Article

Impact of Plastic Blends on the Gaseous Product Composition from the Co-Pyrolysis Process

1
Department of Air Protection, Faculty of Energy and Environmental Engineering, Silesian University of Technology in Gliwice, 44-100 Gliwice, Poland
2
Institute of Energy and Fuel Processing Technology, 1 Zamkowa, 41-803 Zabrze, Poland
3
School of Chemical Engineering, University of Birmingham, Edgbaston, Birmingham B15 2TT, UK
*
Authors to whom correspondence should be addressed.
Energies 2023, 16(2), 947; https://doi.org/10.3390/en16020947
Submission received: 20 December 2022 / Revised: 7 January 2023 / Accepted: 13 January 2023 / Published: 14 January 2023

Abstract

:
The co-pyrolysis of various biomasses mixed with two types of plastic waste was investigated in this study. Mixture M1 consisted of 30% m/m styrene–butadiene rubber (SBR), 40% m/m polyethylene terephthalate (PET), and 30% m/m polypropylene (PP). M2 consisted of 40% m/m PET, 30% m/m PP, and 30% m/m acrylonitrile–butadiene–styrene copolymer (ABS). The SBR, ABS, and PP used in this study were from the automotive industry, while the PET originated from scrap bottles. Co-pyrolysis was performed using wood biomass, agricultural biomass, and furniture trash. Thermal treatment was performed on samples from room temperature to 400 or 600 °C at a heating rate of 10 °C/min under N2 at a flow rate of 3 dm3/min. Based on the findings of the experiments, an acceptable temperature was found for the fixed-bed pyrolysis of biomass–plastic mixtures with varying ratios, and the raw materials were pyrolyzed under the same conditions. The composition of the derived gaseous fraction was investigated. The co-pyrolysis studies and variance analysis revealed that combining biomass with plastic materials had a good influence on the gaseous fraction, particularly in the presence of 6.6–7.5% v/v hydrogen and a lower heating value of 15.11 MJ/m3. This type of gaseous product has great potential for use as a replacement for coke oven gas in metallurgy and other applications.

1. Introduction

The desire for more energy and the depletion of current energy sources have prompted research into and the creation of technology for using alternative fuels that are safer for the environment than traditional fuels. Plastics and other polymer-based materials that are currently made primarily from petroleum-derived components are being developed for use as components or surrogates for liquid fuels and viable energy sources for the future. [1]. There has been a significant increase in global plastic production from 1950 (1.5 million Mg) to 2008 (245 million Mg) [2,3]. This increase may be attributed to rapid urbanisation, rising incomes, and increasing industrial applications. The production of plastics across the world has grown approximately 10% annually on average since 1950. The lightweight and corrosion-resistant properties of plastic are only two of its many advantages. However, plastic waste is the third largest component of municipal solid waste (MSW) [4,5] after food and paper. The enormous volume and per person weight of plastic rubbish means that it makes up approximately 20–30% of MSW [6].
Currently, the plastic disposal problem is addressed by traditional recycling of waste plastic into reusable plastic items [7]. The nonbiodegradable nature of plastic, along with its widespread usage and very short average product life, has created serious environmental concerns. Petroleum-based plastics may be recycled and processed into useful goods such as gasoline and heavy oils that can be further utilised to generate energy or chemicals by thermal treatment or combustion [8,9,10]. When compared to combustion, the environmental benefits of pyrolysis as a thermal conversion process for plastic waste are far greater. In addition to minimising carbon monoxide (CO) and carbon dioxide (CO2) emissions [11,12,13,14], the inert atmosphere (no oxygen) and low temperature used in the pyrolysis process also inhibit the production of dioxins.
Thermochemical degradation processes, pyrolysis and co-pyrolysis take place in an inert atmosphere between 400 and 900 °C. When heated past their breakdown temperature, high molecular weight chains break down and form more stable, low molecular weight products and solid residue [15]. Plastic type, reactor type, and process parameters, especially reaction temperature and heating rate [16,17,18,19,20], affect the composition and yield of the char, oil/wax, and gas produced during the thermal conversion process. In addition, several scientists tried co-pyrolysis of polymers with catalysts to produce a large percentage of oil products [21,22,23,24,25,26,27,28]. Co-pyrolysis of binary or ternary mixtures of biomass and polymers was the primary focus of previous studies. Previous research [29] examined the raw material interactions of high-density polyethylene (HDPE) and potatoes through primary and secondary co-pyrolysis. The temperature used in the thermal conversion was 900 °C with heating rates of 10, 20, and 30 °C/min. Other studies [30] combined agricultural residues, including cotton stalks, hazelnut shells, and sunflower remnants, with polyvinyl chloride (PVC) and poly(ethylene terephthalate) (PET) plastics. The parameters for pyrolyzing binary mixtures and raw materials were identical, with the exception of the final temperature of 500 °C. A number of studies examined the potential benefits of the co-pyrolysis of biomass and plastic wastes. A very useful tool for this type of analysis is chemometrics, especially design of experiments (DOE) and analysis of variance (ANOVA), which are often used in this type of approach [31,32,33]. Experimental data on the co-pyrolytic behaviour of polyolefins such as polyethylene (PE), polypropylene (PP), and polystyrene (PS) with biomass materials, such as pine wood-PP [4,34,35,36,37], hazelnut shell-PP [38], rubber seed shell-HDPE [39], wood pellet-PP [40], wood sawdust-PP [41], olive residue-LDPE (low-density polyethylene) [42], and pine cone-PE/PP/PS [43], were presented in many publications.
In the course of their thermal decomposition, polyolefins donate hydrogen from the polyolefinic chain to radicals produced from biomass [44,45,46]. Co-pyrolysis, whereby biomass and plastics are heated together, is a process whose mechanism is not well understood and that depends upon the feedstock. Several papers have suggested alternative polymer precursors, including PET for everyday usage and PVC for industrial use. Prepaid credit cards, films, fibres, and tapes are only some of the many industrial applications for PET, making it the plastic most used by consumers on a daily basis [47]. Naturally, there has been a great deal of research on the interactions of different polymers. For our study, this knowledge is crucial, especially for characterizing the most important interactions between polymers and biomass components (cellulose, hemicellulose, and lignin). HDPE, LDPE, PP, PS, PVC, PET, and their mixtures were studied by Williams and Williams [48,49] for their yield and quality of pyrolysis products. HDPE, LDPE, and PP were found to contain approximately 80% aliphatic oil and wax, whereas PS included aromatic oil. Oil output and quality were negatively affected, and pyrolysis facilities were corroded, by corrosive gases such HCl, terephthalic acid, and benzoic acid, as studied by Fukushima et al. [50]. Calcium oxide (CaO) and calcium hydroxide (Ca(OH)2) were tested for their impact on the pyrolysis of a variety of polymers (including PE, PP, PS, and PET) at 600 °C in a steam atmosphere by Kumagai et al. [51]. They also discovered that the yields of liquid and gaseous products were particularly high under these conditions.
In this study, three lignin-rich materials were mixed with multicomponent biomass-plastic blends before being manufactured and subjected to thermal treatment; the biomasses were wood biomass, straw biomass, and furniture waste. The PET from bottles recovered from MSW, PP from scrap bumpers, and acrylonitrile–butadiene–styrene copolymer (ABS) from automotive detritus were all put to good use. Different types of biomass were considered while selecting the three lignin-rich materials. This variation in primary concentration was a direct result of the fact that their physical and chemical characteristics were not identical (cellulose, hemicellulose, and lignin). Notably, the waste polymers used in this study were selected because each one degraded in a unique way. For example, PP, ABS, and styrene–butadiene rubber (SBR) undergo free radical reactions throughout their decomposition. The waste polymers used in this study were selected for their unique rates of decomposition. Consequently, radical reaction degradation must take place in the case of PP, ABS, and SBR. Under pyrolysis conditions, PET degrades by heterolytic (ionic) main-chain cleavage, yielding a structure with an olefin end and an acidic end. When PET degrades, it forms non-volatile residues, which is not the case for PP, ABS, or SBR [52,53,54]. By combining radical and ionic degradation events during co-pyrolysis, biomass thermal conversion results may vary from those achieved with a single polymer.
Previous investigations employing two distinct waste plastic mixes, as noted previously in the Introduction, primarily focused on the impact of process parameters and additive type on the yield of products collected during the co-pyrolysis process. Furthermore, no consideration has been given to the interaction between the type of biomass-derived material and the type of plastic waste combination, which might have a considerable impact on the products obtained in thermal processes of multi-component waste containing both biomass and polymer waste. In terms of technology, determining not only the influence of the thermal conversion processes that pyrolysis and co-pyrolysis belong to is vital for scaling up processes, for example.
As a result, the goals of this research were not only to examine the impact of process parameters on the quantitative and qualitative composition of gaseous products but also to present and characterise the possibility of an interaction between the kind of biomass and the type of plastic mixture.

2. Materials and Methods

2.1. Materials and Analytical Methods

In this study, two types of plastic mix were employed. M1 constituted 30% m/m SBR from tire waste, 40% m/m PET from scrap bottles recovered from MSW, and 30% m/m PP from scrap bumpers. M2 was composed of 40% m/m PET from scrap bottles, 30% m/m PP from automotive scrap, and 30% m/m ABS from automotive scrap. PET came from MSW. Table 1 shows the results of the approximate and ultimate analyses of the polymers.
The polymers utilised in the co-pyrolysis process had particle sizes ranging from 1 to 5 mm. This particle size was adjusted to match the particle size of the raw biomass, which was less than 10 mm. A laboratory drum mixer was used to guarantee that the plastic mix was uniform and homogeneous. Appropriate quantities of waste polymers were added to the drum, which was then agitated at a constant speed of 30 rpm. Every 5 min, a predetermined amount of the mixture was added as needed. Raw biomass for the co-pyrolysis process included alder wood, straw biomass, and furniture trash. Table 2 shows the results of the proximate and ultimate analyses of the biomass.

2.2. Analytical Procedures

All raw materials were analysed for ash content (ash), volatile matter content (VM), and final analysis (Cta, Hta, Na, Sta, and Ota). Proximate and final analyses were carried out in accordance with the procedures shown in [34,35,36,55].
The ash content of the samples was determined by incineration. The sample was placed in a muffle furnace and continuously heated in air to 815 °C, which was then maintained until a constant weight was achieved. Weighing a closed crucible without air before and after heating it at 850 ± 15 °C for 7 min and calculating the difference between total weight loss and weight loss due to water evaporation yielded the volatile matter concentration.
To determine the carbon, hydrogen, nitrogen, and sulphur content of samples, they were submitted to automatic quantitative combustion in an oxygen stream at 1150 °C (the temperature of the reaction is roughly 1800 °C as a result of the exothermic reaction in tin foil). The combustion products (CO, CO2, NO, N2, SO, SO2, PO2, F, O2, H2O) were introduced through a quartz bridge into a reduction tube, where sulphur and nitrogen oxides were reduced to SO2 and N2 in the presence of copper (the excess oxygen was also bonded). The mixture of components (He + N2 + CO2 + H2O + SO2) at the reduction tube’s exit was transported into a dynamic separation system, where absorption columns were thermally desorbed in series. A thermal conductivity detector (TCD) was used to analyse combustion gases (N2, CO2, H2O, and SO2). An NDIR detector was used to examine low SO2 concentrations.
To determine the oxygen content of samples, they were pyrolyzed at 1120–1150 °C in an H2O, CO2, and O2 free reductive environment (95% N2 and 5% H2), providing a direct quantitative analysis of oxygen concentration. The sample was placed in a pyrolysis tube filled with elemental carbon, and carbon dioxide was produced as a result of the reaction between oxygen from the sample and carbon from the filler (Boudouard equilibrium). The acidic pyrolysis products, such as H2S, HCN, and HCl, were absorbed on granulated NaOH, while the generated water was absorbed by a dehumidifier. The inert pyrolysis products (N2 and CH4) were introduced into a measuring cell containing carbon monoxide. Because the NDIR detector was only sensitive to CO, the other gases did not need to be separated. A Vario Macro Cube automatic elemental analyser was used to determine the elementary composition of Cta, Hta, Na, Sta, and Ota.
Equation (1) [56] was used to compute the temperatures of combustion of the materials studied.
HHV = 601.95 11.57   ·   Ahs 7.12   ·   VM + 341.67   ·   C t a + 1165.86   ·   H t a 97.35   ·   O t a 193.37   ·   N a + 110.36   ·   S t a
A Varian CP3800 gas chromatograph was used to determine the pyrolytic gas composition. The gas composition was determined according to PN-C-96012:1993—Gaseous fuels. Determination of the content of gaseous components in pyrolysis gas by gas chromatographic methods.
The determination of density and calorific value based on gas composition was performed according to PN-EN ISO 6976:2016-11—Natural gas. Calculation of calorific values, density, relative density, and Wobbe number from composition.
The principle of the method is to determine the composition of the gas using a Varian CP3800 gas chromatograph equipped with two detectors: a TCD (thermal conductivity detector) and an FID (flame ionisation detector), as well as a valve system that allowed the carrier gas stream (compressed helium, compressed air of 5.0 purity), along with the sample, to be split and sent to the FID and TCD. The FID was fed with hydrogen (purity 5.0).
The chromatograph was additionally equipped with a capillary column, e.g., CP Sil 5, measuring 60 m × 0.25 mm with a sample dispensing loop on the 1 mL capillary column, and a Molecular Sieve 5A CP packed column measuring 1.5 m × 2.0 mm with a sample dispensing loop on the 250 µL packed column.
The following chromatograph operating conditions were used to perform the analyses. The following two-stage temperature programme was applied: from 45 °C to 90 °C with a ramp-up of 8 °C per minute, from 90 °C to 160 °C with a ramp-up of 20 °C per minute, and then holding at the initial temperature for 9 min. The injector temperature was 150 °C, the FID detector temperature was 280 °C, and the TCD detector temperature was 175 °C.

2.3. Experimental Design with Analysis of Variance (ANOVA)

The experimental design approach is one of the most widely used methods for controlling a wide range of technical processes, including those in chemical technology [57].
However, for a variety of reasons, including a lack of time, it is not required in research, despite the fact that it can have numerous good impacts, the presence of which may not have been anticipated by researchers at the outset of their research preparation. This method’s strength is that it may be paired with data analysis methods such as analysis of variance to identify current effects both qualitatively and quantitatively, allowing for the development of new inventive ways or products.
This approach has also been used to obtain relevant information about the interactions and correlations between examined factors (chemical reagents and process parameters), which may then be utilised to optimise product yield. The Box–Wilson central composite design, also known as the central composite design, was chosen as the design of experiments (DOE) approach in this study. Table 3 shows the physical and coded values of the parameters for the design of the experiments.
ANOVA is a statistical approach for determining the importance of process variables and process conditions. ANOVA may be used to assess the experimental error and determine the impact of each component (e.g., A, B, and C) and their interactions (e.g., AB, AC, BC, and ABC). If the components and interactions that impact the response (e.g., material quality) are known, then the common least-squares criteria may be used to construct an empirical model. As a result, the statistical significance of the regression coefficients must be determined, often using Student’s t-test. The final equation is constructed by fitting the regression coefficient. STATISTICA [58] was used to statistically analyse the co-pyrolysis data. Pearson’s correlation coefficient was used to calculate correlations. The significance of differences between the process conditions applied to the tested materials was determined using one-way ANOVA.

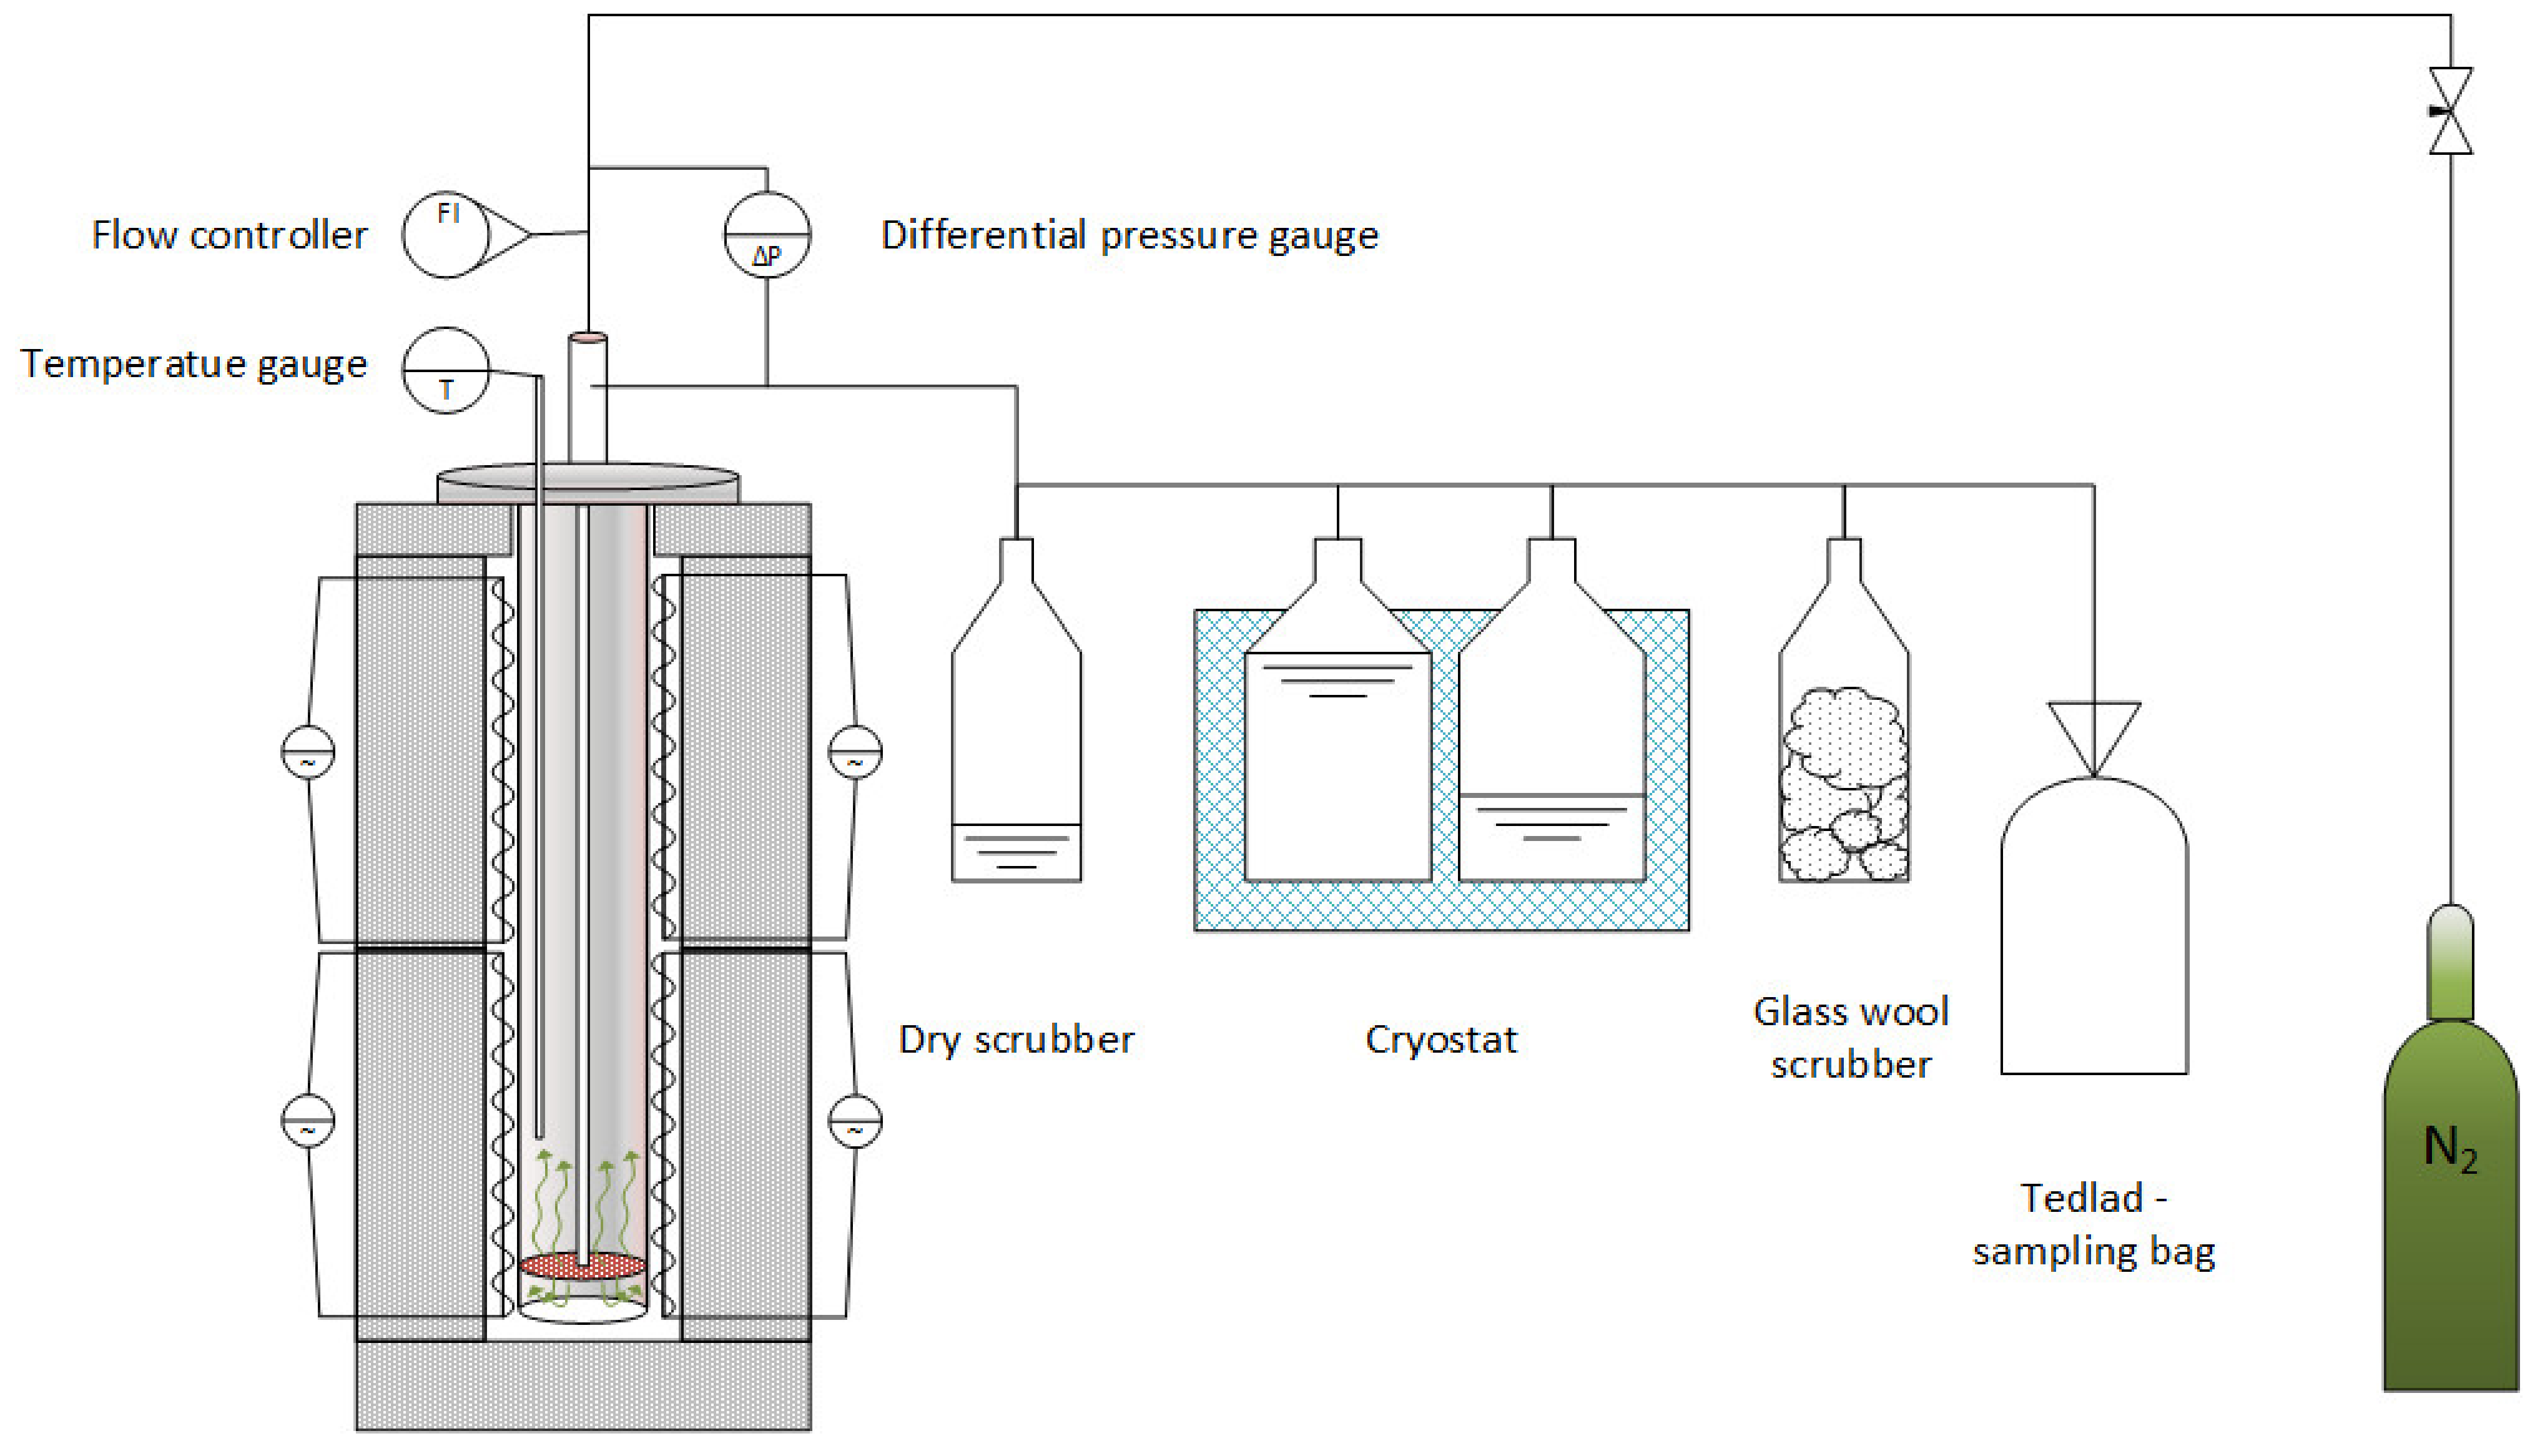
2.4. Co-Pyrolysis Process

The studied biomass was first dried to 2–3% humidity (Wa) before being pulverized into particles smaller than 10 mm in diameter. The resultant mixture (which contained the investigated polymer blends and biomass) was put in a steel retort and co-pyrolyzed under a nitrogen atmosphere. An electric furnace, a steel retort (where the tested materials were converted), and a system for collecting the liquid and gaseous products comprised the test setup. Figure 1 displays a schematic of the solid fuel thermal conversion system. Nitrogen was injected from the bottom of the retort at a rate of 3 dm3/h. The retort was purged with nitrogen for 15 min prior to pyrolysis, and the treated material was then heated to the aforementioned temperature at a heating rate of 10 K/min. After attaining the required temperature, it was held for 30 min before the sample was cooled to room temperature. The laboratory-scale setup was similar to that employed in previous investigations [55]. During the procedure, char, liquid, and gaseous samples were collected for future study. To confirm that the reactions were reproducible and stable, the reactions were performed in triplicate.

3. Results

3.1. The Co-Pyrolysis of Biomass and Plastic Waste Blends—Product Mass Balance

Co-pyrolysis of biomass has been intensively researched [22,24,55], mostly employing two-component combinations of polymer–biomass feedstock, as discussed in a previous paper [37]. Because these materials have similar physicochemical qualities, the yields of solid, liquid, and gaseous products from wood biomass and furniture waste were comparable. As shown in Table 4, depending on the biomass sample and thermal conversion conditions, various product yields can be achieved.
If the conversion process was focused on the yield of solid products, then the lower the temperature was, the greater the biochar yield. Biochar yields varied depending on the type of biomass material tested, ranging from 39% for alder wood (400 °C) to 54.8% for straw biomass (400 °C). An increase in temperature resulted in a decrease in the amount of biochar obtained in favour of liquid and gaseous products. An increase in temperature from 400 °C to 600 °C resulted in a decrease in biochar of approximately 12% for alder wood and approximately 25% for straw biomass and waste furniture. Additionally, the largest increase of more than 17% in liquid products was observed for waste furniture, and an increase of more than 15% in gaseous products was observed when increasing the pyrolysis temperature for straw biomass.
The impact of polymer addition on pyrolysis of waste furniture was extremely large, with an average increase of +6.35%, and it increased with the square of the amount of added polymer. In all situations, the average yield of liquid products was between 47 and 56%. Co-pyrolysis between 500 °C and 600 °C (0% m/m of M1) produced the largest output of gaseous compounds from the M1 mix. In the case of combination M1, the opposite tendency was observed. An ANOVA test indicated that raising the temperature of the thermal conversion process had a statistically significant effect, with averages of 2.2%, 1.5%, and 2.9% for wood biomass, agricultural waste, and furniture waste, respectively. The influence of various polymer waste blends on the yields of products from the co-pyrolysis of biomass was evaluated through fifteen tests utilising two mixtures of waste polymers (M1 and M2) at different temperatures in triplicate runs (Table 5).

3.2. Variable Effect on the Chemical Composition of the Gaseous Products

The initial stage in the research was to determine which factors had a statistically significant influence on the composition of different gas product components. As can be observed from the comparison data in Table 6, temperature had a statistically significant (p < 0.05) influence on the concentration of the examined components of the co-pyrolysis products in almost every case (with the exception of C2H4 concentration).
The statistical relevance of pyrolysis temperature was not unexpected given that it is the primary factor controlling the degree of breakdown of materials, whether organic matter or plastic. Its lack of influence on ethylene concentration was also not surprising because pyrolysis reactions, and thus co-pyrolysis reactions, are predominantly free radical reactions (especially when dealing with polyolefin pyrolysis), so the ethyl radical, which is reactive and is in a pyrolysis reaction environment rich in other chemical entities, is more likely to combine with other molecules than to form a double bond.
Similarly, with the exception of the methane content and overall density of the resultant gas after co-pyrolysis, the addition of the waste plastic mixture had a significant influence on the concentration of the components examined in this example. Furthermore, a significant interaction effect was detected between the temperature of the co-pyrolysis process and the addition of the waste plastic mixture for numerous components, such as CO, CO2, C3H6, C4H10, and density. This was also connected to free radical reactions that occurred during the thermal conversion of polymers, which easily reacted with them in the presence of biomass rich in, for example, hydroxyl and carboxyl groups, as demonstrated by a rise in the amount of CO and CO2 in the process gas.
The presence of a connection between the kind of biomass material and the type of usage of the waste plastic combination was an essential piece of evidence that confirmed our hypothesis. In this scenario, significant impacts were found for H2, CO, CO2, C3H8, C3H6, C4H10, HHV, and LHV concentrations and densities. This knowledge will be critical for the future design of the composition of gaseous products in this type of procedure.
Simply knowing that both the kind of material and the content of the waste plastic combination both have significant effects may not be sufficient. Thus, Pareto charts were created and presented to graphically show which specific variables and, in the case of raw materials, which biomass–waste mixtures had the greatest influence on the composition of the pyrolysis gas components mentioned earlier (H2, CO, CO2, C3H8, C3H6, C4H10, HHV, LHV, density).
For clarity, these components were separated into two groups (Figure 1 and Figure 2), with LHV reflecting the amount of energy carried by the pyrolytic gas created under specified process circumstances in the second group.
The graphs depict the effects of the process variables studied, namely, temperature (linear effect L, quadratic effect Q), polymer addition (linear effect L, quadratic effect Q), their linear interaction (1 L vs. 2 L), and options representing various combinations of the type of biomass-derived material thermally converted with one of the two waste plastic blends. The linear or quadratic effect was found to determine whether the variable had a linear effect on the process being studied or it could be described by a quadratic function. Options 1–5 (pyrolysis option) were the following: straw + M2, wood + M1, wood + M2, furniture waste + M1, and furniture waste + M2. The impacts of these groups were compared to option (0), i.e., straw + M1.
As shown in Figure 2a, changing the kind of biomass material utilised from straw to wood had a significant beneficial influence on the rise in hydrogen content of the pyrolysis gas, in addition to the greatest effects of process temperature and the amount of waste plastic mixture added. This could have been because alder wood has a lower ash concentration than straw biomass, which has a slightly higher hydrogen level. A difference in ash of more than 4%, however, suggests that more biomass material, and thus more hydrogen, enters the process. Changing the kind of plastic mixture from M1 to M2 has a significant impact, but it is a negative one, reducing the quantity of hydrogen in the pyrolysis gas. The negative effect of changing the composition of the waste plastic mixture from M1 to M2 is visible in all three cases, confirming the hypothesis that not only the additive but also the composition of the plastic mixture influences the co-pyrolysis process and, more specifically, the quality and composition of the products obtained in this type of process. Although more hydrogen compacted in ABS than in SBRs that entered M2 is more than in SBRs, the process produced hydrogen cyanide, which consumed one molecule of hydrogen.
In the case of propylene (C3H6, Figure 2b), the situation was somewhat different: temperature had less influence on propylene concentration than on hydrogen, with the most substantial effect occurring when plastic was introduced. This was because it is easier to break the internal C–C (338 kJ/mol) bond in radical reactions than the bond between C–H (412 kJ/mol). In this case, changing the kind of plastic mix as well as the feedstock from straw to wood had a considerable detrimental influence on the propylene content of the co-pyrolysis products. Instead, the mixing of furniture waste with the M1 blend had a favourable influence on the rise in propylene content.
The inclusion of waste plastics and the process temperature had a synergistic impact on the higher homologues. This interaction increased the concentrations of C3H6 and C4H10 in the gas following thermal conversion (Figure 2c,d). This was mostly due to the previously noted bonding energy between the carbon bonds of both biomass and polymer wastes. The usage of furniture waste in the form of straw in conjunction with the waste plastic mixture M2 had a minor but good effect on C3H6. In the case of C4H10, a greater impact was found when straw was combined with M2, and furniture trash was combined with M1; other combinations had a negative or statistically negligible effect on the C4H10 content of the resultant postprocess gas.

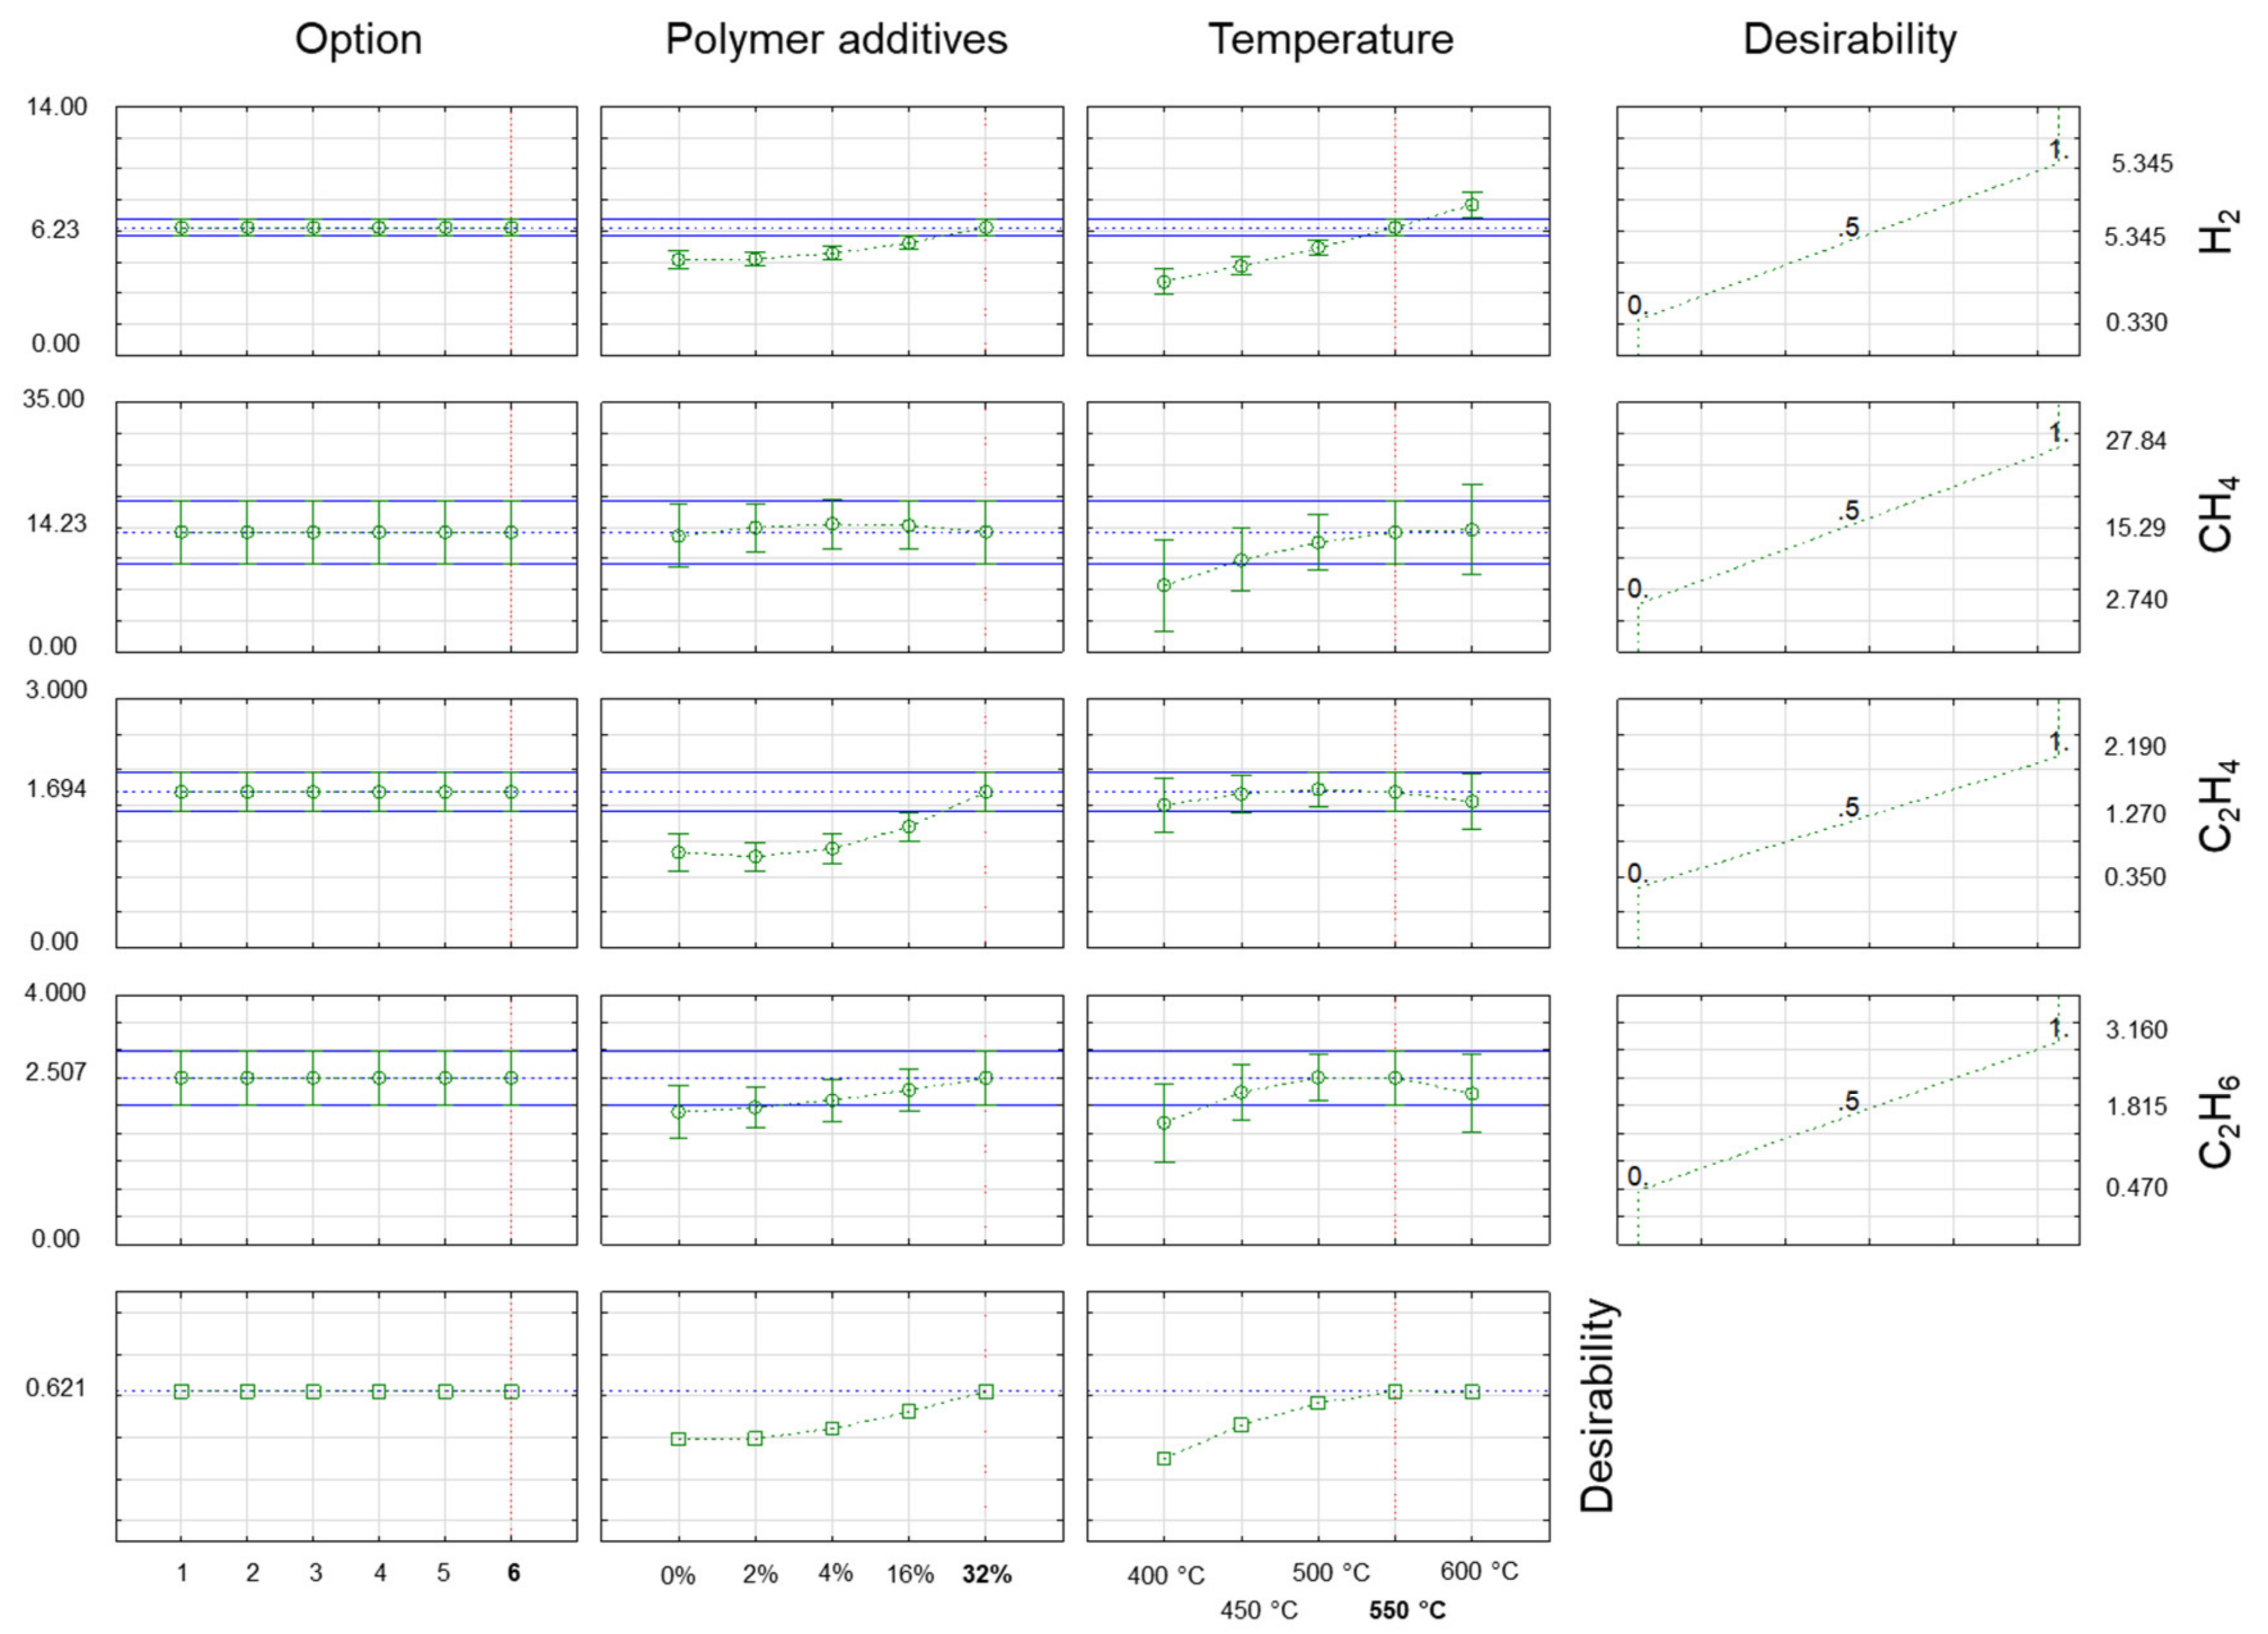
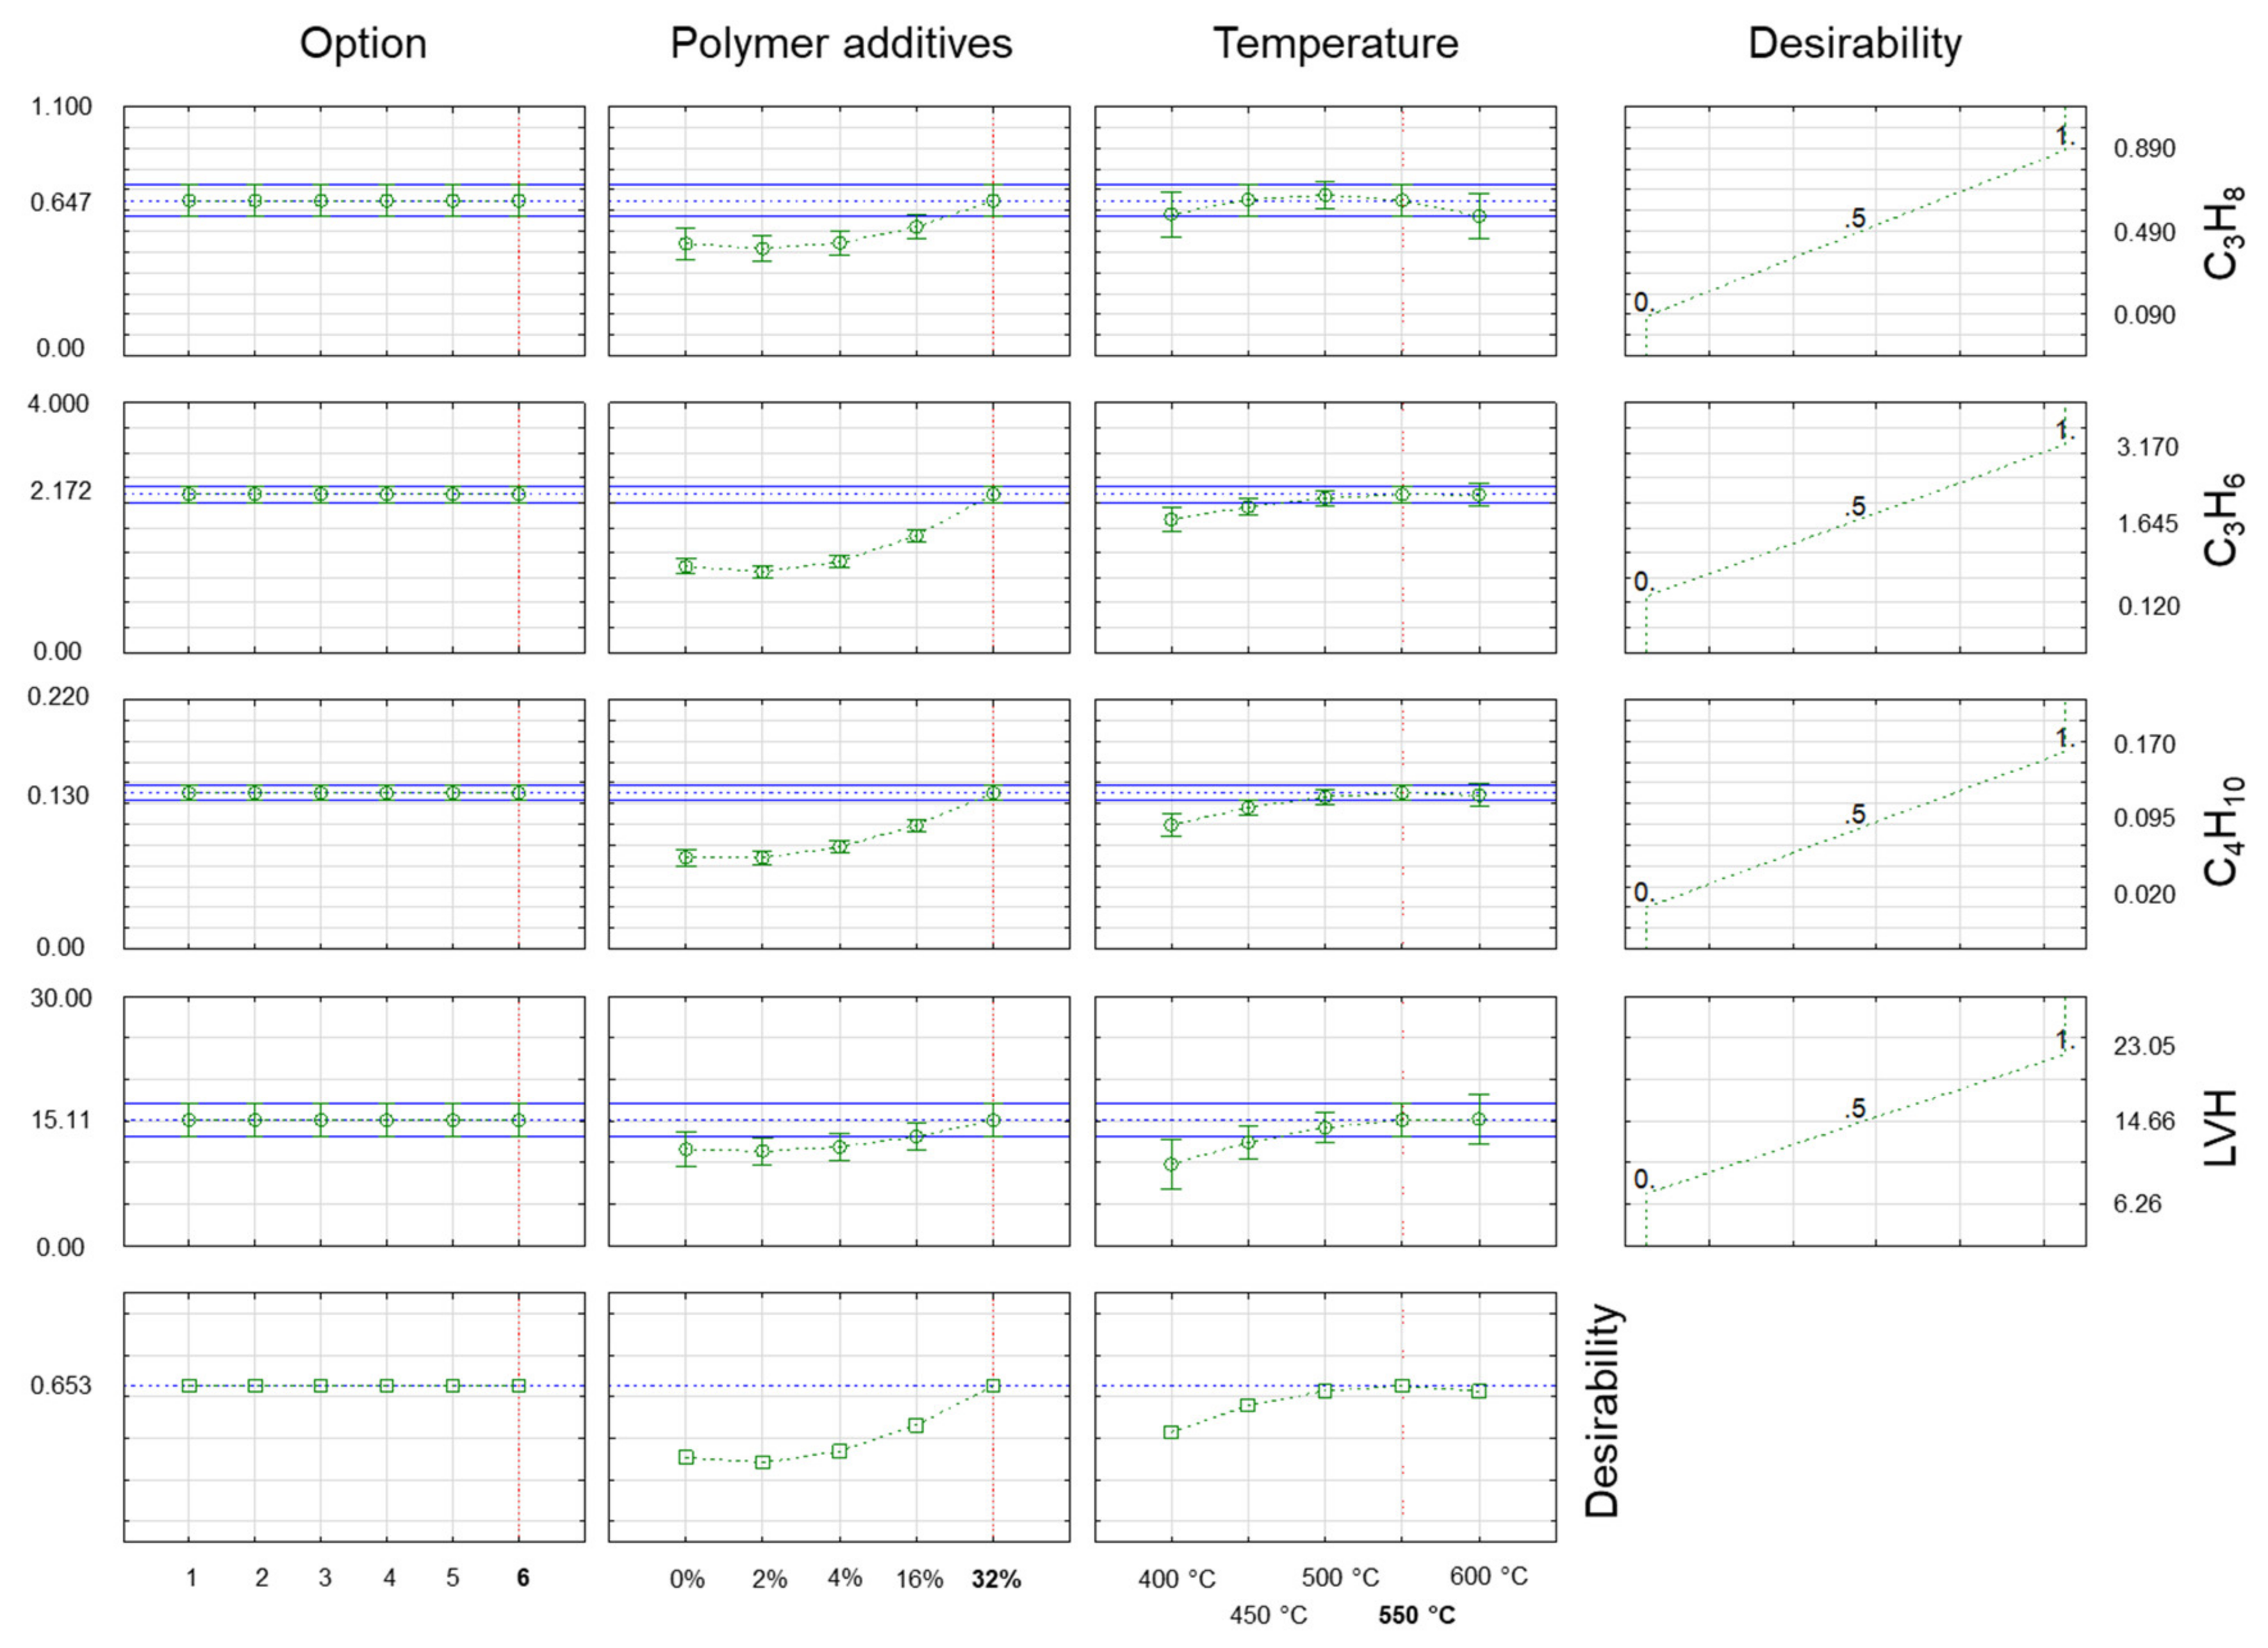
3.3. Determination of Optimal Co-Pyrolysis Parameters

Optimisation for thermal conversion processes is a very important step. This is because during thermal conversion processes such as pyrolysis, mainly free radical reactions take place, which lead to the formation of products that may constitute energy ballast, e.g., CO2 or even CO, in addition to the desired high-energy and valuable products. In contrast to the previously described dependencies affecting the high-energy content of gaseous products, the opposite effect was observed in the cases of CO and CO2 (Figure 3a,b), as well as the material-type–plastic–mixture connection. In contrast to CO2, where a change in biomass material from straw + M1 to wood + M2 had a strong negative effect on concentration, a change in biomass material from straw + M1 to wood + M2 had a rather strong positive effect on CO concentration. Similarly, when we altered the wood + M1 case for CO, we observed an increase in concentration as a result of the feedstock change rather than a decrease in CO2 concentration.
The calorific value and density of the gas were directly affected by changing the composition of the different components of the gas products. These two parameters were most strongly and statistically significantly influenced by the change in biomass material from straw to wood and the change in plastic mixture from M1 to M2, as well as temperature and the amount of waste plastic added to the co-pyrolysis process, as shown in Figure 3c,d.
Information regarding these interactions is critical for process optimisation. The variables that determine the composition of the separate components of the gas product formed from the co-pyrolysis of biomass materials and waste plastic mixtures are demonstrated above. When optimising the composition of gas products in terms of combustion heat or, more commonly, calorific value, it is possible to maximise the composition of the most energetic components so that the final gas obtained has high energy content as well. Such an approach was used in the present study to demonstrate that proper experimental planning not only provides valuable and relevant information on the phenomenon under investigation but also, especially when investigating chemical processes including thermal processes, allows for optimisation of process conditions to ensure maximum benefit.
In Figure 4 and Figure 5, the desirability chart shows how the studied properties of gas products obtained during co-pyrolysis changed under different process conditions. The utility function used here assumed that during the optimisation process, the maximum hydrocarbon content was sought while minimising the carbon monoxide and carbon dioxide content of the gas product. The utility function (right side of Figure 4 and Figure 5) had a linear form, and it assumed a value of 0 (undesirable result) for the minimum value of the hydrocarbon under test and a value of 1 (desirable result) for the maximum value of hydrogen and the hydrocarbons for the test. In the case of carbon monoxide and carbon dioxide, the course of the function was reversed, with a value of 1 (the desired result) for the minimum content of CO2 and a value of 0 (the undesirable result) for the maximum content of CO2 in the gaseous products of the co-pyrolysis process. In this case, the total utility function (bottom part of Figure 4 and Figure 5) was the result of the utility functions for hydrogen, the labelled hydrocarbons, CO2, and thus also the LHV value.
The outcome of this research presented in this publication indicated that to obtain gaseous products with maximally high hydrogen and hydrocarbon contents while minimising the carbon dioxide concentration, a process of co-pyrolysis of biomass material with a maximum 32% addition of a plastic mixture (M1) at 550 °C was needed. As was observed, no further increase in process temperature over 550 °C was necessary because the increase in process temperature only had a favourable effect on raising the hydrogen content from 6.23% v/v to approximately 7.68% v/v. In the cases of CH4, C2H5, C3H6, and C3H8, the concentrations fell by 0.17, 0.46, 0.05, and 0.07% v/v, respectively. The concentrations of the other components remained constant. These modifications had no effect on the calorific value of the gas received, which stayed at 15.11 MJ/m3.
A gas with this calorific value is only slightly worse than coke oven gas, which is currently used quite extensively in the metallurgical industry (17.3 MJ/m3), demonstrating that the gas products of co-pyrolysis have significant energy potential for use in applications including those in heavy industry with high energy requirements.

4. Conclusions

This paper provides a thorough analysis using a method to identify the most important variables that determine the qualitative features of gas products generated from the co-pyrolysis of biomass-derived materials and waste plastic mixes. Using planning experiments and analysis of variance methodologies, it was feasible to not only find statistically significant factors but also to characterise the nature of their effect and, finally, to achieve the best process conditions. Co-pyrolysis provides effective waste management and carbon utilisation from wastes to help provide circularity to the destination of fossil fuels and energy used in waste generation while minimising unsustainable paths such as landfilling and incineration and offering environmental protection by reducing growing marine pollution caused by plastic wastes and alleviating poisonous emissions created by incinerators. According to the review article’s authors [60], co-pyrolysis was studied in terms of key polymers (PET, HDPE, PVC, LDPE, PP, PS, and other plastics) and typical solid biomass, followed by synergetic effects and influencing factors between the feedstocks. In general, in co-pyrolysis with solid biomass, HDPE, LDPE, and PP have positive synergetic effects on liquid yield, whereas PET, PS, and PVC have positive synergetic effects on solid residue or gas production.
As shown in the study, the optimum conditions to obtain the maximum hydrogen and hydrocarbon content and at the same time maximise the calorific value of the pyrolysis gas obtained are to run the co-pyrolysis process at 550 °C with a 32% addition of a mixture of waste plastics. Both the type of biomass and the composition of the waste polymer blend have little effect on the process. Of course, if, for example, for technological reasons one wishes to maximise a smaller number of parameters, e.g., focus only on the hydrogen content, then both the type of biomass material and the composition of the waste polymer will have an impact, and the optimum conditions may be slightly different and include the most favourable combination of biomass type and composition of the waste plastic mixture. In the case studied, to maximise the hydrogen content, it is sufficient to raise the pyrolysis temperature to the maximum since, as shown by ANOVA, it is the temperature that most strongly influences the hydrogen content of the pyrolysis gas.
This study is significant in terms of the use of nonrecyclable polymer waste as well as the use of low-quality biomass or biomass-derived trash. Knowledge of the effect and interaction of specific elements, for example, on the calorific value of the resultant gas, is crucial in terms of the use of such a product, for example, in the metallurgical sector, where products from sustainable sources might replace some of the natural gas. Given the present economic situation in particular, it is critical to seek solutions that will lessen negative impacts on the environment while lowering the expenses associated with the current usage of fossil fuels.

Author Contributions

Conceptualisation, M.S.; methodology, M.S. and R.M.; software, M.S.; formal analysis, R.M.; investigation, R.M. and M.S.; writing—original draft preparation, M.S., R.M., G.G. and M.O.; writing—review and editing, M.S., R.M., G.G. and M.O.; visualisation, M.S.; supervision, M.S. All authors have read and agreed to the published version of the manuscript.

Funding

This research received no external funding.

Data Availability Statement

The supporting data and results can be found in the data repository: Sajdak, Marcin; Muzyka, Roksana (2022), “Gaseous products from biomass and waste co-pyrolysis -DOE”, Mendeley Data, V1, https://doi.org/10.17632/ny8bxjkhyk.1 (accessed on 14 November 2022) [61].

Acknowledgments

This research was supported by the Faculty of Energy and Environmental Engineering, Silesian University of Technology (statutory research).

Conflicts of Interest

The authors declare no conflict of interest.

References

  1. United Nations Environment Programme, Converting Waste Plastics into a Resource—Compendium of Technologies. 2009. Available online: https://wedocs.unep.org/20.500.11822/8638 (accessed on 19 December 2022).
  2. Basu, P. Biomass Gasification and Pyrolysis: Practical Design and Theory; Academic Press: Cambridge, MA, USA, 2010; pp. 1–365. ISBN 9780123749888. [Google Scholar] [CrossRef]
  3. Scheirs, J.; Kaminsky, W. Feedstock Recycling and Pyrolysis of Waste Plastics: Converting Waste Plastics into Diesel and Other Fuels. Feedstock Recycl. Pyrolysis Waste Plast. Convert. Waste Plast. Into Diesel Other Fuels 2006, 1–785. [Google Scholar] [CrossRef]
  4. Gałko, G.; Rejdak, M.; Tercki, D.; Bogacka, M.; Sajdak, M. Evaluation of the Applicability of Polymeric Materials to BTEX and Fine Product Transformation by Catalytic and Non-Catalytic Pyrolysis as a Part of the Closed Loop Material Economy. J. Anal. Appl. Pyrolysis 2021, 154, 105017. [Google Scholar] [CrossRef]
  5. Gałko, G.; Mazurek, I.; Rejdak, M.; Jagustyn, B.; Hrabak, J.; Ouadi, M.; Jahangiri, H.; Sajdak, M. Evaluation of Alternative Refuse-Derived Fuel Use as a Valuable Resource in Various Valorised Applications. Energy 2023, 263 Pt D, 125920. [Google Scholar] [CrossRef]
  6. Scott, D.S.; Czernik, S.R.; Piskorz, J.; Radlein, D.S.A.G. Fast Pyrolysis of Plastic Wastes. Energy Fuels 1990, 4, 407–411. [Google Scholar] [CrossRef]
  7. Achilias, D.S.; Roupakias, C.; Megalokonomos, P.; Lappas, A.A.; Antonakou, V. Chemical Recycling of Plastic Wastes Made from Polyethylene (LDPE and HDPE) and Polypropylene (PP). J. Hazard. Mater. 2007, 149, 536–542. [Google Scholar] [CrossRef]
  8. Miskolczi, N.; Angyal, A.; Bartha, L.; Valkai, I. Fuels by Pyrolysis of Waste Plastics from Agricultural and Packaging Sectors in a Pilot Scale Reactor. Fuel Process. Technol. 2009, 90, 1032–1040. [Google Scholar] [CrossRef]
  9. Demirbas, A. Pyrolysis of Municipal Plastic Wastes for Recovery of Gasoline-Range Hydrocarbons. J. Anal. Appl. Pyrolysis 2004, 72, 97–102. [Google Scholar] [CrossRef]
  10. Babu, B.V.; Chaurasia, A.S. Modeling for Pyrolysis of Solid Particle: Kinetics and Heat Transfer Effects. Energy Convers Manag 2003, 44, 2251–2275. [Google Scholar] [CrossRef]
  11. Chen, D.; Yin, L.; Wang, H.; He, P. Pyrolysis Technologies for Municipal Solid Waste: A Review. Waste Manag. 2014, 34, 2466–2486. [Google Scholar] [CrossRef]
  12. Stanmore, B.R. The Formation of Dioxins in Combustion Systems. Combust. Flame 2004, 136, 398–427. [Google Scholar] [CrossRef]
  13. McKay, G. Dioxin Characterisation, Formation and Minimisation during Municipal Solid Waste (MSW) Incineration: Review. Chem. Eng. J. 2002, 86, 343–368. [Google Scholar] [CrossRef]
  14. Kanniche, M.; Gros-Bonnivard, R.; Jaud, P.; Valle-Marcos, J.; Amann, J.M.; Bouallou, C. Pre-Combustion, Post-Combustion and Oxy-Combustion in Thermal Power Plant for CO2 Capture. Appl. Eng. 2010, 30, 53–62. [Google Scholar] [CrossRef] [Green Version]
  15. Crocker, M. Thermochemical Conversion of Biomass to Liquid Fuels and Chemicals. The Royal Society of Chemistry: London, UK, 2011; Available online: https://pubs.rsc.org/en/content/ebook/978-1-84973-035-8 (accessed on 10 October 2022)ISBN 978-1-84973-035-8.
  16. Bagri, R.; Williams, P.T. Catalytic Pyrolysis of Polyethylene. J. Anal. Appl. Pyrolysis 2002, 63, 29–41. [Google Scholar] [CrossRef]
  17. Williams, P.T.; Slaney, E. Analysis of Products from the Pyrolysis and Liquefaction of Single Plastics and Waste Plastic Mixtures. Resour. Conserv. Recycl. 2007, 51, 754–769. [Google Scholar] [CrossRef]
  18. Serrano, D.P.; Aguado, J.; Escola, J.M.; Garagorri, E. Performance of a Continuous Screw Kiln Reactor for the Thermal and Catalytic Conversion of Polyethylene-Lubricating Oil Base Mixtures. Appl. Catal. B 2003, 44, 95–105. [Google Scholar] [CrossRef]
  19. Manos, G.; Garforth, A.; Dwyer, J. Catalytic Degradation of High-Density Polyethylene over Different Zeolitic Structures. Ind. Eng. Chem. Res. 2000, 39, 1198–1202. [Google Scholar] [CrossRef]
  20. del Remedio Hernández, M.; García, Á.N.; Marcilla, A. Study of the Gases Obtained in Thermal and Catalytic Flash Pyrolysis of HDPE in a Fluidized Bed Reactor. J. Anal. Appl. Pyrolysis 2005, 73, 314–322. [Google Scholar] [CrossRef]
  21. Muradov, N.Z. CO2-Free Production of Hydrogen by Catalytic Pyrolysis of Hydrocarbon Fuel. Energy Fuels 1998, 12, 41–48. [Google Scholar] [CrossRef]
  22. Miskolczi, N.; Ateş, F.; Borsodi, N. Comparison of Real Waste (MSW and MPW) Pyrolysis in Batch Reactor over Different Catalysts. Part II: Contaminants, Char and Pyrolysis Oil Properties. Bioresour. Technol. 2013, 144, 370–379. [Google Scholar] [CrossRef]
  23. Muhammad, C.; Onwudili, J.A.; Williams, P.T. Thermal Degradation of Real-World Waste Plastics and Simulated Mixed Plastics in a Two-Stage Pyrolysis-Catalysis Reactor for Fuel Production. Energy Fuels 2015, 29, 2601–2609. [Google Scholar] [CrossRef]
  24. Balakrishnan, R.K.; Guria, C. Thermal Degradation of Polystyrene in the Presence of Hydrogen by Catalyst in Solution. Polym. Degrad. Stab. 2007, 92, 1583–1591. [Google Scholar] [CrossRef]
  25. Syamsiro, M.; Saptoadi, H.; Norsujianto, T.; Noviasri, P.; Cheng, S.; Alimuddin, Z.; Yoshikawa, K. Fuel Oil Production from Municipal Plastic Wastes in Sequential Pyrolysis and Catalytic Reforming Reactors. Energy Procedia 2014, 47, 180–188. [Google Scholar] [CrossRef] [Green Version]
  26. Chung, S.H.; Park, J.J.; Jeon, S.G.; Kim, D.C. Pyrolysis of Waste Plastics Using Synthesized Catalysts from Fly Ash. J. Ind. Eng. Chem. 2003, 9, 181–187. [Google Scholar]
  27. Shah, J.; Jan, M.R.; Hussain, Z. Catalytic Pyrolysis of Low-Density Polyethylene with Lead Sulfide into Fuel Oil. Polym. Degrad. Stab. 2005, 87, 329–333. [Google Scholar] [CrossRef]
  28. Mastral, J.F.; Berrueco, C.; Gea, M.; Ceamanos, J. Catalytic Degradation of High Density Polyethylene over Nanocrystalline HZSM-5 Zeolite. Polym. Degrad. Stab. 2006, 91, 3330–3338. [Google Scholar] [CrossRef]
  29. Xiong, S.; Zhuo, J.; Zhou, H.; Pang, R.; Yao, Q. Study on the Co-Pyrolysis of High Density Polyethylene and Potato Blends Using Thermogravimetric Analyzer and Tubular Furnace. J. Anal. Appl. Pyrolysis 2015, 112, 66–73. [Google Scholar] [CrossRef]
  30. Čepelioğullar, Ö.; Pütün, A.E. Products Characterization Study of a Slow Pyrolysis of Biomass-Plastic Mixtures in a Fixed-Bed Reactor. J. Anal. Appl. Pyrolysis 2014, 110, 363–374. [Google Scholar] [CrossRef]
  31. Sajdak, M.; Kmieć, M.; Micek, B.; Hrabak, J. Determination of the Optimal Ratio of Coal to Biomass in the Co-Firing Process: Feed Mixture Properties. Int. J. Environ. Sci. Technol. 2019, 16, 2989–3000. [Google Scholar] [CrossRef] [Green Version]
  32. Sajdak, M.; Piotrowski, O. C&RT Model Application in Classification of Biomass for Energy Production and Environmental Protection. Cent. Eur. J. Chem. 2013, 11, 259–270. [Google Scholar] [CrossRef]
  33. Sajdak, M. Application of Chemometrics to Identifying Solid Fuels and Their Origin. Cent. Eur. J. Chem. 2013, 11, 151–159. [Google Scholar] [CrossRef]
  34. Sajdak, M.; Słowik, K. Use of Plastic Waste as a Fuel in the Co-Pyrolysis of Biomass: Part II. Variance Analysis of the Co-Pyrolysis Process. J. Anal. Appl. Pyrolysis 2014, 109, 152–158. [Google Scholar] [CrossRef]
  35. Sajdak, M.; Muzyka, R.; Hrabak, J.; Słowik, K. Use of Plastic Waste as a Fuel in the Co-Pyrolysis of Biomass: Part III: Optimisation of the Co-Pyrolysis Process. J. Anal. Appl. Pyrolysis 2015, 112, 298–305. [Google Scholar] [CrossRef]
  36. Sajdak, M.; Muzyka, R. Use of Plastic Waste as a Fuel in the Co-Pyrolysis of Biomass. Part I: The Effect of the Addition of Plastic Waste on the Process and Products. J. Anal. Appl. Pyrolysis 2014, 107, 267–275. [Google Scholar] [CrossRef]
  37. Sajdak, M. Impact of Plastic Blends on the Product Yield from Co-Pyrolysis of Lignin-Rich Materials. J. Anal. Appl. Pyrolysis 2017, 124, 415–425. [Google Scholar] [CrossRef]
  38. Çepelioǧullar, Ö.; Pütün, A.E. Thermal and Kinetic Behaviors of Biomass and Plastic Wastes in Co-Pyrolysis. Energy Convers Manag. 2013, 75, 263–270. [Google Scholar] [CrossRef]
  39. Chin, B.L.F.; Yusup, S.; al Shoaibi, A.; Kannan, P.; Srinivasakannan, C.; Sulaiman, S.A. Kinetic Studies of Co-Pyrolysis of Rubber Seed Shell with High Density Polyethylene. Energy Convers Manag. 2014, 87, 746–753. [Google Scholar] [CrossRef]
  40. Narobe, M.; Golob, J.; Klinar, D.; Francetič, V.; Likozar, B. Co-Gasification of Biomass and Plastics: Pyrolysis Kinetics Studies, Experiments on 100 KW Dual Fluidized Bed Pilot Plant and Development of Thermodynamic Equilibrium Model and Balances. Bioresour. Technol. 2014, 162, 21–29. [Google Scholar] [CrossRef]
  41. Alvarez, J.; Kumagai, S.; Wu, C.; Yoshioka, T.; Bilbao, J.; Olazar, M.; Williams, P.T. Hydrogen Production from Biomass and Plastic Mixtures by Pyrolysis-Gasification. Int. J. Hydrog. Energy 2014, 39, 10883–10891. [Google Scholar] [CrossRef]
  42. Aboulkas, A.; el Harfi, K.; el Bouadili, A. Pyrolysis of Olive Residue/Low Density Polyethylene Mixture: Part I Thermogravimetric Kinetics. J. Fuel Chem. Technol. 2008, 36, 672–678. [Google Scholar] [CrossRef]
  43. Brebu, M.; Ucar, S.; Vasile, C.; Yanik, J. Co-Pyrolysis of Pine Cone with Synthetic Polymers. Fuel 2010, 89, 1911–1918. [Google Scholar] [CrossRef]
  44. Jakab, E.; Várhegyi, G.; Faix, O. Thermal Decomposition of Polypropylene in the Presence of Wood-Derived Materials. J. Anal. Appl. Pyrolysis 2000, 56, 273–285. [Google Scholar] [CrossRef]
  45. Kumagai, S.; Fujita, K.; Kameda, T.; Yoshioka, T. Interactions of Beech Wood–Polyethylene Mixtures during Co-Pyrolysis. J. Anal. Appl. Pyrolysis 2016, 122, 531–540. [Google Scholar] [CrossRef]
  46. Ohmukai, Y.; Hasegawa, I.; Mae, K. Pyrolysis of the Mixture of Biomass and Plastics in Countercurrent Flow Reactor Part I: Experimental Analysis and Modeling of Kinetics. Fuel 2008, 87, 3105–3111. [Google Scholar] [CrossRef]
  47. Yoshioka, T.; Grause, G.; Eger, C.; Kaminsky, W.; Okuwaki, A. Pyrolysis of Poly(Ethylene Terephthalate) in a Fluidised Bed Plant. Polym. Degrad. Stab. 2004, 86, 499–504. [Google Scholar] [CrossRef]
  48. Williams, P.T.; Williams, E.A. Interaction of Plastics in Mixed-Plastics Pyrolysis. Energy Fuels 1998, 13, 188–196. [Google Scholar] [CrossRef]
  49. The Pyrolysis of Individual Plastics and a Plastic Mixture in a Fixed Bed Reactor—Williams—1997—Journal of Chemical Technology & Biotechnology—Wiley Online Library. Available online: https://onlinelibrary.wiley.co. (accessed on 6 November 2022).
  50. Fukushima, K.; Coady, D.J.; Jones, G.O.; Almegren, H.A.; Alabdulrahman, A.M.; Alsewailem, F.D.; Horn, H.W.; Rice, J.E.; Hedrick, J.L. Unexpected Efficiency of Cyclic Amidine Catalysts in Depolymerizing Poly (Ethylene Terephthalate). J. Polym. Sci. Part A Polym. Chem. 2013, 51, 1606–1611. [Google Scholar] [CrossRef]
  51. Kumagai, S.; Hasegawa, I.; Grause, G.; Kameda, T.; Yoshioka, T. Thermal Decomposition of Individual and Mixed Plastics in the Presence of CaO or Ca(OH)2. J. Anal. Appl. Pyrolysis 2015, 113, 584–590. [Google Scholar] [CrossRef]
  52. Samperi, F.; Puglisi, C.; Alicata, R.; Montaudo, G. Thermal Degradation of Poly(Butylene Terephthalate) at the Processing Temperature. Polym. Degrad. Stab. 2004, 83, 11–17. [Google Scholar] [CrossRef]
  53. Montaudo, G.; Puglisi, C.; Samperi, F. Primary Thermal Degradation Mechanisms of PET and PBT. Polym. Degrad. Stab. 1993, 42, 13–28. [Google Scholar] [CrossRef]
  54. Holland, B.J.; Hay, J.N. The Thermal Degradation of PET and Analogous Polyesters Measured by Thermal Analysis-Fourier Transform Infrared Spectroscopy. Polym. (Guildf) 2002, 43, 1835–1847. [Google Scholar] [CrossRef]
  55. Muzyka, R.; Chrubasik, M.; Dudziak, M.; Ouadi, M.; Sajdak, M. Pyrolysis of Tobacco Waste: A Comparative Study between Py-GC/MS and Fixed-Bed Reactors. J. Anal. Appl. Pyrolysis 2022, 167, 105702. [Google Scholar] [CrossRef]
  56. Sajdak, M.; Muzyka, R.; Hrabak, J.; Rózycki, G. Biomass, Biochar and Hard Coal: Data Mining Application to Elemental Composition and High Heating Values Prediction. J. Anal. Appl. Pyrolysis 2013, 104, 153–160. [Google Scholar] [CrossRef]
  57. Montgomery, D.C.; Wiley, J. Design and Analysis of Experiments, 8th ed; John Wiley & Sons: Hoboken, NJ, USA, 2013. [Google Scholar]
  58. TIBCO Software. TIBCO® Statistica. Available online: https://www.tibco.com/resources/product-download/tibco-statistica-trial-download-for-windows (accessed on 13 January 2023).
  59. Sajdak, M. Characteristics of Chars from Biomass and Waste Co-Pyrolysis. 2021. Version 2. Available online: https://data.mendeley.com/datasets/rjg7j5wzrj/2 (accessed on 4 October 2021).
  60. Wang, Z.; Burra, K.G.; Lei, T.; Gupta, A.K. Co-Pyrolysis of Waste Plastic and Solid Biomass for Synergistic Production of Biofuels and Chemicals-A Review. Prog. Energy Combust. Sci. 2021, 84, 100899. [Google Scholar] [CrossRef]
  61. Sajdak, M.; Muzyka, R. Gaseous Products from Biomass and Waste Co-Pyrolysis—DOE. Version 1. 2022. Available online: https://data.mendeley.com/datasets/ny8bxjkhyk/1 (accessed on 14 November 2022).
Figure 1. Test setup for co-pyrolysis of biomass and plastic blends in a fixed-bed reactor.
Energies 16 00947 g001
Figure 2. Pareto charts for (a) H2, (b) C3H8, (c) C3H6, and (d) C4H10 (all variables characterised by bars exceeding the p = 0.05 limit had a statistically significant effect on the parameters under study).
Energies 16 00947 g002
Figure 3. Pareto charts for (a) CO, (b) CO2, (c) LHV, and (d) density (all variables characterised by bars exceeding the p = 0.05 limit had a statistically significant effect on the parameters under study).
Energies 16 00947 g003
Figure 4. Desirability charts for percentage concentrations (% v/v) of H2, C3H8, C3H6, and C4H10 in gaseous products obtained for the optimal co-pyrolysis conditions where desirability was a percentage of target fulfilment (maximisation of essential substances in gaseous products while minimising ballast substances, e.g., CO2).
Energies 16 00947 g004
Figure 5. Desirability charts for percentage concentrations (% v/v) of C4H10, C3H6, C3H8 in gaseous products obtained in the optimal co-pyrolysis conditions where desirability was a percentage of target fulfilment (maximisation of essential substances in gaseous products while minimising ballast substances, e.g., CO2).
Energies 16 00947 g005
Table 1. Basic physical and chemical characterisation of waste polymers [37], reproduced with permission from Elsevier.
ParameterUnitABSPETPPSBR
Ash content—Ashwt.%0.000.000.0014.01
Volatile Matter—VM99.9586.8499.9261.61
Fixed carbon—FC0.0013.110.0024.36
Moisture content—Wa0.050.050.080.02
Carbon content-Cta75.4462.4884.870.42
Hydrogen content—Hta8.194.1714.56.46
Oxygen content—Ota3.4433.30.257.22
Nitrogen content—Na4.740.000.140.43
Sulphur content—Sta8.140.000.231.44
High heating value—HHVMJ/kg38.0930.8545.8033.92
Table 2. Basic physical and chemical characterisation of applied biomass-based materials [37], reproduced with permission from Elsevier.
ParameterUnitAlder WoodStraw BiomassFurniture Waste
Ashwt.%0.354.782.02
VM78.5570.5073.87
FC14.7817.1817.78
Wa6.327.546.24
Cta45.9043.8047.70
Hta5.675.485.83
Ota37.4038.6941.79
Na4.470.620.26
Sta0.080.100.40
HHVMJ/kg17.83517.52319.072
Table 3. Physical and coded values of parameters for the design of experiments [37], reproduced with permission from Elsevier.
Parameters/LevelsSymbols
Coding—Classical Experimental DesignA—Temperature (°C)B—Polymer Blends Addition (M1, M2) (%)
Lowest−1.4144000.0
Low−14502.0
Centre05004.0
High+155016.0
Highest+1.41460032.0
Table 4. Mass balance of products (average) from pyrolysis biomass [59].
Pyrolysis TemperatureChar (% m/m)Liquid Fraction (% m/m)Gaseous Fraction (% m/m)
Straw biomass
40054.837.57.60
45038.040.421.6
50037.639.822.6
55032.443.024.6
60029.347.523.2
Alder wood
40039.044.916.1
45037.847.714.5
50027.855.017.1
55027.255.217.6
60025.355.918.8
Waste furniture
40053.532.114.4
45038.544.217.3
50032.747.519.8
55030.348.920.8
60029.049.621.4
Table 5. Mass balance of products (average) from co-pyrolysis biomass and plastic waste blends [59].
Addition (% m/m)Pyrolysis Temperature (°C)Char
(% m/m)
Liquid Fraction
(% m/m)
Gaseous Fraction
(% m/m)
Char
(% m/m)
Liquid Fraction
(% m/m)
Gaseous Fraction
(% m/m)
Abder wood + M1Alder wood + M2
245028.0054.4017.6130.5054.0215.48
255025.2556.5618.1923.2558.5918.17
1645038.5048.2419.6831.7554.6713.58
1655029.2550.2520.5126.0058.9915.01
050027.6755.1717.1627.6755.1717.16
3250029.5054.1216.3928.7556.1615.09
440036.5049.5014.0135.0051.3313.67
460023.5058.2018.3123.2558.7218.04
450024.7557.6117.6425.7557.4616.79
450026.2557.0916.6726.2556.9216.83
Straw + M1Straw + M2
245034.0044.9621.0431.2547.7820.98
255029.5047.8122.6927.5050.1622.34
1645037.2540.7921.9733.7547.9718.29
1655029.7550.2120.0527.0054.1118.90
050038.9439.2821.7738.9439.2821.77
3250034.2541.5819.4330.0051.3818.62
440039.0041.5819.4338.2543.2518.50
460027.2549.8222.9426.0051.8122.19
450029.7549.1721.0930.2549.3620.40
450032.2546.4321.3331.0045.5623.44
Waste furniture + M1Waste furniture + M2
245041.0041.2117.7936.0046.5417.46
255028.0051.8820.1228.0051.9920.01
1645042.0033.6424.3636.0046.9617.04
1655029.0050.4220.5829.0050.7320.27
050036.9245.0818.0036.9245.0818.00
3250038.5038.9522.5540.0047.8912.74
440043.0042.2014.8041.5044.3414.16
460027.0052.2520.7523.0055.3321.67
450030.0047.8622.1430.5050.2519.25
450033.0048.0019.0029.0050.1920.81
Table 6. Effects of variables on the chemical composition of the gaseous products.
VariableTemperaturePolymer AdditivesInteractionsPyrolysis Option
Parameter
H2++-+
CO++++
CH4+---
CO2++++
C2H4-+--
C2H6++--
C3H8++-+
C3H6++++
C4H10++++
HHV++-+
LHV++-+
Density+-++
Pyrolysis option—pyrolysis of various biomass with different polymer waste additives: straw + M2, wood + M1, wood + M2, furniture waste + M1, and furniture waste + M2.
Disclaimer/Publisher’s Note: The statements, opinions and data contained in all publications are solely those of the individual author(s) and contributor(s) and not of MDPI and/or the editor(s). MDPI and/or the editor(s) disclaim responsibility for any injury to people or property resulting from any ideas, methods, instructions or products referred to in the content.

