Abstract
Saline wastewater pollution is a critical issue that needs to be addressed. The present study focused on the development of a dual-chambered microbial fuel cell (MFC) treating saline wastewater at the anode. Halophilic exo-electrogenic bacteria enriched from seawater (Arabian Sea, Mumbai, India) were used in the anodic chamber of the MFC. Denitrification using denitrifying bacteria was employed in the cathodic chamber. The maximum power density was significantly increased from 96.77 mW/m2 to 162.09 mW/m2 with a rise in NaCl concentration from 20 to 40 g/L. Nitrate removal in the cathode chamber increased from 80 ± 3% to 89 ± 3.2% with increase in salt concentration from 20 g/L to 40 g/L and concomitantly COD removal in the anode chamber increased from 76 ± 3.8% to 83 ± 4%. Cyclic voltammetry (CV) analysis revealed higher electrochemical activity at 40 g/L salt concentration. Electrochemical impedance spectroscopy (EIS) analysis exhibited that charge transfer and solution resistances were lower when the salinity was increased. Microbial community analysis revealed the presence of Clostridium, Shewanella, and Bacillus as the most abundant genera in the anodic chamber. This study demonstrated the dual applicability of the system targeted for removal of organics from saline wastewater and nitrate removal from contaminated wastewater accompanied by power generation from the MFC.
1. Introduction
The treatment of organic pollutants from saline wastewater is one of the major environmental concerns which needs urgent attention. Fish, textile, petroleum, food processing, and leather industries generate saline wastewater. Seawater is used for cleaning toilets in coastal cities, which eventually leads to the generation of saline wastewater [1]. Saline wastewater constitutes approximately 5% of the overall wastewater generated worldwide. To treat this saline wastewater, many physicochemical processes including coagulation–flocculation, evaporation, ion exchange, and membrane processes [2] can be applied. However, such physiochemical processes are uneconomical and inherently energy intensive compared to biological processes. Treatment of saline wastewater using a biological process may be more efficient when halophilic bacteria are used instead of freshwater bacteria.
In a microbial fuel cell (MFC), chemical energy contained in the substrate or waste can be converted into electrical energy through the bio-electrocatalytic activity of microorganisms [3]. MFC systems rely on bacteria capable of extracellular electron transfer activity, i.e., bacteria capable of exchanging electrons with the conductive electrode [4]. In an MFC, a proton exchange membrane separates the anodic and cathodic chambers, where oxidation and reduction occur at the anode and cathode chamber, respectively.
During the past two decades, a notable improvement has been observed in the production of power in MFCs. There still exist many challenges associated with MFC technology that need to be addressed for large-scale applications. The use of low conductivity (approximately 1 mS/cm) domestic wastewater ultimately restricts the power generation in an MFC system. An optimal conductivity of the solution equivalent to ~20 mS/cm is reported to yield higher power density in MFCs [5,6]. Further, in the MFC system, when the conductivity is low, ion transport is limited. This causes an increase in the internal resistance of the system. Additionally, the ohmic and the charge transfer resistances are increased with an increase in internal resistance of the system. In large-scale MFC systems, ohmic losses are higher in comparison to small-scale MFC systems due to the configuration of the reactor [7]. Some studies have suggested that the addition of salt would reduce mass transport limitations and the internal resistance of the system [1,8]. Kumar et al. (2020), reported that the addition of salt in the anolyte resulted in a reduction of the charge transfer resistance. This facilitated the exchange of electrons from the electroactive biofilm (EAB) to the electrode [9]. As previously mentioned, halophilic bacteria are potential candidates for the operation of MFCs under saline conditions. Such bacteria can survive under extreme salinity conditions.
The source from which the halophilic bacteria are enriched plays an important role in salinity tolerance. Halophilic bacteria isolated from saline sediments are reported to tolerate salinity up to 250 g/L NaCl [10,11,12,13]. In contrast, halophilic bacteria isolated from domestic wastewater/anaerobic sludge can tolerate salinity up to 20–24 g/L [1,8,14,15].
Studies using seawater or saline effluent originating from industrial processes as the anolyte have shown the beneficial effect of high ionic strength on power generation [16,17,18,19,20,21].
In all these studies, the power performance increased with increasing salinity up to an optimal level and subsequently decreased as the optimal salinity was exceeded. For example, in one study, as salinity in the anodic chamber of an MFC varied from 1–8%, the maximum power density of 48.4 mW/m2 was achieved at 6% salinity [10]. In an MFC system, the optimal salinity at which the power is highest varies depending on a variety of parameters, such as operating conditions, inoculum source, and MFC reactor configuration. The optimal salinity is likely to be strongly influenced by the inoculum source and its acclimatization.
The selection of a suitable electron acceptor in the cathode also plays an important role since it contributes to the overall potential generated in the MFC system. Oxygen has been used as the electron acceptor in MFCs treating saline wastewater. The use of alternate electron acceptors, such as nitrate, can be an effective strategy to treat nitrate-contaminated wastewater. Additionally, in MFCs using a biocathode, the costly platinum-based catalyst can be replaced. The redox potential of nitrate is almost similar to that of oxygen [22]. Thus, such a process can treat wastewater contaminated with nitrate at the cathode while simultaneously removing COD from the anolyte.
As mentioned earlier, enrichment and isolation of halophilic bacteria from seawater would enable MFC operation under highly saline conditions. The objective of this research was to enrich and acclimatize halophilic bacteria from Mumbai seawater (Arabian Sea) for determining its potential for power generation from saline wastewater in a denitrifying MFC. The enriched culture was used as a catalyst in the anodic chamber of the MFC containing saline wastewater. A denitrifying enriched culture and nitrate-rich wastewater were added to the cathode chamber. Nitrate in the cathode chamber acted as the electron acceptor. This study presents a comparison of power and voltage generation in MFCs operated at different NaCl concentrations and also explores differences in power and voltage generation, chemical oxygen demand (COD) removal from the saline wastewater, and nitrate removal at the cathode chamber. Further, electrochemical and microbial community analysis studies were also performed under different salinity conditions. This is the first study using halophilic bacteria for electricity generation in an MFC using an enriched culture derived from the Arabian sea. In this study, COD removal at the anode was coupled with simultaneous denitrification at the cathode.
2. Materials and Methods
2.1. Sample Collection and Enrichment of Halophilic Bacteria
Water samples were collected from the Arabian Sea (coordinates: 19.10° N 72.83° E, temperature—32 °C) in sterile bottles, and the bottles were transported to the laboratory. All the water samples were sealed until further use and stored at 4 °C. The samples were collected from two distinct locations to achieve bacterial diversity in the anodic inoculum. Characterization of the collected water samples was performed, and TDS, salinity, pH, and conductivity were determined (Table 1).

Table 1.
Characterization of water samples collected from the Arabian Sea, Mumbai.
The anodic inoculum was enriched from the collected seawater samples. The enrichment process is discussed briefly. The water samples were inoculated aseptically in halophilic media containing NaCl and multiple transfers were performed for enriching a halophilic consortium. The composition of halophilic medium was as follows (per L): casein hydrolysate—8 g, yeast extract—4.0 g, KH2PO4—0.1 g, K2HPO4—0.1 g, MgSO4—0.1 g, and Sodium acetate—3 g. (Atlas, 2010). The pH was adjusted to 7. After inoculation, the halophilic medium was kept at 37 °C in an incubator shaker. Subsequently, for all the experiments, this enriched culture was used for inoculation at the anode chamber. In this study, two different salinities of 20 g/L and 40 g/L were tested in anolyte. The MFCs were operated under open circuit conditions for the first nine days to allow voltage to build-up before closed circuit operation was initiated.
2.2. MFC Configuration and Operation
An MFC with dual chambers was constructed using acrylic sheets. The construction and installation of the fuel cell have been described previously [23]. The working volume of the anode and cathode chamber was 100 mL each. The physical dimensions of both chambers were 5 (l) × 5 (b) × 5 (h) cm. A proton exchange membrane (Nafion—117, Fuel cell store, USA) was used for physical separation of the two chambers. Dual ports were provided in both chambers on the upper side for adding the sample/substrate and for fixing the electrode wire. For creating an environment free of oxygen, the anodic and the cathodic ports were sealed using rubber stoppers during MFC operation. The cathode and anode were comprised of carbon felt (l × b × h—3 × 3 × 0.55 cm, surface area—18.6 × 10⁻⁴ m2, Fuel cell store, USA), and stainless-steel mesh (dimension—3 × 3 cm, Grade-316 L), respectively. Pre-treatment of the electrode was carried out as described by a previous study [24]. A copper wire was used as the current collector. The MFC was kept at a constant resistance of 100 Ω throughout the experiment. A schematic of the MFC is depicted in Figure 1. The anolyte comprised the following (per L): casein hydrolysate—8 g, yeast extract—4.0 g, KH2PO4—0.1 g, K2HPO4—0.1 g, MgSO4—0.1 g, and Sodium acetate—3.5 g., and the solution pH was adjusted to 7.0 ± 0.2 [25]. Two different NaCl concentrations of 20 g/L and 40 g/L were added to the anodic media to evaluate the performance of the MFC at high salinity. These concentrations were chosen based on the enrichment studies conducted at various salinity values (. Inoculation of the anodic chamber was achieved using 10 mL of an active bacterial consortium enriched from seawater as already discussed. Synthetic wastewater in the cathode chamber contained (per liter): 4.4 g KH2PO4, 3.4 g K2HPO4, 2 g NaHCO3, 0.5 g NaCl, 0.2 g MgSO4·7H2O, and 0.0146 g CaCl2, and its pH was adjusted 7.0. The composition of synthetic wastewater was suggested by Clauwaert et al. [26]. KNO3 (2.5 g/L) served as the nitrate source in the cathodic medium. Since autotrophic denitrification was targeted, no organic matter was added to the catholyte. Inoculation of the cathodic chamber was achieved using the denitrifying bacterial culture extracted from soil and cow manure as reported by Vijay et al. [27]. This enriched denitrifying culture was used for reducing the initial start-up time. Abiotic controls free of microbes were set up simultaneously. The MFCs were operated at a temperature of 37 °C in fed-batch mode in a temperature-controlled environmental chamber (Made-Kaleidoscope) for up to 7 cycles. Each cycle was run for 4 days. When the voltage dropped to 40 mV, the media and substrate were replaced.
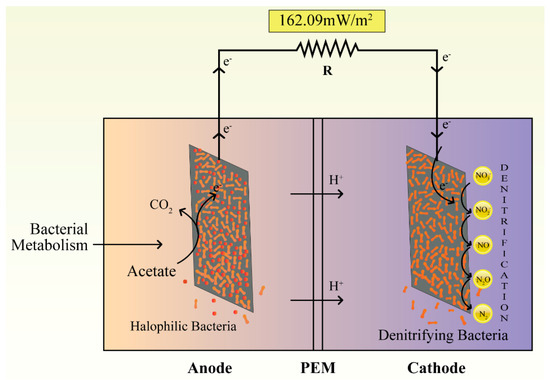
Figure 1.
Schematic diagram of the MFC.
2.3. Analysis and Calculations
A multi-parameter meter (Cole Parmer, Mumbai, India) was used to measure conductivity, salinity, TDS, and pH according to standard protocol. Examination of the abiotic controls was performed simultaneously. COD and nitrate were determined according to the standard protocols [28]. Measurements of voltage and current were taken regularly using a data acquisition system. The power density (mW/m2) was calculated by dividing the power by the projected surface area (m2) of the cathode. By measuring the voltage and current over a range of external resistance from 50,000 Ω to 5 Ω, the polarization curves were plotted. The values were noted after achieving a stable potential and current. Columbic efficiency (CE) was calculated using the formula:
where I is current, M is the molecular weight of nitrate, F is the Faraday constant, n is the number of electrons exchanged per mole of nitrate when nitrate is completely reduced to molecular nitrogen, V is the volume of the anodic chamber, and ∆COD is the difference between the initial and final COD at time t.
2.4. Electrochemical Analysis
Cyclic voltammetry (CV) and electrochemical impedance spectroscopy (EIS) were performed using Biologic VMP-3 potentiostat (BioLogic, Claix, France) in MFCs with three-electrode system as described in the previous study by Vijay et al. [13]. In the three-electrode system, the anode acted as a working electrode, the cathode was counter electrode and an Ag/AgCl electrode dipped in the anode chamber served as the reference electrode. To obtain the CV plots, the voltage was swept from −0.8 V to +0.8 V using a scan rate of 10 mV/s. The CV was recorded using the software EC-Lab V 10.44. EIS measurements were taken over the frequency range varying from 1 MHz to 10 mHz using an AC signal of 10 mV. The obtained data were analyzed using EC lab software V 10.44. The EIS data were simulated to prepare the equivalent circuit to calculate the charge transfer resistance (Rct) and solution resistance (Rs) using EC lab software V11.36.
2.5. Anodic Microbial Population Analysis
Extraction of DNA samples from the anodic biofilm was performed after the MFC achieved maximum voltage in the last batch cycle. The DNA was extracted using the DNA isolation kit, QIAamp, Qiagen, Mumbai, India. The PCR was carried out using the V3-V4 amplicons with region-specific primers (16S Forward: AGAGTTTGATCCTGGCTCAG; 16S Reverse: GGTTACCTTGTTACGACTT; V3-V4 Forward: CCTACGGGNGGCWGCAG; V3-V4 Reverse: GACTACHVGGGTATCTAATCC). These PCR amplicons were sequenced on the Illumina platform at MedGenome labs (Bangalore, India) to analyze the bacterial diversity. The analyses and alpha-diversity were all calculated as described previously [23]. The sequenced data was submitted to the NCBI sequence read archive (SRA) with the accession number PRJNA842887.
3. Results and Discussion
3.1. Voltage Generation Profile with Time
During start-up, all the MFCs were operated under open circuit conditions. In this start-up period, the enrichment and growth of bacteria caused voltage generation. In this study, both the MFCs took about 9 days to stabilize, and after that, a positive voltage was generated. This is indicative of the successful enrichment of exo-electrogenic halophilic bacteria. Also, it was observed that the voltage was generated at both the salinity values pointing towards the successful development of the anodic microbial community. The MFCs were operated for 7 fed-batch cycles where the duration of each cycle was 4 days.
The voltage evolved during the first batch cycle. After the first batch cycle, the bacteria were further enriched with subsequent cycles and this resulted in the generation of progressively higher voltage towards the end of each cycle. The maximum operating voltage achieved after the last batch cycle was 375 ± 10 mV and 240 ± 8 mV at salinity values of 40 g/L and 20 g/L respectively (Figure 2A,B). The reproducibility of the voltage achieved was determined based on the duplicate studies as illustrated in Figure 2A. Every cycle was initiated by feeding acetate containing wastewater into the anode chamber which was followed by a gradual rise in the voltage. With the depletion of acetate at the anode, a fall in the voltage was observed. (Figure 2B). The voltage was found to start increasing after the addition of acetate after every batch cycle. A similar voltage trend was reported in a previously published study [29]. All the functional MFCs attained high operating voltage over 28 days of fed-batch operation. The progressive increase in voltage towards the end of a cycle can be visualized in Figure 2A,B through the successive feed cycles from 1 to 7 due to the growing bacterial biomass and enrichment of exo-electrogenic activity under closed circuit conditions. In closed-circuit conditions, the bacterial biofilm either releases soluble mediators or employs direct electron transfer which contributes to electricity generation. Thus, with the growth of biofilm on the electrode surface, a rise in mediator concentration is expected along with the rise in voltage and current.
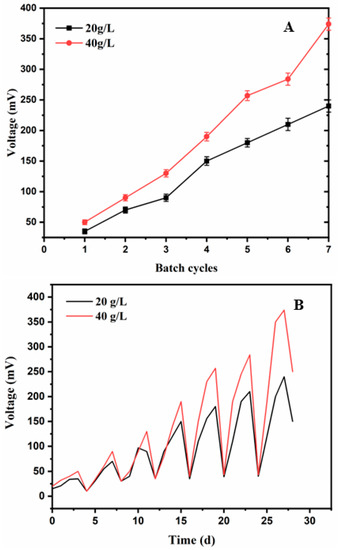
Figure 2.
(A) Maximum voltage achieved in a cycle versus cycle number during operation of MFC in fed-batch mode (B) Voltage v/s time profile over the entire period of MFC operation at different salinities.
Estimation of nitrate was also carried out at the cathode during each batch cycle and was supplemented at regular intervals to maintain the redox potential. During the monitoring period, the maximum open-circuit voltage (OCV) was 435 ± 10 mV and 670 ± 13 mV at 20 g/L and 40 g/L salinity, respectively (Table 2). The highest OCV and the operating voltage were supported by a NaCl concentration of 40 g/L, and below this value, the voltage declined. Previous studies showed similar results of voltage and current profiles for MFCs operating at different salinities [10].
Table 2.
Comparison of the data obtained for MFCs operating at different NaCl concentrations (Initial COD—2900 ± 110 mg/L; Initial NO3−-N—345 mg/L).
3.2. Power Generation at Different Salinities
During the last batch cycle, studies on the polarization curve were carried out on both the saline MFCs. The voltage and current were noted at different external resistances ranging from 50 KΩ to 5 Ω. The maximum power density was obtained at 100 Ω as visualized in the polarization curves. A comparative presentation of voltage, power density, and current density at both salinities is summarized in Table 2. The highest power density and a current density of 162.09 ± 3 mW/m2 and 1801.07 ± 10 mA/m2, respectively, were obtained at 40 g/L NaCl concentration (Figure 3). The peak power density and current density when operating at 20 g/L NaCl were 806.45 ± 8 mA/m2 and 96.77 ± 3 mW/m2, respectively. About a 1.7-fold increase in power output could be observed with an increase in NaCl concentration to 40 g/L. The maximum current density of 2161.29 ± 15 mA/m2 and 1908.60 ± 12 mA/m2 were obtained at 5 Ω in 40 g/L and 20 g/L, respectively. The volumetric power density (per unit volume of the anode chamber) was 1.8 W/m3 and 3.01 W/m3 at 20 g/L and 40 g/L NaCl, respectively. No power generation was observed in the control MFC. In the present study, the maximum power density of 162.09 ± 3 mW/m2 achieved was higher than the power density reported in other studies involving halophilic bacteria [30,31]. All studies using halophilic bacteria on the anode side have reported energy generation using oxygen reduction at the cathode. In the present study, the power was recovered using nitrate as a terminal electron acceptor using denitrifying microbial consortia.
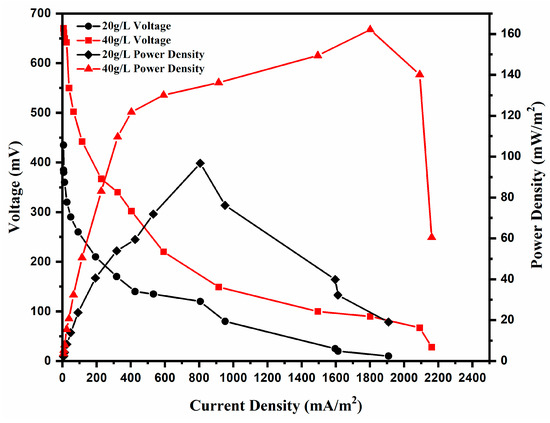
Figure 3.
Polarization curves at different salinities.
3.3. COD Removal Efficiency at Different Salinities
Operation of the saline MFC was carried out at an influent COD concentration of 2900 ± 140 mg/L at both salinities. The rate of COD degradation reflected the adaptability of the microbial consortia for depicting exo-electrogenic activity on acetate as an electron donor and carbon source in the presence of high salt concentration. It also aided in the determination of the overall efficiency of the system. In this study, sodium acetate was used as a substrate. At 20 g/L and 40 g/L salinity, overall COD removal of 76 ± 3.8% and 83 ± 4% were achieved, respectively in the last batch cycle (Table 2, Figure 4A). A higher COD removal rate at 40 g/L salinity correlated well with higher power generation and current production at higher salinity. The COD removal rate (mg/L/d) at 20 g/L and 40 g/L salinity was 550 mg/L/d and 625 mg/L/d, respectively. Further, the COD removal rate was found to be higher under closed-circuit conditions in comparison to open-circuit conditions. Under open circuit conditions, 28% and 32% COD removal were observed at 20 g/L and 40 g/L salinity, respectively. This indicates that the electrons which were channeled toward the production of electricity were responsible for the oxidation of organic matter. As long as the removal of COD is accomplished by the generation of electricity, the goal of treating the wastewater and generation of power is achieved.
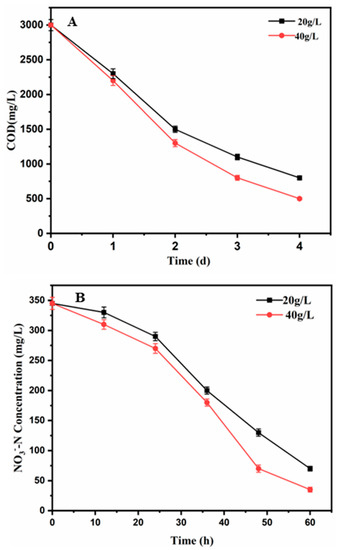
Figure 4.
(A) Chemical oxygen demand (COD) degradation profile with time at different salinities, (B) Nitrate-nitrogen removal profile with time at different salinities.
Additionally, coulombic efficiency was determined based on the total COD removal. At 20 g/L and 40 g/L salinity, 12 ± 0.06% and 14 ± 0.08% coulombic efficiency was observed, respectively. These CE values demonstrate that a substantial amount of substrate was lost towards processes other than current production. Low CE can result from the utilization of substrate for processes such as microbial growth, non-electricity producing reactions, and formation of secondary microbial products and may be dependent on the type and concentration of electron acceptor in the system and competition between exo-electrogenic bacteria and other bacterial strains in the anode and the cathode [19]. It may also depend on the availability of electrons for nitrate reduction and the availability of exoelectrogenic nitrate reducers in the cathode chamber. The removal of COD observed in this study is either comparable to or higher than the previously reported studies where acetate was used as a substrate in a saline medium [32,33]. The external resistance also affected the COD removal rate as reported in other studies [34]. The external resistor affects the flow of electrons from the anode to the cathode thereby affecting both the power and the COD removal rate. In the present study, 100 ohm resistance was chosen for power generation as it was already reported as the optimum resistance in a previous study [35].
3.4. Nitrate Removal at Different Salinities
The denitrification process was employed at the cathode chamber using pre-acclimatized bacteria culture as described in the above section. Since this bacterial culture has both denitrifying and exo-electrogenic bacteria, it supported power output as well as nitrate removal [23]. The initial feeding concentration of nitrate-nitrogen (NO3−-N) was 345 mg/L [23]. At this concentration, saline MFCs exhibited successful removal of nitrate. When the salt concentration on the anode side was 40 g/L, the nitrate removal was 89 ± 3.2% (NO3−-N) and the nitrate removal rate was 124 ± 3 mg/L/d (Table 2, Figure 4B). At a salinity of 20 g/L, the NO3−-N removal was 80 ± 3% (NO3−-N) and the nitrate removal rate was 110 ± 4 mg/L/d (Table 2, Figure 4B). Higher nitrate removal was caused by the higher current observed at the higher salinity [26]. In the abiotic control, no nitrate removal was observed. This indicated the significance of the bio-electrochemical process occurring in the saline MFCs. Further, the rate of nitrate removal was increased with each subsequent batch cycle. After the third cycle, average nitrate removal was in the range of 72 ± 5% and 62 ± 5% at 40 g/L and 20 g/L salinity, respectively. This was due to the development of the biofilm at the cathode. The present study successfully exhibited the removal of COD from saline wastewater and nitrate removal from nitrate-contaminated wastewater. Further, in all the studies of power generation by halophilic bacteria, oxygen is used as an electron acceptor in the cathode chamber. In the present study, the addition of nitrate as an electron acceptor in the cathode chamber has several other applications also. The present MFC system can be used in the submersible environment. In marine engineering, the MFC system can be easily operated underwater when nitrate is added as electron acceptor in the cathode chamber instead of oxygen.
3.5. Cyclic Voltammetry (CV)
CV is a technique used to analyze the electrochemical processes at the electrode surface. The major differences in the oxidation and reduction peaks at both the salinities can be visualized from the CV curves (Figure 5). The oxidative peak current value of 46.54 mA was observed at 0.3 V in the MFC with 40 g/L salinity. At 20 g/L salinity, the oxidative peak current of 27.68 mA was noted at 0.34 V. These values possibly correspond to the outer membrane c-type cytochromes of OmcB/OmcZ [36]. At 40 g/L, the reductive peak current value of −62.97 mA was obtained at −0.55 V, whereas at 20 g/L, −34.31 mA was observed at −0.59 V. The peak obtained at −0.59 V corresponds to NAD+/NADH reduction reaction [9]. These findings are indicative of the fact that both mediated and direct electron transfer were involved in the generation of power. The absence of prominent redox peaks in the control MFC points out the bacterial-driven catalysis as the sole reason for redox reaction occurring at the electrode. These observations clearly indicate that at 40 g/L salinity, electrochemical activity of the biofilm was higher as compared to that at 20 g/L salinity. Variations in the peak current values between both the saline MFCs are apparent in the form of about a 1.7-fold difference in the highest power density. Similar observations were reported in a previous study [37].
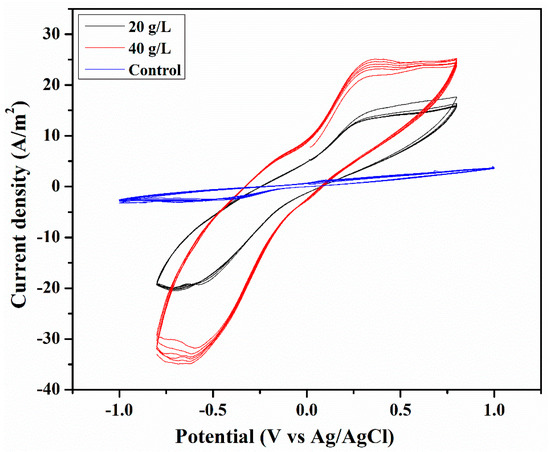
Figure 5.
Cyclic voltammetry profile at different salinities and control MFC.
3.6. EIS Analysis
The Nyquist plot presented in Figure 6A,B clearly explains the charge transfer activity, ohmic, and Warburg diffusion resistance. In the Nyquist plot, charge transfer resistance (Rct) can be seen on the semicircle region (low frequency). It is evident from the figure that the total resistance decreased as the anodic salinity increased. The solution resistance (Rs = 0.64 Ω) and the charge transfer resistance (Rct = 17.81 Ω) at 40 g/L salinity were lower than those at 20 g/L salinity (Rs = 0.853 Ω, Rct = 18.9 Ω). In the control MFC, solution resistance (Rs) of 3.5 ohms and charge transfer resistance (Rct) of 518 ohms were observed. A lower Rct value at 40 g/L salinity is indicative of low charge-transfer resistance. These observations show the enhancement of electrocatalytic activity and increased electron transfer at the electrode surface in the MFC. Additionally, a reduction in solution resistance was observed with an increase in anodic salinity. It could be visualized that the control MFC showed high Rct values as bio-electrochemical activity was not prevailing there. The addition of salt decreased the Rct value at both salinities. It can be concluded that the addition of NaCl changed the physicochemical environment of the anodic chamber in terms of solution and charge transfer resistance. Similar trends were reported previously [9]. It is already reported in the literature [38] that with an increase in salinity, the solution resistance decreases, which could be observed in this study as well. The EIS results were consistent with the CV data obtained in the present study. Similarly, a reduction in the total resistance with the increase in anode salinity is also in accordance with the increased power output of the MFC.
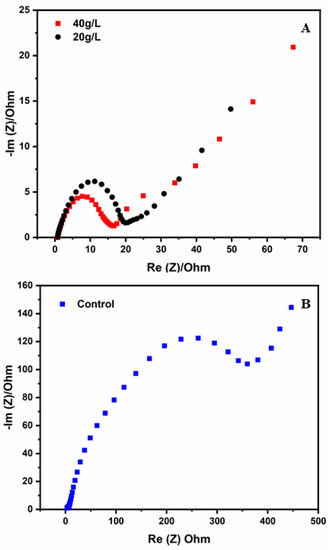
Figure 6.
EIS profile while operating MFCs at (A) different salinities and (B) without microbes (control MFC).
3.7. Microbial Community and Diversity Analysis
The sequencing of DNA extracted from the anodic biofilm generated a total of 307,639 total raw reads. Based on 96% sequence similarity a total of 450 OTUs were generated. According to the alpha diversity calculation, the value of the Shannon index was 3.53, and Chao-1 was 450. The value of the alpha diversity indicates the bacterial diversity and richness in the system. The rarefraction curve was also plotted between the observed OTUs v/s sequences per sample. The plot shows the typical hyperbolic curve which shows saturation in the sequencing process.
In the saline MFC, the presence of electro-active bacteria is important as they are responsible for electron transfer at the anode surface. The relative abundance at phylum, order, class, and family levels can be seen in Figure 7. At the phylum level, Firmicutes (76.8%) were predominant. Other abundant phyla included proteobacteria (22.1%) and Actinobacteria (0.07%). The presence of Firmicutes is reported under highly saline conditions [11]. Proteobacteria are also known for their electroactive ability in MFCs [39]. At class level, Clostridia (49.3%), Bacilli (27.6%), Gammaproteobacteria (22.1%), and Actinobacteria (0.07%) were found to be abundant. Clostridia, Bacilli, and Gammaproteobacteria are known for their abundance in sea sediments and are also reported to show electroactivity [11,40,41]. Further, at the family level, Clostridiaceae (49.07%), Shewanellaceae (19.6%), Planococcaceae (14.5%), Bacillaceae (12.3%), and Enterobacteriaceae (2.08%) were found to be abundant. Figure 8 shows the heat map which represents all the dominant bacteria present in the microbial community. It can be seen that Clostridium was the most abundant genus in the heat map. This bacterium is already reported for direct and mediated electron transfer in MFC anodes [9,42,43]. This bacterium is also reported to produce electricity in MFCs containing seafood industry wastewater [19]. The second most abundant genus was Shewanella. This bacterium is reported for its direct electron transfer properties in MFCs [44] and intense research has been carried out on its mediator-less electron transfer property. In addition, some of these bacterial strains were reported in sea sediments, producing electricity under highly saline conditions up to 70 g/L [10,45,46]. The third most dominant genus was found to be Bacillus. Bacillus is also reported for its extracellular electron transfer capability under highly saline conditions [13,30,40]. Bacillus sonorensis was observed as one of the species visualized in the heat map. This bacterial species is known for its exo-electrogenic nature in MFCs [47]. Further analysis of the heatmap revealed the presence of Clostridium oceanicum which is found in marine sediments [48].
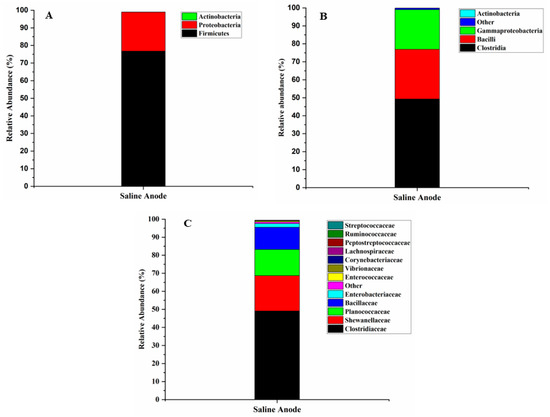
Figure 7.
The relative abundance of microbial community at 40 g/L (A) Phylum (B) Class (C) Family Level.
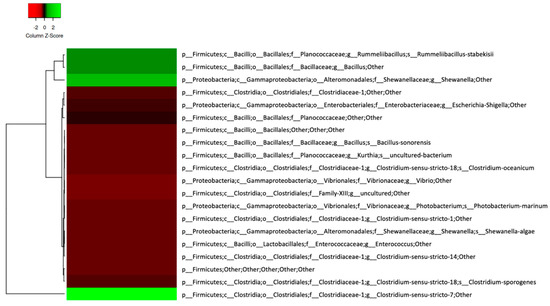
Figure 8.
A heat map showing the taxonomy assignment for each OTU. Green color represents OTUs having relatively higher abundance whereas red color represents OTUs having lower abundance. (For interpretation of the references to color in this figure legend, the reader is referred to the web version of this article).
The same cathodic microbial community capable of autotrophic denitrification used in a prior study in MFC [23], was used in this study. The predominant genus present were Pseudomonas and Thauera. Specifically, Pseudomonas stutzeri present in this consortium has been reported for its autotrophic denitrification and electricity generation in a biocathode MFC [49]. In addition, Acholeplasma, Paracoccus aminovorans, and Alkaliphilus transvaalensis were also present. This microbial community exhibited efficient denitrification in the absence of any organic carbon source in the cathode. It can be summarized that the cathodic community was composed of denitrifying and electroactive microbes which carried out denitrification.
The microbial community enriched from seawater reported in this study was found to be comprised of halophilic bacteria that could tolerate high salinity and transfer electrons extracellularly. Future studies could explore the use of industrial wastewater characterized by high salinity in MFCs. The primary technical challenges associated with the application of these microbes for electricity generation from saline industrial wastewater are the nature of organics contributing to the COD, toxic organic and inorganic constituents in the wastewater, and the range of salinity values encountered. Inherent variability in wastewater characteristics may cause fluctuations in power output and may adversely affect the microbial community. Another challenge is corrosion of the electrode at high salinity values. The selection of suitable electrode material is very important when using industrial wastewater with different salinity ranges. Thus, acclimatization of microbes on the wastewater and optimization of operating conditions would be required for treating various saline industrial wastewaters. Moreover, scaled-up studies using saline industrial wastewater should be conducted in flow-through systems.
4. Conclusions
The current study demonstrated that halophilic bacteria enriched from the Arabian sea could serve as an exo-electrogenic bacterial consortium that could be applied for power generation in MFC while also treating saline wastewater. The power density and the current density increased as the salinity increased from 20 g/L to 40 g/L due to an increase in ionic strength of the anolyte. CV analysis also confirmed higher electrochemical activity at 40 g/L salinity. The EIS profile indicated a decrease in the charge transfer resistance and solution resistance as the salinity increased from 20 g/L to 40 g/L. The MFC system developed in this study demonstrated COD removal from saline wastewater together with autotrophic denitrification of a nitrate-rich wastewater stream and simultaneous power generation. Thus, the treatment of saline industrial wastewater in MFCs with simultaneous power generation may be feasible. However, more studies are needed with specific types of industrial wastewater to acclimatize the exo-electrogenic consortia and optimize the MFC design and operating conditions.
Author Contributions
Conceptualization, A.V.; Methodology, A.V.; Validation, A.V.; Formal analysis, A.V.; Investigation, A.V.; Writing—original draft, A.V.; Writing—review & editing, P.C.G. and S.M.; Visualization, A.V. and S.M.; Supervision, P.C.G. and S.M.; Project administration, P.C.G. and S.M.; Funding acquisition, P.C.G. and S.M. All authors have read and agreed to the published version of the manuscript.
Funding
This research received no external funding.
Data Availability Statement
All irrelevant data is incorporated in the manuscript.
Acknowledgments
Author AV acknnowledges, the Indian Institute of Technology Bombay for providing the institute post-doctoral fellowship.
Conflicts of Interest
The authors declare no conflict of interest.
References
- Lefebvre, O.; Tan, Z.; Kharkwal, S.; Ng, H.Y. Effect of increasing anodic NaCl concentration on microbial fuel cell performance. Bioresour. Technol. 2012, 112, 336–340. [Google Scholar] [CrossRef]
- Lefebvre, O.; Moletta, R. Treatment of organic pollution in industrial saline wastewater: A literature review. Water Res. 2006, 40, 3671–3682. [Google Scholar] [CrossRef] [PubMed]
- Logan, B.E.; Hamelers, B.; Rozendal, R.; Schröder, U.; Keller, J.; Freguia, S.; Aelterman, P.; Verstraete, W.; Rabaey, K. Microbial Fuel Cells: Methodology and Technology. Environ. Sci. Technol. 2006, 40, 5181–5192. [Google Scholar] [CrossRef] [PubMed]
- Logan, B.E. Exoelectrogenic bacteria that power microbial fuel cells. Nat. Rev. Genet. 2009, 7, 375–381. [Google Scholar] [CrossRef] [PubMed]
- Liu, G.; Yates, M.D.; Cheng, S.; Call, D.F.; Sun, D.; Logan, B.E. Examination of microbial fuel cell start-up times with domestic wastewater and additional amendments. Bioresour. Technol. 2011, 102, 7301–7306. [Google Scholar] [CrossRef] [PubMed]
- Logan, B.E.; Rabaey, K. Conversion of Wastes into Bioelectricity and Chemicals by Using Microbial Electrochemical Technologies. Science 2012, 337, 686–690. [Google Scholar] [CrossRef]
- Rozendal, R.A.; Hamelers, H.; Rabaey, K.; Keller, J.; Buisman, C.J. Towards practical implementation of bioelectrochemical wastewater treatment. Trends Biotechnol. 2008, 26, 450–459. [Google Scholar] [CrossRef]
- Liu, H.; Cheng, S.; Logan, B.E. Power Generation in Fed-Batch Microbial Fuel Cells as a Function of Ionic Strength, Temperature, and Reactor Configuration. Environ. Sci. Technol. 2005, 39, 5488–5493. [Google Scholar] [CrossRef]
- Kumar, S.S.; Kumar, V.; Gude, V.G.; Malyan, S.K.; Pugazhendhi, A. Alkalinity and salinity favor bioelectricity generation potential of Clostridium, Tetrathiobacter and Desulfovibrio consortium in Microbial Fuel Cells (MFC) treating sulfate-laden wastewater. Bioresour. Technol. 2020, 306, 123110. [Google Scholar] [CrossRef]
- Huang, J.; Sun, B.; Zhang, X. Electricity generation at high ionic strength in microbial fuel cell by a newly isolated Shewanella marisflavi EP1. Appl. Microbiol. Biotechnol. 2010, 85, 1141–1149. [Google Scholar] [CrossRef]
- Monzon, O.; Yang, Y.; Yu, C.; Li, Q.; Alvarez, P.J.J. Microbial fuel cells under extreme salinity: Performance and microbial analysis. Environ. Chem. 2015, 12, 293–299. [Google Scholar] [CrossRef]
- Li, X.; Zheng, R.; Zhang, X.; Liu, Z.; Zhu, R.; Zhang, X.; Gao, D. A novel exoelectrogen from microbial fuel cell: Bioremediation of marine petroleum hydrocarbon pollutants. J. Environ. Manag. 2019, 235, 70–76. [Google Scholar] [CrossRef] [PubMed]
- Vijay, A.; Arora, S.; Gupta, S.; Chhabra, M. Halophilic starch degrading bacteria isolated from Sambhar Lake, India, as potential anode catalyst in microbial fuel cell: A promising process for saline water treatment. Bioresour. Technol. 2018, 256, 391–398. [Google Scholar] [CrossRef]
- Adelaja, O.; Keshavarz, T.; Kyazze, G. The effect of salinity, redox mediators and temperature on anaerobic biodegradation of petroleum hydrocarbons in microbial fuel cells. J. Hazard. Mater. 2015, 283, 211–217. [Google Scholar] [CrossRef]
- Tan, F.X.; Zhang, L.H.; Liu, W.F.; Zhu, Y.M. Osmotic Pressure Compensated Solute Ectoine Improves Salt Tolerance of Microbial Cells in Microbial Fuel Cells. Fuel Cells 2019, 19, 616–622. [Google Scholar] [CrossRef]
- Grattieri, M.; Minteer, S.D. Microbial fuel cells in saline and hypersaline environments: Advancements, challenges and future perspectives. Bioelectrochemistry 2018, 120, 127–137. [Google Scholar] [CrossRef]
- Zhang, L.; Fu, G.; Zhang, Z. Simultaneous nutrient and carbon removal and electricity generation in self-buffered biocathode microbial fuel cell for high-salinity mustard tuber wastewater treatment. Bioresour. Technol. 2019, 272, 105–113. [Google Scholar] [CrossRef]
- Monzon, O.; Yang, Y.; Kim, J.; Heldenbrand, A.; Li, Q.; Alvarez, P.J. Microbial fuel cell fed by Barnett Shale produced water: Power production by hypersaline autochthonous bacteria and coupling to a desalination unit. Biochem. Eng. J. 2017, 117, 87–91. [Google Scholar] [CrossRef]
- Pugazhendi, A.; Al-Mutairi, A.E.; Jamal, M.T.; Jeyakumar, R.B.; Palanisamy, K. Treatment of seafood industrial wastewater coupled with electricity production using air cathode microbial fuel cell under saline condition. Int. J. Energy Res. 2020, 44, 12535–12545. [Google Scholar] [CrossRef]
- Ghorab, R.E.A.; Pugazhendi, A.; Jamal, M.T.; Jeyakumar, R.B.; Godon, J.J.; Mathew, D.K. Tannery wastewater treatment coupled with bioenergy production in upflow microbial fuel cell under saline condition. Environ. Res. 2022, 212, 113304. [Google Scholar] [CrossRef]
- Pugazhendi, A.; Jamal, M.T.; Al-Mur, B.A.; Jeyakumar, R.B. Bioaugmentation of electrogenic halophiles in the treatment of pharmaceutical industrial wastewater and energy production in microbial fuel cell under saline condition. Chemosphere 2022, 288, 132515. [Google Scholar] [CrossRef] [PubMed]
- Vijay, A.; Sonawane, J.M.; Chhabra, M. Denitrification process in microbial fuel cell: A comprehensive review. Bioresour. Technol. Rep. 2022, 17, 100991. [Google Scholar] [CrossRef]
- Vijay, A.; Chhabra, M.; Vincent, T. Microbial community modulates electrochemical performance and denitrification rate in a biocathodic autotrophic and heterotrophic denitrifying microbial fuel cell. Bioresour. Technol. 2019, 272, 217–225. [Google Scholar] [CrossRef]
- Khandelwal, A.; Vijay, A.; Dixit, A.; Chhabra, M. Microbial fuel cell powered by lipid extracted algae: A promising system for algal lipids and power generation. Bioresour. Technol. 2018, 247, 520–527. [Google Scholar] [CrossRef] [PubMed]
- Atlas, R.M. Handbook of Microbiological Media, 4th ed.; CRC Press: Boca Raton, FL, USA, 2010. [Google Scholar]
- Clauwaert, P.; Rabaey, K.; Aelterman, P.; De Schamphelaire, L.; Pham, T.H.; Boeckx, P.; Boon, N.; Verstraete, W. Biological Denitrification in Microbial Fuel Cells. Environ. Sci. Technol. 2007, 41, 3354–3360. [Google Scholar] [CrossRef]
- Vijay, A.; Vaishnava, M.; Chhabra, M. Microbial fuel cell assisted nitrate nitrogen removal using cow manure and soil. Environ. Sci. Pollut. Res. 2016, 23, 7744–7756. [Google Scholar] [CrossRef]
- APHA. Standard Methods for the Examination of Water & Wastewater, 21st ed.; American Public Health Association: Washington, DC, USA, 2005. [Google Scholar] [CrossRef]
- Vijay, A.; Khandelwal, A.; Chhabra, M.; Vincent, T. Microbial fuel cell for simultaneous removal of uranium (VI) and nitrate. Chem. Eng. J. 2020, 388, 124157. [Google Scholar] [CrossRef]
- Miller, L.G.; Oremland, R.S. Electricity generation by anaerobic bacteria and anoxic sediments from hypersaline soda lakes. Extremophiles 2008, 12, 837–848. [Google Scholar] [CrossRef]
- Grattieri, M.; Suvira, M.; Hasan, K.; Minteer, S.D. Halotolerant extremophile bacteria from the Great Salt Lake for recycling pollutants in microbial fuel cells. J. Power Sources 2017, 356, 310–318. [Google Scholar] [CrossRef]
- Miyahara, M.; Kouzuma, A.; Watanabe, K. Sodium chloride concentration determines exoelectrogens in anode biofilms occurring from mangrove-grown brackish sediment. Bioresour. Technol. 2016, 218, 674–679. [Google Scholar] [CrossRef]
- Zhang, L. Effects of electrolyte total dissolved solids (TDS) on performance and anodic microbes of microbial fuel cells. Afr. J. Biotechnol. 2011, 10, 16897–16908. [Google Scholar] [CrossRef]
- Jang, J.K.; Pham, T.H.; Chang, I.S.; Kang, K.H.; Moon, H.; Cho, K.S.; Kim, B.H. Construction and operation of a novel mediator- and membrane-less microbial fuel cell. Process. Biochem. 2004, 39, 1007–1012. [Google Scholar] [CrossRef]
- Katuri, K.P.; Scott, K.; Head, I.M.; Picioreanu, C.; Curtis, T.P. Microbial fuel cells meet with external resistance. Bioresour. Technol. 2011, 102, 2758–2766. [Google Scholar] [CrossRef] [PubMed]
- Christwardana, M.; Kwon, Y. Yeast and carbon nanotube based biocatalyst developed by synergetic effects of covalent bonding and hydrophobic interaction for performance enhancement of membraneless microbial fuel cell. Bioresour. Technol. 2017, 225, 175–182. [Google Scholar] [CrossRef] [PubMed]
- Rabaey, K.; Boon, N.; Siciliano, S.D.; Verhaege, M.; Verstraete, W. Biofuel Cells Select for Microbial Consortia That Self-Mediate Electron Transfer. Appl. Environ. Microbiol. 2004, 70, 5373–5382. [Google Scholar] [CrossRef] [PubMed]
- Aaron, D.; Tsouris, C.; Hamilton, C.Y.; Borole, A.P. Assessment of the Effects of Flow Rate and Ionic Strength on the Performance of an Air-Cathode Microbial Fuel Cell Using Electrochemical Impedance Spectroscopy. Energies 2010, 3, 592–606. [Google Scholar] [CrossRef]
- Guo, F.; Luo, H.; Shi, Z.; Wu, Y.; Liu, H. Substrate salinity: A critical factor regulating the performance of microbial fuel cells, a review. Sci. Total Environ. 2020, 763, 143021. [Google Scholar] [CrossRef] [PubMed]
- Gurav, R.; Bhatia, S.K.; Choi, T.-R.; Jung, H.-R.; Yang, S.-Y.; Song, H.-S.; Park, Y.-L.; Han, Y.-H.; Park, J.-Y.; Kim, Y.-G.; et al. Chitin biomass powered microbial fuel cell for electricity production using halophilic Bacillus circulans BBL03 isolated from sea salt harvesting area. Bioelectrochemistry 2019, 130, 107329. [Google Scholar] [CrossRef] [PubMed]
- Gurav, R.; Bhatia, S.K.; Choi, T.-R.; Kim, H.J.; Song, H.-S.; Park, S.-L.; Lee, S.-M.; Lee, H.-S.; Kim, S.-H.; Yoon, J.-J.; et al. Utilization of different lignocellulosic hydrolysates as carbon source for electricity generation using novel Shewanella marisflavi BBL25. J. Clean. Prod. 2020, 277, 124084. [Google Scholar] [CrossRef]
- Park, H.S.; Kim, B.H.; Kim, H.S.; Kim, H.J.; Kim, G.T.; Kim, M.; Chang, I.S.; Park, Y.K.; Chang, H.I. A Novel Electrochemically Active and Fe(III)-reducing Bacterium Phylogenetically Related to Clostridium butyricum Isolated from a Microbial Fuel Cell. Anaerobe 2001, 7, 297–306. [Google Scholar] [CrossRef]
- Kumar, S.; Malyan, S.K.; Basu, S.; Bishnoi, N.R. Syntrophic association and performance of Clostridium, Desulfovibrio, Aeromonas and Tetrathiobacter as anodic biocatalysts for bioelectricity generation in dual chamber microbial fuel cell. Environ. Sci. Pollut. Res. 2017, 24, 16019–16030. [Google Scholar] [CrossRef]
- Kim, H.J.; Park, H.S.; Hyun, M.S.; Chang, I.S.; Kim, M.; Kim, B.H. A mediator-less microbial fuel cell using a metal reducing bacterium, Shewanella putrefaciens. Enzym. Microb. Technol. 2002, 30, 145–152. [Google Scholar] [CrossRef]
- Wang, B.A.; Chen, X.H.; Xu, F.C.; Wang, W.; Xiong, X.J. Influence of Substrate and Salinity on Electricity Production by Deep-Sea Strain Shewanella sp DS1. Power Energy Eng. Conf. 2010, 2010, 259–262. [Google Scholar]
- Wei, D.; Zhang, X. Current Production by a Deep-Sea Strain Shewanella sp. DS1. Curr. Microbiol. 2007, 55, 497–500. [Google Scholar] [CrossRef]
- Yu, J.; Cho, S.; Kim, S.; Cho, H.; Lee, T. Comparison of Exoelectrogenic Bacteria Detected Using Two Different Methods: U-tube Microbial Fuel Cell and Plating Method. Microbes Environ. 2011, 27, 49–53. [Google Scholar] [CrossRef]
- Smith, L.D.S. Clostridium oceanicum, sp. n., a sporeforming anaerobe isolated from marine sediments. J. Bacteriol. 1970, 103, 811–813. [Google Scholar] [CrossRef] [PubMed]
- Ding, A.; Zhao, D.; Ding, F.; Du, S.; Lu, H.; Zhang, M.; Zheng, P. Effect of inocula on performance of bio-cathode denitrification and its microbial mechanism. Chem. Eng. J. 2018, 343, 399–407. [Google Scholar] [CrossRef]


Disclaimer/Publisher’s Note: The statements, opinions and data contained in all publications are solely those of the individual author(s) and contributor(s) and not of MDPI and/or the editor(s). MDPI and/or the editor(s) disclaim responsibility for any injury to people or property resulting from any ideas, methods, instructions or products referred to in the content. |
© 2023 by the authors. Licensee MDPI, Basel, Switzerland. This article is an open access article distributed under the terms and conditions of the Creative Commons Attribution (CC BY) license (https://creativecommons.org/licenses/by/4.0/).