Article

Common Reed and Maize Silage Co-Digestion as a Pathway towards Sustainable Biogas Production

by
Robert Czubaszek
1,
Agnieszka Wysocka-Czubaszek
1,*,
Wendelin Wichtmann
2,
Grzegorz Zając
3 and
Piotr Banaszuk
1
1
Faculty of Civil Engineering and Environmental Sciences, Bialystok University of Technology, Wiejska 45A Str., 15-351 Bialystok, Poland
2
Partners in the Greifswald Mire Centre, Succow Foundation and Greifswald University, Ellernholzstraße 1, 17489 Greifswald, Germany
3
Faculty of Production Engineering, University of Life Sciences in Lublin, Głęboka 28 Str., 20-950 Lublin, Poland
*
Author to whom correspondence should be addressed.
Energies 2023, 16(2), 695; https://doi.org/10.3390/en16020695
Submission received: 29 November 2022 / Revised: 22 December 2022 / Accepted: 28 December 2022 / Published: 6 January 2023

Abstract

:
The key factor in sustainable biogas production is a feedstock whose production has no adverse impact on the environment. Since maize cultivation harms the environment, biogas plant operators seek a more sustainable feedstock. Common reed is an invasive species mown as part of wetland conservation measures, or it can be harvested from paludiculture. This study aimed to investigate wet co-digestion of maize silage with 10%, 30%, and 50% content of common reed silage using the biochemical methane potential (BMP) test. In addition, the potential energy generated and avoided greenhouse gas (GHG) emissions were calculated. The substitution of maize silage with 10%, 30%, and 50% content of reed silage reduced the methane (CH4) yield by 13%, 28%, and 35%, respectively. A disadvantage of reed silage addition was increased ammonia (NH3) and hydrogen sulfide (H2S) concentrations in biogas. Although substituting maize silage with reed silage decreases the CH4 yield, the co-digestion of maize and reed biomass from conservation or paludiculture may positively affect environmental aspects of energy generation. The substitution of maize with reed in biogas plants decreases the area used for maize cultivation and reduces GHG emissions.

1. Introduction

Biogas has a strong potential for transforming the global energy system into a more sustainable one. In the last 20 years, biogas production has increased globally from ~11 billion m3 to 62.3 billion m3, with an annual growth rate of 9%. Europe is the leader in biogas production, with 30.6 billion m3 of biogas generated in 2019 [1]. In Europe, biogas is produced mainly from energy crops, crop residues, sequential crops (8 Mtoe), and animal manure (6 Mtoe). Two other main groups of feedstocks are municipal solid waste (3 Mtoe) and municipal wastewater (1 Mtoe) [2]. Feedstock is a critical factor in the productivity of biogas plants. Sustainable biogas production has been shifting from using energy crops to waste and agricultural residues. The high prices of energy crops force biogas plant operators to seek cheap and more sustainable waste that could, at least partially, replace maize silage (MS) without lowering the profitability of biogas production. At the same time, providers of green energies are currently intensively searching for biogas plants that could change their substrates from feeding maize to biomass sourced from paludiculture, seeking to deliver methane (CH4) into the grid in order to be able to sell „paludi-gas” to end consumers [3]. However, as the German example shows, MS still prevails as a feedstock in agricultural biogas plants, constituting almost 70% of all energy crops [4].
Globally, maize is the leading staple cereal, with its annual production exceeding 1 billion metric tons [5], with the United States, China, Brazil, and the European Union as the leading producers [6]. The global maize area for dry grain increased from 105 million ha in 1961 to over 200 million ha in 2020, while the green maize area expanded from 760 thousand ha in 1961 to over 1 million ha in 2020. The intensification of crop production also increased maize yield in the same period [6]. Maize is an important food crop, especially in sub-Saharan Africa, Asia, as well as several countries in Latin America, where it contributes over 20% of total food calories [7]. It is also a versatile multi-purpose crop used not only for human food production but also as a livestock feed crop [8] and, recently, for the production of biofuels, chemical compounds, pseudo-plastics, and other materials [5]. Maize grain is used as one of the main sources of bioethanol, an alcohol made from the fermentation of carbohydrates present in starch crops. Globally, the top ethanol producers are the United States and Brazil. In the US, maize is the primary feedstock, while in Brazil, biofuel is produced from sugarcane [9]. The production of ethanol from maize generates significant quantities of by-products such as distillers’ dried grains with solubles, corn gluten feed, and corn gluten meal, which are used in livestock feed [10]. Maize is also the leading energy crop used as a feedstock for biogas production. The increase in the biogas sector resulted in the expansion of maize monocultures in large areas. In Germany, the share of maize in the total arable land increased from 5% in 2005 to 12% in 2013, strengthening the competition for land use in some regions and negatively impacting the landscape [11,12,13]. Another disadvantage of the production of biogas from energy crops, especially MS, is the competition with food production.
High-yield agricultural production is a consequence of the greater use of synthetic agrochemicals such as fertilizers and pesticides, irrigation, and mechanization in some regions. These technological advancements have many negative impacts on the environment. Life cycle assessment (LCA) of maize production revealed that fertilization has the most detrimental impact on the ecosystem, followed by harvest [14]. Large-area maize monocultures, cultivated without proper crop rotation and phytomelioration treatments, contribute to increased wind and water erosion. Heavy equipment is one of the main reasons for severe soil compaction, while intensive fertilization and the use of plant protection products result in the progressive acidification of soils and the contamination of ground and surface waters. The environmental risk associated with cultivation increases on light and permeable soils [15]. The increasing area of maize cultivated both for food and energy has a significant negative impact on the landscape, leading to its “maizification” [16] and decreasing biodiversity, resulting in reduced natural and aesthetic values of rural areas [17,18].
Maize cultivation harms the environment due to greenhouse gas (GHG) emissions from cultivation, land use change, the loss of biodiversity, the risk of erosion, nitrous oxide (N2O) emissions, eutrophication, and, in some regions, a high irrigation demand [19,20,21,22]. Particularly alarming is the cultivation of maize for biogas production, frequently practiced on drained peatlands or organic soils. In such cases, due to drainage and soil cultivation, the amounts of GHG released are many times higher than those ultimately mitigated by biogas production. If site-specific emissions of biomass fuels produced on peatlands are considered, the total emissions exceed those of fossil fuels by a multiple [23]. Furthermore, the increasing area of maize cultivated for energy purposes lowers the public acceptance of biogas production [11]. Therefore, the anaerobic digestion (AD) of waste and by-products is now considered a sustainable pathway for biogas production [13,24,25].
Both economic and environmental impacts force biogas production to turn towards the pathway of transition to more sustainable feedstocks. Using a single substrate may create an imbalance in the process; however, such a problem does not occur in the case of mono-digestion of feedstocks such as maize silage. Since maize should be utilized for food production, its substitution in biogas production is challenging. Numerous studies comparing the mono- and co-digestion of various feedstocks revealed an increase in CH4 yield through co-digestion [26,27,28,29,30,31,32], which increased biogas yield due to the optimum C:N ratio, balanced pH, and reduced hydraulic retention time [33]. The co-digestion of poultry manure with alkali-treated corn stover increases the production of biogas by ensuring nutrient balance [34]. Adding grass clippings at a 10% rate to food waste enhances the buffering capacity in AD [35]. According to a study by Velásquez Piñas et al. [36], the optimum proportions of MS and grass silage for co-digestion systems with cattle manure are in the ranges of 22–65% and 18–54%, respectively. The substitution of MS with corn stover in co-digestion with pretreated poultry manure has no negative impact on the CH4 yield [37]. Kalamars and Kotsopoulos [38] studied MS substitution with agricultural materials such as sorghum silage, cardoon silage, bedding straw from cattle farms, and naturally or mechanically dried, thermally or thermo-chemically pretreated milk thistle. These substitutes were co-digested with cattle manure. The results revealed that MS could be successfully substituted with most of the proposed materials. The best results were obtained for cardoon silage and thermo-chemically pretreated, naturally sun-dried milk thistle. However, the co-digestion of maize residues with poultry blood revealed inhibitory problems in semi-continuous operation due to the high content of volatile fatty acids (VFA) when the reactor operated at a low organic load rate [39], while the substitution of MS with 20% of either ultrasonicated or untreated microalgae led to significantly lower biogas yields, even though the decreased viscosity had a beneficial effect on the process and the economy of a biogas plant [40].
According to Agostini et al. [20,41], replacing MS with sorghum as a co-substrate in biogas plants based on manure and 30% of energy crops provides GHG savings and generates economic profits. In contrast, AD emissions of maize or sorghum alone are comparable to those of the Italian electricity mix and generate financial losses. The environmental assessment of wild plant mixtures as AD feedstock and comparisons of their performance with MS revealed that MS is a more profitable feedstock for biogas production. Additionally, wild plant mixtures require a substantially larger area, which can lead to additional GHG emissions. However, increased carbon sequestration in such a system, in addition to sustainable management of marginal land, can be the advantage of wild plant mixtures [42]. Studies by De Vries et al. [43] comparing the mono- and co-digestion of swine manure with MS, beet tails, wheat yeast concentrate, and grass residues from verges revealed that the co-digestion of MS with grass residues appeared to be the most environmentally sustainable option.
Another source of feedstock is biomass from conservation measures on wetlands and paludiculture such as Phragmites australis, Typha spp., and sedges [44]. Biomass harvested from these habitats varies depending on the species composition, habitat fertility, and harvest time. Wetland biomass yield ranges from3 tDM ha−1 (Phragmitetum australis, mossy variants of Caricetum elatae) to 16 tDM ha−1 (Phragmitetum australis, Phalaridetum arundinacea) [45,46,47,48,49,50,51]. Biomass harvested from paludiculture ranges from 8 tDM ha−1 to 20 tDM ha−1 [52]. The advantage of biomass from paludiculture is its huge, almost infinite, potential. Ultimately, all currently drained peatlands [53,54] must be rewetted to reduce the GHG emissions from the land use sector and to comply with the Paris Climate Agreement of 2015 [55]. Some of them, after rewetting, will be given to natural succession, while others may be sustainably used under wet conditions (paludiculture). Either material (production of insulation materials, construction panels, substrates) or cascade use of biomass from paludiculture is preferable to energy recovery. Although it can be assumed that, due to the large number of degraded peatlands, which have to be rewetted, at least in Central Europe [56], the area potential for the production of biomass for biogas or for maize substitution should be sufficient [57].
Common reed is a highly competitive invasive plant capable of rapid growth and spread, often threatening the biodiversity of natural and rewetted wetlands. Reed forms dense monospecific stands and reduces flood retention by decreasing microtopography [58,59]. Reed ecosystems may be characterized by remarkably high biomass, depending on the local conditions and genetic differences [46]. In natural wetlands, invasive reed stands are managed mainly by mowing, generating large amounts of biomass waste that is difficult to utilize [60]. At present, there are limited management options for reed biomass harvested from natural stands, as part of conservation measures, or from paludiculture. Common reed is mainly used for raw material extraction or energy generation, usually through direct combustion [50,61]. However, reed biomass is characterized by a moisture content that is too high for direct combustion; hence, it needs to be dried before use, generating demand for external energy. Therefore, biogas production seems to be an interesting option for energy generation from common reed; however, the CH4 potential has to be considered since “green” energy should be sustainable, feasible, and profitable.
The existing literature data reveals that wetland biomass’s specific methane yield (SMY) is relatively low and depends on the species and the harvest time [62,63]. Most studies show that the CH4 potential of various wetland species or communities ranges from 102 NL CH4 kgVS−1 to 275 NL CH4 kgVS−1 [49,63,64,65]. Müller et al. [66] investigated the AD of Juncus effuses, which produced, on average, 399.02 NL kgVS−1 of biogas with 60.7% of CH4. This yield is only 59% of the biogas potential of MS. Results of SMY determinations for common reed are contradictory. According to Roj-Rojewski et al. [63], depending on the harvest time, SMY ranged from 102 NL kgVS−1 to 148 NL kgVS−1. Similar findings were reported by Baute et al. [67], who obtained a CH4 yield of 172.4 NL kgVS−1 and 107.6 NL kgVS−1 for common reeds harvested in July and October, respectively. Contrary to these findings, Ohlsson et al. [68] showed that SMY for common reed from the Baltic Sea area was 400 NL kgVS−1. Literature data concerning studies focused on the co-digestion of wetland plants with other feedstocks is limited. Hartung et al. [52] investigated co-digestion of MS with 10%, 20%, 30%, and 40% contents of Typha latifolia or Phalaris arundinacea based on volatile solids. The results showed that an addition of as little as 10% of Typha latifolia reduced biogas production, whereas an addition of Phalaris arundinacea of up to 30% did not influence biogas yield. The anaerobic co-digestion of common reed with feces and kitchen waste, with an addition of zeolite, revealed that a 10% addition of clinoptilolite inhibited the acidification of the digestion liquid and increased the amount of VFA, resulting in biogas production of 308 L kgVS−1 with an increased CH4 content of up to 65.30% [69]. The co-digestion of the seaweed Laminaria digitata with common reed gave a similar CH4 potential of ~170 L kgVS−1 for mono-digestion, while co-digestion was characterized by process instability [68].
The aim of this study was to evaluate the suitability of using common reed silage for co-digestion with maize silage in biogas production. The biochemical methane potential (BMP) test was performed at a temperature of 38 °C on maize silage (100%), reed silage (100%), and maize silage with 10%, 30%, and 50% additions of reed silage on a fresh weight basis. Based on the obtained results, the amount of energy generated in a biogas plant using mono-digestion of maize silage or reed silage and co-digestion of combinations of reed and maize silages were calculated as well as the avoided GHG emissions.

2. Materials and Methods

2.1. Substrates and Inoculum

The studied common reed (Phragmites australis (Cav.) Trin. ex Steud.) was harvested from a natural wetland in late autumn of 2020. The plant material was cut into 2–4 cm pieces and ensiled without additives. MS was collected from the original feedstock silo in a biogas plant. Digestate from an agricultural biogas plant that treats MS with 10–20% content of food and agricultural waste in mesophilic conditions was used as the inoculum. After collecting, the inoculum was degassed at a temperature of 38 °C.

2.2. Experimental Setup

The SMY was measured using the batch test. The test involved MS, reed silage (RS), and the mixtures of MS with 10%, 30%, and 50% contents of RS on a fresh weight basis. The BMP test was conducted using eudiometers. Bottles with a total volume of 1 L and a working volume of 300 mL were incubated in a water bath at 38 ± 1 °C. These were filled with 200 g of inoculum, and substrates were added to achieve an inoculum-to-substrate ratio of 2:1 based on volatile solids (VS). Distilled water was added to obtain the reactors’ total solids (TS) of 5%. Bottles containing 200 mL of inoculum and water were used as a control. They were flushed with nitrogen for 2 min. to remove oxygen. The CH4 yield of each substrate was assessed in triplicate using three eudiometers. The volume of the produced biogas was measured by confining liquid displacement, while the portable biogas analyzer, the DP-28BIO (Nanosens, Wysogotowo, Poland), was used to determine the chemical composition of biogas. The batch test was conducted until the daily CH4 production was less than 1% of the total cumulative volume of CH4 observed over three consecutive days. The total cumulative CH4 yield was calculated at the end of the BMP test. The modified Gompertz model [70] was used to determine the kinetics of CH4 production:
G ( t ) = G 0   × e x p { exp [ R m a x × e G 0 ( λ t ) + 1 ] }
where:
G(t)—cumulative methane production at a specific time t (mL)
G0—methane production potential (mL)
Rmax—maximum daily methane production rate (mL day−1)
λ—duration of lag phase (minimum time to produce methane) (days)
t—cumulative time for methane production (days)
e—mathematical constant (2.71828)
All the gas volumes are reported for standard conditions (0 °C and 1.013 bar) per kg of vs. added (NL CH4 kgVS−1). The times (given in days) when 50% (T50) and 95% (T95) of the possible CH4 were reached were determined based on plotted curves.

2.3. Chemical Analyses

Before starting the batch test, total solids (TS), volatile solids (VS), total Kjeldahl nitrogen (TKN) content, total phosphorus (TP) content, potassium (K) content, and total organic carbon (TOC) content in the inoculum, MS, and RS were analyzed. TS was determined by drying the sample at 105 °C until the constant weight could be measured. In accordance with standard methods, vs. content was determined after dried material was incinerated at 550 °C for 5 h in a muffle furnace [71]. TKN was determined for fresh samples in the Vapodest 50 s analyzer (Gerhardt, Königswinter, Germany) using the Kjeldahl method. The oven-dried samples were ground and used for further analyses. After nitric acid/hydrogen peroxide microwave digestion in the ETHOS One (Milestone s.r.l., Milan, Italy), the content of P was determined using ammonium metavanadate method with the UV-1800 spectrophotometer (Shimadzu, Kyoto, Japan) and the content of K was analyzed using flame photometry (BWB Technology, Newbury, UK). TOC content was determined in the TOC-L analyzer with the SSM-5000A Solid Sample Combustion Unit (Shimadzu, Kyoto, Japan). The analyses were performed in triplicate, and the results were given on a dry-weight basis.

2.4. Calculations and Statistical Analyses

The SMY values determined during laboratory tests were used to calculate the potential energy generated from biogas in a biogas plant fed with MS and RS. The biogas was converted to electricity and heat in the combined heat and power (CHP) unit. The CHP unit’s electrical and thermal conversion efficiency was assumed to be 38% and 43%, respectively. The thermal energy consumption in the biogas plant was assumed to be 30%, and the electric power use was considered to be 9% of the produced energy.
Energy production per 1 hectare for maize and reed was calculated based on the BMP results and crop yields. Maize yields were taken from [72], and reed yield was measured during biomass harvest and was equal to 8.59 tDM ha−1.
The amount of energy obtained from the reed as a result of its direct combustion was calculated based on its net calorific value (NCV) expressed in GJ tDM−1 and the measured yield. The calorific value was measured using the LECO AC600 (St. Joseph, MI, USA). To calculate the calorific value at operating moisture (optimal for biomass combustion), the following formula was used [73]:
Q n e t ,   O M   = Q n e t ,   D M   × 100 O M 100 0.02443 × O M
where:
Qnet, OM—the net calorific value as received (at operating moisture) (MJ kg−1)
Qnet, DM—the net calorific value in dry matter (MJ kg−1)
OM—the operating moisture content (w—%, wet basis)
0.02443—the correction factor of the enthalpy of vaporization for water at 25 °C (MJ kg−1 per 1% of moisture)
The reduction of CO2 emissions was calculated based on the electricity and heat production in the biogas plant fed with MS and RS. The emission factors for coal were adopted from [74]. In this study, the emission factor for maize cultivation, i.e., 3.38 t CO2 ha−1, was taken from Hryniewicz and Grzybek [75], who determined CO2 emissions from maize cultivation for Polish conditions.
The results of the chemical analyses of the substrate and of the BMP test results were processed using Statistica 13.3 (TIBCO Software Inc., Palo Alto, CA, USA). One-way variance analysis (ANOVA; single factor) was used to find the significant differences among the chemical compositions of inoculum, MS, and RS, as well as SMY and the lag time of five tested mono- and co-digested substrates. When a significant F-test was obtained, multiple mean comparisons were carried out with Tukey’s Honest Significant Difference (HSD) test. The normality was checked with the Shapiro–Wilk test, and the homogeneity of variance was evaluated with the Levene test. When the data failed the Levene test, the Welch test and Tukey’s HSD test were used to assess the significant differences among the values of each parameter. A significance level of 95% was used throughout all the statistical analyses

3. Results

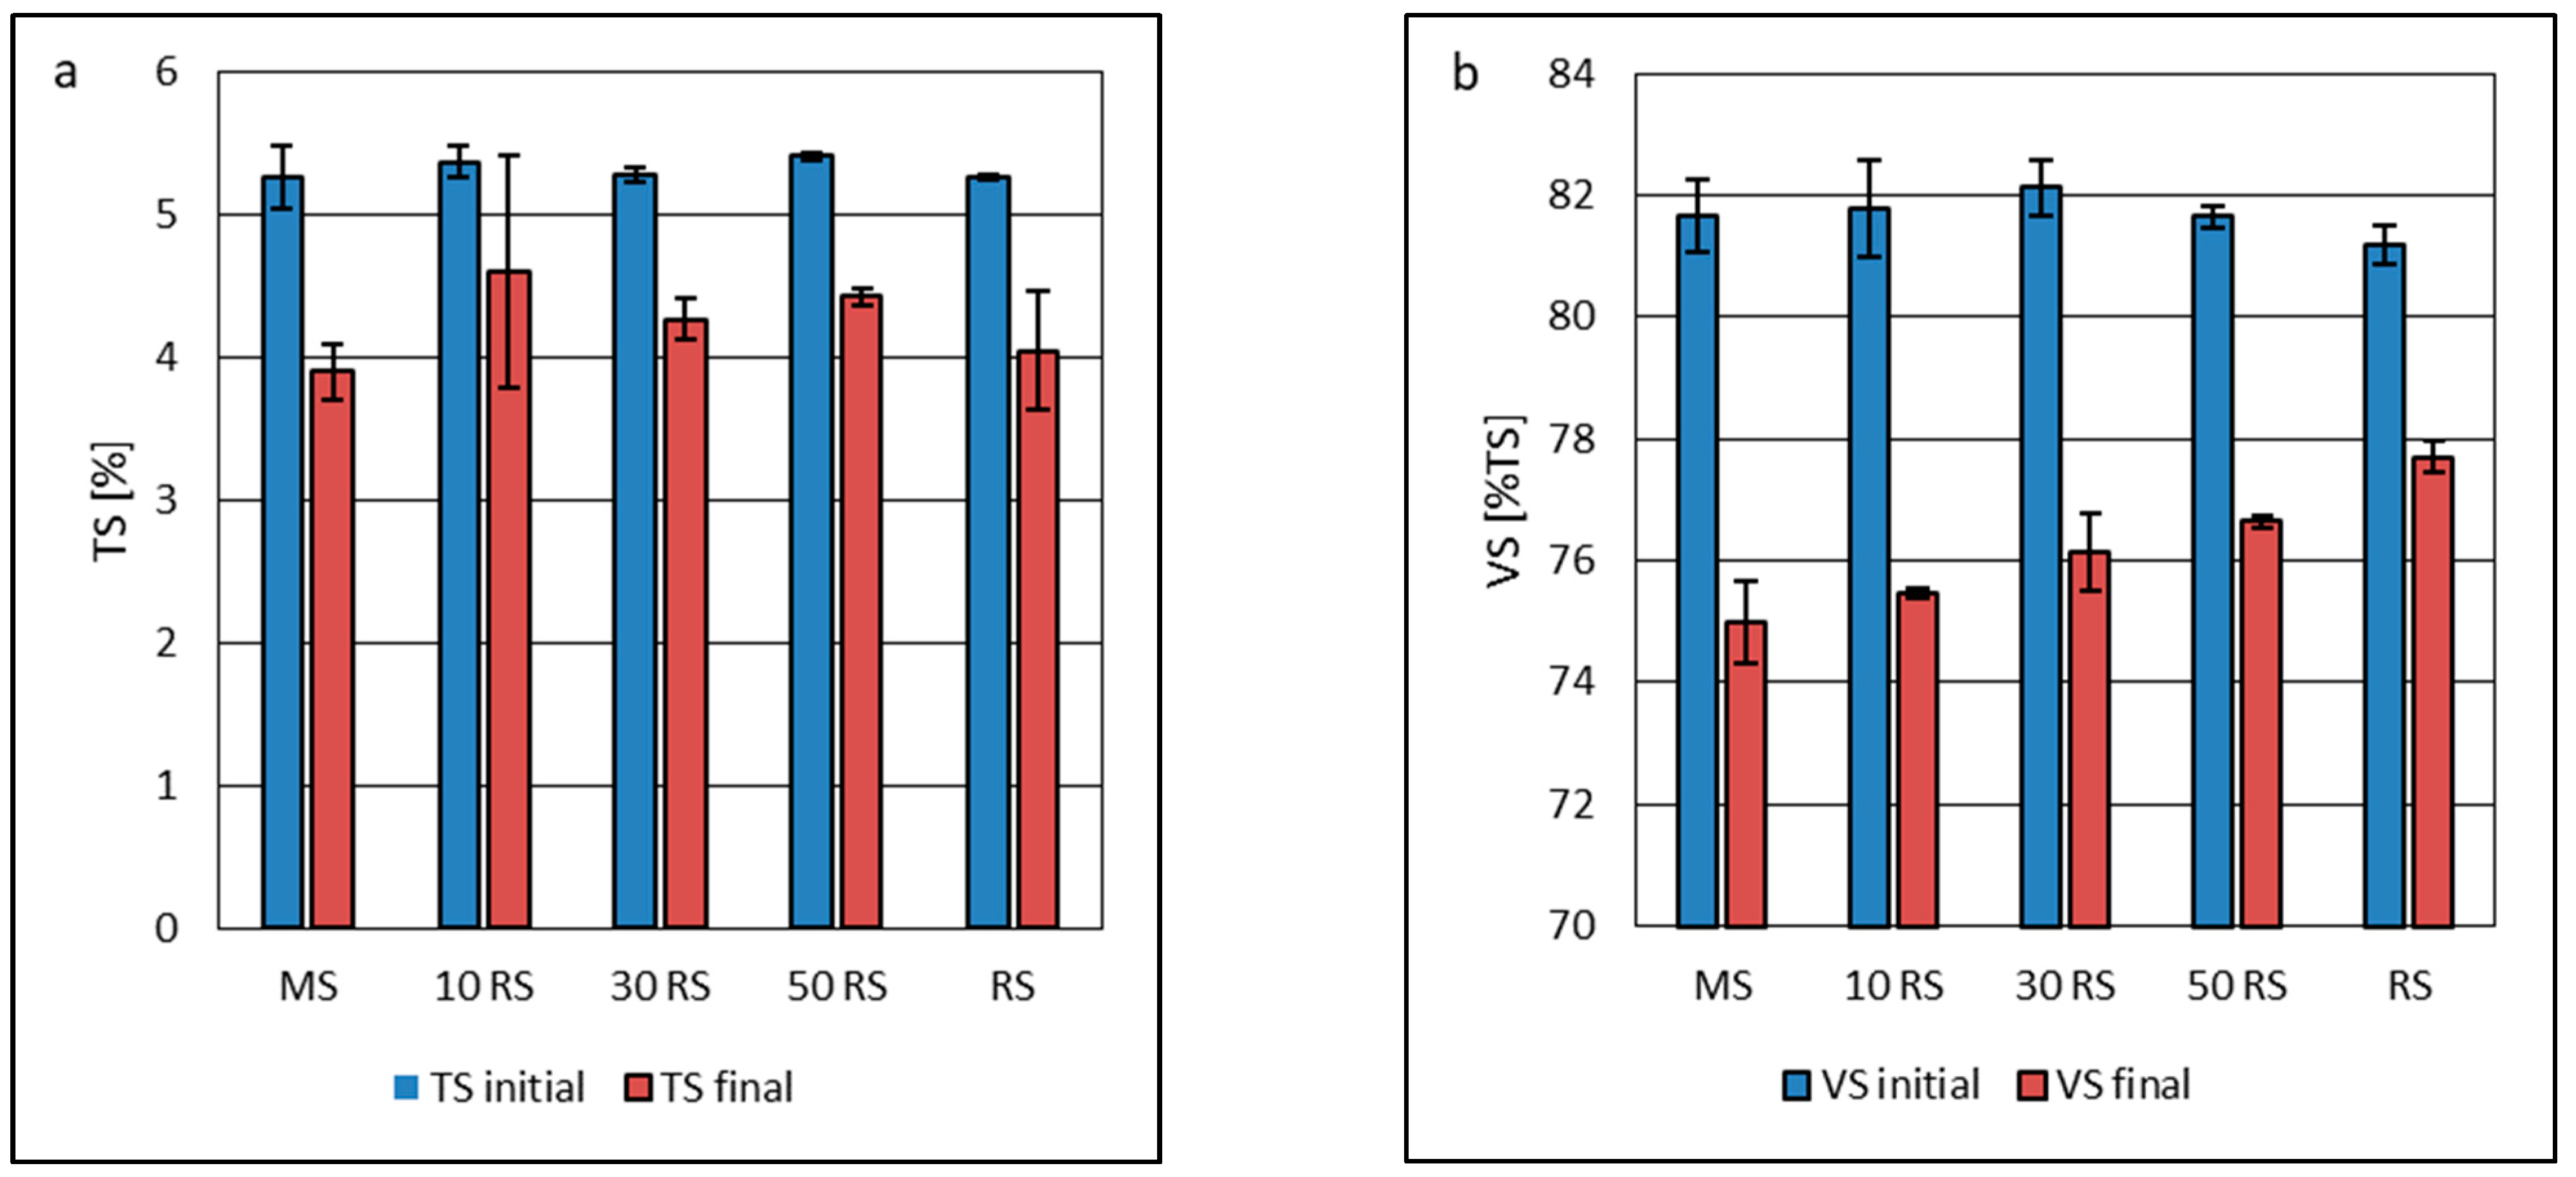
3.1. Feedstock and Inoculum Characteristics

RS had significantly (p < 0.05) higher TS compared to MS, while the difference in vs. was less pronounced even though it was significant (p < 0.05). Both silages were characterized by similar TKN values. Other chemical parameters differed significantly (p < 0.05) in both silages and were higher in the case of MS. The C:N ratio in both silages was similar (Table 1). The inoculum was characterized by significantly (p < 0.05) lower TS and vs. values and much higher TKN, TP, and K contents.
The initial TS was similar in all the reactors since the experiment assumption was to start the BMP test with a TS content of ~5%. The lowest final TS was observed in the reactor containing MS (Figure 1). This indicates that MS has the best digestibility; however, the final TS content in the digester containing RS was slightly higher. The overall differences between the initial and final TS values were around 1%. More pronounced differences were observed in the case of vs. content. The initial vs. content in all the reactors was similar in accordance with the experimental setup. MS was characterized by the lowest final VS, while the highest vs. content was found in the reactor containing RS. The increased amounts of RS in co-digested mixtures slightly raised the contents of the final VS.

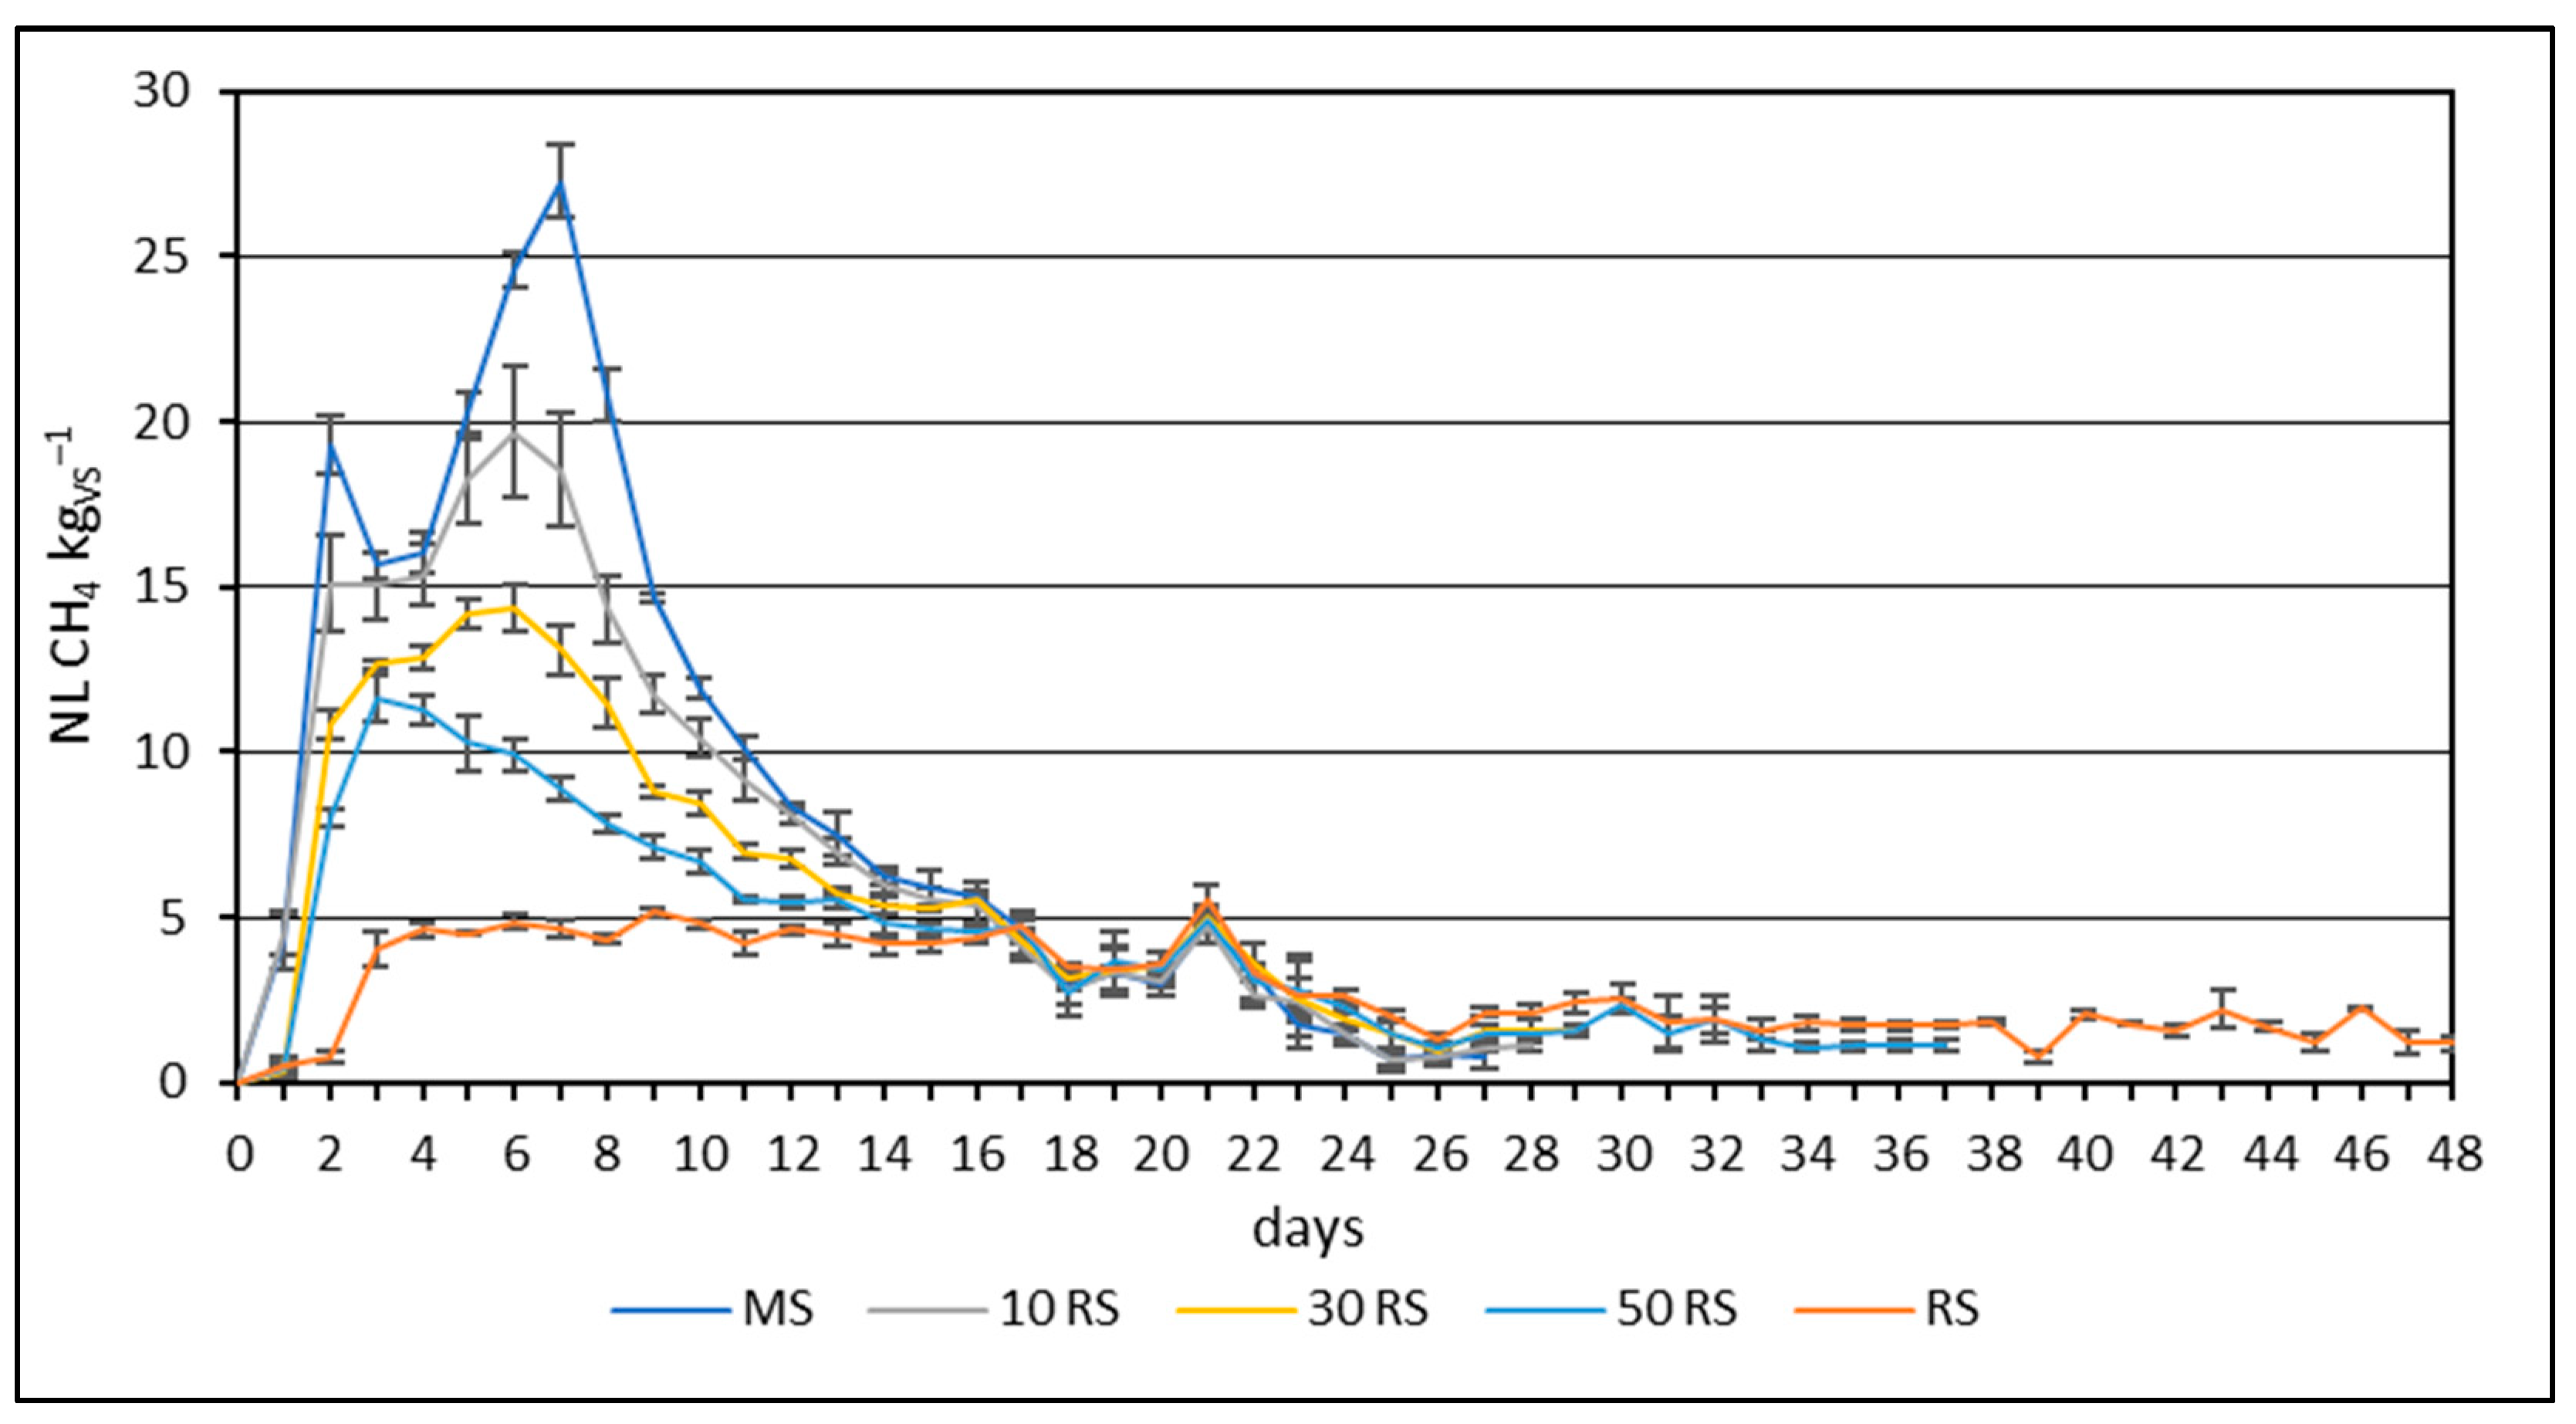
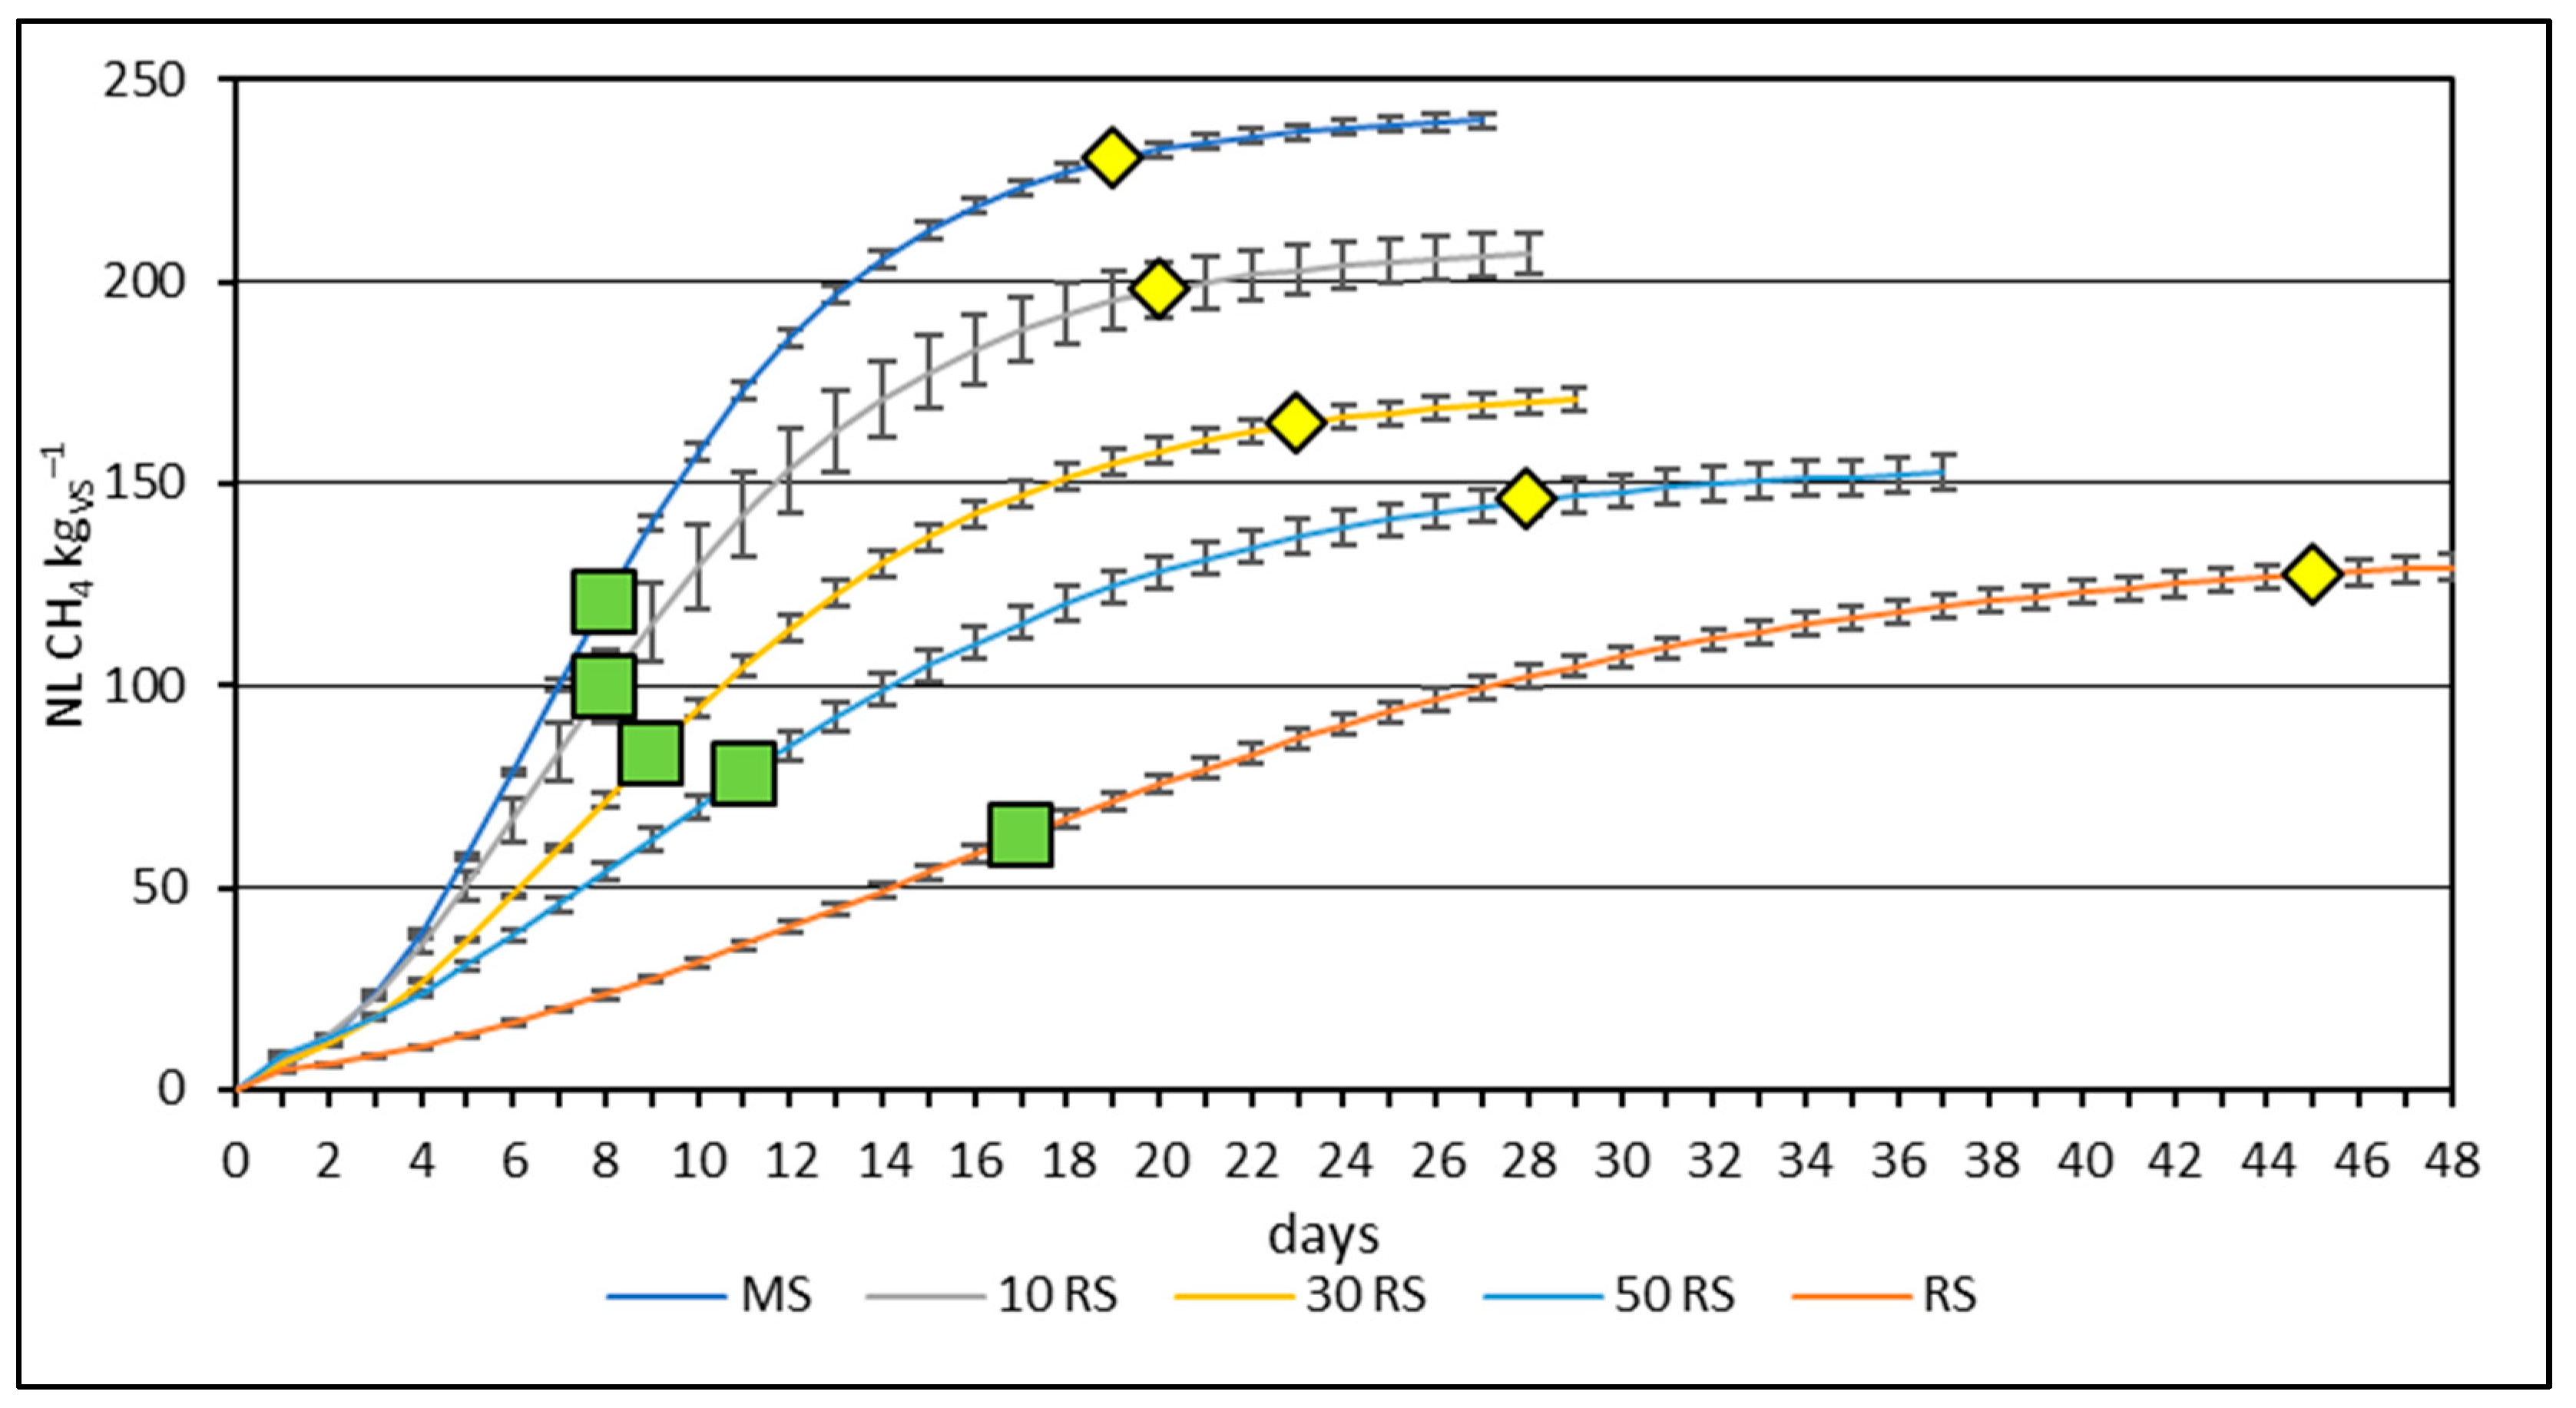
3.2. Methane Yield from Mono- and Co-Digestion of Maize and Reed Silages

The biodegradability of MS was much faster than that of RS. Almost complete biodegradation of MS took only 30 days, while CH4 production from RS mono-digestion stopped after 48 days. Partial substitution of MS with RS influenced CH4 yield from co-digestion. The addition of RS in the amounts of 10%, 30%, and 50% on a fresh matter basis decreased the CH4 yield by 13%, 28%, and 35%, respectively (Table 2). The CH4 yield from RS mono-digestion was lower by 44% compared to the CH4 yield from MS.
RS was characterized by the lowest CH4 production rate with a different distribution compared to MS and all three combinations. The characteristics of daily CH4 production were similar for MS mono-digestion and co-digestion of MS with RS in all combinations (Figure 2). The daily CH4 yield was high for the first 10 days and then decreased significantly and stabilized at a low value. For MS and 10 RS, two peaks of CH4 production were detected on days 2 and 7, while for 30 RS and 50 RS, only one peak was observed. For 30 RS, the highest daily CH4 production occurred on day 6, which was similar to the second peak in MS mono-digestion and in the 10 RS combination. For 50 RS, the most significant increase in daily CH4 production was observed on day 3, which is similar to the first peak detected for MS and the 10 RS combination. For RS, a sharp increase of CH4 yield was seen on day 3 followed by a plateau and a slight decrease to very low values after 18 days of the experiment. The increasing addition of RS in all combinations lowered the daily CH4 production, which was very pronounced in days of maximum daily production.
As expected, the lower SMY of RS reduced the cumulative CH4 production with increasing substitution of MS with RS. For 10%, 30%, and 50% of RS contents in co-digested feedstock, the cumulative CH4 yield decreased by 28%, 47%, and 57%, respectively. The addition of RS influenced the CH4 yield and affected the lag phase. In contrast, the RS lag phase lasted more than 2 days and was significantly (p < 0.05) longer than the lag time for MS, substituting the latter with an increasing share of RS shortened this period, and for 50 RS, biogas production started almost immediately.
The addition of RS, however, only partially affected the indicators that indicate the time after which the analyzed combinations and mono-digested feedstocks produced 50% (T50) and 95% (T95) of potential CH4. T50 did not differ between all the combinations and MS and ranged from 8 days for MS and 10 RS to 11 days for 50 RS (Figure 3). The addition of RS had a more pronounced effect on T95, which was similar for MS and 10 RS and equaled 17 days and 19 days, respectively. The higher RS share resulted in T95 equal to 23 days for 30 RS and 29 days for 50 RS. As expected, the T50 and T95 values for RS were the longest and equaled 17 days and 46 days, respectively. In this case, a low daily CH4 production was significantly extended, mainly the time needed to reach 95% of the potential CH4 yield.

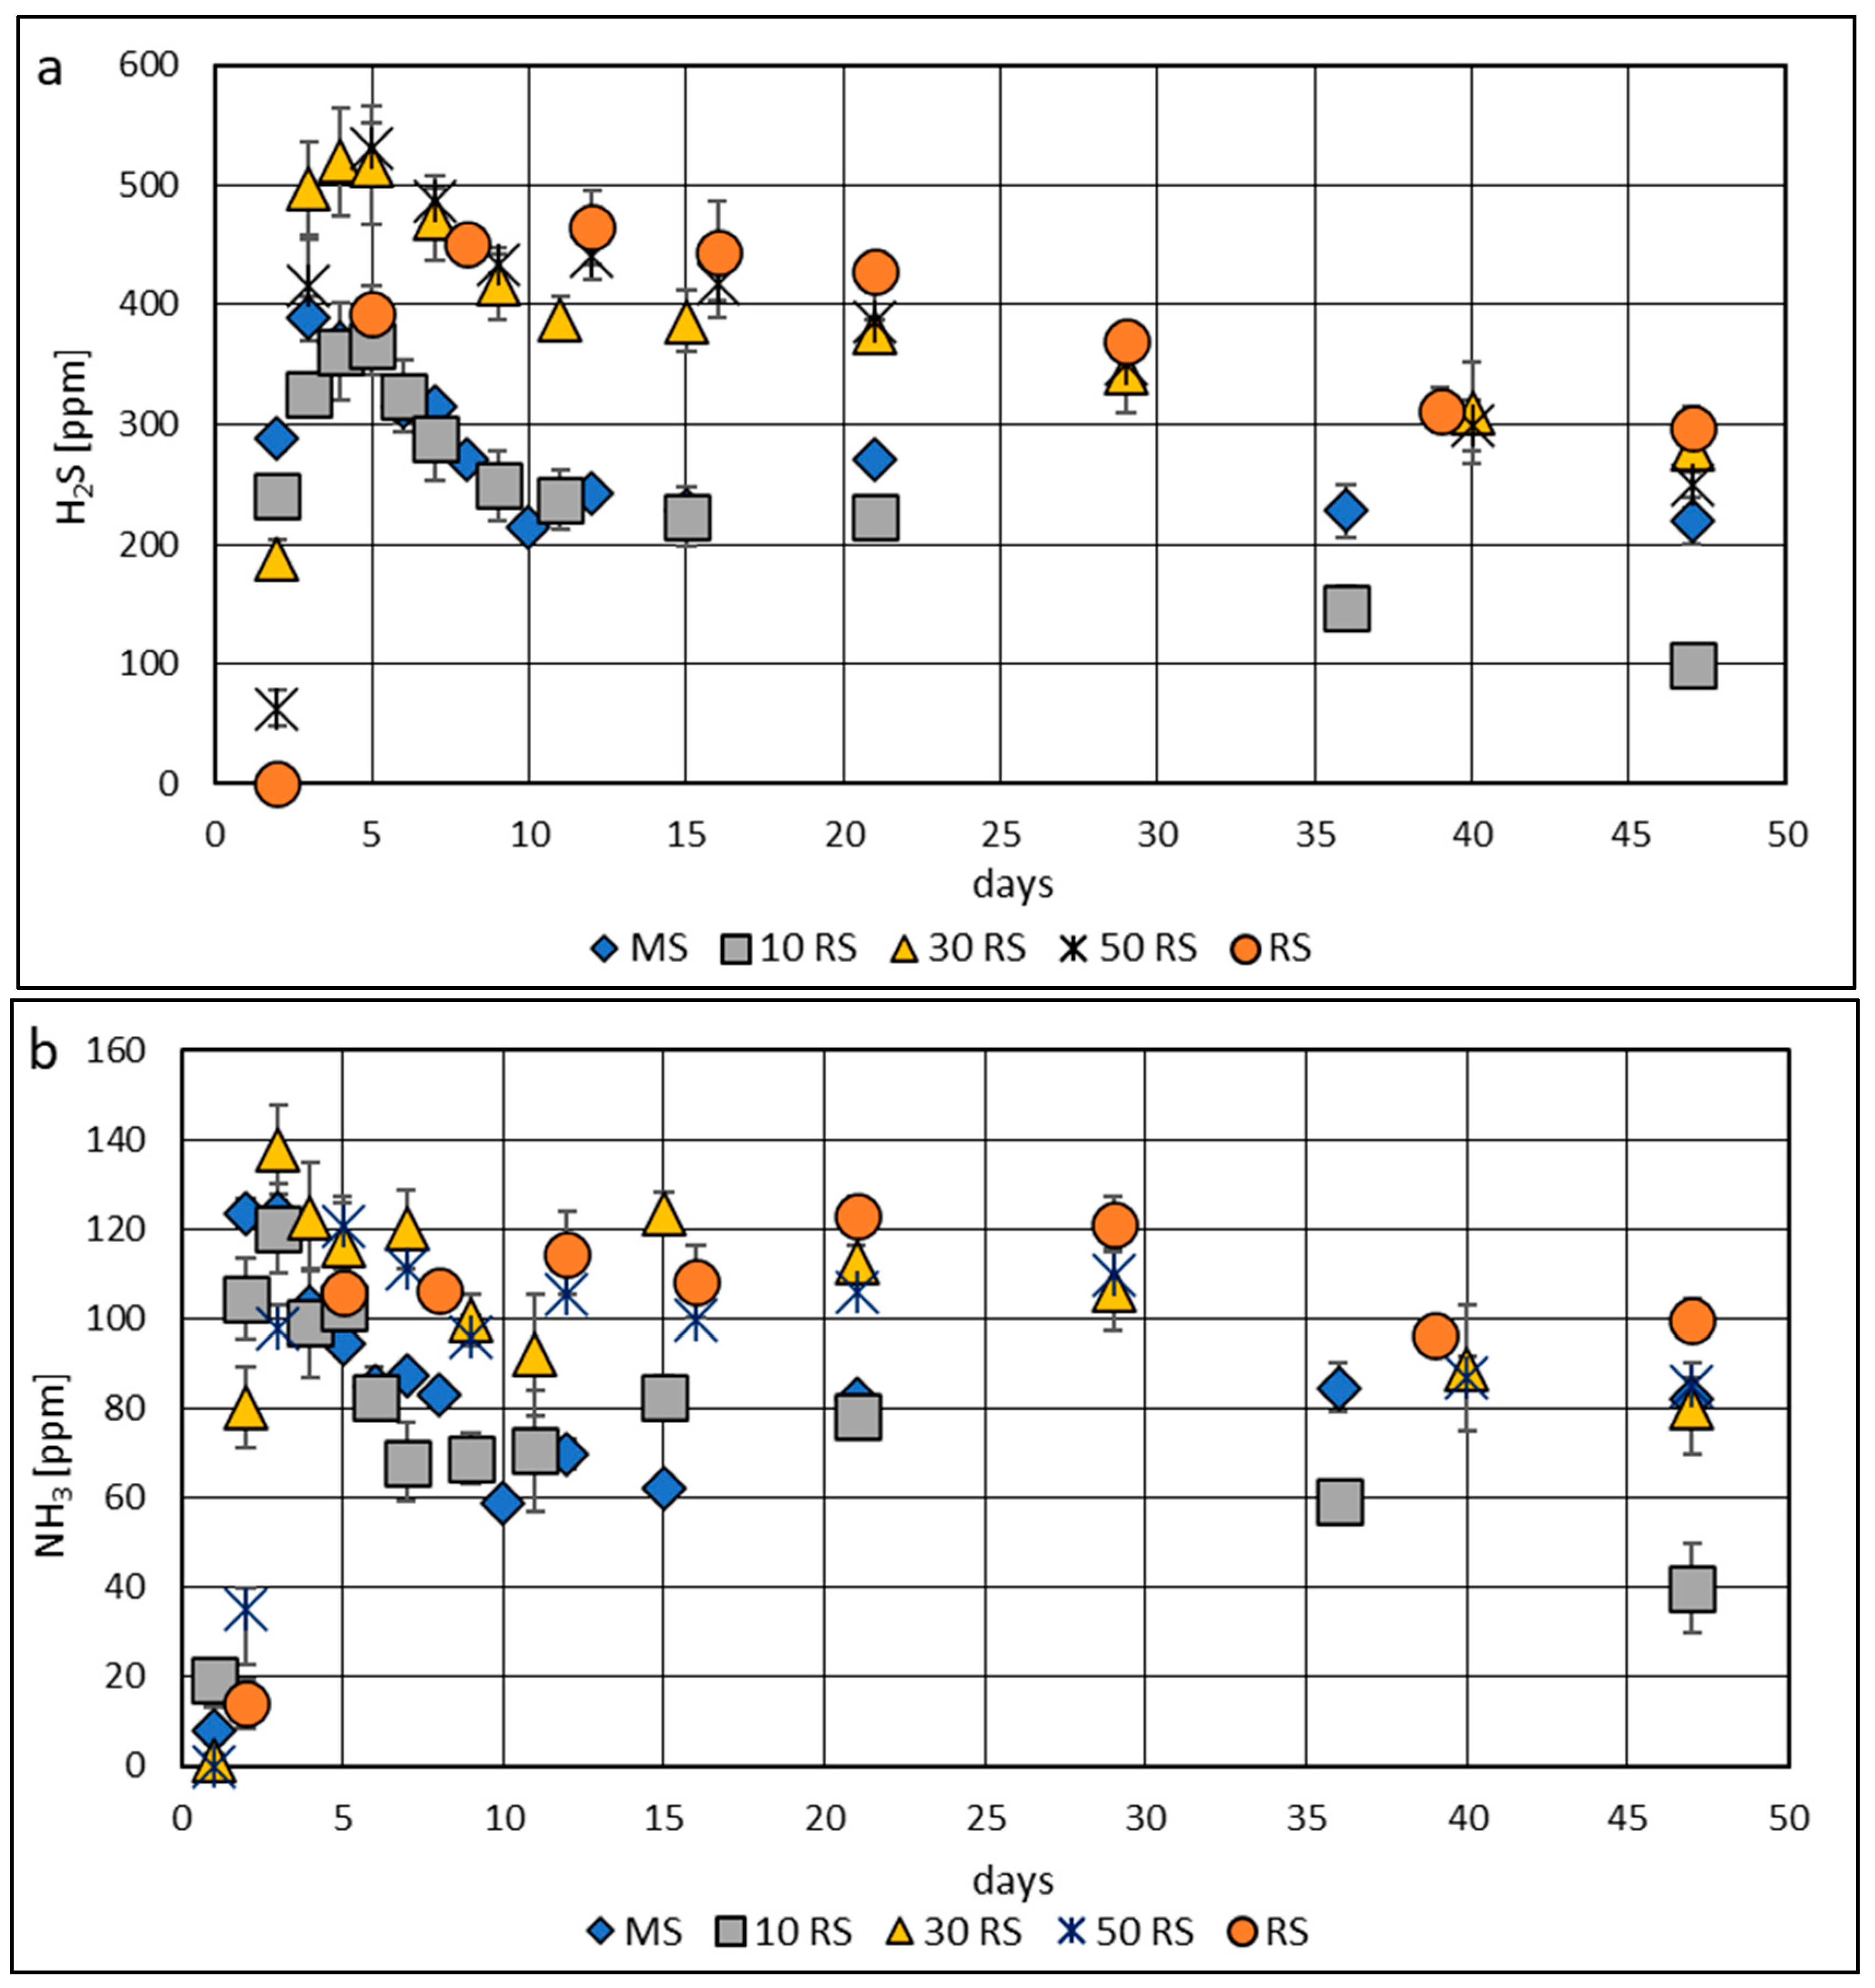
3.3. Concentration of Hydrogen Sulphide and Ammonia in Biogas from Mono- and Co-Digestion of Maize and Reed Silages

The addition of RS also influenced the hydrogen sulfide (H2S) content in the biogas produced from analyzed combinations compared to mono-digestion of MS. While in the case of MS and the 10 RS combination, the content of this compound was almost identical throughout the experiment, an increased share of RS in the co-digestion experiments caused a nearly two-fold increase in the concentration of H2S in biogas (Figure 4a). A similar effect produced by increasing MS substitution with RS was observed for ammonia (NH3) concentrations in biogas (Figure 4b). High H2S and NH3 concentrations were observed in the biogas produced from RS mono-digestion; hence, adding this feedstock increased the contents of the analyzed inhibitors in all the studied combinations.

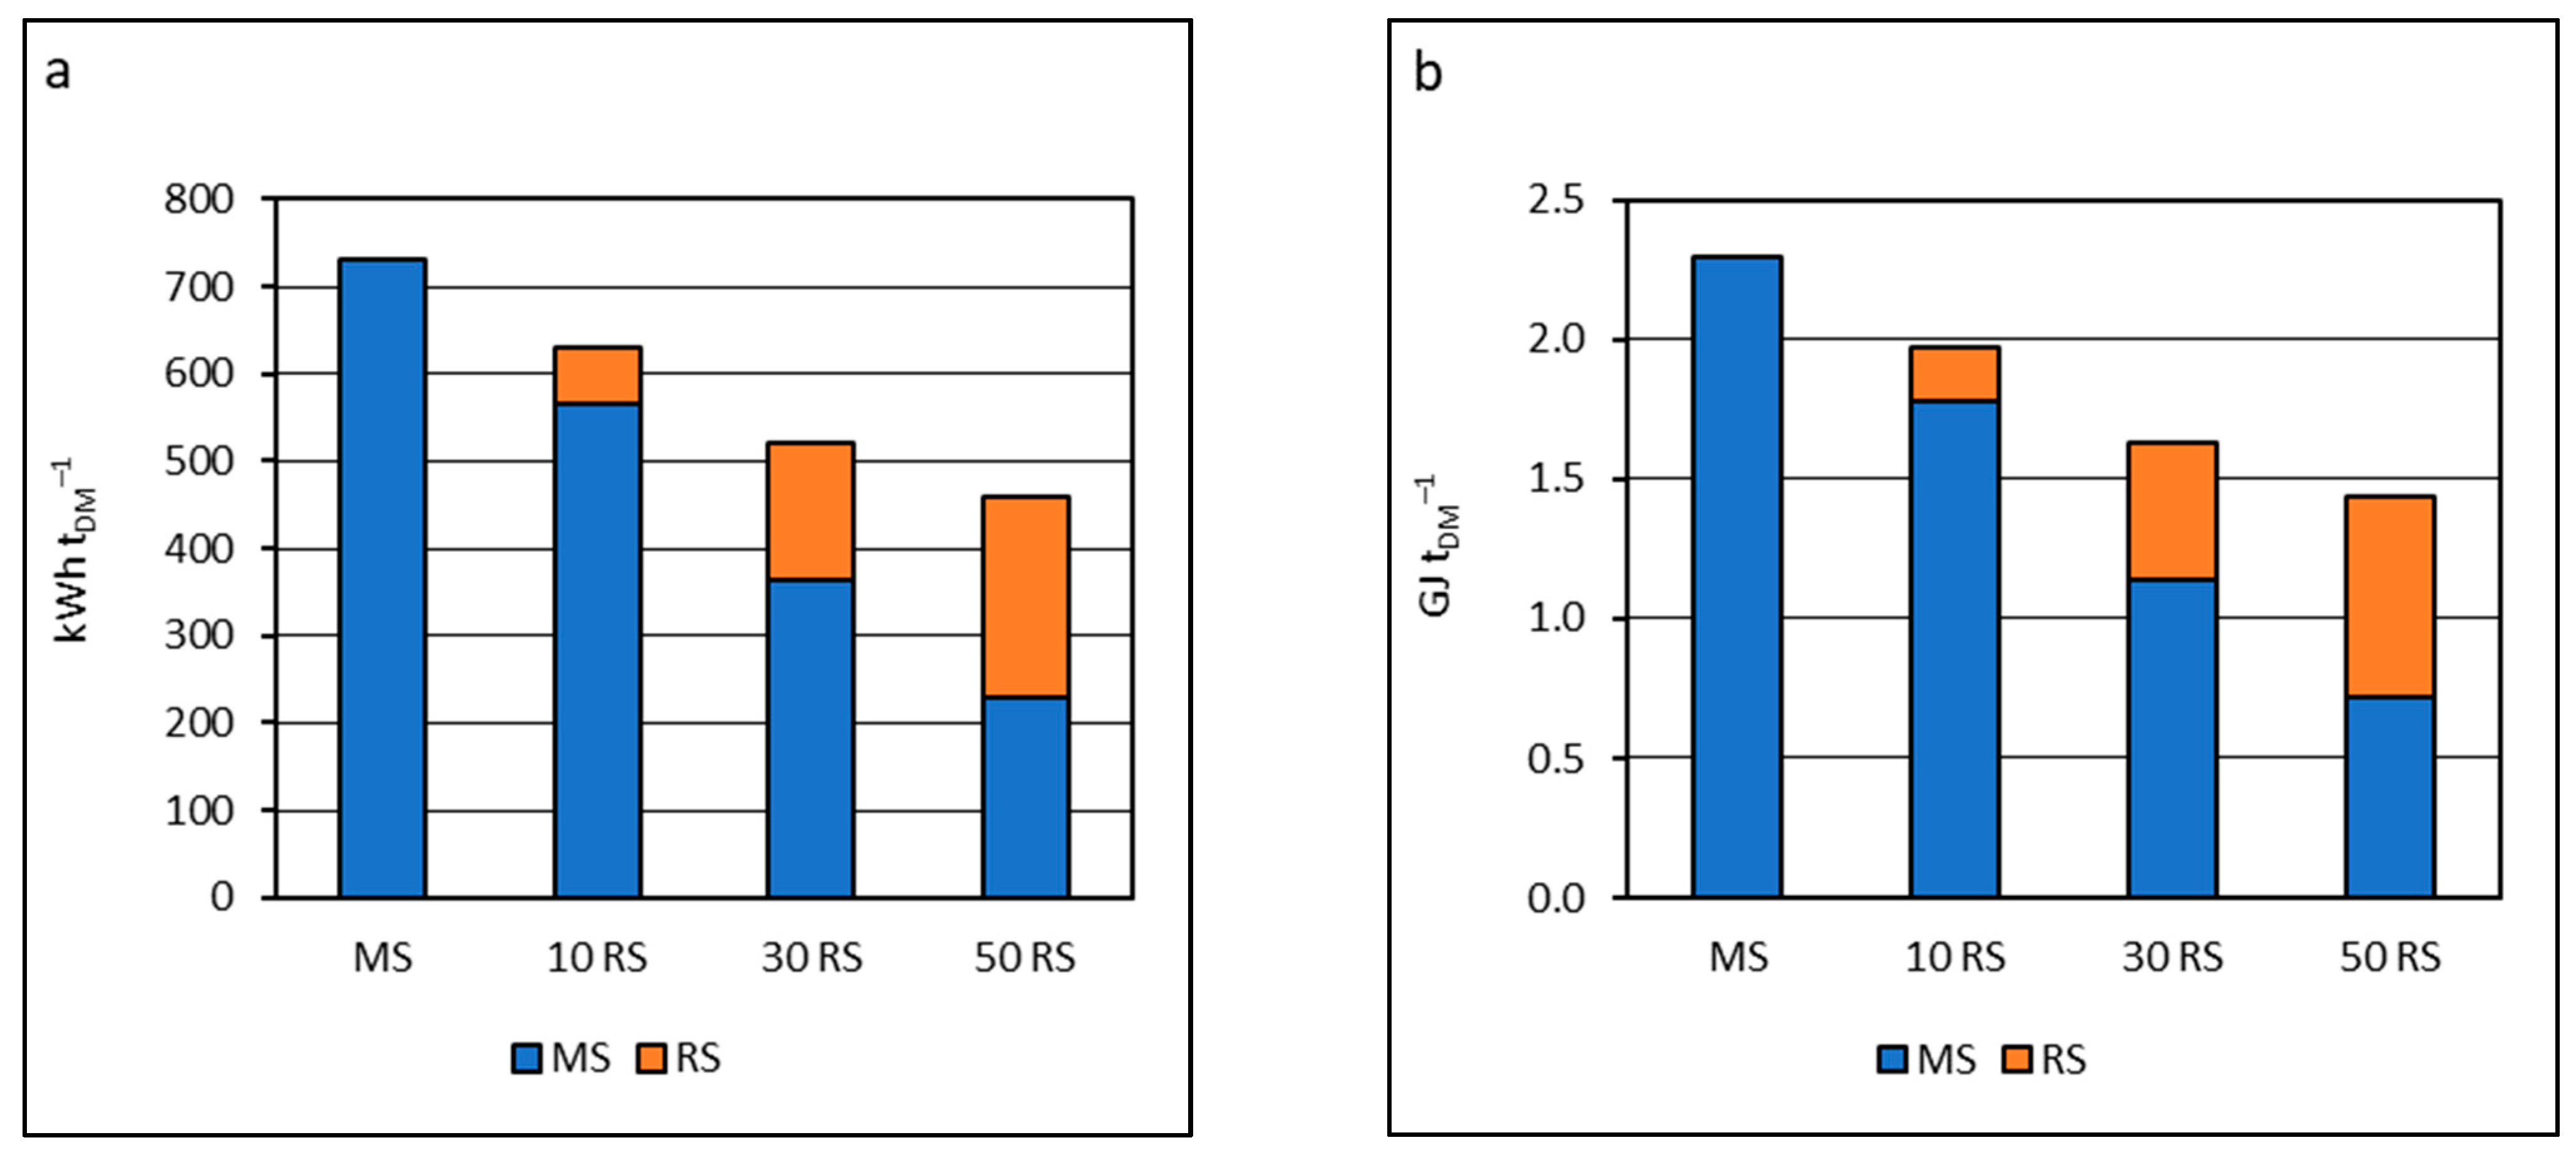
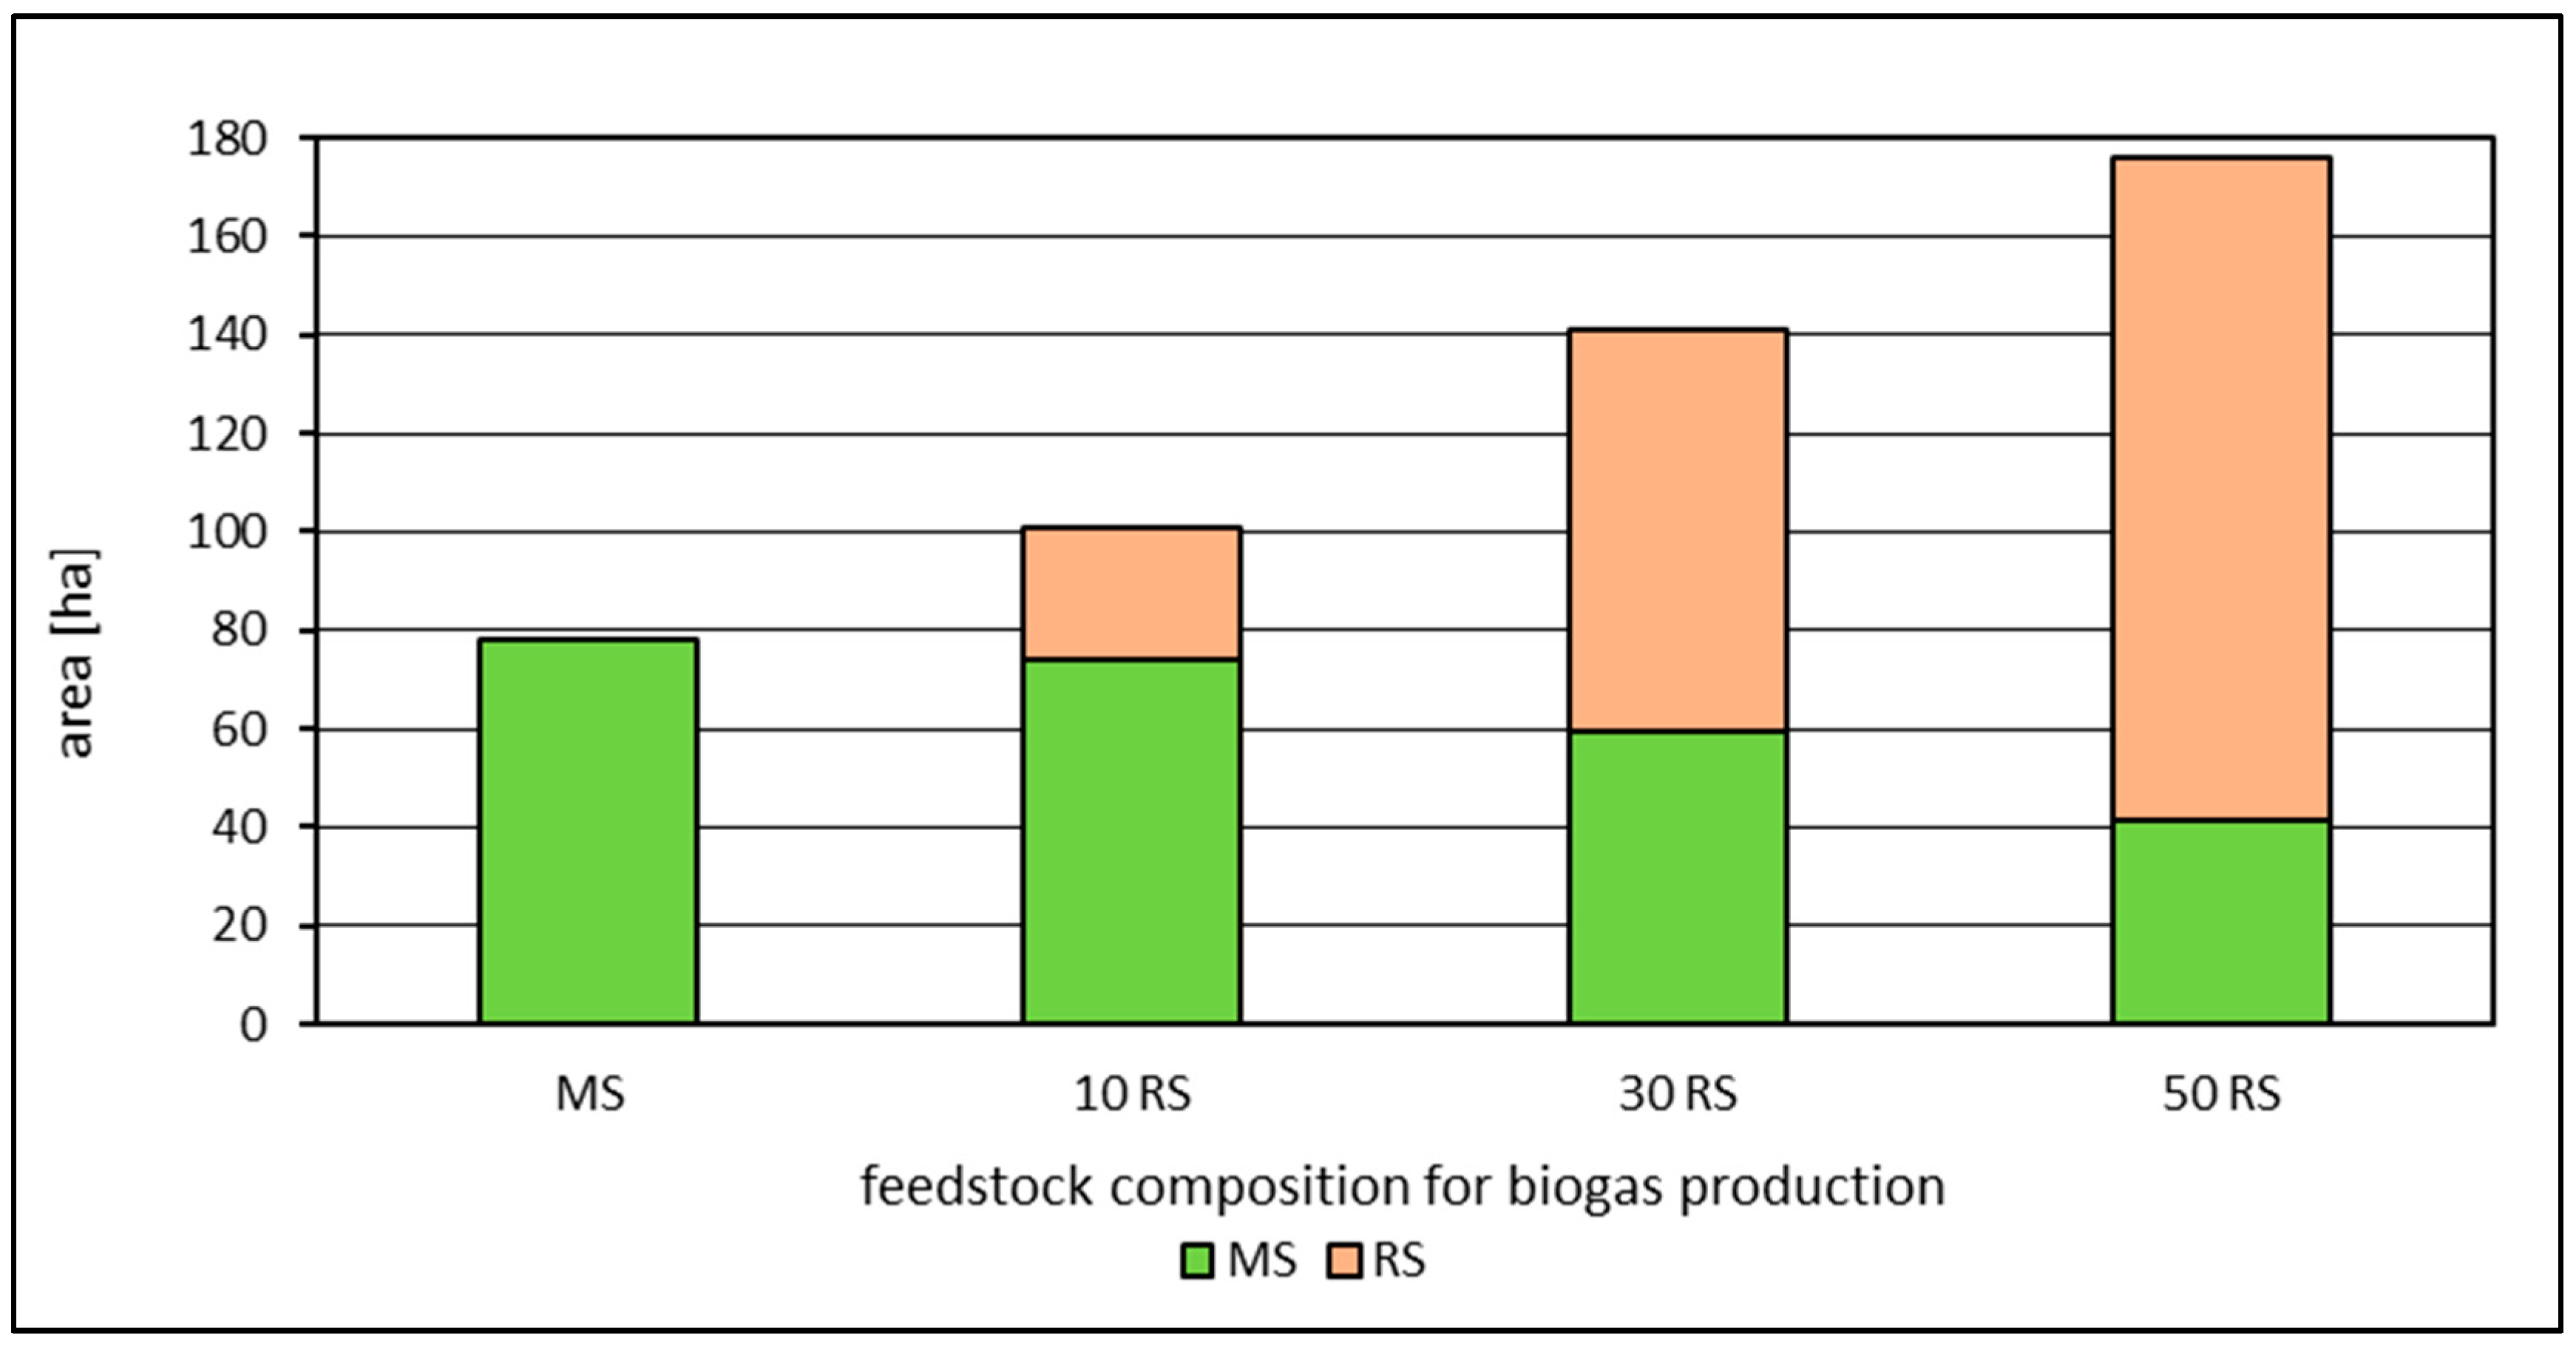
3.4. Energy Balance and GHG Emissions

The differences in the CH4 yield produced from mono-digestion of MS and RS and co-digestion of the three combinations influenced the energy generation (expressed as per ton DM) from biogas produced in a theoretical biogas plant fed with the studied feedstocks. A biogas plant fed with RS only would generate the lowest amount of energy. The most efficient would be a biogas plant based on the MS mono-digestion. The substitution of MS with 10%, 30%, and 50% contents of RS would decrease the generated energy by 14%, 28%, and 37%, respectively (Table 3).
An analysis of the data on electricity and heat generation presented in Table 3 and the share of the energy generated by MS and RS in every co-digested combination of feedstock reveals that the proportion of energy generated from RS in the total energy produced from mono-digestion of MS was 9%, 21%, and 31% for 10 RS, 30 RS, and 50 RS, respectively (Figure 5).
Reed is a promising biofuel used for energy generation through incineration. The basic parameters influencing the efficiency of reed incineration in biomass furnaces are presented in Table 4.
The calorific value relative to the area equaled 145.36 GJ ha−1 and was estimated based on reed yield from natural stands expressed in DM. If the biomass moisture required for the proper operation of the furnace is included in the calculations, the calorific value per hectare decreases to 140.11 GJ ha−1. In addition, if the furnace efficiency of 90% is included in the calculations, the calorific value per hectare decreases to 126.10 GJ ha−1.
Heat generation from reed incineration and from the biogas was compared based on the reed biomass needed for biogas production in all three co-digestion combinations. A comparison of the incineration efficiency and the heat generation from the biogas produced from the same amount of reed reveals that direct incineration is a much more efficient method for heat generation than biogas (Table 5).
Although the substitution of MS with RS reduces the CH4 yield, the co-digestion of energy crops with organic feedstock from conservation measures or with reed biomass from paludiculture may positively affect other environmental aspects of energy generation. These include land use, since substituting MS with 10% of RS reduces the area of maize crop by 5; MS substitution with 30% of RS reduces the area of this energy crop by 24%; while the substitution of half of the maize feedstock with RS decreases the maize crop area by 47% (Table 6).
At the same time, the harvested reed area increases significantly with increasing substitution of MS with the biomass in question. For a biogas plant with an electrical power of 100 kWel, an increase of RS from 10% to 50% expands the harvested area from 20 ha to 140 ha (Figure 6).
The substitution of MS with RS reduces GHG emissions related to maize cultivation. The calculations of GHG emissions, including the emission factor for maize cultivation (3.38 t CO2 ha−1), maize yield, and the area of maize needed for the assumed energy generation, revealed that GHG emissions related to maize cultivation equaled 2.63 t CO2 eq. kWel−1. This means that GHG emissions from the cultivation of maize as a feedstock for a biogas plant with a power of 50 kWel are equal to 131.66 t CO2 eq., while in the case of a biogas plant with a capacity of 1000 kWel, these emissions increase to 2633.26 t CO2 eq. This could be avoided by substituting maize with reed as a feedstock. However, the complete substitution of maize with the reed in biogas production is not viable due to the very low SMY of the reed, which is why only partial substitution should be considered. In this case, the electrical power installed in the biogas plant is significant. In large installations, the amount of the emitted GHG will be lower by over 1200 t (Table 7).
RS co-digestion enables the avoidance of GHG emissions from energy generation from fossil fuels. RS used as feedstock in biogas production would reduce the area for maize cultivation as an energy crop and the GHG emissions from coal burning. A higher CO2 reduction is made possible due to electricity generated from the biogas produced from the co-digestion of RS and MS (Table 8).

4. Discussion

4.1. Feedstock Characteristics

MS is one of the primary energy crops used in biogas plants. Its cultivation method and ensilage process are well-known and commonly used in agricultural practices. However, the soil and weather conditions, fertilization, harvest date, maturity, and the variety of maize may influence the chemical composition of the feedstock in question [76,77,78,79,80,81]. The TS of maize depends on the variety and the maturity during harvest. In general, the TS content in milk ripeness is lower compared to wax ripeness and, depending on the variety, may range from 23.32% to 88.43% [77]. However, Seppӓlӓ et al. [82] reported a TS of maize as low as 16%. The results of this study agree with the data provided by Hartung et al. [52] as well as the mean value for the milk ripeness stage reported by Gao et al. [77]. The vs. content obtained in this study is similar to that reported by Hartung et al. [52] and Seppӓlӓ et al. [82]. The N, P, and K contents in maize vary between the plant parts and depend on the maturity and fertilization. The N content ranges from 3.8 g kg−1 in stems in the tasseling stage to 12.1 g kg−1 in leaves in the 7–8th leaf stage and in the milk-dough stage, depending on fertilization [79]. Skowrońska and Filipek [83] also reported a wide range of N concentrations in the different maize parts, from 3.08 g kg−1 in cobs to 15.96 g kg–1 in grain. Seppӓlӓ et al. [82] and Zhao et al. [84] reported a higher N content (~15 g kg−1) in the whole plant. The result obtained in this study is above the range given by Nenova et al. [79], within the range reported by Skowrońska and Filipek [83], and lower than the data given by Seppӓlӓ et al. [82] or Zhao et al. [84]. The P content obtained in this study remains in the range provided by Nenova et al. [79], who reported relatively narrow limits of TP, i.e., from 1.5 g kg−1 on average during the milk-dough stage to 4.9 g kg−1 during the 7–8th leaf growth stage. A more comprehensive range was given by Skowrońska and Filipek [83], who observed a K content ranging from 0.4 g kg−1 in roots and cobs to 6.2 g kg−1 in grains. The K content of dry biomass of maize varied the most in studies by Nenova et al. [79], i.e., from 7 g kg−1 in the stems during the milk-dough stage to 54 g kg−1 during the 7–8th leaf growth stage. The result obtained in this study is close to the lower limit of the K content reported by Nenova et al. [79].
The chemical composition of reed biomass is influenced by biotopes [85], geographical location [86], climatic and weather conditions, and harvest time [63,87]. The TS content in RS (62.85 ± 0.99%) is much higher than the results reported in the previous study. The TS content of RS prepared from plants harvested in late autumn of 2019 from the same natural wetland was 44.76 ± 0.90% [65]. However, Roj-Rojewski et al. [63] reported a higher TS, ranging from 59.9 ± 1.6% to 86.1 ± 0.3%, depending on the harvest time, while Ohlsson et al. [68] reported a TS of 68%. The vs. content of RS was similar to the values reported in the literature [63,65,68,88]. The TKN content (14.60 ± 0.53 g kg−1) was similar to those reported by Borin et al. [89], Ohlsson et al. [68], and Van Tran et al. [90]; however, much lower values, i.e., in the range from 0.53 g kg−1 to 6.68 g kg−1, can be found in the literature [91,92]. Roj-Rojewski et al. [63] reported high variability in this parameter, ranging from 14 ± 2 g kg−1 to 36 ± 4 g kg−1, depending on the harvest time. The result obtained in this study is also much lower than the values obtained in our previous study [65]. The TP content in RS found in literature ranged from 0.04 g kg−1 to 2.2 g kg−1 [63,68,91,92,93]. The result of this study (1.98 ± 0.02 g kg−1) remains in the quoted range and is comparable to the TP reported by Baran et al. [93] and Roj-Rojewski et al. [63] as well as the authors’ previous study [65]. The K content (2.68 ± 0.16 g kg−1) remains in the range given in the literature, i.e., from 0.2 g kg−1 to 10.90 g kg−1 [91,92,93], and is similar to the result reported by López-González et al. [92]. However, the K content in the authors’ earlier study was almost twice as high [65]. The TOC content (379.11 ± 7.81 g kg−1) is lower than that obtained in our previous study [65] and similar to the results given by López-González et al. [92] and Roj-Rojewski et al. [63]; however, literature reports higher values in a range from 443.4 g kg−1 to 870.5 g kg−1 [89,90,91,93].
The C:N ratio of feedstock is one of the essential parameters indicating effective digestion. Kwietniewska and Tys [94] reported an optimal C:N ratio for AD of organic waste as 20–35. The C:N ratio of MS obtained in this study is 29:1; thus, mono-digestion of MS can be an effective process with a high degradation rate. RS was characterized by a lower C:N ratio, i.e., 26:1, but this value could still be considered valuable for process efficiency.

4.2. Methane Yield from Mono- and Co-Digestion of Maize and Reed Silages

In an extensive literature review, Hermann and Rath [95] reported that the SMY of maize feedstock might vary significantly and range from 181 NL kgVS−1 for fresh and chopped maize harvested in the dough stage to 581 NL kgVS−1 for ensiled maize also harvested in the dough stage. The CH4 yield depends on many factors, such as harvest time, growth stage, maize variety, ensilage, and particle size. Ensiling increases the rate of CH4 formation, also increasing the SMY [95]; however, results reported by Kreuger et al. [96] were contradictory since ensiling had no significant effect on the SMY of maize. Herrmann et al. [97] reported that chemical additives and microbiological inoculants increase the aerobic stability of ensiled maize and thus increase the SMY after the exposure of MS to air, compared to maize ensiled without any additives. Although CH4 production may benefit from a smaller particle size through better silage quality and higher specific surface area, resulting in faster digestion through an increase in the feedstock’s availability to microorganisms, the hydrolysis of cross-linkages between lignin and other cell wall compounds is a rate-limiting step which is unlikely to be overcome by a decrease in particle size. The result of this study is in the lower limit of the range of SMY reported by Herrmann and Rath [95]. Acidity is an efficient qualifying parameter of the silage process, and the pH, as a function of TS, is a good indicator of silage quality. The pH of MS (TS–31.66%) was 3.94, indicating a pH below the value of 4.4, which is considered an indicator of a very good quality of silage [98]. Nevertheless, ensilage had no significant effect on the CH4 yield. The low SMY value may result from the maturity of the harvested biomass and the weather conditions persisting through the vegetation period.
Several studies have investigated biogas production from common reed. The common reed has significant intraspecific variability, including highly different growth rates [99] reflected in biomass production ranging from 3–10 tDM ha−1 [45,46,50] in natural habitats to 16 tDM ha−1 when harvested from paludiculture [52]. The intraspecific variability is also reflected in the nutrient uptake efficiency and tissue properties. However, this differentiation has less impact on SMY, which did not differ significantly between the four genotypes collected from Romania, Italy, the Netherlands, and Denmark. The CH4 yield is also significantly affected by the harvest time and the part of the plant. The SMY of leaves is markedly higher than that of stems [62]. The SMY obtained for RS in this study is lower than that reported by Eller et al. [99] and Lizasoain et al. [88] but similar to the values obtained by Roj-Rojewski et al. [63] for reed harvested in three seasons from natural habitat and the results reported by Czubaszek et al. [65]. These discrepancies may be due to the genotype, the weather conditions, the trophic status of the habitat, or the ensiling quality. In this study, the ensiled material was characterized by a high TS, i.e., 62.85%, and a pH of 6.68, which indicates a relatively poor ensiling performance. The material was harvested in late autumn, with a very high TS content after a relatively dry summer. The lack of additives may also have negatively influenced the ensilage.
The co-digestion of different feedstocks has two advantages. Firstly, it may optimize the C:N ratio; secondly, it can help balance the amounts of trace elements, such as cobalt, molybdenum, or nickel, used by the trophic chain in enzyme production, which is important for methanogenesis [100]. Moreover, Chakraborty et al. [35] reported that adding grass clippings to food waste regulated sudden pH changes and enhanced the production of value-added biochemicals. However, improper feedstock selection or excessive co-digestion may introduce inhibitory compounds, imbalance the C:N ratio, or overload the organic ratio, suppressing the AD process [101]. A proper selection of the co-substrate and balance are essential parameters in co-digestion which can improve the CH4 yield and stabilize the process to avoid the risk of acidification. A balanced distribution between carbohydrates, proteins, and lipids should also be considered in co-substrate selection [29].
Although maize is an excellent feedstock for biogas production with a relatively high SMY and the possibility of ensiling, MS as a feedstock for biogas plants is under socio-economic pressure as a type of biomass that competes with food for cultivation area [40]. Therefore, substituting MS with other organic materials in biogas production has been intensively studied recently. A study on substituting MS co-digested with pig slurry with microalgae biomass revealed that adding this type of biomass led to a significantly lower biogas yield [40]. The co-digestion of bedding straw with cattle manure was characterized by a similar CH4 yield as MS while substituting maize with cardoon, or naturally sun-dried milk thistle stalks thermo-chemical pretreated with NaOH gave the highest CH4 yield values [38].
Wetland vegetation and paludi-biomass have received attention lately as attractive, sustainable feedstock for co-digestion. Chuanchai and Ramaraj [27] investigated the effect of co-digestion of buffalo grass with buffalo manure at various ratios on biogas production. Adding meadow grass also enhanced the CH4 yield from the AD of cattle manure [102]. In this study, the co-digestion of maize and reed silages with increasing substitution of maize with RS decreased the SMY significantly compared to the mono-digestion of MS. Since both feedstocks were characterized by similar C:N ratios, the inhibitory effect of the imbalanced amounts of N and C was not the reason for the decreasing CH4 yield. A much lower SMY of RS was probably the main reason for the lower CH4 production from co-digestion. These results are in line with studies by Hartung et al. [52] on the co-digestion of Typha latifolia with maize. An addition of 10% of Typha latifolia significantly reduced the specific biogas yield of MS. However, the substitution of maize with Phalaris arundinacea of up to 30% did not significantly reduce biogas yield since the specific biogas yield of this species was comparable to that of maize [52]. In turn, Ohlsson et al. [68] reported no effect of reed addition on the SMY of Laminaria digitata.
The common reed used in this study was chopped, increasing the area exposed for conversion by microorganisms; however, such pretreatment seems insufficient for enhancing biogas production. Similar findings have been reported by Pelegrin and Holzem [103]. Thus, the optimization of the pretreatment step in mono- or co-digestion of RS is necessary to increase the methane yield. There are several methods of biomass pretreatment, which can be categorized as physical, chemical, or biological. The simplest method of pretreatment of lignocellulosic raw materials is milling, which reduces the crystallinity and particle size of the material. Milling pretreatment of raw lignocellulosic materials followed by solid-state anaerobic digestion increases the kinetics of the AD process [104]. Extrusion leads to a significant increase in CH4 production but requires a high energy input [105]. A significant increase in biogas yield can also be obtained using chemical pretreatment methods. A study by Shah and Tabassum [106] showed a twofold increase in biogas production from corn cob with the use of alkaline pretreatment. Amnuaycheewa et al. [107], on the other hand, showed the beneficial effect of organic acids on sugar production and, thus also, on the production of biogas. However, chemical pretreatments may introduce hazardous substances to the environment and should be used carefully. A more environmentally friendly method of pretreatment is the steam explosion process. Lizasoain et al. [88] observed a 22% increase in the CH4 yield from corn stover after the steam explosion pretreatment, although inhibitors of biogas production may be formed in this process. Pelegrin and Holzem [103] investigated several pretreatment methods with the common reed, including shredding, grinding, heating to 190 °C for 1 h, sonication at 20 kHz for 4 h, soaking in 2% sodium hydroxide for 60 min at 120 °C, soaking in 2% hydrochloric acid for 60 min at 120 °C, aeration, and shaking in anaerobic conditions at 150 rpm and 35 °C for 4 h. The results of this study have revealed a significant increase in biogas and CH4 yields resulting from pretreatments, apart from the chemical methods. Mechanical shredding performed the best, followed by the thermal method and grinding. All these methods require additional energy, and therefore, the trade-off between methane yield and the additional energy demand for biogas production should be carefully analyzed to achieve a profitable biogas plant.

4.3. Concentration of Hydrogen Sulfide and Ammonia in Biogas from Mono- and Co-Digestion of Maize and Reed Silages

The inhibition of the AD process is one of the most important disadvantages of biogas production. Inhibitors such as pesticides, antibiotics, or heavy metals may be introduced with feedstock or generated during one of the stages of the AD process. In addition to CH4 and CO2, biogas contains nitrogen (N2), hydrogen (H2), carbon monoxide (CO), oxygen (O2), hydrogen sulfide (H2S), and ammonia (NH3). The last two compounds may have an inhibitory effect on biogas production.
Sulfate is a typical component of several types of industrial wastewater [108,109]; other feedstocks, such as animal manure, may also contain high amounts of sulfur compounds. Thus, the H2S concentration in biogas may vary from 2 ppm to 12,000 ppm [110,111,112]. H2S forms a corrosive condensate with water in biogas, damaging the combined heat and power (CHP) units and pipes; moreover, it is toxic to living organisms. Furthermore, the combustion of biogas containing H2S releases sulfur oxides (SOx) into the atmosphere [113,114], which can harm trees and plants by damaging foliage and decreasing growth, contributing to acid rains and hurting the respiratory system of living organisms. Hence, the H2S content in biogas should be low; however, the threshold value depends on further applications. The highest H2S content (<70,000 ppm) is acceptable in biogas used in microturbines, but if biogas is upgraded for the substitution of natural gas, the H2S content should not exceed 4–10 ppm [115]. CHP units can operate on biogas with a maximum H2S content between 100 and 500 ppm [114,116]. As mentioned above, since the H2S concentration in biogas may reach as much as 12,000 ppm [110], removal technologies such as absorption into a liquid (either water or caustic solution), adsorption on a solid (such as iron oxide-based materials, activated carbon or impregnated activated carbon) and biological conversion (by which sulfur compounds are converted into elemental sulfur by sulfide oxidizing microorganisms with the addition of air or oxygen) are used [111].
This study’s highest daily concentrations slightly exceeded 500 ppm for biogas produced from 50 RS and 30 RS. The maximum daily H2S concentration is much lower than that for biogas from mono-digestion of cow manure. However, the value is similar to the mono-digestion of cow manure with the addition of waste iron powder to suppress the H2S concentration [117]. The daily H2S concentration for biogas from 10 RS is similar to the values reported for semi-continuous AD of swine manure and corn stover [118] and the AD of mixed fruit and fruit with vegetables [119]. The results of this study agree with those provided by Herout et al. [120], who reported a low H2S content in biogas produced from liquid beef manure with the addition of MS, grass haylage, and rye grain; however, the addition of MS only did not prevent the increase of H2S up to 1000 ppm at the end of the experiment. The mono-digestion of MS produced biogas with an H2S concentration similar to that reported by Hutňan [121].
NH3 is another inhibitor produced in the digester by degrading nitrogen-containing compounds, primarily proteins, urea, and nucleic acids [109,122]. The inhibitory effect is manifested by total cessation of methanogenic activity and indicated by a decrease in CH4 production and an increase in the VFA concentration [122].
According to Theuerl et al. [123], the generally accepted threshold value for NH3 ranges from 80 ppm to 400 ppm; however, the toxicity limits given in the literature differ significantly and range from 60 ppm to 14,000 ppm [109,124]. In this study, the maximum daily NH3 concentration ranged between 106 ppm and 138 ppm and is close to the lower limit of the threshold value given by Theuerl et al. [123].
Since NH3 inhibition may cause a failure of the AD process, several strategies for controlling NH3 concentrations are adopted in biogas production, i.e., (i) acclimation of microflora, especially methanogens, to high NH3 concentration; (ii) proper control of pH [125]; (iii) dilution of feedstock containing high amounts of nitrogen-rich compounds, or adjustment of the feedstock’s C:N ratio by co-digestion of a feedstock with a high N content with a substrate rich in C; (iv) addition of inert packing materials such as zeolite or clay minerals; (v) optimization of the concentration of trace elements [122]; and (vi) bioaugmentation [124].

4.4. Energy Balance and GHG Emissions

In Poland, in 2018, the electricity consumption per floor area of residence was 27.32 kWh m−2, and the consumption of heat generated from coal was equal to 0.77 GJ m−2 [126]. An analysis of the energy generated in biogas plants based on the studied co-digestion combinations revealed that depending on the size of the biogas plant, from 146 to 2917 residences with an area of 100 m2 could be supplied with electricity and from 16 to 324 residences with an area of 100 m2 could be supplied with heat (Table 9).
The large number of households that can be supplied with energy from the analyzed biogas plants results from the AD of MS. If the calculations were only based on the share of RS added to MS, the results would be much lower. Electricity sourced from RS only, co-digested in combinations with MS, can supply from 1 to 729 households, while from less than 1 to 108 houses can be supplied with heat (Table 10).
In this study, the calorific value of reed (16.903 ± 0.079 GJ tDM−1) is slightly lower than the values reported by Demko et al. [127] and Dahms et al. [128]. However, the calorific value per hectare of reed is significantly lower compared to the data from the study by Demko et al. [127] since, in this research, the reed yield used for calculations were based on values from natural habitats and was thus much lower than that used by Demko et al. [127]. This study result is close to the value for the medium reed yield reported by Dahms et al. [128]. However, direct incineration of reed generates much more heat than CHP units in the analyzed biogas plants. Therefore, the number of households supplied with heat from reed incineration would be much higher than those supplied from biogas (Table 11). Nevertheless, incineration of reed requires drying the biomass to a moisture level that would meet the requirements for biomass furnaces.
Since the CH4 yield for RS is significantly lower than that for MS, reed biomass should only be considered a co-substrate in a biogas plant. The results of this study have revealed that reed could replace MS in the amount of only up to 10% of the feedstock. However, substituting MS with RS may decrease the area used for maize cultivation and, simultaneously, reduce the competition for land and open up a sensible utilization path for the biomass produced in paludiculture. This can lead to a lowering of the market prices of maize. The other advantage is the reduction of GHG emissions from maize cultivation which are proven to contribute significantly to the overall GHG emissions from biogas production [129]. Additionally, if drained peatlands are rewetted, and reed is cultivated on them for harvesting biogas substrates or other purposes, this is associated with large reductions in GHG emissions from the peatland site, due to the change to anaerobic conditions, minimizing the decomposition of peat. Depending on the site conditions, especially water levels before and after rewetting, GHG emission savings of up to over 20 t CO2 eq. per hectare per year can be achieved [130].
The LCA of electricity and heat generation from agricultural residues and MS through the AD process revealed that regardless of the feedstock, energy generation from biogas has a lower impact in at least nine environmental categories [25]. Hijazi et al. [131] concluded their review on the LCA assessment for biogas production in Europe that the feedstock type is a determining factor for the environmental impact of biogas production. Indeed, the addition of MS to cattle slurry significantly influenced GHG emissions, photochemical oxidants formation, particulate matter formation, land use, and water depletion [25]. Agostini et al. [41] concluded that the mono-digestion of energy crops appeared environmentally detrimental. A similar finding was revealed by Tonini et al. [132], who reported that land-use changes in GHG emissions related to energy production from annual crops exceed any GHG savings generated from the replacement of fossil fuels. The results of this study also revealed that even a low share of MS substitution with reed might significantly decrease GHG emissions. In contrast, the GHG reduction increases with the increasing size of the biogas plant.

5. Conclusions

Due to the rising prices of maize and the decreasing social acceptance of maize as a sustainable feedstock, biogas plant operators seek inexpensive feedstocks that could substitute MS. Reed biomass is a lignocellulosic material that is inexpensive, not competing with food production and, in some cases, also considered a waste that it is challenging to utilize. This study has revealed that the CH4 yield from RS is much lower than that from MS. Therefore, the share of reed as an MS substitution can reach 10%; otherwise, a significant decrease in the CH4 yield is observed. Both silages are characterized by the proper C:N ratio; however, an addition of reed may increase NH3 and H2S concentrations, thus impairing the AD process or increasing the operating costs.
Adding reed as a maize substitution may significantly impact the environmental performance of biogas plants since reed does not require additional new land for cultivation. Even if the CH4 yield per hectare or ton of fresh matter is lower for reed than maize, reed can be competitive due to lower or zero demand for agrochemical input. Reed harvested in natural habitats or from paludiculture also performs much better in terms of GHG emissions.

Author Contributions

Conceptualization, R.C., A.W.-C., P.B. and W.W.; methodology, R.C. and A.W.-C.; formal analysis, R.C. and A.W.-C.; investigation, R.C, A.W.-C. and G.Z.; writing—original draft preparation, R.C., A.W.-C. and P.B.; writing—review and editing, P.B., W.W. and G.Z.; visualization, R.C. and A.W.-C.; project administration, P.B. and W.W; funding acquisition, W.W. All authors have read and agreed to the published version of the manuscript.

Funding

This research was funded by the Interreg Baltic Sea Region project DESIRE (Development of sustainable (adaptive) peatland management by restoration and paludiculture for nutrient retention and other ecosystem services in the Neman River catchment), index number R3071 and project number #R091, implemented in the framework of the Interreg Baltic Sea Region Program, co-funded by the European Regional Development Fund.

Institutional Review Board Statement

Not applicable.

Informed Consent Statement

Not applicable.

Data Availability Statement

Not applicable.

Conflicts of Interest

The authors declare no conflict of interest. The funders had no role in the design of the study; in the collection, analyses, or interpretation of data; in the writing of the manuscript; or in the decision to publish the results.

References

  1. World Bioenergy Association. Global Bioenergy Statistics 2021. Available online: https://www.worldbioenergy.org/uploads/211214%20WBA%20GBS%202021.pdf (accessed on 2 November 2022).
  2. International Energy Agency. Biogas Production by Region and by Feedstock Type. 2018. Available online: https://www.iea.org/data-and-statistics/charts/biogas-production-by-region-and-by-feedstock-type-2018 (accessed on 2 November 2022).
  3. Green Planet Energy. Paludicultur Und Biomethan—Nachhaltige Landnutzung, 1st ed.; Green Planet Energy: Hamburg, Germany, 2022. [Google Scholar]
  4. Fachagentur Nachwachsende Rohstoffe e.V., 2020. Bioenergy in Germany Facts and Figures 2020. Available online: https://www.fnr.de/fileadmin/allgemein/pdf/broschueren/broschuere_basisdaten_bioenergie_2020_engl_web.pdf (accessed on 3 November 2022).
  5. García-Lara, S.; Serna-Saldivar, S.O. Chapter 1—Corn History and Culture. In Corn, 3rd ed.; Serna-Saldivar, S.O., Ed.; AACC International Press: Oxford, UK, 2019; pp. 1–18. ISBN 978-0-12-811971-6. [Google Scholar]
  6. FAOSTAT Crops and Livestock Products. Available online: https://www.fao.org/faostat/en/#data/QCL (accessed on 16 December 2022).
  7. Shiferaw, B.; Prasanna, B.M.; Hellin, J.; Bänziger, M. Crops That Feed the World 6. Past Successes and Future Challenges to the Role Played by Maize in Global Food Security. Food Sec. 2011, 3, 307–327. [Google Scholar] [CrossRef] [Green Version]
  8. Erenstein, O.; Jaleta, M.; Sonder, K.; Mottaleb, K.; Prasanna, B.M. Global Maize Production, Consumption and Trade: Trends and R&D Implications. Food Sec. 2022, 14, 1295–1319. [Google Scholar] [CrossRef]
  9. Xu, J.; Li, M.; Ni, T. Feedstock for Bioethanol Production from a Technological Paradigm Perspective. BioResources 2015, 10, 6285–6304. [Google Scholar] [CrossRef] [Green Version]
  10. Mumm, R.H.; Goldsmith, P.D.; Rausch, K.D.; Stein, H.H. Land Usage Attributed to Corn Ethanol Production in the United States: Sensitivity to Technological Advances in Corn Grain Yield, Ethanol Conversion, and Co-Product Utilization. Biotechnol. Biofuels 2014, 7, 61. [Google Scholar] [CrossRef] [PubMed] [Green Version]
  11. Dobers, G.M. Acceptance of Biogas Plants Taking into Account Space and Place. Energy Policy 2019, 135, 110987. [Google Scholar] [CrossRef]
  12. Wicki, L.; Naglis-Liepa, K.; Filipiak, T.; Parzonko, A.; Wicka, A. Is the Production of Agricultural Biogas Environmentally Friendly? Does the Structure of Consumption of First- and Second-Generation Raw Materials in Latvia and Poland Matter? Energies 2022, 15, 5623. [Google Scholar] [CrossRef]
  13. Martínez-Gutiérrez, E. Biogas Production from Different Lignocellulosic Biomass Sources: Advances and Perspectives. 3 Biotech 2018, 8, 233. [Google Scholar] [CrossRef]
  14. Kumar, R.; Bhardwaj, A.; Singh, L.P.; Singh, G. Environmental Impact Assessment of Maize Production in Northern India. IOP Conf. Ser. Earth Environ. Sci. 2022, 1084, 012042. [Google Scholar] [CrossRef]
  15. Rode, M.; Schneider, C.; Ketelhake, G.; Reißhauer, D. Naturschutzverträgliche Erzeugung Und Nutzung von Biomasse Zur Wärme–Und Stromgewinnung, 1st ed.; BfN–Skripten: Bonn, Germany, 2015. (In German) [Google Scholar]
  16. Vergara, F.; Lakes, T.M. Maizification of the Landscape for Biogas Production? Identifying the Likelihood of Silage Maize for Biogas in Brandenburg from 2008–2018; FORLand-Working Paper; Humboldt-Universität zu Berlin: Berlin, Germany, 2019. [Google Scholar]
  17. Fahrig, L.; Baudry, J.; Brotons, L.; Burel, F.G.; Crist, T.O.; Fuller, R.J.; Sirami, C.; Siriwardena, G.M.; Martin, J.-L. Functional Landscape Heterogeneity and Animal Biodiversity in Agricultural Landscapes. Ecol. Lett. 2011, 14, 101–112. [Google Scholar] [CrossRef]
  18. Kleijn, D.; Rundlöf, M.; Scheper, J.; Smith, H.G.; Tscharntke, T. Does Conservation on Farmland Contribute to Halting the Biodiversity Decline? Trends Ecol. Evol. 2011, 26, 474–481. [Google Scholar] [CrossRef]
  19. Banaszuk, P.; Wysocka-Czubaszek, A.; Czubaszek, R.; Roj-Rojewski, S. Skutki energetycznego wykorzystania biomasy. Wieś I Rol. 2015, 4, 139–152. (In Polish) [Google Scholar]
  20. Agostini, A.; Battini, F.; Padella, M.; Giuntoli, J.; Baxter, D.; Marelli, L.; Amaducci, S. Economics of GHG Emissions Mitigation via Biogas Production from Sorghum, Maize and Dairy Farm Manure Digestion in the Po Valley. Biomass Bioenergy 2016, 89, 58–66. [Google Scholar] [CrossRef]
  21. Lüker-Jans, N.; Simmering, D.; Otte, A. The Impact of Biogas Plants on Regional Dynamics of Permanent Grassland and Maize Area—The Example of Hesse, Germany (2005–2010). Agric. Ecosys. Environ. 2017, 241, 24–38. [Google Scholar] [CrossRef]
  22. Markou, G.; Brulé, M.; Balafoutis, A.; Kornaros, M.; Georgakakis, D.; Papadakis, G. Biogas Production from Energy Crops in Northern Greece: Economics of Electricity Generation Associated with Heat Recovery in a Greenhouse. Clean. Techn. Environ. Policy 2017, 19, 1147–1167. [Google Scholar] [CrossRef]
  23. Couwenberg, J. Biomass Energy Crops on Peatlands: On Emissions and Perversions. Int. Mire Conserv. Group (IMCG) Newsl. Issue 2007, 3, 12–14. [Google Scholar]
  24. Bacenetti, J.; Sala, C.; Fusi, A.; Fiala, M. Agricultural Anaerobic Digestion Plants: What LCA Studies Pointed out and What Can Be Done to Make Them More Environmentally Sustainable. Appl. Energy 2016, 179, 669–686. [Google Scholar] [CrossRef] [Green Version]
  25. Balcioglu, G.; Jeswani, H.K.; Azapagic, A. Evaluating the Environmental and Economic Sustainability of Energy from Anaerobic Digestion of Different Feedstocks in Turkey. Sustain. Prod. Consum. 2022, 32, 924–941. [Google Scholar] [CrossRef]
  26. Mu, H.; Zhao, C.; Zhao, Y.; Li, Y.; Hua, D.; Zhang, X.; Xu, H. Enhanced Methane Production by Semi-Continuous Mesophilic Co-Digestion of Potato Waste and Cabbage Waste: Performance and Microbial Characteristics Analysis. Bioresour. Technol. 2017, 236, 68–76. [Google Scholar] [CrossRef]
  27. Chuanchai, A.; Ramaraj, R. Sustainability Assessment of Biogas Production from Buffalo Grass and Dung: Biogas Purification and Bio-Fertilizer. 3 Biotech 2018, 8, 151. [Google Scholar] [CrossRef] [Green Version]
  28. Vats, N.; Khan, A.A.; Ahmad, K. Options for Enhanced Anaerobic Digestion of Waste and Biomass—A Review. J. Biosyst. Eng. 2020, 45, 1–15. [Google Scholar] [CrossRef]
  29. Miramontes-Martínez, L.R.; Rivas-García, P.; Albalate-Ramírez, A.; Botello-Álvarez, J.E.; Escamilla-Alvarado, C.; Gomez-Gonzalez, R.; Alcalá-Rodríguez, M.M.; Valencia-Vázquez, R.; Santos-López, I.A. Anaerobic Co-Digestion of Fruit and Vegetable Waste: Synergy and Process Stability Analysis. J. Air Waste Manag. Assoc. 2021, 71, 620–632. [Google Scholar] [CrossRef] [PubMed]
  30. Riau, V.; Burgos, L.; Camps, F.; Domingo, F.; Torrellas, M.; Antón, A.; Bonmatí, A. Closing Nutrient Loops in a Maize Rotation. Catch Crops to Reduce Nutrient Leaching and Increase Biogas Production by Anaerobic Co-Digestion with Dairy Manure. Waste Manag. 2021, 126, 719–727. [Google Scholar] [CrossRef] [PubMed]
  31. Wilinska-Lisowska, A.; Ossowska, M.; Czerwionka, K. The Influence of Co-Fermentation of Agri-Food Waste with Primary Sludge on Biogas Production and Composition of the Liquid Fraction of Digestate. Energies 2021, 14, 1907. [Google Scholar] [CrossRef]
  32. Vijin Prabhu, A.; Sivaram, A.R.; Prabhu, N.; Sundaramahalingam, A. A Study of Enhancing the Biogas Production in Anaerobic Digestion. Mater. Today Proc. 2021, 45, 7994–7999. [Google Scholar] [CrossRef]
  33. Atelge, M.R.; Krisa, D.; Kumar, G.; Eskicioglu, C.; Nguyen, D.D.; Chang, S.W.; Atabani, A.E.; Al-Muhtaseb, A.H.; Unalan, S. Biogas Production from Organic Waste: Recent Progress and Perspectives. Waste Biomass. Valori. 2020, 11, 1019–1040. [Google Scholar] [CrossRef]
  34. Aklilu, E.G.; Waday, Y.A. Optimizing the Process Parameters to Maximize Biogas Yield from Anaerobic Co-Digestion of Alkali-Treated Corn Stover and Poultry Manure Using Artificial Neural Network and Response Surface Methodology. Biomass Conv. Bioref. 2021. [Google Scholar] [CrossRef]
  35. Chakraborty, D.; Palani, S.G.; Ghangrekar, M.M.; Anand, N.; Pathak, P. Dual Role of Grass Clippings as Buffering Agent and Biomass during Anaerobic Co-Digestion with Food Waste. Clean Techn. Environ. Policy 2022, 24, 2787–2799. [Google Scholar] [CrossRef]
  36. Velásquez Piñas, J.A.; Venturini, O.J.; Silva Lora, E.E.; Calle Roalcaba, O.D. Technical Assessment of Mono-Digestion and Co-Digestion Systems for the Production of Biogas from Anaerobic Digestion in Brazil. Renew. Energy 2018, 117, 447–458. [Google Scholar] [CrossRef]
  37. Böjti, T.; Kovács, K.L.; Kakuk, B.; Wirth, R.; Rákhely, G.; Bagi, Z. Pretreatment of Poultry Manure for Efficient Biogas Production as Monosubstrate or Co-Fermentation with Maize Silage and Corn Stover. Anaerobe 2017, 46, 138–145. [Google Scholar] [CrossRef]
  38. Kalamaras, S.D.; Kotsopoulos, T.A. Anaerobic Co-Digestion of Cattle Manure and Alternative Crops for the Substitution of Maize in South Europe. Bioresour. Technol. 2014, 172, 68–75. [Google Scholar] [CrossRef]
  39. Cuetos, M.J.; Gómez, X.; Martínez, E.J.; Fierro, J.; Otero, M. Feasibility of Anaerobic Co-Digestion of Poultry Blood with Maize Residues. Bioresour. Technol. 2013, 144, 513–520. [Google Scholar] [CrossRef]
  40. Gruber-Brunhumer, M.R.; Montgomery, L.F.R.; Nussbaumer, M.; Schoepp, T.; Zohar, E.; Muccio, M.; Ludwig, I.; Bochmann, G.; Fuchs, W.; Drosg, B. Effects of Partial Maize Silage Substitution with Microalgae on Viscosity and Biogas Yields in Continuous AD Trials. J. Biotechnol. 2019, 295, 80–89. [Google Scholar] [CrossRef] [PubMed]
  41. Agostini, A.; Battini, F.; Giuntoli, J.; Tabaglio, V.; Padella, M.; Baxter, D.; Marelli, L.; Amaducci, S. Environmentally Sustainable Biogas? The Key Role of Manure Co-Digestion with Energy Crops. Energies 2015, 8, 5234–5265. [Google Scholar] [CrossRef]
  42. Lask, J.; Martínez Guajardo, A.; Weik, J.; von Cossel, M.; Lewandowski, I.; Wagner, M. Comparative Environmental and Economic Life Cycle Assessment of Biogas Production from Perennial Wild Plant Mixtures and Maize (Zea mays L.) in Southwest Germany. Glob. Change Biol. Bioenergy 2020, 12, 571–585. [Google Scholar] [CrossRef]
  43. De Vries, J.W.; Vinken, T.M.W.J.; Hamelin, L.; De Boer, I.J.M. Comparing Environmental Consequences of Anaerobic Mono- and Co-Digestion of Pig Manure to Produce Bio-Energy—A Life Cycle Perspective. Bioresour. Technol. 2012, 125, 239–248. [Google Scholar] [CrossRef] [Green Version]
  44. Tanneberger, F.; Wichtmann, W. Land Use Options for Rewetted Peatlands. In Carbon Credits from Peatland Rewetting. Climate-Biodiversity-Land Use, 1st ed.; Tanneberger, F., Wichtmann, W., Eds.; Schweizerbart Science Publishers: Stuttgart, Germany, 2011; pp. 107–132. [Google Scholar]
  45. Granéli, W. Reed Phragmites australis (Cav.) Trin. Ex Steudel as an Energy Source in Sweden. Biomass 1984, 4, 183–208. [Google Scholar] [CrossRef]
  46. Brix, H.; Sorrell, B.K.; Lorenzen, B. Are Phragmites-Dominated Wetlands a Net Source or Net Sink of Greenhouse Gases? Aquat. Bot. 2001, 69, 313–324. [Google Scholar] [CrossRef]
  47. Hallam, A.; Anderson, I.C.; Buxton, D.R. Comparative Economic Analysis of Perennial, Annual, and Intercrops for Biomass Production. Biomass Bioenergy. 2001, 21, 407–424. [Google Scholar] [CrossRef]
  48. Jasinskas, A.; Zaltauskas, A.; Kryzeviciene, A. The Investigation of Growing and Using of Tall Perennial Grasses as Energy Crops. Biomass Bioenergy 2008, 32, 981–987. [Google Scholar] [CrossRef]
  49. Massé, D.; Gilbert, Y.; Savoie, P.; Bélanger, G.; Parent, G.; Babineau, D. Methane Yield from Switchgrass and Reed Canarygrass Grown in Eastern Canada. Bioresour. Technol. 2011, 102, 10286–10292. [Google Scholar] [CrossRef]
  50. Köbbing, J.F.; Thevs, N.; Zerbe, S. The Utilisation of Reed (Phragmites australis): A Review. Mires Peat 2013, 13, 1–14. [Google Scholar]
  51. Pocienė, L.; Šarūnaitė, L.; Tilvikienė, V.; Šlepetys, J.; Kadžiulienė, Ž. The Yield and Composition of Reed Canary Grass Biomass as Raw Material for Combustion. Biologija 2013, 59, 195–200. [Google Scholar] [CrossRef]
  52. Hartung, C.; Andrade, D.; Dandikas, V.; Eickenscheidt, T.; Drösler, M.; Zollfrank, C.; Heuwinkel, H. Suitability of Paludiculture Biomass as Biogas Substrate—Biogas Yield and Long-Term Effects on Anaerobic Digestion. Renew. Energy 2020, 159, 64–71. [Google Scholar] [CrossRef]
  53. Geurts, J.J.M.; van Duinen, G.-J.A.; van Belle, J.; Wichmann, S.; Wichtmann, W.; Fritz, C. Recognize the High Potential of Paludiculture on Rewetted Peat Soils to Mitigate Climate Change. Landbauforsch. J. Sustain. Org. Agric. Syst. 2019, 69, 5–8. [Google Scholar] [CrossRef]
  54. United Nations Environment Programme Global Peatlands Assessment: The State of the World’s Peatlands. Available online: http://www.unep.org/resources/global-peatlands-assessment-2022 (accessed on 27 November 2022).
  55. Humpenöder, F.; Karstens, K.; Lotze-Campen, H.; Leifeld, J.; Menichetti, L.; Barthelmes, A.; Popp, A. Peatland Protection and Restoration Are Key for Climate Change Mitigation. Environ. Res. Lett. 2020, 15, 104093. [Google Scholar] [CrossRef]
  56. Joosten, H.; Tanneberger, F.; Moen, A. (Eds.) Mires and Peatlans of Europe. Status. Distribution and Conservation, 1st ed.; Schweizerbart Science Publishers: Stuttgart, Germany, 2017. [Google Scholar]
  57. Tanneberger, F.; Appulo, L.; Ewert, S.; Lakner, S.; Ó Brolcháin, N.; Peters, J.; Wichtmann, W. The Power of Nature-Based Solutions: How Peatlands Can Help Us to Achieve Key EU Sustainability Objectives. Adv. Sustain. Syst. 2021, 5, 2000146. [Google Scholar] [CrossRef]
  58. Raichel, D.L.; Able, K.W.; Hartman, J.M. The Influence of Phragmites (Common Reed) on the Distribution, Abundance, and Potential Prey of a Resident Marsh Fish in the Hackensack Meadowlands, New Jersey. Estuaries 2003, 26, 511–521. [Google Scholar] [CrossRef]
  59. Cotana, F.; Cavalaglio, G.; Pisello, A.; Gelosia, M.; Ingles, D.; Pompili, E. Sustainable Ethanol Production from Common Reed (Phragmites australis) through Simultaneuos Saccharification and Fermentation. Sustainability 2015, 7, 12149–12163. [Google Scholar] [CrossRef] [Green Version]
  60. Banaszuk, P.; Kamocki, A.K.; Wysocka-Czubaszek, A.; Czubaszek, R.; Roj-Rojewski, S. Closing the Loop—Recovery of Nutrients and Energy from Wetland Biomass. Ecol. Eng. 2020, 143, 105643. [Google Scholar] [CrossRef]
  61. Gómez-Sánchez, M.D.; Sánchez, R.; Espinosa, E.; Rosal, A.; Rodríguez, A. Production of Cellulosic Pulp from Reed (Phragmites Australis) to Produce Paper and Paperboard. Bioprocess Eng. 2017, 1, 65. [Google Scholar] [CrossRef]
  62. Dragoni, F.; Giannini, V.; Ragaglini, G.; Bonari, E.; Silvestri, N. Effect of Harvest Time and Frequency on Biomass Quality and Biomethane Potential of Common Reed (Phragmites australis) Under Paludiculture Conditions. Bioenergy Res. 2017, 10, 1066–1078. [Google Scholar] [CrossRef]
  63. Roj-Rojewski, S.; Wysocka-Czubaszek, A.; Czubaszek, R.; Kamocki, A.; Banaszuk, P. Anaerobic Digestion of Wetland Biomass from Conservation Management for Biogas Production. Biomass Bioenergy 2019, 122, 126–132. [Google Scholar] [CrossRef]
  64. Jagadabhi, P.S.; Kaparaju, P.; Rintala, J. Two-Stage Anaerobic Digestion of Tomato, Cucumber, Common Reed and Grass Silage in Leach-Bed Reactors and Upflow Anaerobic Sludge Blanket Reactors. Bioresour. Technol. 2011, 102, 4726–4733. [Google Scholar] [CrossRef] [PubMed]
  65. Czubaszek, R.; Wysocka-Czubaszek, A.; Wichtmann, W.; Banaszuk, P. Specific Methane Yield of Wetland Biomass in Dry and Wet Fermentation Technologies. Energies 2021, 14, 8373. [Google Scholar] [CrossRef]
  66. Müller, J.; Jantzen, C.; Wiedow, D. The Energy Potential of Soft Rush (Juncus effusus L.) in Different Conversion Routes. Energy Sustain. Soc. 2020, 10, 26. [Google Scholar] [CrossRef]
  67. Baute, K.; Van Eerd, L.; Robinson, D.; Sikkema, P.; Mushtaq, M.; Gilroyed, B. Comparing the Biomass Yield and Biogas Potential of Phragmites Australis with Miscanthus x Giganteus and Panicum virgatum Grown in Canada. Energies 2018, 11, 2198. [Google Scholar] [CrossRef] [Green Version]
  68. Ohlsson, L.-O.; Karlsson, S.; Rupar-Gadd, K.; Albers, E.; Welander, U. Evaluation of Laminaria digitata and Phragmites australis for Biogas Production and Nutrient Recycling. Biomass Bioenergy 2020, 140, 105670. [Google Scholar] [CrossRef]
  69. Wang, X.; Zhang, L.; Xi, B.; Sun, W.; Xia, X.; Zhu, C.; He, X.; Li, M.; Yang, T.; Wang, P.; et al. Biogas Production Improvement and C/N Control by Natural Clinoptilolite Addition into Anaerobic Co-Digestion of Phragmites australis, Feces and Kitchen Waste. Bioresour. Technol. 2015, 180, 192–199. [Google Scholar] [CrossRef]
  70. Wang, K.; Yun, S.; Xing, T.; Li, B.; Abbas, Y.; Liu, X. Binary and Ternary Trace Elements to Enhance Anaerobic Digestion of Cattle Manure: Focusing on Kinetic Models for Biogas Production and Digestate Utilization. Bioresour. Technol. 2021, 323, 124571. [Google Scholar] [CrossRef]
  71. APHA. Standard Methods: For the Examination of Water and Wastewater, 20th ed.; American Public Health Association, American Water Works Association, Water Pollution Control Federation: Washington, DC, USA, 1998; ISBN 978-0-87553-235-6.
  72. Statistics Poland. Production of Agricultural and Horticultural Crops in 2021, 1st ed.; Zakład Wydawnictw Statystycznych: Warsaw, Poland, 2022. [Google Scholar]
  73. European Biomass Association. Statistical Report 2017; European Biomass Association: Brussels, Belgium, 2017. [Google Scholar]
  74. The National Centre for Emissions Management. Emission Factors for CO2, SO2, NOx and Total Particulate Matter for Electrical Energy on the Basis of Information in National Database on Emissions of Greenhouse Gases and Other Substances for 2020; The National Centre for Emissions Management: Warsaw, Poland, 2020. (In Polish) [Google Scholar]
  75. Hryniewicz, M.; Grzybek, A. Estimation of Greenhouse Gases Emission from Maize for Silage Crop by LCA Method. Probl. Agric. Eng. 2016, 1, 63–73. (in Polish). [Google Scholar]
  76. Schittenhelm, S. Chemical Composition and Methane Yield of Maize Hybrids with Contrasting Maturity. Eur. J. Agron. 2008, 29, 72–79. [Google Scholar] [CrossRef]
  77. Gao, R.; Yuan, X.; Zhu, W.; Wang, X.; Chen, S.; Cheng, X.; Cui, Z. Methane Yield through Anaerobic Digestion for Various Maize Varieties in China. Bioresour. Technol. 2012, 118, 611–614. [Google Scholar] [CrossRef] [PubMed]
  78. Gąsiorowska, B.; Płaza, A.; Rzążewska, E.; Waranica, M. Effect of Weather Conditions on the Content of Sugars in Plants of European Maize Cultivars Grown for Silage. Acta Agroph. 2020, 26, 57–64. [Google Scholar] [CrossRef]
  79. Nenova, L.; Benkova, M.; Simeonova, T.; Atanassova, I. Nitrogen, Phosphorus and Potassium Content in Maize Dry Biomass under the Effect of Different Levels of Mineral Fertilization. Agric. Sci. Technol. 2019, 11, 311–316. [Google Scholar] [CrossRef]
  80. Bojtor, C.; Mousavi, S.M.N.; Illés, Á.; Golzardi, F.; Széles, A.; Szabó, A.; Nagy, J.; Marton, C.L. Nutrient Composition Analysis of Maize Hybrids Affected by Different Nitrogen Fertilisation Systems. Plants 2022, 11, 1593. [Google Scholar] [CrossRef]
  81. Lin, S.; Pi, Y.; Long, D.; Duan, J.; Zhu, X.; Wang, X.; He, J.; Zhu, Y. Impact of Organic and Chemical Nitrogen Fertilizers on the Crop Yield and Fertilizer Use Efficiency of Soybean–Maize Intercropping Systems. Agriculture 2022, 12, 1428. [Google Scholar] [CrossRef]
  82. Seppälä, M.; Pyykkönen, V.; Väisänen, A.; Rintala, J. Biomethane Production from Maize and Liquid Cow Manure—Effect of Share of Maize, Post-Methanation Potential and Digestate Characteristics. Fuel 2013, 107, 209–216. [Google Scholar] [CrossRef]
  83. Skowrońska, M.; Filipek, T. Accumulation of Nitrogen and Phosphorus by Maize as a Result of a Reduction in the Potassium Fertilization Rate. Ecol. Chem. Eng. S 2010, 17, 83–88. [Google Scholar]
  84. Zhao, X.; Liu, J.; Liu, J.; Yang, F.; Zhu, W.; Yuan, X.; Hu, Y.; Cui, Z.; Wang, X. Effect of Ensiling and Silage Additives on Biogas Production and Microbial Community Dynamics during Anaerobic Digestion of Switchgrass. Bioresour. Technol. 2017, 241, 349–359. [Google Scholar] [CrossRef]
  85. Herrmann, C.; Prochnow, A.; Heiermann, M.; Idler, C. Biomass from Landscape Management of Grassland Used for Biogas Production: Effects of Harvest Date and Silage Additives on Feedstock Quality and Methane Yield. Grass Forage Sci. 2014, 69, 549–566. [Google Scholar] [CrossRef]
  86. Mosier, N. Features of Promising Technologies for Pretreatment of Lignocellulosic Biomass. Bioresour. Technol. 2005, 96, 673–686. [Google Scholar] [CrossRef]
  87. Wenzel, M.; Kabengele, G.; Dahms, T.; Barz, M.; Wichtmann, W. Bioenergie Aus Nassen Mooren. Thermische Verwertung von Halmgutartiger Biomasse Aus Paludikultur, 1st ed.; Institut für Botanik und Landschaftsökologie, Universität Greifswald, Greifswald Moor Centrum: Greifswald, Germany, 2022. (In German) [Google Scholar]
  88. Lizasoain, J.; Rincón, M.; Theuretzbacher, F.; Enguídanos, R.; Nielsen, P.J.; Potthast, A.; Zweckmair, T.; Gronauer, A.; Bauer, A. Biogas Production from Reed Biomass: Effect of Pretreatment Using Different Steam Explosion Conditions. Biomass Bioenergy 2016, 95, 84–91. [Google Scholar] [CrossRef]
  89. Borin, M.; Florio, G.; Barbera, A.; Cirelli, G.L.; Albergo, R.; Palazzo, S. Preliminary Evaluation of Macrophyte Wetland Biomasses to Obtain Second Generation Ethanol. In Proceedings of the 19th European Biomass Conference and Exhibition, Berlin, Germany, 6–10 June 2011. [Google Scholar]
  90. Van Tran, G.; Unpaprom, Y.; Ramaraj, R. Methane Productivity Evaluation of an Invasive Wetland Plant, Common Reed. Biomass Conv. Bioref. 2020, 10, 689–695. [Google Scholar] [CrossRef]
  91. Wöhler-Geske, A.; Moschner, C.R.; Gellerich, A. Provenances and Properties of Thatching Reed (Phragmites australis). Appl. Agric. For. Res. 2016, 86, 1–10. [Google Scholar] [CrossRef]
  92. López-González, D.; Avalos-Ramirez, A.; Giroir-Fendler, A.; Godbout, S.; Fernandez-Lopez, M.; Sanchez-Silva, L.; Valverde, J.L. Combustion Kinetic Study of Woody and Herbaceous Crops by Thermal Analysis Coupled to Mass Spectrometry. Energy 2015, 90, 1626–1635. [Google Scholar] [CrossRef]
  93. Baran, M.; Váradyová, Z.; Kráčmár, S.; Hedvábný, J. The Common Reed (Phragmites australis) as a Source of Roughage in Ruminant Nutrition. Acta Vet. Brno 2002, 71, 445–449. [Google Scholar] [CrossRef] [Green Version]
  94. Kwietniewska, E.; Tys, J. Process Characteristics, Inhibition Factors and Methane Yields of Anaerobic Digestion Process, with Particular Focus on Microalgal Biomass Fermentation. Renew. Sust. Energy Rev. 2014, 34, 491–500. [Google Scholar] [CrossRef]
  95. Herrmann, A.; Rath, J. Biogas Production from Maize: Current State, Challenges, and Prospects. 1. Methane Yield Potential. Bioenergy Res. 2012, 5, 1027–1042. [Google Scholar] [CrossRef]
  96. Kreuger, E.; Nges, I.; Björnsson, L. Ensiling of Crops for Biogas Production: Effects on Methane Yield and Total Solids Determin. Biotechnol. Biofuels 2011, 4, 44. [Google Scholar] [CrossRef] [PubMed] [Green Version]
  97. Herrmann, C.; Idler, C.; Heiermann, M. Improving Aerobic Stability and Biogas Production of Maize Silage Using Silage Additives. Bioresour. Technol. 2015, 197, 393–403. [Google Scholar] [CrossRef] [Green Version]
  98. Gross, F.; Riebe, K. Gärfutter: Betriebswirtschaft, Erzeugung, Verfütterung, 1st ed.; UlmeVerlag Eugen: Stuttgart, Germany, 1974; ISBN 978-3-8001-4321-4. (In German) [Google Scholar]
  99. Eller, F.; Ehde, P.M.; Oehmke, C.; Ren, L.; Brix, H.; Sorrell, B.K.; Weisner, S.E.B. Biomethane Yield from Different European Phragmites australis genotypes, compared with other herbaceous wetland species grown at different fertilization regimes. Resources 2020, 9, 57. [Google Scholar] [CrossRef]
  100. Bareha, Y.; Faucher, J.-P.; Michel, M.; Houdon, M.; Vaneeckhaute, C. Evaluating the Impact of Substrate Addition for Anaerobic Co-Digestion on Biogas Production and Digestate Quality: The Case of Deinking Sludge. J. Environ. Manag. 2022, 319, 115657. [Google Scholar] [CrossRef] [PubMed]
  101. Wickham, R.; Galway, B.; Bustamante, H.; Nghiem, L.D. Biomethane Potential Evaluation of Co-Digestion of Sewage Sludge and Organic Wastes. Int. Biodeterior. Biodegrad. 2016, 113, 3–8. [Google Scholar] [CrossRef] [Green Version]
  102. Feng, L.; Wahid, R.; Ward, A.J.; Møller, H.B. Anaerobic Co-Digestion of Cattle Manure and Meadow Grass: Effect of Serial Configurations of Continuous Stirred Tank Reactors (CSTRs). Biosyst. Eng. 2017, 160, 1–11. [Google Scholar] [CrossRef]
  103. Pelegrin, J.; Holzem, R.M. Evaluating the Impacts of Phragmites australis Pretreatment Methods on Biogas and Methane. MJUR 2017, 7, 244–259. [Google Scholar]
  104. Motte, J.-C.; Escudié, R.; Hamelin, J.; Steyer, J.-P.; Bernet, N.; Delgenes, J.-P.; Dumas, C. Substrate Milling Pretreatment as a Key Parameter for Solid-State Anaerobic Digestion Optimization. Bioresour. Technol. 2014, 173, 185–192. [Google Scholar] [CrossRef]
  105. Wahid, R.; Hjorth, M.; Kristensen, S.; Møller, H.B. Extrusion as Pretreatment for Boosting Methane Production: Effect of Screw Configurations. Energy Fuels 2015, 29, 4030–4037. [Google Scholar] [CrossRef]
  106. Shah, T.A.; Tabassum, R. Enhancing Biogas Production from Lime Soaked Corn Cob Residue. Int. J. Renew. Energy Res. 2018, 8, 761–766. [Google Scholar]
  107. Amnuaycheewa, P.; Hengaroonprasan, R.; Rattanaporn, K.; Kirdponpattara, S.; Cheenkachorn, K.; Sriariyanun, M. Enhancing Enzymatic Hydrolysis and Biogas Production from Rice Straw by Pretreatment with Organic Acids. Ind. Crops Prod. 2016, 87, 247–254. [Google Scholar] [CrossRef]
  108. Czatzkowska, M.; Harnisz, M.; Korzeniewska, E.; Koniuszewska, I. Inhibitors of the Methane Fermentation Process with Particular Emphasis on the Microbiological Aspect: A Review. Energy Sci. Eng. 2020, 8, 1880–1897. [Google Scholar] [CrossRef] [Green Version]
  109. Chen, Y.; Cheng, J.J.; Creamer, K.S. Inhibition of Anaerobic Digestion Process: A Review. Bioresour. Technol. 2008, 99, 4044–4064. [Google Scholar] [CrossRef] [PubMed]
  110. Fortuny, M.; Baeza, J.A.; Gamisans, X.; Casas, C.; Lafuente, J.; Deshusses, M.A.; Gabriel, D. Biological Sweetening of Energy Gases Mimics in Biotrickling Filters. Chemosphere 2008, 71, 10–17. [Google Scholar] [CrossRef] [PubMed]
  111. Mamun, M.R.A.; Torii, S. Removal of Hydrogen Sulfide (H₂S) from Biogas Using Zero-Valent Iron. J. Clean Energy Technol. 2015, 3, 428–432. [Google Scholar] [CrossRef] [Green Version]
  112. Calbry-Muzyka, A.; Madi, H.; Rüsch-Pfund, F.; Gandiglio, M.; Biollaz, S. Biogas Composition from Agricultural Sources and Organic Fraction of Municipal Solid Waste. Renew. Energy 2022, 181, 1000–1007. [Google Scholar] [CrossRef]
  113. Żarczyński, A.; Rosiak, K.; Anielak, P.; Wolf, W. Practical Methods of Cleaning Biogas from Hydrogen Sulphide. Part 1. Application of Solid Sorbents. Acta Innov. 2014, 12, 24–34. [Google Scholar]
  114. Aita, B.C.; Mayer, F.D.; Muratt, D.T.; Brondani, M.; Pujol, S.B.; Denardi, L.B.; Hoffmann, R.; da Silveira, D.D. Biofiltration of H2S-Rich Biogas Using Acidithiobacillus thiooxidans. Clean. Techn. Environ. Policy 2016, 18, 689–703. [Google Scholar] [CrossRef]
  115. Jung, H.; Kim, D.; Choi, H.; Lee, C. A Review of Technologies for In-Situ Sulfide Control in Anaerobic Digestion. Renew. Sust. Energy Rev. 2022, 157, 112068. [Google Scholar] [CrossRef]
  116. Moreno-Andrade, I.; Moreno, G.; Quijano, G. Theoretical Framework for the Estimation of H2S Concentration in Biogas Produced from Complex Sulfur-Rich Substrates. Environ. Sci. Pollut. Res. 2020, 27, 15959–15966. [Google Scholar] [CrossRef]
  117. Farghali, M.; Andriamanohiarisoamanana, F.J.; Ahmed, M.M.; Kotb, S.; Yamamoto, Y.; Iwasaki, M.; Yamashiro, T.; Umetsu, K. Prospects for Biogas Production and H2S Control from the Anaerobic Digestion of Cattle Manure: The Influence of Microscale Waste Iron Powder and Iron Oxide Nanoparticles. Waste Manag. 2020, 101, 141–149. [Google Scholar] [CrossRef]
  118. Arias, D.E.; Veluchamy, C.; Habash, M.B.; Gilroyed, B.H. Biogas Production, Waste Stabilization Efficiency, and Hygienization Potential of a Mesophilic Anaerobic Plug Flow Reactor Processing Swine Manure and Corn Stover. J. Environ. Manag. 2021, 284, 112027. [Google Scholar] [CrossRef]
  119. Tahir, M.S.; Shahzad, K.; Shahid, Z.; Sagir, M.; Rehan, M.; Nizami, A. Producing Methane Enriched Biogas Using Solvent Absorption Method. Chem. Eng. Trans. 2015, 45, 1309–1314. [Google Scholar] [CrossRef]
  120. Herout, M.; Malaťák, J.; Kučera, L.; Dlabaja, T. Biogas Composition Depending on the Type of Plant Biomass Used. Res. Agric. Eng. 2011, 57, 137–143. [Google Scholar] [CrossRef] [Green Version]
  121. Hutňan, M. Maize Silage as Substrate for Biogas Production. In Advances in Silage Production and Utilization; da Silva, T., Santos, E.M., Eds.; IntechOpen: London, UK, 2016. [Google Scholar]
  122. Rajagopal, R.; Massé, D.I.; Singh, G. A Critical Review on Inhibition of Anaerobic Digestion Process by Excess Ammonia. Bioresour. Technol. 2013, 143, 632–641. [Google Scholar] [CrossRef]
  123. Theuerl, S.; Klang, J.; Prochnow, A. Process Disturbances in Agricultural Biogas Production—Causes, Mechanisms and Effects on the Biogas Microbiome: A Review. Energies 2019, 12, 365. [Google Scholar] [CrossRef] [Green Version]
  124. Krakat, N.; Demirel, B.; Anjum, R.; Dietz, D. Methods of Ammonia Removal in Anaerobic Digestion: A Review. Water Sci. Technol. 2017, 76, 1925–1938. [Google Scholar] [CrossRef] [PubMed]
  125. Fernandes, T.V.; Keesman, K.J.; Zeeman, G.; van Lier, J.B. Effect of Ammonia on the Anaerobic Hydrolysis of Cellulose and Tributyrin. Biomass Bioenergy 2012, 47, 316–323. [Google Scholar] [CrossRef]
  126. Statistics Poland. Energy Consumption in Households in 2018; Zakład Wydawnictw Statystycznych: Warsaw, Poland, 2019.
  127. Demko, J.; Machava, J.; Saniga, M. Energy Production Analysis of Common Reed—Phragmites australis (Cav.) Trin. Folia Oecologica 2017, 44, 107–113. [Google Scholar] [CrossRef] [Green Version]
  128. Dahms, T.; Oehmke, C.; Kowatsch, A.; Abel, S.; Wichmann, S.; Wichtmann, W.; Schröder, C. Halmgutartige Festbrennstoffe Aus Nassen Mooren, 1st ed.; Universität Greifswald, Greifswald Moor Centrum: Greifswald, Germany, 2017. (In German) [Google Scholar]
  129. Czubaszek, R.; Wysocka-Czubaszek, A.; Banaszuk, P. GHG Emissions and Efficiency of Energy Generation through Anaerobic Fermentation of Wetland Biomass. Energies 2020, 13, 6497. [Google Scholar] [CrossRef]
  130. Tanneberger, F.; Birr, F.; Couwenberg, J.; Kaiser, M.; Luthardt, V.; Nerger, M.; Pfister, S.; Oppermann, R.; Zeitz, J.; Beyer, C.; et al. Saving Soil Carbon, Greenhouse Gas Emissions, Biodiversity and the Economy: Paludiculture as Sustainable Land Use Option in German Fen Peatlands. Reg. Environ. Change 2022, 22, 69. [Google Scholar] [CrossRef]
  131. Hijazi, O.; Munro, S.; Zerhusen, B.; Effenberger, M. Review of Life Cycle Assessment for Biogas Production in Europe. Renew. Sust. Energy Rev. 2016, 54, 1291–1300. [Google Scholar] [CrossRef]
  132. Tonini, D.; Hamelin, L.; Alvarado-Morales, M.; Astrup, T.F. GHG Emission Factors for Bioelectricity, Biomethane, and Bioethanol Quantified for 24 Biomass Substrates with Consequential Life-Cycle Assessment. Bioresour. Technol. 2016, 208, 123–133. [Google Scholar] [CrossRef] [PubMed]
Figure 1. Variations of organics content for co-digestion of maize and reed silage under different combinations: (a) TS and (b) VS. MS—maize silage, 10 RS—maize silage with 10% content of reed silage, 30 RS—maize silage with 30% content of reed silage, 50 RS—maize silage with 50% content of reed silage and RS—reed silage.
Energies 16 00695 g001
Figure 2. Daily methane production from mono- and co-digestion of maize and reed silages. MS—maize silage, 10 RS—maize silage with 10% content of reed silage, 30 RS—maize silage with 30% content of reed silage, 50 RS—maize silage with 50% content of reed silage, and RS—reed silage. Standard errors are shown as vertical bars.
Energies 16 00695 g002
Figure 3. Cumulative methane production from mono- and co-digestion of maize and reed silages. MS—maize silage, 10 RS—maize silage with 10% content of reed silage, 30 RS—maize silage with 30% content of reed silage, 50 RS—maize silage with 50% content of reed silage, and RS—reed silage. The green squares and yellow diamonds mean T50 and T95, respectively. Standard errors are shown as vertical bars.
Energies 16 00695 g003
Figure 4. The concentration of (a) hydrogen sulfide (H2S) and (b) ammonia (NH3) in biogas produced from mono- and co-digestion of maize and reed silages. MS—maize silage, 10 RS—maize silage with 10% content of reed silage, 30 RS—maize silage with 30% content of reed silage, 50 RS—maize silage with 50% content of reed silage, and RS—reed silage. Standard errors are shown as vertical bars (where absent, bars fall within symbols).
Energies 16 00695 g004
Figure 5. Electricity (a) and heat (b) produced by MS and RS in the analyzed combinations. MS—maize silage, 10 RS—maize silage with 10% content of reed silage, 30 RS—maize silage with 30% content of reed silage, 50 RS—maize silage with 50% content of reed silage, and RS—reed silage.
Energies 16 00695 g005
Figure 6. The area required for maize and reed cultivation based on the example of a biogas plant with an installed electrical power of 100 kWel. MS—maize silage, 10 RS—maize silage with 10% content of reed silage, 30 RS—maize silage with 30% content of reed silage, 50 RS—maize silage with 50% content of reed silage.
Energies 16 00695 g006
Table 1. Chemical composition of feedstock and inoculum.
ParameterMaize SilageReed SilageInoculum
Total solids (TS), %31.66 ± 0.32 a *62.85 ± 0.99 b5.28 ± 0.03 c
Volatile solids (VS), %TS95.51 ± 0.53 a91.16 ± 0.27 b75.62 ± 0.02 c
Total Kjeldahl Nitrogen (TKN), g kgDM−113.88 ± 0.16 a14.60 ± 0.53 a94.50 ± 0.18 b
Total phosphorus (TP), g kgDM−11.98 ± 0.02 a1.26 ± 0.07 b8.29 ± 0.18 c
Total potassium (K), g kgDM−19.56 ± 0.20 a2.68 ± 0.16 b62.59 ± 1.15 c
Total organic carbon (TOC) g kgDM−1396.04 ± 5.45 a379.11 ± 7.81 b368.03 ± 5.61 b
C:N29:126:14:1
* Lowercase letters—statistical differences at p < 0.05 among silages and inoculum.
Table 2. Methane production and lag time of mono- and co-digestion of maize and reed silages.
FeedstockMethane ProductionMaximum Daily Methane ProductionLag Time
NL kgVS−1NL kgVS−1Days
MS241.42 ± 1.97 a *27.26 ± 1.09 a1.36 ± 0.06 a
10 RS208.92 ± 4.91 b19.69 ± 2.02 b1.03 ± 0.06 b
30 RS173.87 ± 2.26 c14.39 ± 0.72 c0.99 ± 0.15 b
50 RS155.18 ± 4.59 d11.24 ± 0.43 d0.38 ± 0.07 c
RS135.22 ± 3.42 e5.54 ± 0.40 e2.23 ± 0.10 d
* Lowercase letters—statistical differences at p < 0.05 among co-digested combinations and mono-digested silages. MS—maize silage, 10 RS—maize silage with 10% content of reed silage, 30 RS—maize silage with 30% content of reed silage, 50 RS—maize silage with 50% content of reed silage, and RS–reed silage.
Table 3. Electricity and heat generation from biogas produced by mono- and co-digestion of maize and reed silages.
FeedstockElectricity GenerationHeat Generation
kWh tDM−1kWh tFM−1GJ tDM−1GJ tFM−1
MS7312312.290.73
10 RS6302191.970.69
30 RS5192131.630.67
50 RS4592171.440.68
RS3912461.220.77
MS—maize silage, 10 RS—maize silage with 10% content of reed silage, 30 RS—maize silage with 30% content of reed silage, 50 RS—maize silage with 50% content of reed silage, and RS—reed silage.
Table 4. Combustion heat and calorific values of reed related to the dry weight, fresh weight, and moisture required for the biomass furnace.
Combustion Heat
HHV
Calorific Value
LHV
Calorific Value *
LHV
Calorific Value **
LHV
Ash
GJ tDM−1GJ tDM−1GJ tFM−1GJ tOM−1%
18.250 ± 0.07916.903 ± 0.0799.716 ± 0.0513.034 ± 0.0507.38 ± 0.08
* calorific value of reed with moisture of 37.15%. ** calorific value of reed with the moisture of 20% (average biomass moisture required for a furnace burning biomass).
Table 5. Heat generation from reed direct incineration and biogas produced from reed.
Share of Reed Silage in Co-Digested Combinations of Reed and Maize SilagesElectric Power Installed in a Biogas Plant (kWel)
501002005001000
BBPBBPBBPBBPBBP
GJ
10%16772333544567099016,77222633,544452
30%517417210,34834520,69568951,7381723103,4763446
50%846441516,92883133,857166284,6414154169,2838308
B—the burning of biomass, BP—heat production in a biogas plant.
Table 6. The area required for the cultivation of maize and reed depending on the studied maize and reed silage combinations and the electric power installed in the biogas plant.
FeedstockElectric Power Installed in a Biogas Plant (kWel)
501002005001000
Area Required for Maize and Reed Cultivation (ha)
MaizeReedMaizeReedMaizeReedMaizeReedMaizeReed
MS39 79 157 394 787
10 RS3713752715053374133749267
30 RS30416082120164299411599822
50 RS216742135842692106734201345
MS—maize silage, 10 RS—maize silage with 10% content of reed silage, 30 RS—maize silage with 30% content of reed silage, 50 RS—maize silage with 50% content of reed silage, and RS—reed silage.
Table 7. CO2 eq. emissions avoided by reducing the area for maize cultivation.
FeedstockElectric Power Installed in a Biogas Plant (kWel)
501002005001000
t CO2 eq.
10 RS6.4512.8925.7864.46128.92
30 RS31.5263.04126.07315.19630.37
50 RS61.45122.90245.80614.491228.98
10 RS—maize silage with 10% content of reed silage, 30 RS—maize silage with 30% content of reed silage, and 50 RS—maize silage with 50% content of reed silage.
Table 8. CO2 emissions avoided by using reed as a co-substrate in a biogas plant.
Share of Reed Silage in Co-Digested Combinations of Reed and Maize SilagesElectric Power Installed in a Biogas Plant (kWel)
501002005001000
EHEHEHEHEH
t CO2
10%27.811.755.623.4111.346.7278.2116.8556.4233.5
30%83.535.0166.970.1333.9140.11391.0350.31669.3700.6
50%139.158.4278.2116.8556.4233.51391.0583.82782.11167.7
E—electricity production, H—heat production.
Table 9. The number of residences with an area of 100 m2 supplied with electricity and heat depending on the size of the biogas plant.
Electric Power Installed in a Biogas PlantElectricity GenerationHeat Generation
kWelNumber of residences with an area of 100 m2
5014616
10029232
20058465
5001459162
10002918324
Table 10. The number of residences supplied with energy generated only from RS used as co-substrate depending on the size of a biogas plant.
Share of Reed Silage in Co-Digested Combinations of Reed and Maize SilagesElectric Power Installed in a Biogas Plant (kWel)
501002005001000
EHEHEHEHEH
Number of Residences with an Area of 100 m2
10%103161153296
30%1322645391312226345
50%36573111462236554729108
E—electricity production, H—heat production.
Table 11. The number of households supplied with heat from the incineration of reed biomass harvested from the area which should be harvested to supply biogas plants of various electric power installed and operating on different combinations of maize and reed silages.
Share of Reed Silage in Co-Digested Combinations of Reed and Maize SilagesElectric Power Installed in a Biogas Plant (kWel)
501002005001000
10%224487218436
30%671342696721344
50%11022044010992198
100%19438877719423885
20% of biomass moisture was assumed for calculation.
Disclaimer/Publisher’s Note: The statements, opinions and data contained in all publications are solely those of the individual author(s) and contributor(s) and not of MDPI and/or the editor(s). MDPI and/or the editor(s) disclaim responsibility for any injury to people or property resulting from any ideas, methods, instructions or products referred to in the content.

