Article

Research on the Influence of Ripple Voltage on the Performance of a Proton Exchange Membrane Electrolyzer

1
School of Energy and Power Engineering, Inner Mongolia University of Technology, 010051 Hohhot, China
2
Baotou Power Supply Company of Inner Mongolia Electric Power (Group) Co., Ltd., 014000 Baotou, China
*
Author to whom correspondence should be addressed.
Energies 2023, 16(19), 6912; https://doi.org/10.3390/en16196912
Submission received: 15 August 2023 / Revised: 25 September 2023 / Accepted: 27 September 2023 / Published: 30 September 2023
(This article belongs to the Special Issue Hydrogen and Fuel Cell Technology, Modelling and Simulation II)

Abstract

:
The power quality of hydrogen production converters is related to the characteristics of electrolytic hydrogen production, which is crucial to efficiency, power loss and other performance factors of hydrogen production. In order to explore the influence of the output voltage ripple of a hydrogen production converter on the hydrogen production performance of a proton exchange membrane electrolyzer, a proton exchange membrane electrolyzer model was established according to the principles of material conservation and electrochemistry. The performance characteristics of the proton exchange membrane electrolyzer and the effects of three kinds of ripple voltage with different frequencies and amplitudes on the hydrogen production efficiency and power consumption of the proton exchange membrane electrolyzer were explored. The effects of the three kinds of ripple were consistent. For example, when the ripple coefficient of the sinusoidal ripple voltage was increased by 45%, the average power consumption increased by 61%. When the ripple coefficient was constant, the frequency increased by 1000%, and the average power consumption increased by only 0.033%. In the range of low ripple coefficient (0~35%), the hydrogen production rate was reduced by 2% at most. When the ripple coefficient was in the range of 35~70%, the hydrogen production rate was reduced by 12% at most. The results showed that the ripple coefficient had a greater impact on the power consumption and hydrogen production rate of the electrolyzer, but the frequency was smaller. Among the three kinds of ripple, the triangular wave had the least influence on the power consumption and hydrogen production rate of the electrolytic cell. This study provides reference and theoretical support for the subsequent engineering application, precise control and dynamic characteristics of proton exchange membrane electrolyzer.

1. Introduction

Wind power and photovoltaic technology are currently developing rapidly, but they are very volatile and unpredictable, and storage is difficult. Hydrogen production using electrolytic cells is an ideal way to realize the storage, transportation and conversion of wind power and photovoltaic energy [1]. At present, there are three mainstream electrolyzer technologies: alkaline electrolyzers, proton exchange membrane electrolyzers and solid oxide electrolyzers [2]. Proton exchange membrane electrolyzers have many advantages, such as high current density, low ohmic loss and fast system response [3,4]. Many experts believe that the proton exchange membrane electrolyzer will develop into the mainstream electrolyzer technology [5]. Wind power and photovoltaic power need to be connected to the electrolytic cell through the converter, and the voltage converted by the converter often contains ripples [6]. The ripple voltage of the electrolytic cell is an important parameter affecting the performance of the electrolytic cell, but there are few studies on its influence. The study [7] analyzes the advantages and disadvantages of four methods types proton exchange membrane electrolyzer (PEMEL), namely mechanism modeling, semi-empirical modeling, empirical modeling, and data-driven modeling, as well as the applicability of the models, and puts forward the key research direction of PEMEL model construction and predicts its future development trend. The study [8] reviewed the modeling work on PEMEL internal mass transfer, classified and analyzed the low-temperature electrolysis model, summarized the research progress of PEMEL mass transfer model based on analytical methods, semi-empirical methods and thermodynamic methods, and carried out in-depth research on the physical quantity, mass transfer mode and modeling method when building the model. Reference [9] used simultaneous equation modeling technology to simulate the process of hydrogen production in a proton exchange membrane electrolyzer, and studied the variations in the voltage, power and efficiency of a hydrogen production system with current density under different temperatures, operating pressures and proton membrane thickness, as well as other influencing factors. In reference [10], the PEMEL simulation model was established using COMSOL multiphysics software, and the multi-physical fields of chemical reaction, heat and mass transfer and current distribution were coupled and analyzed. The paper [11] summarizes the results of research on PEMEL electrocatalysts, focusing on the electrocatalytic activity and stability of high-performance, low-cost hydrogen evolution reaction (HER) and oxygen evolution reaction (OER) electrocatalysts under high current density. In reference [12], a semi-empirical battery model was used to study the influence of power quality on the energy consumption of PEM electrolyzers. The results show that higher power quality can reduce the energy consumption of water electrolysis. Ni et al. analyzed the energy of the PEM electrolysis system coupled with a fluctuating power supply, and the results showed that increasing the operating temperature, reducing the current density, reducing the electrode thickness and improving the catalyst activity on the electrode can effectively improve the electrolysis efficiency [13]. The authors of [14] studied the influence of different types of power supply on the performance of alkaline electrolyzers. The results show that the electrolytic efficiency can be changed by using different power supply topologies and different output voltage and current waveforms. The study [15] studied the effect of pulse potential on energy consumption of alkaline water electrolysis, and the results show that specific and controllable pulse potential can have a positive impact on the alkaline electrolyzer. References [16,17,18] explore the influence of electrolyzer materials and hydrogen production methods on hydrogen production efficiency, and references [19,20,21] study the development of catalysts and methods of improving PEM electrolyzers.
The current literature mainly focuses on the improvement of the modeling method, materials and catalysts of the electrolytic cell, and less on the impact of power quality on its operation. However, the input voltage ripple of the electrolytic cell has an important impact on the hydrogen production efficiency and power consumption of the electrolytic cell. There has been some research on the influence of power quality on the performance of alkaline electrolyzers, but the literature shows that the influence of ripple power supply on different types of electrolyzers is not consistent.
To this end, this paper does the following work:
(1)
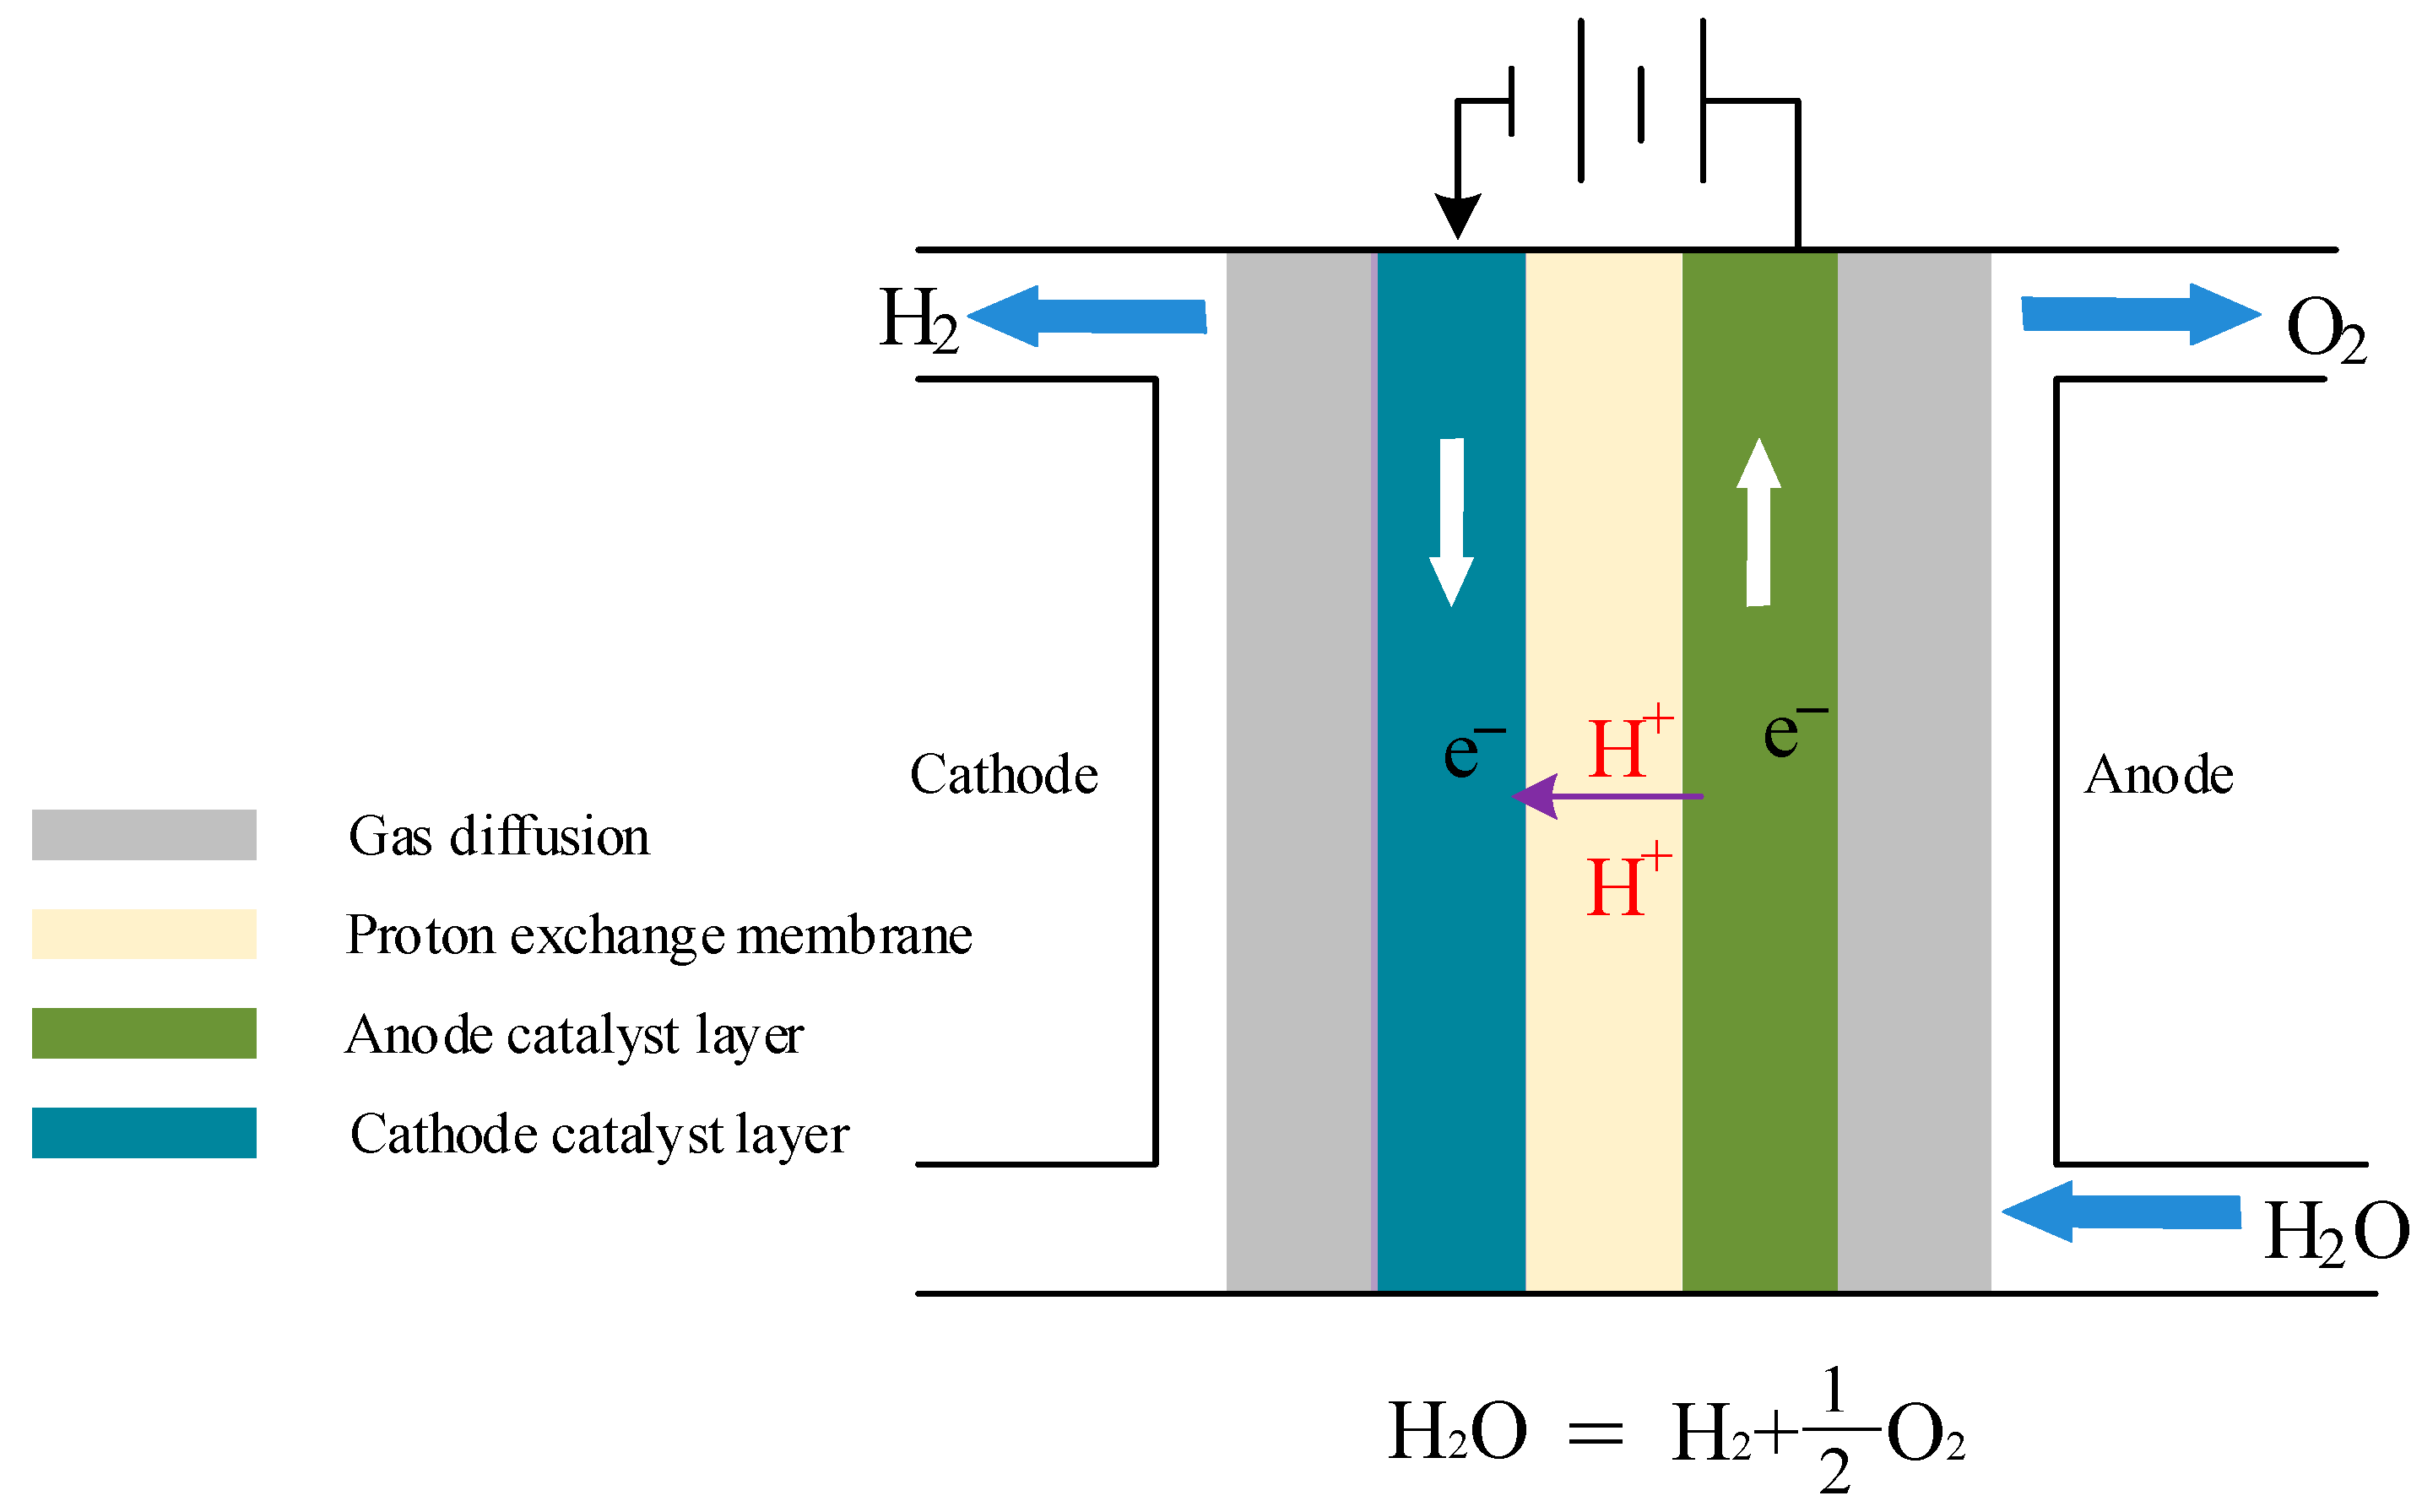
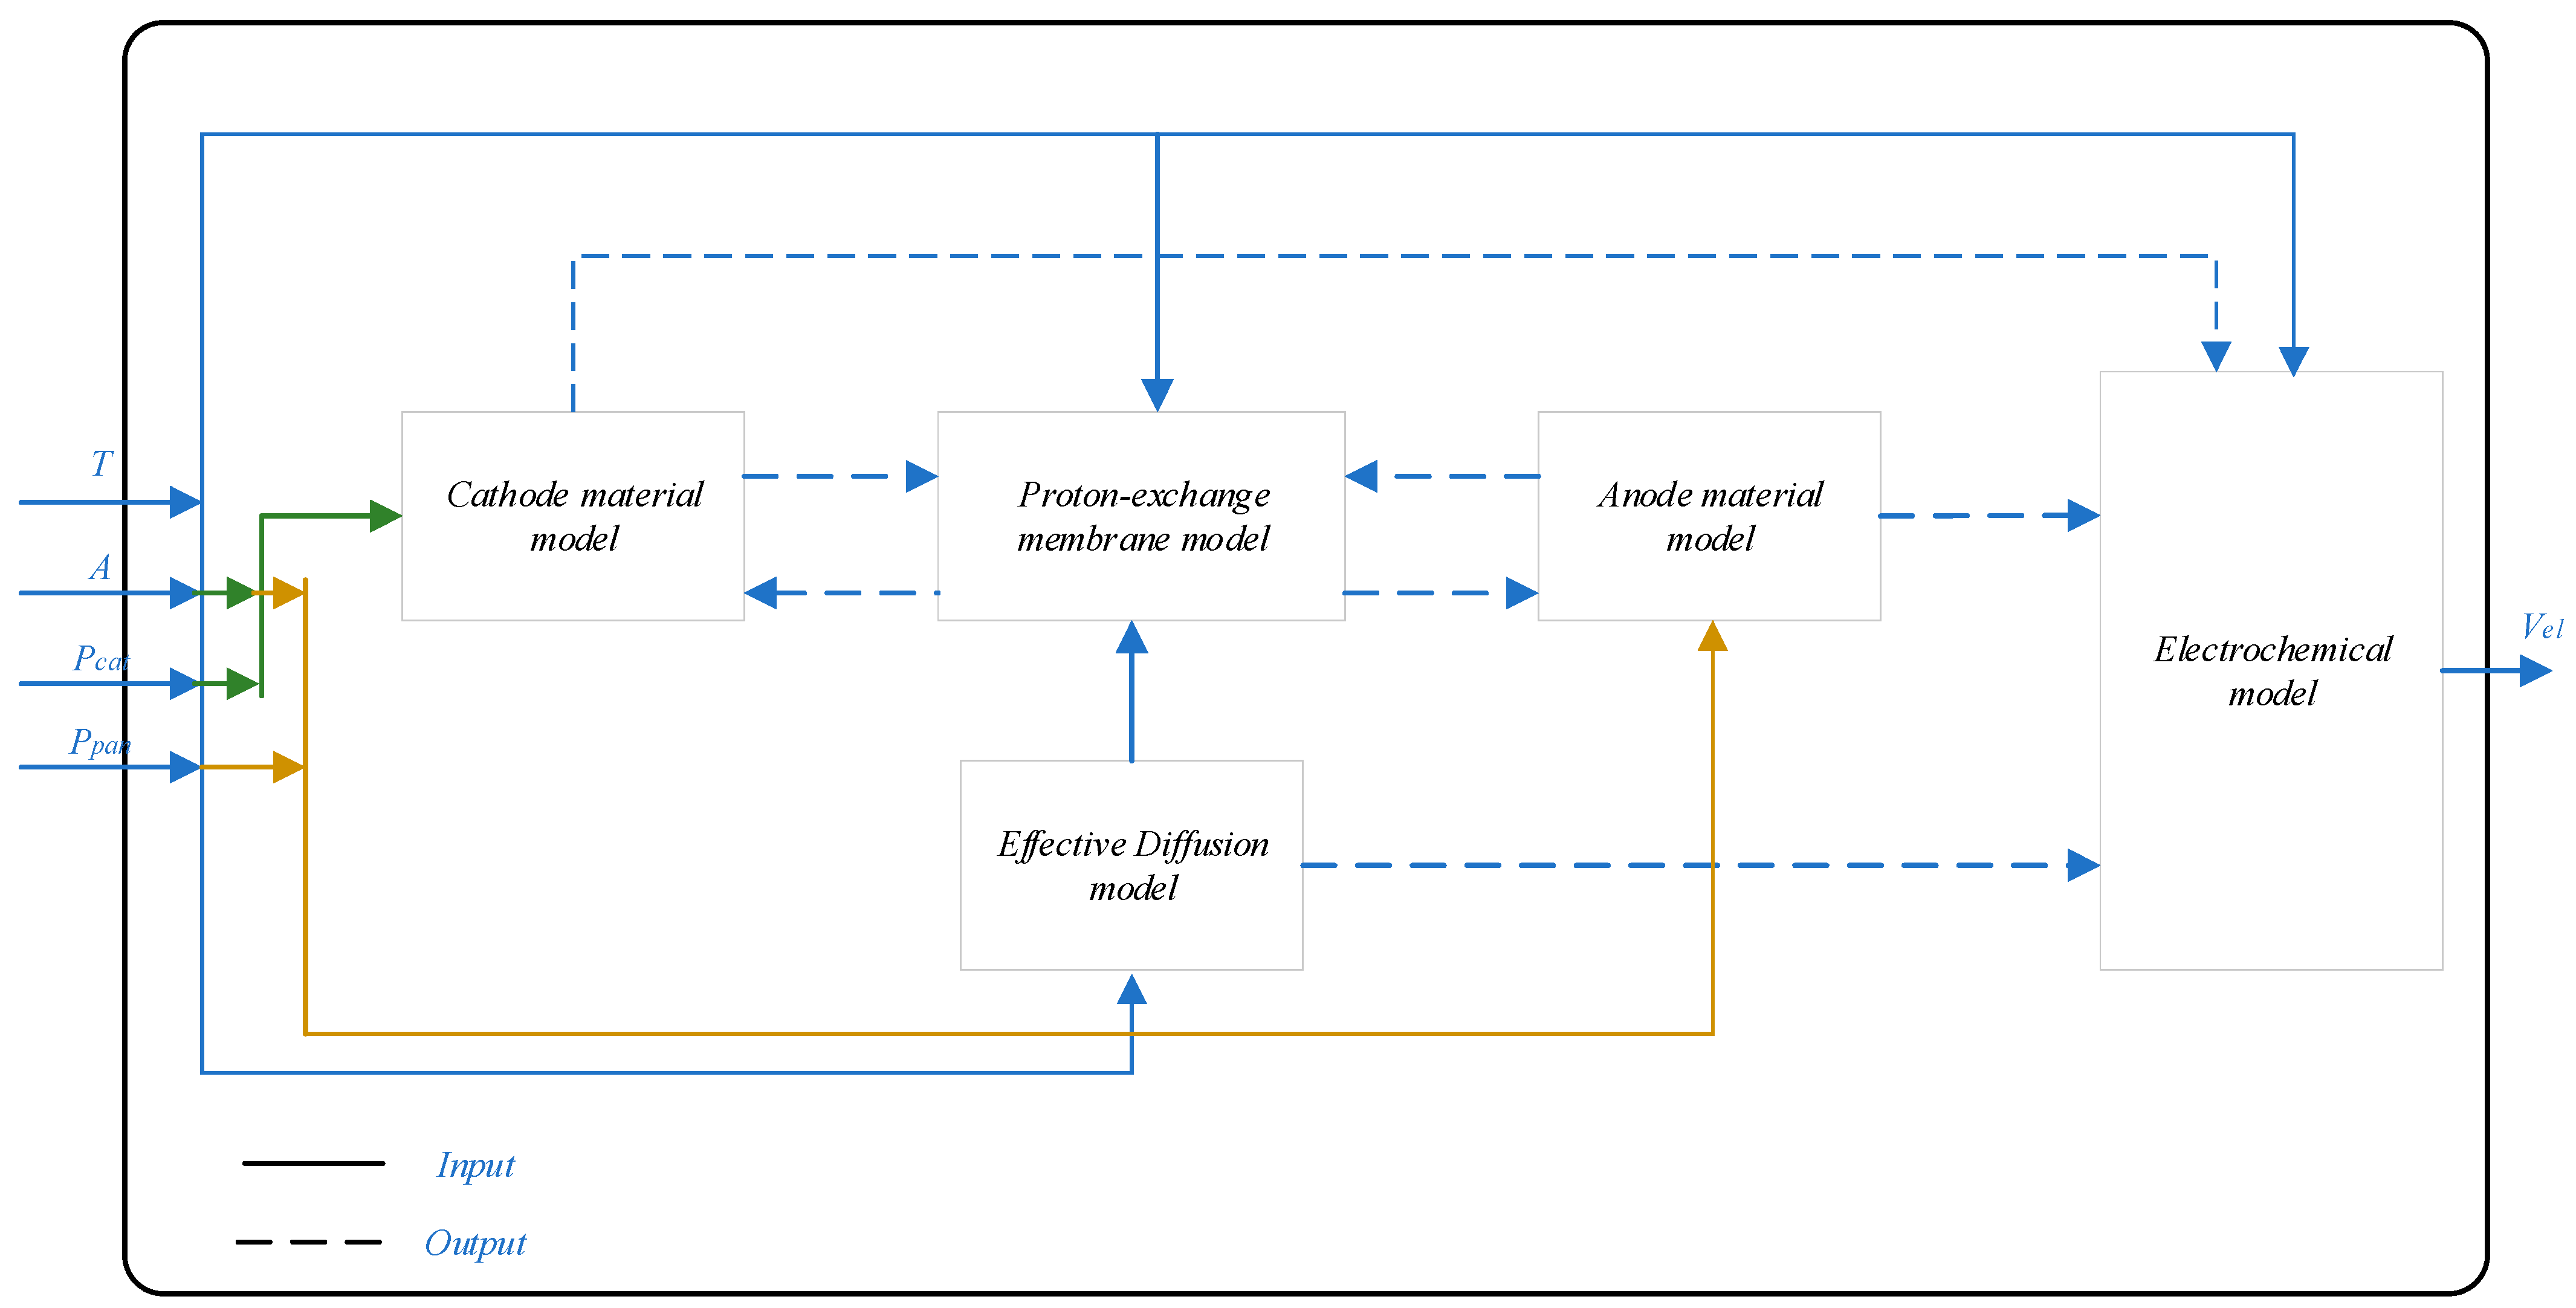
The hydrogen production mechanism of the proton exchange membrane electrolyzer is described, and a dynamic model of the proton exchange membrane electrolyzer was established according to the principles of electrochemistry and material conservation.
(2)
A simulation model of a proton exchange membrane electrolyzer was established in PSCAD/EMTDC, and its correctness and effectiveness were verified via simulation. The influence of relevant performance parameters on the terminal voltage of the electrolyzer was analyzed.
(3)
Based on the established model, the relationship between the ripple voltage and the performance of proton exchange membrane electrolyzers was interpreted, and the hydrogen production and power consumption performance of electrolyzers were analyzed by using three common forms of ripple voltage.

2. Introduction of Proton Exchange Membrane Electrolyzer

The electrolytic reaction principle of the proton exchange membrane electrolyzer is shown in Figure 1. The main components of the proton exchange membrane electrolyzer, from inside to outside, are the proton exchange membrane, anode and cathode catalytic layer, anode and cathode gas diffusion layer and anode and cathode plate. The diffusion layer, the catalytic layer and the proton exchange membrane form the membrane electrode, which is the main site for material transfer and the electrochemical reaction of the whole water electrolysis cell. The electrolytic reactant is deionized water. Liquid water enters from the anode and decomposes into H+, O2 and e. e is sent out through the external circuit for reaction. H+ reaches the cathode through the exchange membrane and forms H2 with e. The reaction equation is
Anode : H 2 O 2 H + + 1 2 O 2 + 2 e Cathode : 2 H + + 2 e H 2

3. Mathematical Model of Proton Exchange Membrane Electrolyzer

To facilitate modeling and analysis, the model is based on the following assumptions: This hypothesis was verified in reference [22], and the maximum relative error between the simulation model established based on this hypothesis and the measured data does not exceed 3%.
The reaction inside the electrolytic cell is carried out under isothermal conditions;
The reaction inside the electrolytic cell is carried out under isobaric conditions;
The ohmic resistance and exchange membrane resistance of the electrolytic cell are fixed values;
The friction loss of water and gas in the pipeline is 0.

3.1. Voltage Model

According to electrochemical theory, the cell voltage includes Nernst voltage and three kinds of polarization loss voltage: activation polarization voltage, ohmic polarization voltage and concentration polarization voltage.
The working voltage of the electrolytic cell is described in Equation (2) [23]:
V e l = V o c v + V a c t + V o h m + V c o n
In the above formula, Vocv, Vact, Vohm and Vcon are open circuit voltage, activation overvoltage, ohmic overvoltage and concentration difference overvoltage, respectively.
The open circuit voltage is obtained from Nernst equation:
V o c v = E 0 + R T 2 F ln p H 2 p O 2 α H 2 O
where PH2, PO2, R, T and αH2O are hydrogen, oxygen partial pressure, gas constant, cell temperature and water activity between electrode and membrane, respectively; E0 is the reversible voltage of the battery. Under standard conditions,
E 0 = 1.229 0.9 × 10 3 T 298
The activation polarization voltage Vact is generated by the polarization of the charge during the transfer process:
V a c t = R T α F ln i i 0
where i0 is the exchange current density, which has a great influence on the activation overvoltage, and its value is related to the electrode material, porosity, catalyst concentration and working temperature; i is current density; α is the transfer coefficient.
Ohmic polarization voltage Vohm is the ohmic loss voltage caused by proton exchange membrane resistance and electrolytic cell resistance, and its expression is
V o h m = R cell I = R el + R pl + R mem I = V ohm el + V ohm pl + V ohm mem
where Rcell is the effective ohmic resistance; Rel is the electrode resistance; Rpl is the resistance of flow field plate; Rmem is the membrane resistance; V ohm el , V ohm pl , V ohm mem is the corresponding ohmic voltage of the corresponding resistance.
V con = V con an + V con cat = R T 4 F ln C O 2 mem C O 2 , 0 mem + R T 2 F ln C H 2 mem C H 2 , 0 mem
where, C O 2 mem and C H 2 mem are the molar concentrations of oxygen and hydrogen at the membrane interface, respectively, and subscript 0 is the reference working condition, expressed by
C H 2 mem = p cat x H 2 R T δ el cat n H 2 D eff   cat C O 2   mem   = p an x O 2 R T + δ el an n O 2 D eff   an

3.2. Material Transport Model

With the electrolysis of water, material is transmitted in the electrolytic cell. Hydrogen is generated at the cathode of the electrolytic cell and oxygen is generated at the anode. The reaction process follows the law of conservation of matter and the law of conservation of charge. Water consumption in the electrolytic cell mainly includes water required for electrolytic reactions, electro-osmosis reactions and steam.
According to the law of conservation of charge, the molar flux of oxygen produced by the anode per unit time is [24]
n O 2 an = N ˙ O 2 gn   A = I 4 F A
The molar flux of hydrogen produced by the cathode per unit time is [17]
n H 2 cat = N ˙ H 2 gn   A = I 2 F A
where A is the effective membrane area of the membrane electrode assembly, I is the current of the electrolytic cell, and F is the Faraday constant.
According to the law of conservation of matter, the mass of water decomposed per unit time is
m ˙ D rag = M H 2 O   n ˙ H 2
where MH2O is the molar mass of water.
In unit time, the quality of water consumption caused by electro-osmosis effect is
m ˙ D rag = 2 D M H 2 O   n ˙ H 2
D is the movement coefficient of the electro-osmosis effect, and its value is 1.9 mol/(mol H+) [25].
The amount of water vapor leaving the electrolytic cell can be calculated, where the saturated vapor pressures of hydrogen and oxygen PH2-satt and PO2-satt are [26]
p H 2 - satt = a 4 T 4 S t a c k + a 3 T 3 S t a c k + a 2 T 2 S t a c k + a 1 T 1 S t a c k + a 0 p O 2 - satt = b 4 T 4 S t a c k + b 3 T 3 S t a c k + b 2 T 2 S t a c k + b 1 T 1 S t a c k + b 0
TStack is the temperature of the electrolytic cell, a4–a0 and b4–b0 are the saturated vapor pressure coefficients of hydrogen and oxygen, respectively.
The value of this coefficient is shown in the following Table 1:
The amount of water vapor leaving the electrolytic cell with hydrogen and oxygen in unit time is calculated with the following:
n ˙ V a p o r H 2 = P H 2 s a t t P K + 1 P H 2 s a t t n ˙ H 2 n ˙ V a p o r O 2 = P O 2 s a t t P A + 1 P O 2 s a t t n ˙ O 2
where PK is the cathode pressure and PA is the anode pressure.
It can be seen that the hydrogen production rate is the main influencing factor of water consumption rate in the electrolytic reaction and electro-smosis reaction, and the pressure and temperature of the electrolytic cell are the main influencing factors of the water vapor escape rate [27].

4. Performance Analysis of Proton Exchange Membrane Electrolyzer

In this section, we describe simulation modeling in PSCAD/EMTDC software according to the proton exchange membrane mathematical model in Section 1. The schematic diagram of the proton exchange membrane electrolyzer simulation model is shown in Figure 2. Through the temperature, membrane area, cathode, anode pressure and membrane diffusion coefficient, the gas partial pressure and the amount of substance were calculated. Finally, the working voltage of the electrolytic cell was calculated using the electrochemical equation.
The proton exchange membrane simulation model is shown in Figure 3.

4.1. PEMEL Properties

See Table 2 for the parameters of the simulation model of the proton exchange membrane electrolyzer:
The performance analysis of the proton exchange membrane electrolyzer is shown in Figure 4. It should be noted that, when studying the influence of the above influencing factors on the cell voltage, other variables should be kept unchanged. The initial parameters were anode pressure (Pan) = 60 bar; cathode pressure (Pcat) = 60 bar; temperature (T) = 313.15 K; exchange current density (i0) = 10−6.132 A/cm2. It can be seen from Figure 4 that, when the current density is 1.18 A/cm2, the lower voltage at a temperature of 314 K is 1.75 V, and the lower voltage at a temperature of 352 K is 1.65 V. This is the same trend as under a low current density. According to the experimental data, there is a correlation between the output voltage under different conditions, that is, the temperature is negatively correlated with the voltage at the end of the electrolytic cell. When the galvanic pile temperature increases, the ionic conductivity of the membrane increases, which accelerates the electrochemical reaction rate and reduces the polarization loss. This leads to a reduction in the power required for electrolysis, which in turn reduces the electrolyzer voltage.
When the current density is 1.18 A/cm2 and the exchange current density is 10−1.34 A/cm2, the terminal voltage is 1.4 V. When the exchange current density is 10−9.04 A/cm2, the terminal voltage is 1.57 V. This trend is the same under small current density. The exchange current density is negatively correlated with the voltage of the electrolytic cell. The exchange current density reflects the difficulty of electrode reaction. According to the principle of electrochemistry, a higher exchange current density means that, under a certain total current density, the required overpotential is small. The higher the exchange current density, the smaller the influence on the over potential, the weaker the polarization effect, the less the electric energy consumption, and the voltage of the electrolytic cell decreases.
When the current density is 1.18 A/cm2 and the cathode pressure is 11.5 bar, the terminal voltage is 1.67 V, and when the cathode pressure is 88.5 bar, the terminal voltage is 1.73 V. The trend is the same under low current density. When the current density is 1.18 A/cm2 and the anode pressure is 11.5 bar, the terminal voltage is 1.69 V, and when the anode pressure is 88.5 bar, the terminal voltage is 1.72 V. The trend is the same at low current density. Therefore, increasing the pressure of the anode or cathode can increase the external driving force between molecules, which is conducive to improving the working current density.
The trend of the results of exploring the performance of proton exchange membrane electrolyzers in this article is the same as that of reference [28], so the correctness of the simulation model established in this article can be verified.

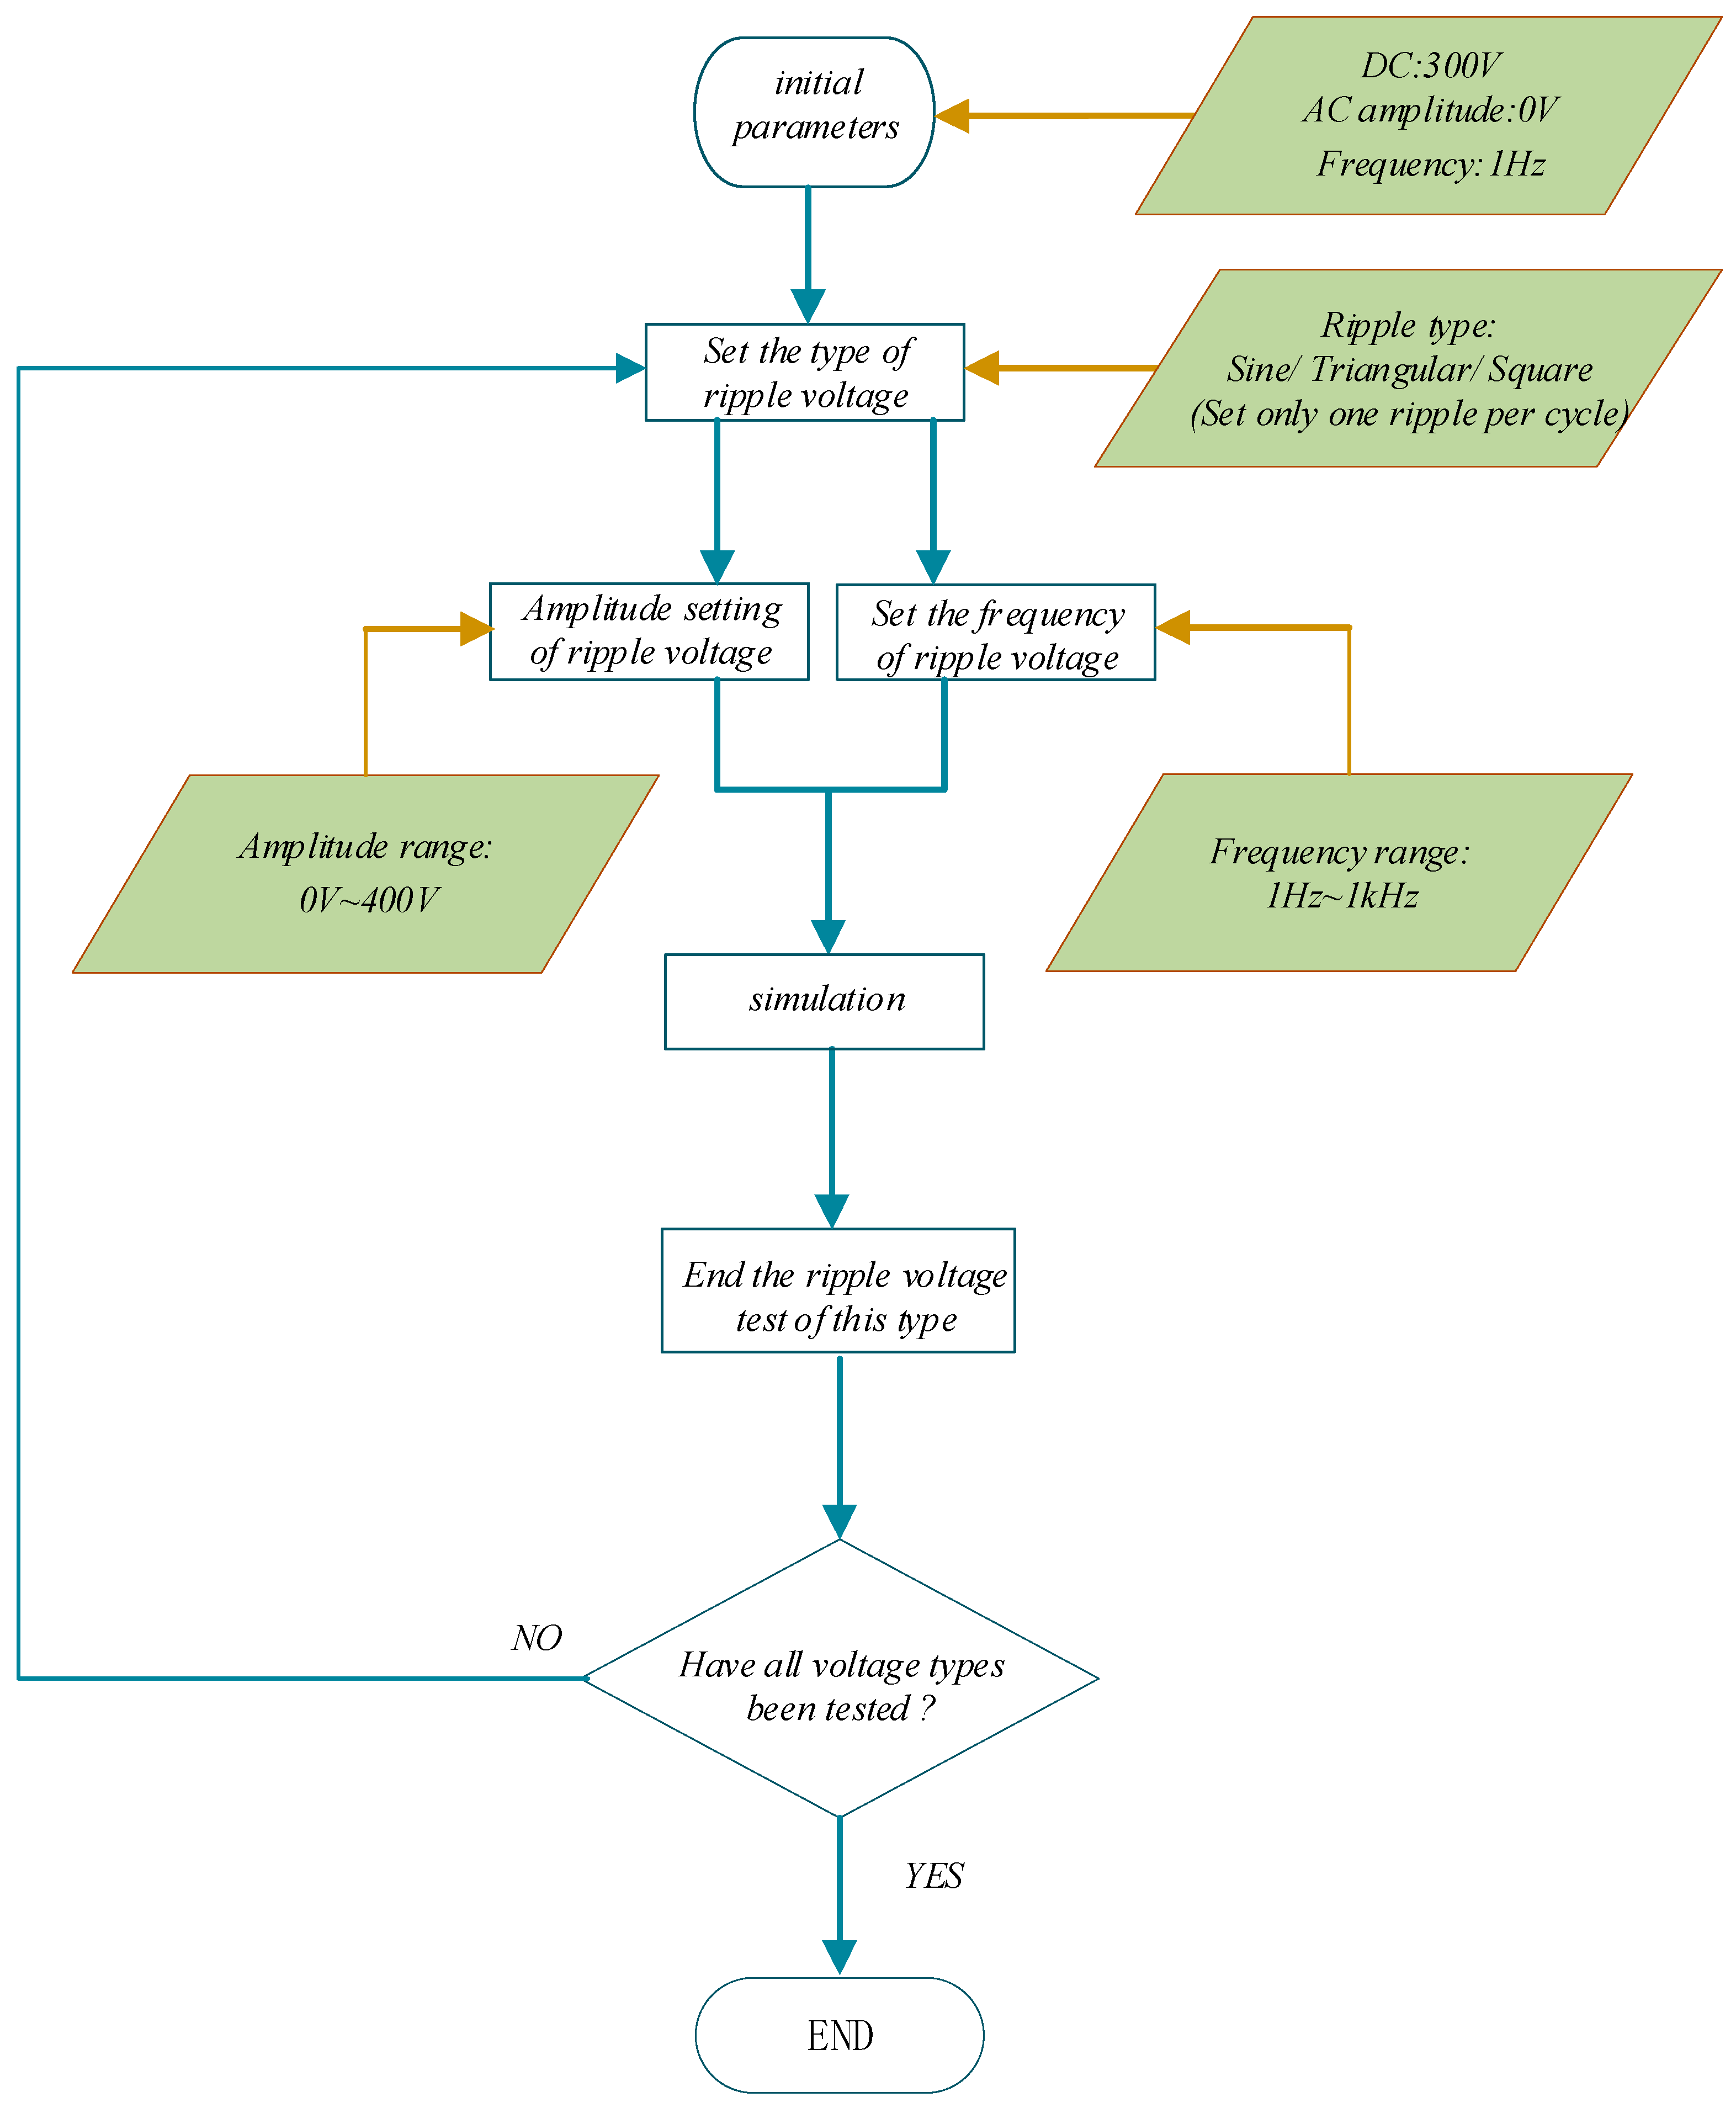
4.2. Ripple Voltage Effect

The frequent fluctuation of external DC voltage or current of the proton exchange membrane electrolyzer will affect the efficiency of the hydrogen production system. Usually, a rectifier and voltage stabilizing circuit are added in the control. In fact, there are ripples in the rectified output voltage. It is necessary to explore the impact of ripple current on the average power consumption and hydrogen production efficiency of the electrolyzer. In this paper, an experiment was designed to test the ripple voltage of the electrolyzer, and the three common ripple voltage scenarios of sine wave, square wave and triangle wave were studied. By changing the frequency and amplitude of the ripple voltage, the relationship between the hydrogen production rate and power consumption of the electrolyzer with different ripple voltages of the proton exchange membrane electrolyzer was simulated, and the influence of the ripple voltage on the electrolytic performance was analyzed. The experimental process of the effect of ripple voltage on the performance of proton exchange membrane electrolyzers is shown in Figure 5.
The initial amplitude of the ripple voltage was 0 V, and the DC voltage was 300 V. Changing the ripple amplitude changes the ripple factor, and then gradually increases the frequency from 1 Hz to 1000 Hz. The ripple amplitude increases from 0 V and does not exceed 400 V. The experiment was carried out at T = 313.5 K.
The applied ripple voltage is
V = V d c + v
where Vdc is a constant DC voltage and v is a time-varying AC component.
The ripple coefficient can be calculated using the following formula:
r = 100 v r m s V d c
where vrms is the root mean square value of the AC component, i.e.,
v r m s = 1 T 0 T v 2 t d t
The average power consumption is calculated using
P av = 0 T U I d t
where T is the period of the waveform used, and U and I are the measured voltage and current, respectively.
The relationship between average power consumption and frequency and ripple coefficient under sine wave, triangular wave and square wave ripple voltages is shown in Figure 6, in turn.
Figure 6 shows that, under a sine wave, when the ripple coefficient was 40%, the average power consumption was 153.69 W at 25 Hz, and 153.74 W at 1000 Hz. Under a triangular wave, when the ripple coefficient was 40%, the average power consumption was 153.65 W at 25 Hz, and 153.67 W at 1000 Hz. Under a square wave, when the ripple coefficient was 40%, the average power consumption was 153.94 W at a frequency of 25 Hz, and 154.03 W at a frequency of 1000 Hz. As the ripple becomes smaller, the trend stays the same.
Under the three kinds of ripple voltages, the average power consumption had the same relationship with frequency and ripple coefficient. At low ripple coefficients, the change in average power consumption was relatively slow. However, when the ripple coefficient exceeded 15%, the average power consumption increased significantly with the increase in ripple coefficient. The increase in ripple coefficient led to an increase in average power consumption, and an increase in frequency also increased the average power consumption.
At the same frequency, the increase in ripple coefficient had a more significant effect on the proton exchange membrane electrolyzer. Taking sinusoidal ripple voltage as an example, when the ripple coefficient was increased by 45%, the average power consumption increased by 61%. When the ripple coefficient is constant, the frequency increased by 1000%, and the average power consumption increased by only 0.033%. In addition, among the three kinds of ripple voltages, the average power consumption of the square wave was the highest, followed by the sine wave, and the triangular wave was the lowest. This is because, under the condition of the same ripple coefficient and frequency, the waveform area of the square wave is larger and its integral value is larger.
This means that excessive ripple will lead to an increase in equipment heating and power consumption, and may affect the stability of the equipment. Therefore, in the application of proton exchange membrane electrolyzers, attention should be paid to controlling the ripple coefficient to below 15%, eliminating excessive ripple amplitude and minimizing the ripple area. The ripple frequency has a relatively small impact on power consumption, and can be considered as a secondary factor.
The relationship between hydrogen production rate and frequency and ripple coefficient under sine wave, triangular wave and square wave voltage is shown in Figure 7.
Figure 7 shows that, under a sine wave, when the ripple coefficient was 58%, the hydrogen production rate was 86.19% at 20 Hz, and 87.19% at 1000 Hz. Under a triangular wave, when the ripple coefficient was 58%, the hydrogen production rate was 89.91% at 20 Hz and 90.34% at 1000 Hz. Under a square wave, when the ripple coefficient was 58%, the hydrogen production rate was 78.24% at 20 Hz and 78.42% at 1000 Hz. As the ripple becomes smaller, the trend stays the same.
The trend in variation in hydrogen production rate caused by the three ripple voltages was consistent. With a decrease in ripple coefficient, the hydrogen production rate decreased significantly. In the range of low ripple coefficient (0~35%), the hydrogen production rate did not decrease significantly. Under the three kinds of ripple voltage, the hydrogen production rate decreased by 2% at most.
When the ripple coefficient was in the range of 35~70%, the hydrogen production rate decreased significantly with the decrease in ripple coefficient. At this stage, the hydrogen production rate can be reduced by up to 12%. This is because the larger ripple causes more energy loss, and the proportion of effective electric energy used for hydrogen production is reduced, thus reducing the Faraday efficiency.
In cases with low frequency, the decline curve of hydrogen production rate with ripple coefficient was not smooth, and presented the phenomenon of repeated twists and turns. This is because, when the frequency is low, the waveform fluctuates obviously, so although the ripple coefficient increases linearly, the hydrogen production rate changes with the amplitude fluctuation. When the frequency is high, the waveform tends to be smoother and the hydrogen production rate curve is smoother.
It is obvious from the figure that the hydrogen production rate at higher frequencies is higher than that at the same ripple coefficient, regardless of the ripple coefficient. However, in general, the effect of ripple coefficient on hydrogen production rate is more significant, while the effect of frequency is weaker.
Therefore, the ripple coefficient should be controlled to within 35% in the engineering application of the proton exchange membrane electrolyzer. The first consideration is the influence of ripple amplitude, and the second is the influence of frequency on the smoothness of the macro waveform. If the ripple coefficient is large and the frequency is low, an increase in frequency should be considered to improve the overall smoothness of the voltage waveform.

5. Conclusions

In this paper, the mathematical model and simulation model of the proton exchange membrane electrolyzer were established, and the performance characteristics of the proton exchange membrane electrolyzer and the influence of ripple voltage on the proton exchange membrane electrolyzer were explored.
(1)
The established mathematical model and simulation model of the proton exchange membrane electrolyzer are correct and can be used for reference in subsequent research.
(2)
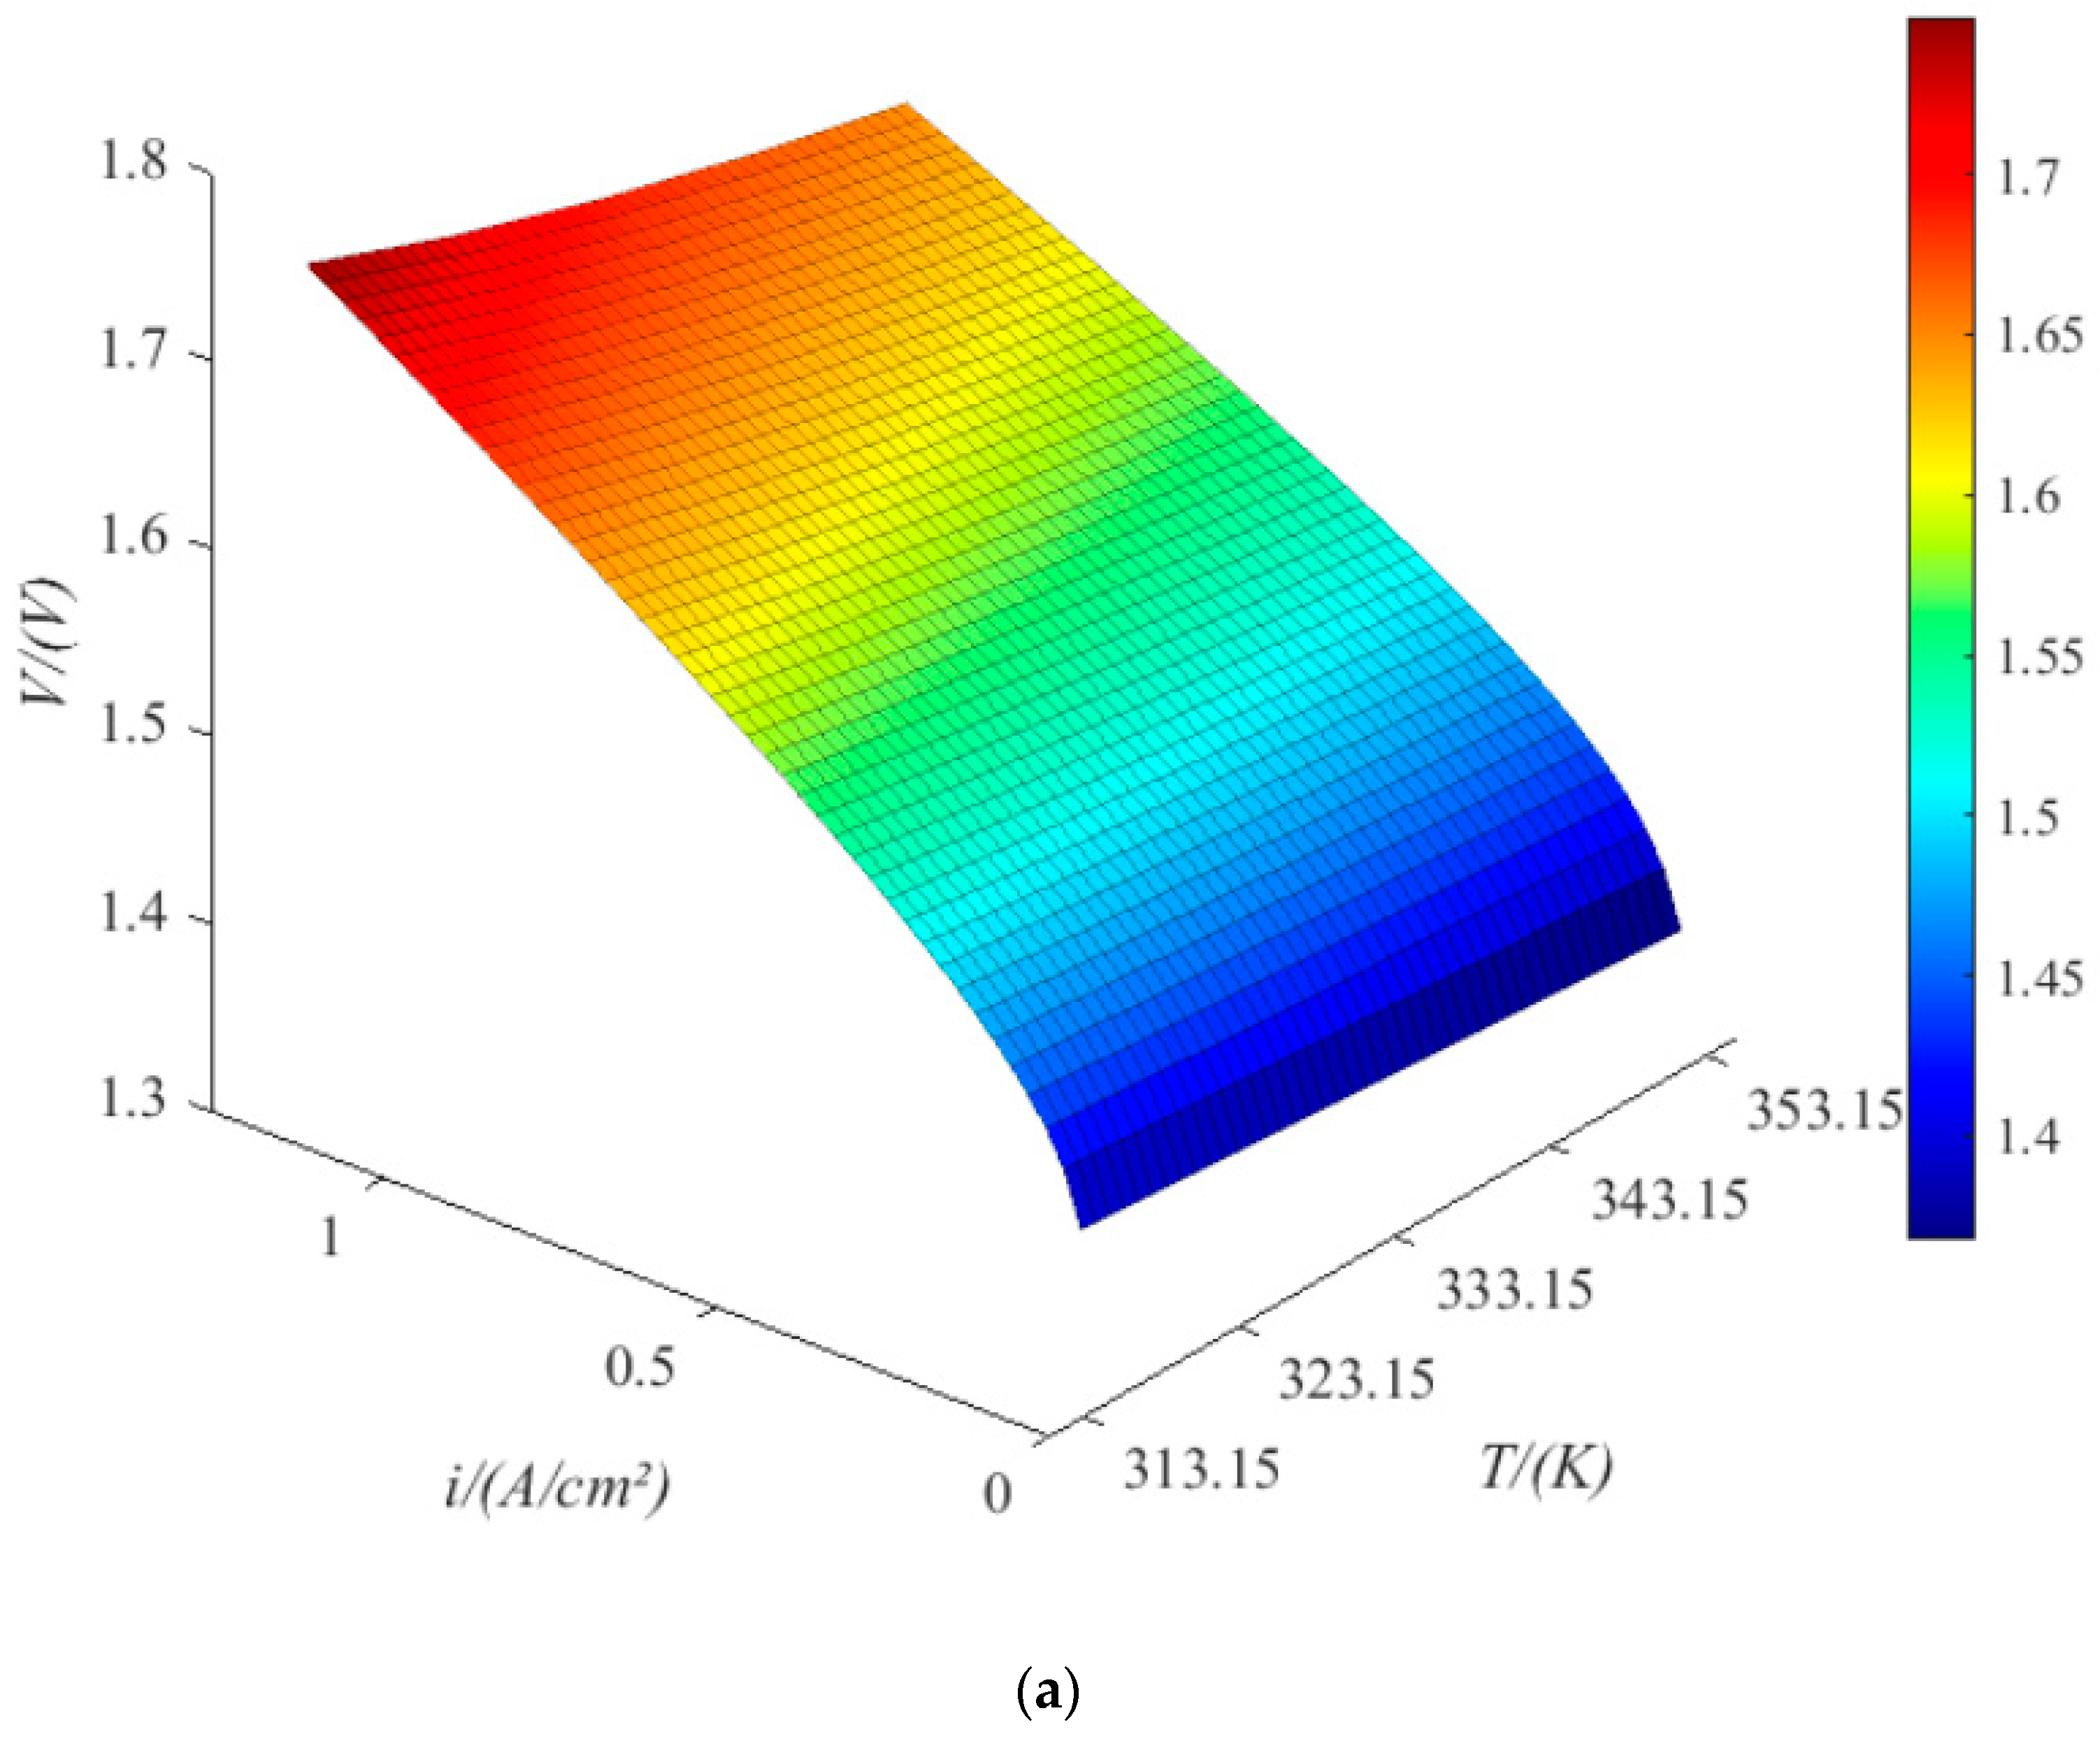
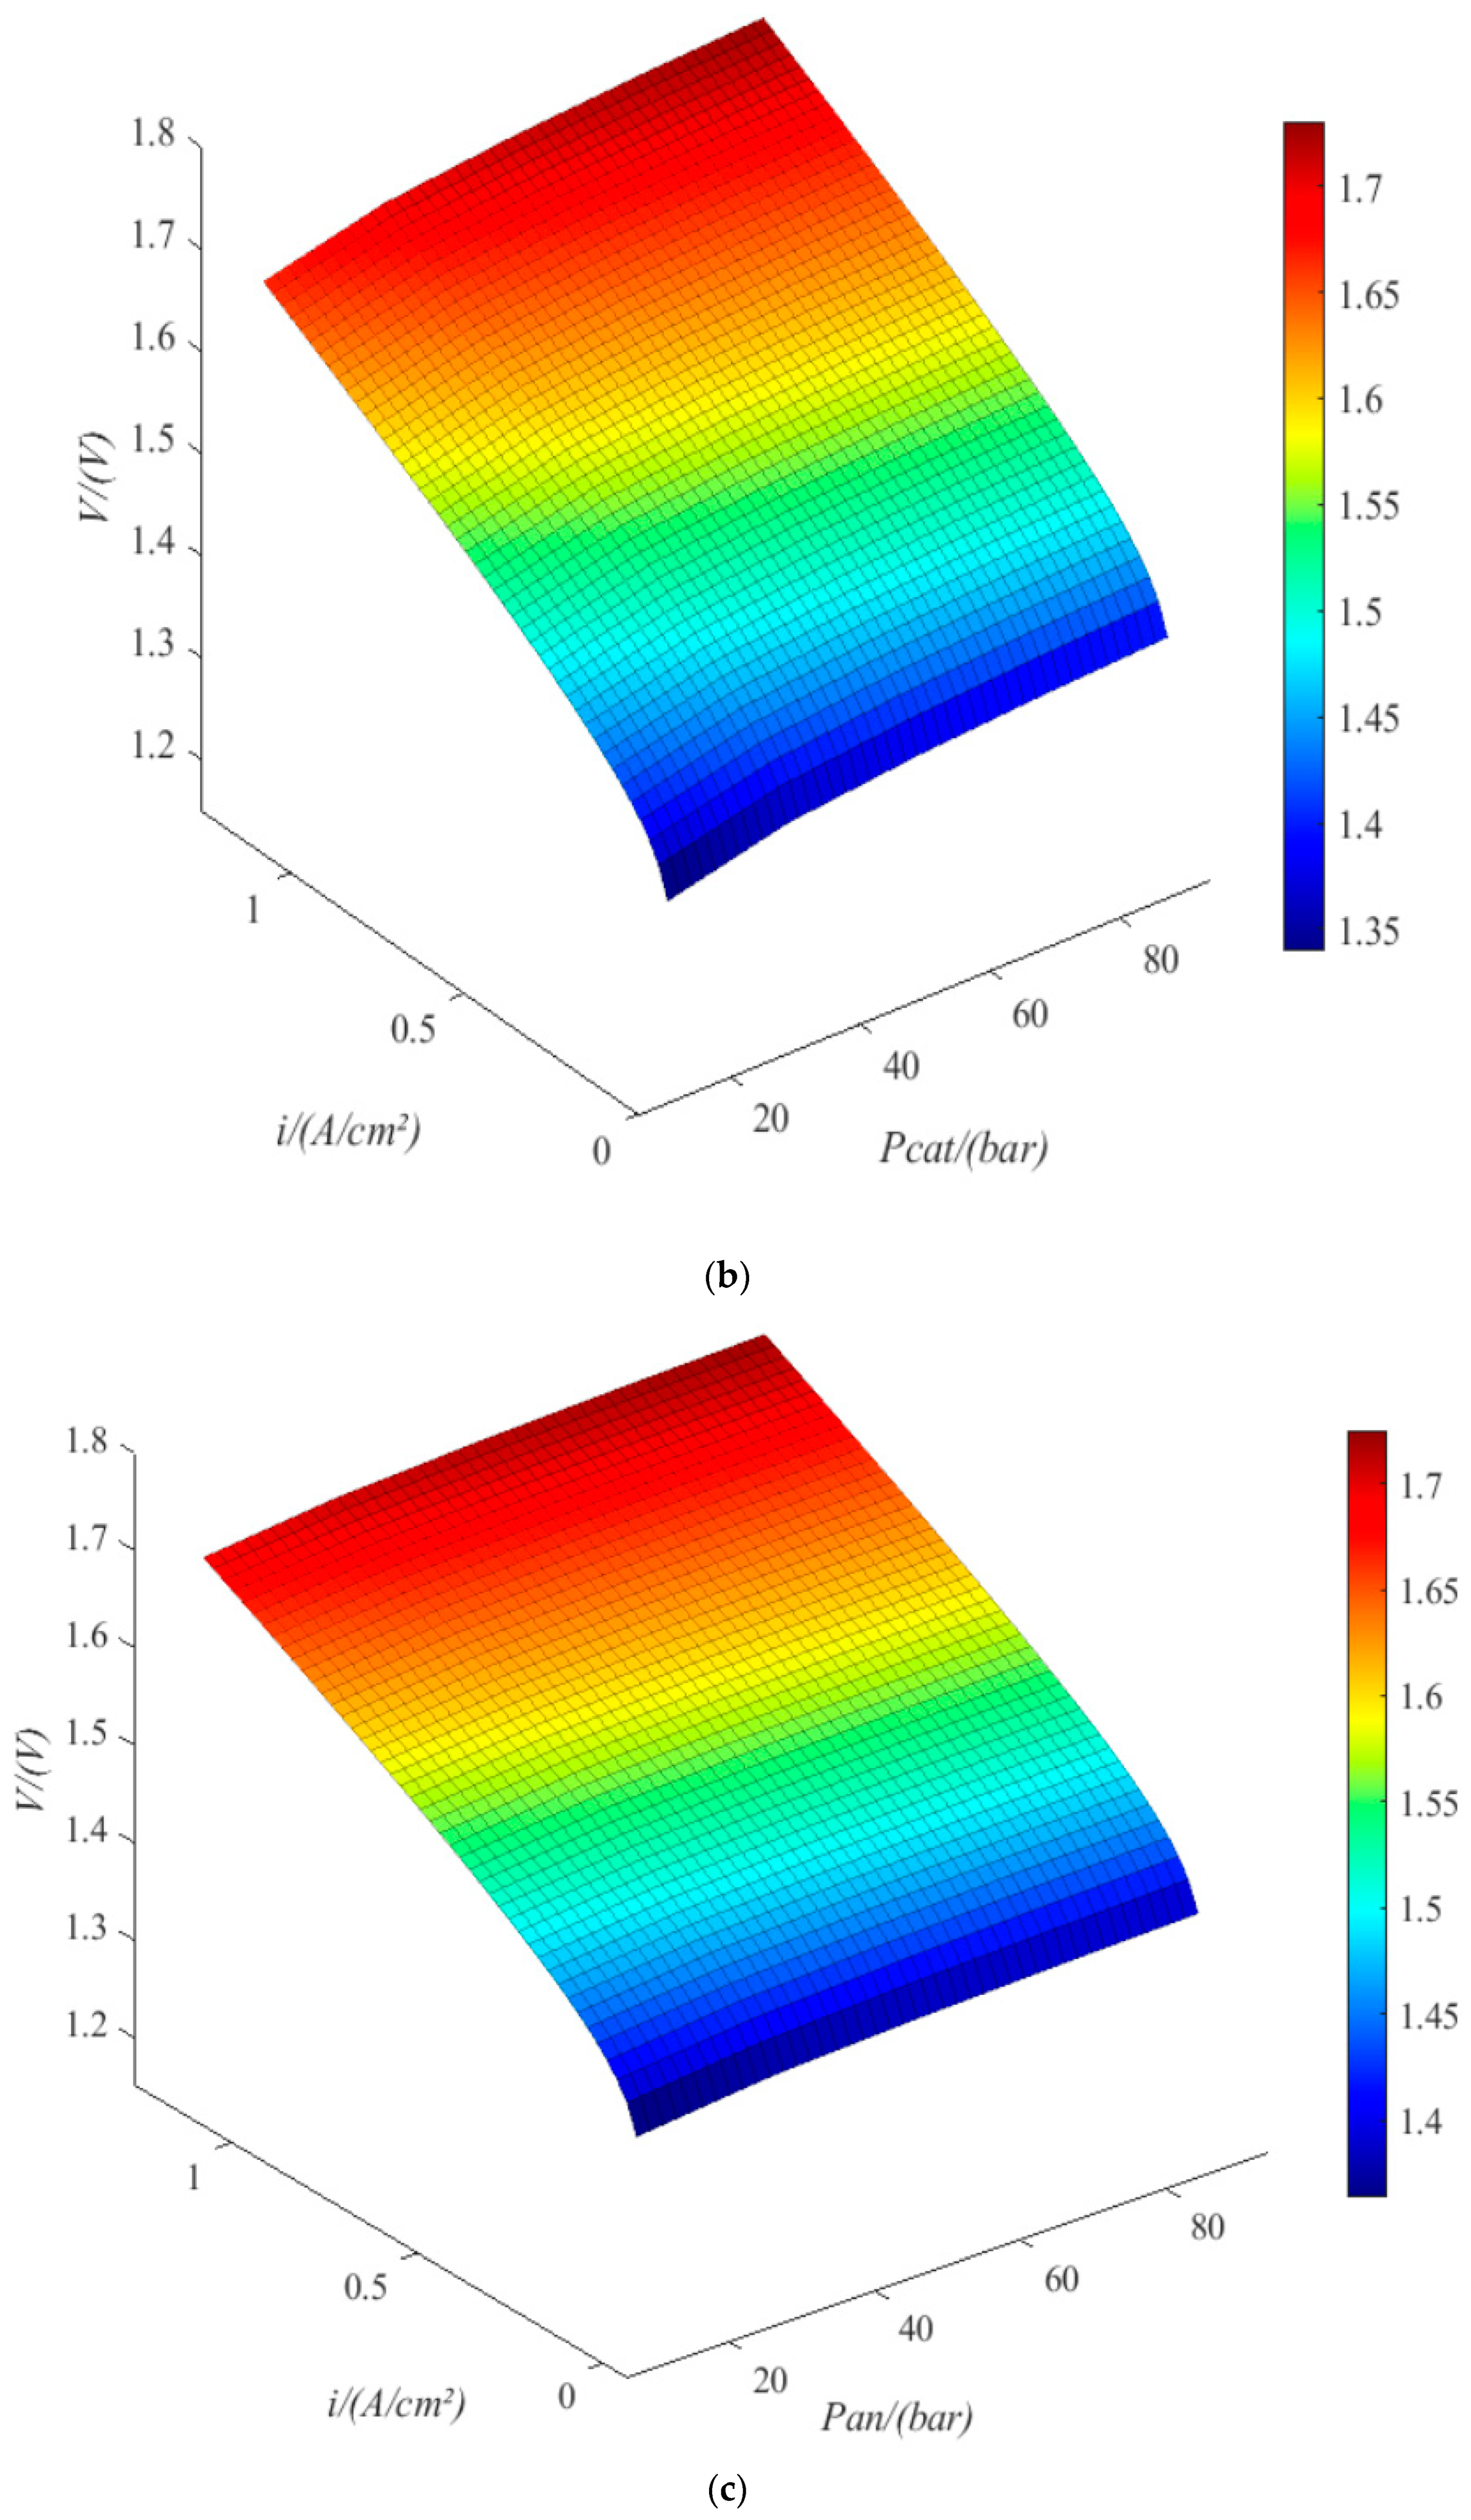
When the current density is 1.18 A/cm2, the terminal voltage is 1.75 V at a temperature of 314 K, 1.65 V at a temperature of 352 K, 1.4 V at an exchange current density of 10–1.34 A/cm2, 1.57 V at an exchange current density of 10−9.04 A/cm2, 1.67 V at a cathode pressure of 11.5 bar, 1.73 V at a cathode pressure of 88.5 bar, 1.69 V at an anode pressure of 11.5 bar, and 1.72 V at an anode pressure of 88.5 bar. The trend is the same under low current density. Therefore, increasing the pressure of anode and cathode is beneficial to improving the working current density; increasing the exchange current density and increasing the temperature of the electrolytic cell are conducive to reducing the power consumption of the electrolytic cell.
(3)
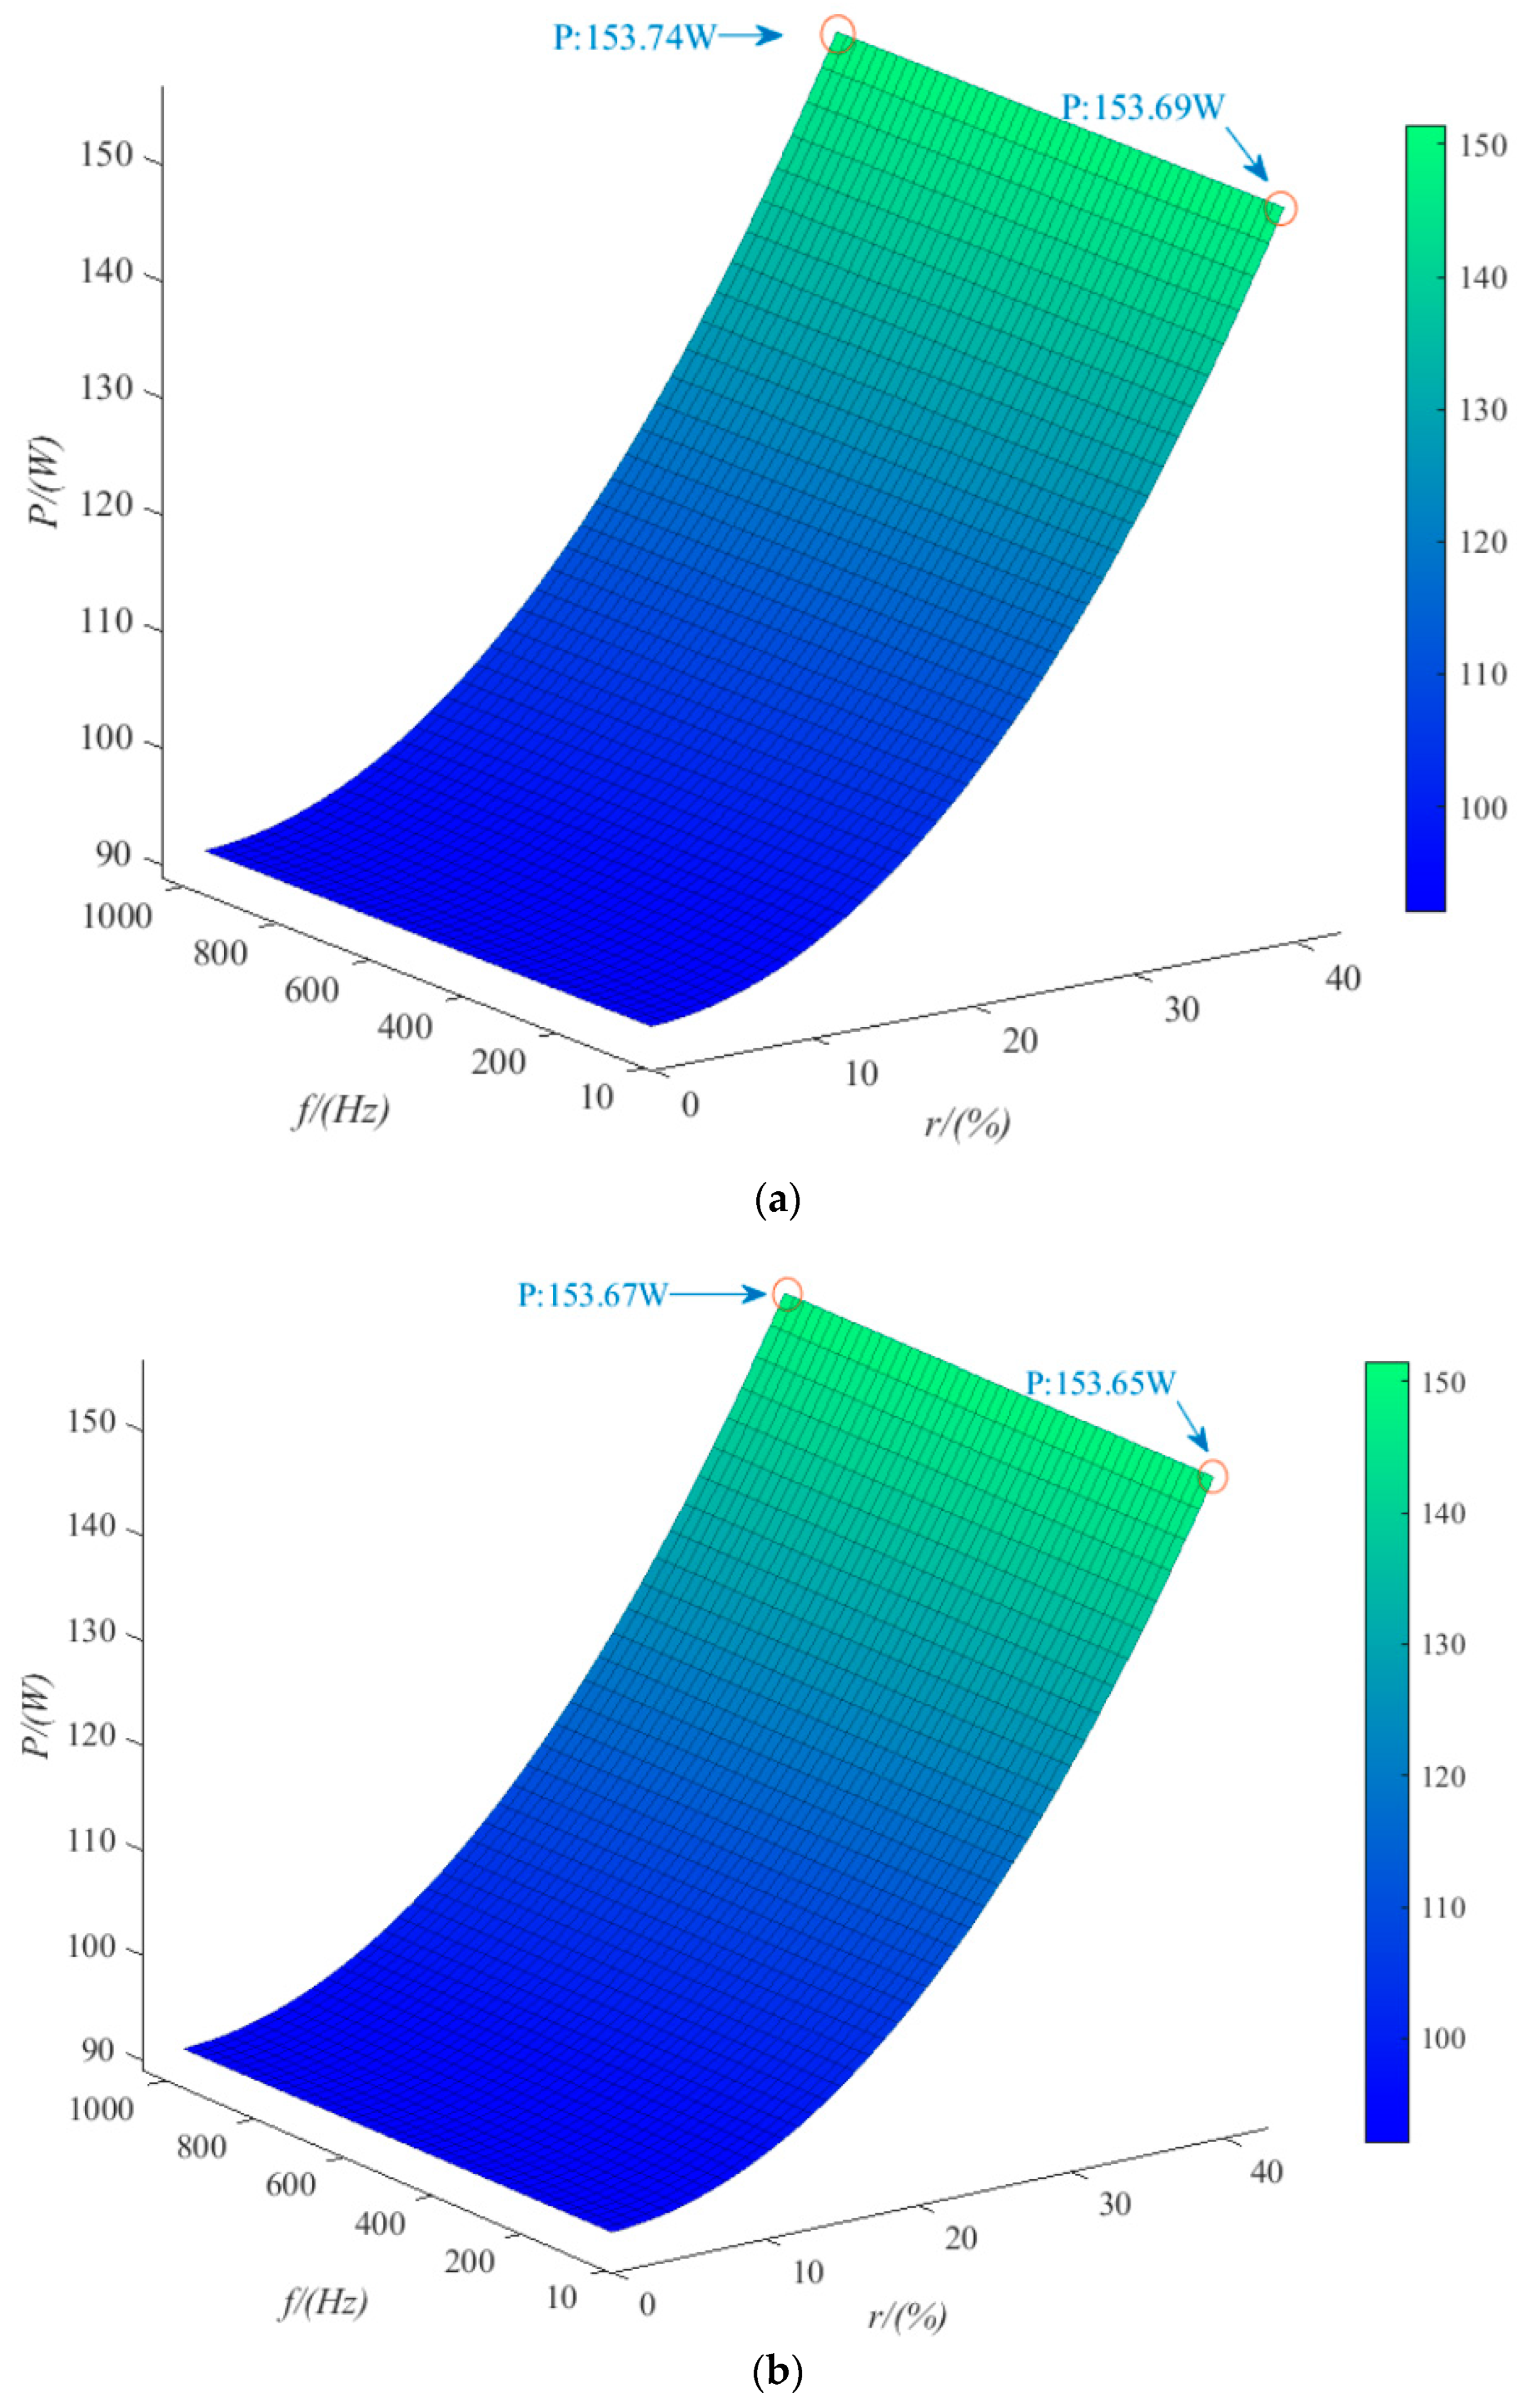
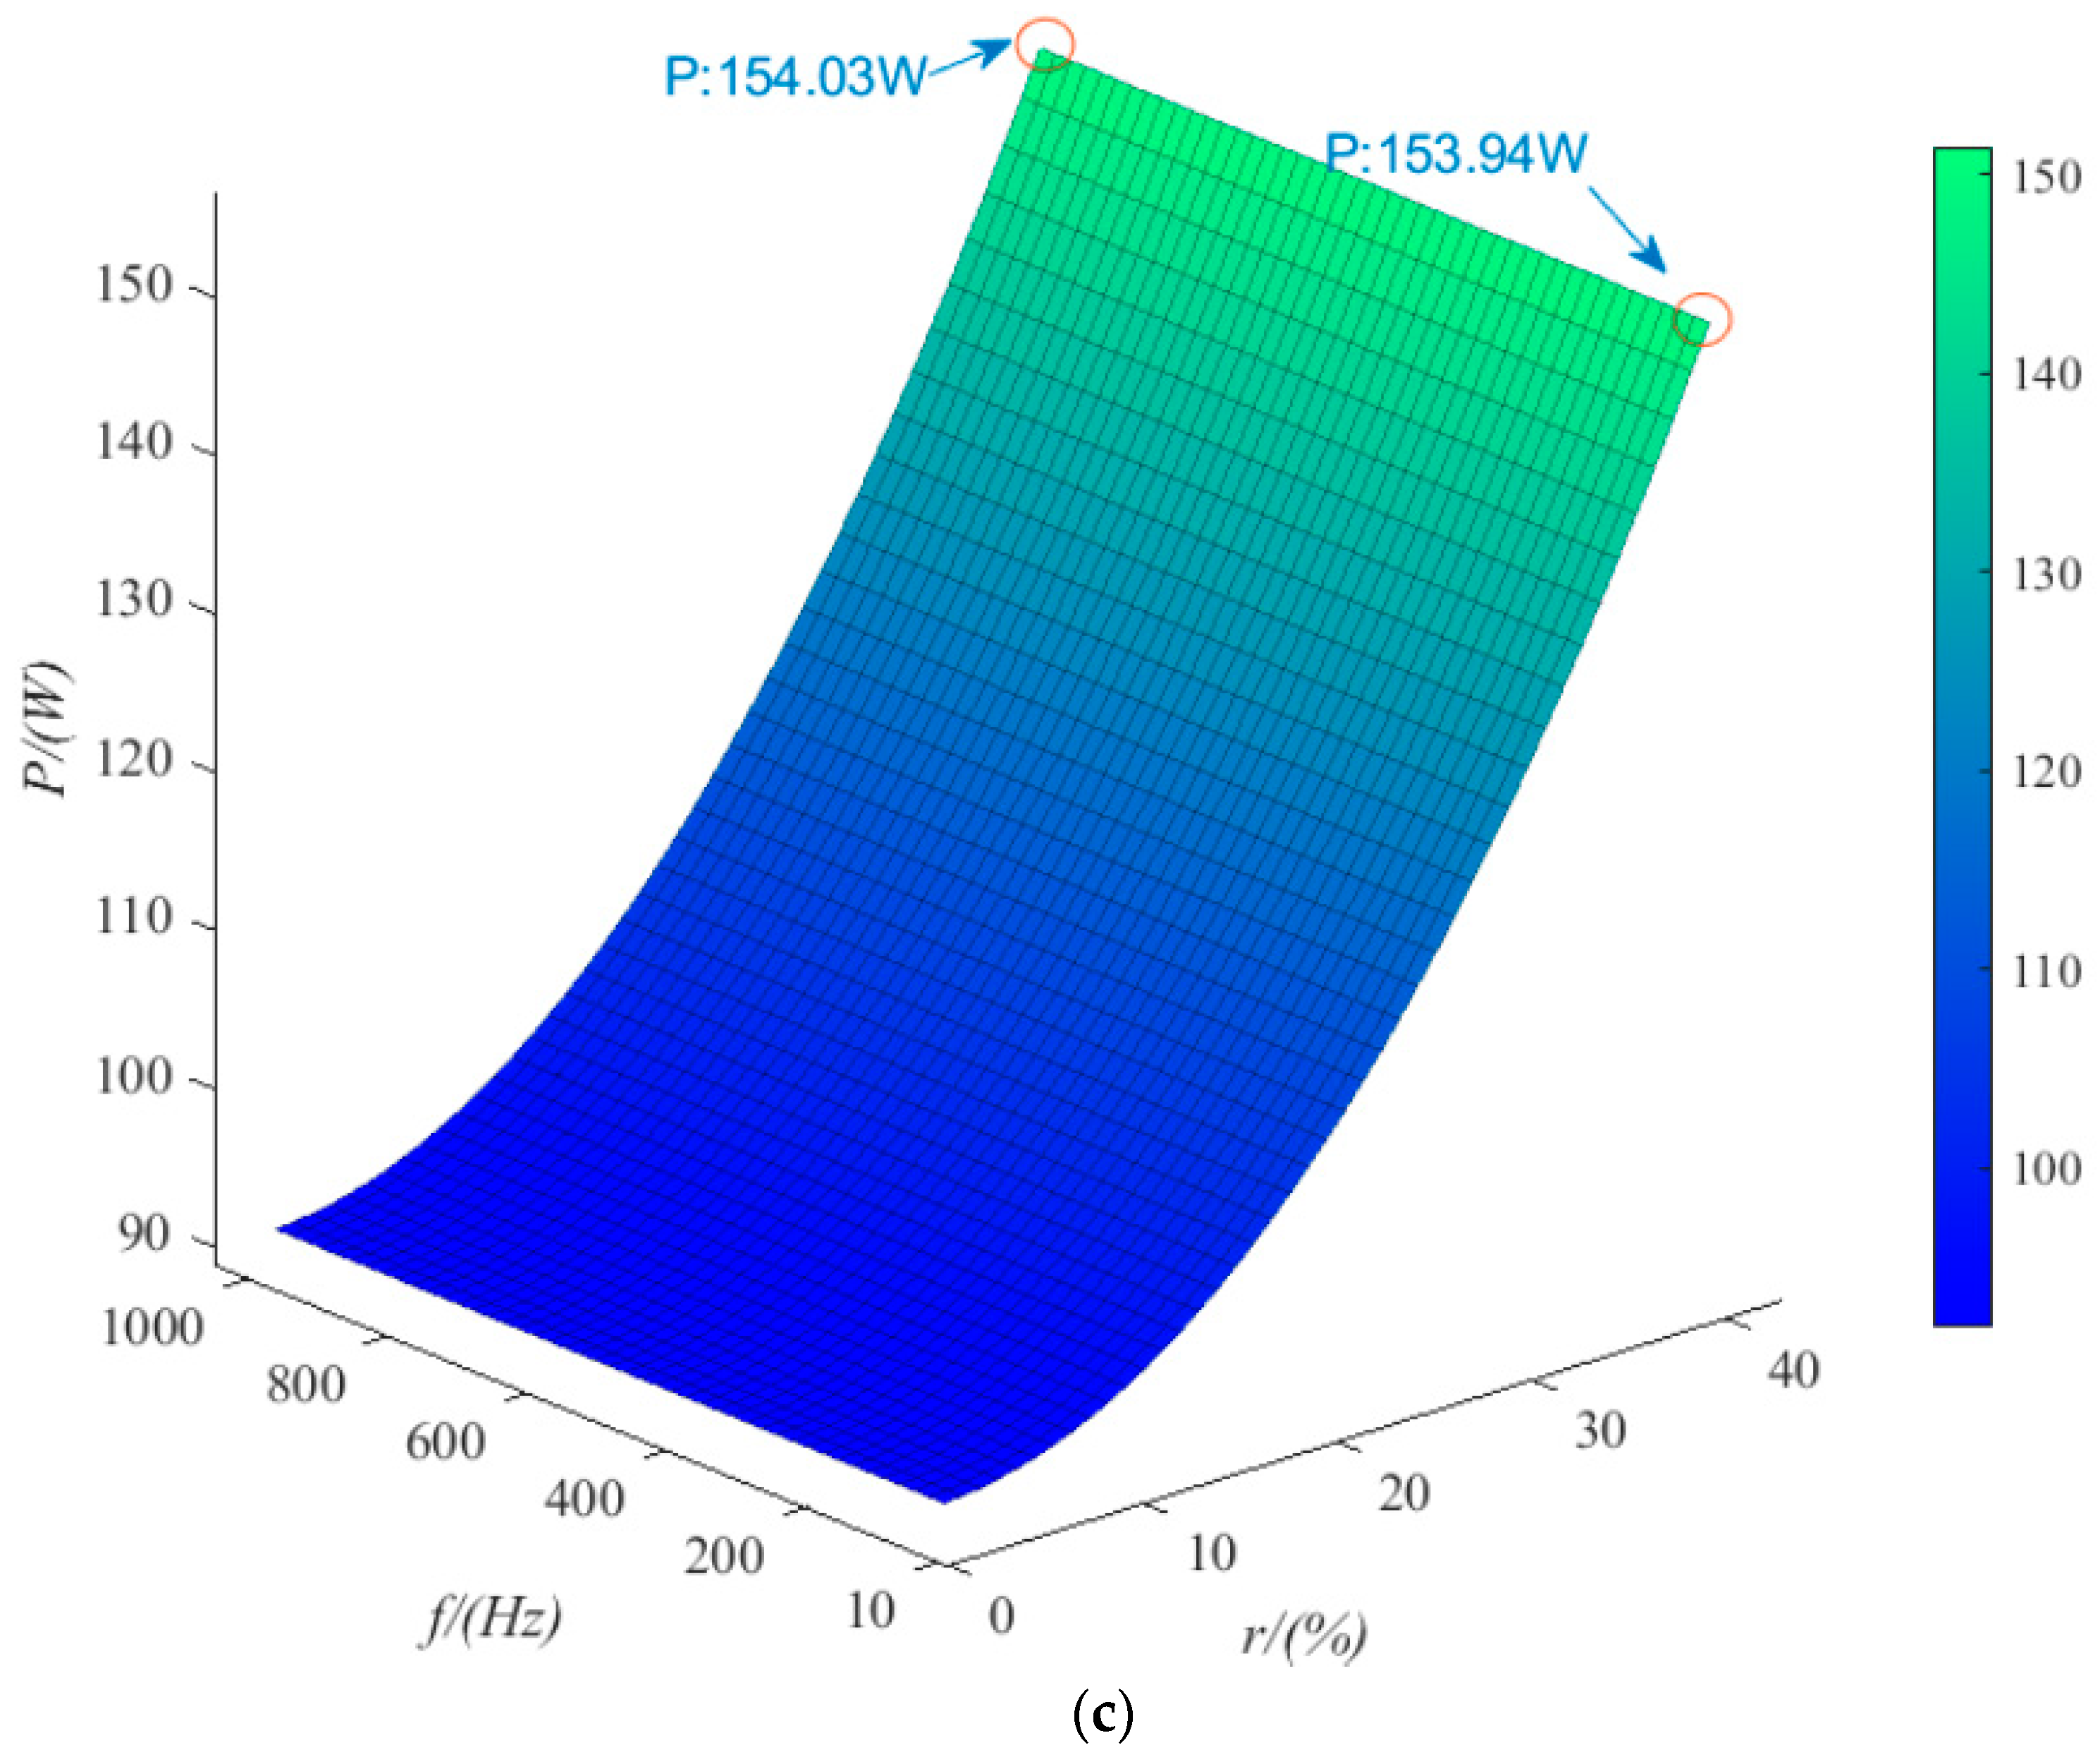
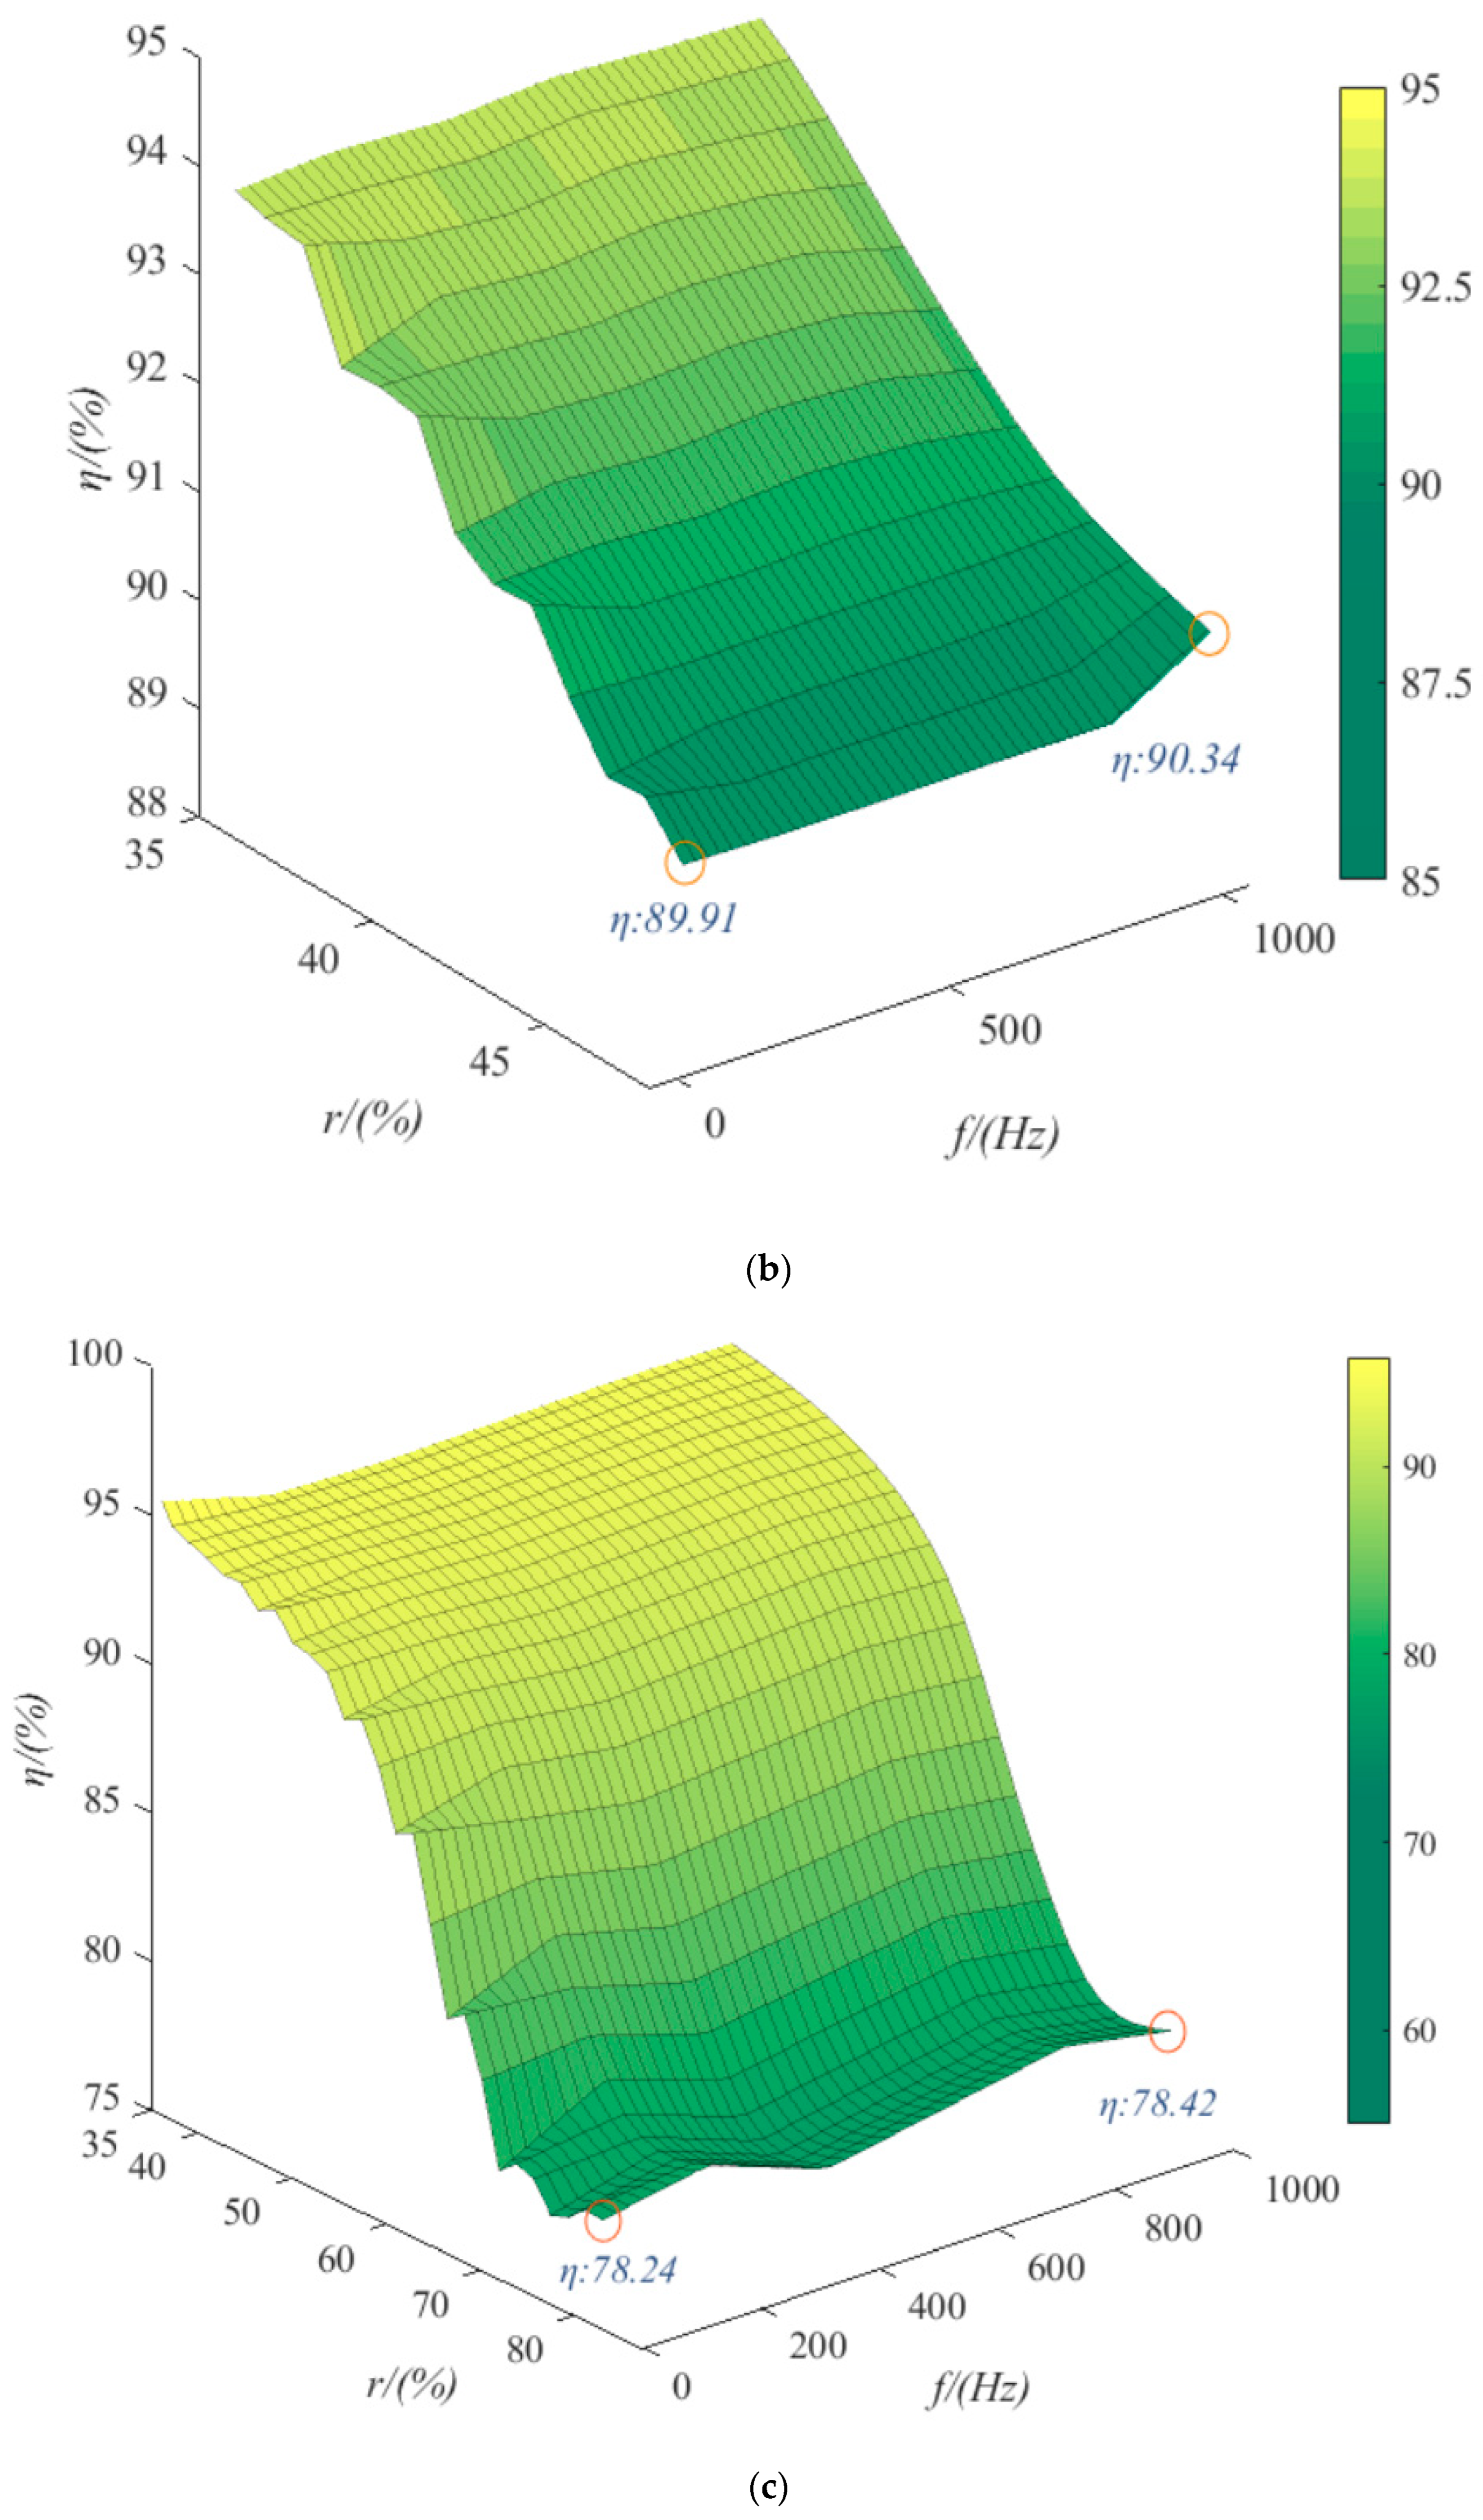
The trends of the effects of the three kinds of ripple are consistent. Taking sinusoidal ripple voltage as an example, when the ripple coefficient increases by 45%, the average power consumption increases by 61%. When the ripple coefficient is constant, the frequency increases by 1000%, and the average power consumption increases by only 0.033%. In the range of low ripple coefficients (0~35%), the hydrogen production rate can be reduced by 2% at most. When the ripple coefficient is in the range of 35~70%, the hydrogen production rate can be reduced by 12% at most. The ripple coefficient has a great influence on the power consumption and hydrogen production rate of the electrolytic cell, but the frequency is small. Among the three kinds of ripple, the triangular wave has the least influence on the power consumption and hydrogen production rate of the electrolytic cell. Therefore, the influence of the ripple coefficient and the overall smoothness of the waveform should be considered in practical application.
(4)
Although the test results are under specific parameters, because the working principle, internal chemical reaction and mechanical structure of the electrolytic cell are fixed, the conclusions are qualitatively consistent. It is universal for different types of equipment.

Author Contributions

Methodology, software, validation, formal analysis, writing—original draft preparation: T.Y.; Conceptualization, project administration: H.L.; writing—review and editing: J.W.; visualization: D.J. All authors have read and agreed to the published version of the manuscript.

Funding

This paper was supported by 2021 Inner Mongolia Autonomous Region’s major science and technology project (Grant No.: 2021ZD0027). “Key technologies for efficient integration and flexible control of high-power wind hydrogen storage systems”.

Data Availability Statement

The data used to support the findings of this study are available from the corresponding author upon request.

Conflicts of Interest

The authors declare no conflict of interest.

References

  1. Wang, J.; Li, H.; Peng, Y.; Xiao-Yan, L.; Xin-Yu, Z. Modeling and grid connection control of wind hydrogen storage coupling system. China South. Power Grid Technol. 2022, 16, 141–150. (In Chinese) [Google Scholar]
  2. Zhang, W. Technical progress and economic analysis of hydrogen production. Contemp. Pet. Petrochem. 2022, 30, 31–36. (In Chinese) [Google Scholar]
  3. Grigoriev, S.; Porembsky, V.; Fateev, V. Pure hydrogen production by PEM electrolysis for hydrogen energy. Int. J. Hydrogen Energy 2006, 31, 171–175. [Google Scholar] [CrossRef]
  4. Rashid, M.; Al Mesfer, M.K.; Naseem, H.; Danish, M. Hydrogen production by water electrolysis: A review of alkaline water electrolysis, PEM water electrolysis and high temperature water electrolysis. Int. J. Eng. Adv. Technol. 2015, 4, 2249–8958. [Google Scholar]
  5. Schmidt, O.; Gambhir, A.; Staffell, I.; Hawkes, A.; Nelson, J. Few, Future cost and performance of water electrolysis: An expert elicitation study. Int. J. Hydrogen Energy 2017, 42, 30470–30492. [Google Scholar] [CrossRef]
  6. Yodwong, B.; Guilbert, D.; Phattanasak, M.; Kaewmanee, W.; Hinaje, M.; Vitale, G. Proton exchange membrane electrolyzer modeling for power electronics control: A short review. C J. Carbon Res. 2020, 6, 29. [Google Scholar] [CrossRef]
  7. Li, J.; Zhang, Z.; Li, G.; Niu, M. Research progress of proton exchange membrane electrolyzer modeling based on model hierarchy analysis. High Volt. Technol. 2023, 49, 1105–1117. (In Chinese) [Google Scholar]
  8. Rahim, A.H.; Tijani, A.S.; Kamarudin, S.K.; Hanapi, S. An overview of polymer electrolyte membrane electrolyzer for hydrogen production: Modeling and mass transport. J. Power Sources 2016, 309, 56–65. [Google Scholar] [CrossRef]
  9. Zhang, L.; Chen, Y.; Gong, M.; Zhao, H.; Wang, X.; Huang, H. Process simulation of factors affecting hydrogen production from water electrolysis with proton exchange membrane. Compr. Smart Energy 2022, 44, 88–94. (In Chinese) [Google Scholar]
  10. Zheng, J.; Mo, J. Three-dimensional modeling of the reaction characteristic parameters of PEM electrolysis cells. Chin. J. Power Sources 2021, 45, 1401–1404, 1504. (In Chinese) [Google Scholar]
  11. Kumar, S.S.; Himabindu, V. Hydrogen production by PEM water electrolysis—A review. Mater. Sci. Energy Technol. 2019, 2, 442–454. [Google Scholar]
  12. Koponen, J.; Ruuskanen, V.; Hehemann, M.; Rauls, E.; Kosonen, A.; Ahola, J.; Stolten, D. Effect of power quality on the design of proton exchange membrane water electrolysis systems. Appl. Energy 2020, 279, 115791. [Google Scholar] [CrossRef]
  13. Ni, M.; Leung, M.K.H.; Leung, D.Y.C. Energy and exergy analysis of hydrogen production by a proton exchange membrane (PEM) electro-lyzer plant. Energy Convers. Manag. 2008, 49, 2748–2756. [Google Scholar] [CrossRef]
  14. Ursu´a, A.; Marroyo, L.; Gubı´a, E.; Gandı´a, L.M.; Dieguez, P.M.; Sanchis, P. Influence of the power supply on the energy efficiency of an alkaline water electrolyser. Int. J. Hydrogen Energy 2009, 34, 3221e33. [Google Scholar] [CrossRef]
  15. Demir, N.; Kaya, M.F.; Albawabiji, M.S. Effect of pulse potential on alkaline water electrolysis performance. Int. J. Hydrogen Energy 2018, 43, 17013–17020. [Google Scholar] [CrossRef]
  16. Teixeira, F.C.; de SáA, I.; Teixeira, A.P.S.; Ortiz-Martinez, V.M.; Ortiz, A.; Ortiz, I.; Rangel, C.M. New modified Nafion-bisphosphonic acid composite membranes for enhanced proton conductivity and PEMFC performance. Int. J. Hydrogen Energy 2021, 46, 17562–17571. [Google Scholar] [CrossRef]
  17. Karimi, M.B.; Mohammadi, F.; Hooshyari, K. Recent approaches to improve Nafion performance for fuel cell applications: A review. Int. J. Hydrogen Energy 2019, 44, 28919–28938. [Google Scholar] [CrossRef]
  18. Esmaeili, N.; Gray, E.M.; Webb, C.J. Non-fluorinated polymer composite proton exchange membranes for fuel cell applications-Areview. Chem. Phys. Chem. 2019, 20, 2016–2053. [Google Scholar] [CrossRef] [PubMed]
  19. King, L.A.; Hubert, M.A.; Capuano, C.; Manco, J.; Danilovic, N.; Valle, E.; Hellstern, T.R.; Ayers, K.; Jaramillo, T.F. A non-precious metalhydrogen catalyst in a commercial polymer electrolyte membrane electrolyser. Nat. Nanotechnol. 2019, 14, 1071–1074. [Google Scholar] [CrossRef]
  20. Bernt, M.; Hartig-weiss, A.; Tovini, M.F.; El-Sayed, H.A.; Schramm, C.; Schroter, J.; Gebauer, C.; Gasteiger, H.A. Current challenges incatalyst development for PEM water electrolyzers. Chem. Ing. Tech. 2020, 92, 31–39. [Google Scholar] [CrossRef]
  21. Guo, Y.; Cui, Z.; Xu, X.; Feng, Q. Preparation of alloy catalysts by electroplating method for hydrogen production from hydrolysis of sodium borohydride. Lab. Res. Explor. 2015, 34, 14–17. (In Chinese) [Google Scholar]
  22. Liu, C.; Zeng, G.; Liao, M.; Dong, X. Dynamic simulation modeling and fast frequency response analysis of large capacity electrolytic cell. Power Grid Technol. 2023, 1–10. (In Chinese) [Google Scholar] [CrossRef]
  23. Raúl, M.; Luis, M.; Fernández, R.; Garcia-Vazquez, C.A.; Jurado, F. Electrolyzer models for hydrogen production from wind energy systems. J. Hydrogen Energy 2015, 40, 2927–2938. [Google Scholar]
  24. Abdullah, A.; Ibrahim, D. Thermodynamic and electrochemical analyses of a solid oxide electrolyzer for hydrogen production. Int. J. Hydrogen Energy 2017, 42, 21404–21413. [Google Scholar]
  25. Keller, R.; Rauls, E.; Hehemann, M.; Muller, M.; Carmo, M. An adaptive model-based feedforward temperature control of a 100 kW PEM electrolyzer. Control. Eng. Pract. 2022, 120, 104992. [Google Scholar] [CrossRef]
  26. Huang, P. Umidity standard of compressed hydrogen for fuel cell technology. ECS Trans. 2008, 12, 479–484. [Google Scholar] [CrossRef]
  27. Wang, Z.M. Simulation and Experimental Study on the Performance of Proton Exchange Membrane Cell. Ph.D. Thesis, North China Electric Power University, Beijing, China, 2021. (In Chinese). [Google Scholar]
  28. Abdin, Z.; Webb, C.; Gray, E. Modelling and simulation of a proton exchange membrane (PEM) electrolyser cell. Int. J. Hydrogen Energy 2015, 40, 13243–13257. [Google Scholar] [CrossRef]
Figure 1. Schematic diagram of proton exchange membrane electrolyzer.
Energies 16 06912 g001
Figure 2. Principle block diagram of proton exchange membrane electrolyzer simulation model.
Energies 16 06912 g002
Figure 3. Simulation model of proton exchange membrane.
Energies 16 06912 g003
Figure 4. Performance characteristics of proton exchange membrane electrolyzer. (a) The relationship between temperature, current density, and terminal voltage. (b) The relationship between cathode pressure, current density, and terminal voltage. (c) The relationship between anode pressure, current density, and terminal voltage. (d) The relationship between exchange current density and terminal voltage.
Energies 16 06912 g004aEnergies 16 06912 g004bEnergies 16 06912 g004c
Figure 5. Experimental flowchart for the effect of ripple voltage on the performance of proton exchange membrane electrolyzers.
Energies 16 06912 g005
Figure 6. Influence of ripple coefficient and frequency on average power consumption. (a) The influence of the ripple coefficient and frequency on average power consumption under sinusoidal ripple voltage. (b) The influence of the ripple coefficient and frequency on average power consumption under triangular ripple voltage. (c) The influence of the ripple coefficient and frequency on average power consumption under square ripple voltage.
Energies 16 06912 g006aEnergies 16 06912 g006b
Figure 7. Effect of ripple coefficient and frequency on hydrogen production efficiency. (a) Effect of the ripple coefficient and frequency on the hydrogen production rate under sinusoidal ripple voltage. (b) The influence of the ripple coefficient and frequency on the hydrogen production rate under triangular ripple voltage. (c) Effect of the ripple coefficient and frequency on the hydrogen production rate under square ripple voltage.
Energies 16 06912 g007aEnergies 16 06912 g007b
Table 1. Saturated steam pressure coefficient values.
Subscript iaibi
00.00890.0093
1−1.468 × 10⁻⁶−8.012 × 10⁻⁶
24.101 × 10−54.213 × 10−6
3−3.703 × 10⁻⁷−3.782 × 10⁻⁶
49.8 × 10−91 × 10−8
Table 2. Electrolytic cell simulation parameters.
ParameterNumerical ValueParameterNumerical Value
Membrane area A160 cm2Curvature ξ4
Film thickness δmem0.0254 cmAverage pore radius r1 nm
Electro-osmosis coefficient nd7Water diffusion coefficient in membrane Dw1.28 × 10−6
Membrane moisture content λ21%Permeability of Membrane to water KDarcy1.58 × 10−14
Porosity ε0.3Water density ρH2O1 (g/cm3)
Faraday constant F96,485 (C/mol)Gas constant R8.314 (J/mol/K)
Oxygen pressure PO23 atmHydrogen pressure PH23 atm
AC current density i00.4 (A/cm2)
Disclaimer/Publisher’s Note: The statements, opinions and data contained in all publications are solely those of the individual author(s) and contributor(s) and not of MDPI and/or the editor(s). MDPI and/or the editor(s) disclaim responsibility for any injury to people or property resulting from any ideas, methods, instructions or products referred to in the content.

