Article

Environmental Life Cycle Analysis and Energy Payback Period Evaluation of Solar PV Systems: The Case of Pakistan

Department of Engineering, Università del Sannio, Piazza Roma 21, 82100 Benevento, Italy
*
Author to whom correspondence should be addressed.
Energies 2023, 16(17), 6400; https://doi.org/10.3390/en16176400
Submission received: 17 July 2023 / Revised: 24 August 2023 / Accepted: 31 August 2023 / Published: 4 September 2023
(This article belongs to the Special Issue Advances in Photovoltaic Solar Energy)

Abstract

:
This study employs a life cycle assessment (LCA) approach to investigate the environmental burden of photovoltaic power generation systems that use multi-crystalline silicon (multi-Si) modules in Pakistan. This study evaluates the energy payback time (EPBT) of this class of systems, and considers various environmental impacts, including climate change, acidification, and eutrophication. The assessment accounts for upstream, midstream, and downstream processes, including cell as well as module production. The critical stages in the production cycle were identified, including the metallic silicon transformation into solar silicon and the assembly of the panels, which involve energy-intensive materials such as aluminum frames and glass roofing. Despite using the most efficient conversion technology, the former stage consumes a significant amount of electricity. This study reveals that multi-Si PV systems in Pakistan have an EPBT that is considerably less than their lifespan, ranging from 2.5 to 3.5 years. These findings suggest that the development of PV systems in Pakistan is a very interesting option for energy production. Additionally, this study compares solar PV and wind power generation systems in various regions of Pakistan. The study outcomes can facilitate evidence-based decision-making processes in the renewable energy sector and contribute significantly to Pakistan’s endeavor to transition toward a sustainable energy system.

1. Introduction

Solar energy is the foremost extensively distributed and abundant renewable source of energy globally. Technological progressions and decreased production expenses have facilitated the extensive-scale development and utilization of solar power as a renewable energy technology. Given the concerning issues surrounding energy security and climate change, the significance of solar power has garnered substantial global attention [1]. Conventional fossil fuels, such as coal, oil and natural gas, continue to be the primary drivers of energy consumption worldwide. While these fuels offer convenience, their usage results in adverse outcomes. Fossil fuel combustion releases into the atmosphere SOx, NOx and COx, which pose a significant threat to both human health and the environment. The rapid growth in the global population has further increased the demand for fossil fuels, leading to alarming levels of environmental contamination, including the global warming effects. The primary cause of global warming, which severely impacts the environment, is the release of CO2 resulting from the oxidation of fossil fuels. Thus, reducing CO2 levels and other harmful gases in the environment is crucial to mitigate the effects of global warming.
The optimal approach to achieving this objective is through the escalation of renewable energy utilization as a primary power source. Among the various options available within the renewable energy sector, solar power stands out as the most favorable alternative due to its non-detrimental impact on the surrounding environment [2]. Solar energy possesses the capacity to fulfill energy requirements sustainably and efficiently. The solar radiation that reaches the Earth’s surface exceeds the annual sum of commercial energy utilized by humans by more than 200 fold [3]. Solar energy can be harnessed, for example, through the use of photovoltaic (PV) cells, which are composed of semiconductors and can store energy in batteries for subsequent use across multiple applications.
Concerning its operational procedures, PV technology may be deemed to be largely environmentally benign. However, a comprehensive evaluation of the entire life cycle of a PV system, from silica extraction to system deployment, necessitates accounting for the energy consumption and environmental emissions involved in the process. Research conducted in the 1970s examined the PV system’s life cycle and analyzed the energy utilization involved in the production of solar cells, starting from raw materials to the finished product. The outcomes indicated that for mono-crystalline silicon (mono-Si) solar cells designed for terrestrial utilization, the energy payback time (EPBT) was estimated to be 12 years, a duration shorter than the expected lifespan of the solar cells [4]. The escalating utilization of PV technologies has led to an amplification of concerns surrounding the potential ecological effects of PV power systems. Consequently, an elevated number of life cycle assessment (LCA) investigations focusing on evaluating the environmental ramifications and EPBT of PV technologies have been conducted [5,6,7,8]. Despite the broad range of potential environmental impacts associated with PV technologies, the majority of studies have concentrated on evaluating the EPBT and specific emissions, notably greenhouse gases [9,10,11].
Although PV technologies have the potential to cause diverse environmental impacts, only a small number of studies have investigated other ecological ramifications, including eutrophication potential, biological toxicity, and acidification potential [12,13,14]. To the best of the authors’ knowledge, there are currently no studies available that have been conducted on the environmental impacts of the state-of-the-art PV systems that are produced or installed within Pakistan. The absence of such studies indicates a research gap concerning the ecological implications of these advanced systems, underscoring the necessity for future investigations in this field.
Situated within the geographical coordinates of latitude 24° to 37° north and longitude 62° to 75° east, Pakistan shares borders with four neighboring countries: China to the north, India to the east, Iran to the west and Afghanistan to the northwest, with the Arabian Sea in the south. Its administrative divisions encompass five provinces (Punjab, Sindh, Baluchistan, Khyber Pakhtunkhwa, and Gilgit Baltistan) plus one federal territory (Islamabad Capital Territory). Notably, the northern includes towering mountain ranges, such as the Himalayas, Hindukush, and Karakoram, home to the second highest peak in the world, K-2. The fertile plains of Punjab and Sindh are irrigated by five converging rivers that form the Indus, while the western expanse features the arid Baluchistan Plateau, surrounded by rugged mountains. Pakistan’s population exceeds 207 million, with nearly 40% residing in urban regions across its land area of approximately 796,096 square kilometers [15,16].
Despite a 2020 GDP of 300 billion US dollars and an annual growth rate of 5.8%, Pakistan faces the challenge of delivering essential services to a growing population and economy, resulting in amplified energy demands that strain limited resources. Although government initiatives have reduced poverty, a considerable segment of the population still lives below the poverty line, surviving on less than 2 US dollars per day [17].
Benefiting from its location in the so called “sun belt”, Pakistan receives abundant sunlight year-round, prompting a critical need to harness its solar energy potential. To combat current energy issues, effective utilization of solar resources, coupled with strategic public and private sector investments, is imperative. While fossil fuels predominate in neighboring Asian nations such as India and China, Pakistan relies significantly on natural gas (44%) for power generation. Conversely, coal constitutes the primary energy source for electricity in India (57%) and China (72%). As finite fossil fuel reserves come under strain, these nations actively seek cleaner, renewable energy alternatives, particularly solar power, to reduce their reliance on conventional energy sources [16,17,18].
Furthermore, the insights gleaned from this study could serve as a valuable blueprint for other nations in the region that grapple with similar energy challenges and aspire to transition to renewable sources. The strategies identified to enhance energy production efficiency while minimizing environmental impacts can be tailored to suit the circumstances of various countries, thereby facilitating the broader adoption of sustainable energy practices. In the broader context of global renewable energy goals, Pakistan’s endeavors align with international efforts to curtail carbon emissions and mitigate climate change. The outcomes of this study can contribute to a more comprehensive understanding of the multi-Si PV system’s environmental implications, thereby enhancing the global repository of knowledge for informed decision making in the renewable energy sector.

2. The Status of Photovoltaic Energy in Pakistan

The present Pakistan energy mix is not sustainable and predominantly relies on imported non-renewable resources, resulting in impediments to the country’s economic advancement. The escalating energy requirements of the country are growing expeditiously, and the introduction of new power stations is insufficient in managing these demands, which in turn leads to insufficiencies in the energy supply [15]. The country is experiencing an annual increase in electric power demand of approximately 8%, as illustrated in Figure 1. This surge in demand has resulted in an energy deficit, particularly in the northern regions that are not yet connected to the national power grid. To bridge this gap and satisfy the escalating energy demands, it is imperative to explore alternative and sustainable energy resources. The anticipated advantages of solar energy decentralized nature include its ability to effectively supplement the gap between energy supply and demand. While hydro and thermal sources of renewable and clean energy are being employed and scheduled for use, they are insufficient in overcoming the persistent energy shortages [16,17,18].
Ernst & Young’s Renewable Energy Attractiveness Index (RECAI) report has identified Pakistan as an enticing prospect for potential investors in the field [19]. However, in comparison to other countries, the progress of solar energy implementation within Pakistan has not been promising so far (see Table 1). Furthermore, even when compared to other Asian nations, Pakistan’s position regarding installed solar energy capacity is relatively lower, as demonstrated in Figure 2. However, since Pakistan is situated in a region that experiences high solar radiation levels, PV systems could play a pivotal role in mitigating the escalating energy demands of this country, that are fueled by a rapid population growth and an expanding economy. Indeed, solar energy could help to reduce Pakistan’s dependence on fossil fuels, and this in turn could help to mitigate the environmental impacts associated with traditional forms of energy production.
Therefore, the objective of this study is to comprehensively assess the environmental impacts and energy efficiency of multi-crystalline silicon PV modules in Pakistan. By conducting a thorough analysis of the entire lifecycle of these PV systems, this study aims to quantitatively evaluate diverse environmental indicators, including factors such as acidification potential, eutrophication potential, and global warming potential. Furthermore, this study seeks to calculate the EPBT for distinct regions within Pakistan, offering insights into the rate at which these systems offset their initial energy input through subsequent energy generation. Through these articulated objectives, this study aims to provide valuable insights to policy makers, investors, and stakeholders, enabling informed decisions about the viability of integrating multi-crystalline silicon PV modules into Pakistan’s energy infrastructure. In this way, this study contributes to Pakistan’s ongoing efforts to achieve sustainable energy transition objectives.

3. Materials and Methods

3.1. Life Cycle Assessment

Life cycle assessment is a valuable methodology for assessing the potential environmental impacts and resource utilization of a product throughout its entire life cycle, starting from the extraction of raw materials, production, and use, and ending with waste management, including recycling and disposal. The term “product” encompasses both goods and services. LCA is a comprehensive assessment that takes into account all environmental attributes, human health, and resource usage across the product’s life cycle. The distinguishing characteristic of LCA is its emphasis on a holistic approach that considers the entire life cycle of products. This broad outlook of LCA offers advantages in preventing the transfer of negative impacts, known as problem shifting, across different life cycle stages, regions, or environmental issues [21]. The LCA analysis typically follows four stages: goal and scope definition, life cycle inventory analysis (LCI), life cycle impact assessment (LCIA), and interpretation.
Integrating a LCA into this study is both relevant and essential, owing to the capability of this approach to comprehensively explore the environmental implications associated with energy systems. LCA offers a holistic perspective that is often missing in conventional analyses. Within this study’s framework, LCA systematically evaluates the environmental impacts at each stage of the multi-Si PV system’s lifecycle, enhancing the understanding of the broader energy context. The importance of LCA is underscored by its ability to quantitatively gauge the environmental footprint across various lifecycle phases–covering processes from raw material extraction, production, and transportation to usage, maintenance, and eventual disposal. In instances such as complex energy systems such as the multi-Si PV configuration, where environmental impacts span through multiple stages, LCA becomes an invaluable tool for capturing the full scope of these effects. This knowledge not only informs the design and engineering of energy systems but also significantly influences policy formulation and investment decisions.
LCA’s data-driven insights underpin policy-making by facilitating a comprehensive evaluation of trade-offs among energy alternatives, enabling the formulation of sustainable energy policies that align with environmental goals across short-term gains and long-term consequences. Moreover, LCA informs investment decisions by revealing a full spectrum of environmental implications, aiding stakeholders in identifying solutions that are both ecologically sound and economically viable. In the context of renewable energy technologies, LCA serves as a guiding compass for transitioning to sustainable energy sources, allowing for a comparative analysis of renewable technologies against conventional counterparts, elucidating their environmental merits. Specifically, in the case of the multi-Si PV system, LCA enables the identification of lifecycle stages with the most significant environmental impacts, thus directing mitigation efforts with precision.

3.2. Goal and Scope

The solar cell is the essential element of a PV power plant, as it harnesses luminous energy and converts it into electrical energy through the photovoltaic effect. The process generates an electromotive force through the interaction between radiation and a semiconductor plate with a potential gap. The choice of semiconductor for solar cells is typically silicon, which can be fashioned into monocrystalline, polycrystalline, or amorphous structures. In this study, multi-crystalline silicon PV module has been chosen to define LCA functional unit.
The selection of multi-Si PV modules for this study stems from a well-founded assessment of their advantages and suitability to the conditions in Pakistan. Advantages of multi-Si PV modules include their established technological maturity, which contributes to their reliability and consistent performance. This reliability is particularly important for a comprehensive LCA study, as accurate and consistent data are crucial for meaningful environmental impact analysis. Additionally, multi-Si modules exhibit a lower energy payback time compared to some other PV technologies, making them more energy-efficient in terms of their manufacturing and deployment.
Given Pakistan’s geographical location between latitudes 24° and 37° north, the region receives ample sunlight, making solar energy an attractive and sustainable option. Multi-Si modules are well-suited to these conditions due to their moderate temperature coefficient, ensuring relatively stable performance in high-temperature environments. Furthermore, Pakistan’s energy landscape, with its focus on addressing energy deficits and reducing dependence on fossil fuels, aligns well with the inherent advantages of multi-Si PV technology, as it can contribute to a cleaner and more sustainable energy mix. In comparison to other PV technologies, such as thin-film or mono-crystalline silicon, multi-Si modules often offer a lower production cost due to their simpler manufacturing processes. This cost-effectiveness is particularly relevant for regions striving to maximize the benefits of solar energy within constrained budgets. While mono-crystalline silicon may provide slightly higher efficiency, multi-Si modules offer a balance between cost and efficiency that makes them appealing for large-scale installations, which aligns with Pakistan’s ambitious renewable energy targets.
Figure 3 presents the system boundary used in this study, which covers both upstream processes (from silica extraction to the growth of crystalline silicon bars and ingots) and midstream processes (including the fabrication of cells and modules as well as the production of aluminum frames). The balance of the system (BOS) was not considered in our analysis due to its significant reliance on the installation process and negligible impact on environmental outcomes. Within rooftop PV systems, BOS components involve inverters, cables, connectors, and mounting structures, while ground-mounted installations demand supplementary equipment and facilities such as office buildings, grid connections, and concrete structures [22]. Prior investigations have indicated that the BOS component accounted for approximately 0.2 years of EPBT for a multi-Si PV system. Moreover, it was responsible for the emission levels of 18 mg/kWh of SOx, 10 mg/kWh of NOx, and 5 g CO2-eq/kWh of greenhouse gases [23].
The environmental impacts of the processing facility infrastructure per unit of electricity were not considered in the analysis, and this could potentially result in underestimating the environmental impacts associated with PV systems [24]. Nonetheless, due to the long service life and high production capacity of the processing facilities throughout their lifespan, their impact on the environmental impacts per unit of electricity is expected to be minimal [25].
Furthermore, the wide range of transportation modes and distances utilized by various PV projects posed a challenge for conducting a precise assessment. Consequently, the primary focus of this investigation is directed toward the multi-Si PV system production phase, with a particular emphasis on the PV module, which is recognized as the most significant and distinct element of a PV system.
The LCA study used a functional unit of 1 kWh based on a multi-Si PV module with a capacity of 200 Wp. The presumed PV system lifespan was 25 years. However, inadequate maintenance often resulted in a shorter lifespan for PV systems, leading to an underestimation of environmental impacts as well as primary energy demand per kWh generated. The module characteristics are detailed in Table 2.

3.3. Life Cycle Inventory

The obtained inventory data are related to the material usage and environmental emissions associated with the manufacturing of solar-grade silicon, wafers, ingots, cells, and modules. The data were collected primarily from published literature and Pakistani companies in collaboration with Chinese entities possessing advanced expertise in multi-Si photovoltaic technologies, representing the current state-of-the-art in this domain. The collected data were utilized in the calculation process, employing a model using OpenLCA® software, version 1.10.3, which is capable of performing life-cycle calculations and provides access to a comprehensive database. The acquired upstream data, on energy and auxiliary materials, were sourced from the OpenLCA® database. The PV modules’ production processes are discussed below.

3.3.1. Production of Solar-Grade Multi-Si (Sog-Si)

The preferred production technique for sog-Si is the modified Siemens process, which involves a complex sequence of chemical transformations. In this process, silica fume is reacted with hydrogen chloride, obtained during the reducing preparation of polysilicon, to produce trichlorosilane. The low-temperature absorption method is then employed to separate trichlorosilane and silicon tetrachloride, which are subjected to further purification and reduction in a furnace under specific conditions of high temperature and pure hydrogen. The outcome is the formation of tetrachlorosilane, hydrogen chloride, and silicon, with the silicon forming rod-shaped polysilicon. This method is characterized by a high degree of material recycling within a relatively closed internal system. The inputs and outputs of the process are shown in Table 3.

3.3.2. Ingot Casting

Two methods are generally employed for the transformation of sog-Si into ingots: the directional solidification and casting method. The present study concentrates on the directional solidification method, in which the polysilicon is melted within a crucible and then subjected to a gradual decrease in temperature from the thermal field or moved upwards from the bottom of the crucible. This process ultimately leads to the formation of ingots. Table 4 summarizes the inputs and outputs of the process.

3.3.3. Wafer Slicing

At this stage, a series of steps are employed to transform the silicon ingot into thin wafers with precise geometries. These steps involve affixing square ingots, marking lines, mixing mortar, degumming, washing, chamfering, truncating, ultrasonic cleaning, bonding ingots, wire saw slicing, cleaning and drying wafers, and testing samples. Furthermore, any silicon scrap produced during the wafer production is subjected to washing procedures to allow for recycling and reuse. The inputs and outputs of the wafer-slicing process are presented in Table 5.

3.3.4. Cell Processing

The anti-reflection film coating and passivation process is utilized to treat the cells. To perform both phases at the same time, this study considers the plasma-enhanced chemical vapor deposition (PECVD) process. This involves using sylane (SiH4) and ammonia (NH3) to deposit Si3N4 on the cells via a plasma-enhanced chemical reaction in a reactor at a temperature of 400–450 °C. The inputs and outputs include wafers, potassium hydroxide, nitrate, hydrochloric acid, nitrogen, acid, solid waste, and wastewater along with PV cells (Table 6).

3.3.5. Panel Assembling

Following testing, the cells undergo assembly into modules, which involves encapsulating them between two ethylene vinyl acetate (EVA) sheets. Afterward, a transparent tempered glass sheet is placed on the front side of the module, while a Tedlar/Al/Tedlar sheet is placed on the backside. An aluminum frame is then applied, along with a connection box on the posterior face. The inputs include glass, PV cells, frames, PET, EVA, water, anhydrous alcohol, soldering flux steam, and electricity. The output of the process includes PV panel, exhaust, cooling water, and solid waste (Table 7).

3.4. Impact Assessment

The life cycle impact assessment (LCIA) stage is a pivotal component of the LCA methodology, as it offers a scientific foundation for assessing the prospective environmental consequences of a product or process. The LCIA step converts the inventory data of the product or process into environmental impact scores, which are helpful in identifying the areas of concern and opportunities for environmental improvement. Moreover, the outcomes of the LCIA stage aid in decision-making processes and policy development by providing a scientific basis for comparing the environmental performance of diverse products or processes, which assists in identifying the most eco-friendly alternatives.
Numerous life cycle impact assessment approaches have been devised and are currently available in specialized LCA software databases. This study employs the CML-1A baseline impact assessment method in OpenLCA® software to appraise the environmental repercussions. The CML-1A baseline impact assessment method is a popular approach utilized in LCA for evaluating the environmental impacts of products or processes. It was developed by the Centre of Environmental Science at Leiden University, and has been implemented in various sectors such as agriculture, energy, transportation, and construction. Given its extensive use and applicability, the CML-1A method has become a standard tool for evaluating the environmental performance of products or processes in academia, industry, and government agencies [29,30,31]. Furthermore, the method performs assessments transparently by explicitly stating the underlying assumptions and providing comprehensive documentation of the analysis. The impact assessment is conducted by using the following environmental impact categories: acidification (kg SO2 eq.), eutrophication (kg PO43− eq.), global warming (kg CO2 eq.), terrestrial ecotoxicity (kg 1,4-dichlorobenzene, or 1,4-DB, eq.), freshwater aquatic ecotoxicity (kg 1,4-DB eq.) and photochemical oxidation (kg C2H4 eq.).

4. Results and Discussion

4.1. Analysis of Environmental Impacts

Table 8 shows the overall ecological impacts of the PV system, while 
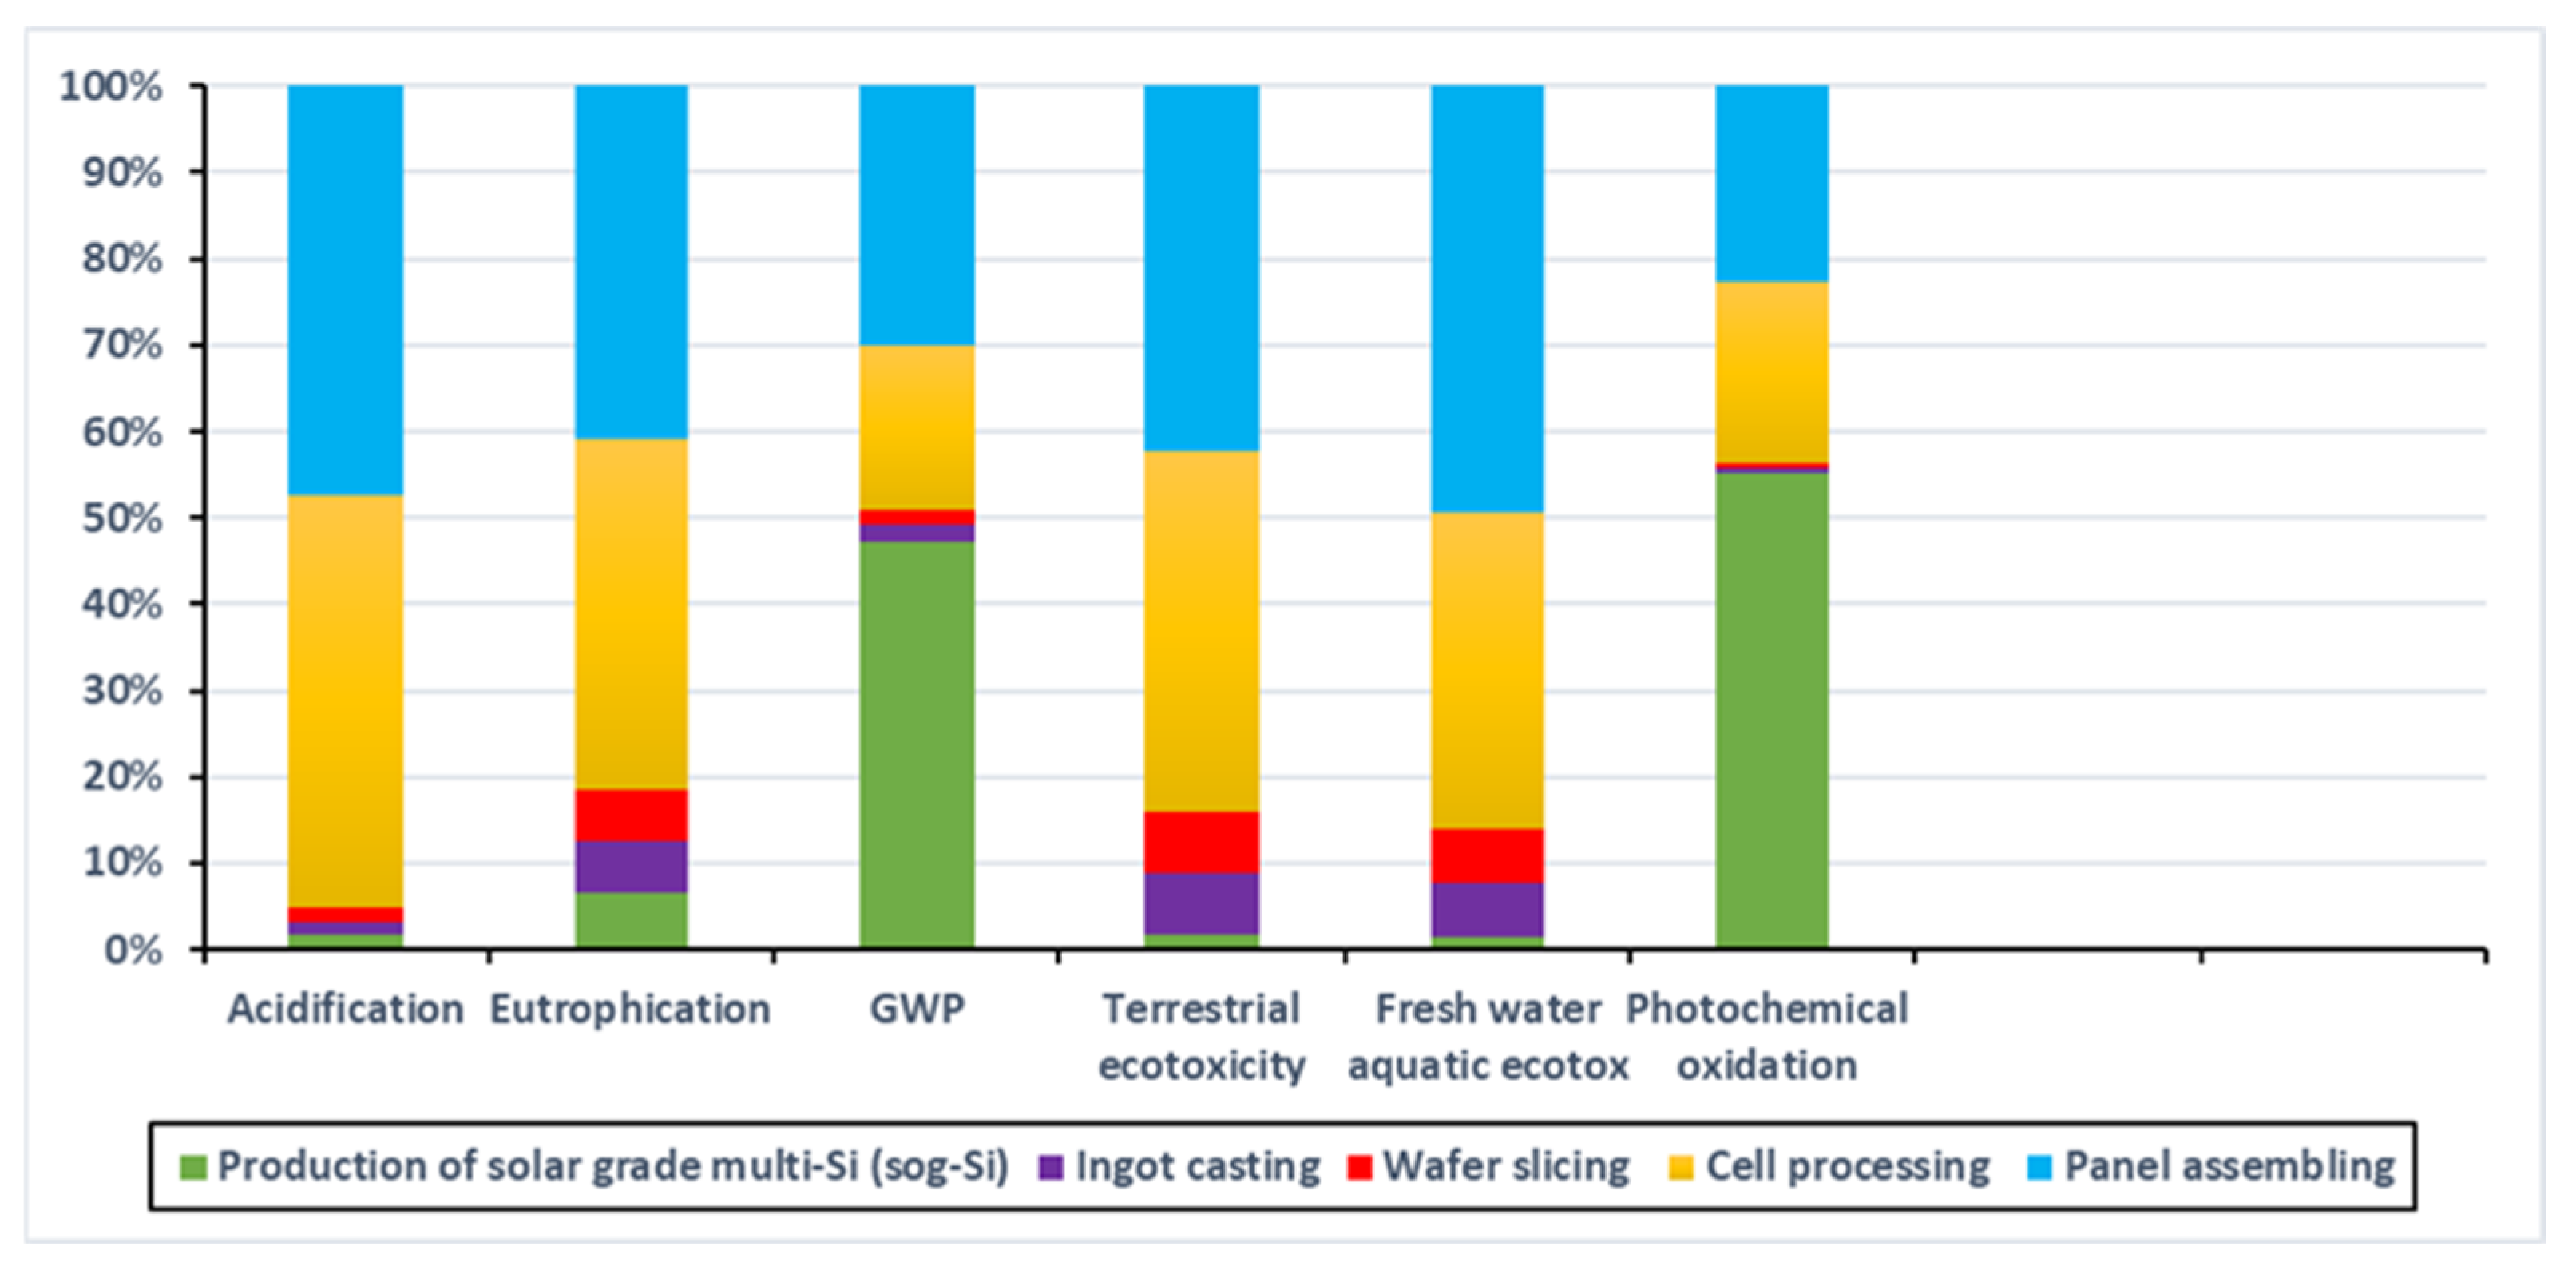
Figure 4 shows the percentage contribution of each environmental impact category in various stages of PV system production.
The life cycle assessment of the PV system indicated an AP value of 9.33 × 10⁴ kg SO2 eq./kWh, predominantly originating from the release of emissions into the atmosphere. A significant fraction of this AP value (around 72.9%) was contributed by sulfur dioxide, which can be mainly attributed to the energy consumption during each stage of the PV system. It is noteworthy that Pakistan relies heavily on thermal processes, such as coal, natural gas, and oil, for generating electricity, which results in the emission of considerable amounts of nitrogen oxides and sulfur dioxide.
The PV system environmental impact was quantified by its EP of 3.15 × 10⁻² kg PO43− eq./kWh, primarily driven by emissions to air and freshwater, which included phosphate, nitrogen oxides, and nitrate. Phosphate emissions to freshwater constituted 45.4% of the total EP, primarily due to the production of electricity in Pakistan, where thermal processes generate most of the electricity, leading to the release of phosphate into the water during coal mining and power generation. The emission of nitrogen oxides to air accounted for 44.6% of the total EP, primarily due to the steam and electricity utilization generated from fossil fuels in Pakistan, which emit significant nitrogen oxide amounts.
The GWP of a PV system was estimated to be 5.30 × 10⁻² kg CO2 eq./kWh, with carbon dioxide and methane accounting for 83.3% and 11.7%, respectively. The most significant contributors were the solar-grade multi-Si (sog-Si) production stage, which accounted for nearly 50% of the GWP (Figure 4), owing to high steam and electricity consumption. Cell production also had a considerable impact on GWP due to electricity usage. The underlying reason was the predominance of thermal processes in the generation of Pakistani electricity, which releases substantial amounts of greenhouse gases. Nevertheless, in module production, the consumption of material had a greater effect on GWP than electricity use. Specifically, aluminum framing and PVF film contributed 46.1% and 26.4%, respectively, while only 8.2% accounted for electricity use. This was because the production processes for PVF and aluminum emitted substantial CO2 amounts.
The calculated value of TE of the PV system was 3.25 × 10⁻⁵ kg 1,4 DB eq./kWh, with the largest impact coming from emissions to air and fresh water. Emissions to air were responsible for 74.3% of the total TE value and consisted of heavy metals, organic and inorganic emissions. Heavy metals, such as selenium, chromium, arsenic, and nickel were mainly emitted during steam and electricity consumption, as well as in the material used during module production. These metals were present in the fossil fuels used to generate Pakistani electricity and steam. Organic and inorganic air emissions were primarily polychlorinated dibenzo-p-dioxins and hydrogen fluoride, which were produced during waste glass disposal in wafer production and the consumption of energy. Freshwater emissions contributed 25.7% to the TE value and consisted mainly of heavy metals, including vanadium (+III), selenium, and thallium, produced during electricity generation.
The life cycle assessment of the PV system resulted in an FWAE value of 5.96 × 10⁻² kg 1,4 DB-eq./kWh. The analysis identified cell processing and panel assembling stages with the highest contribution to the ecotoxicity impact. Specifically, cell processing contributed 34.3% and panel assembling contributed 49.7% to the total impact. The elements that are contributing to freshwater aquatic ecotoxicity in the cell processing stage include chemicals such as HCl and nitric acid used for cleaning and etching of the silicon wafer. In addition, solvents such as n-methyl-2-pyrrolidone (NMP) and isopropanol used in the manufacturing of cells may also contribute to ecotoxicity. Similarly, in the panel assembling stage, the elements that contribute to FWAE include lead (Pb) and cadmium (Cd) from soldering and silver (Ag) from the front metallization process. The use of PVF as a backsheet material and the formation of NOx during the manufacturing process of the backsheet material also contributes to the ecotoxicity impact.
The evaluation of the PV module production’s potential environmental impact resulted in a PO value of 1.85 × 10⁻⁵ kg ethane eq./kWh. The impact was primarily driven by the emission of inorganic and organic compounds into the atmosphere. Sulfur dioxide was identified as the most significant contributor, accounting for 56.1% of the total impact. This was mainly attributed to the utilization of steam and electricity during the solar-grade multi-Si (sog-Si) production, wafers, cells, and ingots including the use of the PVF film and aluminum frame during module production. Nitrogen dioxide was also a significant contributor, accounting for 15% of the total impact, and had similar characteristics to sulfur dioxide. The second-largest contributor was non-methane volatile organic compounds (NMVOC), resulting from the consumption of the PVF, EVA, and aluminum frame during the production of the module, NMVOC air emissions during the production of the cell, and the steam and electricity utilization in every production stage.
These results underscore the necessity of considering the entire life cycle of PV modules to identify potential mitigation measures and minimize their environmental impact, from the raw material extraction and processing stages to the end-of-life disposal stage, to identify potential mitigation measures and minimize their environmental impact. By assessing the environmental impact of PV modules throughout their life cycle, it is possible to determine the stages with the highest contribution to the overall environmental impact. Such stages, known as “hotspots,” can then be targeted to minimize the modules’ impact on the environment.

4.2. Environmental Significance and Mitigation of Multi-Si PV Life-Cycle Stages

As previously discussed, the stages that hold the greatest environmental significance within the multi-Si PV lifecycle are the production of multi-Si material, the processing of cells, and the assembly of panels. The details concerning these stages are as follows:
  • Multi-Si production: This process is energy-intensive and involves high-temperature operations, which may lead to significant environmental impacts. Implications include:
    • Energy Consumption: energy-intensive processes such as melting and crystallizing silicon can contribute to a high carbon footprint; the energy sources used for these processes (e.g., fossil fuels—in case of Pakistan—vs. renewable energy) greatly influence the environmental impact.
    • Resource depletion: raw material extraction, particularly for silicon, can lead to resource depletion and habitat destruction; mining quartz and other materials can result in ecosystem disruption.
    • Waste generation: Silicon production generates waste by-products that might include slag, dust, and emissions; proper management and disposal of these wastes are important to prevent environmental contamination.
  • Cell processing: Cell processing is critical for the conversion of sunlight into electricity, and involves turning silicon wafers into photovoltaic cells through various steps, including doping, etching, and metallization; environmental implications of his stage; include:
    • Chemical usage: Many chemical substances are used in cell processing, some of which can be hazardous; the use, storage, and disposal of these chemicals need careful consideration to avoid environmental contamination.
    • Waste generation: The processes in cell manufacturing generate waste such as chemical by-products and materials removed during etching; proper waste management and treatment are important to minimize negative impacts.
    • Energy efficiency: The efficiency of cell processing steps impacts the overall energy production of the PV system, so that higher efficiency cells tend to have lower environmental impacts over their lifecycle due to their better energy conversion performance.
  • Panel Assembling: Panel assembling involves combining the photovoltaic cells with other components to create a functioning solar panel. This stage includes encapsulation, framing, and wiring. Implications include:
    • Material selection: The choice of materials for encapsulation, framing, and other components can influence the panel’s durability, efficiency, and overall environmental impact.
    • Manufacturing processes: The assembly process requires energy and resources; efficient assembly techniques and technologies can reduce the environmental footprint.
    • End-of-Life management: The way panels are designed for disassembly and recycling at their end-of-life can significantly impact the sustainability of the entire system. Improper disposal can lead to waste and environmental harm.

4.3. EPBT and Primary Energy Demand

The EPBT has gained popularity as a commonly utilized parameter, owing to its easily interpretable input–output format. Its calculation method is simplified and can be expressed as follows:
E P B T = E n e r g y   i n v e s t e d   i n   t h e   P V   m o d u l e A n n u a l   e n e r g y   p r o d u c t i o n   o f   t h e   P V   m o d u l e
where the energy invested in the PV module is equal to the total primary energy consumed during the production, transportation, installation, and end-of-life disposal of the PV module, and the annual energy production of the PV module is equal to the product of the PV module’s rated power and the average number of peak sunshine hours per day at the installation site.
It is important to note that the use of EPBT has been placed under scrutiny, and alternative indexes have been proposed, such as the GHG payback time, defined as the period during which the PV module must operate to offset the emissions embedded in its production [32,33]; however, in this paper the use of EPBT has been deemed to be more appropriate, mainly due to its wider use in the open literature, that allows easier evaluation of the obtained results.
By utilizing the data acquired and the OpenLCA® database, the cumulative primary energy demand (taking into account both renewable and non-renewable resources) of the PV system was assessed to be 0.519 MJ/kWh based on the net calorie value. Accordingly, for a 200 Wp multi-crystalline silicon PV system, the total primary energy demand was found to be 2530 MJ, with calculations eliminating all negligible flows comprising less than 0.1%.
Non-renewable resources such as natural gas, coal, and oil were the primary contributors to the primary energy demands of the PV system. This was primarily a result of the energy-intensive production phases required for the manufacture of solar-grade multi-Si and cells, which primarily utilized electricity generated from thermal processes. The module assembly stage, which involved the production of EVA copolymer, PVF film, and PET film, primarily contributed to the consumption of crude oil and natural gas. The primary energy demand is maximum for the production of solar-grade multi-Si stage (49%) followed by panel assembling (25%), production of cells (19%), and ingots (5%).
Based on the calculated primary energy demand and a rated power of 1 kW for the PV module, the energy invested in the PV module can be estimated as 20,240 MJ based on industry averages (as the average payback period of multi-Si PV is 8 years). Using this value and the annual average solar radiation and peak sunshine hours, the EPBT for different regions in Pakistan is shown in Table 9.
According to the results, EPBT of multi-Si PV systems in Pakistan was found to be significantly lower than their lifespan, regardless of the region where they were installed. Optimal locations for installation were identified as Balochistan, Sindh, and Punjab, with an EPBT of approximately 2 to 3 years, indicating that the energy consumed during the system’s life cycle stages was recovered within this time frame. The EPBT in Gilgit-Baltistan and Azad Jammu and Kashmir regions was also reasonable, at between 3 to 3.5 years, suggesting that PV system development in Pakistan was a feasible option for energy purposes.

4.4. Sensitivity Analysis

A sensitivity analysis was performed to evaluate the effects on environmental impacts and primary energy demand. This analysis was conducted while keeping the processing technology constant. This study exclusively utilized the information provided in Table 2, encompassing module characteristics and solar radiation details. The sensitivity analysis aimed to ascertain the impact of certain factors on environmental consequences and energy demand. These factors included the consumption of electricity and steam during the production of solar-grade multi-Si, the usage and disposal of glass during the wafer slicing process, the electricity consumption during cell processing, as well as the consumption of aluminum and glass during the assembly of modules.
A decrease of 10% in the utilization of electricity during the manufacturing process of solar-grade multi-Si would precipitate a 3.36% reduction in the primary energy demand (Table 10). Conversely, an increase of 10% in electricity consumption would lead a corresponding increase of 3.36% in the primary energy demand. The dominant factor affecting primary energy demand, AP, and EP was the electricity consumption observed during the production of solar-grade multi-Si. Subsequently, the influence lessened in the order of electricity consumption during cell processing, steam consumption during solar-grade multi-Si production, and the consumption of aluminum and glass during the assembly of modules. Similarly, the primary influence on the GWP and PO originated from electricity consumption during the production of solar-grade multi-Si. Subsequently, the effects of electricity consumption during cell processing took place, trailed by aluminum consumption during module assembly, steam consumption during solar-grade multi-Si production, and finally, the utilization of glass during module assembly. In terms of TE, the paramount impact stemmed from electricity consumption during the production of solar-grade multi-Si, accounting for approximately 2.97% (Table 10). This was trailed by the influence of glass consumption and disposal during wafer slicing, which amounted to 2.10%. On the FWAE, the most significant factor was aluminum consumption during module assembly. Notably, a reduction of 10% in aluminum consumption during module assembly would correspondingly result in a substantial 7.00% decrease in the FWAE.

5. Discussion

5.1. Comparison of Solar PV with Wind Power Generation Systems in Pakistan

The demand for electricity in Pakistan is rising rapidly, and the country is eager to find sustainable ways to meet this need. One potential solution is to invest in renewable energy sources such as solar and wind power [34]. Pakistan has significant renewable energy potential, with abundant sunlight and strong winds in many parts of the country. Figure 5, Figure 6, Figure 7 and Figure 8 shows the comparison between solar PV and wind power generation systems in various regions in Pakistan.
In the context of renewable energy, it is important to select the optimal energy source for a given location based on various environmental factors. In this regard, a comparison was made between wind turbines and solar PV systems for the city of Karachi, where the monthly average electricity generation was analyzed for one year, as depicted in Figure 5. The findings indicate that while wind speeds in Karachi are favorable for electricity generation for roughly 5 months, solar radiation remains consistent throughout the year, making solar energy a better option in Karachi than wind energy.
Similarly, in the case of Lahore city, the suitability of wind turbines and solar PV systems as energy sources were compared using Figure 6, which presents the average monthly electricity generation for both systems. Again, the results demonstrate that solar PV is the preferable energy source for Lahore city, as it generates higher average monthly electricity compared to wind turbines. These findings are consistent with scientific knowledge as wind energy requires consistent wind speeds to generate electricity, whereas solar energy is more efficient in areas with high levels of solar radiation.
Figure 7 presents a comparative analysis between the suitability of solar PV and wind power systems for Faisalabad city. The results demonstrate that solar energy provides better energy output throughout the year, while wind energy is only suitable during June. Similarly, Figure 8 compares the monthly average energy production of solar and wind energy systems in Bahawalpur City. The findings indicate that solar energy is the most suitable renewable energy source for this location.

5.2. Environmental Comparison with Other Power Generation Systems

Pakistan’s electricity generation capacity primarily stems from thermal processes (59.6%), hydropower (25%), nuclear (12.3%), and renewables (12.3%). The growth of renewables in the energy mix is promising but is not keeping pace with the escalating global electricity demand. Consequently, the reliance on coal and fossil fuels is increasing, posing a risk of higher CO2 emissions within the electrical sector. The latest report by the International Energy Agency (IEA) highlights this concern. Emission levels per unit of electricity (kWh) vary, depending on the specific renewable energy source used and the efficiency of the power plants. Figure 9 illustrates the carbon intensity per kWh of the power system. Broadly, renewables exhibit the lowest emissions, while fossil fuels such as coal and crude oil contribute significantly to CO2 emissions. On the other hand, renewable sources such as wind and solar power help reduce carbon intensity [37].
Although a complete transition from coal to PV power cross the entire Pakistani grid is currently impractical due to the higher economic cost of PV in comparison to coal-fired generation. Moreover, certain regions characterized by low solar radiation are unsuitable for PV installation. Nevertheless, there is potential to gradually substitute coal-fired generation with PV power as costs decrease and government support through subsidies and incentives becomes more available. In the foreseeable future of Pakistan’s energy landscape, the adoption of both large-scale grid-connected PV systems and small distributed PV systems is anticipated to witness significant expansion.

5.3. The Current Status and Future Directions of Solar Power Utilization

Pakistan has made significant strides in the deployment of solar energy technology over the last two decades [38]. In the early 1980s, a total of only 18 solar PV power stations were established in various regions of the country, each possessing a capacity of approximately 440 kW. Regrettably, these installations failed to meet performance expectations, primarily owing to insufficient technical expertise [39]. Currently, several organizations have acquired and implemented cutting-edge technology and knowledge, backed by government support, to attain high efficiency in this domain. Solar technology is currently applied in a wide range of stationary settings, including electronics, telephone stations along highways, refrigeration, communication towers, street and garden lighting, and others. Moreover, the Department of Public Health has deployed nearly 20 solar-powered drinking water pumps across various regions of Baluchistan.
The national government facilitated the design, development, installation, and testing of 100 new models of solar PV systems for the generation of electricity near Islamabad [40]. The city’s primary grid-tied solar power plant, with a PV capacity of 356 kWp, began operations on 29 May 2012, under the Clean Energy through Solar Electricity Generation System project in Islamabad. Additionally, under the auspices of the national program by the Punjab government, a 10 kWp power generation unit was erected at the Beacon House Canal Side Campus in Lahore. The program’s objective was to implement 50–100 MWp of PV facilities in 2013 and around 300 MWp in 2014 [41]. Furthermore, advocates of sustainability contend that equipping each house in rural communities with a solar panel would prove cost-effective and would promote social and, to some extent, economic welfare.
In May 2015, the Pakistani government launched the Quaid-e-Azam Solar Park in Bahawalpur, Punjab, with a total capacity of 100 MWp. This project, which was constructed at a cost of approximately USD 131 million, comprises 400,000 solar panels [42]. Current efforts are focused on expanding the capacity of the solar plant. Nonetheless, impediments such as the absence of regional technical proficiency and other influential factors persist as significant hindrances to the efficient utilization of electricity produced by this substantial initiative.
With various initiatives led by the government and private organizations, Pakistan is expected to see significant advancements in solar technology in the upcoming years (Table 11). The current status of some major solar projects underway is presented in Table 12. The Alternative Energy Development Board (AEDB) has projected that more than 1000 MWp of capacity for PV systems will be established throughout the country in the coming years.

5.4. Strategies for the Effective Integration and Application of PV Systems in Pakistan

This section delves into strategic considerations and viable pathways for the seamless integration and effective application of PV systems within the unique energy landscape of Pakistan. The following strategies encompass a range of approaches, from decentralized energy solutions to innovative technological implementations, all aimed at harnessing the full potential of solar power across various sectors in the country.
One promising avenue is to implement distributed solar power generation systems across the country. This approach could prove particularly valuable in remote and off-grid areas that currently lack reliable access to electricity. By establishing decentralized solar systems, Pakistan can extend electricity services to communities that have long been underserved by traditional grid infrastructure. Furthermore, embracing solar water pumping systems presents a practical solution to address water scarcity challenges. Solar-powered pumps can significantly reduce the dependency on fossil fuel-driven pumps for agricultural and rural water needs. This approach not only contributes to sustainable water management but also aligns with the country’s renewable energy objectives. Another innovative approach involves the integration of solar panels with agricultural activities, known as “agrivoltaics”. This approach optimizes land usage by allowing farmers to simultaneously harness solar energy and cultivate crops. Agrivoltaics can enhance crop productivity while providing an additional revenue stream for farmers, thus fostering a harmonious relationship between energy production and agriculture.
To harness solar energy in urban environments, encouraging the adoption of industrial and commercial rooftop solar systems is pivotal. This initiative can mitigate the energy consumption of industries and businesses by tapping into clean, renewable sources. By reducing peak load demands on the grid, such installations contribute to more stable and efficient energy distribution. Effective policy mechanisms are also essential. Implementing net metering and feed-in tariff programs can incentivize individuals and businesses to invest in PV systems. These policies enable surplus energy generated by solar installations to be fed back into the grid, empowering energy consumers to actively contribute to the energy ecosystem while reaping financial benefits.
Public education and awareness campaigns play a pivotal role in shaping attitudes toward solar energy adoption. Informing citizens about the multifaceted advantages of solar power fosters a culture of sustainability and encourages wider uptake of PV systems across various sectors. To catalyze solar adoption, government support through financial incentives, subsidies, and tax benefits is crucial. Establishing a conducive regulatory framework ensures seamless integration and operation of PV systems, further bolstering their attractiveness. Investing in research and development to enhance PV technology’s efficiency and cost-effectiveness is a strategic move. Tailoring solutions to Pakistan’s specific climate conditions can yield cutting-edge solar solutions that align with the nation’s energy goals.
Exploring hybrid energy systems that integrate solar with other renewable sources such as wind and hydropower can provide a more stable and reliable energy supply, particularly in regions with varying weather patterns. Community-based solar projects, where local communities collectively own and manage PV systems, foster a sense of ownership and responsibility. These initiatives can empower communities to actively engage in sustainable energy practices.
Strategic incorporation of solar energy considerations into urban planning and building design promotes energy-efficient infrastructure that seamlessly integrates solar panels. Finally, recognizing the potential for solar energy to drive economic growth and job creation can incentivize investment in the renewable energy sector. Supporting skill development and training programs ensures a capable workforce ready to drive Pakistan’s renewable energy ambitions forward.

6. Implications and Limitations of This Study

The assessment of environmental impacts demonstrates that multi-crystalline silicon PV modules possess a favorable profile with regard to acidification potential, eutrophication potential, and terrestrial ecotoxicity. This outcome suggests that adopting these PV systems can contribute significantly to reducing air and water pollution levels, aligning well with Pakistan’s pursuit of cleaner and healthier ecosystems. Furthermore, this study reveals that the global warming potential of multi-Si PV modules is substantially lower compared to conventional energy sources. This finding holds the potential to substantially aid Pakistan in its endeavor to reduce greenhouse gas emissions, in consonance with international commitments aimed at mitigating climate change.
This study also highlights the promising potential of multi-Si PV modules in minimizing adverse impacts on local freshwater ecosystems. With relatively low levels of freshwater emissions and aquatic ecotoxicity potential, these modules emerge as a sustainable choice for regions in Pakistan, where water resources hold critical significance. What’s noteworthy is that the EPBT data underscores the swift harnessing of solar energy across diverse regions in Pakistan. EPBT values ranging from 2.5 to 3.4 years signify that these regions can achieve net energy generation in a relatively short span, rendering solar adoption both practically efficient and economically viable.
The variations in EPBT values across different regions further emphasize the importance of deploying multi-Si PV systems in a manner that’s closely aligned with regional solar radiation and sunshine patterns. This nuanced approach to system deployment can optimize energy generation efficiency and overall performance. Moreover, this study suggests that the relatively short EPBT directly translates into quick recovery of the initial energy investment in manufacturing and installation. This economic efficiency aspect aligns seamlessly with Pakistan’s aspirations of diversifying its energy sources and reducing its reliance on imported fuels. Furthermore, the adoption of multi-Si PV modules resonates with Pakistan’s pursuit of the United Nations Sustainable Development Goals, specifically in the realms of affordable and clean energy (SDG 7) and climate action (SDG 13).
While these implications are significant, it is important to acknowledge the limitations of this study. Firstly, the scope of the analysis is centered on the environmental impacts and EPBT of multi-Si PV modules within specific regions of Pakistan. While these findings offer valuable insights, they might not encompass the complexities associated with other photovoltaic technologies or broader considerations within the energy system.
Additionally, this study primarily focuses on specific lifecycle stages, such as production and use. Other stages, including module transportation, installation, and maintenance, could potentially influence the overall environmental impacts and deserve further exploration. Given the reliance on various assumptions and data sources in environmental impact assessments, a degree of uncertainty is inherent in the results. Furthermore, this study’s utilization of regional solar data might not fully account for localized factors that can impact EPBT values. Lastly, this study’s assumption of a fixed primary energy demand value might not encapsulate variations in energy generation and consumption patterns across different regions and timeframes. Moreover, while this study provides valuable insights into the environmental impacts of PV modules, extrapolating these findings to larger MW or GW plant sizes necessitates careful consideration of additional factors that might influence the results.

7. Conclusions

In summary, the analysis conducted in this study revealed significant findings regarding the feasibility of utilizing multi-Si PV systems for energy production in Pakistan. The results demonstrated a primary energy demand of 0.519 MJ/kWh and an EPBT of 2.5–3.4 years for the systems, which is practical and economically viable given their expected lifespan of approximately 25 years. This study identified multi-Si production, cell processing, and panel assembling stages as the most significant contributors to primary energy demand and environmental impacts, with thermal processes being the primary source of electricity in Pakistan. Comparing solar energy and wind power generation systems in Pakistan, this study highlights that solar energy is a better source of renewable energy due to its year-round availability of solar radiation in the country. Solar technologies offer an economical and environmentally friendly means of generating electricity and can provide power to off-grid areas far from urban centers. The integration of solar thermal and photovoltaic technologies can offer substantial economic advantages by diminishing dependence on conventional energy sources. Nonetheless, the widespread implementation of solar energy in the country is impeded by significant challenges such as incoherent policies, limited synchronization between various entities, inadequate infrastructure, and insufficient investment incentives for the progression of solar-based technologies. Consequently, this study suggests the implementation of favorable policies and proactive measures to commercialize and foster solar energy technology, which would allow for the exploitation of the immense solar power potential in Pakistan.

Author Contributions

All authors (H.H.S., P.B., E.M. and F.P.) participated in all stages of this work, from conception to this study and final submission. We highlight some important stages: conceptualization, software, methodological development, data and results analysis, writing, drafting and original article, review and final edition. All authors have read and agreed to the published version of the manuscript.

Funding

This research received no external funding.

Data Availability Statement

Not applicable.

Acknowledgments

Authors wish to thank the Department of Engineering and the Laboratory of Chemical Process Engineering, Università degli Studi del Sannio, for providing financial assistance.

Conflicts of Interest

The authors declare no conflict of interest.

References

  1. Li, G.; Li, M.; Taylor, R.; Hao, Y.; Besagni, G.; Markides, C. Solar energy utilisation: Current status and roll-out potential. Appl. Therm. Eng. 2022, 209, 118285. [Google Scholar] [CrossRef]
  2. Mekhilef, S.; Saidur, R.; Safari, A. A review on solar energy use in industries. Renew. Sustain. Energy Rev. 2011, 15, 1777–1990. [Google Scholar] [CrossRef]
  3. Alrikabi, N.K. Renewable energy types. J. Clean Energy Technol. 2014, 2, 61–64. [Google Scholar] [CrossRef]
  4. Hunt, L.P. Total energy use in the production of silicon solar cells from raw materials to finished product. In Proceedings of the 12th Photovoltaic Specialists Conference, Baton Rouge, LA, USA, 15–18 November 1976. [Google Scholar]
  5. Ashraf, I.; Chandra, A. Energy pay-back time and air pollution mitigation of a 100-kWp grid connected SPV power plant for Lakshadweep island. In Proceedings of the 39th International Universities Power Engineering Conference (UPEC 2004), Bristol, UK, 6–8 September 2005. [Google Scholar]
  6. Dones, R.; Frischknecht, R. Life-cycle assessment of photovoltaic systems: Results of Swiss studies on energy chains. Prog. Photovolt. 1998, 6, 117–125. [Google Scholar] [CrossRef]
  7. Frankl, P.; Masini, A.; Gamberale, M.; Toccaceli, D. Simplified life-cycle analysis of PV systems in buildings: Present situation and future trends. Prog. Photovolt. 1998, 6, 137–146. [Google Scholar] [CrossRef]
  8. Phylipsen, G.J.M.; Alsema, E.A. Environmental Life-Cycle Assessment of Multicrystalline Silicon Solar Cell Modules; Netherlands Agency for Energy and the Environment: Amsterdam, The Netherlands, 1995. [Google Scholar]
  9. Lu, Y.; Yue, T.; Chen, C.; Fan, Z.; Wang, Q. Solar radiation modeling based on stepwise regression analysis in China. J. Remote Sens. 2010, 14, 852–864. [Google Scholar]
  10. Zhang, D.; Tang, S.; Lin, B.; Liu, Z.; Zhang, X.; Zhang, D. Co-benefit of polycrystalline large-scale photovoltaic power in China. Energy 2012, 41, 436–442. [Google Scholar] [CrossRef]
  11. Zhai, P.; Williams, E.D. Dynamic Hybrid Life Cycle Assessment of Energy and Carbon of Multicrystalline Silicon Photovoltaic Systems. Environ. Sci. Technol. 2010, 44, 7950–7955. [Google Scholar] [CrossRef] [PubMed]
  12. Jungbluth, N. Life cycle assessment of crystalline photovoltaics in the Swiss ecoinvent database. Prog. Photovolt. 2005, 13, 429–446. [Google Scholar] [CrossRef]
  13. Koroneos, C.; Stylos, N.; Moussiopoulos, N. LCA of multicrystalline silicon photovoltaic systems. Part 2: Application on an island economy. Int. J. Life Cycle Assess. 2006, 11, 183–188. [Google Scholar] [CrossRef]
  14. Tsoutsos, T.; Frantzeskaki, N.; Gekas, V. Environmental impacts from the solar energy technologies. Energy Policy 2005, 33, 289–296. [Google Scholar] [CrossRef]
  15. Economic Advisory Council. The Energy Expert Group Integrated Energy Plan 2009–2022; Government of Pakistan: Islamabad, Pakistan, 2009.
  16. Rafique, M.M.; Rehman, S. National energy scenario of Pakistan—Current status, future alternatives, and institutional infrastructure: An overview. Renew. Sustain. Energy Rev. 2017, 69, 156–167. [Google Scholar] [CrossRef]
  17. Rafique, M.M.; Rehman, S.; Al-Hadhrami, L.M. Developing zero energy and sustainable villages—A case study for communities of the future. Renew. Energy 2018, 127, 565–574. [Google Scholar] [CrossRef]
  18. Rafique, M.M. A pathway for sustainable energy development in Pakistan and other developing countries. Energy Manag. Res. J. 2020, 3, 1–12. [Google Scholar]
  19. Ernst & Young Global Limited. Renewable Energy Country Attractiveness Index (RECAI); Ernst & Young Global Limited: New York, NY, USA, 2020. [Google Scholar]
  20. International Renewable Energy Agency. Renewable Capacity Statistics 2023. Available online: https://www.irena.org/Publications/2023/Mar/Renewable-capacity-statistics-2023 (accessed on 17 July 2023).
  21. ISO 14040; Environmental Management—Life Cycle Assessment—Principles and Framework. International Organisation for Standardization: Geneva, Switzerland, 2006.
  22. Fthenakis, V.M.; Kim, H.C. Photovoltaics: Life-cycle analyses. Sol. Energy 2011, 85, 1609–1628. [Google Scholar] [CrossRef]
  23. de Wild-Scholten, M.; Alsema, E. Environmental life cycle inventory of crystalline silicon photovoltaic module production. Mater. Res. Soc. Online Proc. Libr. 2005, 895, 304. [Google Scholar] [CrossRef]
  24. Cabeza, L.F.; Rincón, L.; Vilariño, V.; Pérez, G.; Castell, A. Life cycle assessment (LCA) and life cycle energy analysis (LCEA) of buildings and the building sector: A review. Renew. Sustain. Energy Rev. 2014, 29, 394–416. [Google Scholar] [CrossRef]
  25. Le Tong, L.; Liu, X.; Yuan, Z.; Zhang, Q. Life cycle assessment of water reuse systems in an industrial parks. J. Environ. Manag. 2013, 129, 471–478. [Google Scholar] [CrossRef]
  26. Stoppato, A. Life cycle assessment of photovoltaic electricity generation. Energy 2008, 33, 224–232. [Google Scholar] [CrossRef]
  27. Frischknecht, R.; Stolz, P.; Krebs, L.; de Wild-Scholten, M.; Sinha, P.; Fthenakis, V.; Kim, H.C.; Raugei, M.; Stucki, M. Life Cycle Inventories and Life Cycle Assessment of Photovoltaic Systems; International Energy Agency (IEA) PVPS Task 12, Report T12-19; IEA: Paris, France, 2020. [Google Scholar]
  28. Nishimura, A.; Hayashi, Y.; Tanaka, K.; Hirota, M.; Kato, S.; Ito, M.; Araki, K.; Hu, E.J. Life cycle assessment and evaluation of energy payback time on high-concentration photovoltaic power generation system. Appl. Energy 2010, 87, 2797–2807. [Google Scholar] [CrossRef]
  29. Amin, M.; Chung, E.; Shah, H.H. Effect of different activation agents for activated carbon preparation through characterization and life cycle assessment. Int. J. Environ. Sci. Technol. 2022, 20, 7645–7656. [Google Scholar] [CrossRef]
  30. Amin, M.; Shah, H.H.; Iqbal, A.; Farooqi, Z.U.R.; Krawczuk, M.; Zia, A. Conversion of Waste Biomass into Activated Carbon and Evaluation of Environmental Consequences Using Life Cycle Assessment. Appl. Sci. 2022, 12, 5741. [Google Scholar] [CrossRef]
  31. Amin, M.; Shah, H.H. Effect of Absorption Time for the Preparation of Activated Carbon from Wasted Tree Leaves of Quercus alba and Investigating Life Cycle Assessment. C 2022, 8, 57. [Google Scholar] [CrossRef]
  32. Schultz, H.S.K.; Carvalho, M. Design, greenhouse emissions, and environmental payback of a photovoltaic solar energy 783 system. Energies 2022, 15, 6098. [Google Scholar] [CrossRef]
  33. Fonseca, L.F.S.; Carvalho, M. Greenhouse gas and energy payback times for a wind turbine installed in Brazilian Northeast. Front. Sustain. 2022, 3, 160. [Google Scholar] [CrossRef]
  34. Amin, M.; Shah, H.H.; Anaiz, G.F.; Wasim, U.K.; Chung, E.; Zia, A.; Ur Rahman, Z.F.; Lee, C. Hydrogen production through renewable and non-renewable energy processes and their impact on climate change. Int. J. Hydrogen Energy 2022, 47, 33112–33134. [Google Scholar] [CrossRef]
  35. Mazhar, H.; Baloch, G.; Kaloi, S.; Memon, Z.A. Current scenario of the wind energy in Pakistan challenges and future perspectives: A case study. Energy Rep. 2016, 2, 201–210. [Google Scholar]
  36. Raza, M.A.; Lal Khatri, K.; Ul Haque, M.I.; Shahid, M.; Rafique, K.; Waseer, T.A. Holistic and scientific approach to the development of sustainable energy policy framework for energy security in Pakistan. Energy Rep. 2022, 8, 4282–4302. [Google Scholar] [CrossRef]
  37. Hannan, M.; Al-Shetwi, A.; Begum, R.; Ker, P.; Mansor, M.; Rahman, S.; Dong, Z.; Tiong, S.; Mahlia, T.; Muttaqi, K. Impact of renewable energy utilization and artificial intelligence in achieving sustainable development goals. Energy Rep. 2021, 7, 5359–5373. [Google Scholar] [CrossRef]
  38. Rafique, M.M.; Bahaidarah, H.M.S. Thermo-economic and environmental feasibility of a solar power plant as a renewable and green source of electrification. Int. J. Green Energy 2019, 16, 1577–1590. [Google Scholar] [CrossRef]
  39. Raza, R.; Hayat, S.A.; Chaudhry, M.A.; Muhammad, J. Development and study of PEM fuel cell in Pakistan. Energy Environ. 2009, 20, 597–604. [Google Scholar] [CrossRef]
  40. Zafar, U.; Rashid, T.U.; Khosa, A.A.; Khalil, M.S.; Rashid, M. An overview of implemented renewable energy policy of Pakistan. Renew. Sustain. Energy Rev. 2018, 82, 654–665. [Google Scholar] [CrossRef]
  41. Khan, M. Policy Review and Recommendations on the Promotion of Renewable Energy and Energy Efficiency; UNIDO: Islamabad, Pakistan, 2020. [Google Scholar]
  42. Asad, M.; Mahmood, F.I.; Baffo, I.; Mauro, A.; Petrillo, A. The Cost Benefit Analysis of Commercial 100 MW Solar PV: The Plant Quaid-e-Azam Solar Power Pvt Ltd. Sustainability 2022, 14, 2895. [Google Scholar] [CrossRef]
Figure 1. Electric power growth production demand in Pakistan [16,17].
Energies 16 06400 g001
Figure 2. Solar energy installed capacity in selected Asian countries in 2022 (MWp) [20].
Energies 16 06400 g002
Figure 3. System boundary of multi-Si PV production.
Energies 16 06400 g003
Figure 4. Percentage contribution of environmental impacts during PV module production.
Energies 16 06400 g004
Figure 5. Comparison between solar and wind power generation systems in Karachi [35,36].
Energies 16 06400 g005
Figure 6. Comparison between solar and wind power generation systems in Lahore [35,36].
Energies 16 06400 g006
Figure 7. Comparison between solar and wind power generation systems in Faisalabad [35,36].
Energies 16 06400 g007
Figure 8. Comparison between solar and wind power generation systems in Bahawalpur [35,36].
Energies 16 06400 g008
Figure 9. Environmental impacts of various power generation technologies (CO2e/kWh).
Energies 16 06400 g009
Table 1. Total solar energy installed capacity in Pakistan and in the world (MWp) [20].
PakistanWorldYear
101140,5142013
165180,7132014
266228,9212015
590301,0802016
655395,9452017
680489,3062018
755592,2452019
854720,4302020
1077861,5372021
12431,053,1152022
Table 2. PV system characteristics evaluated in this study.
Parameter Specification
Panel size1428 × 992 × 35 mm
Frame Aluminum alloy
Mass16.5 kg
Sheet thickness (EVA)0.5 mm
Front glass3.2 mm tempered glass
Number of cells54
Wafer thickness 200 µm ± 20 µm
Cells efficiency 16%
Cell area0.024 m2
Solar radiation (annual)3350 MJ/(m2·a)
Operational life 25 years
Open and optimum circuit voltage 33.5 V and 26.3 V
Optimum and short circuit current 7.62 A and 8.11 A
Operating temperature+85 °C to −40 °C
Maximum power at standard conditions 200 Wp
System voltage (maximum)1000 V DC
Series fuse rating (maximum)20 A
Power tolerance ±3%
Table 3. Life cycle inventory on the production of solar-grade multi-Si (sog-Si).
FlowsUnitValue
Inputs
Metallurgical silicon (>99%)kg6.07
Hydrochloric acid (30%)kg2.92
Calcium oxidekg6.50
Hydrogen (>99.8%)kg0.49
Hydrofluoric acid (20%)kg0.05
Nitrogen gaseouskg70.15
Nitric acid (35%)kg0.20
Sodium hydroxide (20%)kg4.79
Silicon tetrachloride (>99%)kg8.28
Steamkg384
Water kg10,396
Electricity MJ2286
Outputs
Solar-grade multi-Sikg5.50
Emissions to air (chlorosilane) g28.50
Emissions to water (COD)g82.15
Emissions to air (hydrogen fluoride)g0.20
Emissions to air (silicon dust)g8.25
Emissions to air (nitrogen dioxide)g3.10
Emissions to air (silicon tetrachloride)g9.20
Silicon dust for recovery (99%)kg0.80
Emissions to air (trichlorosilane)g31.30
Freshwater suspended solids g54.75
Emissions to air (water evapotranspiration)kg5990
Sources: [26,27,28].
Table 4. Life cycle inventory on the ingot casting process.
FlowsUnitValue
Inputs
Solar-grade multi-Sikg5.50
Quartz cruciblekg15.35
Silicon carbideg61.90
Hydrofluoric acid (49%)g253.65
Argonkg10.20
Sodium hydroxideg46.85
Compressed airm318.73
Steam kg7.55
Waterkg492.43
Electricity MJ157.51
Outputs
Multi-Si ingotkg5.45
Silicon carbideg61.40
Emissions to air (hydrogen fluoride)g0.58
Quartz crucible waste for recoverykg15.35
Waste acid g348.68
Emissions to air (water evapotranspiration)kg375.03
Sources: [26,27,28].
Table 5. Life cycle inventory on wafer slicing process.
FlowsUnitValue
Inputs
Multi-Si ingotkg5.45
Silicon carbideg175.75
Glasskg2.45
Acetic acidkg0.58
Steel wirekg17.09
Compressed airm329.03
Detergent kg2.21
Electricity MJ24.01
Water kg528.60
Outputs
Multi-Si waferkg3.32
Glasskg2.45
Acetic acidkg0.58
Scrap of silicon for recoverykg2.05
Residues glue for disposalg243.26
Wastewaterkg336.90
Sources: [26,27,28].
Table 6. Life cycle inventory on cell processing.
FlowsUnitValue
Inputs
Multi-Si waferkg3.32
Ethanol (99.6%)kg0.21
Ammoniag88.07
Hydrofluoric acidkg0.76
Hydrochloric acid (37%)kg2.55
Nitrogen kg7.60
Nitric acid (70%)kg1.41
KOH (21%)kg2.74
Phosphoric acid (85%)g9.26
Aluminum g0.36
Silver g67.88
Natural gas kg0.57
Waterkg866.02
Steamkg26.13
Electricity MJ686.61
Outputs
Multi-Si solar cellkW1.09
Emissions to air (hydrogen chloride)g4.90
Emissions to air (ammonia)g7.84
Emissions to air (nitrogen oxides)g60.98
Emissions to air (hydrogen fluoride)g3.91
Water kg888.10
NMVOC to airg34.62
Sources: [26,27,28].
Table 7. Life cycle inventory on the panel assembling process.
FlowsUnitValue
Inputs
Multi-Si solar cellkW1.09
Aluminumkg11.75
Glasskg63.24
Polyvinyl fluoride filmkg3.25
Polyethylene terephthalatekg3.25
Ethylene vinyl acetate copolymerkg7.50
Ethanolg56.95
Waterkg118.02
Isopropanolg17.65
ElectricityMJ72.00
Steamkg16.20
Outputs
Solar panelkW1.00
Emissions to air (water evapotranspiration)kg94.24
Activated carbon for the recoveryg61.09
Freshwater emissionskg23.76
Sources: [26,27,28].
Table 8. Overall environmental impacts of PV module production.
Environmental ImpactsUnitsValue
Acidification potential (AP)kg SO2 eq.9.33 × 10−4
Eutrophication potential (EP)kg PO43− eq3.15 × 10−2
Global warming potential (GWP)kg CO2 eq.5.30 × 10−2
Terrestrial ecotoxicity (TE)kg 1,4-DB eq.3.25 × 10−5
Freshwater aquatic ecotoxicity (FWAE)kg 1,4-DB eq.5.96 × 10−2
Photochemical oxidation (PO)kg C2H4 eq.1.85 × 10−5
Freshwater emissionskg23.76
Table 9. EPBT of a 200 Wp PV system in various regions of Pakistan.
RegionAnnual Average Maximum Solar
Radiation
Annual Average Peak SunshineEnergy Payback Period
kWh/m²/DayHoursYears
Balochistan6.58.02.5
Sindh6.37.82.6
Punjab6.07.12.8
Khyber Pakhtunkhwa5.76.63.0
Islamabad Capital Territory5.56.53.1
Gilgit-Baltistan5.45.93.3
Azad Jammu and Kashmir5.25.63.4
Table 10. Results of sensitivity analysis.
ProcessVariablesVariationEPAPGWPPOTEFWAEPrimary Energy Demand
Solar-grade multi-SiConsumption of electricity−10%−3.80%−3.96%−3.55%−3.20%−2.97%−0.42%−3.36%
+10%+3.80%+3.96%+3.55%+3.20%+2.97%+0.42%+3.36%
Consumption of steam−10%−0.45%−0.68%−0.68%−0.86%−1.01%0.00%−0.68%
+10%+0.45%+0.68%+0.68%+0.89%+1.01%0.00%+0.68%
Wafer slicingConsumption and disposal of glass−10%0.00%0.00%0.00%0.00%−2.10%−0.02%0.00%
+10%0.00%0.00%0.00%0.00%+2.10%+0.02%0.00%
CellsConsumption of electricity−10%−1.82%−1.60%−1.69%−1.53%−1.42%−0.20%−1.60%
+10%+1.82%+1.60%+1.69%+1.53%+1.42%+0.20%+1.60%
Modules assemblyConsumption of aluminum−10%−0.28%−0.48%−0.99%−1.47%−0.22%−7.00%−0.48%
+10%+0.28%+0.48%+0.99%+1.47%+0.22%+7.00%+0.48%
Consumption of glass−10%−0.12%−0.16%−0.11%−0.08%−0.05%−0.24%−0.16%
+10%+0.12%+0.16%+0.11%+0.08%+0.05%+0.24%+0.16%
Table 11. Emerging solar energy projects in Pakistan.
Developer Location Capacity (MWp)
ForshineThatta, Sindh, Pakistan50
Asia petroleumChakwal, Punjab, Pakistan30
Crystal EnergyThatta, Sindh, Pakistan2
First Solar Ltd.Sindh Province, Pakistan2
ET Solar Ltd.Attock, Punjab, Pakistan25
Act Solar Ltd.Noori Abad, Sindh, Pakistan50
ET Solar Ltd.Sialkot, Punjab, Pakistan50
Jafri AssociatesNoori Abad, Sindh, Pakistan50
Adamjee PowerThatta, Sindh, Pakistan10
Solar Blue Ltd.Punjab Province, Pakistan50
Table 12. List of some operational solar PV projects in Pakistan.
PV Station Location Capacity (MWp)
Zorlu Solar (Pvt) Ltd.Punjab, Pakistan150
Pakistan ParliamentIslamabad, Pakistan80
ForshineSindh, Pakistan50
Siddiqsons Solar Ltd.Punjab, Pakistan50
M/s R.E Solar l & ll (Pvt) Ltd.Sindh, Pakistan40
M/s Safe Solar Power (Pvt) Ltd.Punjab, Pakistan10
Quaid-e-Azam Solar ParkPunjab, Pakistan400
Fatima Jinnah parkIslamabad, Pakistan1
Oursons Pakistan Ltd.Sindh, Pakistan50
POF Sanjwal FactoryIslamabad, Pakistan5
M/s Integrated Power StationSindh, Pakistan50
M/s Access Solar (Pvt) Ltd.Punjab, Pakistan11.5
M/s Bakhsh Solar (Pvt) Ltd.Punjab, Pakistan10
Disclaimer/Publisher’s Note: The statements, opinions and data contained in all publications are solely those of the individual author(s) and contributor(s) and not of MDPI and/or the editor(s). MDPI and/or the editor(s) disclaim responsibility for any injury to people or property resulting from any ideas, methods, instructions or products referred to in the content.

