Article

Dynamic Dose-Based Emergency Evacuation Model for Enhancing Nuclear Power Plant Emergency Response Strategies

1
College of Energy, Xiamen University, Xiamen 361102, China
2
Fujian Provincial Nuclear Energy Engineering Technology Research Center, Xiamen 361005, China
*
Author to whom correspondence should be addressed.
Energies 2023, 16(17), 6338; https://doi.org/10.3390/en16176338
Submission received: 4 August 2023 / Revised: 23 August 2023 / Accepted: 29 August 2023 / Published: 31 August 2023

Abstract

:
The safe evacuation of residents near a nuclear power plant during a nuclear accident is vital for emergency response planning. To tackle this challenge, considering the dynamic dispersion of radioactive materials in the atmosphere and its impact on evacuation routes under different meteorological conditions is crucial. This paper develops a dynamic dose-based emergency evacuation model (DDEEM), which is an efficient and optimized nuclear accident evacuation model based on dynamic radiological dose calculation, utilizing an improved A* algorithm to determine optimal evacuation routes. The DDEEM takes into account the influence of radiological plume dispersion and path selection on evacuation effectiveness. This study employs the DDEEM to assess radiological consequences and evacuation strategies for students residing 5 k m from a Chinese nuclear power plant. Under various meteorological conditions, including the three typical meteorological conditions, random ordered and random unordered meteorological sequences, optimal routes obtained through the DDEEM effectively reduce radiological dose exposure and mitigate radiation hazards. The results indicate that all evacuation paths generated by the DDEEM have a maximum dose of less than 1   m S v . Through simulations, the model’s effectiveness and reliability in dynamic radiological environments in terms of radiological consequences and evacuation analysis is verified. The research provides valuable insights and a practical tool for nuclear power plant emergency decision-making, enhancing emergency management capabilities during nuclear accidents. The DDEEM offers crucial technical support and a solid foundation for developing effective emergency response strategies.

1. Introduction

Nuclear energy has a crucial role in optimizing the energy structure, ensuring energy security, and reducing greenhouse gas emissions [1]. To guarantee nuclear power’s safety, nations worldwide adopt a defense-in-depth strategy, with nuclear emergency management as the last line of defense to minimize radiation hazards to surrounding residents. Nuclear accidents such as Three Mile Island, Chernobyl, and Fukushima underscore the need for nuclear emergency management, despite their low probability of occurrence.
Swift emergency response and protective measures are necessary in case of severe accidents at nuclear power plants, including evacuation, iodine prophylaxis, and sheltering in place [2]. The emergency planning zone (EPZ) in China typically encompasses a 10 km radius around the reactor [3]. However, the EPZ’s actual boundaries may be adjusted based on the accident’s severity, population distribution, and radiation effects [3]. For example, during the Fukushima nuclear accident, residents within a 20 km radius were evacuated, while those within a 20–30 km radius were advised to take shelter [4]. The EPZ scope may expand to hundreds or thousands of kilometers from the power plant [5]. China has 12 nuclear power plants with surrounding populations exceeding one million within an 80 km radius [6]. As urbanization increases, the population density around nuclear power plants rises, posing significant challenges for emergency evacuation during urgent situations.
To address this challenge, much research on an emergency evacuation plan were conducted. For example, Urbanik proposed an analysis of evacuation time estimation [5]. Li et al. developed the fuzzy gradient chance-constrained evacuation model (FGCCEM) to address the uncertainty in nuclear power plant emergency evacuation, providing decision support for risk management [7]. Hammond et al. proposed an adaptive EPZ strategy to reduce radiation exposure or minimize the number of people requiring evacuation [8]. Zhou et al. proposed a fuzzy-improved genetic algorithm for the optimization of a vehicle evacuation path in a nuclear emergency [9]. Lee et al. from South Korea studied the time estimation of evacuating different types of personnel within the smoke plume EPZ of the Kori nuclear power plant [10]. Takabatake et al. simulated the impact of local residents’ and tourists’ behavior on evacuation time in the event of a tsunami following the Fukushima nuclear accident [11]. Both studies emphasized that traffic congestion was a significant factor influencing evacuation time [10,11].
Since the Three Mile Island accident in 1979, research on evacuation models based on network graphs gained popularity. These models can be classified into two categories. The first category involves evacuation simulation modeling system, such as NETVACI and the Oak Ridge evacuation modeling system (OREMS), which estimate overall evacuation time by considering traffic congestion and road capacity [12,13,14]. The second category focuses on optimizing evacuation paths to minimize evacuation time and avoid traffic congestion. Similar models were developed for disasters such as hurricanes, earthquakes, fires, and tsunamis [15,16]. Chen et al. studied car evacuation optimization under emergency situations, including nuclear accidents [17]. Zou et al. incorporated road capacity and other factors in network flow graphs to research optimization algorithms for the shortest evacuation paths in nuclear accidents [18]. Zhao et al. examined primary influencing factors and challenges of nuclear emergency evacuation, constructing a utility evaluation function to guide path planning and mitigate potential risks beyond radiation exposure [19]. These studies provide valuable references for developing emergency evacuation models in the context of nuclear accidents.
Most emergency evacuation optimization models prioritize minimizing evacuation time or finding the shortest path. However, these approaches may overlook the critical aspect of preventing excessive radiation exposure during nuclear accidents. Hence, a more comprehensive approach is required for nuclear accident evacuation path planning, integrating considerations of radiation dose on evacuation decisions. Recent research addresses these issues, incorporating radiation dose into evacuation planning. For instance, Pei et al. [20] enhanced the Dijkstra algorithm for path planning in a static environment with radioactive dose distribution. Their method minimized collective dose and analyzed optimal evacuation paths post-accidents. Hwang et al. proposed a radioactive emergency evacuation model using an agent-based approach [21]. Simulating evacuee behavior in a radioactive environment via NetLogo, they analyzed received radiation doses in the accident scenario [21]. Tian et al. quantify the difference in terrain to movement speed and propose a path-planning method for complex terrain based on the algorithm (CTA) to give the minimum dose path [22].
During a nuclear accident, meteorological conditions can impact the dispersion of radioactive materials, leading to varying radiation exposures for residents around the nuclear power plant. Evacuating solely downwind may result in severe radiation consequences, conflicting with emergency response objectives. Analyzing the meteorological data around an NPP is important for determining a resident evacuation route [23]. To address this, a nuclear emergency evacuation model must consider real-time meteorological data, protective measures, evacuation strategies, and assess radiation doses on the public. This study focuses on calculating the concentration distribution of radioactive nuclides around the nuclear power plant based on real-time meteorological information following a severe accident. The dynamic dose-based emergency evacuation model (DDEEM), utilizing an improved A * optimal evacuation path algorithm, is developed to calculate radiation dose impacts on individuals during evacuation and provide optimal evacuation path recommendations. We hope this research could contribute valuable technical support for emergency decision-making in nuclear power plants.

2. Dynamic Dose-Based Emergency Evacuation Model

To address the challenges posed by the release of radioactive materials from a nuclear power plant, it is crucial to consider the dynamic dispersion and migration, which are influenced by environmental meteorological conditions and the source term conditions at the time of release. Evaluating the radiation doses that individuals may absorb during emergency evacuations is essential for developing effective emergency plans and evaluating the public’s protection measures. To achieve this, a dynamic dose-based emergency evacuation model (DDEEM) was developed in this study, utilizing an improved A * optimal evacuation path algorithm. This model takes into account the dynamic dispersion behavior of radioactive materials and the evacuation paths of individuals to effectively evaluate the radiation doses received during the evacuation process.
In the following subsections, we will provide an introduction to the different modules of the DDEEM. Subsequently, we will present simulation analyses in Section 4 and Section 5, utilizing a specific nuclear power plant in China as a case study to demonstrate the model’s effectiveness.

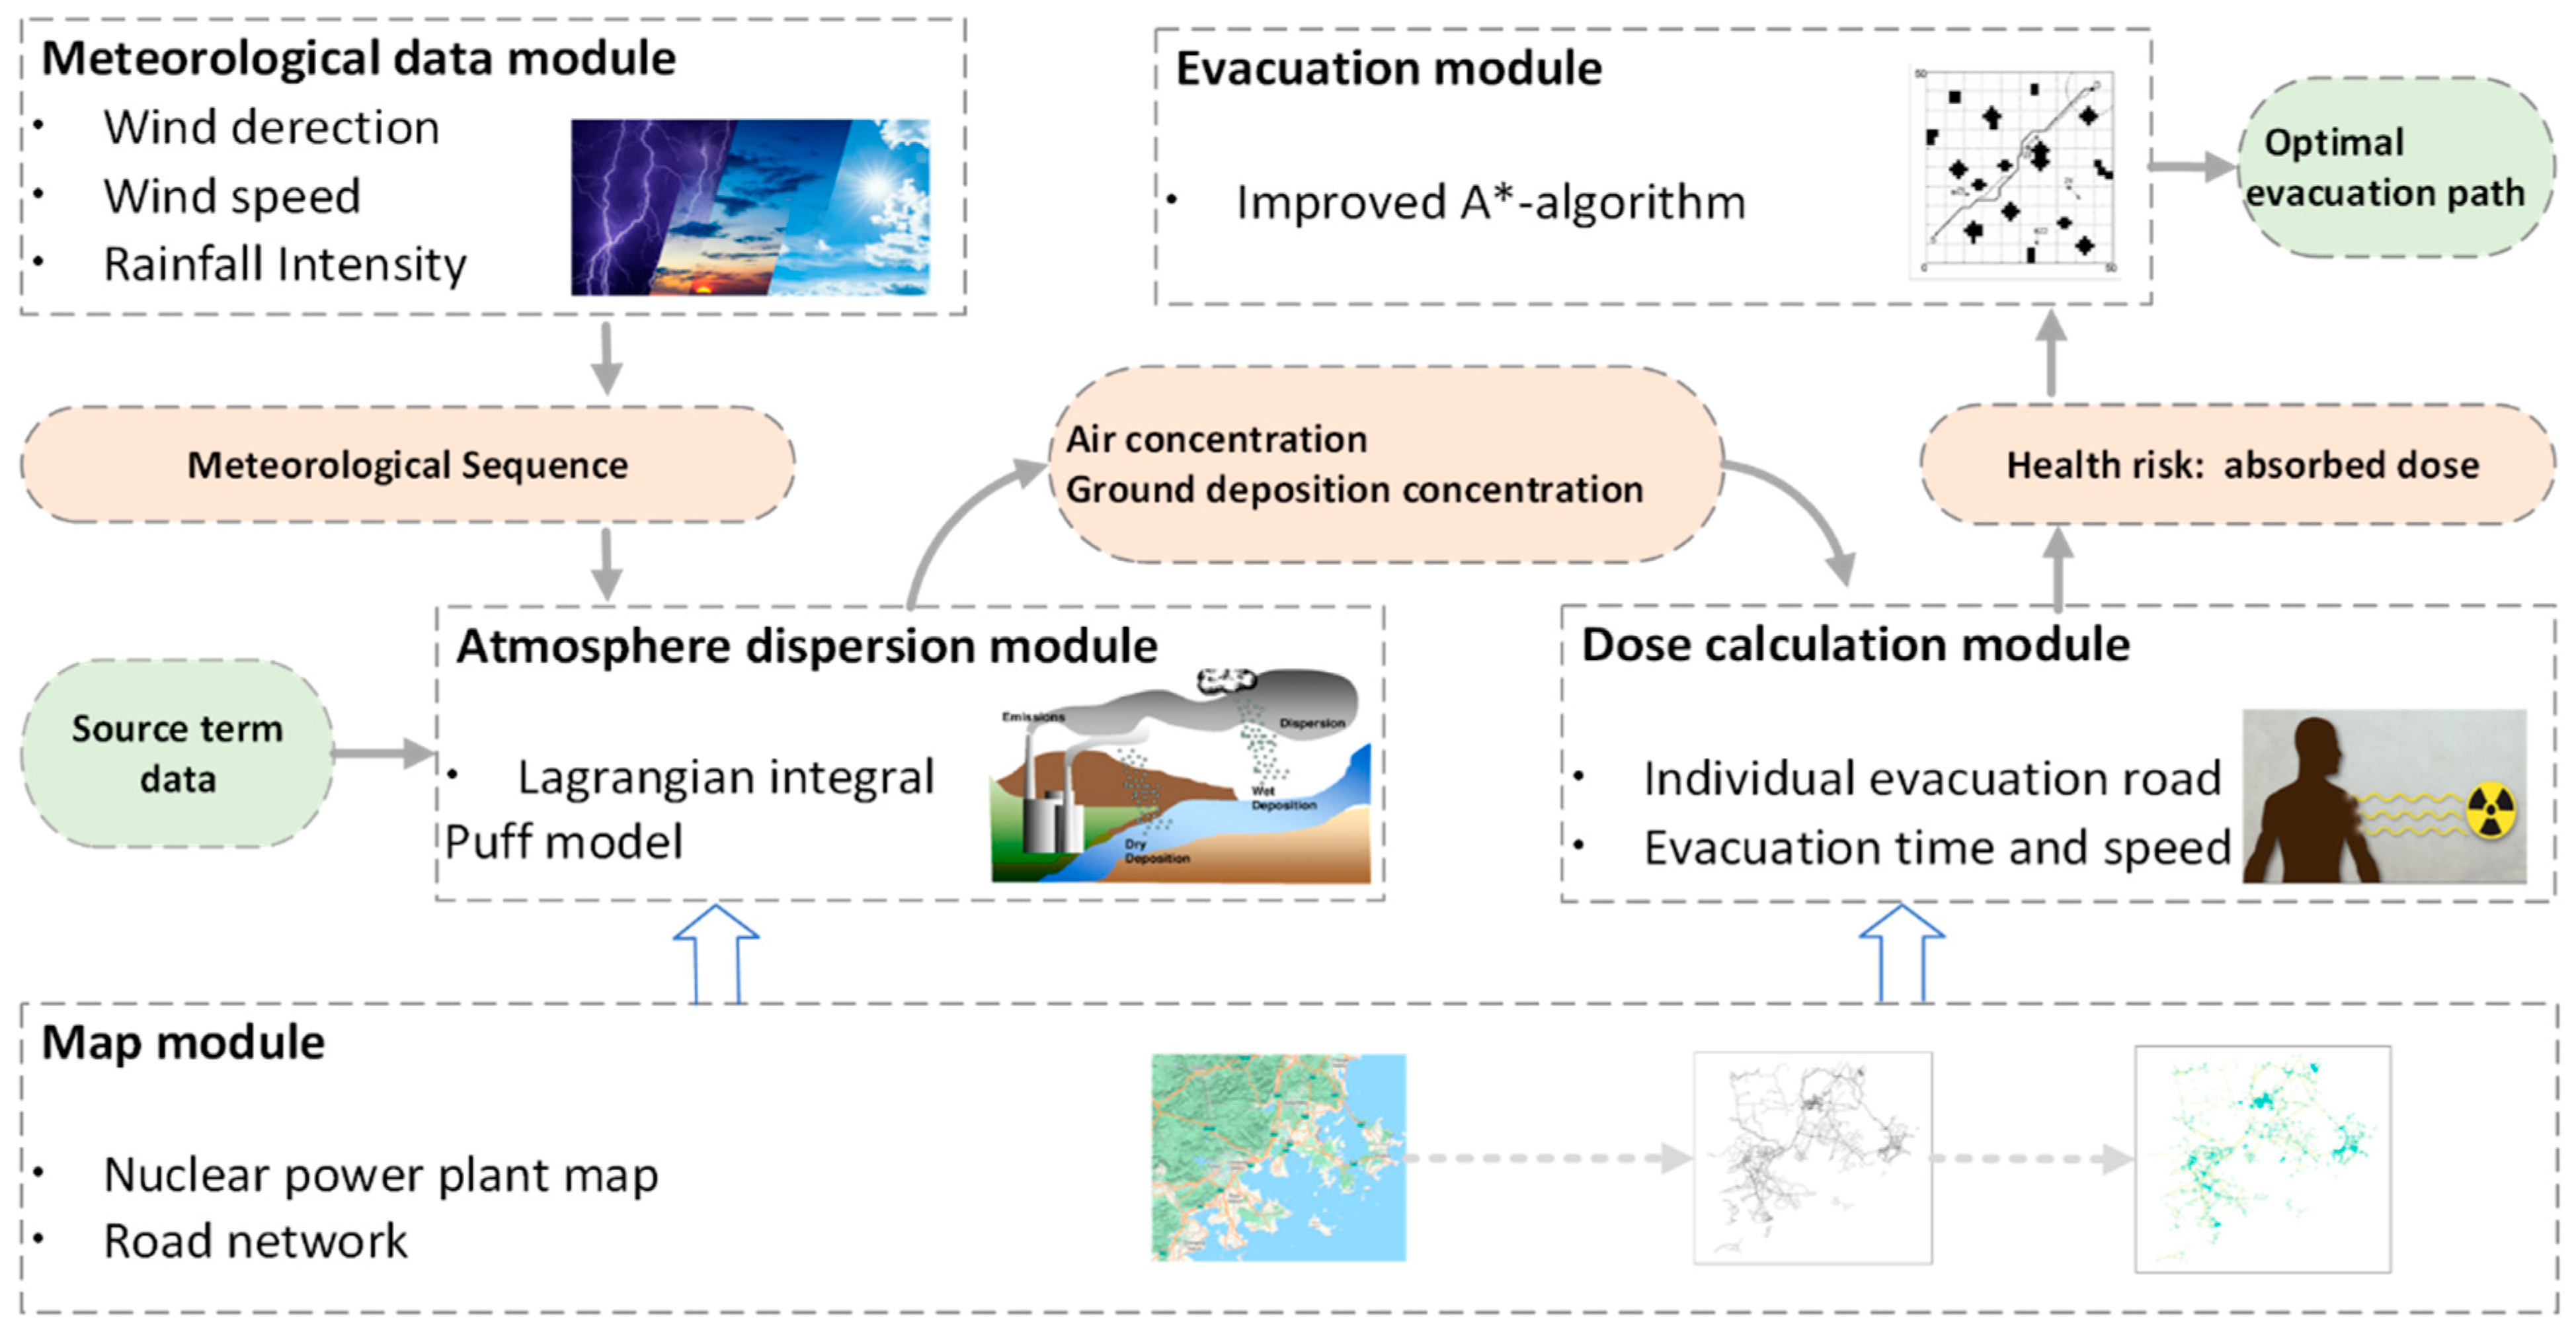
2.1. Model Framework Structure

The DDEEM consists of five modules: the map module, meteorological data module, atmospheric dispersion module, dose calculation module, and evacuation module, as shown in Figure 1. The map module constructs a road network model by incorporating the main road network and its connectivity alongside maps of the nuclear power plant and its surrounding area. Additionally, the map module serves as the support for the road network in the atmospheric dispersion module, dose calculation module, and evacuation module. It assists in computing the concentration distribution of radioactive materials on the road network and the radiation dose at different locations on the road network within a certain time period. The meteorological data module provides meteorological input data to the atmospheric dispersion module, generating different sequences of meteorological data required for simulation calculations. The atmospheric dispersion module contains an atmospheric dispersion model based on meteorological conditions. It calculates the concentration distribution of radioactive materials at different locations on the map over time, considering the source term conditions and meteorological conditions. In this model, the atmospheric dispersion model adopts a Lagrange model called the integral puff model. The dose calculation module computes the radiation dose received by individuals during the evacuation process based on the concentration distribution calculated by the atmospheric dispersion module. The evacuation module, based on the proposed improved A* algorithm, utilizes the atmospheric dispersion model and dose calculation model to search for the optimal evacuation path under real-time meteorological conditions.

2.2. Map Module and Meteorological Data Module

The map module obtains the road network data of the nuclear power plant and its surroundings to generate a weighted network flow graph G , composed of nodes and edges, where each edge represents a road and each node represents an intersection of different roads. The length of each edge, denoted as l , represents the road length. Figure 2a depicts the map of a nuclear power plant and its surrounding area in China, while Figure 2b illustrates the road network graph, consisting of 8813 nodes and 9071 edges. Furthermore, to reduce computational complexity, a simplification process is applied to the network flow graph G . If u t and t v are two edges of the network flow graph, and the degree of vertex t is 2, these two edges are removed and replaced by a new edge u v , where l ( u v ) = l ( u t ) + l ( t v ) . The resulting simplified network flow graph is denoted as G , which comprises 575 nodes and 831 paths, as shown in Figure 2c. In addition to obtaining the map and road networks of the nuclear power plant and its surrounding area, the map module supports the computations of the dose calculation module and evacuation module, assisting in determining the concentration distribution of radioactive materials and the radiation dose values along evacuation paths.
To predict the dispersion of radioactive materials in the atmosphere, meteorological data around the nuclear power plant are required. Meteorological data include hourly information on wind direction, wind speed, and rainfall intensity. The meteorological data serve as input for the atmospheric dispersion module for each time step of the simulation calculation. Typically, the time step of meteorological data is set to hourly, 30 min, or 15 min. In this model, historical meteorological data files from the European Centre for Medium-Range Weather Forecasts (ECMWF) are utilized [24]. Typically, the simulation calculation lasts for several hours, requiring multiple sets of meteorological data to form meteorological sequences.

2.3. Atmospheric Dispersion Module

The atmospheric dispersion module is one of the core computational modules in the model. It retrieves a meteorological sequence from the meteorological data module and provides the calculated results of radioactive concentration distribution to the dose calculation module and evacuation module.
To predict the consequences of radioactive source terms released into the atmosphere, it is essential to consider the temporal and spatial distribution of the radioactive concentration in the affected environment. Atmospheric turbulence is the main factor causing plume dispersion, with a diffusion rate 105 to 106 times higher than molecular diffusion [25]. Atmospheric turbulence formation and development depend on two factors: mechanical or dynamic factors, which give rise to mechanical turbulence (such as turbulence formed by the relative motion between near-surface air and stationary ground, leading to wind shear near the ground) and thermal factors, which mainly result from uneven heating or atmospheric temperature instability layers. In order to comprehensively reflect the complexity of the environment during an accident and obtain more accurate results within a limited time, this model uses average wind field data and applies the Lagrange integral puff model to calculate the diffusion and deposition behavior of radioactive source terms in the atmospheric environment after release.
The integral puff model represents a continuous plume as a series of discrete puffs. Most puff models assess the contribution of puffs to the concentration at observation points by taking “snapshots”. In other words, the puffs are frozen after a fixed time step, and the model calculates the sum of the contributions of each puff near the observation point. Then, the puffs continue to disperse and migrate until the next time step, and the process repeats. In terms of concentration distribution, the puff model assumes Gaussian distribution in both the horizontal and vertical directions. Additionally, because the diffusion rate due to turbulence is much smaller than the average wind speed, the model neglects diffusion in the wind direction.
The integral puff model is developed within the non-steady-state puff dispersion model (CALPUFF) framework. This model is used to calculate concentration distribution, and its formula is as follows [25]:
C ¯ = g 2 π σ y 2 Q t I 1 + [ Q t + Δ t Q t ] I 2 ,
I 1 = π 2 a 1 / 2 exp b 2 2 a c 2 · erf a + b 2 a 1 / 2 erf b 2 a 1 / 2                               I 2 = b I 1 a + 1 a e x p b 2 2 a · e x p b 2 2 a exp 1 2 a + 2 b + b 2 a a = d x 2 + d y 2 σ y 2                                                                                                                                                                                                 b = d x x 1 x r + d y y 1 y r σ y 2                                                                                                                                   c = x 1 x r 2 + y 1 y r 2 σ y 2                                                                                                                                                 .    
In the equation above, C ¯ represents the concentration of radioactivity ( B q / m 3 ) at the sampling point over the time interval from t to t + Δ t , where Δ t is the time step ( s ). σ y represents the standard deviation of the Gaussian distribution in the vertical direction ( m ). g is the vertical term of the Gaussian equation ( m ) that describes the vertical distribution of concentration at the observation point. Q ( t ) and Q ( t + Δ t ) represent the total radioactivity ( B q ) in the plume at the beginning and end of the time step, respectively. In Equation (2), x 1 and y 1 represent the coordinates of the plume center at the beginning of the time step, while x r and y r represent the coordinates of the sampling point.
The integral puff model calculates the concentration distribution of pollutants within a fixed time step Δ t using an analytical solution. Compared to traditional puff models, this approach significantly improves computational efficiency. In the context of nuclear emergency applications, the pollutants in the plume are radioactive nuclides. Therefore, when calculating the changes in radioactivity within the plume, the model takes into account not only the effects of dry and wet deposition, but also the impact of radioactive decay.

2.4. Dose Calculation Module

In a radioactive environment, individuals during an evacuation are exposed to radiation from various sources. This study assumes that evacuees are threatened by three main pathways of radiation exposure during the early evacuation process:
  • Cloudshine: radiation from the plume of radioactive aerosols;
  • Groundshine: radiation from ground contamination;
  • Acute inhalation: radioactive aerosol particles entering the body.
The dose calculation module obtains the radioactive concentration distribution data from the atmospheric dispersion module, as well as the location information of evacuees. It calculates the radiation dose received by evacuees within each time step and the subsequent potential radiation dose. This information serves as the basis for evaluating the dose along the evacuation path. The following is the calculation method.
Assuming there is a path   A B C on the evacuation road network flow graph, as shown in Figure 3, the path is divided into multiple segments using the grid used by the atmospheric dispersion module. Taking the red virtual segment in the figure as an example, the dose calculation method for this segment is as follows:
Firstly, the dose calculation module identifies the grid in which the segment to be calculated is located and performs an averaging process on the dose within that grid. This results in the average dose within the grid:
C g r i d i , j = a v e r a g e c i , j + c i + 1 , j + c i , j + 1 + c i + 1 , j + 1 ,
where C g r i d i , j represents the average dose within the grid surrounded by the observation points i ,   j , i + 1 ,   j , ( i ,   j + 1 ) and ( i + 1 ,   j + 1 ) , and c i , j , c i + 1 , j , c i , j + 1 and c ( i + 1 , j + 1 ) represent the air concentration or ground deposition concentration at the corresponding observation points of the four vertices of the grid.
Secondly, the dose impact caused by different irradiation pathways is calculated using dose conversion factors. Let the two intersection points between the red path and the grid be denoted as a and b , representing the two endpoints of the red segment. For the cloud irradiation pathway and ground irradiation pathway, the formula to calculate the accumulated dose after passing through the segment ( a ,   b ) is:
d o s e ( a , b ) = C g r i d i , j × L v × D C F × S F C ,
where d o s e represents the dose of cloudshine radiation d o s e c l o u d s h i n e m S v or groundshine radiation d o s e g r o u n d s h i n e m S v received during the evacuation process; C g r i d i , j represents the time-averaged concentration in the grid where the segment is located (air concentration for cloudshine and ground deposition concentration for groundshine); L represents the length of the segment ( m ), and v represents the average speed of evacuees along the route ( m / s ); D C F is the dose conversion factor for cloudshine radiation or groundshine radiation ( m S v · s 1 / B q · m 3 ) for cloudshine and ( m S v · s 1 / B q · m 2 ) for groundshine); and S F C is the shielding factor for cloudshine radiation or groundshine radiation, which is dimensionless. For the dose generated from acute inhalation exposure, the difference lies in considering the breathing rate ( B R ) of evacuees. The calculation formula is:
d o s e i n h a l e d = C g r i d i , j × L v × D C F × S F C × B R ,
where D C F is the dose conversion factor for acute inhalation exposure ( m S v / B q ).
The above dose calculation formulas represent the calculation for a specific radionuclide. Therefore, during the entire evacuation process, the total dose received by evacuees can be expressed as the sum of the three types of doses over all the grids traversed:
t o t a l d o s e = g = 1 n h = 1 m ( d o s e c l o u d s h i n e g , h + d o s e g r o u n d s h i n e g , h + d o s e i n h a l e d g , h ) ,
where n represents the number of considered radionuclides, and m represents the number of segments obtained by dividing the final evacuation path into observed grids.

2.5. Evacuation Module

The evacuation module interacts in real time with the atmospheric dispersion module and the dose calculation module to simulate the evacuation process and behavior of evacuees. By setting parameters such as the starting time of evacuation for each population group (relative to the accident time), the evacuation departure points, dose conversion factors, and shielding factors for the population groups, the evacuation module simulates the evacuation behavior of individuals. Based on the improved A * algorithm proposed in Section 3, the evacuation module analyzes the estimated dose and path length of evacuation routes in the dynamic radiological environment. It plans evacuation routes that minimize the dose radiation risk and provide the optimal evacuation path. The description of the optimal evacuation path algorithm is provided in Section 3.

3. Optimal Evacuation Path Algorithm

The evacuation path algorithm proposed in this paper is an improved A *   algorithm. An A * algorithm is a classical path-searching algorithm widely used to find the path with the minimum cost in a multi-node graph [26]. The traditional A * algorithm is typically used for single-objective optimization problems. In the case of path planning, to reach the destination quickly, an estimation function f ( n ) is defined for each evaluated node n , which represents the estimated cost from node n to the target node. The basic expression is f ( n ) = g ( n ) + h ( n ) , where g ( n )   represents the cumulative cost from the starting point to node n , usually taken as the actual path length from the starting point to the current evaluated node, and h ( n ) represents the estimated cost from the current node to the target node, usually calculated as the Euclidean distance (straight-line distance) or Manhattan distance (sum of the horizontal and vertical differences) between the current node and the target node.
In the context of a nuclear accident, evacuating people to safety as quickly as possible can effectively reduce the risks associated with the accident. At the same time, considering the distribution of radioactive contaminants, the selection of evacuation paths should avoid radiation hazards and minimize evacuation time. To simultaneously consider both dose and time as objectives for evacuation path planning, this paper introduces the concept of “Dose Risk” ( D R ) as the objective function for the path selection. Since the primary goal of nuclear accident evacuation is to avoid receiving radiation doses, the weight of potential doses should be higher in the “Dose Risk” objective.
The optimal evacuation path algorithm with the “Dose Risk” as the objective function requires the following definitions: Suppose the current node is denoted as   m , and its neighboring node being evaluated is n , while node d represents the destination node. The d o s e ( n )   is defined as the accumulated radiation dose up to the current time step when arriving at node n . The d o s e ( n , d ) represents the estimated radiation dose from the current time step, from node   n to node d along the path. L ( n ) denotes the path length traveled to reach node n at the current time step, while L ( n , d )   represents the shortest path length from node n to node d . The angle factor ( A F ) is the cosine function value of the angle between the vector from the starting point at the current time step to the destination node and the wind vector. It is used to distinguish the potential risks at the destination. The concept of A F   is inspired by radial evacuation strategies, where A F approaches e when two vectors are parallel, indicating significantly increased dose risk. Conversely, when two vectors are perpendicular, A F   approaches 1 , indicating minimal impact of potential wind direction changes on the dose risk. For the node n , the “Dose Risk” ( D R ) is defined as:
D R n = d o s e n + A F × d o s e n , d                     i f   d o s e ( n , d ) 0 d o s e n 1 L n + A F × L n , d                             i f   d o s e n , d = 0 .              
The evacuation path algorithm is a heuristic algorithm, which means that for the current node m , among its neighboring nodes n 1 , n 2 , , n k , the node n j with the smallest D R ( n j ) is selected as the next node, where D R n j = m i n { D R n i | 1 i k } .
When d o s e n , d 0 , it is inevitable to receive at least the dose from the groundshine pathway, whether passing through the deposition area in the current time step or in subsequent time steps. In this case, based on the heuristic path to reach the target node d , the total dose along the itinerary will be greater than 0   m S v . Therefore, following the principle of minimizing dose, combined with the path exploration method of the A * algorithm, the path with the minimum dose will be found.
When d o s e ( n ,   d ) = 0 , the evacuation path problem is transformed into a path planning problem with the objective of finding the shortest path. In this case, the calculation of “Dose Risk” reverts to the traditional A * algorithm. However, considering all neighboring nodes of node m , if some nodes have a nonzero total dose along the itinerary, in order to choose a neighboring node without dose and with the shortest path to the target node d , the negative reciprocal of the total path length is used as the “Dose Risk” for those nodes. In Equation (7), taking the negative value ensures that the “Dose Risk” of these nodes is always smaller than those with a nonzero total dose along the itinerary, and taking the reciprocal ensures that the node with the shortest total path length remains the smallest value even after taking the negative value. As a result, among the neighboring nodes of the current node m , the node without a total dose along the itinerary and with the shortest path to the target node d   will have a higher chance of being selected as the next explored node.
From the definition of D R , it can be seen that the principle for finding the next node is to prioritize minimizing the dose and then to consider minimizing the evacuation time, thus achieving a balance between the two objectives. The steps of the optimal evacuation path algorithm are as follows:
  • Step 1: Let G be the weighted network flow graph, S = S 0 the origin node, D 1 ,   D 2 , , D d all the destination nodes, and P = S 0 the evacuation path. Let p = 0 .
  • Step 2: For each destination node D j ,   1 j d , let D R S p , j = m i n { D R n i | 1 i k } , where n 1 , n 2 , , n k are all the neighboring nodes of S p . Let D R S p + 1 = m i n { D R S p , j | 1 j d } . It is obvious that S p + 1 { n 1 , n 2 , , n k } . Let p = p + 1 and P = P S p .
  • Step 3: If S p is one of the destination nodes, then output the evacuation path P and end the algorithm. Otherwise, go to the step 2.

4. Simulation Input Data

4.1. Accident Source Term Data

In accordance with typical methods for radioactive consequence analysis, I-131 and Cs-137 are selected as representative radionuclides released in this simulation analysis. It is assumed that a release of radioactive contaminants occurs every 15 min from the reactor, and the atmospheric dispersion module calculates the concentration distribution of all released contaminants within the computation area. The initial calculation time is set as the time when the radioactive material is first released into the environment, which is considered as the 0th second. Based on source term inversion studies of the Fukushima nuclear accident, a total release of 1.6 × 10 17   B q of I-131 and 1.5 × 10 16   B q   of Cs-137 was estimated from 11 March 2011, 17:00 to 12 April 2011 [27]. The average hourly values of these results are used as the source term parameters for this case study (refer to Table 1). Additionally, the dry deposition rates for these two radioactive nuclides are assumed to be constant values.

4.2. Meteorological Data Analysis

The geographical location of the nuclear power plant studied in this case is shown in Figure 2. The selected calculation area is bounded by coordinates 119.2271 °   W ,   119.6679 °   E ,   25.3639 °   S , and   25.6335 °   N , spanning 100   k m in the east-west direction and 100   k m in the north-south direction.
Meteorological conditions are one of the main factors affecting emergency response effectiveness and are of significant importance for the development of emergency plans and evacuation strategies. The historical meteorological data used in this case study are sourced from the European Centre for Medium-Range Weather Forecasts (ECMWF). Data cover a period of three years, from 1 January 2018, 08:00:00 to 1 January 2021, 08:00:00 UTC, providing hourly averaged data for wind speed and mean precipitation intensity at a height of 10   m above the ground. The data cover the same geographical area as the calculation area. There are a total of 16 wind directions, as shown in Table 2, and the wind direction indicates the direction from which the wind is blowing. For example, N (north wind) indicates wind blowing from the north.
The historical meteorological data mentioned above will be analyzed to illustrate the overall meteorological conditions at the nuclear power plant site. This analysis will serve as a basis for determining specific parameter settings in the subsequent simulation analysis.
The Figure 4 shows the statistical results of wind direction for each hour from 1 January 2018, 8:00, to 1 January 2021, 8:00. As shown in Figure 4a, the predominant wind direction at the site is from the northeast (landward direction), with the highest frequency coming from north-northeast wind (NNE) and northeast wind (NE), with a total probability of 58.50%. The next significant wind directions are from the south and southwest (seaward direction) of the nuclear power plant, with statistically significant wind directions being south wind (S), south-southwest wind (SSW), and southwest wind (SW), with a total probability of 23.39%. Overall, landward winds dominate the majority of the historical time, which helps prevent the migration and dispersion of radioactive releases towards the land, minimizing the risk of public exposure to radioactive environments. This observation highlights the safety and rationale behind the site selection for the nuclear power plant. However, the proportion of seaward winds should not be underestimated, as they can lead to extensive areas on land being exposed to downwind radioactive releases in the event of an accident.
Furthermore, a time series analysis of the 3-year local meteorological data reveals the temporal variation in wind direction, as shown in Figure 4b. The wind direction at the site demonstrates a clear relationship with time. From a broader time perspective, the prevailing winds are from the south-southwest and southwest (SSW and SW) during the period from May to September each year. From September to May of the following year, the dominant wind direction is from the northeast (NE). Considering the analysis results of wind direction probabilities, the period from May to September each year should be given attention, as during this time, seaward winds are frequent, have longer durations, and exhibit greater variability. In the event of a nuclear accident, this period poses a higher risk of radioactive exposure to a larger area on land.
Building upon the aforementioned discussions, this study will select meteorological data from May to September 2020 to derive the average wind field and hourly rainfall intensity as representative meteorological conditions for simulation using the meteorological data module. The average statistical results for three typical wind directions during this period are presented in Table 3. From a conservative perspective, it is assumed that the wind direction mainly falls within these three directions. This analysis aims to assess the doses and dose rates of residents in the downwind direction within the emergency planning zone (EPZ) and demonstrate the necessity of implementing evacuation strategies.

4.3. Evacuee Parameters

Evacuees to be considered in emergency plans are typically categorized as permanent residents, transient populations, and special populations. Special populations include those in locations such as schools, prisons, and hospitals. Due to the unique nature of these places, special transportation vehicles (such as buses or ambulances) are often required for their evacuation. On one hand, past research showed that limited planning significantly impacts the mobility of non-vehicle-dependent populations. Assessments of Hurricane Katrina and Hurricane Rita in the United States demonstrated the inadequacy of planning for populations reliant on public transportation, resulting in a considerable portion of mobility-constrained individuals being unable to evacuate before the storms arrived [28]. If a nuclear power plant is located in an area with a smaller population and lacks the capacity for large-scale evacuation, evacuees often rely on private vehicles. However, in China, nuclear power plants are often located near densely populated areas, making private vehicle evacuation prone to traffic congestion and reduced evacuation efficiency [18]. Therefore, for the evacuation plans of non-vehicle-dependent populations, the use of high-capacity buses can reduce the number of vehicles on the road network, alleviate congestion, and facilitate organized and coordinated group evacuations, reducing uncertainty and improving evacuation efficiency.
Thus, in this simulation, students from a school located 5   k m east-northeast of the nuclear power plant are selected for analysis. On one hand, as special groups such as students lack the capability for independent evacuation, they require special attention in emergency plans. On the other hand, based on the analysis of historical meteorological data in Section 4.2, during the period covered by typical meteorological conditions, there is a high probability that these students will be in the downwind of the nuclear power plant in the event of an accident. Therefore, it is necessary to study and analyze the evacuation situation of these students. It is assumed that the simulated students can be evacuated by an abundant number of buses, all starting evacuation simultaneously. As shown in Figure 5, S represents the location of the school, which serves as the origin of the evacuation. D 1 ,   D 2 , and D 3 are three decontamination facilities designated as the destinations for evacuation. It is assumed that all evacuees travel at a speed of 10   m / s , with the evacuation starting the 1800 t h second after the accident. The control group strategy and evacuation setup information can be found in Table 4 and Table 5, and the individual doses for the evacuation and sheltering groups are calculated using the dose conversion factors shown in Figure 5. Additionally, it is assumed that S 1 prepared for radiation shielding prior to the arrival of the radioactive plume, taking shelter in buildings such as classrooms or gymnasiums and securing doors and windows.
As shown in Figure 5, there are five groups. E 1 ,   E 2 , and E 3 groups represent the shortest paths obtained using the Dijkstra algorithm, corresponding to the paths ( S ,   D 1 ) , ( S ,   D 2 ) , and ( S ,   D 3 ) , with path lengths of 57.027   k m ,   60.072   k m , and 77.595   k m , respectively. Since S ,   D 1 ,     D 2 , and D 3 are fixed locations, these three shortest paths remain constant. The optimal path found by the improved A * algorithm developed in this paper is denoted as E 4 . As described in Section 3, the optimal evacuation path algorithm is calculated with the objective of minimizing dose risk. Therefore, under different wind direction conditions, E 4 will vary, and the optimal destination among the three will be chosen based on the meteorological conditions. Additionally, it is assumed that S 1 adopts an in-place sheltering strategy for comparison of the radiation dose consequences between evacuation and sheltering strategies.
In Section 5, the radiation dose consequences will be compared for the five groups: E 1 ,   E 2 ,   E 3 ,   E 4 , and S 1 under different meteorological conditions to validate the effectiveness of the proposed optimal evacuation path algorithm.

5. Simulation and Analysis

5.1. Analysis of Typical Meteorological Conditions

Analyzing the evacuation of evacuees under typical meteorological conditions is a conservative approach to evaluating the significance and effectiveness of evacuation actions. By combining the three typical meteorological conditions from Table 3, the following three meteorological condition sequences were obtained. The model was run to calculate the radiation dose values for E 1 ,   E 2 ,   E 3 ,   E 4 , and S 1 under each condition.
(1)
Typical Meteorological Condition 1 (wind direction: S)
Under the conservative assumption that the wind direction remains as S, the distribution of radioactive material concentration and the evacuation paths of different evacuation groups are shown in left of Figure 6a. The right of Figure 6a displays the dose curves of each evacuation path. Under this wind direction condition, E 4 chooses D 1 as the destination, and it coincides with E 1 , which follows a fixed path to D 1 . From Figure 6a, it can be observed that the route of E 3 crosses the plume area in the vicinity of the nuclear power plant. Therefore, the dose rapidly increases around 2618   s , reaches its peak dose of 0.2032   m S v around 3080 s, and leaves the plume coverage area at approximately 3700   s . Similarly, E 2 , due to a significant overlap of its evacuation path with the downwind area, enters the plume area around 3700   s and begins to accumulate dose. It reaches its peak dose of 0.0278   m S v at around 4220   s , as the vehicle’s speed is faster than the wind speed. On the other hand, the evacuation paths of E 1 and E 4 , as well as the region where S 1 is located, do not intersect with the plume dispersion area. Therefore, the dose for E 1 ,   E 4 , and S 1 remains at 0   m S v . This demonstrates that in the case of a continuous wind direction of S , the students at the school have sufficient time for evacuation preparation, and evacuating towards the east or northeast direction is the optimal evacuation strategy. Additionally, the developed model software is able to find the optimal evacuation path in such cases.
(2)
Typical Meteorological Condition 2 (wind direction: SSW)
Under the Typical Meteorological Condition 2, assuming a continuous wind direction of SSW, the distribution of radioactive concentration and the evacuation paths of different evacuation groups are shown in Figure 6b. Under this wind direction condition, due to the influence of the A F factor in the path planning evacuation mode, the E 4 did not choose the shorter route to D 2 , but instead selected D 3 as the destination, and its evacuation path completely overlaps with E 3 . Additionally, since the starting point S in this case is located within the downwind plume sector, all evacuation paths are exposed to radioactive plume irradiation during the evacuation process. In particular, the sheltering group S 1 , being constantly exposed to the radioactive plume, reaches a personal dose of 143.92   m S v at 10,800   s after the accident. Figure 6b shows the dose curves under meteorological condition 2 (the dose curve of the E 3 overlaps with the E 4 in the figure). E 1 crosses the plume in the vicinity of the source, resulting in a rapid increase in individual dose in the short term. Once outside the plume coverage area, the dose no longer increases and reaches 0.125   m S v . Furthermore, because the path E 2 ( S ,   D 2 ) diverges from the path E 3 ( S ,   D 3 ) and still partially overlaps with the edge of the plume area, the individual dose for E 2 is slightly higher than that of E 3 and E 4 , but all remain below 0.01   m S v .
In this simulation, S 1 remains immersed in the radioactive plume for a prolonged period and still receives a high dose despite the shielding factor. At this point, timely evacuation should be considered to avoid the accumulation of unavoidable doses and the multiple threats posed by the deteriorating air quality in enclosed environments. Under this wind direction condition, the evacuation path found by the model is also optimal.
(3)
Typical Meteorological Condition 3 (wind direction: SW)
Under the Typical Meteorological Condition 3, assuming a continuous wind direction of SW, the distribution of radioactive concentration and the evacuation paths of different evacuation groups are shown in Figure 6c. E 4 selects D 2 as the destination, and its evacuation path highly overlaps with the path E 2 ( S ,   D 2 ) . In the early stages of the evacuation process, E 4 follows the path E 3 ( S ,   D 3 ) . This is because the evacuation module, influenced by the angle factor, selects nodes with larger angles relative to the plume movement direction. However, due to the absolute value taken in the formula for the angle factor, the subsequent paths to destination D 2 and destination D 3 have a similar impact on the evacuation module considering the angle with the wind direction. As D 2 has a shorter evacuation path, E 4 changes its destination to D 2 and returns to the path ( S ,   D 2 ) in the subsequent path planning. The dose curves under this condition are shown in Figure 6. Due to crossing the plume area, E 1 experiences a rapid increase in dose in the early stages of the evacuation process, receiving a dose of 0.178   m S v   in only about 2200   s of travel time. The remaining path has no overlap with the plume area, resulting in no dose accumulation.
Under this condition, similar to the typical Meteorological Condition 1, the plume dispersion process does not directly affect the school. However, due to the school’s close proximity to the nuclear power plant, only 5 km away, it is still necessary to evacuate as quickly as possible. From the analysis, it can be seen that the model could find the optimal evacuation path.
From the analysis of the results under the three typical meteorological conditions, it is evident that on-site sheltering or the three fixed shortest paths may also result in radiation exposure consequences. These findings highlight the importance of selecting evacuation paths based on specific meteorological conditions. Furthermore, as depicted in Figure 6, the optimal evacuation path algorithm consistently identifies the optimal evacuation destinations and routes. Hence, the DDEEM outperforms conventional methods. By integrating real-time meteorological data and dynamic radiological dose calculation, it accurately assesses radiation dose impacts on evacuees and recommends optimal paths.

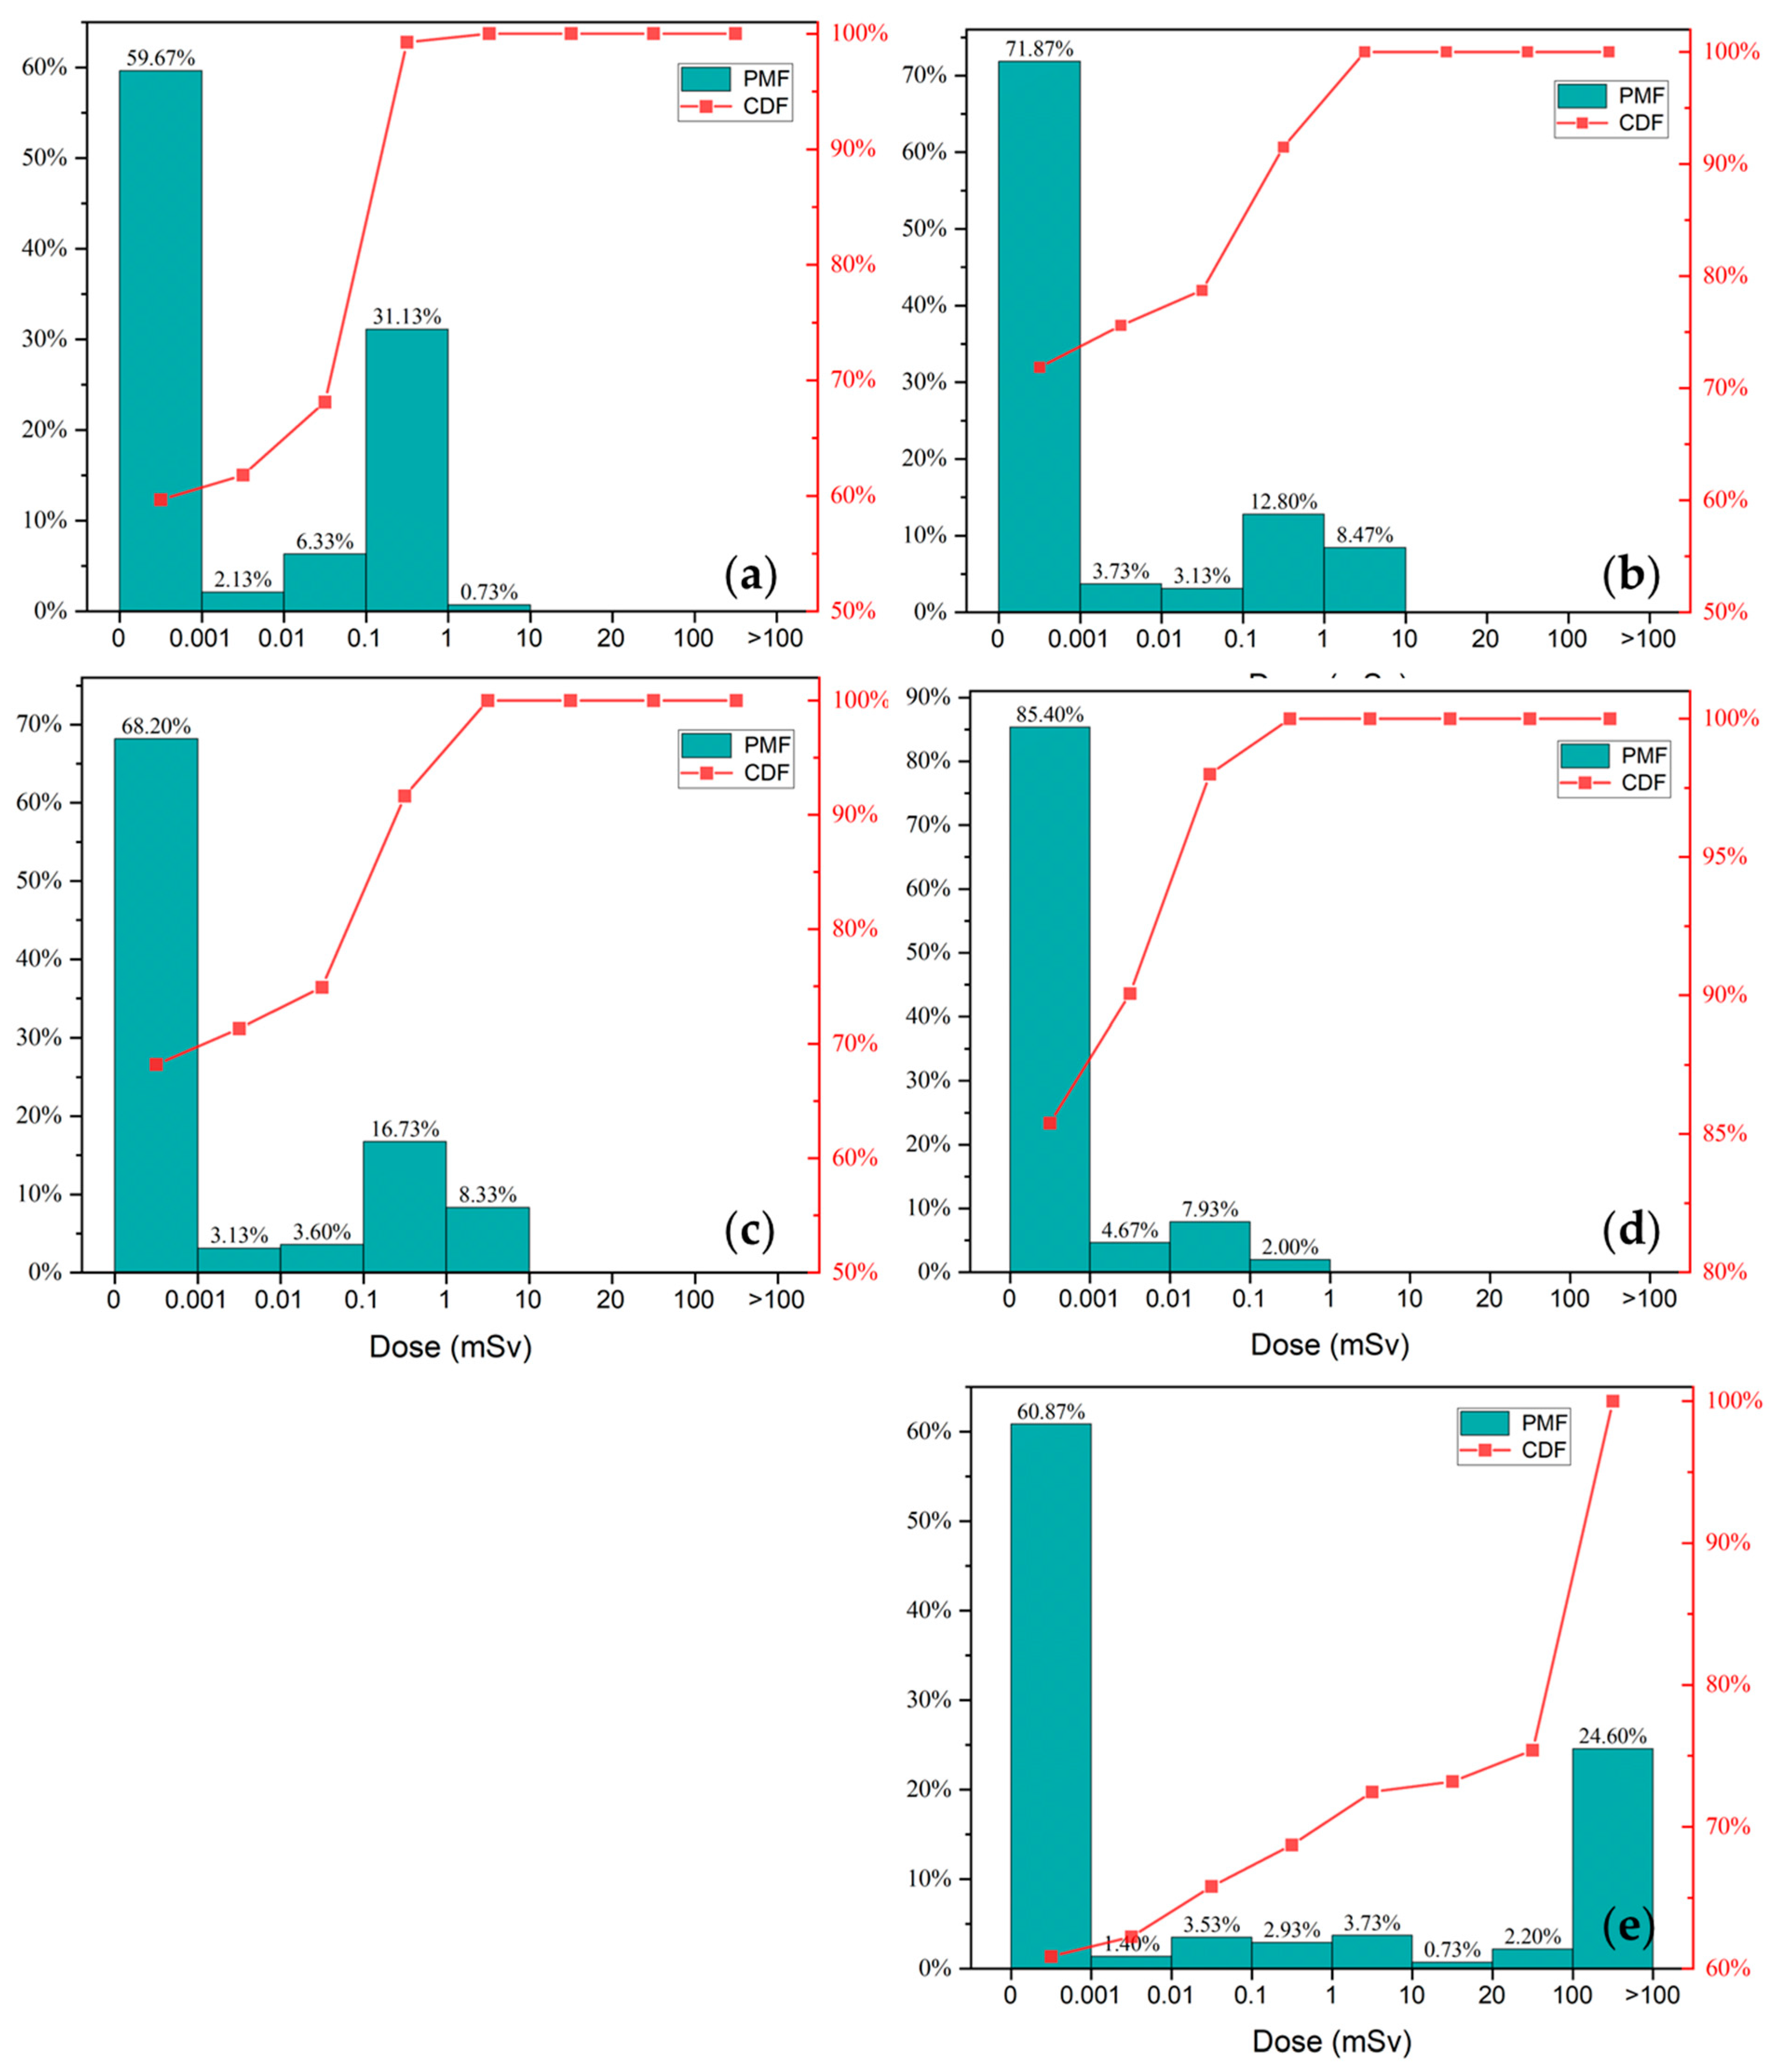
5.2. Analysis of Random Meteorological Conditions

Section 5.1 evaluated evacuation actions from a conservative perspective, assuming that the wind direction corresponds to the higher probability conditions and do not change during the evaluation. In order to conduct a better simulation analysis of evacuation paths, this subsection will utilize a combination of meteorological conditions known as random meteorological condition sequences, which include both randomly unordered and randomly ordered sequences.
The random unordered meteorological sequence refers to a collection of meteorological data covering multiple hours until all evacuation groups reach a specific destination. The meteorological data for each hour (including wind direction, wind speed, and rainfall intensity) is randomly sampled from the meteorological database spanning from 1 May to 30 September 2020 . A total of 1500 sets of unordered meteorological sequences were extracted for analyzing the statistical dose results of different evacuation paths and emergency protection strategies. The simulation results are shown in Figure 7, containing the dose probability mass function (PMF) and the cumulative distribution function (CDF). Under random unordered meteorological conditions, the dose distributions of E 1 ,   E 2 , and E 3 are generally similar: the highest probability occurs in the dose range of 0 to 1 × 10 5   m S v , with a frequency of 40 % to 50 % , and the next highest frequency is in the range of 0.1 to 1   m S v , and the probability of less than   1   m S v public dose limit reaching 100 % . This result indicates that evacuation can still achieve good radiation protection effects even under conditions of rapid wind direction changes. In the case of S 1 , which represents sheltering in place, the hazards brought by unstable meteorological conditions are more significant, with a high probability of exceeding 100   m S v reaching 93.7 % . This is because continuously released radioactive material accumulates heavily around the nuclear power plant under continuously changing wind directions. When comparing the results of the evacuation groups with S 1 , under most meteorological conditions, the avoidable dose far exceeds the intervention level of evacuation, indicating that evacuation should be carried out to reduce the possibility of radiation exposure.
Compared with other evacuation groups, E4 showed superior results, with the highest dose not exceeding 1 m S v , and a probability of 59.20 % for no cumulative dose or minimal cumulative dose, surpassing the results of evacuation path schemes E1, E2, and E3. The statistical distribution of E4’s results indicates that the optimal evacuation path performs well in complex and rapidly changing dynamic environments of concentration distribution. By identifying appropriate evacuation paths, it effectively reduces the radiation exposure consequences resulting from the dispersion of radioactive materials.
The random ordered meteorological sequence refers to the extraction of a continuous set of meteorological data (including wind direction, wind speed, and rainfall intensity) from 1 May to 30 September 2020. These data are randomly selected and spans multiple hours, until all evacuation groups reach a specific destination. The order of the meteorological data within each set is retained. A total of 1500 sets of sequential meteorological data are extracted.
The final dose distributions for each control group exhibit different patterns, as shown in Figure 8. In the statistical results of all control groups, the proportion of journey doses in the range of 0 to 1 × 10 3   m S v accounts for over   50 % of the total sample size. This indicates that without any planning, evacuating along any of the three paths or choosing to shelter in place has at least a 50 % probability of avoiding radiation hazards. In all sampled simulation results, the maximum doses for the evacuation groups following the fixed evacuation paths fall within the range of   1 to 10   m S v .
Further analysis of the dose distribution for S 1 shows that under random order meteorological sampling, the estimated doses from taking shelter exceed the intervention level of evacuation in a certain percentage of the total simulations, and there is a probability exceeding 24.60 % of receiving doses exceeding 100   m S v . These results indicate that in this case, using the source term conditions and historical meteorological data employed, evacuation is a better choice to avoid dose hazards.
E 1 has the lowest probability in the dose range of 0 to 1 × 10 5   m S v , even lower than the worst-case scenario of S 1 . Additionally, from the statistical distribution of E 1 , the probability in the range of 0.1 to 1   m S v is significantly higher than that of other evacuation groups. This is because the frequencies of west wind and southwest wind are relatively high in the meteorological data used from 1 May to 30 September 2020 . Furthermore, due to limitations in the road network, if the public in the D 1 direction needs to be relocated again due to the escalation of the situation, the secondary evacuation path is relatively limited. Therefore, even though the sampled simulation results for E 1 meet the intervention level limit for evacuation actions, it is not recommended to choose D 1 as the destination for evacuation and set up decontamination stations. It is advised to evacuate residents in that area as soon as possible after an accident occurs.
The dose distribution patterns for E 2 and E 3 are similar. Except for the wind direction S , E 3 needs to pass through the plume coverage area, while the other wind directions allow both E 2 and E 3 to avoid the downwind direction of the nuclear power plant.
Furthermore, E 4 has the best overall situation, with a probability of 85.4 % of estimating little or no dose, and the largest dose range is less than 1   m S v . This indicates that in a dynamic radioactive environment, the optimal evacuation path effectively reduces radiation dose. Therefore, it could better avoid the various uncertain pathologies caused by public exposure to doses.

6. Conclusions

Off-site emergency response is the last line of defense in the defense-in-depth strategy of nuclear power plants, aiming to minimize the radiological consequences to the surrounding public and environment. Effective implementation of evacuation actions, which involve safely and swiftly evacuating individuals from the affected areas according to predetermined plans, is one of the key tasks in off-site emergency response for nuclear power plants.
On one hand, the plume of radioactive materials disperses based on real-time meteorological conditions and source term conditions at the time of release, and its distribution dynamically changes over time. On the other hand, the evacuation of the population around the nuclear power plant at different times and along different evacuation paths results in different radiological consequences. In other words, the decision-making of evacuation strategies after a nuclear accident directly impacts the radiological dose consequences that individuals may receive during the evacuation process. This study focuses on investigating the influence of different protective actions and evacuation path choices on public doses within the emergency planning zone during a nuclear accident and develops the DDEEM. The DDEEM proposes an improved A * algorithm-based evacuation path planning method, which aims to find the optimal evacuation path considering both radiological dose and path length as the objective functions in a dynamic environment.
Taking into account the retrospective review of the emergency evacuation situation during the Fukushima nuclear accident in Japan, this paper simulates and evaluates the radiological consequences and evacuation of a Chinese nuclear power plant site under equivalent source term conditions using the developed model. In the study focusing on the evacuation of students at a school located 5   k m away from the nuclear power plant, the simulation analysis is conducted under typical meteorological conditions, random unorder meteorological conditions, and random order meteorological conditions with sheltering and different evacuation paths. Firstly, in the simulation and analysis under the three typical meteorological conditions, the DDEEM provides optimal evacuation path recommendations based on the estimated dose results for each evacuation route. In other words, the model offers suggestions for evacuation strategies under different typical meteorological conditions. Secondly, the analysis and comparison of the radiological consequences when implementing various protective actions under random order meteorological conditions show that the personnel evacuating along the paths obtained from the DDEEM receives the lowest radiological doses, thus validating the effectiveness of the proposed model. Finally, a comparison of the radiological consequences for different evacuation paths under random sequential meteorological conditions is conducted, and the results indicate that, under the given source term and meteorological conditions, the personnel inside the school receive the lowest radiological dose when evacuating according to the DDEEM. However, according to the calculation results, there is a high probability that the total dose received by the personnel at the school location under random meteorological conditions while adopting the sheltering strategy will exceed the intervention level of evacuation actions. On the other hand, adopting the evacuation strategy significantly reduced the dose levels. This further highlights the necessity of emergency planning and implementing evacuation actions for the students at the school.
In conclusion, this study developed the DDEEM and conducted radiological consequence and evacuation analysis for a specific Chinese nuclear power plant site. It can provide technical support for emergency decision-making and development. To enhance the capabilities of the evacuation model, the following aspects need further improvement: the impact of non-flat terrain on the dose responses; the current path network only considers the geometric features of roads, i.e., the connectivity of paths, while ignoring constraints on road capacity and the influence of lane numbers, lane widths, and road types on the movement speed. In future work, these attributes will be added to the road network to increase the sensitivity of path selection to evacuation time, providing more realistic path guidance.

Author Contributions

Conceptualization, H.M. and P.Y.; methodology, G.Z.; software, G.Z.; validation, G.Z. and P.Y.; formal analysis, H.M. and C.S.; investigation, H.M.; resources, J.Z.; data curation, H.M. and C.S.; writing—original draft preparation, H.M.; writing—review and editing, J.Z.; visualization, P.Y. and C.S.; supervision, J.Z.; project administration, H.M.; funding acquisition, H.M. All authors have read and agreed to the published version of the manuscript.

Funding

This research was supported by the National Natural Science Funds of China (No. 72104207), the Fundamental Research Funds for the Central Universities (No. 20720220118) and Fujian Innovation Strategy Research Program (No. 2020R0011).

Data Availability Statement

Data are contained within the article.

Conflicts of Interest

The author declares no conflict of interest.

Abbreviations

DDEEMDynamic dose-based emergency evacuation model
EPZEmergency planning zone
FGCCEMFuzzy gradient chance-constrained evacuation model
OREMSOak Ridge evacuation modeling system
CTAComplex terrain based on the algorithm ()
ECMWF European Centre for Medium-Range Weather Forecasts ()
DRDose risk
AFAngle factor
DCFDose conversion factor

References

  1. China Nuclear Society. China Nuclear Development Report; China Nuclear Society: Beijing, China, 2020. [Google Scholar]
  2. Li, F.; Wang, J.; Li, H.; Hu, Q.; Dan, W.; Ge, L.; Cohen, D. Evaluation on Nuclear Emergency Response Strategies in the Asia-Pacific Region. Int. J. Crit. Infra-Struct. Prot. 2021, 34, 100447. [Google Scholar] [CrossRef]
  3. GB/T 17680.1-2008; Guidelines for Nuclear Power Plant Emergency Plans and Preparedness—Part 1: Division of Emergency Planning Zones. China National Standardization Administration: Beijing, China, 2008.
  4. Sekiguchi, Y. An Ounce of Nuclear Prevention: A Window into Japanese Evacuation Planning for Nuclear Accidents. In CSIS Policy Perspective; CSIS: Washington, DC, USA, 2016; pp. 1–8. [Google Scholar]
  5. Urbanik, T. Evacuation Time Estimates for Nuclear Power Plants. J. Hazard. Mater. 2000, 75, 165–180. [Google Scholar] [CrossRef]
  6. Butler, D. Nuclear safety: Reactor, residents and risk. Nature 2011, 472, 274–275. [Google Scholar] [CrossRef]
  7. Li, Z.; Hufang, G.H.; Guo, L.; Fan, Y.R.; Chen, J.P. A Fuzzy Gradient Chance-Constrained Evacuation Model for Managing Risks of Nuclear Power Plants under Multiple Uncertainties. J. Environ. Inform. 2015, 33, 129–138. [Google Scholar] [CrossRef]
  8. Hammond, G.D.; Bier, V.M. Alternative Evacuation Strategies for Nuclear Power Accidents. Reliab. Eng. Syst. Saf. 2015, 135, 9–14. [Google Scholar] [CrossRef]
  9. Zhou, H.; Zhang, H.; Chen, B.; Huo, J.; Lin, H. Optimum Vehicle Evacuation Plan for Nuclear Emergency Using Fuzzy Credibility Theory and Improved Genetic Algorithm. Arab. J. Sci. Eng. 2023, 48, 10517–10536. [Google Scholar] [CrossRef]
  10. Lee, J.; Jeong, J.J.; Shin, W.; Song, E.; Cho, C. The Estimated Evacuation Time for the Emergency Planning Zone of the Kori Nuclear Site, with a Focus on the Precautionary Action Zone. J. Radiat. Prot. Res. 2016, 41, 196–205. [Google Scholar] [CrossRef]
  11. Takabatake, T.; Shibayama, T.; Esteban, M.; Ishii, H.; Hamano, G. Simulated Tsunami Evacuation Behavior of Local Residents and Visitors in Kamakura, Japan. Int. J. Disaster Risk Reduct. 2017, 23, 1–14. [Google Scholar] [CrossRef]
  12. Sheffl, Y.; Mahmassani, H.; Powell, W.B. A Transportation Network Evacuation Model. Transp. Res. 1982, 16A, 209–218. [Google Scholar] [CrossRef]
  13. Moriarty, K.D.; Ni, D.; Collura, J. Modeling Traffic Flow under Emergency Evacuation Situations: Current Practice and Future Directions. In Proceedings of the 86th Transportation Research Board Annual Meeting, Washington, DC, USA, 21–25 January 2007; pp. 21–25. [Google Scholar]
  14. Cohen, R.; Weinisch, K. The Impact of a Major Earthquake on the Evacuation of the Emergency Planning Zone of a Nuclear Power Plant. J. Emerg. Manag. 2015, 13, 135–143. [Google Scholar] [CrossRef]
  15. Zhang, J.; Liu, Y.; Zhao, Y.; Deng, T. Emergency Evacuation Problem for a Multi-source and Multi-destination Transportation Network: Mathematical Model and Case Study. Ann. Oper. Res. 2020, 291, 1153–1181. [Google Scholar] [CrossRef]
  16. Rathand, A.K.; Solanki, R. Simulation of Traffic Flow During Emergency Evacuations: A Microcomputer Based Modeling System. In Proceedings of the 25th conference on Winter Simulation, Los Angeles, CA, USA, 12–15 December 1993; pp. 1250–1258. [Google Scholar]
  17. Chen, Y.; Shen, S.; Chen, T.; Yang, R. Path Optimization Study for Vehicles Evacuation Based on Dijkstra Algorithm. Procedia Eng. 2014, 71, 159–165. [Google Scholar] [CrossRef]
  18. Zou, Y.; Zou, S.; Niu, C. The Optimization of Emergency Evacuation from Nuclear Accidents in China. Sustainability 2018, 10, 2737. [Google Scholar] [CrossRef]
  19. Zhao, J.; Mao, M.; Xie, B. A Nuclear Emergency Partition Evacuation Framework Based on Comprehensive Risk Assessment. Int. J. Disaster Risk Reduct. 2023, 86, 103543. [Google Scholar] [CrossRef]
  20. Pei, Q.; Hao, L.; Chen, C.; Zheng, X.; He, T. Minimum Collective Dose Based Optimal Evacuation Path-planning Method under Nuclear Accidents. Ann. Nucl. Energy 2020, 147, 107644. [Google Scholar] [CrossRef]
  21. Hwang, Y.; Heo, G. Development of a Radiological Emergency Evacuation Model Using Agent-based Modeling. Nucl. Eng. Technol. 2021, 53, 2195–2206. [Google Scholar] [CrossRef]
  22. Tian, H.; Yang, Z.; Sun, G.; Wang, S.; Fu, J.; Tao, G. An Improved A* Path-planning Algorithm for Nuclear Spill Evacuation and Radioactive Source Retrieval in Complex Terrain. Nucl. Eng. Des. 2023, 408, 112314. [Google Scholar] [CrossRef]
  23. Choi, J.K.; Kim, J.W.; Joo, H.Y.; Moon, J.H. Applying a Big Data Analysis to Evaluate the Suitability of Shelter Locations for the Evacuation of Residents in Case of Radiological Emergencies. Nucl. Eng. Technol. 2023, 55, 261–269. [Google Scholar] [CrossRef]
  24. ERA5 Hourly Data on Single Levels from 1979 to Present. Available online: https://cds.climate.copernicus.eu/cdsapp#!/dataset/reanalysis-era5-single-levels?tab=overview (accessed on 1 April 2022).
  25. Scire, J.S.; Strimaitis, D.G.; Yamartino, R.J. A User’s Guide for the CALPUFF Dispersion Model. Earth Tech Inc. 2000, 521, 1–521. [Google Scholar]
  26. Dechter, R.; Pearl, J. Generalized Best-first Search Strategies and the Optimality of A. J. ACM 1985, 32, 505–536. [Google Scholar] [CrossRef]
  27. Hasegawa, R. Disaster Evacuation from Japan’s 2011 Tsunami Disaster and the Fukushima Nuclear Accident. Studies 2013, 1–54. [Google Scholar]
  28. Naghawi, H.; Wolshon, B. Transit-based Emergency Evacuation Simulation Modeling. J. Transp. Saf. Secur. 2010, 2, 184–201. [Google Scholar] [CrossRef]
Figure 1. Framework of the DDEEM.
Energies 16 06338 g001
Figure 2. Evacuation network flow graph of a nuclear power plant. (a) The map of the nuclear power plant and surroundings; (b) the road network flow graph G ; and (c) the simplified network flow graph G .
Energies 16 06338 g002
Figure 3. Path dose calculation.
Energies 16 06338 g003
Figure 4. Wind direction variation in the calculation area from 2018 to 2021. (a) Wind rose diagram; (b) wind direction distribution.
Energies 16 06338 g004
Figure 5. Evacuation paths and destinations.
Energies 16 06338 g005
Figure 6. Radioactive material concentration, evacuation paths and dose curves under different meteorological conditions. (a) Typical Meteorological Condition 1 (wind direction: S); (b)Typical Meteorological Condition 2 (wind direction: SSW); and (c) Typical Meteorological Condition 3 (wind direction: SW).
Energies 16 06338 g006
Figure 7. The dose statistics different evacuation groups under random unorder meteorological sequences (a) E 1 ; (b) E 2 ; (c) E 3 ; (d) E 4 ; and (e) S 1 .
Energies 16 06338 g007
Figure 8. The dose statistics different evacuation groups under random order meteorological sequences (a) E 1 ; (b) E 2 ; (c) E 3 ; (d) E 4 ; and (e) S 1 .
Energies 16 06338 g008
Table 1. Source term conditions.
ParameterValue
Horizontal initial dispersion coefficient ( σ x y ) 10   m
Vertical initial dispersion coefficient ( σ z ) 5   m
Release height 25   m
I 131 Release rate 2.064 × 10 14   B q / h
I 131   Deposition velocity 0.003   m / s
C s 137 Release rate 1.935 × 10 13   B q / h
C s 137 Deposition velocity 0.001   m / s
Table 2. Wind direction.
NNorth windSSouth wind
NNENorth-northeast windSSWSouth-southwest wind
NENortheast windSWSouthwest wind
ENEEast-northeast windWSWWest-southwest wind
EEast windWWest wind
ESEEast-southeast windWNWWest-northwest wind
SESoutheast windNWNorthwest wind
SSESouth-southeast windNNWNorth-northwest wind
Table 3. Average wind speed and rainfall intensity for the dominant influencing wind directions from May to September 2020.
Meteorological ConditionWind
Direction
Wind
Direction (m/s)
Average Rainfall
Intensity (mm/h)
Typical Meteorological Condition 1S 4.4095 7.5944 × 10 5
Typical Meteorological Condition 2SSW 4.5534 3.4273 × 10 4  
Typical Meteorological Condition 3SW 5.7441 4.3229 × 10 5    
Table 4. Control group information.
GroupDestinationSpeedDeparture TimEvacuation Path
E 1 D 1 10   m / s 1800   s ( S , D 1 )
E 2 D 2 ( S , D 2 )
E 3 D 3 ( S , D 3 )
E 4 Model calculationModel calculation
S 1 In-place shelter ( S , S )
Table 5. Dose conversion factors.
NuclideRadiation PathUnitValue
I-131Cloudshine m S v · s 1 / B q · m 3 1.459 × 10 14
Groundshine m S v · s 1 / B q · m 2 3.083 × 10 16
Inhalation m S v / B q 1.98 × 10 8
Cs-137Cloudshine m S v · s 1 / B q · m 3 2.103 × 10 14
Groundshine m S v · s 1 / B q · m 2 4.289 × 10 16
Inhalation m S v / B q 8.492 × 10 9
Disclaimer/Publisher’s Note: The statements, opinions and data contained in all publications are solely those of the individual author(s) and contributor(s) and not of MDPI and/or the editor(s). MDPI and/or the editor(s) disclaim responsibility for any injury to people or property resulting from any ideas, methods, instructions or products referred to in the content.

