Article

Experimental and Theoretical Evaluation of a Commercial Luminescent Dye for PVT Systems

1
The Group of Applied Physics, Technological University Dublin—City Campus, Central Quad, D07 ADY7 Dublin, Ireland
2
Dublin Energy Lab, Technological University Dublin, City Campus Central Quad, D07 ADY7 Dublin, Ireland
3
School of Physics & Clinical & Optometric Sciences, Technological University Dublin, City Campus Central Quad, D07 ADY7 Dublin, Ireland
4
Department of Civil, Structural & Environmental Engineering, Trinity College Dublin, D02 PN40 Dublin, Ireland
*
Author to whom correspondence should be addressed.
Energies 2023, 16(17), 6294; https://doi.org/10.3390/en16176294
Submission received: 20 June 2023 / Revised: 25 August 2023 / Accepted: 28 August 2023 / Published: 29 August 2023
(This article belongs to the Section A: Sustainable Energy)

Abstract

:
Combining photovoltaic (PV) and photo-thermal (PT) energy collection strategies in a single system can enhance solar energy conversion efficiencies, leading to increased economic returns and wider adoption of renewable energy sources. This study focuses on incorporating a commercial luminescent organic dye (BASF Lumogen F Red 305) into ethylene glycol to explore its potential for PVT applications. The optical and electrical characteristics of the working fluid were evaluated at different temperatures under direct solar irradiance. Pristine ethylene glycol reduced the maximum PV cell temperature by 10 °C. The inclusion of luminescent dye at various concentrations further reduced the maximum temperature, with the lowest concentration achieving a 7 °C decrease compared to pristine ethylene glycol. The highest dye concentration (0.50 wt%) resulted in a significant temperature reduction of 12 °C. While electrical conversion efficiencies decreased with increasing dye concentration, all concentrations exhibited higher fill factors compared to the bare PV cell during the 100-min illumination period. A ray-tracing model was employed to analyze the behavior of the luminescent dye and quantify transmitted energy for electricity and thermal energy production. Different concentrations showed varying energy outputs, with lower concentrations favoring electrical energy and higher concentrations favoring thermal energy. Economic assessment revealed the viability of certain concentrations for specific countries, highlighting the trade-off between thermal and electrical energy generation. These findings provide valuable insights for PVT system applications in different geographical and economic contexts.

1. Introduction

Among the vast categories of renewable energy technologies that are used as a means of combating both excess carbonization and energy generation, one of the most widely used is that of solar renewable energy systems. Such systems are used to produce electrical energy via photovoltaic (PV) systems, which convert incident solar radiation into electrical energy [1]. The major benefits of solar PV systems come from their lower operational and maintenance costs compared to those of existing fossil fuel-based energy generation sources [1,2,3]. Solar energy systems offer numerous advantages, but before they can capture a significant share of the global energy generation market, they must overcome challenges. Quantities of PV installations have been gradually rising over recent years and are expected to surpass coal by 2027, with over 1 TWh of energy produced in 2022 [4,5].
These challenges can be grouped into two primary categories: spectral management and thermal management. Ambient environmental conditions such as temperature, humidity, wind speed, and dust accumulation on the surface of the PV module have been shown to negatively impact the conversion efficiency of these devices [6]. In situ studies conducted reported that for every 1 °C rise in temperature, there is an efficiency decrease of 0.50% [7,8,9,10,11]. Aside from the efficiency of the PV cell being reduced, a wide variety of structural and physical defects can occur within the solar module as the temperature of the device increases [8,12,13,14]. Such defects include yellowing or browning of the silicon within the cell, delamination of the packing layers, and the presence of scorched “hot spots” on the material [12,14]. Hence, these challenges must be addressed to prevent a rise in PV exploitation costs that implies purchasing new replacement modules after the damage has occurred. A secondary issue lies in the downstream management and end-of-life processing of the PV cells [15,16,17,18,19]. Such cells have issues relating to toxicity due to the tin-lead plating, which is used as a connection ribbon across the cell surface [16,17,20,21]. Methods of providing cooling to the solar cells in question come in a wide variety. One innovative solution to enhance the performance of PV systems involves the implementation of anti-reflection coatings (ARCs) designed not only to reduce optical losses by minimizing the reflection of visible light but also to effectively manage infrared (IR) radiation. ARCs play a pivotal role in enhancing the overall energy conversion efficiency of PV modules by redirecting IR radiation away from the solar cells, thereby preventing excessive heat buildup and providing cell cooling methods [22,23,24]. However, ARC can also be used in conjunction with plasmonic luminescent layers to increase the solar energy conversion efficiency, as proved in [25,26]. More passive methods of cooling have looked at providing aluminum heat sink fins attached at the rear of the module as a means of reducing the overall temperature of the system [27]. Another more complex system comes in the form of a simple sprinkler, which, when used in this manner, has a dual operational purpose of reducing the surface temperature of the cell and also removing any dust or debris. This is causing shading to occur on the surface of the cell [28]. While these methods have shown enthusiastic results regarding the cooling (and cleaning) of the PV cell in question, the heat that is ultimately removed from the system is ultimately wasted. The ability to functionally use this excess heat as a means of providing thermal energy has prompted the combination of solar thermal systems and photovoltaic systems to form hybrid photovoltaic-thermal (PVT) systems [29,30,31]. A standard PVT system combines a typical thermal collection system (which will normally include a working fluid) and a PV cell [29]. In the classical approach, to cool the PV, the working fluid flows through a pipe under the PV cell without being exposed to the solar flux. Recently, a new approach gained the researchers’ attention. Thus, the working fluid is placed in front of the PV, cell absorbing the heat while still allowing the illumination of the solar cell. There are a series of advantages to utilizing a system such as this [31]. The primary advantage lies in its dual energy generation methods, as such a system is capable of combining electrical conversion and thermal generation, which can provide an overall solar energy conversion efficiency of >90% [32].
Further enhancement to this combined PVT system is aimed at tackling the second major challenge associated with solar-based renewable energy systems, which is the spectral mismatch of the incident light compared to the operational spectral window of the PV cell. For a traditional silicon PV cell, this is between 350 and 1100 nm [33,34,35]. The wavelengths outside this spectral region will determine if a temperature rise occurs and, hence, the generation of excess heat. A popular means of altering the incident light for higher conversion efficiencies within a solar cell is through luminescent down-shifting (LDS). Usually, this employs a luminescent species to be uniformly dispersed through an active medium such as a solid layer on top of the solar cell or within a working fluid [32,36,37]. Thus, the implementation of an LDS layer allows for photons of high energy wavelength (<500 nm) to be harvested for electrical generation and hence increases the electrical efficiency of the PV device. A common material that is used for these LDS investigations is BASF’s Lumogen F series of commercial dyes. These are perylene [38,39,40] and naphthalimides [41,42] structured dyes which provide good solubility in a range of polymers and fluids whilst also having a high quantum yield (85–90%) [38]. When the luminescent dye is dispersed in a solid layer, the thermal component is lost. Dispersing these dyes within the working fluid placed in front of a solar cell provides the dual benefits of spectral modulation and heat absorption. This gives rise to a “Spectral Beam Splitting” PVT (SBS-PVT) device [32,43,44,45].
In this study, a common BASF Lumogen dye, Lumogen F Red 305 (LR-305), will be dispersed in various concentrations in ethylene glycol, which will act as a base fluid. This working fluid will then be placed between a solar simulator and an amorphous silicon cell. As PVT research primarily focuses on the use of monocrystalline silicon (c-Si) PVs [32,46,47,48,49,50,51], amorphous silicon (a-Si) was selected as a candidate for this study in an attempt to expand the scope of current PVT research towards older technologies still in use that could be retrofitted to enhance their solar energy conversion. The use of a-Si PV cells is also justified by studies that report that a-Si cells are less sensitive to temperature fluctuations compared to c-Si cells [52]. The use of a-Si in this experiment is also used to validate the potential of the ray-tracing model, which was previously used only for c-Si cells [51]. Thus, the current study will show that adopting PVT technology can provide a viable method of retrofitting existing a-Si cells to increase their sustainability through extended usage. This will allow for the evaluation of the (differential) temperature at various concentrations and the performance of the PV cell over these temperature ranges, and will permit the assessment of its viability for use in PVT systems. A comprehensive analysis known as the merit function analysis will be conducted within this study to assess and compare the economic performance of the PVT system. This analysis serves to evaluate the cost-effectiveness and competitiveness of the PVT system in relation to standalone energy generation options that solely provide either electrical or thermal energy. The merit function analysis considers parameters that influence the system’s performance. Key parameters considered in the merit function analysis include, ultimately, the solar irradiance incident on the PVT system, the optical efficiency of the PV cell, the spectral response of the PV cell, and the absorptivity of the thermal collector. The solar irradiance represents the intensity of sunlight received by the system and plays a vital role in determining the overall energy output. The optical efficiency of the PV module relates to how effectively it converts incident light into electrical energy, while the spectral response characterizes its sensitivity to different wavelengths of light. Additionally, the thermal absorptivity of the thermal collector determines the system’s ability to absorb and convert incident solar radiation into usable thermal energy. These parameters collectively influence the energy conversion efficiency, overall performance, and ultimately the economic viability of the PVT system. By considering both the electrical and thermal energy outputs and their associated costs, the merit function analysis provides a comprehensive framework for evaluating the economic feasibility and competitiveness of the PVT system.
A combination of a ray tracing model and experimental procedures will be utilized to analyze the optical properties of the system and to investigate the influence of LDS on the electrical and thermal power output of the SBS-PVT system, which assists in the merit function analysis [51,53]. The employed modeling approach is particularly valuable as it provides detailed information regarding the transmission and absorption as the light passes through the working fluid, such as the pristine ethylene glycol with Lumogen F Red 305 dispersed throughout. By capturing these characteristics, the model provides insights into the behavior of the system, either electrically or thermally, by providing the amount of solar energy that can be either transmitted (for electrical energy generation from the PV) or absorbed (for thermal energy generation from the working fluid).

2. Materials and Methods

2.1. Preparation of Working Fluids

In this study, Lumogen Red (LR-305) was dispersed in ethylene glycol (see Figure S1) to create a 0.5 wt% stock solution. This was then diluted to 0.01 wt%, 0.05 wt%, and 0.1 wt% solutions for testing. To make the initial 0.5 wt% stock solution for LR-305, 0.15 g of dye powder was added to 33.3 cm3 of ethylene glycol (anhydrous, 99.8%, Sigma Aldrich/ Merck Life Science LTD, Arklow, Ireland and stirred with a magnetic stirrer for one hour at room temperature at 1050 rpm in a conical flask.

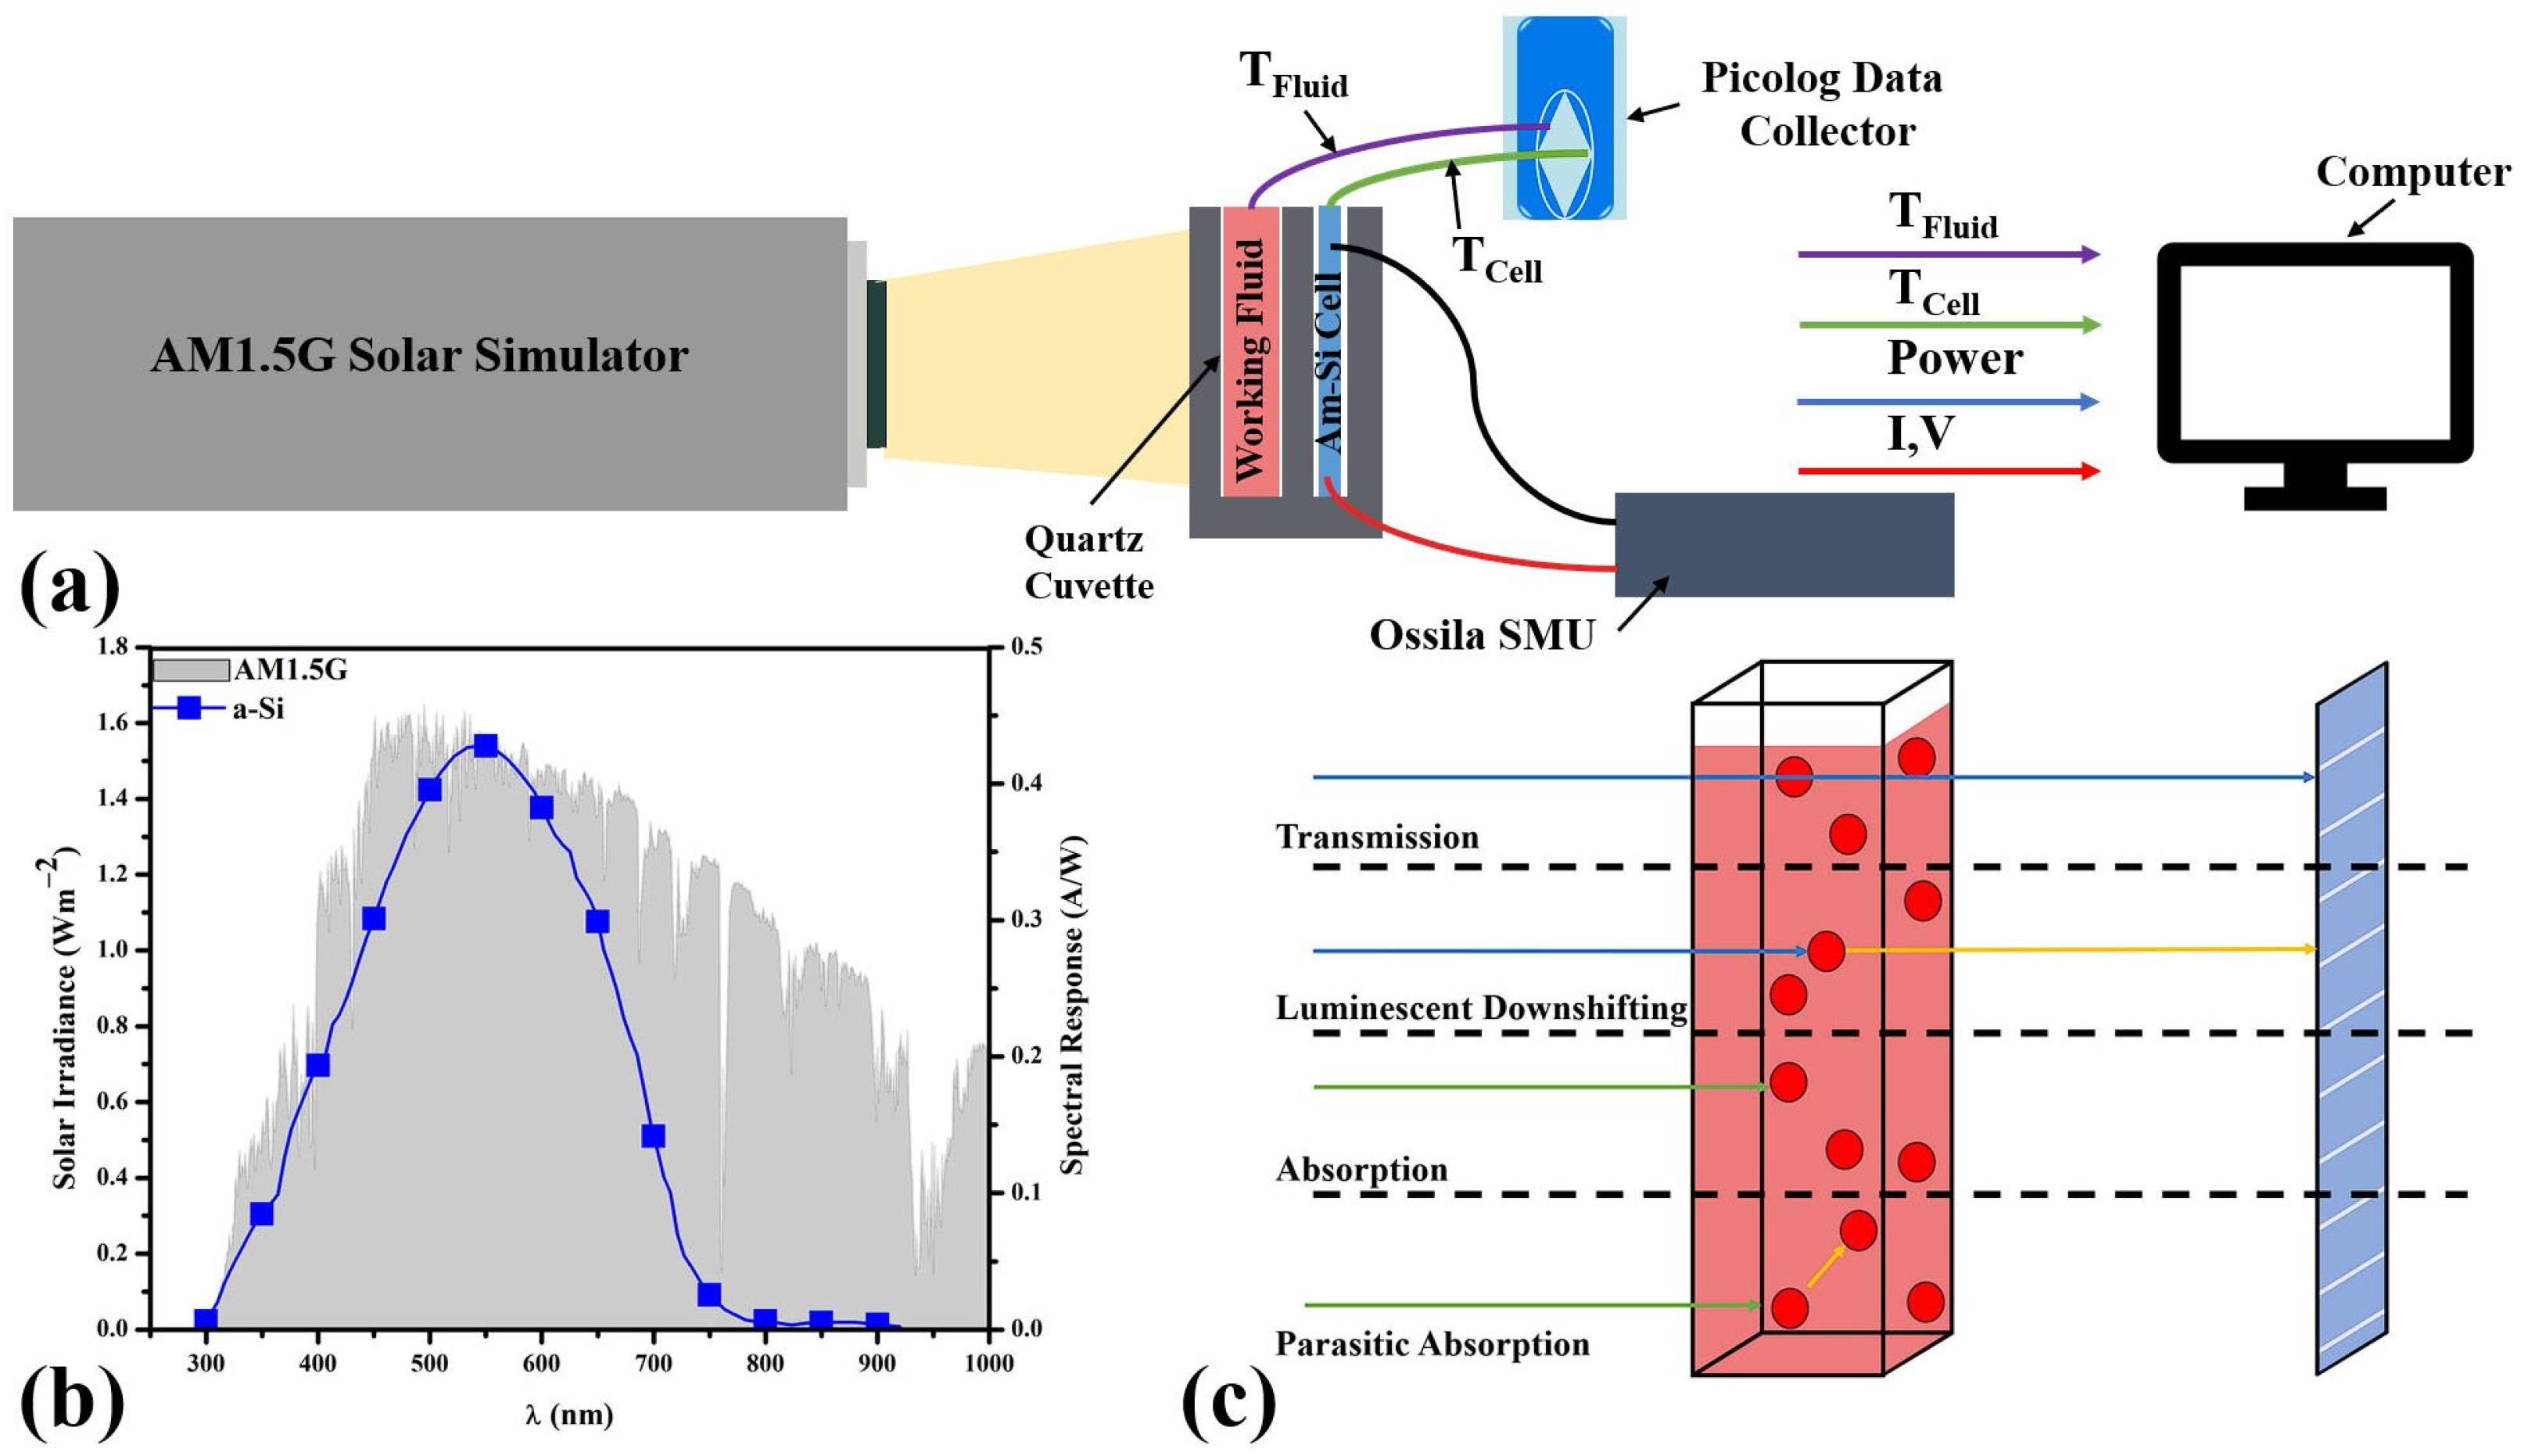
2.2. Photovoltaic-Thermal System Performance

An investigation into photovoltaic-thermal (PVT) systems was performed using the experimental setup presented in the schematic in Figure 1a. The illumination source used for PVT analysis is an Abet 10500 Solar Simulator lamp, which is positioned at a working distance of 10 cm. This solar simulator is classified as Class A for spectral match with an AM1.5G air mass filter through a DC Xenon arc lamp. The intensity of this light was measured using a Kipp and Zonen SP Lite2 pyranometer connected to a standard multimeter. The distance was adjusted to have an equivalent irradiance of 1000 Wm−2 incident on the pyranometer. A 10 mm path-length quartz cuvette filled with the working fluid (pure ethylene glycol or ethylene glycol mixed with LR-305 at different concentrations) is placed in position within the holder, which centers it within the optical path of the solar simulator. The apparatus was located in a large laboratory that has air conditioning and is well ventilated to ensure the room temperature is unaffected by the illumination process.
Positioned after the quartz cuvette is the SOLEMS a-Si solar cell, whose spectral response is represented in Figure 1b as the blue squares. K-type thermocouples connected to a Pico USB TC08 Temperature Data Logger were used to monitor the temperature of the working fluid and the a-Si solar cell. The I-V curve of the solar cell was collected at 5-min intervals using an Ossila brand Xtralien X200 source meter with a voltage measurement uncertainty of ±10 mV and a current uncertainty of ±10 nA.
Before the base or working fluid was incorporated into the apparatus seen in Figure 1a, the experiment was performed with no cuvette present to determine the electrical characteristics of the solar cell under the AM1.5G irradiance. Under these conditions, the energy conversion performance achieved solely by the a-Si PV cell is measured. This also allows us to determine the PV behavior and the changes in IV curves at various temperatures. Once this was performed, the a-Si PV cell was allowed to cool down to the ambient temperature (room temperature). Then an empty cuvette was placed in front of the solar cell, and the electrical behavior (i.e., the I-V curves) and temperature of the a-Si PV cell were again acquired. This configuration of the system was tested to investigate the possible influences that the reflective quartz cuvette (i.e., the housing used to hold the working fluid) could have on the final results. Finally, the measurements were repeated with the cuvette filled with base fluid and various working fluids containing LR-305 at various loading concentrations. Between any two consecutive experiments, the a-Si PV cell was allowed to cool down and reach the initial (room) temperature. Throughout these tests and the illumination cycle, the temperature of the solar cell (TCELL) was monitored using a K-type thermocouple.
The inclusion of the working fluid in the experiment was done by transferring 2 mL to the quartz cuvette. An additional K-type thermocouple was placed through a unique 3D-printed cuvette lid to ensure that the container was completely sealed to reduce the cooling of the fluid under ambient conditions. The fluid temperature could be monitored (TFLUID). The temperature of both TCELL and TFLUID was gathered at 1-s intervals throughout the entire exposure and cooling cycle. The principal electrical characteristics that were investigated were the short circuit density (Jsc), open circuit voltage (Voc), and fill factor (FF), which could be determined from the collected I-V curves.

2.3. Monte Carlo Raytrace Model

In addition to the experimental investigation that was conducted with the apparatus schematically described in Figure 1a, a Monte Carlo Raytrace model was also used to simulate the optical performance of the LR-305-based working fluids and provide additional information. This model has been thoroughly explained in our previous work (for more details, see ref. [51] and Figure S2). The spectral properties of this dye are well characterized in references [54,55] and show stability with temperature throughout the temperature ranges that were experienced in this study. Therefore, for the model employed, temperature dependence is not considered. Properties relating to the geometrical design of the apparatus and the optical properties of the working fluid are the only requirements for beginning the simulation. The apparatus, which has been previously outlined in Figure 1a, is the geometrical basis upon which the modeling was performed. Hence, the quartz cuvette having dimensions of 120 mm × 2 mm × 75 mm, is designed within the model and placed in the simulated space. An a-Si PV cell is placed at the rear of this quartz cuvette and has the spectral response outlined in Figure 1b. Optical parameters are also required for this simulation, namely the absorption coefficient of the working fluid and its refractive index. Ethylene glycol is used as a base fluid in this simulation, with a refractive index of n = 1.43. The re-emission of photons from the working fluid towards the light source is not considered in the results of this study as it will not contribute to energy generation via electrical or thermal means. However, the percentage of photons that underwent re-emission after an LDS event and left the system towards the light source is presented in Figure S3 of the supplemental material.
For the simulation, 100,000 unique photons [56] are generated with a random wavelength in accordance with the AM1.5G spectrum. Each photon was generated in sequence, and its initial wavelength (λinitial) and position were recorded. As the photon moved through the simulated space and was then incident upon the working fluid, a number of interactions could be recorded based on the final position of the generated photon. This is shown schematically in Figure 1c. The first of these interactions is the transmission event. In this event, the photon enters the working fluid with λinitial and is impinged upon the solar cell with λfinal = λinitial. Another event that can occur is luminescent down-shifting (LDS). This interaction occurs when an incident photon interacts with the luminophore present within the working fluid. Downshifting occurs based on the absorption and emission properties of the luminophore in question. This event is recorded as λfinal ≠ λinitial with λfinal > λinitial. Absorption events are also recorded. These events are recorded when the photon’s final location is recorded as being within the cuvette containing the working fluid. Hence, an absorption event (from Figure 1c) is recorded as a photon that was incident upon the working fluid yet ended its lifecycle within this location, never impinging upon the a-Si PV cell. A more advanced form of absorption that can also be recorded is parasitic absorption. When a photon interacts with the luminophore present and undergoes LDS, as signalled by its λfinal ≠ λinitial, parasitic absorption is said to occur. This interaction is due to the overlapping of absorption and emission bands, which are characteristics of the luminophore (referred to as Stokes shift losses). While a photon is successfully able to undergo LDS, its final wavelength is located within the absorption band of the luminophore, and (re)absorption occurs. From these four interactions, it is possible to build a comprehensive model to determine the interactions of photons towards energy generation within a PVT system such as this [51].

2.4. PVT Energy Conversion Calculation

The working fluids that are investigated within this study will be subjected to an experimental analysis regarding their merit functions for various loading concentrations of the luminescent material dispersed through the ethylene glycol. The following method was used to determine the merit functions of the working fluids and to compare the model outputs with the experimentally gathered results [32,51,57,58,59]. The reverse saturation current density J00 of the modeled a-Si PV cell was determined using Equation (1) [32,59]:
J 00 = K T 3 n exp ( E g m k b T c )
where K , n , and m are empirical constants, Eg represents the bandgap energy, k B is the Boltzmann constant and T c is the solar cell temperature—the numerical value of these constants can be found in previous work (see [32,51]). The short-circuit current density J S C was determined using the following equation:
J S C   f i l t e r e d = 280   nm 2500   nm ϕ λ · S R ( λ ) · τ L I Q U I D ( λ ) · d λ
where S R ( λ ) represents the spectral response of the investigated amorphous silicon cell, ϕ λ represents the transmitted irradiance that is incident upon the PV cell after passing through the working fluid [58]. This transmitted irradiance is represented in the model using the “transmitted” photons (Figure 1c), which are comprised of both unmodulated (transmitted) and LDS photons that impinge on the PV cell. VOC represents the open circuit voltage, and it is determined via
V O C = A k B T c e ln f · J S C J 00 + 1
where e is the fundamental unit of charge, f is the concentration factor and A′ is the ideality factor. The fill factor (FF) is determined by [32,59];
F F = V m p V O C 1 e e V m p k B T C 1 e e V O C k B T C 1  
where Vmp is the maximum voltage derived at the maximum power point of the I–V response curve, which can be approximated by
V m p = k V O C
where k is typically between 0.7 and 0.8. The electrical power output derived by the a-Si PV cell with an accompanying working fluid can be determined by multiplying the corresponding Voc and FF for Jsc (filtered), as follows:
P P V = J s c V O C F F
The thermal power output of the PVT system when equipped with the working fluid Pth is attained by determining the outgoing spectrum of light that is directed toward the solar cell after spectral modulation has occurred within the simulation. This value is calculated as
P t h = η c o l l e c t o r 280 nm 2500 nm ϕ A M 1.5 G λ · 1 τ l i q u i d λ · d λ
where the absorption of the working fluids is quantified by the 1 τ l i q u i d λ term. In this scenario, we assume that absorption is determined by the outward spectrum. Assumptions are also made relating to the collector efficiency, η c o l l e c t o r , of the thermal component within the PVT system, which is assumed to be 67% [32]. The dynamic competition between the percentage of the solar irradiance partitioned into usable thermal and electrical energy for each working fluid was revealed through the following expression:
η = P 280   nm 2500   nm ϕ A M 1.5 G λ d λ
where P represented the thermal ( P t h ) or electrical ( P P V ) power output of the PVT system and η is the energy conversion percentage for this type of energy.
To evaluate whether a working fluid can convert solar energy into electrical and thermal energy more efficiently within a PVT system, a merit function is implemented.
M F = w P P V + P P t w P P V ( u n f i l t e r e d )
where P P V and P P V ( u n f i l t e r e d ) is the filtered and unfiltered (i.e., no cuvette) electrical power output of the silicon cell, a w is the worth factor of electricity to thermal energy.
Classically, heat transfer fluids, such as the ones employed in this study, are evaluated using a 3:1 worth factor of electricity to thermal energy [59]. All values used for Equations (1)–(9) can be seen in previous work [32,51].

3. Results

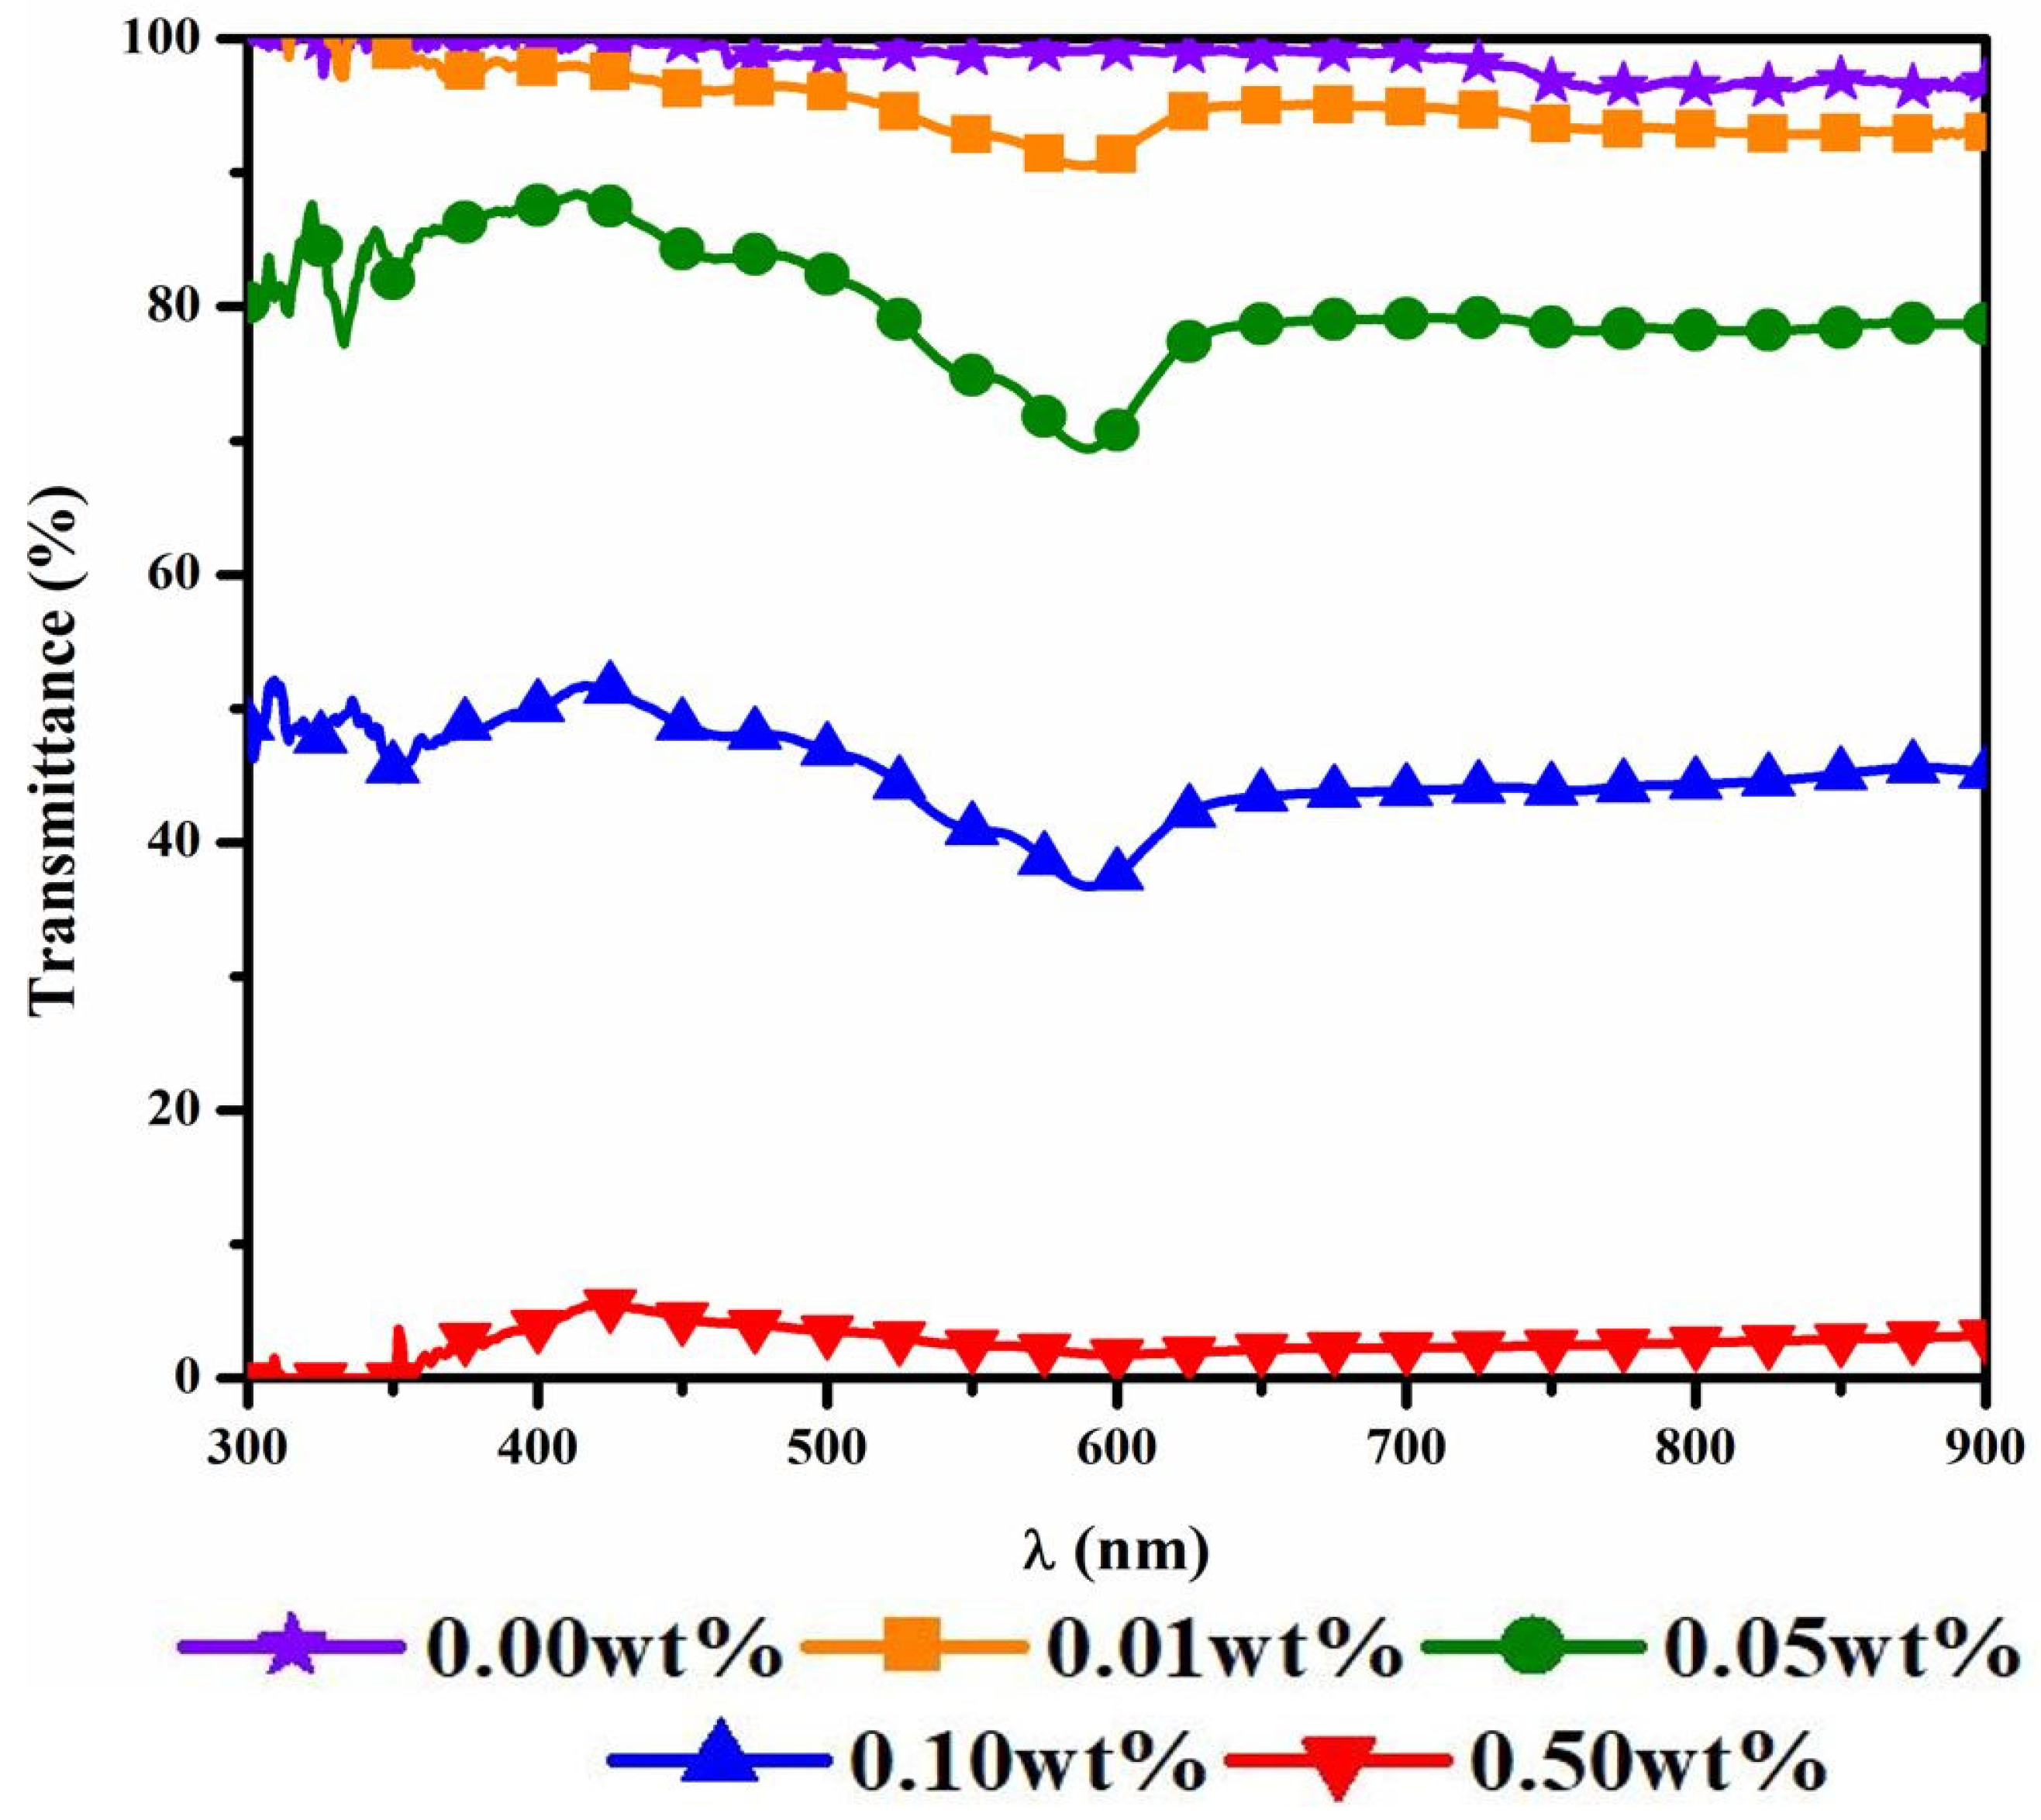
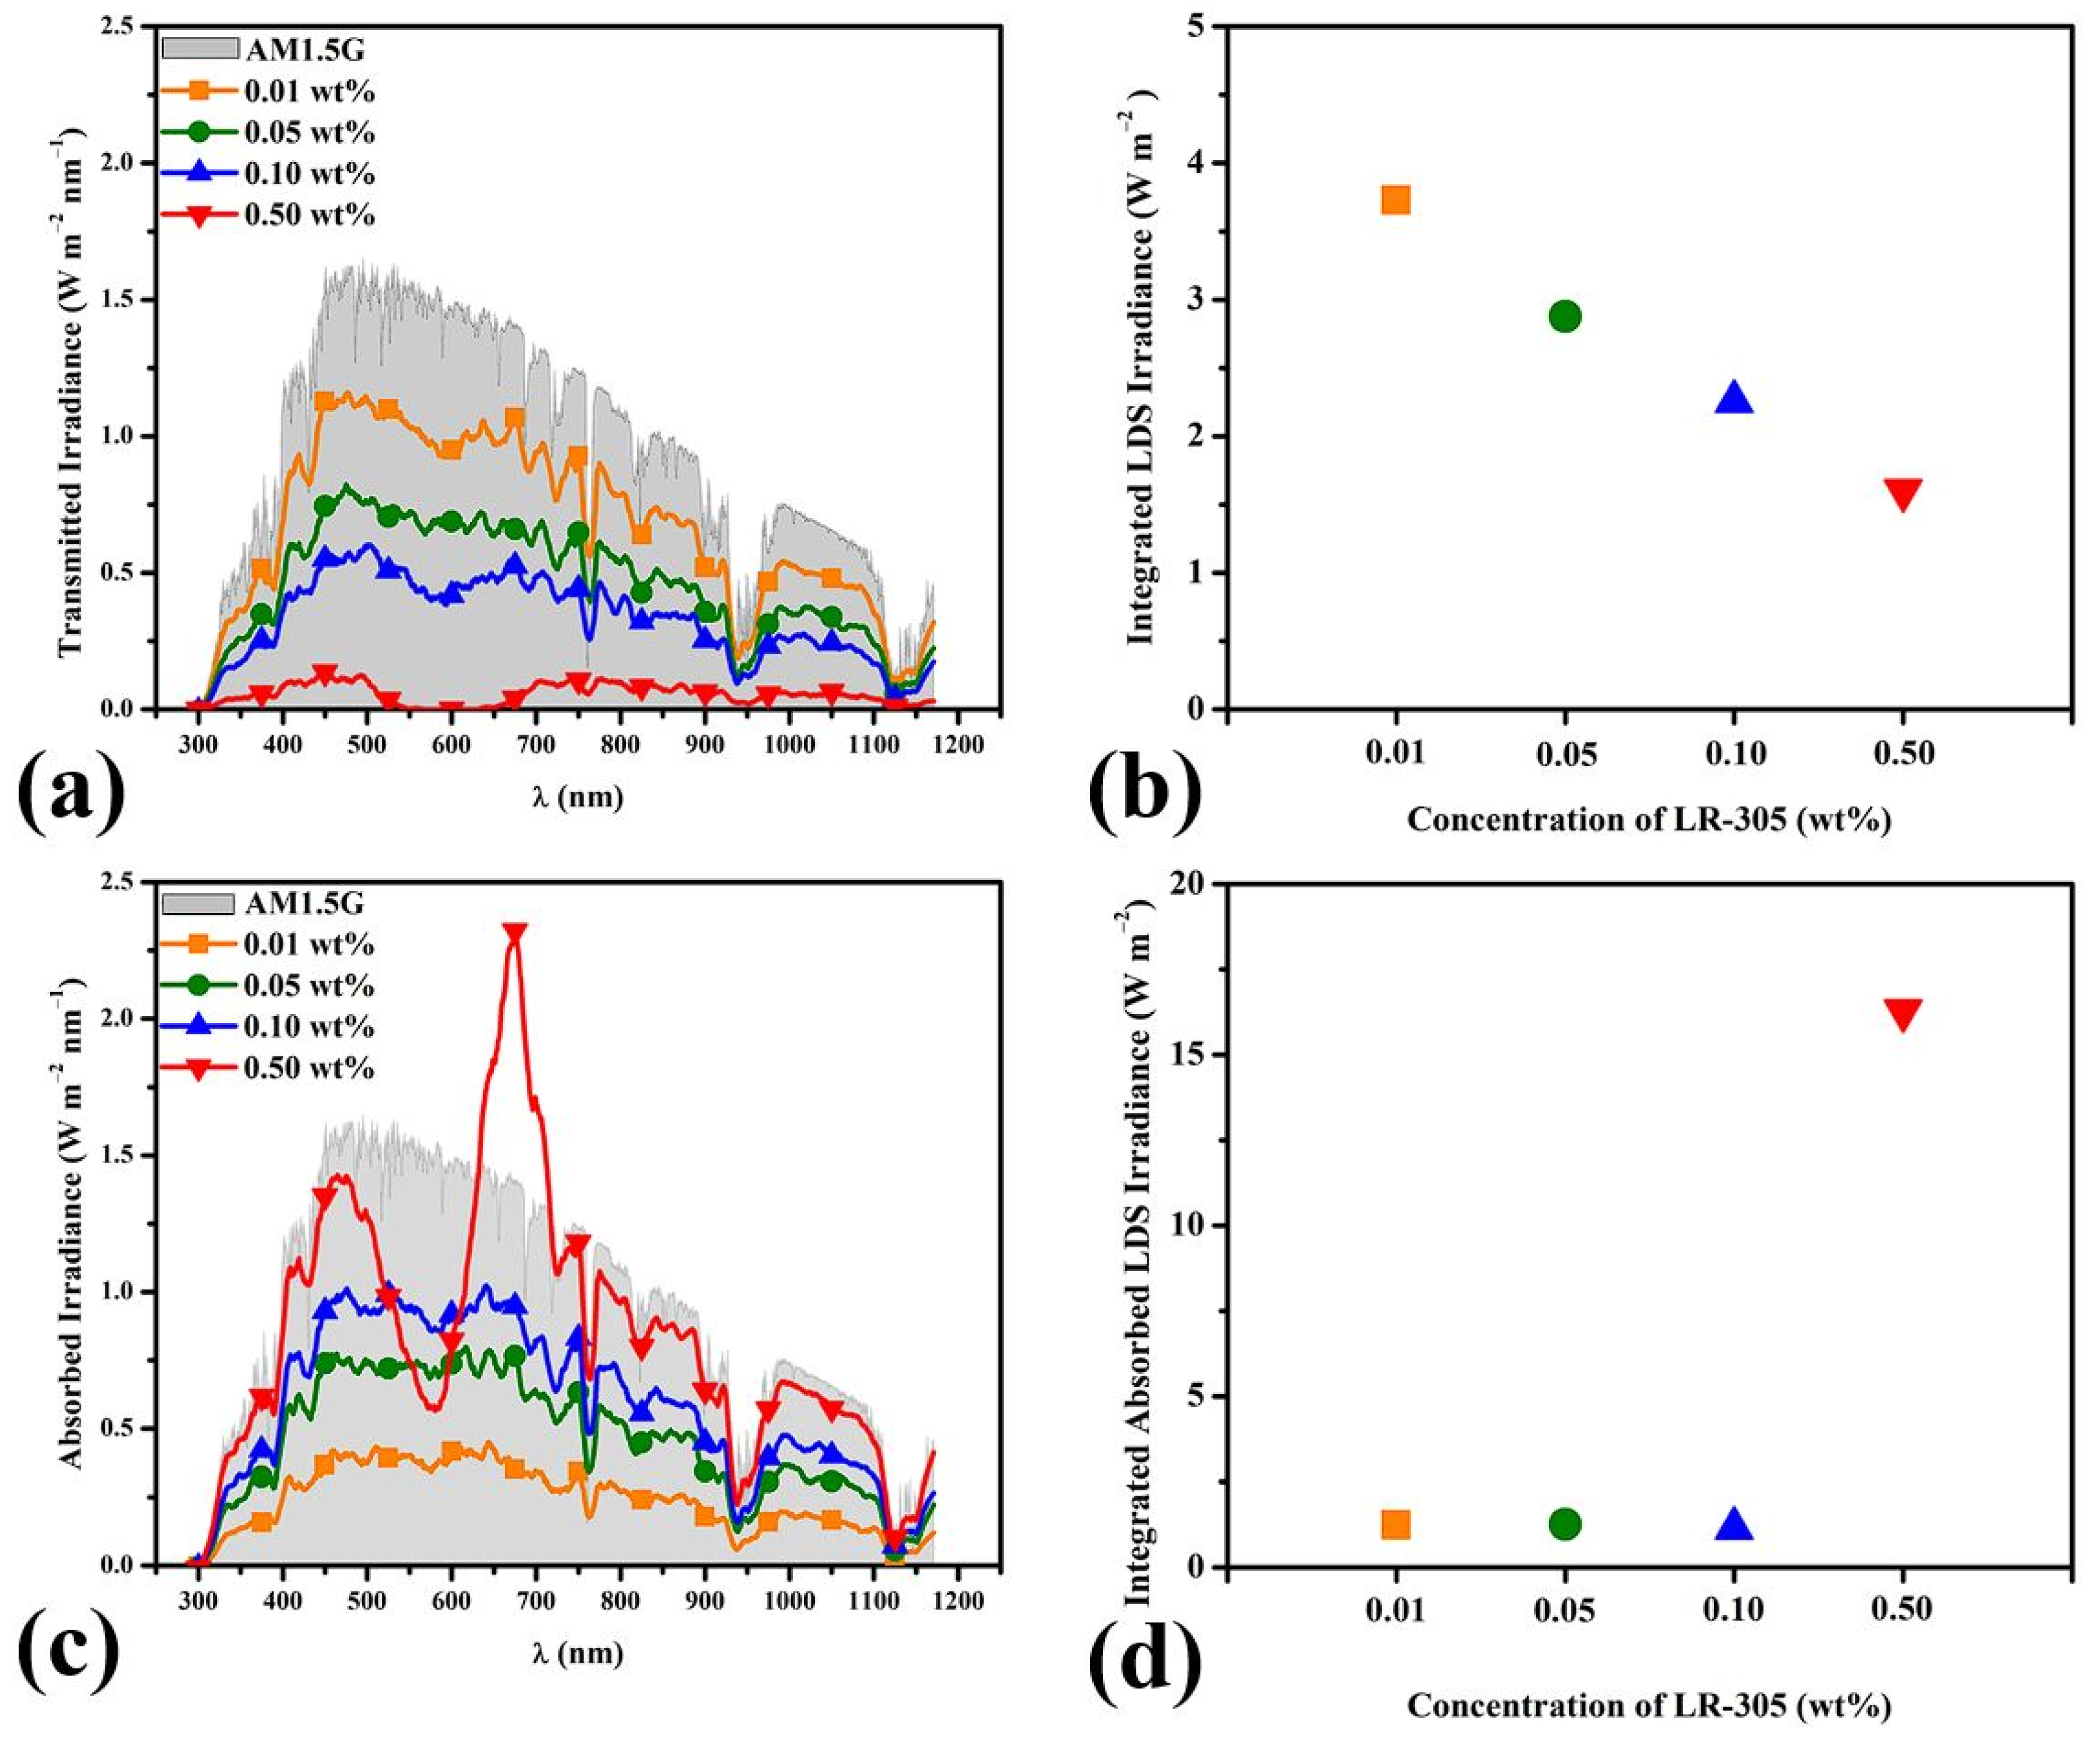
3.1. Optical Transmittance of the Working Fluids

The optical transmittance of the pristine base fluid and the various working fluids, which contained LR-305 in various amounts, served as the primary material attribute through which the performance of the combined PVT system was assessed. The optical transmittance of the base fluid and all the concentrations investigated are shown in Figure 2. Undoped ethylene glycol provided >96.7% transmittance over a wavelength range of 400–900 nm.
This ethylene glycol base fluid was doped with increasing concentrations of the Lumogen F Red 305 organic dye, which absorbs in the region of 300–580 nm [60,61,62]. This effect can also be seen for the various concentrations investigated in Figure 2. As the concentration of LR-305 in the working fluid increased, a reduction in transmittance was recorded. For the 0.01 wt% (Figure 2—orange square), 0.05 wt% (Figure 2—green circle), and 0.10 wt% (Figure 2—blue triangle), an expected reduction in transmittance is observed in the regions of 550–600 nm, which is the wavelength region over which the Lumogen F Red 305 dye is particularly active [60,61,62]. The lowest concentration of LR-305 (0.01 wt%, Figure 2—orange square) was found to have an average transmittance of 93.9% over a wavelength range of 400–920 nm. As the loading concentration of LR-305 increased from 0.01 wt% to 0.50 wt%, the transmittance over the same spectral region decreased from 93.9% to 2.9%. A reduction in transmitted light incident on the solar cell will have a significant impact on its conversion efficiency. The reduction in light which was observed from these materials is focused at the 550–600 nm region, which is located within the spectral response of this PV cell (Figure 1b). Low transmittances such as this have a detrimental impact on the conversion performance of the a-Si PV cell. Thus, since the transmittance is low, a large portion of the incoming photon flux cannot penetrate through the working fluid and reach the active layer of the a-Si PV cell.

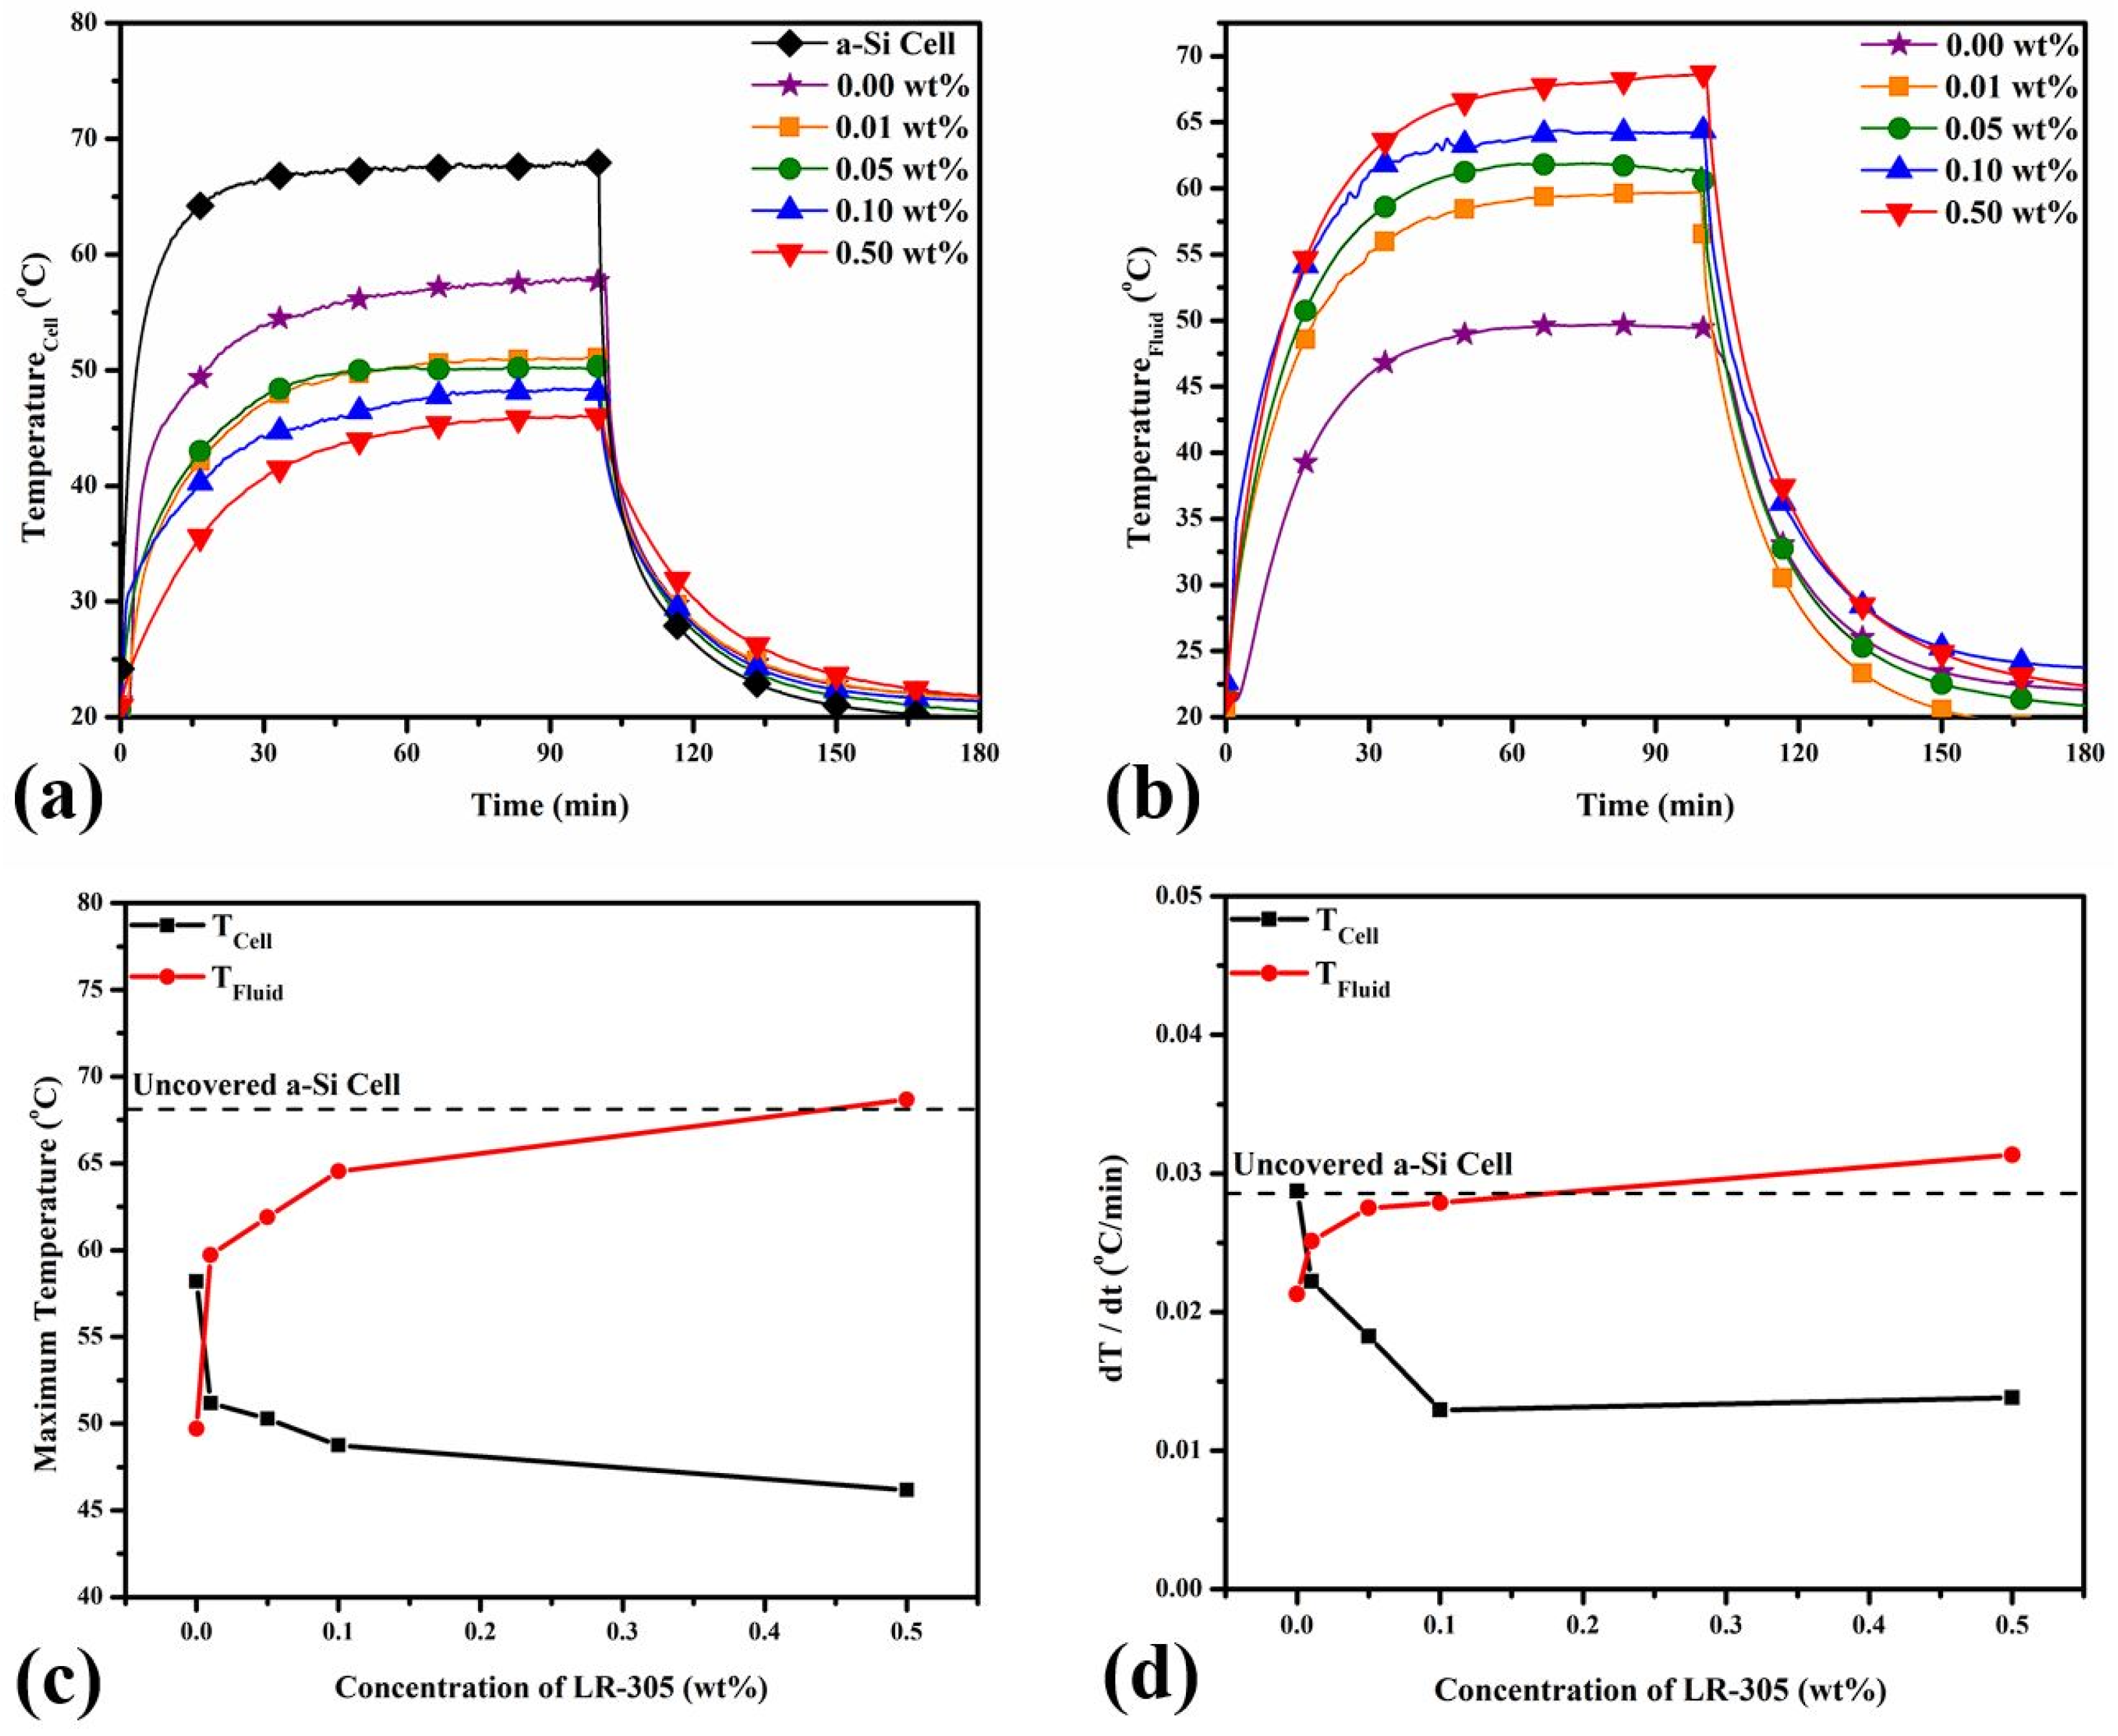
3.2. Thermal Response of the PV Cell & the Working Fluid

As the working fluid and the PV cell were subjected to the incident radiation, the temperature of both the PV cell (TCell) and the working fluid (TFluid) was closely monitored to assess the potential thermal energy conversion of the working fluid along with the ability to monitor the changes in the electrical characteristics of the solar cell in relation to the temperature over time.
The uncovered PV cell reaches a maximum temperature of 68.12 °C. Utilizing the base fluid (i.e., pristine ethylene glycol) as the working fluid in the PVT system resulted in the temperature of the PV cell reaching a maximum temperature of 58.20 °C while the fluid reached a maximum temperature of 49.70 °C during the illumination period. This suggests that even the base fluid can lead to a decrease in the TCell and, thus minimizing, to a certain extent, the detrimental effects that the temperature can have on the PV.
By including the lowest concentration of LR-305 (0.01 wt%) when compared to the base ethylene glycol working fluid, a rise in fluid temperature of 10.01 °C was recorded (Figure 3b). A steady increase in the maximum temperature achieved by the working fluid was seen over the rising concentrations, with a total temperature difference of 8.97 °C being observed between the lowest and highest concentrations of LR-305 used in this investigation. The inclusion of the LR-305 dye has shown direct evidence of reducing the overall maximum temperature of the solar cell in question (Figure 3c). For the base fluid of pristine ethylene glycol, the temperature of the a-Si cell was measured to be 58.22 °C. However, even at the lowest concentration of 0.01 wt% LR-305, the temperature dropped significantly to 51.19 °C. As the concentration of LR-305 was increased further to 0.05 wt%, 0.1 wt%, and 0.5 wt%, the temperature continued to decrease to 50.29 °C, 48.75 °C, and 46.17 °C, respectively. Through analysis of the temperature change rate within the system (as depicted in Figure 3d), it becomes evident that the heating rate in the fluid exhibits a good linear correlation with the increasing loading concentration of LR-305. Incorporating LR-305 into the working fluid introduces a certain degree of temperature reduction to the PV cell; however, the passive cooling effect of the SBS reaches a plateau at a loading concentration of 0.10 wt%, indicating a limitation in its cooling capabilities.

3.3. Electrical Characteristics of the PV Cell

The recorded electrical characteristics of the a-Si solar cell are reported in Figure 4. From the IV curves collected every 5 min for 100 min (Figure 4a), the effect of temperature upon these various characteristics can be recorded. The effect of including the luminophore in the working fluid can also be investigated.
A linear inverse proportionality between the open circuit voltage (Voc) and temperature can be seen in Figure 4b. For the pristine ethylene glycol and all concentrations of the included luminophore dispersed through the base fluid, a rise in temperature correlated with a lower value of Voc. While each of the various concentrations that were investigated displayed various Voc values, a unifying trend is that of the loss of Voc with a rise in temperature. The pristine ethylene glycol demonstrated a Voc change rate of −29.7 mV/°C. However, the incorporation of LR-305 in the working fluid reduced this change. At a concentration of 0.01 wt%, the rate of change was reduced to −20.3 mV/°C. Similarly, the 0.05 wt% concentration yielded a value of −21.8 mV/°C, the 0.10 wt% concentration resulted in −24.8 mV/°C, and the highest luminophore concentration of 0.50 wt% exhibited a rate of −23.1 mV/°C.
The Jsc measurements reported no significant deviation for the PVT system, regardless of the concentration of the LR-305 compared to the ethylene glycol. All concentrations were found to have an initial Jsc value of between 21 A cm−2 (Figure 4c—0.05 wt%) and 24 A cm−2 (Figure 4c—0.00 wt%) while at room temperature. For the uncovered a-Si cell, a significant rise in Jsc was observed from 27 A cm−2 to 38 A cm−2 across the first 5 min of illumination. This rise in Jsc was also associated with a drastic increase in cell temperature. Beyond this rapid rise, the Jsc values of the uncovered cell remained steady through increases in temperature.
The maximum power (Pmax) output derived from the a-Si PV cell when equipped with the different configurations of the working fluid over the illumination period is presented in Figure 4d. Pristine ethylene glycol exhibits a gradual reduction in the maximum power output as the temperature of the PV cell begins to increase through the illumination cycle. Measuring an initial power output of 95.6 µW, this gradually declined over the remaining 100-min period at a rate of −0.14 µW/°C. The ethylene glycol also provided the concentration with the largest Pmax from the working fluids, with 88 ± 4.4 µW. The remaining concentrations experienced stability throughout this cycle. The lowest Pmax was observed for the concentration of 0.10 wt%, which saw an average Pmax of 74 ± 3.7 µW, while the 0.50 wt% provided the largest value at 89 ± 2.3 µW.
Similar to the Jsc values, the fill factor (Figure 4e) observed for each of the LR-305 concentrations saw no significant deviations throughout the illumination process yet consistently surpassed the uncovered cell after the initial measurement. The largest change in FF for each concentration evaluated occurred during this initial 5-min period. Beyond this region, the measurements remain stable. The largest fill factor of the working fluids was recorded for the 0.01 wt% at 83.8 ± 1.9%, with the smallest from ethylene glycol at 80.9 ± 3.9%.

3.4. Monte Carlo Raytracing Model

The raytracing model allows evaluation of the events outlined in Figure 1c for the PVT system. An important comparison performed within this study was to determine the ability of the computational model to simulate the short-circuit current density of the a-Si PV cell when placed under the filtered irradiance conditions created by the various working fluids. This was used as the basis for validating the results that were generated from the simulation (Figure 5).
Good agreement between the simulated and measured Jsc values can be seen in Figure 5, with the 0.05 wt% performing particularly well. This concentration was found to produce a Jsc value that had a difference of 0.9% from the experimental result, highlighting the precision available from the model. Modelling of the pristine ethylene glycol also produced similar results, with only a 1.30% difference between the experimental and modeled values. Across the concentration range of LR-305 utilized in the working fluid, the divergence between the predicted Jsc and the Jsc determined under experimental conditions ranged from 1.4 mA/cm2 to 5.6 mA/cm2. Consequently, this was integrated as an uncertainty when performing the modeling calculations. The results for both the transmission and absorption events that were recorded from the model are shown in Figure 6.

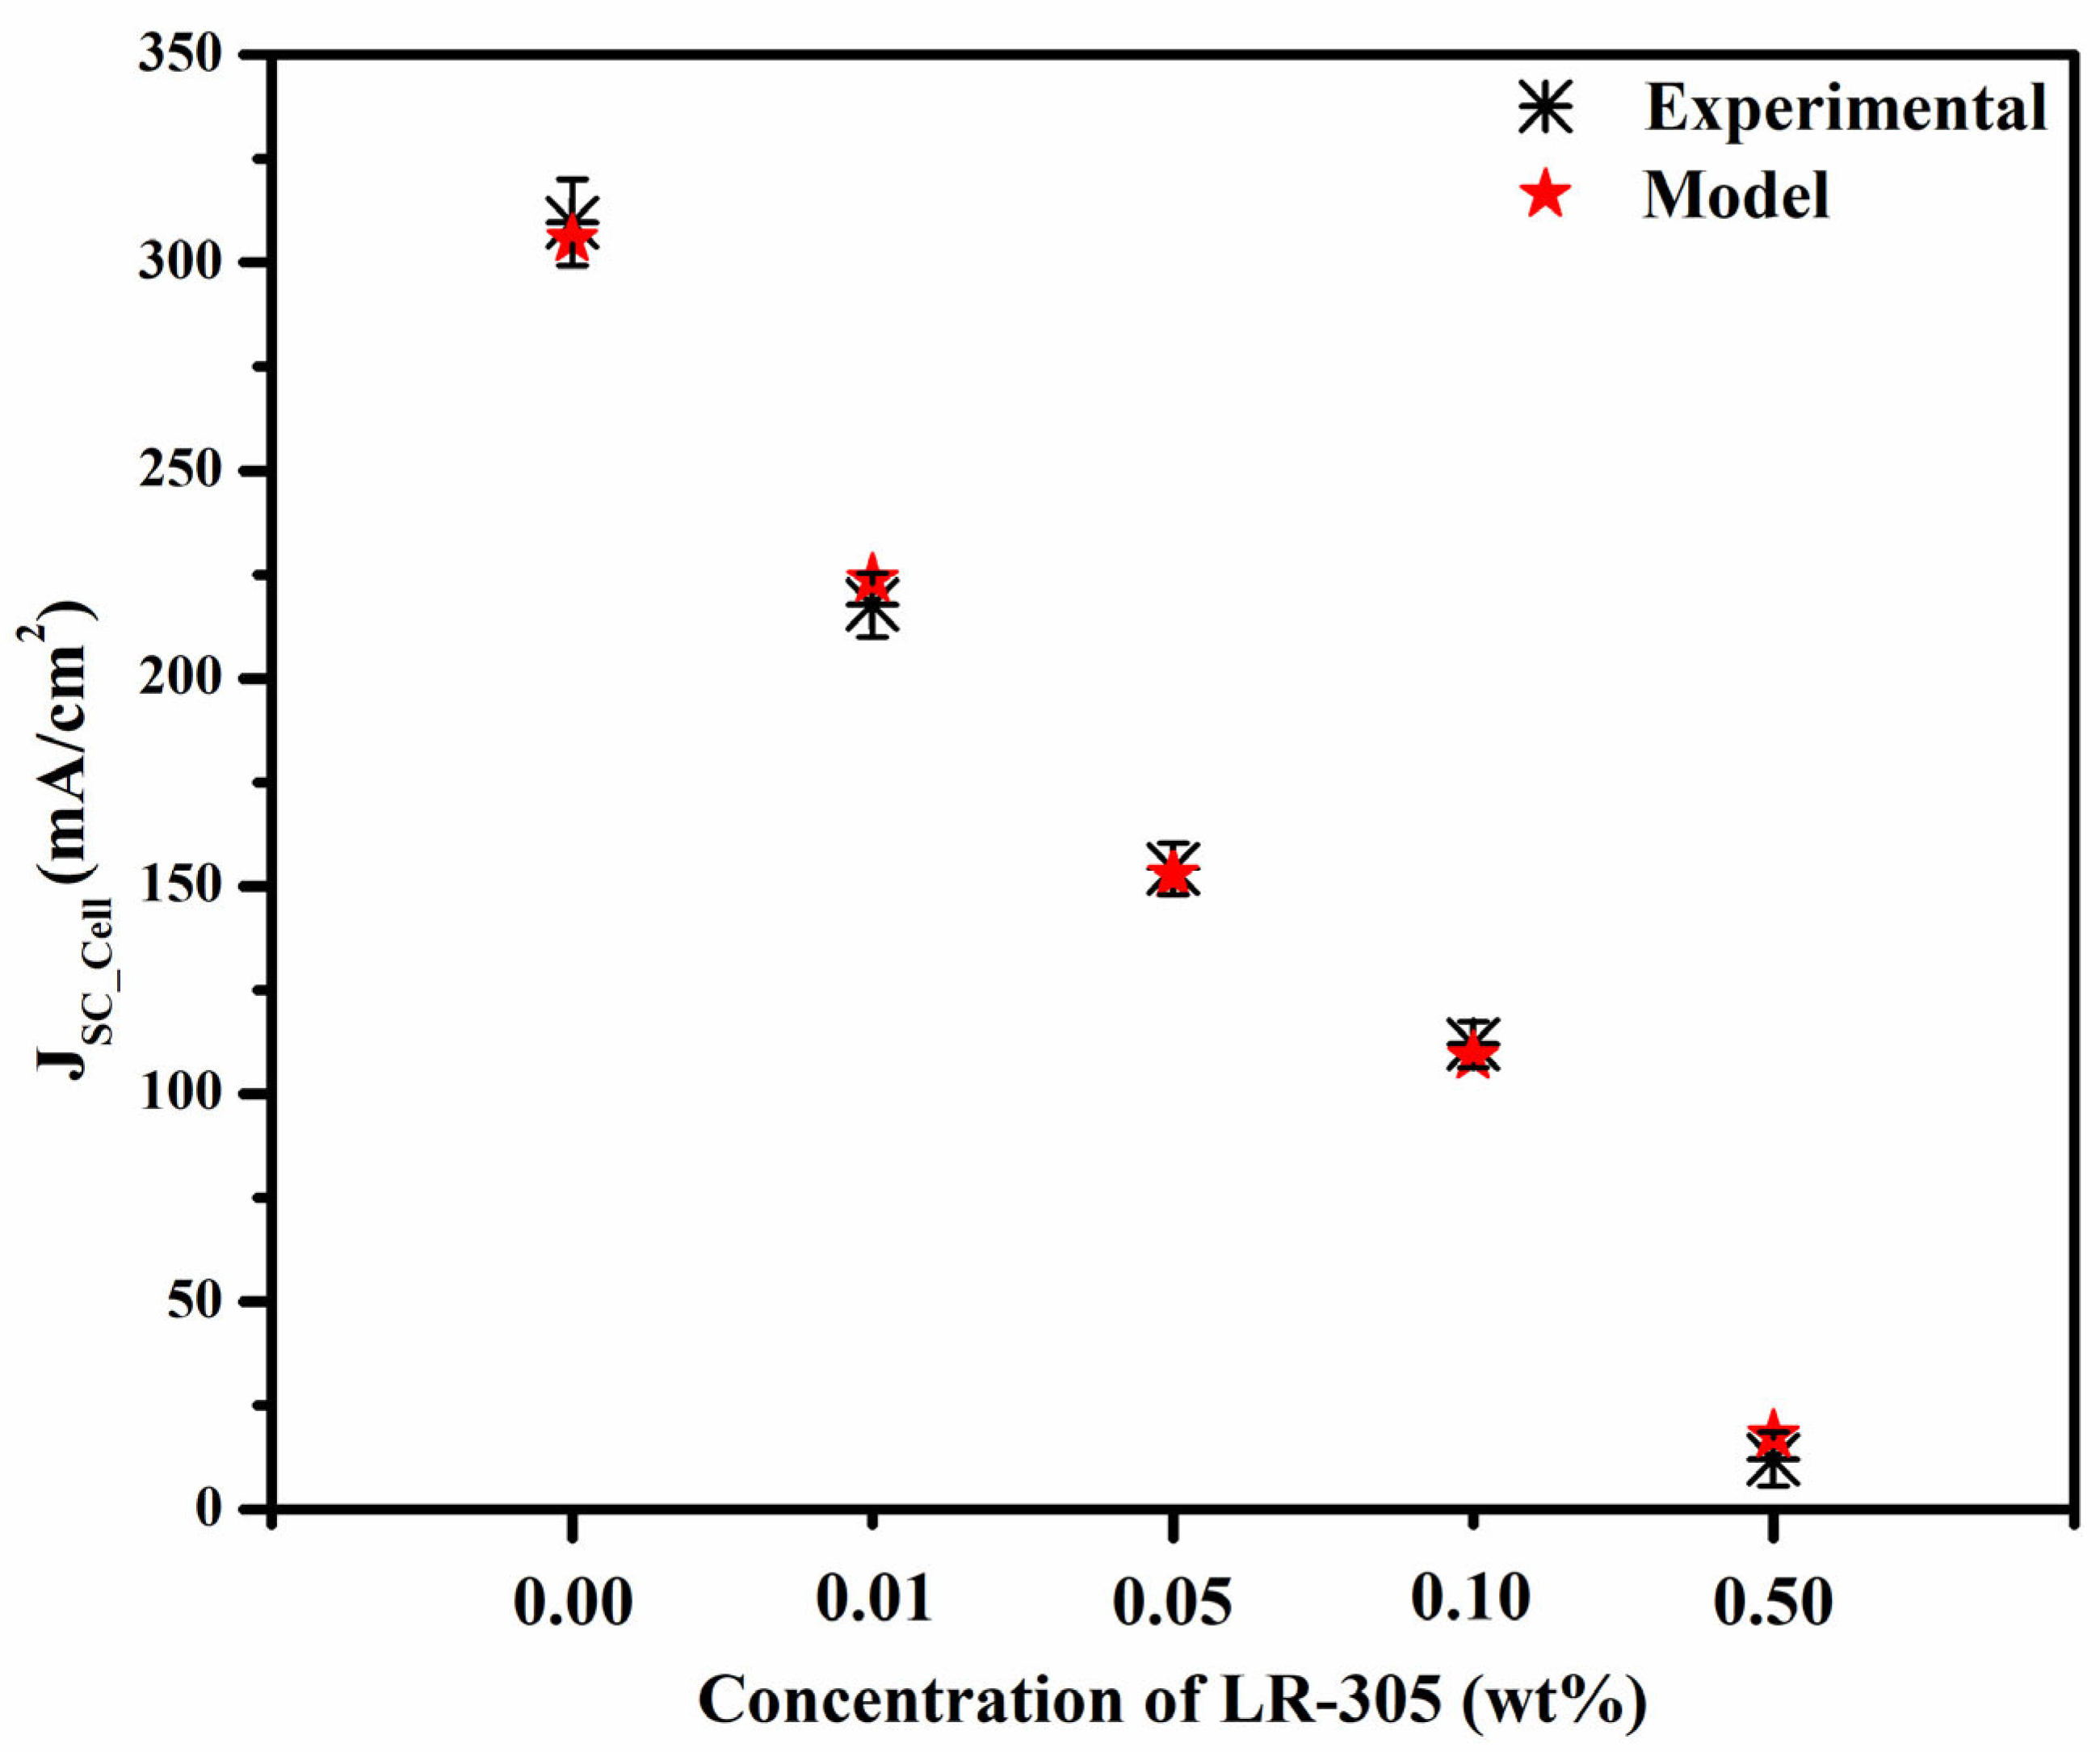
3.4.1. Photons Incident on Solar Cell

The spectral breakdown of the transmitted photons that were recorded as being incident upon the a-Si solar cell can be seen in Figure 6a. This irradiance is due to photons, which were recorded as having no spectral modulation occurring through their lifecycle. It can be seen that a rise in the concentration of LR-305 corresponds to a decrease in the transmitted photons. This result is also supported by the recorded transmission spectrum of each working fluid (Figure 2).
The spectral irradiance that was incident upon the solar cell within this SBS-PVT system, which was solely due to photons that underwent transmission (both LDS and otherwise), provided 5.8% to 71.6% of the total power that was available for PV conversion. The lowest concentration of 0.01 wt% (Figure 6a—orange square) delivered the largest portion of power, enabling 589.8 Wm−2 of the incident solar irradiation to reach the front of the solar cell and become available for PV conversion. Conversely, the largest concentration of 0.50 wt% (Figure 6a—red inverted triangle) led to 47.72 Wm−2. This was somehow expected, as at this concentration, large absorption was also present. For the remaining 2 concentrations of 0.05 wt% and 0.10 wt%, 403.1 Wm−2 and 287.5 Wm−2 of spectral irradiance are impinging upon the a-Si cell, respectively.
As previously mentioned, this model produces 100,000 unique photons and tracks them throughout their lifecycle. Hence, it is possible to ascertain the number of photons that underwent this transmission event. For the lowest concentration of LR-305 used in the working fluid, 0.01 wt%, 71.95% of the photons were transmitted through the fluid. At higher concentrations, such as 0.05 wt%, a drastic drop in transmitted photons was observed, with 49.26% of photons being transmitted. For the two largest concentrations of 0.10 wt% and 0.50 wt%, 35.23% and 6.61% photons were transmitted, respectively.
LR-305 will emit photons that are centered at approximately 625 nm, and this can be monitored by the model (Figure 6b). The lowest concentration, 0.01 wt% (Figure 6b—orange square) of LR-305 investigated, was found to produce the largest contribution to the overall transmitted LDS photons, with only 0.6% of the total transmitted photon contribution. This results in a total of 296 photons undergoing LDS within this concentration and then interacting with the solar cell in question. A gradual decline in contribution to LDS power generation can be seen for higher concentrations, with 0.5%, 0.4%, and 0.3% for 0.05 wt% (Figure 6b—green circle), 0.10 wt% (Figure 6b—blue triangle), and 0.50 wt% (Figure 6b—red inverted triangle), respectively.

3.4.2. Absorbed Photons

As previously stated, the simulation is capable of determining the total irradiance that was incident upon the PV component of the combined system to provide information on the spectral irradiance that was available for conversion into electrical power within the SBS-PVT system. The system is also capable of determining the number of photons that were absorbed within the working fluid and hence contributed to thermal energy generation. The total absorption information is represented in Figure 6c and is produced from the combined optical interaction pathways of absorption and parasitic absorption (Figure 1c). The total power generation from absorbed photons contributed 25.8–89.2% with an observed trend of a rise in concentration resulting in a rise in absorbed photons.
The most immediate observation is that the largest concentration of the luminophore present, 0.50 wt% (Figure 6c—red inverted triangle), provides the largest contribution of irradiance, highlighting a comparatively large quantity of absorbed and parasitically absorbed photons. The total power that was absorbed within the working fluid for this concentration (0.50 wt%) was found to be 734.7 Wm−2 with a total of 89.87% of photons being absorbed within the working fluid to contribute to this total power generation. The lowest concentration of 0.01 wt% exhibited an absorption contribution of 212.5 Wm−2 from 25.63% of generated photons undergoing absorption.
Photons that underwent luminescent downshifting also had the probability of being reabsorbed within the working fluid should their wavelength overlap with the absorption properties of the LR-305 dye. The integrated irradiance of photons that were subjected to this form of parasitic absorption can be seen in Figure 6d. The largest concentration of the luminophore, 0.50 wt% (inset Figure 6d—red inverted triangle), had a noticeable rise in parasitic absorption.

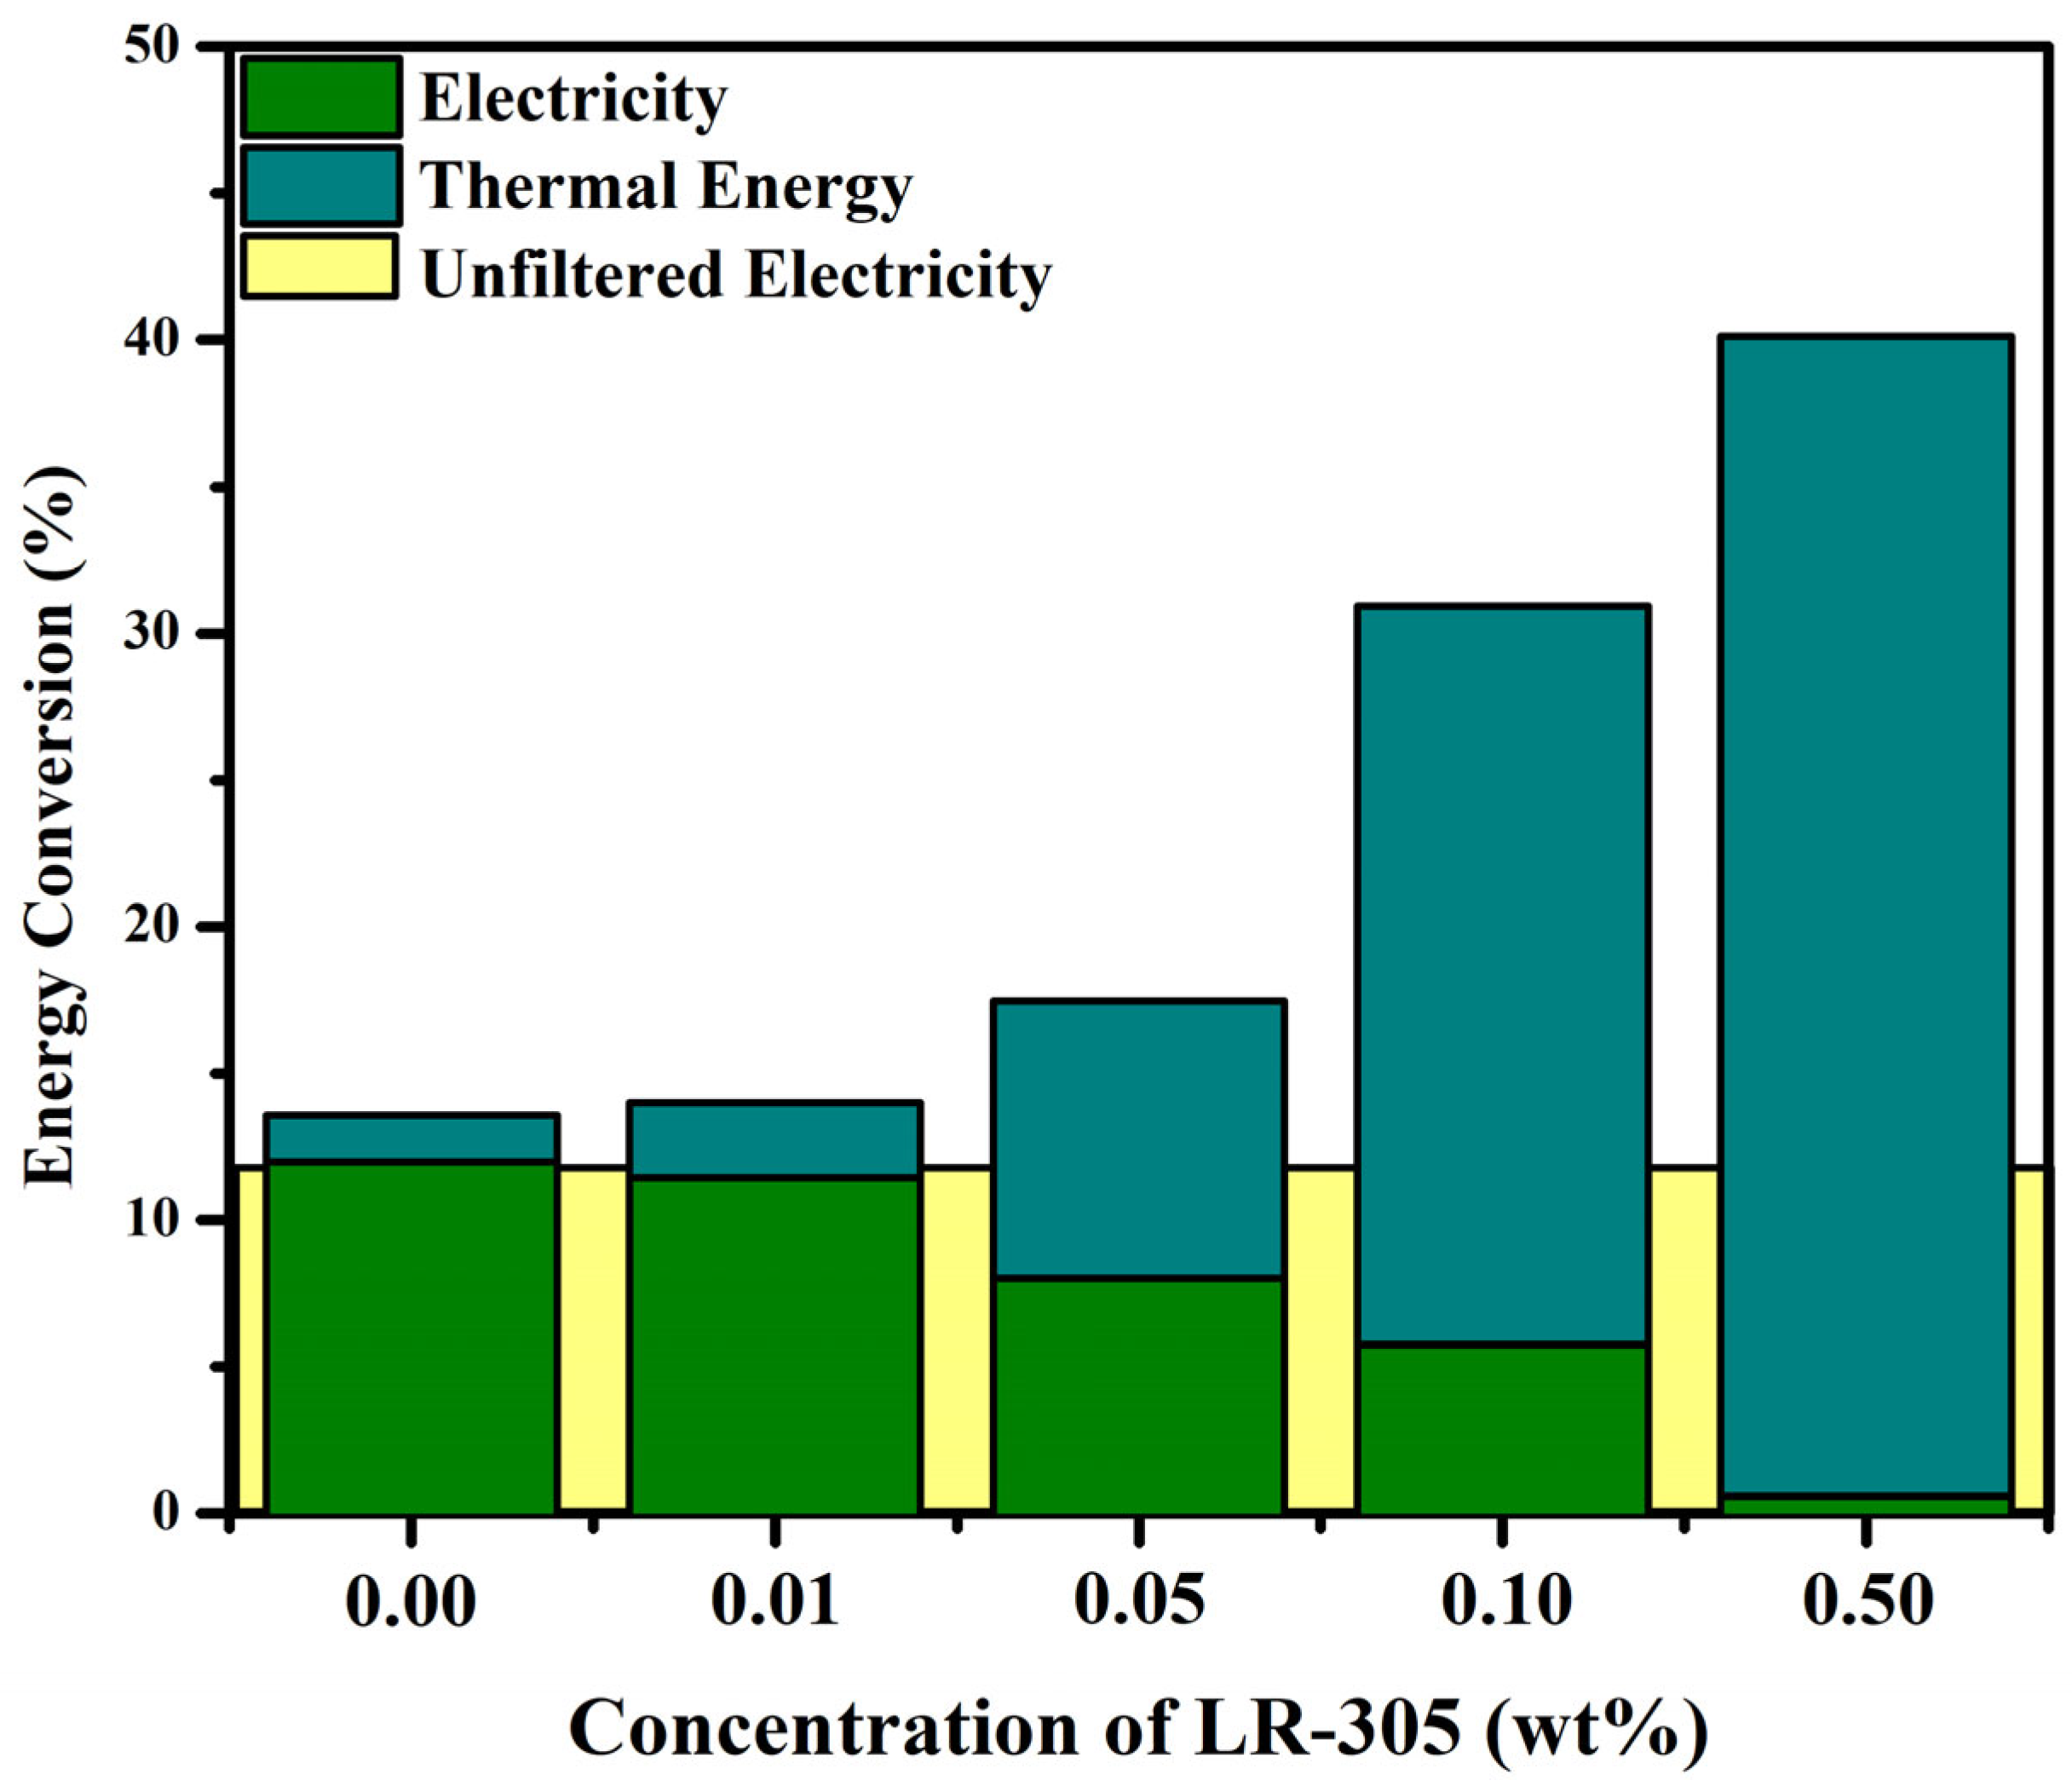
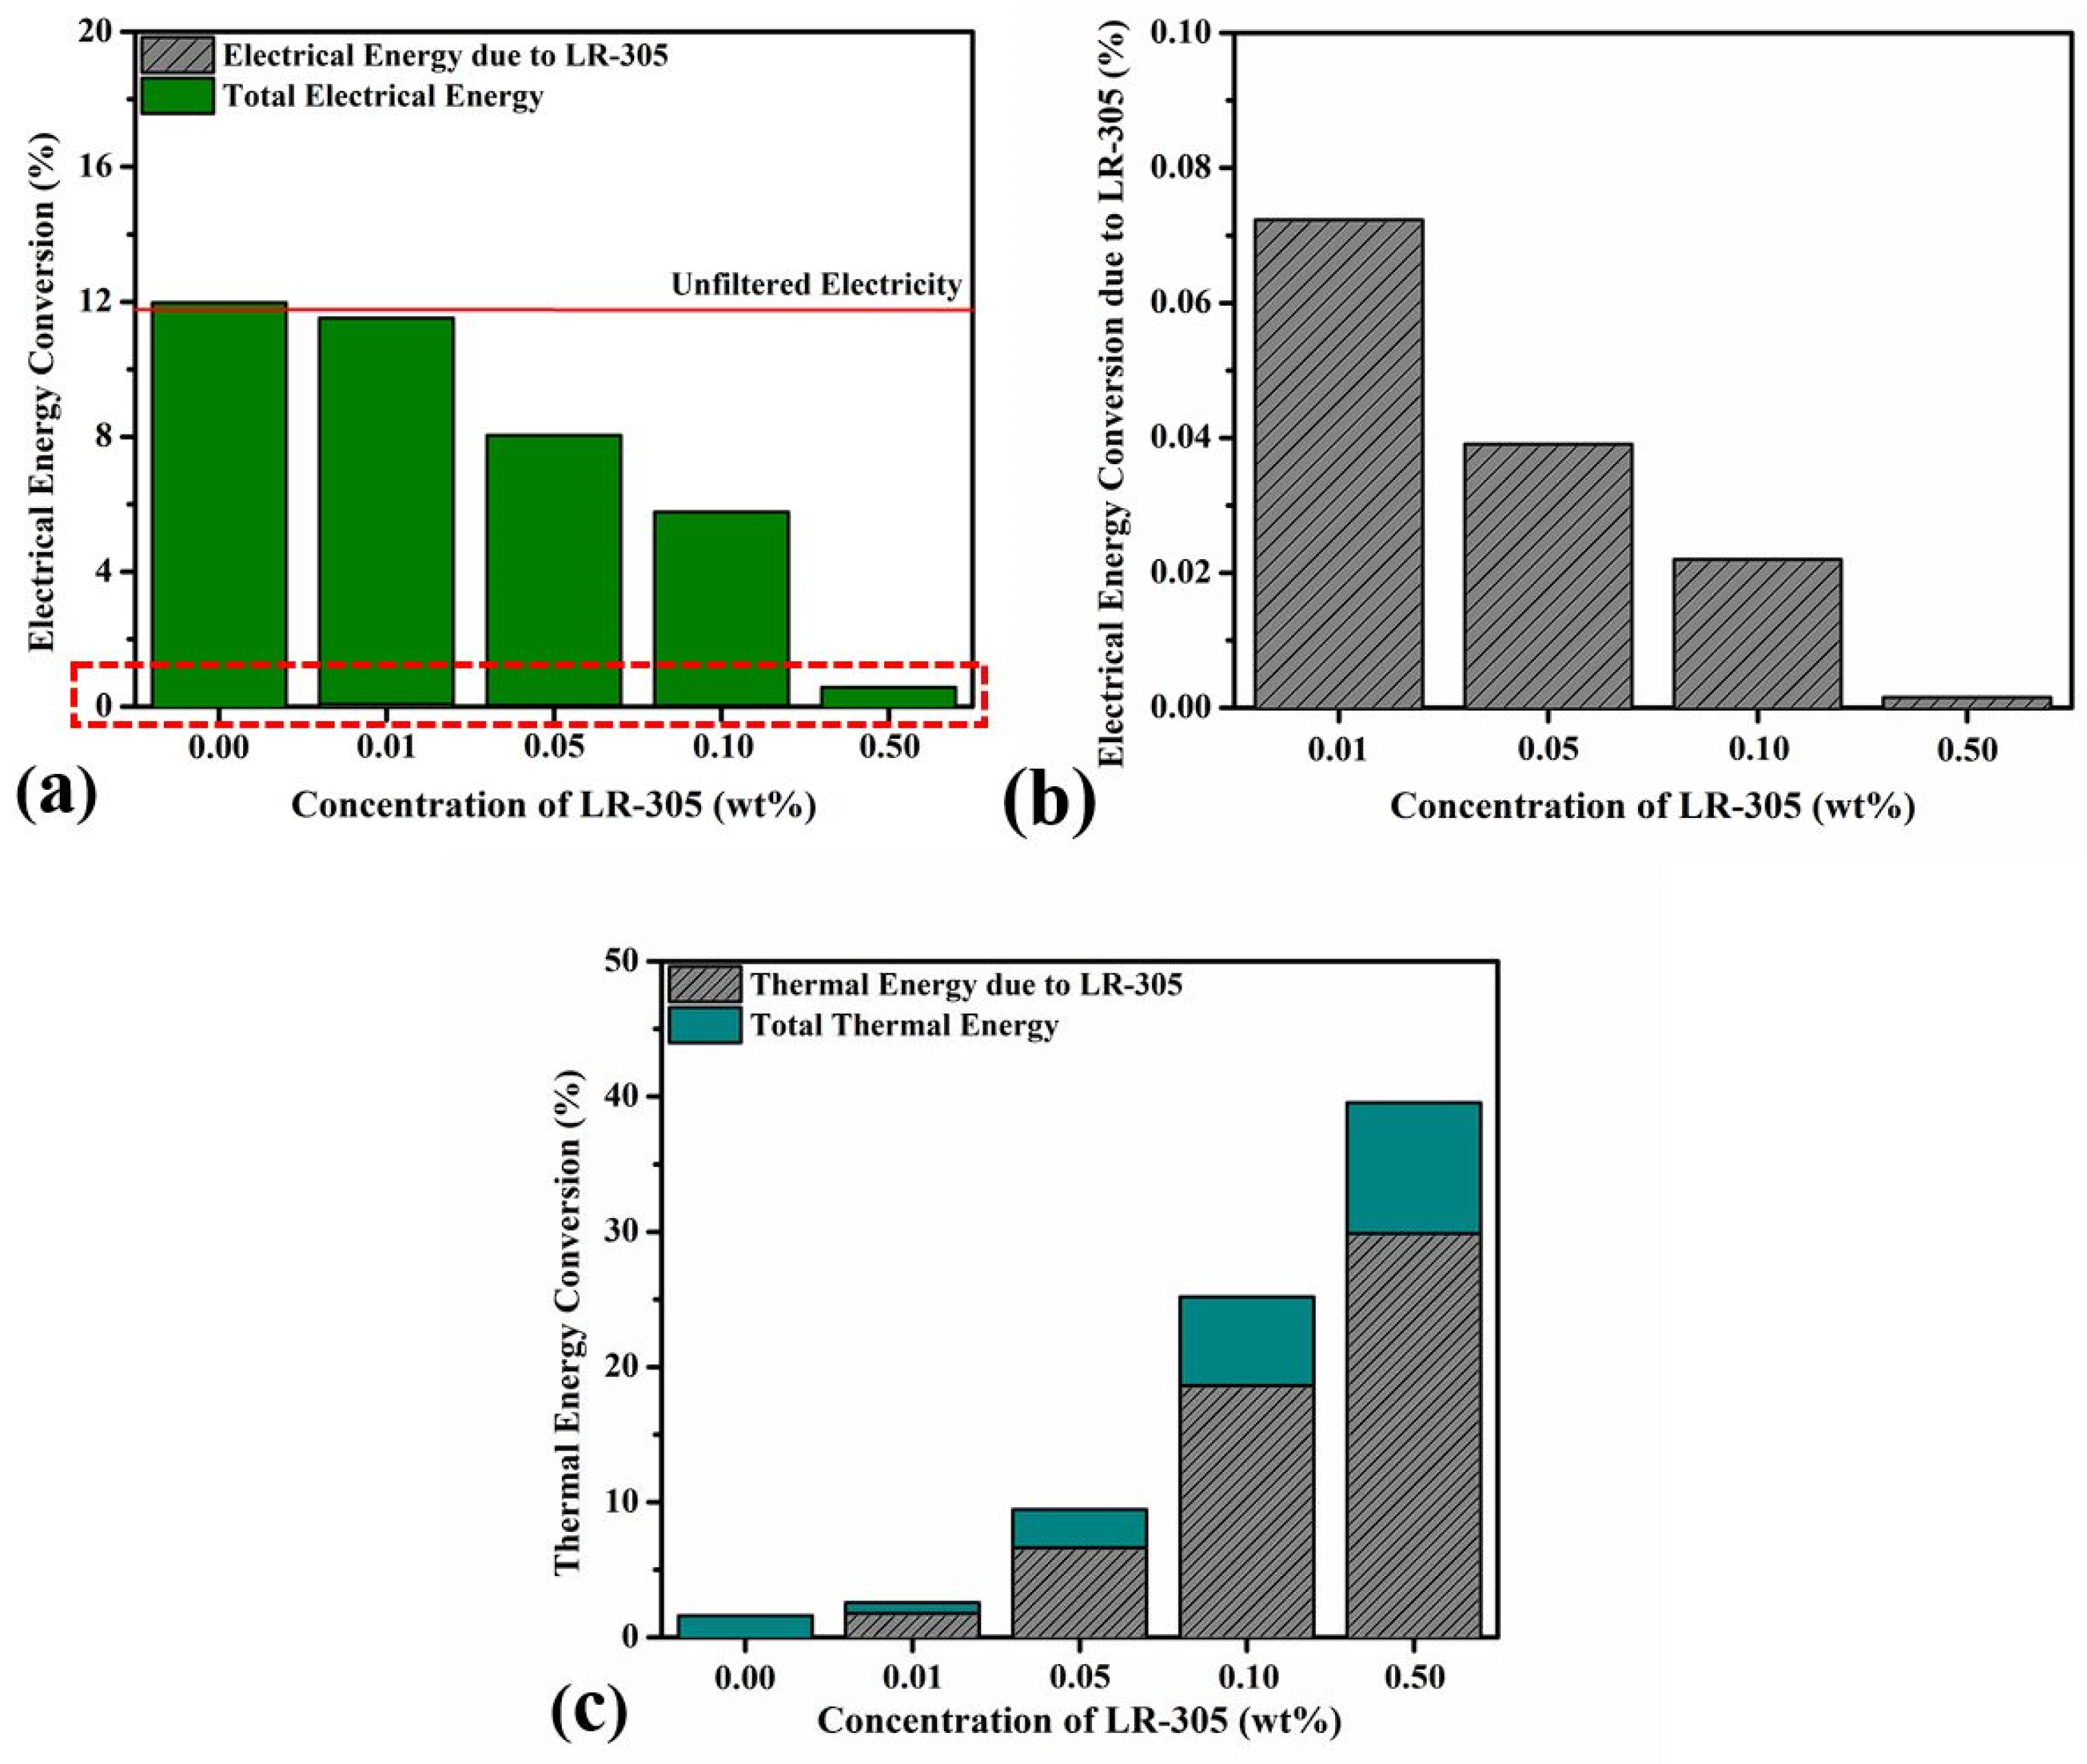
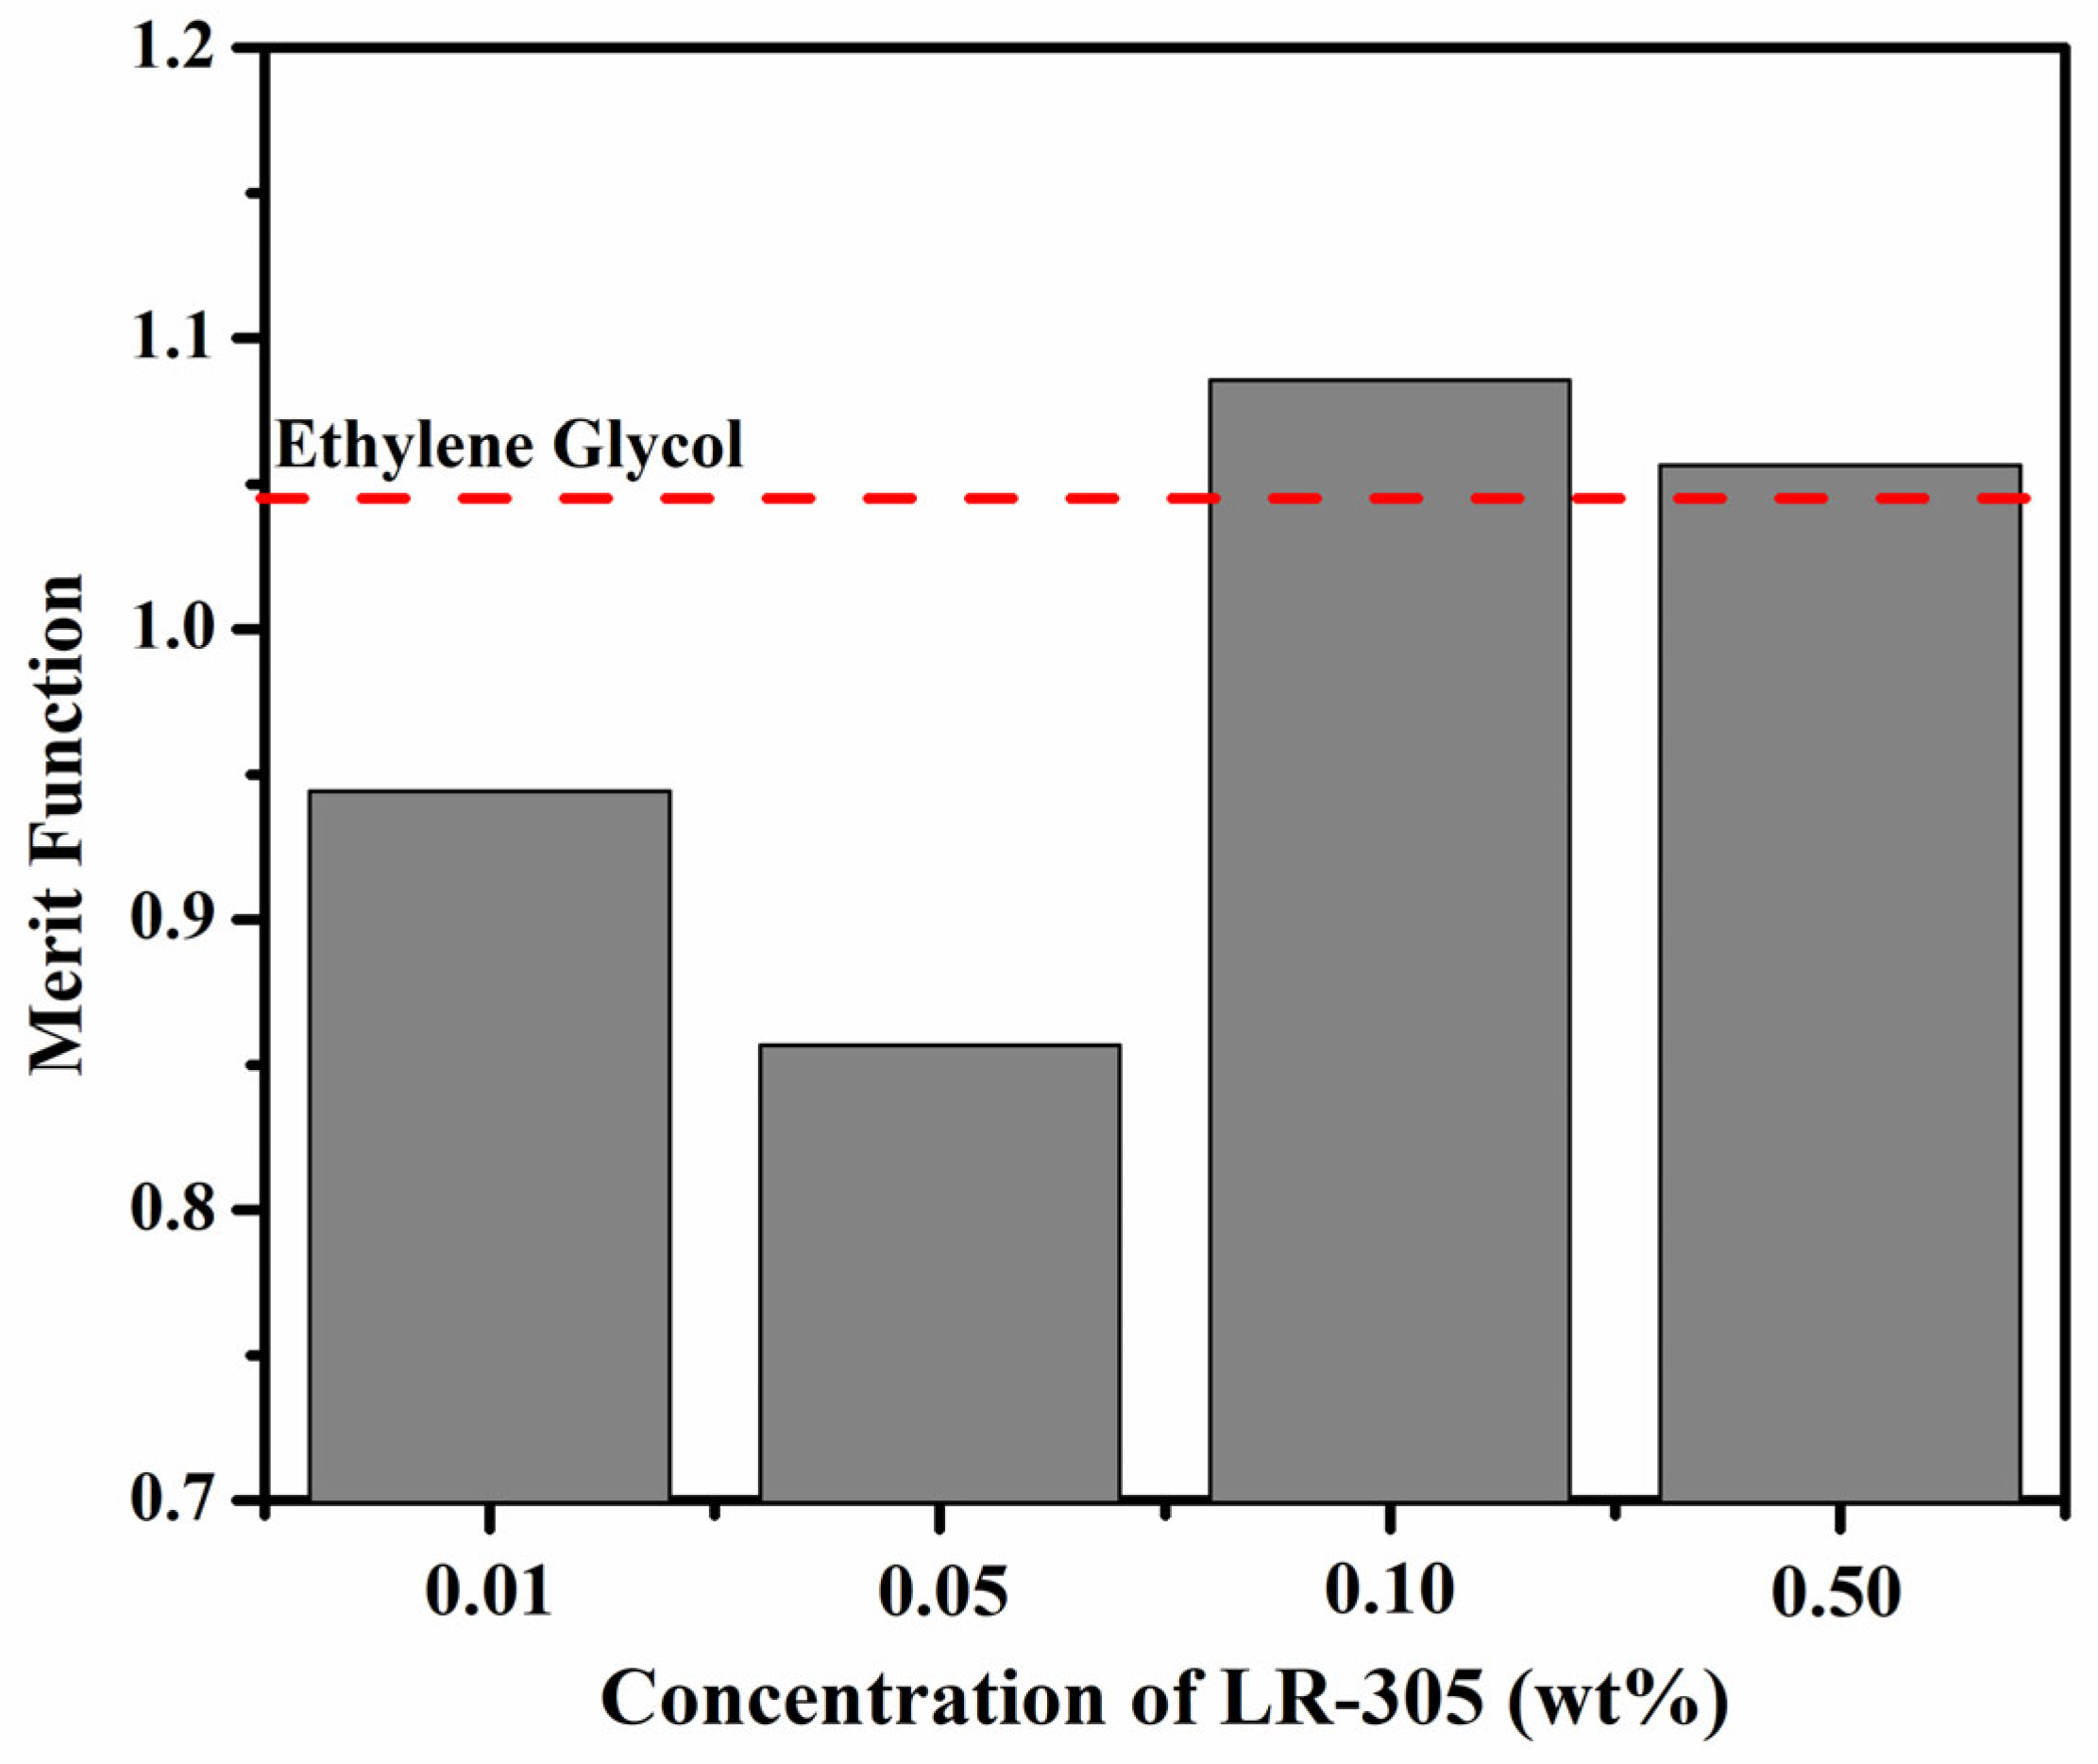
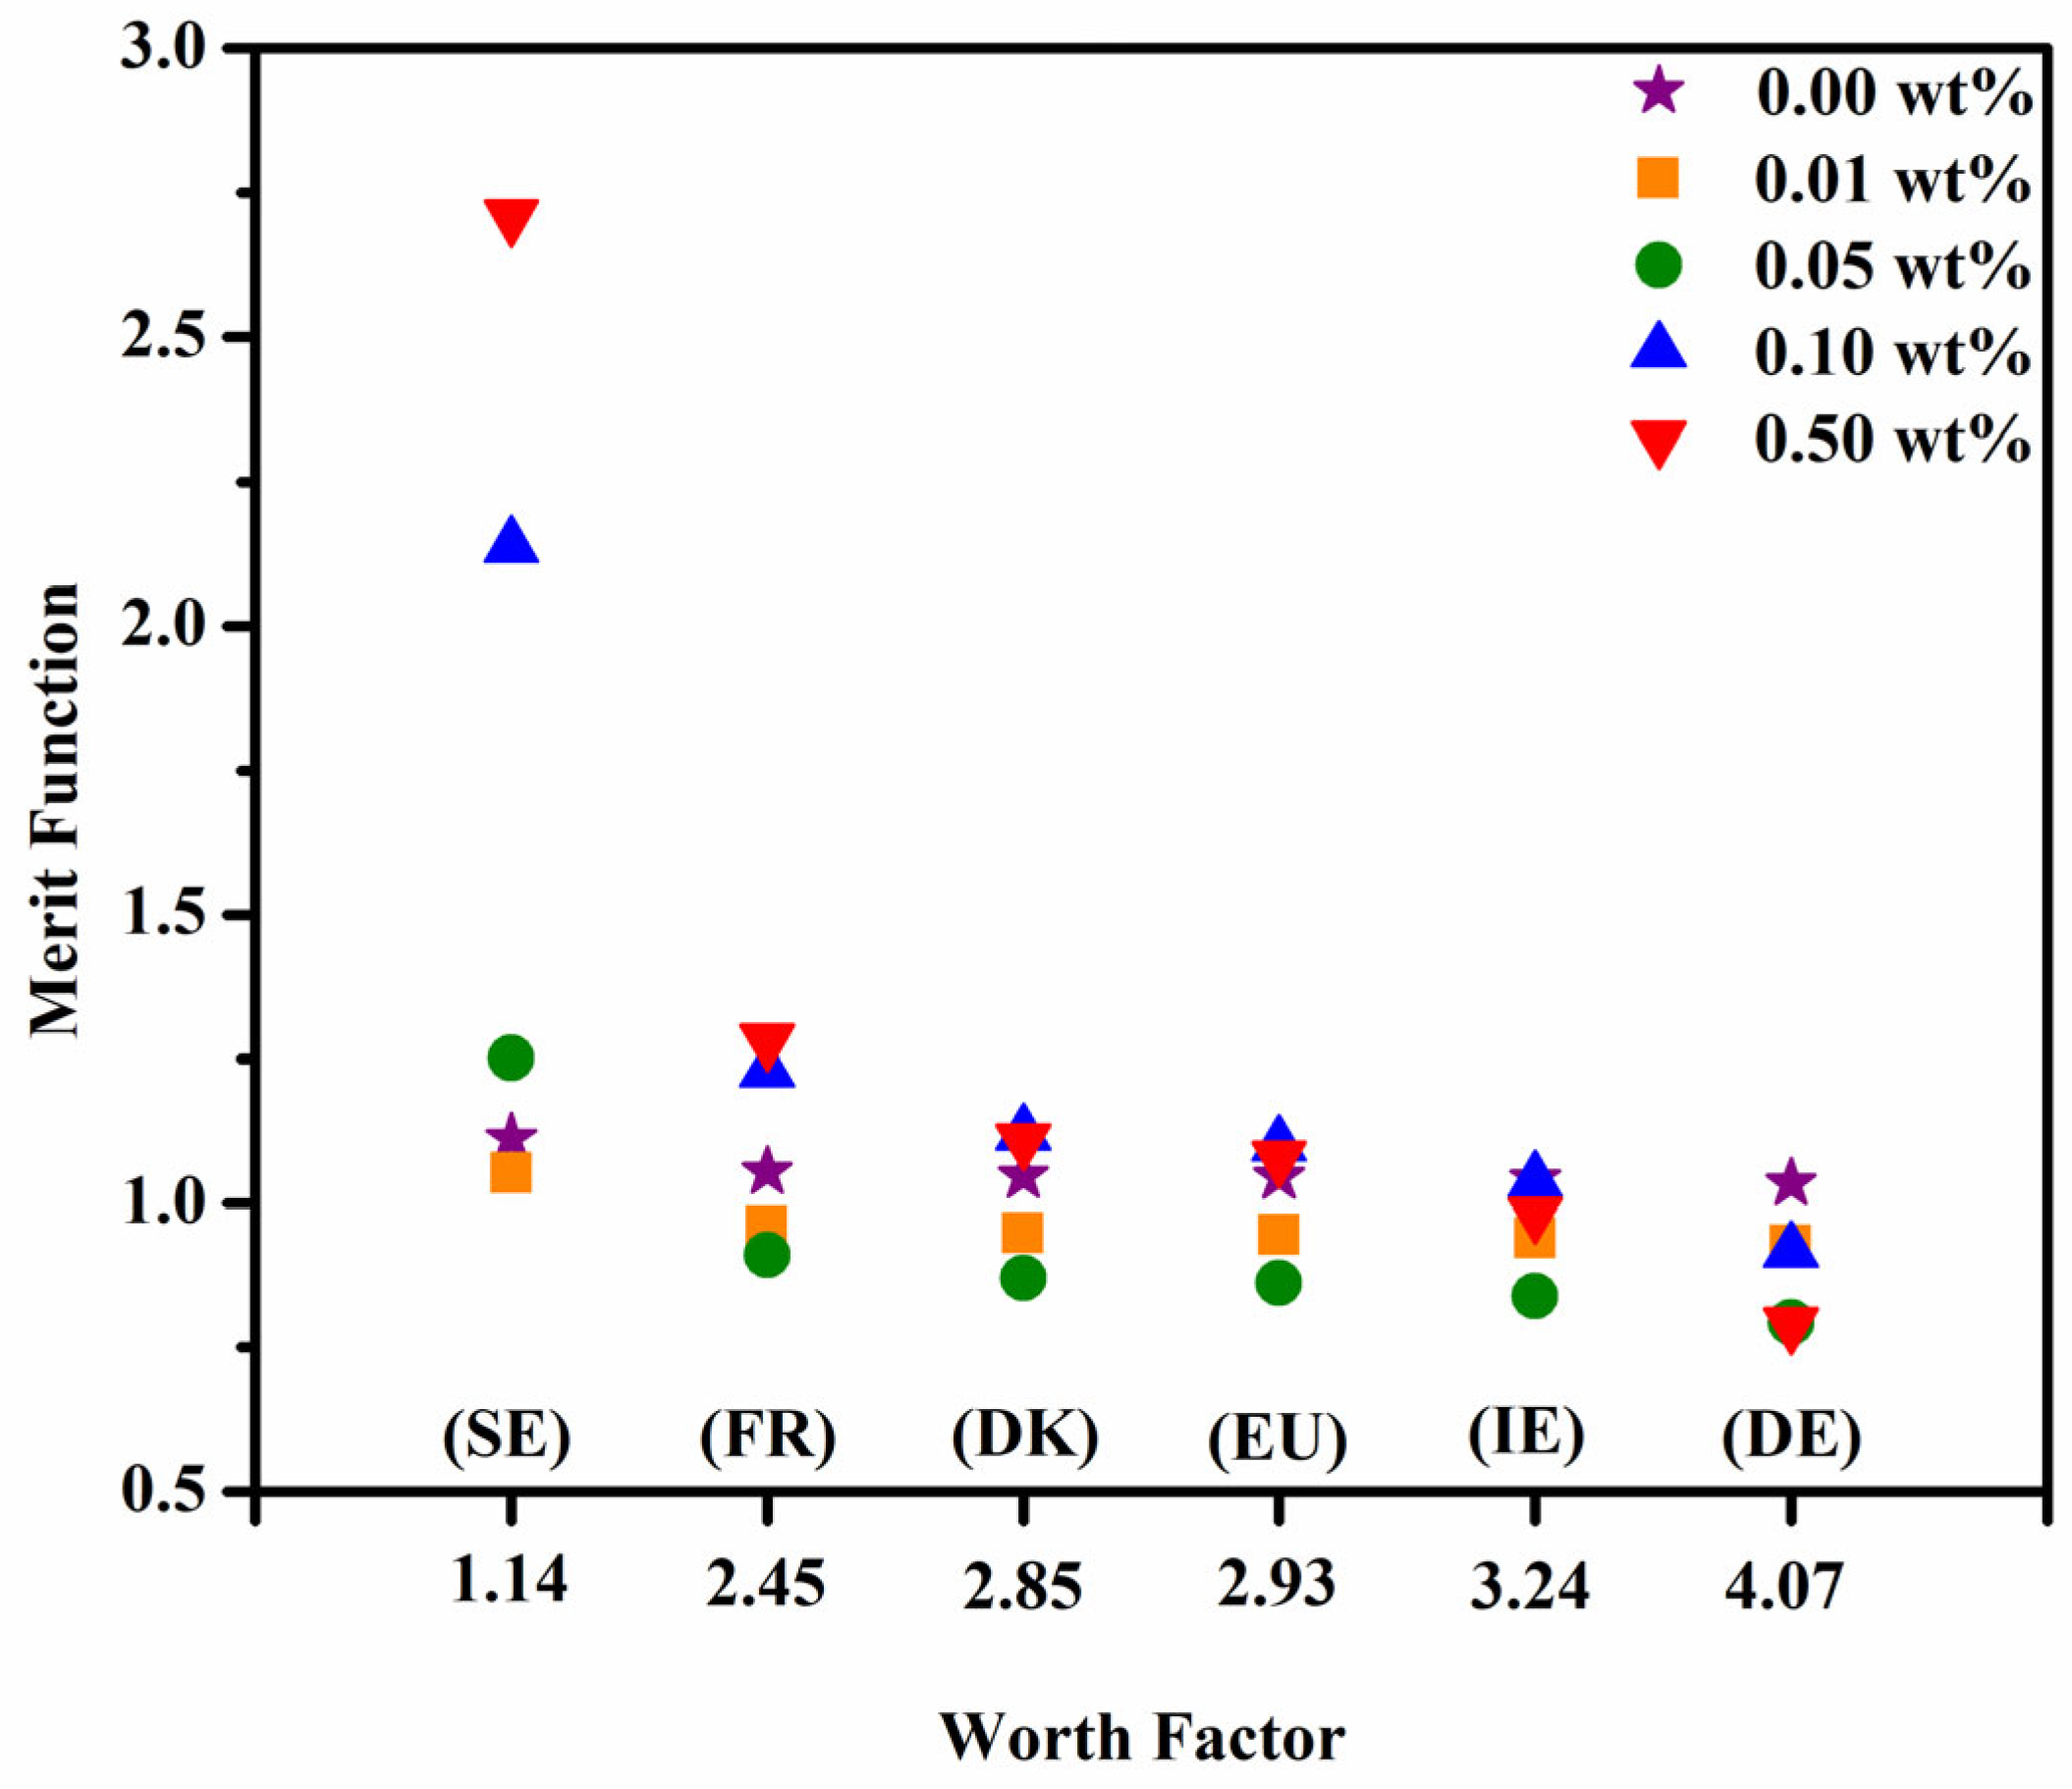
3.5. PVT Energy Conversion Efficiency and Merit Function Analysis

The functionality of the ray tracing model is used to assess the optical and electrical parameters of this combined PVT system, yet further analysis can be performed to determine the overall effectiveness of the combined thermal and electrical energy output of the system and its real-world implementation potential. A comparison of the solar energy conversion efficiency achieved by the PVT system at the various loading concentrations of LR-305 against the base fluid of pristine ethylene glycol can be seen in Figure 7.
In the absence of any working fluid, the standalone a-Si PV cell could deliver a conversion efficiency of 11.76% (Figure 7—unfiltered electricity). As specified in Materials and Methods, the energy breakdown for electrical and thermal components is provided through Equations (6) and (7), respectively, using the previously mentioned model [32,51,57,58,59]. Introducing the base fluid in front of the a-Si cell as the working fluid of the SBS-PVT system did not decrease the total energy conversion efficiency achieved. However, in the partitioning of the energy generated by the system into thermal and electrical components, there is a small decrease in the electricity generated, with the remaining energy being converted into thermal energy. In comparison, excepting for the 0.01 wt% sample, the increase in concentration of LR-305 in the working fluid led to an increase in the total energy conversion efficiency of the PVT system (Figure 7). For example, at a loading concentration of 0.50 wt% LR-305, the total conversion efficiency of the PVT system reached 40.13%. For increasing concentrations of LR-305, a reduction in electrical energy conversion can be seen, while thermal energy conversion is seen to rise. This result is expected due to the higher quantity of luminophore throughout the base fluid, resulting in lower transmission through the fluid to the PV cell (Figure 2). Indeed, this observation is further confirmed when examining the modeling data presented in Figure 8.
The proportion of the incident solar irradiance that is converted by the SBS-PVT system into electrical energy is seen to decrease, as shown in Figure 8a, as the loading concentration of LR-305 in the working fluid increases. For instance, employing the lowest concentration of LR-305 in the working fluid resulted in the PV element of the SBS-PVT system reaching a conversion efficiency of 11.44%, whereas employing the higher loading concentration of 0.50 wt% yielded a conversion efficiency of only 0.57%. It is noted that none of the configurations of the LR-305-based working fluid investigated in this study could provide a higher electrical energy conversion efficiency than that of the unfiltered standalone PV device shown in Figure 7.
The inclusion of the LR-305 luminophore resulted in a poor contribution to the electrical conversion in each scenario. The downshifting of the incident solar spectrum by LR-305 before its interaction with the a-Si PV cell was found to be responsible for only 0.07% to less than 0.01% of the electrical power generated under the filtered irradiance conditions of the working fluids—see Figure 8b. Of all of the LR-305-based working fluids that were investigated, the concentration of LR-305 that provided the highest contribution (0.07%) to the overall electrical energy conversion was the loading concentration of 0.01 wt%. A significant reduction in the electrical conversion efficiency of the a-Si cell was observed for the 0.05 wt% and the 0.10 wt% configurations of the working fluid. While the 0.05 wt% was capable of providing 0.04% of the total conversion from the luminophore, the 0.10 wt% provided only 0.02%. This effect was seen again in the largest concentration of 0.50 wt%, wherein less than 0.01% of the total conversion was due to the presence of the luminophore.
Typically, in the pursuit of increasing the combined power output of both collection systems (i.e., PT and PV), a certain percentage of the electrical conversion efficiency will be “sacrificed” to achieve the increased thermal power output of the system and, hence, a larger total conversion efficiency [59,63]. Investigating the thermal power output of the SBS-PVT system when equipped with the various configurations of the LR-305-based working fluid (Figure 8b) demonstrates this principle. For instance, as the loading concentration of LR-305 increased from 0.01 wt% to 0.50 wt% in the working fluid, the thermal power conversion efficiency of the SBS-PVT system increased from 2.59% to 39.56%, respectively. In comparison, employing pristine ethylene glycol as the working fluid in the system resulted in a thermal collection efficiency of just 1.6%.
While these values represent the total thermal energy collection efficiency of the SBS-PVT system, it is important to consider in the evaluation process the contribution made by the absorption and parasitic absorptions exhibited by LR-305 (Figure 8d). This is because, under certain economic conditions, it may be more economically favorable to produce an excess amount of thermal energy as opposed to electricity. Consequently, the parasitic absorption exhibited by LR-305 offers a potential pathway to increase the amount of solar irradiance that is absorbed by the working fluid. Thereby, there is an increased probability that the thermal collection unit of the system will perform more efficiently.
The contribution of these interactions to the thermal collection efficiency of the SBS-PVT system is provided in Figure 8b, which demonstrates that the presence of LR-305 accounted for 68.70% to 75.54% of the thermal conversion efficiency achieved by the system. Such a thermal response from the SBS-PVT system is expected due to both the decrease in the transmittance observed in Figure 2 and the increase noted in the irradiance absorbed by the working fluid in the modeling results highlighted in Figure 6c. Consequently, employing the highest loading concentration of 0.50 wt% LR-305 in the working fluid produced the largest contribution to thermal energy collection, providing 76% of the total energy collected. This implies that under this configuration, the LR-305 material was responsible for achieving a thermal conversion efficiency of 29.88%.
Given the complexity of the different interactions that can occur in an SBS-PVT system and the geographical variation that exists in the economic incentive to produce different forms (electricity or thermal energy) of energy, a merit function can be typically used to put the results presented in Figure 7 and Figure 8 in a real-world application context. However, one should remember that, based on 2022 economic data, the worth factor can vary in European countries, e.g., from Denmark (2.85) and Austria (2.93) to Ireland (3.24), Spain (3.42), or Belgium (3.60) [64,65]. The merit function value of all the working fluids considered in this investigation is provided in Figure 9 for a worth factor of 3. This compares the economic viability of the energy produced by the SBS-PVT system under each configuration of the working fluid, including pristine ethylene glycol. Fitting the a-Si PV cell into a PVT system with ethylene glycol as the working fluid is economically advantageous, as a merit function value of 1.04 was determined. Two concentrations of the LR-305 working fluid were found to exceed this merit function value. These were the 0.10 wt% and 0.50 wt% LR-305 concentrations, which produced a merit function value of 1.09 and 1.06, respectively. Contrastingly, the LR-305 concentrations of 0.01 wt% and 0.05 wt% were unable to produce a merit function value that exceeded 1.0 (Figure 9). This implies that for these loading concentrations of LR-305, the additional thermal energy captured due to the presence of the luminophore was not enough to sustain and overcome the losses encountered in the electrical energy produced by the PVT system under these conditions.

4. Discussion

An immediate observation that can be made from this study is the effect of including the LR-305 luminophore in the base fluid on the maximum temperature reached by the active PV cell. As noted, by including the lowest concentration of LR-305 at 0.01 wt%, a drastic reduction in the active cell temperature was recorded (Figure 3c). The temperature difference observed between the pristine ethylene glycol and the 0.01 wt% concentration was greater than the temperature difference between the lowest and highest (0.50 wt%) concentrations. This presents an interesting result when analyzing the transmittance that was recorded for each of the investigated materials. While the pristine ethylene glycol had a transmittance of 96.7% over the wavelength region of 300–900 nm, the lowest concentration of 0.01 wt% (Figure 2—orange square) exhibited an average transmittance of 93.2% over this same region. The inclusion of the dye in the PV cell resulted in a temperature reduction of 7.01 °C at the lowest concentration (0.01 wt%). Increasing the concentration led to larger temperature decreases, with reductions of 7.92 °C, 9.45 °C, and 12.03 °C observed at concentrations of 0.05 wt%, 0.10 wt%, and 0.50 wt%, respectively. Hence, the inclusion of LR-305 in ethylene glycol provides an immediate benefit by keeping the active PV cell in SBS-PVT applications at lower temperatures.
From the investigation of the electrical properties of the solar cell under active illumination conditions, it was found that no configuration of the LR-305-based working fluid was capable of outperforming the pristine ethylene glycol in the majority of characteristics investigated (Figure 4). This effect makes itself apparent when analyzing the energy pathways of each concentration (Figure 7 and Figure 8a), where rising concentrations result in lower electrical conversion due to the evidently lower transmission, which allows light to interact with the active solar cell (Figure 2).
Evidence suggests that the reduction in electrical properties ties with the rise in working fluid temperature, pointing to the greater absorption occurring within the PVT system. A per-photon analysis is possible in the ray tracing model to determine the absorption events that are occurring, giving a greater understanding of what is occurring within the system. This provides evidence of the events that are occurring within the system. As previously stated, the maximum concentration studied, 0.50 wt% provided the lowest recorded transmission (Figure 2—red inverted triangles) and hence would result in a large quantity of absorption to occur. The ray trace model was able to show that this concentration in fact absorbed 89.9% of the incident spectrum of AM1.5G light, which was simulated. The benefit of providing this information is the ability to provide direct evidence of the parasitic absorption that occurs within the system. This is due to the model’s ability to directly measure luminescent downshifting events (Figure 1c). Therefore, a more comprehensive overview of the processes that are occurring with the material can be performed to determine the contribution of the luminophore in the PVT system.
The inclusion of LR-305 as an active luminophore in a PVT system such as this has been shown to provide advantageous results for thermal energy generation within the system, with nearly 30% of thermal energy resulting from the inclusion of the 0.50 wt% luminophore. However, the contribution towards electrical conversion was severely lacking for the LR-305 luminophore at all concentrations. No concentration measured was capable of providing more than 0.1% of the contribution towards electrical generation. The included ray trace model outlined the poor LDS conversion rate within the system across all concentrations investigated, with evidence providing the information that only 0.6% of incident photons underwent LDS and then impinged upon the simulated cell, resulting in electrical energy conversion. While this dye has been a popular inclusion in studies related to solid layers within polymer structures, its inclusion in a PVT system to generate electrical energy is insufficient. However, the dual energy generation pathways of a PVT system enable thermal energy generation as well. This provided enthusiastic results for this luminophore, as it was capable of delivering nearly 75% of the total thermal energy generated for the 0.50 wt% configuration of the working fluid. Further investigations into other forms of luminophore will be able to provide a candidate that can generate a higher electrical conversion.
When determining the economic benefits of each material tested against the merit function of the pristine ethylene glycol, the 0.05 wt% was the poorest performing concentration tested, while the 0.10 wt% was considered the most feasible. This concentration was capable of providing a good balance between electrical and thermal energy generation, favoring the weighting assigned in the merit function calculations. This presents the opportunity for this configuration to be implemented in a region of moderate solar irradiance due to the electrical energy generated while being able to supplement the remaining energy through thermal power generation. While the highest concentration of 0.50 wt% was also shown to provide good economic benefit for its implementation, the fact that 98.6% of all energy generated was thermal limits its application in a region where electrical power production is significantly more economically incentivized than thermal power.
The merit function calculations shown in Figure 9 are produced in isolation within the model and thus do not account for implementing these devices in a particular country. The vulnerability of the worth factor to geographic and economic changes in the interaction between the abundant availability of electrical and thermal energy could enable a strategic choice of locations suitable for implementing a full-scale PVT system. To close the gap between theoretical and isolated laboratory-based research and suggest possible solutions suitable for practical implementation, a merit function study [32,51,59,66,67] was performed. By applying this simulation to real-world scenarios, the study aims to offer valuable insights into selecting optimal sites for PVT installation based primarily on the location’s energy market and the country’s merit function for electrical and thermal energy generation.
As the value of the worth factor decreases, the economic advantage of capturing additional energy through adjustments in the spectral properties of the fluids becomes even more pronounced. In an attempt to determine a location around Europe where the various concentrations of LR-305 would be economically viable in this configuration, the work function for various countries was used as an input to the model (Figure 10). From this analysis, countries that would be seen as favorable to implement a LR-305-equipped SBS-PVT system can include Sweden (1.14), France (2.45), and Denmark (2.85) since these countries see a rise in the merit function value across all loading concentrations [64,65]. Employment of this system using the average values available within the EU shows an increase in merit function values for each of the concentrations used over the original model results. As mentioned previously in this study, both the 0.10 wt% and 0.50 wt% offered a larger merit function value than that achieved with the base fluid, which was calculated at 1.05, while the 0.10 wt% and 0.50 wt% were 1.10 and 1.08, respectively.
As shown in this study previously (Figure 9), the 0.05 wt% showed the poorest result in terms of merit function, highlighting its economic infeasibility. However, when applying the results of this material to different countries, it can be seen that it could offer some economic advantages. For example, when analyzing this concentration for Sweden, one can observe that this concentration was capable of outperforming the ethylene glycol, offering a merit function value of 1.25 compared to 1.11 for the ethylene glycol. This concentration also exhibited a larger merit function than that of ethylene glycol when compared against Bulgaria’s cost of energy. For Bulgaria (1.41), the 0.50 wt% saw a merit function of 1.12, while ethylene glycol produced a merit function of 1.09. For countries such as Ireland and Germany, the quantity of electrical and thermal energy output proves to be uneconomical, with all concentrations producing a merit function less than ethylene glycol.
Hence, an important aspect of analyzing the economic potential of PVT systems lies in implementing their electrical and thermal energy generation potentials in energy markets. This shows not only the economic feasibility of a system, but due to the inclusion of the information provided relating to the luminophore, a case study for that luminophore concentration can be undertaken for a specific nation to determine the ideal configuration of such a system.

5. Conclusions

In this study, a popular commercial-based luminescent organic dye (BASF Lumogen F Red 305) was incorporated into a working fluid consisting of pristine ethylene glycol as a candidate for PVT applications. Optical and electrical characteristics were assessed as a function of the PV’s temperature in response to direct illumination from a solar simulator’s irradiance. Throughout the entire study, the temperature of both the working fluid and the solar cell was measured at intervals of 1 s for 100 min to assess the influence of the doped working fluid on cooling the active PV cell. The presence of the luminescent dye across all concentrations was capable of reducing the maximum temperature experienced by the PV cell, with the smallest concentration of the luminophore reducing the maximum temperature of the active cell by ~10 °C when compared to the pristine ethylene glycol. Thus, signifying the impact of the luminophore on cooling the working solar cell. The inclusion of the luminophore at its largest studied concentration of 0.50 wt% led to a reduction in maximum temperature of ~19 °C compared to the base fluid.
Analyzing the electrical characteristics of the active solar cell revealed various reductions in certain parameters when the luminophore was included in the base fluid. Increasing concentrations of the luminophore were found to result in lowered electrical conversion efficiencies due to the low transmission observed for these materials. However, all concentrations of the LR-305 produced higher fill factors than the bare a-Si PV cell throughout the illumination period of 100 min.
The benefit of a hybrid PVT system lies in being able to convert solar energy into thermal and electrical energy at the same time. By implementing the ray tracing model (which is capable of producing a per-photon analysis), it was possible to examine the behavior of the included commercial luminophore at varying concentrations. The inclusion of the model allows for quantification of the energy that is transmitted to the solar cell to produce electricity while also monitoring the absorption of photons within the system, which produces the thermal energy observed in the experimental characterization of the PVT system. The model allows for accurate implementation of luminophores at varying concentrations and determines the luminescent downshifting events. This allows for the analysis of determining the contribution of energy generation by the luminophore at a specific concentration. The inclusion of LR-305 as a luminophore in a PVT system demonstrates its significant advantage in thermal energy generation, contributing to nearly 30% of the total thermal energy with a 0.50 wt% concentration. However, the electrical conversion capability of LR-305 is found to be severely limited, providing less than 0.1% contribution at all concentrations. The low LDS conversion rate and photon absorption in the simulated PV cell further confirm the inefficiency of LR-305 in electrical energy conversion. Future investigations should explore alternative luminophores to achieve higher electrical conversion efficiency in PVT systems.
While this study was able to determine the quantity of energy derived from electrical and thermal sources, it was also able to determine the economic benefit of that concentration. An economical trade-off can be possible due to the large quantity of thermal energy that could be extracted. Yet, by performing an economic assessment of the PVT systems produced and comparing them to the worth factors of various E.U. countries, their economic application can be determined. These findings show that while the 0.05 wt% concentration of LR-305 can prove uneconomical for regions such as Ireland and Germany, a location such as Sweden would benefit from it.

Supplementary Materials

The following supporting information can be downloaded at: https://www.mdpi.com/article/10.3390/en16176294/s1, Figure S1. The absorption (blue squares) and emission (orange circles) profiles of Lumogen Red 305 (LR-305) were compared to the standard AM1.5G spectrum, which was used in the ray trace model. Figure S2. Outline of the Panda data frame libraries, which are used to monitor the lifecycle of photons throughout the simulation and sort the location of their data. Figure S3. Percentage of photons that underwent LDS (λfinal > λinitial) within the working fluid during the simulation and were emitted back to their source.

Author Contributions

Conceptualization, K.C., J.W. and G.A.; methodology, K.C., J.W. and G.A.; software, K.C.; validation, K.C., J.W. and G.A.; formal analysis, K.C.; investigation, K.C.; resources, J.D., S.J.M. and G.A.; writing—original draft preparation, K.C., J.W., J.D., S.J.M. and G.A.; writing—review and editing, K.C., J.W. and G.A.; supervision, J.D., S.J.M. and G.A.; project administration, G.A.; funding acquisition, J.D. and G.A. All authors have read and agreed to the published version of the manuscript.

Funding

This research was funded by the European Space Agency, grant number 400013471, and the TU Dublin Scholarship program.

Data Availability Statement

Data will be made available on request.

Acknowledgments

The authors would like to acknowledge the funding bodies (the European Space Agency and the TU Dublin Fellowship program) for the financial support.

Conflicts of Interest

The authors declare no conflict of interest. The funders had no role in the design of the study; in the collection, analyses, or interpretation of data; in the writing of the manuscript; or in the decision to publish the results.

References

  1. Kapilan, N.; Nithin, K.C.; Chiranth, K.N. Challenges and Opportunities in Solar Photovoltaic System. Mater. Today Proc. 2022, 62, 3538–3543. [Google Scholar] [CrossRef]
  2. Shamim, M.M.H.; Silmee, S.M.; Sikder, M.M.; Shamim, M.M.H.; Silmee, S.M.; Sikder, M.M. Optimization and Cost-Benefit Analysis of a Grid-Connected Solar Photovoltaic System. AIMS Energy 2022, 10, 434–457. [Google Scholar] [CrossRef]
  3. Tawalbeh, M.; Al-Othman, A.; Kafiah, F.; Abdelsalam, E.; Almomani, F.; Alkasrawi, M. Environmental Impacts of Solar Photovoltaic Systems: A Critical Review of Recent Progress and Future Outlook. Sci. Total Environ. 2021, 759, 143528. [Google Scholar] [CrossRef]
  4. IEA. Solar. Available online: https://www.iea.org/energy-system/renewables/solar-pv (accessed on 16 July 2023).
  5. Wydra, K.; Vollmer, V.; Busch, C.; Prichta, S.; Wydra, K.; Vollmer, V.; Busch, C.; Prichta, S. Agrivoltaic: Solar Radiation for Clean Energy and Sustainable Agriculture with Positive Impact on Nature. In Solar Radiation—Enabling Technologies, Recent Innovations, and Advancements for Energy Transition; IntechOpen: London, UK, 2023. [Google Scholar] [CrossRef]
  6. Radziemska, E. The Effect of Temperature on the Power Drop in Crystalline Silicon Solar Cells. Renew. Energy 2003, 28, 1–12. [Google Scholar] [CrossRef]
  7. Divitini, G.; Cacovich, S.; Matteocci, F.; Cinà, L.; Di Carlo, A.; Ducati, C. In Situ Observation of Heat-Induced Degradation of Perovskite Solar Cells. Nat. Energy 2016, 1, 15012. [Google Scholar] [CrossRef]
  8. Kumar, K.; Sharma, S.D.; Jain, L.; Al Khaimah, R. Standalone Photovoltaic (PV) Module Outdoor Testing Facility for UAE Climate; CSEM-UAE Innovation Centre LLC: Dubai, United Arab Emirates, 2007. [Google Scholar]
  9. Haidar, Z.A.; Orfi, J.; Kaneesamkandi, Z. Experimental Investigation of Evaporative Cooling for Enhancing Photovoltaic Panels Efficiency. Results Phys. 2018, 11, 690–697. [Google Scholar] [CrossRef]
  10. Kherici, Z.; Kahoul, N.; Cheghib, H.; Younes, M.; Chekal Affari, B. Main Degradation Mechanisms of Silicon Solar Cells in Algerian Desert Climates. Sol. Energy 2021, 224, 279–284. [Google Scholar] [CrossRef]
  11. Sato, D.; Yamada, N. Review of Photovoltaic Module Cooling Methods and Performance Evaluation of the Radiative Cooling Method. Renew. Sustain. Energy Rev. 2019, 104, 151–166. [Google Scholar] [CrossRef]
  12. Park, N.C.; Oh, W.W.; Kim, D.H. Effect of Temperature and Humidity on the Degradation Rate of Multicrystalline Silicon Photovoltaic Module. Int. J. Photoenergy 2013, 2013, 925280. [Google Scholar] [CrossRef]
  13. Kaplani, E. Detection of Degradation Effects in Field-Aged c-Si Solar Cells through IR Thermography and Digital Image Processing. Int. J. Photoenergy 2012, 2012, 396792. [Google Scholar] [CrossRef]
  14. Kokul, S.R.; Bhowmik, S. Recycling of Crystalline Silicon Photovoltaic Solar Panel Waste to Modified Composite Products. Prog. Rubber Plast. Recycl. Technol. 2021, 37, 327–339. [Google Scholar] [CrossRef]
  15. Wang, X.; Tian, X.; Chen, X.; Ren, L.; Geng, C. A Review of End-of-Life Crystalline Silicon Solar Photovoltaic Panel Recycling Technology. Sol. Energy Mater. Sol. Cells 2022, 248, 111976. [Google Scholar] [CrossRef]
  16. Tao, M.; Fthenakis, V.; Ebin, B.; Steenari, B.M.; Butler, E.; Sinha, P.; Corkish, R.; Wambach, K.; Simon, E.S. Major Challenges and Opportunities in Silicon Solar Module Recycling. Prog. Photovolt. Res. Appl. 2020, 28, 1077–1088. [Google Scholar] [CrossRef]
  17. Guo, J.; Liu, X.; Yu, J.; Xu, C.; Wu, Y.; Pan, D.; Senthil, R.A. An Overview of the Comprehensive Utilization of Silicon-Based Solid Waste Related to PV Industry. Resour. Conserv. Recycl. 2021, 169, 105450. [Google Scholar] [CrossRef]
  18. Kwak, J.-I.; Nam, S.H.; Kim, L.; An, Y.J. Potential Environmental Risk of Solar Cells: Current Knowledge and Future Challenges. J. Hazard. Mater. 2020, 392, 122297. [Google Scholar] [CrossRef]
  19. Venkatachary, S.K.; Samikannu, R.; Murugesan, S.; Dasari, N.R.; Subramaniyam, R.U. Economics and Impact of Recycling Solar Waste Materials on the Environment and Health Care. Environ. Technol. Innov. 2020, 20, 10113. [Google Scholar] [CrossRef]
  20. Lunardi, M.M.; Alvarez-Gaitan, J.P.; Bilbao, J.I.; Corkish, R. Comparative Life Cycle Assessment of End-of-Life Silicon Solar Photovoltaic Modules. Appl. Sci. 2018, 8, 1396. [Google Scholar] [CrossRef]
  21. Cuce, E.; Bali, T.; Sekucoglu, S.A. Effects of Passive Cooling on Performance of Silicon Photovoltaic Cells. Int. J. Low-Carbon Technol. 2011, 6, 299–308. [Google Scholar] [CrossRef]
  22. Perrakis, G.; Tasolamprou, A.C.; Kenanakis, G.; Economou, E.N.; Tzortzakis, S.; Kafesaki, M. Submicron Organic-Inorganic Hybrid Radiative Cooling Coatings for Stable, Ultrathin, and Lightweight Solar Cells. ACS Photonics 2022, 9, 1327–1337. [Google Scholar] [CrossRef]
  23. Yang, X.; Yan, K.; Kang, Z.; Tan, X.; Qi, G.; Tu, Y. Antireflection and Radiative Cooling Difunctional Coating Design for Silicon Solar Cells. Opt. Express 2023, 31, 22296–22307. [Google Scholar] [CrossRef]
  24. Hirose, F.; Kubota, S.; Ahmmad, B. Optical Design of Multilayer Antireflection Coatings for Indoor Solar Cell Applications. Appl. Opt. 2023, 62, 2117–2123. [Google Scholar] [CrossRef]
  25. Walshe, J.; Girtan, M.; McCormack, S.; Doran, J.; Amarandei, G. Combined Experimental and Modeling Analysis for the Development of Optical Materials Suitable to Enhance the Implementation of Plasmonic-Enhanced Luminescent Down-Shifting Solutions on Existing Silicon-Based Photovoltaic Devices. ACS Appl. Electron. Mater. 2021, 3, 2512–2525. [Google Scholar] [CrossRef]
  26. Walshe, J.; Girtan, M.; McCormack, S.; Doran, J.; Amarandei, G. Exploring the Development of Nanocomposite Encapsulation Solutions for Enhancing the Efficiency of PV Systems Using Optical Modelling. Opt. Mater. 2021, 111, 110654. [Google Scholar] [CrossRef]
  27. Cazzaniga, R.; Rosa-Clot, M.; Rosa-Clot, P.; Tina, G.M. Floating Tracking Cooling Concentrating (FTCC) Systems. In Proceedings of the 2012 38th IEEE Photovoltaic Specialists Conference, Austin, TX, USA, 3–8 June 2012; pp. 514–519. [Google Scholar] [CrossRef]
  28. Calise, F.; Dentice d’Accadia, M.; Palombo, A.; Vanoli, L. Dynamic Simulation of a Novel High-Temperature Solar Trigeneration System Based on Concentrating Photovoltaic/Thermal Collectors. Energy 2013, 61, 72–86. [Google Scholar] [CrossRef]
  29. Fudholi, A.; Sopian, K.; Yazdi, M.H.; Ruslan, M.H.; Ibrahim, A.; Kazem, H.A. Performance Analysis of Photovoltaic Thermal (PVT) Water Collectors. Energy Convers. Manag. 2014, 78, 641–651. [Google Scholar] [CrossRef]
  30. Joshi, S.S.; Dhoble, A.S. Photovoltaic -Thermal Systems (PVT): Technology Review and Future Trends. Renew. Sustain. Energy Rev. 2018, 92, 848–882. [Google Scholar] [CrossRef]
  31. Zondag, H.A.; de Vries, D.W.; van Helden, W.G.J.; van Zolingen, R.J.C.; van Steenhoven, A.A. The Yield of Different Combined PV-Thermal Collector Designs. Sol. Energy 2003, 74, 253–269. [Google Scholar] [CrossRef]
  32. Walshe, J.; Carron, P.M.; McCormack, S.; Doran, J.; Amarandei, G. Organic Luminescent Down-Shifting Liquid Beam Splitters for Hybrid Photovoltaic-Thermal (PVT) Applications. Sol. Energy Mater. Sol. Cells 2021, 219, 110818. [Google Scholar] [CrossRef]
  33. Sharma, M.K.; Bhattacharya, J. Dependence of Spectral Factor on Angle of Incidence for Monocrystalline Silicon Based Photovoltaic Solar Panel. Renew. Energy 2022, 184, 820–829. [Google Scholar] [CrossRef]
  34. Fernández-Solas, Á.; Micheli, L.; Almonacid, F.; Fernández, E.F. Optical Degradation Impact on the Spectral Performance of Photovoltaic Technology. Renew. Sustain. Energy Rev. 2021, 141, 110782. [Google Scholar] [CrossRef]
  35. Singh, A.; Umakanth, V.; Tyagi, N.; Baghel, A.K.; Kumar, S. Comparative Study of Commercial Crystalline Solar Cells. Results Opt. 2023, 11, 100379. [Google Scholar] [CrossRef]
  36. Li, Y.; Lin, H.; Zeng, J.; Chen, J.; Chen, H. Enhance Short-Wavelength Response of CIGS Solar Cell by CdSe Quantum Disks as Luminescent down-Shifting Material. Sol. Energy 2019, 193, 303–308. [Google Scholar] [CrossRef]
  37. Klampaftis, E.; Ross, D.; McIntosh, K.R.; Richards, B.S. Enhancing the Performance of Solar Cells via Luminescent Down-Shifting of the Incident Spectrum: A Review. Sol. Energy Mater. Sol. Cells 2009, 93, 1182–1194. [Google Scholar] [CrossRef]
  38. Sanguineti, A.; Sassi, M.; Turrisi, R.; Ruffo, R.; Vaccaro, G.; Meinardi, F.; Beverina, L. High Stokes Shift Perylene Dyes for Luminescent Solar Concentrators. Chem. Commun. 2013, 49, 1618–1620. [Google Scholar] [CrossRef] [PubMed]
  39. Debije, M.G.; Verbunt, P.P.C.; Nadkarni, P.J.; Velate, S.; Bhaumik, K.; Nedumbamana, S.; Rowan, B.C.; Richards, B.S.; Hoeks, T.L. Promising Fluorescent Dye for Solar Energy Conversion Based on a Perylene Perinone. Appl. Opt. 2011, 50, 163–169. [Google Scholar] [CrossRef]
  40. Li, Y.; Olsen, J.; Nunez-Ortega, K.; Dong, W.J. A Structurally Modified Perylene Dye for Efficient Luminescent Solar Concentrators. Sol. Energy 2016, 136, 668–674. [Google Scholar] [CrossRef]
  41. Jo, K.; Hong, S.; Kim, H.J. Optical Properties of EVA Films Including V570 for Transparent Luminescent Solar Concentrator. Appl. Sci. Converg. Technol. 2020, 29, 14–18. [Google Scholar] [CrossRef]
  42. Ahmed, H.; Doran, J.; McCormack, S.J. External Quantum Efficiency Measurements and Outdoor Characterisation for PV Luminescent Downshifting Devices. In Renewable Energy and Sustainable Buildings. Innovative Renewable Energy; Springer International Publishing: Cham, Switzerland, 2020; pp. 727–733. [Google Scholar] [CrossRef]
  43. Mojiri, A.; Taylor, R.; Thomsen, E.; Rosengarten, G. Spectral Beam Splitting for Efficient Conversion of Solar Energy—A Review. Renew. Sustain. Energy Rev. 2013, 28, 654–663. [Google Scholar] [CrossRef]
  44. Ni, J.; Li, J.; An, W.; Zhu, T. Performance Analysis of Nanofluid-Based Spectral Splitting PV/T System in Combined Heating and Power Application. Appl. Therm. Eng. 2018, 129, 1160–1170. [Google Scholar] [CrossRef]
  45. Vivar, M.; Everett, V. A Review of Optical and Thermal Transfer Fluids Used for Optical Adaptation or Beam-Splitting in Concentrating Solar Systems. Prog. Photovolt. Res. Appl. 2014, 22, 612–633. [Google Scholar] [CrossRef]
  46. Tiwari, G.N.; Gaur, A. Photovoltaic Thermal (PVT) Systems and Its Applications. In Proceedings of the 2014 2nd International Conference on Green Energy and Technology (ICGET 2014), Dhaka, Bangladesh, 5–6 September 2014; pp. 132–138. [Google Scholar] [CrossRef]
  47. Proell, M.; Karrer, H.; Brabec, C.J.; Hauer, A. The Influence of CPC Reflectors on the Electrical Incidence Angle Modifier of C-Si Cells in a PVT Hybrid Collector. Sol. Energy 2016, 126, 220–230. [Google Scholar] [CrossRef]
  48. Joshi, S.S.; Dhoble, A.S.; Jiwanapurkar, P.R. Investigations of Different Liquid Based Spectrum Beam Splitters for Combined Solar Photovoltaic Thermal Systems. J. Sol. Energy Eng. 2016, 138, 021003. [Google Scholar] [CrossRef]
  49. Wang, G.; Wang, B.; Yuan, X.; Lin, J.; Chen, Z. Novel Design and Analysis of a Solar PVT System Using LFR Concentrator and Nano-Fluids Optical Filter. Case Stud. Therm. Eng. 2021, 27, 101328. [Google Scholar] [CrossRef]
  50. Chemisana, D.; Fernandez, E.F.; Riverola, A.; Moreno, A. Fluid-Based Spectrally Selective Filters for Direct Immersed PVT Solar Systems in Building Applications. Renew. Energy 2018, 123, 263–272. [Google Scholar] [CrossRef]
  51. Coldrick, K.; Walshe, J.; Doran, J.; Amarandei, G. Evaluation of the Photon Contributions to the Solar Energy Conversion for Organic Luminescent Down-Shifting Liquid Beam Splitters in Hybrid Photovoltaic-Thermal (PVT) Applications Using Raytracing Monte Carlo Simulations. Sol. Energy Mater. Sol. Cells 2023, 254, 112201. [Google Scholar] [CrossRef]
  52. Kang, H. Crystalline Silicon vs. Amorphous Silicon: The Significance of Structural Differences in Photovoltaic Applications. IOP Conf. Ser. Earth Environ. Sci. 2021, 726, 012001. [Google Scholar] [CrossRef]
  53. GitHub. Danieljfarrell/Pvtrace: Optical Ray Tracing for Luminescent Materials and Spectral Converter Photovoltaic Devices. Available online: https://github.com/danieljfarrell/pvtrace (accessed on 16 July 2023).
  54. Slooff, L.H.; Bakker, N.J.; Sommeling, P.M.; Büchtemann, A.; Wedel, A.; Van Sark, W.G.J.H.M. Long-Term Optical Stability of Fluorescent Solar Concentrator Plates. Phys. Status Solidi A 2014, 211, 1150–1154. [Google Scholar] [CrossRef]
  55. Grandes, J.; Illarramendi, M.A.; Arrospide, E.; Bikandi, I.; Aramburu, I.; Guarrotxena, N.; García, O.; Zubia, J. Temperature Effects on the Emission of Polymer Optical Fibers Doped with Lumogen Dyes. Opt. Fiber Technol. 2022, 72, 102980. [Google Scholar] [CrossRef]
  56. De La Gree, G.D.; Papadopoulos, A.; Debije, M.; Cox, M.; Krumer, Z.; Reinders, A.; Rosemann, A. A New Design for Luminescent Solar Concentrating PV Roof Tiles. In Proceedings of the 2015 IEEE 42nd Photovoltaic Specialist Conference (PVSC 2015), New Orleans, LA, USA, 14–19 June 2015. [Google Scholar] [CrossRef]
  57. Hashemian, M.; Jafarmadar, S.; Khalilarya, S.; Faraji, M. Energy Harvesting Feasibility from Photovoltaic/Thermal (PV/T) Hybrid System with Ag/Cr2O3-Glycerol Nanofluid Optical Filter. Renew. Energy 2022, 198, 426–439. [Google Scholar] [CrossRef]
  58. Han, X.; Sun, Y.; Huang, J.; Zheng, J. Design and Analysis of a CPV/T Solar Receiver with Volumetric Absorption Combined Spectral Splitter. Int. J. Energy Res. 2020, 44, 4837–4850. [Google Scholar] [CrossRef]
  59. Han, X.; Chen, X.; Wang, Q.; Alelyani, S.M.; Qu, J. Investigation of CoSO4-Based Ag Nanofluids as Spectral Beam Splitters for Hybrid PV/T Applications. Sol. Energy 2019, 177, 387–394. [Google Scholar] [CrossRef]
  60. Buffa, M.; Carturan, S.; Debije, M.G.; Quaranta, A.; Maggioni, G. Dye-Doped Polysiloxane Rubbers for Luminescent Solar Concentrator Systems. Sol. Energy Mater. Sol. Cells 2012, 103, 114–118. [Google Scholar] [CrossRef]
  61. Carbone, I.A.; Frawley, K.R.; McCann, M.K. Flexible, Front-Facing Luminescent Solar Concentrators Fabricated from Lumogen f Red 305 and Polydimethylsiloxane. Int. J. Photoenergy 2019, 2019, 8680931. [Google Scholar] [CrossRef]
  62. Krumer, Z.; van Sark, W.G.J.H.M.; Schropp, R.E.I.; de Mello Donegá, C. Compensation of Self-Absorption Losses in Luminescent Solar Concentrators by Increasing Luminophore Concentration. Sol. Energy Mater. Sol. Cells 2017, 167, 133–139. [Google Scholar] [CrossRef]
  63. Xiao, Y.; Bao, Y.; Yu, L.; Zheng, X.; Qin, G.; Chen, M.; He, M. Ultra-Stable Carbon Quantum Dot Nanofluids as Excellent Spectral Beam Splitters in PV/T Applications. Energy 2023, 273, 127159. [Google Scholar] [CrossRef]
  64. Natural Gas Price Statistics—Statistics Explained. Available online: https://ec.europa.eu/eurostat/statistics-explained/index.php?title=Natural_gas_price_statistics (accessed on 16 July 2023).
  65. Electricity Price Statistics—Statistics Explained. Available online: https://ec.europa.eu/eurostat/statistics-explained/index.php?title=Electricity_price_statistics (accessed on 16 July 2023).
  66. Walshe, J.; Doran, J.; Amarandei, G. Evaluation of the Potential of Nanofluids Containing Different Ag Nanoparticle Size Distributions for Enhanced Solar Energy Conversion in Hybrid Photovoltaic-Thermal (PVT) Applications. Nano Express 2022, 3, 015001. [Google Scholar] [CrossRef]
  67. Han, X.; Zhao, X.; Huang, J.; Qu, J. Optical Properties Optimization of Plasmonic Nanofluid to Enhance the Performance of Spectral Splitting Photovoltaic/Thermal Systems. Renew. Energy 2022, 188, 573–587. [Google Scholar] [CrossRef]
Figure 1. (a) Schematic overview of the PVT experimental setup. An AM1.5G Spectrum is generated by a solar simulator, and it falls onto the sample holder, which contains a quartz cuvette with the liquid sample and the small amorphous silicon PV cell. IV curves are acquired using an Ossila source meter, while the temperatures are measured with thermocouples connected to the Picolog data collector. The temperature of the fluid is gathered from within the liquid sample but not in the pathway of the solar simulator incident light, while the temperature of the PV cell is gathered from the back of the PV. (b) Simulated AM1.5G spectrum in gray with the spectral response of amorphous silicon PV in blue. (c) Schematic representation of the four primary events that can be analyzed using the PVTrace model. The simulated experimental data is designed in such a configuration that the generated photons are at normal incidence on the liquid optical filter and on the surface of the amorphous silicon PV cell.
Energies 16 06294 g001
Figure 2. Optical transmittance of the various loading concentrations of the Lumogen F Red 305, with the pristine ethylene glycol denoted by 0.00 wt%.
Energies 16 06294 g002
Figure 3. The temperature recorded for (a) the a-Si PV cell and (b) the working fluid. The temperature was allowed to reach its plateau to ensure that the maximum temperature for the PV cell and the working fluid was accurately determined. (c) A summary of the maximum temperature recorded for the PV cell and the fluid for each loading concentration of the fluid is presented. (d) The rate of change per second of the temperatures recorded from (a,b) over the first 15 min of the study.
Energies 16 06294 g003
Figure 4. Over the course of the investigation, various electrical characteristics of the illuminated solar cell were evaluated at 5-min intervals. The (a) typical IV characteristics (here presented at room temperature) allow determination of (b) the open circuit voltage, (c) the short circuit current density, (d) the maximum power, and (e) the fill factor of the cell. Voltage uncertainty of ±10 mV and current uncertainty of ±10 nA.
Energies 16 06294 g004
Figure 5. The experimentally determined (black dashes) and the computational model-generated (red stars) Jsc values.
Energies 16 06294 g005
Figure 6. Optical output results of the ray trace model. The (a) transmission spectra of the various configurations of the LR-305 ethylene glycol-based working fluid, which interacted with the top surface of the a-Si PV cell and was available for conversion into electrical power. (b) The integrated irradiance of photons that underwent luminescent downshifting within the system before impinging the top surface of the a-Si PV cell. (c) the spectra of photons that underwent all forms of absorption within the PVT system (both absorption and parasitic absorption). These photons represent the total quantity of photons available for thermal energy generation within the PVT system. (d) the integrated irradiance of photons that underwent both luminescent downshifting and subsequent absorption within the system, i.e., “parasitic absorption”.
Energies 16 06294 g006
Figure 7. The percentage of solar energy conversion for the PVT system for each concentration of Lumogen F Red 305. The conversion allowed by the base fluid (here, ethylene glycol) is also included. The energy generated as electrical (green) and thermal (cyan) energy, along with the electricity produced by the unfiltered standalone PV system (yellow), are also presented.
Energies 16 06294 g007
Figure 8. Energy conversion for electrical and thermal energy generation pathways. The (a) electrical energy conversion for all luminophore concentrations is highlighted in green, with the unfiltered electricity provided as a comparison. The (b) luminophores’ small contribution to electrical energy generation is provided by further investigating the red region in (a). Finally, the (c) thermal energy conversion is shown for all luminophore concentrations.
Energies 16 06294 g008
Figure 9. Merit function values for each of the luminophore concentrations that were dispersed throughout the working fluid. Each concentration is compared to the base fluid of ethylene glycol (red dashed line).
Energies 16 06294 g009
Figure 10. Merit function of the PVT system examined according to the average worth factor derived from the European (EU) region. Specific countries within the EU are shown as a means of analyzing the potential of implementing such a system with varying concentrations of luminophore within that region. Such countries include Sweden (SE), France (FR), Denmark (DE), Ireland (IE), and Germany (DE).
Energies 16 06294 g010
Disclaimer/Publisher’s Note: The statements, opinions and data contained in all publications are solely those of the individual author(s) and contributor(s) and not of MDPI and/or the editor(s). MDPI and/or the editor(s) disclaim responsibility for any injury to people or property resulting from any ideas, methods, instructions or products referred to in the content.

