1. Introduction
The prediction of Earth’s global average temperature increase of 1.5 °C over the next two decades could escalate many climate-related risks and endanger ecosystems and human populations [
1]. To prevent this development, the European Green Deal aims to reduce greenhouse gas emissions by at least 55% by 2030 and achieve climate neutrality by 2050 [
2]. Some studies have indicated that a significant percentage of greenhouse gas (GHG) emissions, ranging from 60% to 70%, can be attributed to everyday lifestyle [
3]. To meet the EU’s targets, it is vital that citizens are aware of the greenhouse gas emissions they produce, the daily activities that contribute to them, and the alternative options to reduce them. The concept of carbon footprint is commonly used to understand these factors and the effects of climate change [
4].
Several studies have shown that carbon footprint calculators (CFCs) have gained popularity as valuable tools for raising citizen awareness regarding climate change and mitigation measures [
5,
6]. These calculators function as effective tools for educating people about the impacts of their daily habits on greenhouse gas (GHG) emissions. Studies have highlighted that users who are new to carbon footprint calculators were able to develop an understanding and appreciation for information related to carbon emissions [
7]. Thus, they could possibly play a role in educating and inspiring individuals to make positive lifestyle changes, specifically by utilising pledges, which empower people to recognise the potential impact they can have in reducing their carbon footprint [
8]. They could also be used in discussing and evaluating alternative practices in policy-making procedures.
It can be argued that there is a growing interest in the literature regarding carbon footprint calculators. Mulrow et al. (2018) mention that there are numerous online carbon footprint calculators categorised into three groups: Government, Non-profit/charitable, and private [
4]. Salo’s study examines the features of Nordic calculators [
5]. Additionally, Burgui-Burgui presents their carbon footprint calculator, the CO
2web observatory [
9]. These calculators commonly focus on sectors such as Energy, Transportation, Air Transportation, and Food. However, certain aspects like waste management (recycling, composting) and water consumption remain understudied. Most of the calculators are developed for citizens to calculate their household footprint. Therefore, these tools are targeted at a citizen science concept, in which citizens are sharing data related to their daily activities.
As Bonney et al. (2016) mentioned, projects that use citizen science to collect data are well-established scientific practices [
10]. Citizen science has gained significant traction in recent years, especially in the fields of environmental science and ecology [
11]. The active engagement of citizens in scientific activities plays a crucial role in facilitating the collection of valuable data, which can effectively address notable gaps in knowledge [
12]. As Armstrong concludes in their research, citizen science platforms not only enable the measurement of perceptions but also have the potential to shape citizen behaviour. This aspect is of significant importance, especially when considering policy interventions to achieve climate change goals and enhance public health [
13].
Within this context, the citizen science initiative called COMPAIR is developing a new carbon footprint calculator. This project is funded by the European Union’s Horizon 2020 and is active in five pilot cities (Athens, Berlin, Flanders, and Sofia & Plovdiv). Its objective is to assist citizens, even those lacking scientific or technical expertise, to use ICTs for gathering air quality data and collaborating with stakeholders to endorse local policies and social transformations that will enhance the air quality in their local regions/neighbourhoods. The COMPAIR community aims to openly share its findings, data, and methodologies, providing other groups worldwide with the opportunity to gain insights from this project and create their own local air quality experiments [
14].
The current waste management practice in some of COMPAIR’s pilot cities requires the attention of policymakers. Greece and Bulgaria still dispose of the majority of their municipal solid waste in landfills [
15]. As Pierini mentioned in his study, citizen awareness and involvement play a crucial role in programs regarding waste management. The collaboration of citizens and scientists in such initiatives is a productive strategy in order to enhance citizen knowledge and engagement [
16]. Also, a study by Astrup et al. raised concerns about the consistency of different LCA modelling approaches and their designed framework, especially on waste management strategies, such as recovery and recycling. The main explanation is that waste management LCA studies often measure the environmental advantages of a recycling technology by looking at the amount of waste materials it processes. However, these studies might overlook the detailed composition, properties, and the presence of valuable resources in those waste materials [
17]. Therefore, one of the significant advantages of the presented calculator is the proper integration of recycling, composting, and energy recovery into the carbon footprint derived from waste management. There are several other European projects collaborating with COMPAIR, such as AURORA, PSLifeStyle, I-CHANGE, and ECF4CLIM, currently developing carbon footprint calculators, each with a distinct focus on the categories influencing CO
2 emissions and different geographical scope. This highlights the importance of these tools in achieving the European Green Deal’s goal of net zero emissions by 2050, encouraging citizens to change their behaviour to a more environmentally friendly one.
As it was briefly mentioned before, in the framework of the COMPAIR project, the Department of Environment and the Department of Information and Communication Systems Engineering of the University of the Aegean are developing a Carbon Footprint Simulation Dashboard. This interactive tool aims to help citizens understand the impact of their daily actions with regard to released CO2 and compare how modifying these actions, such as using washing machines during the day or night, carsharing or cycling, and replacing appliances with efficient ones, can affect future CO2 emissions. The goal is to guide user behaviours towards environmentally friendly choices—evidence-based such as carpooling, waste reduction, and maximising recycling.
As mentioned in Salo's study with respect to the opportunities and limitations of carbon footprint calculators, the existing research lacks comprehensive insights into the most effective approaches for promoting and encouraging sustainable household consumption. This knowledge gap refers to communication strategies, assessment tools, such as calculators, and the importance of considering the social and cultural aspects that shape everyday routines and practices [
5]. The proposed Carbon Footprint Simulation Dashboard aims to bridge this gap by offering comprehensive recommendations targeted at each pilot city for reducing one’s carbon footprint in various daily routines. It goes beyond simple suggestions by providing analytical information for each recommendation and practical guidelines on how to implement them effectively. In addition, unlike many other calculators, it provides the option of a profile page that empowers users with the capability to maintain a record of their carbon footprint history. This feature allows them to track and compare their previous results, enabling them to assess whether their habits have improved over time. Also, it presents a new methodology for calculating carbon footprint indicators that include the proper integration of waste management. This aspect will aid citizens in decreasing their daily waste and in comprehending the significance of a circular economy. Furthermore, the dashboard also presents potential government actions that users may consider accepting, which can become valuable insights for government bodies and policymakers in shaping effective climate policies.
By taking into account the existing literature and the developed calculators, this study focuses on introducing the following novel aspects. The unique and novel points of this dashboard are primarily two. The first one is that this Carbon Footprint Simulation Dashboard will also capture citizens’ opinions on which actions they are willing to undertake to achieve policy targets. This feature distinguishes the proposed tool from existing carbon footprint dashboards. The other novel aspect of the calculator is the proper integration of recycling, composting, and energy recovery—under the circular economy approach—into the carbon footprint derived from waste management. Therefore, the scope of this study is to present a new methodology for calculating carbon footprint indicators that include the proper integration of waste management. Also, to show how using Carbon Footprint Simulation Dashboard can encourage behavioural changes and support individuals in making more responsible decisions regarding their consumption habits. The focus of this paper is on the scope of the environmental research and does not include the IT development of the tool, which will be presented in an upcoming study.
In conclusion, this paper is organised as follows.
Section 2 presents the methodology used in this study. It describes the pilot’s requirements considered for the Carbon Footprint Simulation Dashboard, as well as the domains of the carbon footprint calculator and the necessary data from these domains to calculate CO
2 emissions.
Section 3 provides the results of the CO
2 calculations for each domain. Additionally, it introduces the Carbon Footprint Simulation Dashboard and its two components: the Carbon Footprint Calculator and the Scenario Simulation Dashboard. Two scenarios regarding waste management will be analysed using the calculator to demonstrate the proper integration of waste management in the footprint. Finally, the conclusions are presented in
Section 4.
2. Materials and Methods
The development of the proposed Carbon Footprint Simulation Dashboard was based on reviewing existing calculators and the available literature on related tools [
4,
8,
18]. More than 20 online calculators were examined. Effective approaches from prior studies were taken into consideration, as well as the research gaps. Several studies have emphasised the absence of established standards for programming carbon footprint calculators, as well as the lack of a defined methodology to ensure consistent outcomes [
18,
19]. As it is mentioned in the study by Burgui-Burgui, making comparisons between life cycle assessments (LCAs) can be challenging due to the variations in methods and national conditions employed in different studies. In addition, although Carbon Footprint Calculators are effective in measuring the emissions resulting from a user’s consumption habits, they have limitations when it comes to providing specific information on alternative choices [
9]. LCA works in a relative framework that does not represent the citizen’s choices. It is an impact tool for holistic scheduling and accounting for global flows of materials, but it does not account for citizens’ behaviour. One characteristic example is that recycled flows in LCA have a negative footprint, i.e., more disposed of items for recycling equal a larger negative footprint, and this does not reflect the individual consumer behaviour and impact of a citizen. Therefore, in this research, the methodology of carbon balances has been used.
Table 1 presents the pilot’s requirements that were taken into account during the design phase before the development of the Carbon Footprint Simulation Dashboard.
To fulfil the pilot’s requirements, the Carbon Footprint Simulation Dashboard includes two tools:
Carbon Footprint Calculator is designed to help citizens realise how their carbon footprint is affected through their daily actions and to give recommendations on ways to reduce their footprint. The Scenario Simulation Dashboard will help citizens to take part in policymaking.
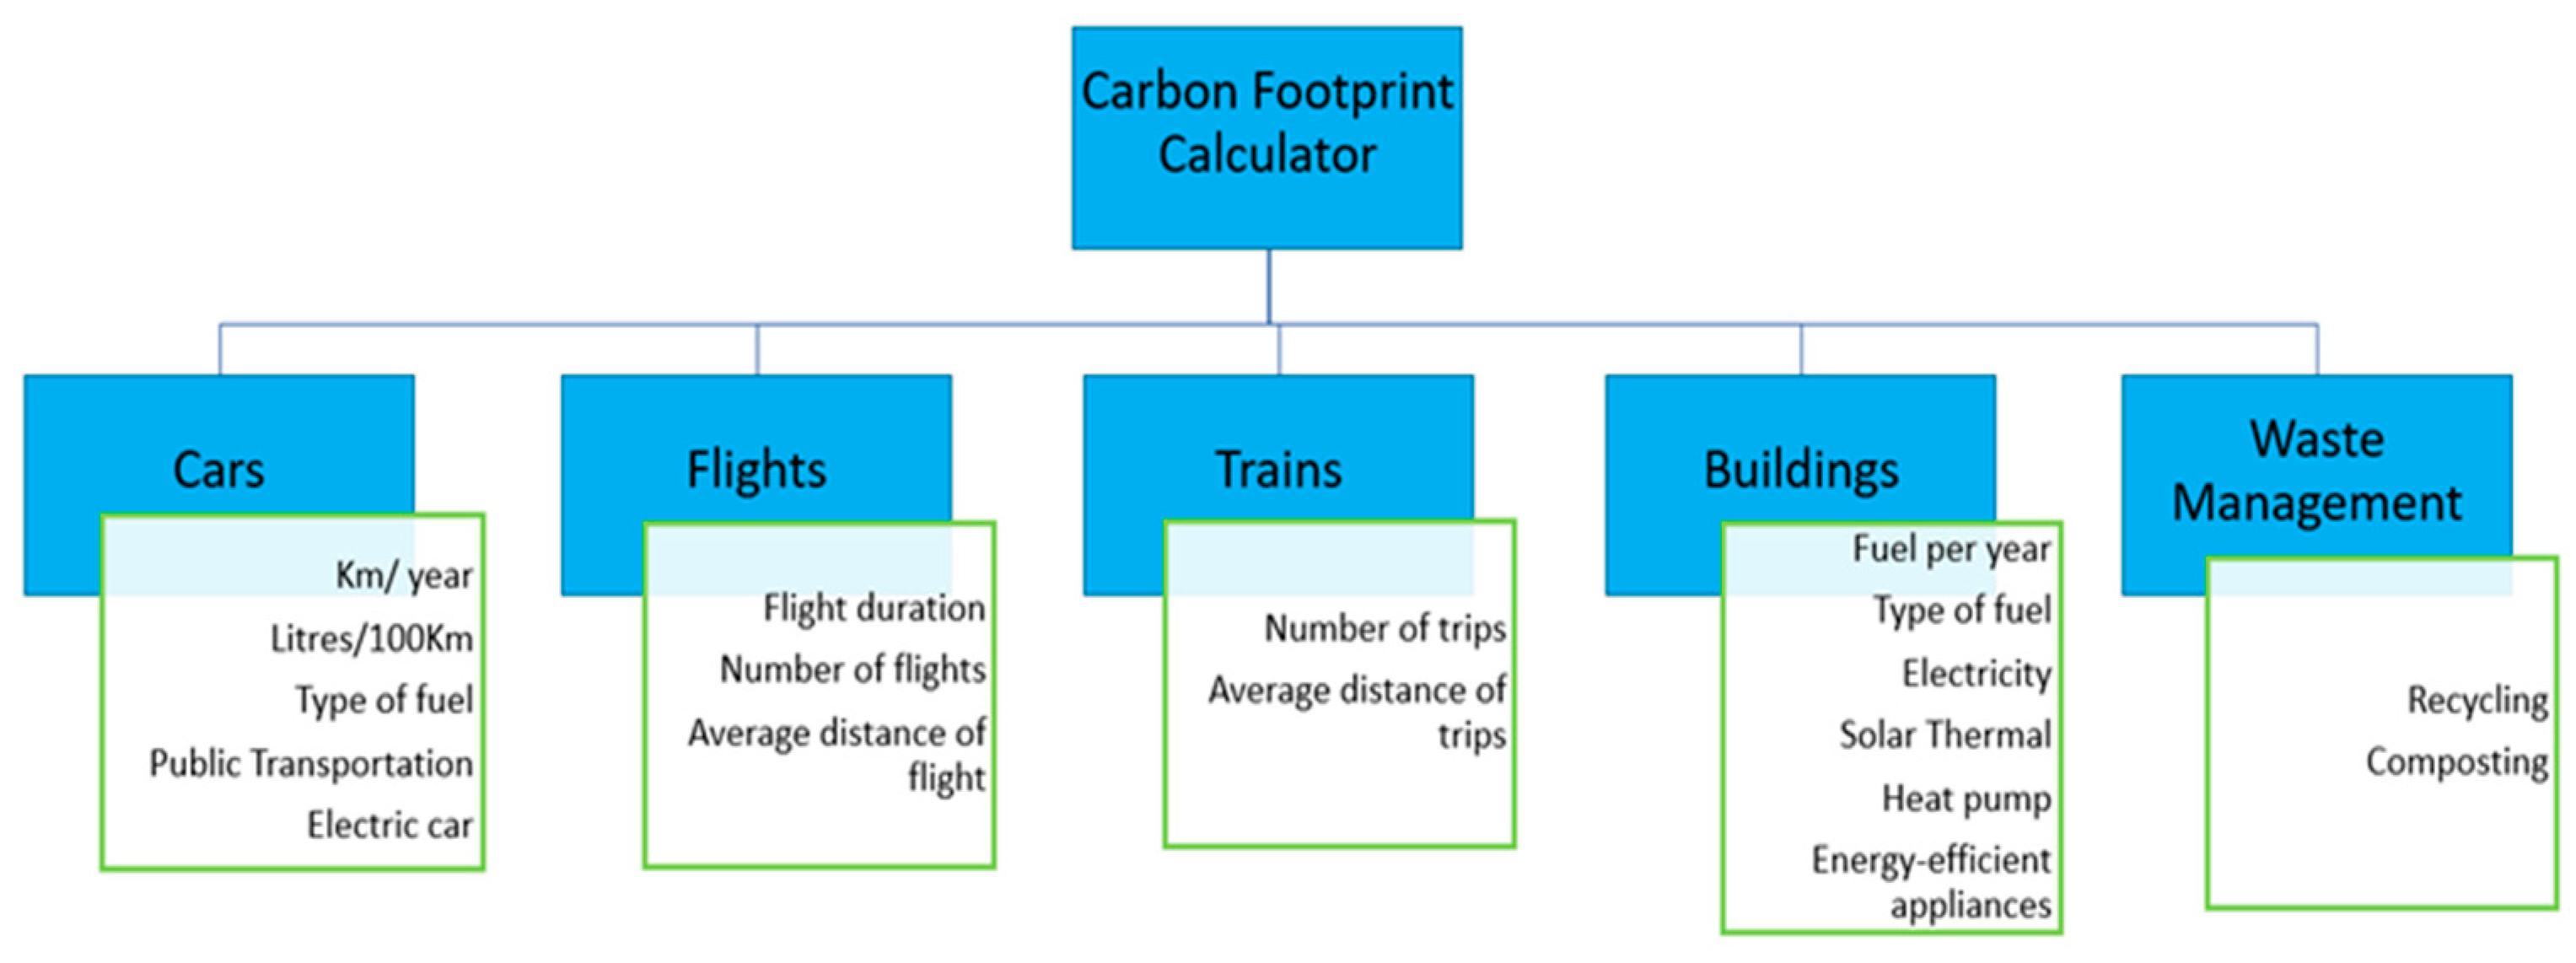
Domains of the Carbon Footprint Calculator
For the development of the first tool, the five main domains that affect the CO
2 footprint were needed: Cars, Flights, Trains, Buildings, and Waste Management (
Figure 1).
The first domain that is taken into consideration is the carbon emissions that are produced by cars. The first step to estimate these emissions was to calculate a country factor regarding the distance travelled in each country and in the EU. In comparison with the existing literature, the primary parameter considered was the distance covered, measured in kilometres, as well as the fuel consumption factors (in litres) [
20]. More specifically, for the calculation, data regarding the average distance per person per day (km) were used from Eurostat [
21], and also the average value of 12.41 was calculated. The specific value for each country was calculated by multiplying the average value with the country factors that are presented in
Table 2. Also, the consumption of the car’s fuels in Liters/100 km for every country was needed [
22], a public transportation factor (ptr. factor). In addition, in this developmental phase of the calculator, the value of 0.156 has been used as indicative of the maximum consumption of electric vehicles [
23]. Finally, the GHG emission factor for the 13 countries has been calculated by using Retscreen, a freely available software developed within the Excel environment, which provides comprehensive information regarding a potential project’s emissions, economic aspects, and risk factors [
24].
Τhe following equations were used to calculate the carbon footprint of cars and electric cars:
The second aspect considered in citizens’ carbon footprint is the emissions from air travel. For this estimation, the number of flights per capita was needed. These data were provided by Airbus based on the passengers originating from respective countries, and they are the following: Austria 1.51, Belgium 1.32, Croatia 1.91, Denmark 2.96, Germany 1.35, Greece 3.5, Italy 1.72, Latvia 1.45, Netherlands 1.7, Poland 0.61, Portugal 2.78, Romania 0.61, Slovenia 0.45, and EU 2.22 [
25]. Also, the average distance of flights was necessary, and it was divided into 4 categories: Domestic, short-haul, medium-haul and long-haul, as well as the kerosene factor 1.264 [
26]. For the calculation of the carbon footprint of air travelling, the following equation was used:
For the estimation of the carbon emissions from train transportation, the GHG emission factor for the 13 countries mentioned prior was required, the average distance of the trip for each country [
27], the number of the trips, as well as the energy consumption of electric trains 0.75 kWh/km of the travel (
Table 3). For the calculation of the carbon footprint from trains, the following equation was used:
It is crucial that future carbon footprint calculators should factor in the different energy mixes in each country to better describe the significance of electricity in greenhouse gas emissions [
4]. In the sector of buildings, this factor is considered by adding the GHG emission factor for each country. Other factors that were used were the heat pumps factor: 0.36, the grid correction factor: 1.08, the Solar thermal factor: 0.71 and the Boiler efficiency: 0.4. In addition, the CO
2 emission from the fuel consumption was calculated for each fuel (CO
2 per unit Biomass: 1.83, CO
2 per unit Coal: 3, CO
2 per unit Heating Oil: 2.64, and CO
2 per unit Natural Gas: 2.75). Finally, the average value for electricity 1866 was calculated by using the average from the country’s electricity per capita and the average value for heating: 3379, by using the average from the country’s space heating per capita [
28]. The specific value for each country was calculated by multiplying the average value with the country factors that are presented in
Table 4.
Some of the equations that were used to calculate the carbon footprint from buildings, are the following:
This research aims to achieve proper integration of recycling, composting, and energy recovery into the carbon footprint resulting from waste management. Firstly, statistics regarding municipal waste per capita were gathered. Additionally, information about waste treatment, categorised by type of recovery and disposal, was collected from Eurostat [
29]. Specifically, the percentage share of total waste treatment for disposal (landfill), recovery (recycling), and energy recovery was obtained. Moreover, the greenhouse gas (GHG) emission factor for each country was required [
24].
Table 5 presents the necessary data for estimating CO
2 emissions from waste management.
Some of the main equations that were used to calculate the carbon footprint from waste management are the following:
For the development of the second tool, the Scenario Simulation Dashboard, the reduction of the carbon footprint was calculated, which would occur depending on the behaviour change of the citizens regarding their daily activities. To calculate the reduction rate, there was thorough research in the existing literature [
30,
31,
32]. Also, the reduction of the carbon footprint was calculated, which would occur depending on the government actions that the citizens are willing to accept. The criteria for choosing these government actions were on the basis of effectively reducing GHG emissions. For example, the utilisation of wind energy and photovoltaic parks is selected as a viable and sustainable course of action for government implementation. [
33,
34]. Some characteristic examples are presented as
Supplementary Material in Tables S1 and S2.
3. Results and Discussion
This section presents the results of the CO2 calculations conducted to assess the environmental impact of everyday habits, such as transportation, electricity consumption, travelling and waste management practices, and also introduces the Carbon Footprint Simulation Dashboard. Some other features of the Dashboard are briefly mentioned, such as the Profile Page and the User’s Feedback. To conclude, two scenarios demonstrated the proper integration of recycling and composting on the carbon footprint from waste management.
3.1. CO2 Emissions
Table 6 displays the carbon footprint attributed to car usage in the thirteen countries examined during this study. Notably, variations in emissions were observed among cars utilising different types of fuel. Furthermore, a helpful example is presented to showcase the potential reduction in CO
2 emissions achieved when citizens use public transportation. These calculations enabled a detailed understanding of the carbon emissions associated with car usage and provided valuable insights for further analysis and decision-making.
The carbon footprint resulting from air travel is presented in
Table 7. In more detail, it shows the emissions from flights, which vary according to the distance travelled and the duration of the flights. As expected, it is observed that longer flights contribute to a larger carbon footprint [
25].
Following the analysis of carbon emissions rising from air travel, the study focuses on examining the environmental impacts of train travel. This aspect, as it has been mentioned, takes into consideration factors such as distance covered, number of travels, and electricity consumption. The results from this calculation could contribute to a comprehensive understanding of the carbon emissions attributed to train transportation and a comparison of the travelling habits between different countries of Europe. These values are presented in
Table 8.
In the domain of buildings, the CO
2 from buildings' electricity and the CO
2 from heat pumps was calculated. Also, the emissions from different heating systems (heating oil, coal, biomass and natural gas) were calculated. An analysis of these calculations in
Table 9 reveals that the largest emissions are associated with coal, followed by natural gas, heating oil, and biomass. In addition, as Fener’s study outlines, there are many difficulties tied to the examination and assessment of building-related carbon emissions, which result from variations in methodologies. It is clear that employing a methodical yet uncomplicated approach could be more favourable for calculating the carbon footprint of buildings [
35].
For the waste management domainthe CO
2 emissions from landfilling, recycling, composting, and energy recovery have been taken into consideration. The calculations in
Table 10 were based on the municipal waste per capita statistics, waste treatment data obtained from Eurostat, and country-specific greenhouse gas emission factors. The results show that at an EU level, CO
2 from landfilling is responsible for 85%, the largest amount of the total emissions, while recycling contributes 0.3%. Composting is responsible for approx. 3.9% and energy recovery for 11% of the total amount.
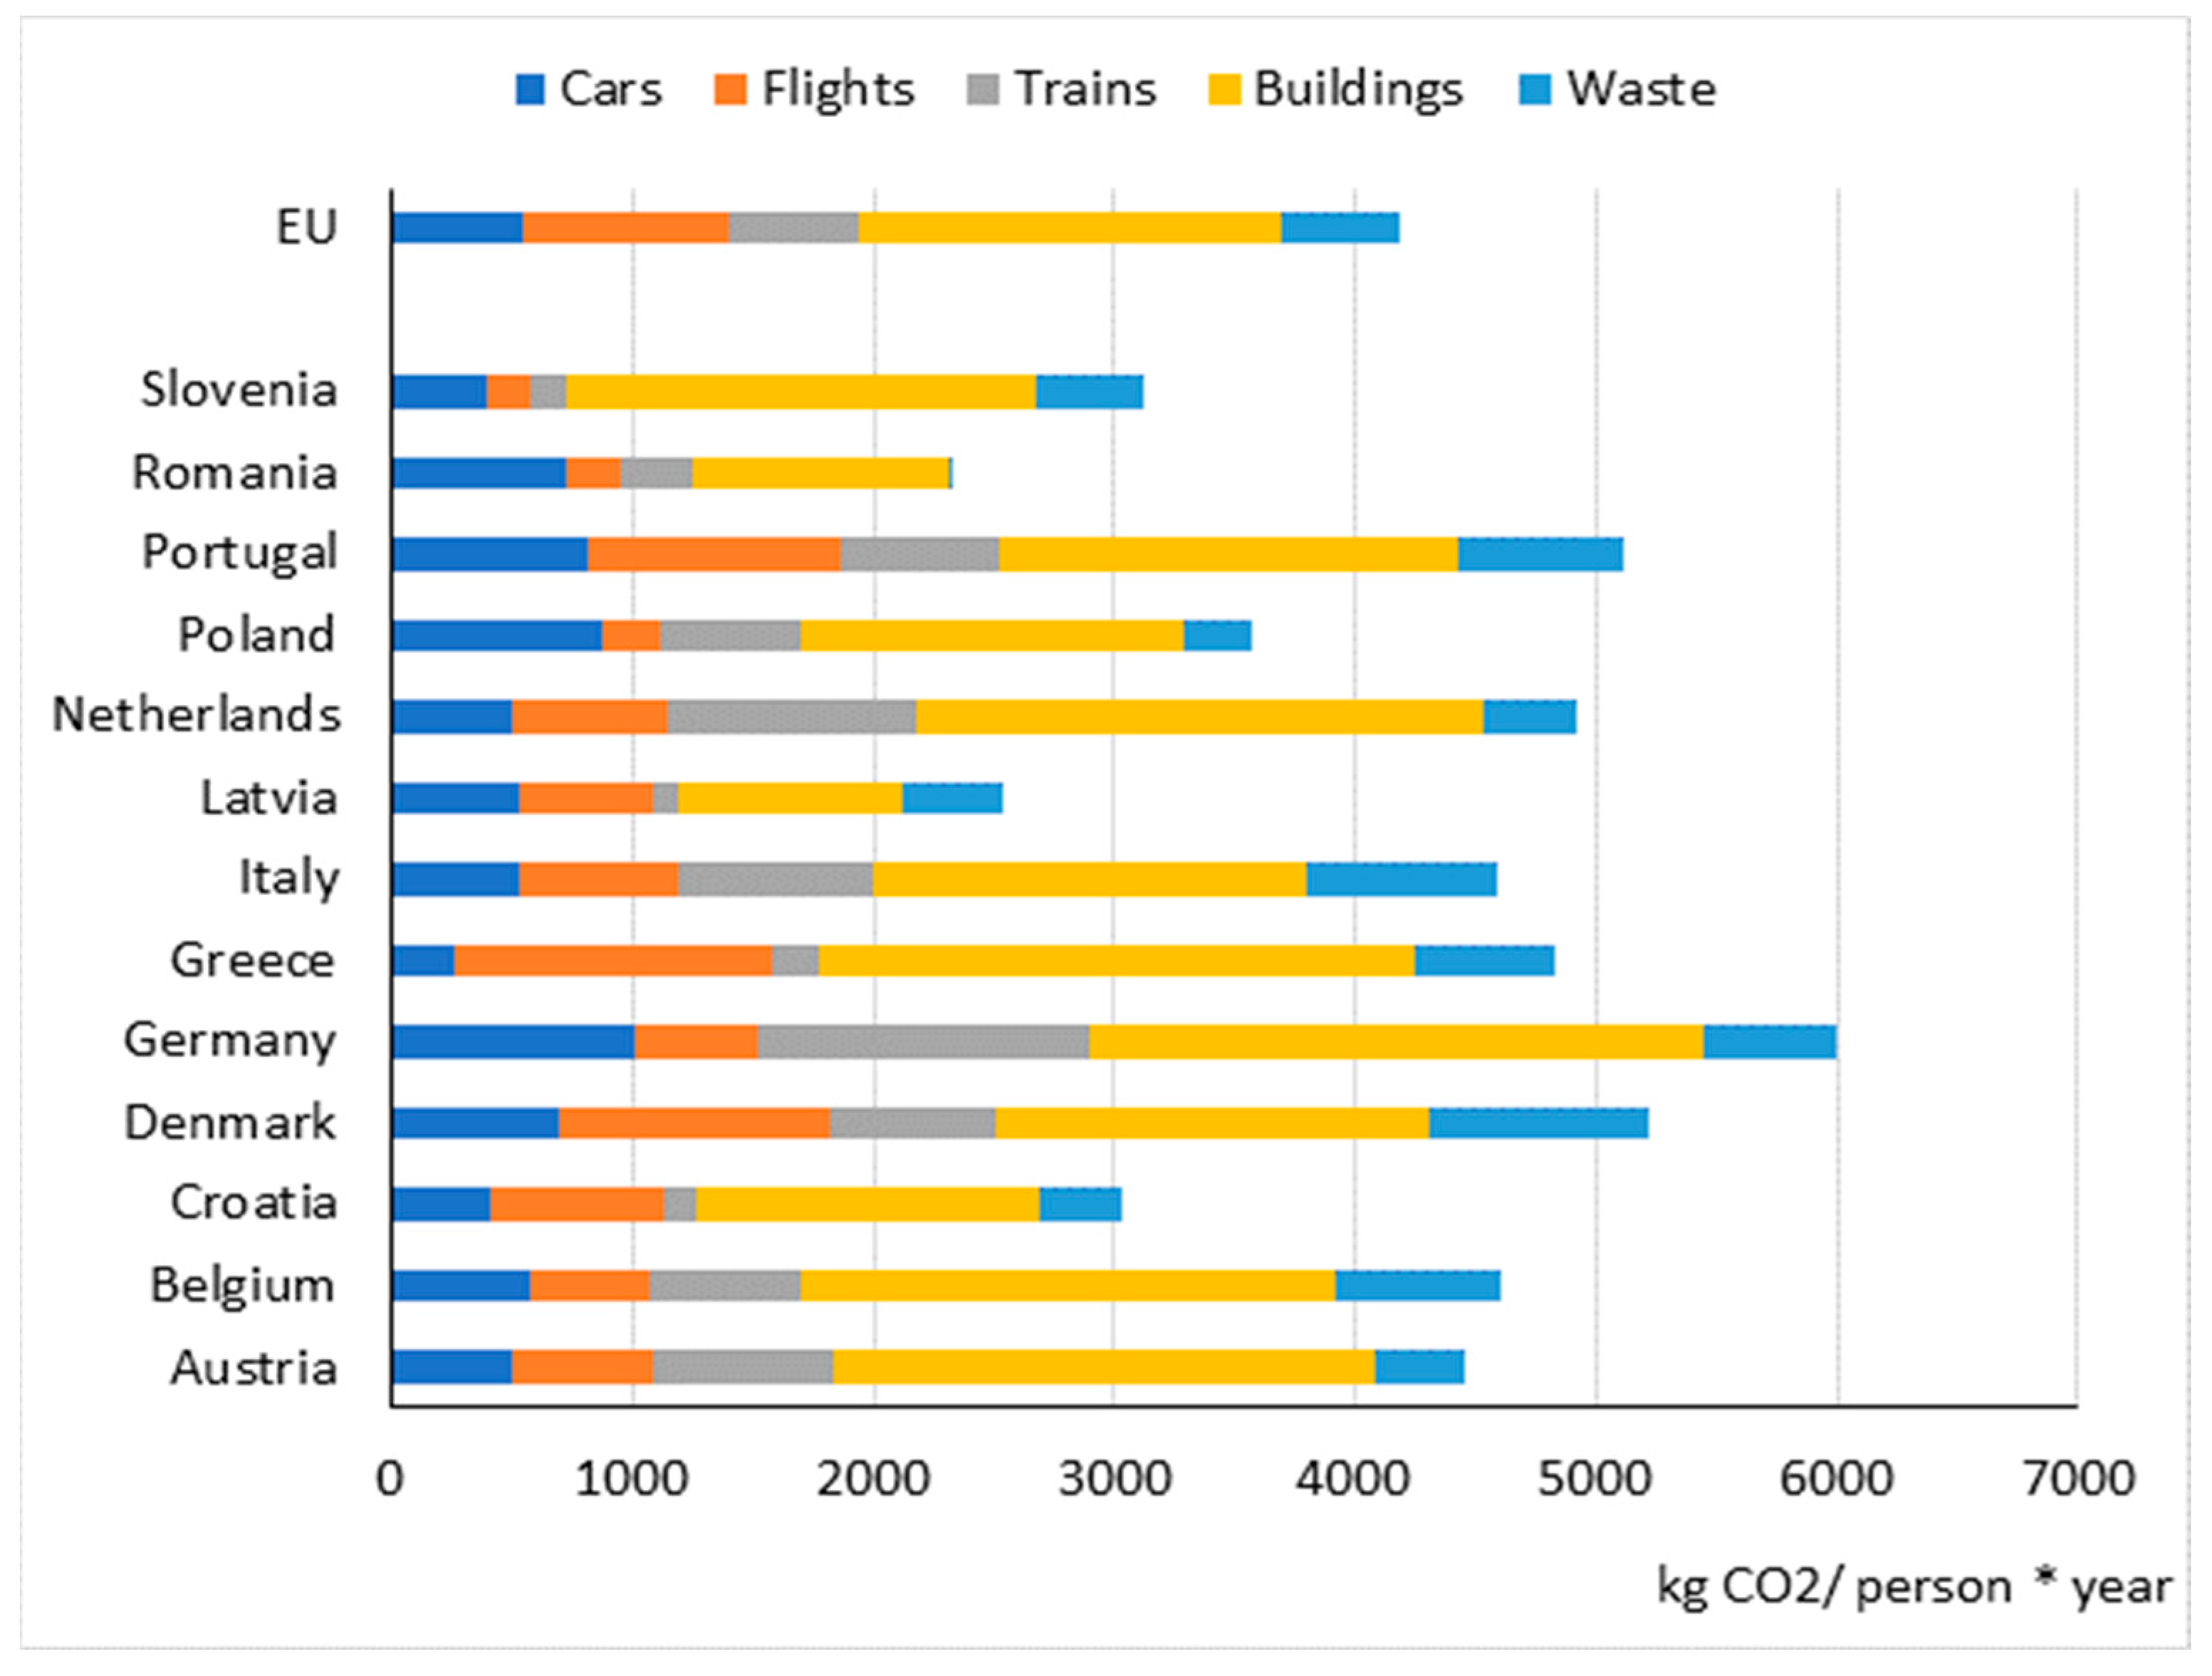
Combining all the above results produces the graph below (
Figure 2). This graph shows the carbon footprint of the 13 countries studied for the five different sectors that affect it.
All the above results were collected and composed on the Carbon Footprint Simulation Dashboard.
3.2. Introducing Carbon Footprint Simulation Dashboard
3.2.1. Carbon Footprint Calculator
The first tool of the Carbon Footprint Simulation Dashboard, the Carbon Footprint Calculator, includes five domains (cars, flights, trains, household, waste management), some demographic characteristics (age, gender, city, country, and time period to calculate your footprint), and finally the results. The Dashboard is available in the pilots’ languages: English, German, Bulgarian, Dutch, and Greek. In
Figure 3, the homepage of the Carbon Footprint Simulation Dashboard is being presented.
The users are asked to provide certain demographic information, including their country and city of residence, as well as the timeframe for which their carbon footprint needs to be calculated. For now, the citizens can choose between the pilot countries (Belgium, Bulgaria, Germany, Greece) and the pilot cities (Athens, Berlin, Flanders, Plovdiv, Sofia). Additionally, participants are asked to provide other demographic characteristics, such as age, gender, and marital status, which are collected for statistical purposes.
The demographic characteristics questions are mandatory and are gathered for research purposes. The only mandatory input is the user’s country as it is used to set the correct calculation factors for the calculator.
After the energy sector, transportation stands as the second largest emitter of greenhouse gases (GHGs), contributing to 25% of the total emissions in the European Union (EU). Especially road transport is responsible for the greatest amount; estimated approx. 72% in 2019 (EEA Report, 2022). So, in the next section, users are asked to provide data about travelling, including car use, flights, use of trains, bikes etc. As far as car use is concerned, users are prompted to enter the sum of the kilometres travelled in the desired period (a year), the consumption of the car’s fuels (litres/100 km), and the type of fuel that the car uses (petrol, diesel, LPG, CNG, etc.). Additionally, users have the option to select public transport as well as electric cars. Since this tool is under development, the questions can change in the future. For example, the domain of the car has been redesigned to include various vehicle types, as well as multiple vehicles per user, and it will be implemented soon.
Another sub-category considered in the transportation domain is flights. At this stage, users select several characteristics in order to define the duration of the flight. They can choose between domestic flights, short-haul (<3 h), medium-haul (3–6 h), and long-haul (6–12 h). After completing this part, information regarding the number of train trips taken is required, as well as the average distance of each trip.
Within the household section, users can choose from a range of energy sources for their energy supply, including the option of specifying whether the energy is derived from renewable sources. The energy sources taken into consideration are electricity, heating oil, coal, biomass, and natural gas. In addition, users are requested to provide their energy consumption in kWh/year. This information could be easily found by referring to electricity bills from the requested period. To complete this section, information about the energy efficiency of household appliances is required. Moreover, the users can choose the energy efficiency of some of their household appliances, such as their refrigerator, oven, dishwasher, and washing machine. The energy efficiency level in the Carbon Footprint Calculator uses the EU energy labelling as a reference in order to follow a recognised standard within the EU [
36].
The last aspect considered in this calculator is the emissions of waste management. In this part, the users are asked to provide information regarding their waste management habits, specifically focusing on recycling and composting. The way this is performed is by providing the average amount of yearly recycling and composting done by a citizen in the user’s country (the one they have picked at the beginning of the Calculator), and then the user can choose if they recycle and compost more or less than that. The reason behind this implementation, like many others in this Calculator, is the need for simplicity for the user so as not to lose interest due to the large number of questions or the difficulty of the questions.
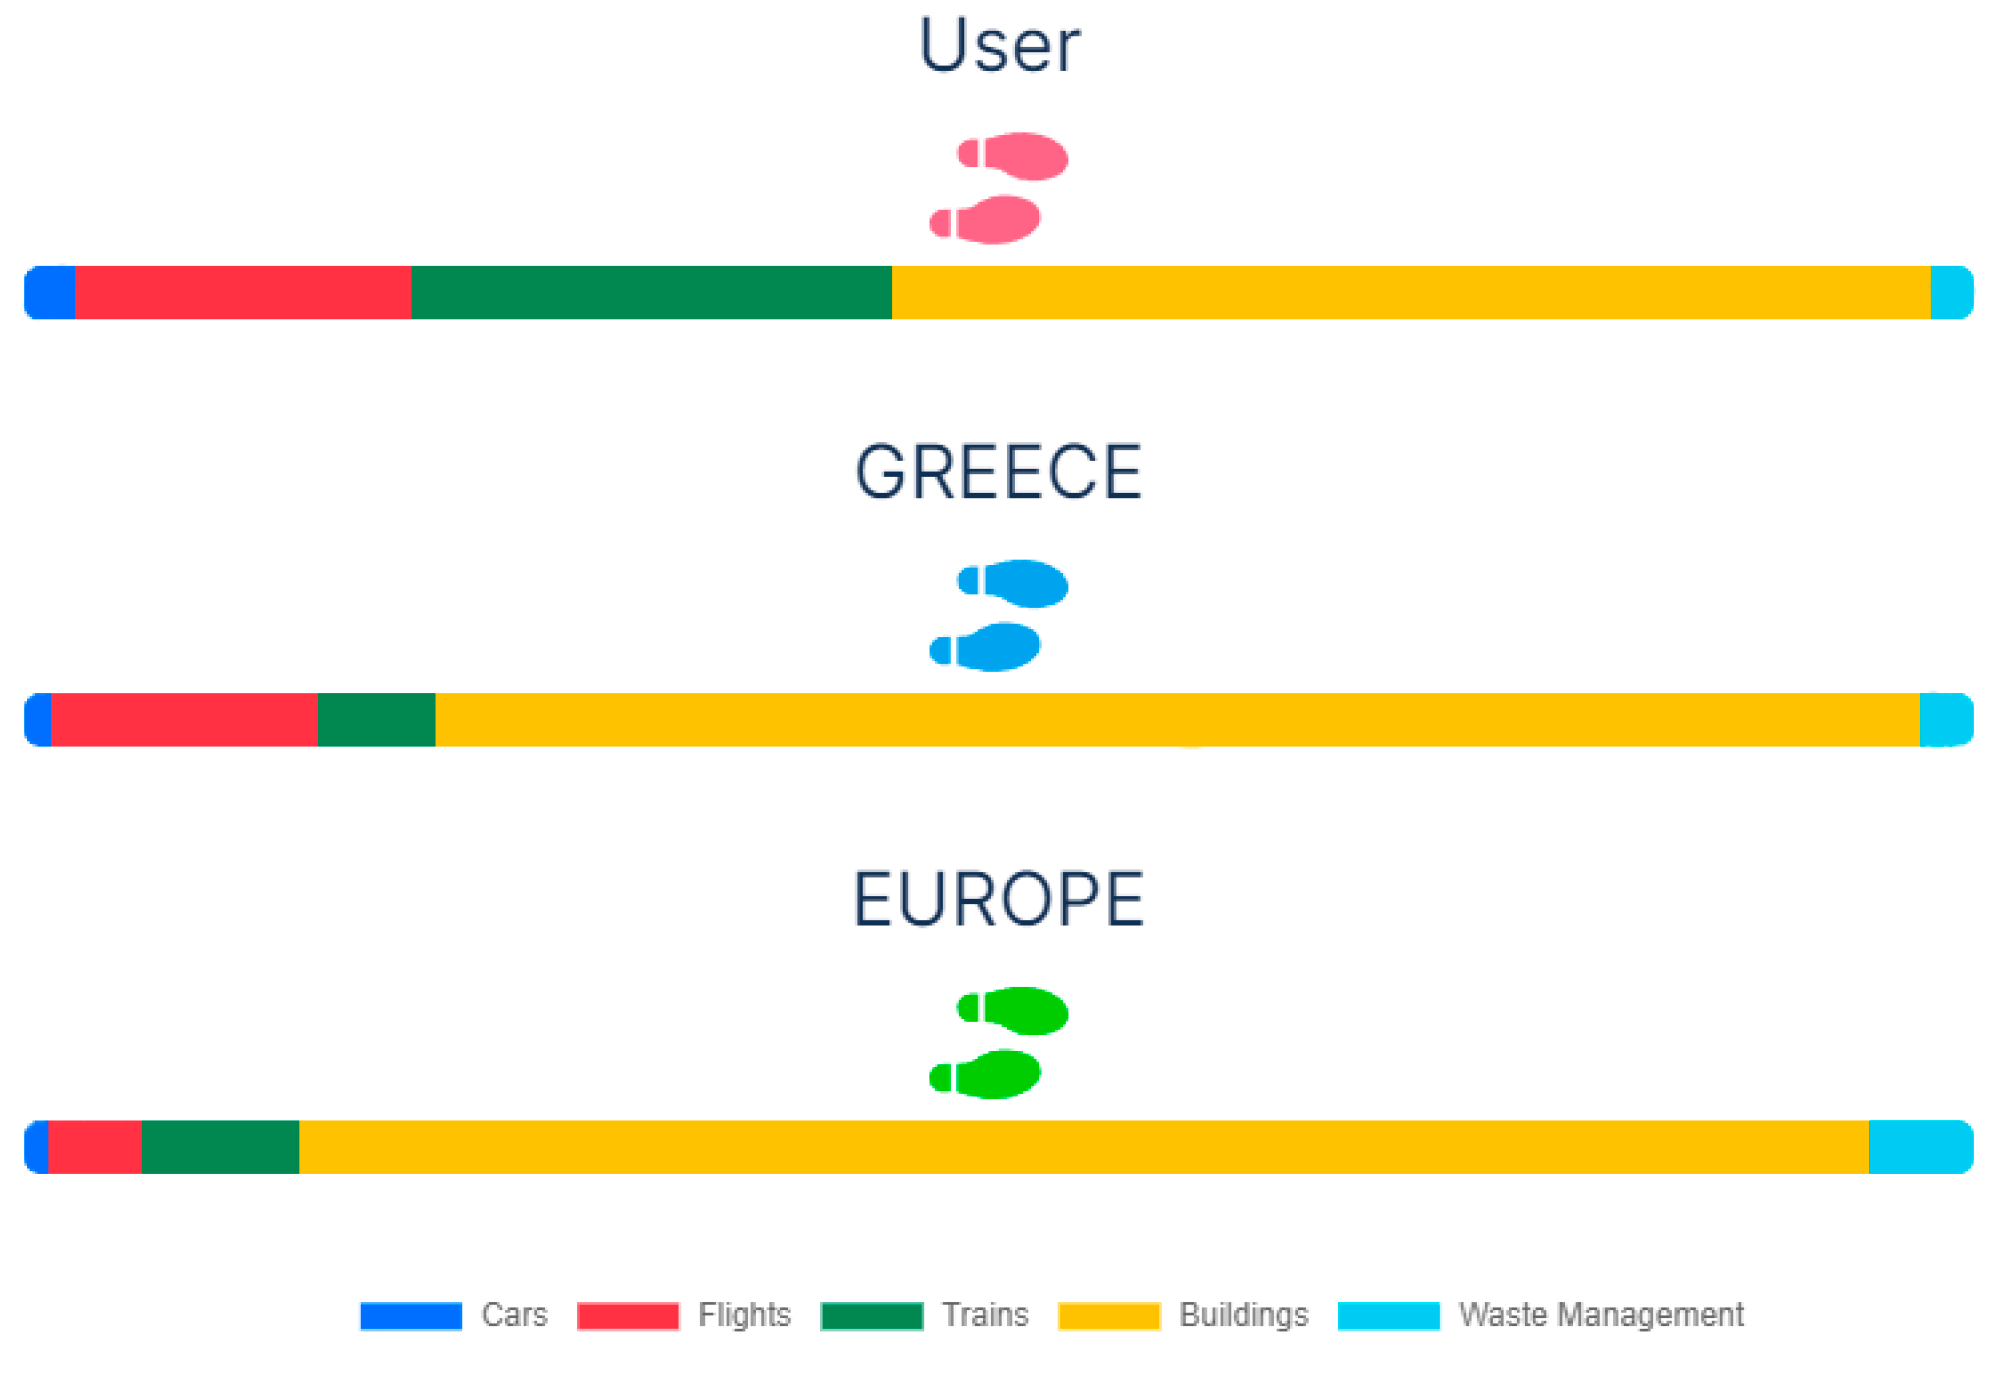
After the users have completed all the above, the calculation of the carbon footprint takes place. As shown in
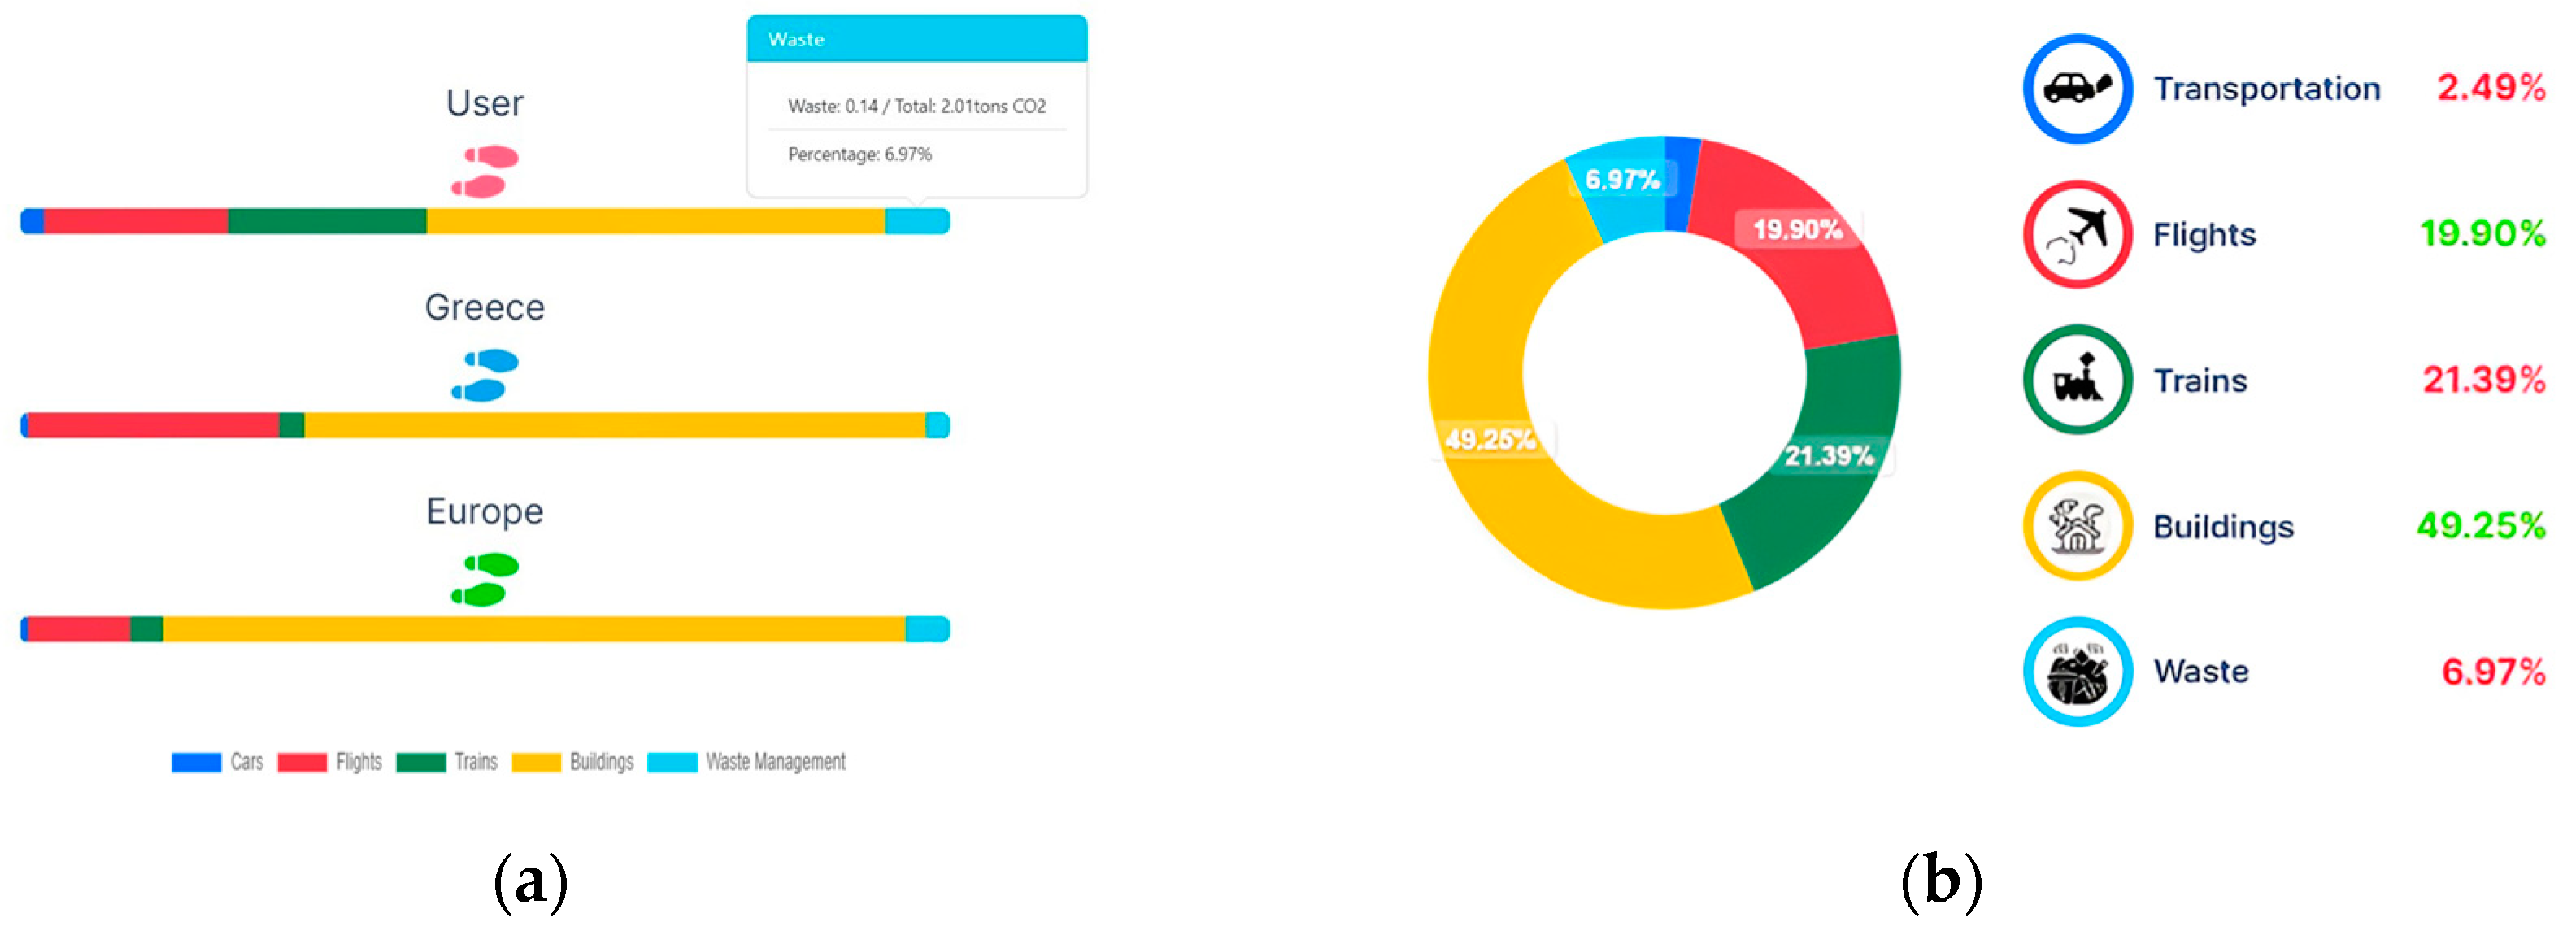
Figure 4, a comparison with the average carbon footprint of the selected country is available, as well as with Europe’s average. This is in line with the pilots’ requirements to be able to compare their carbon footprint with averages at European, and local levels, so they can have the incentive to try to adopt greener habits. During initial workshops where the Carbon Footprint Calculator was presented, this feature gained a lot of positive feedback and aligned well with the objectives of the tool to raise awareness among citizens regarding their carbon footprint, as well as help them visualise it.
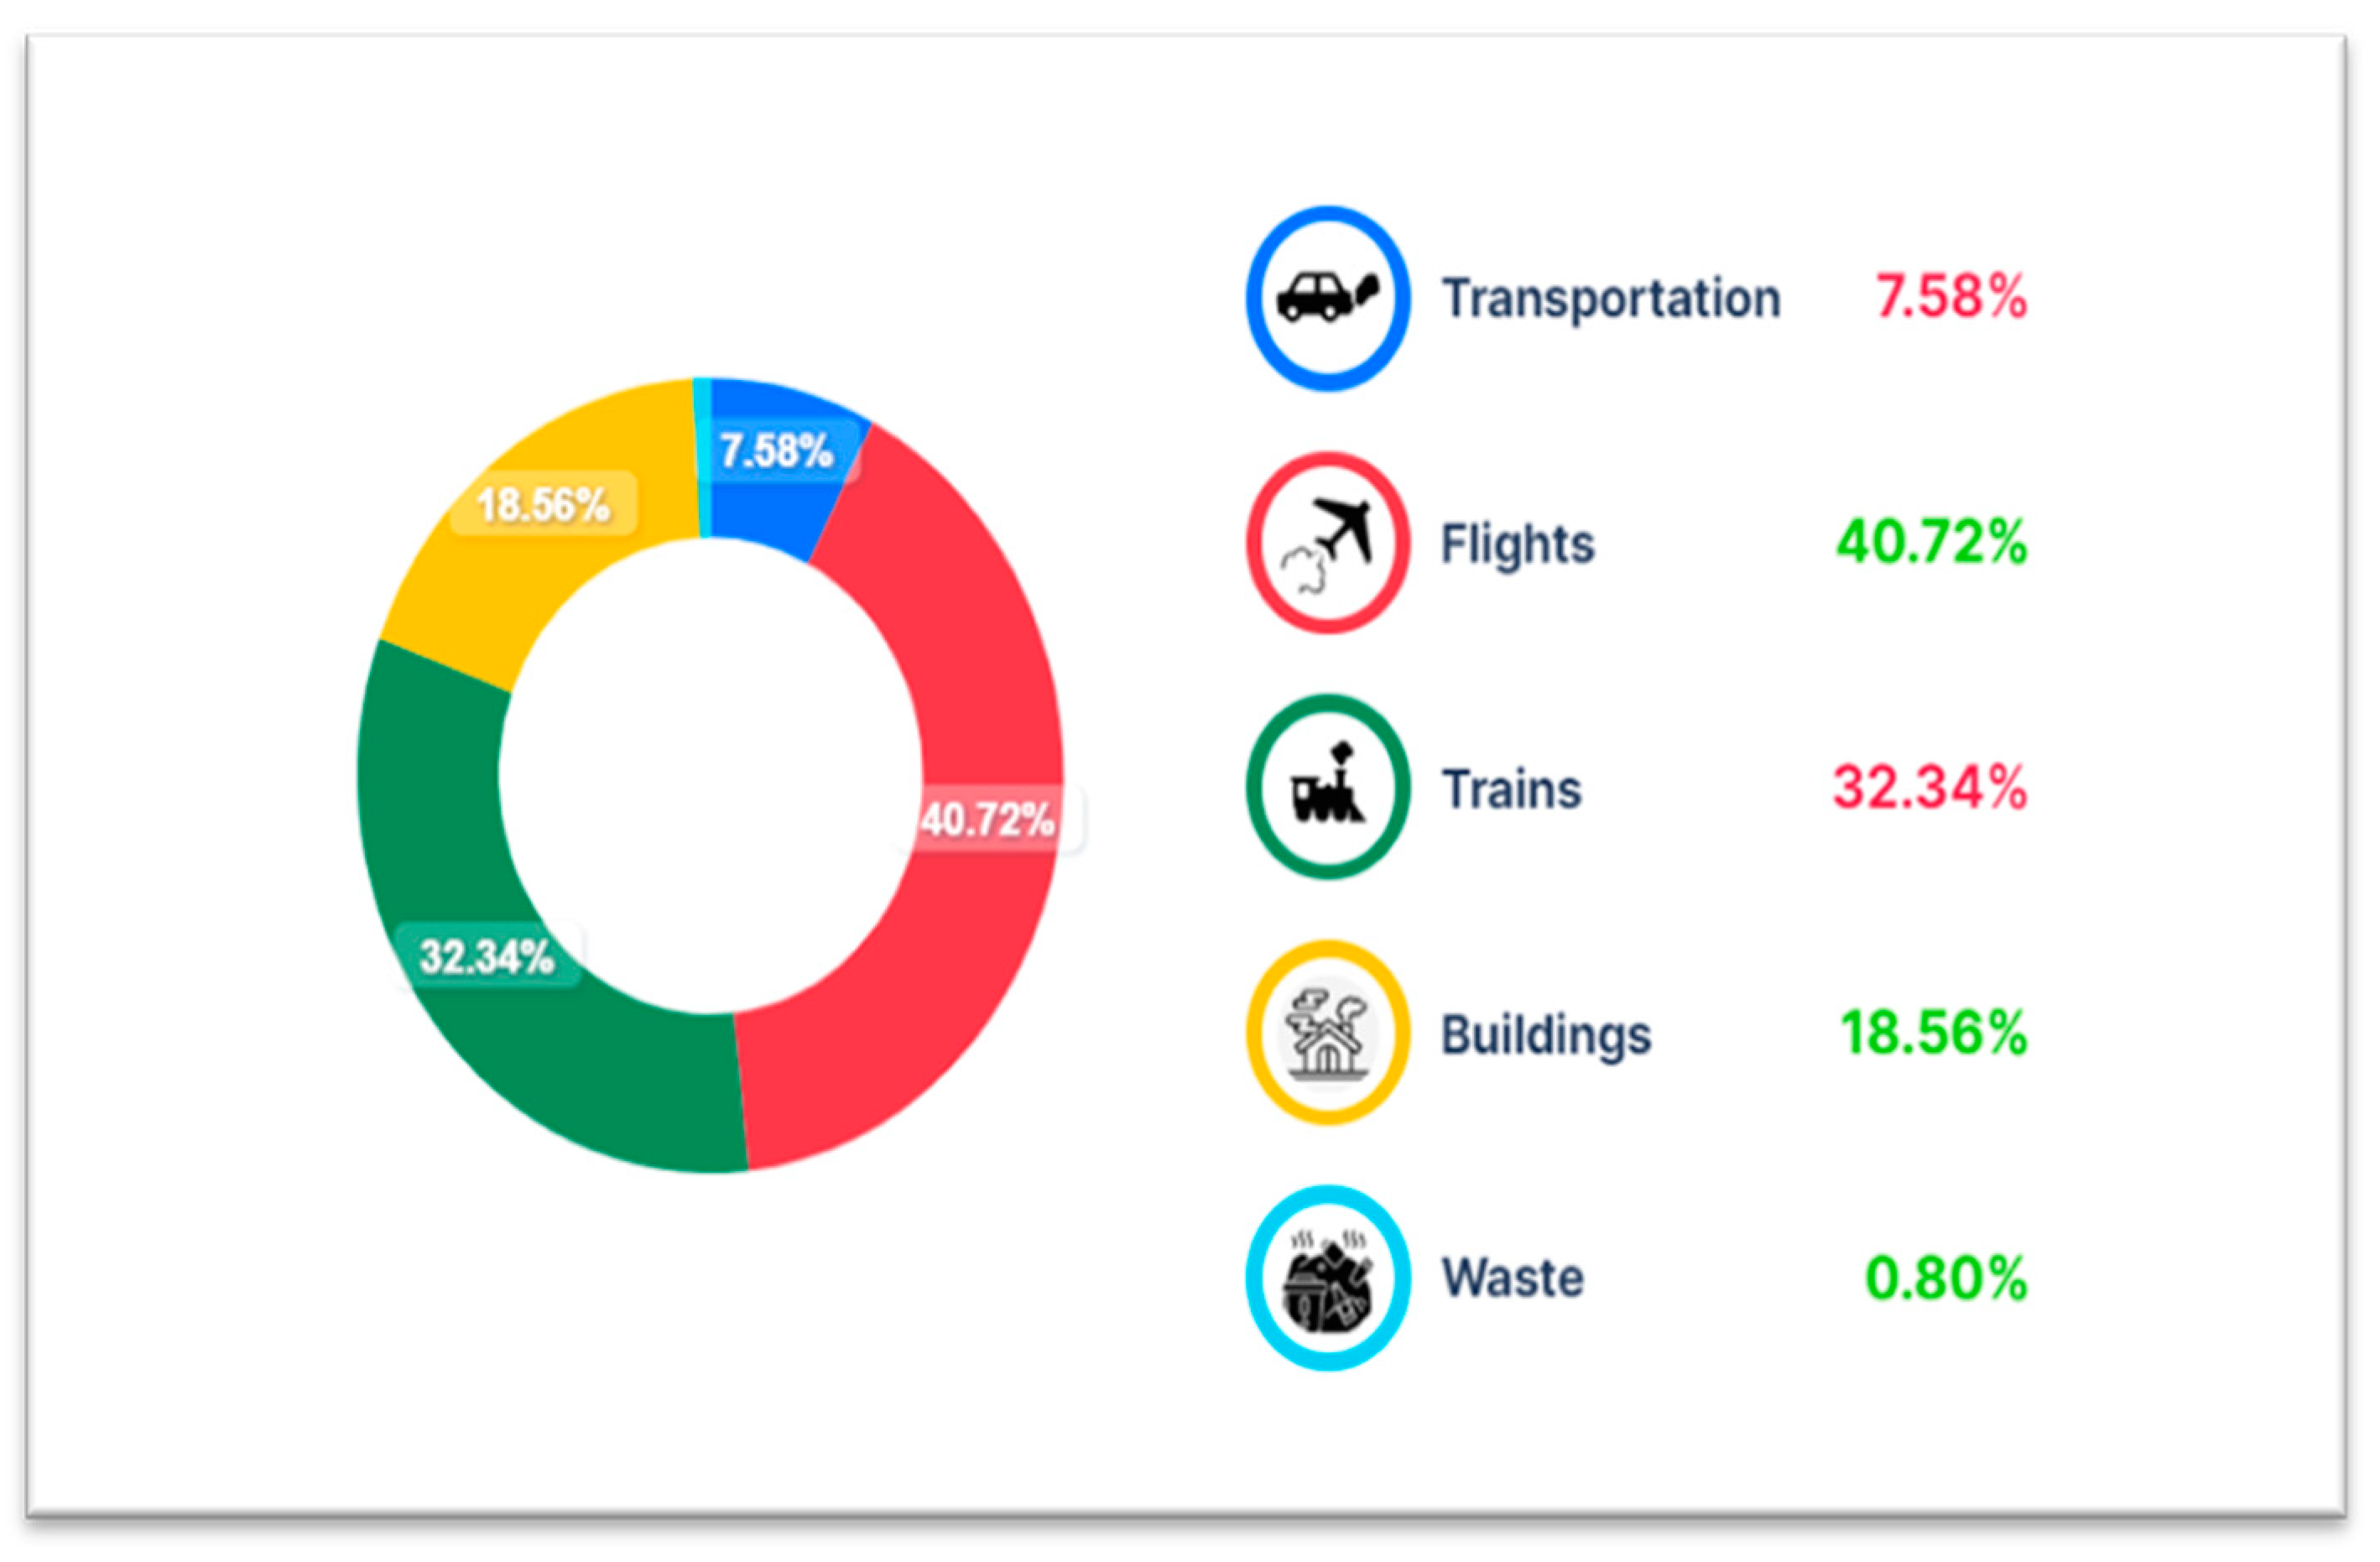
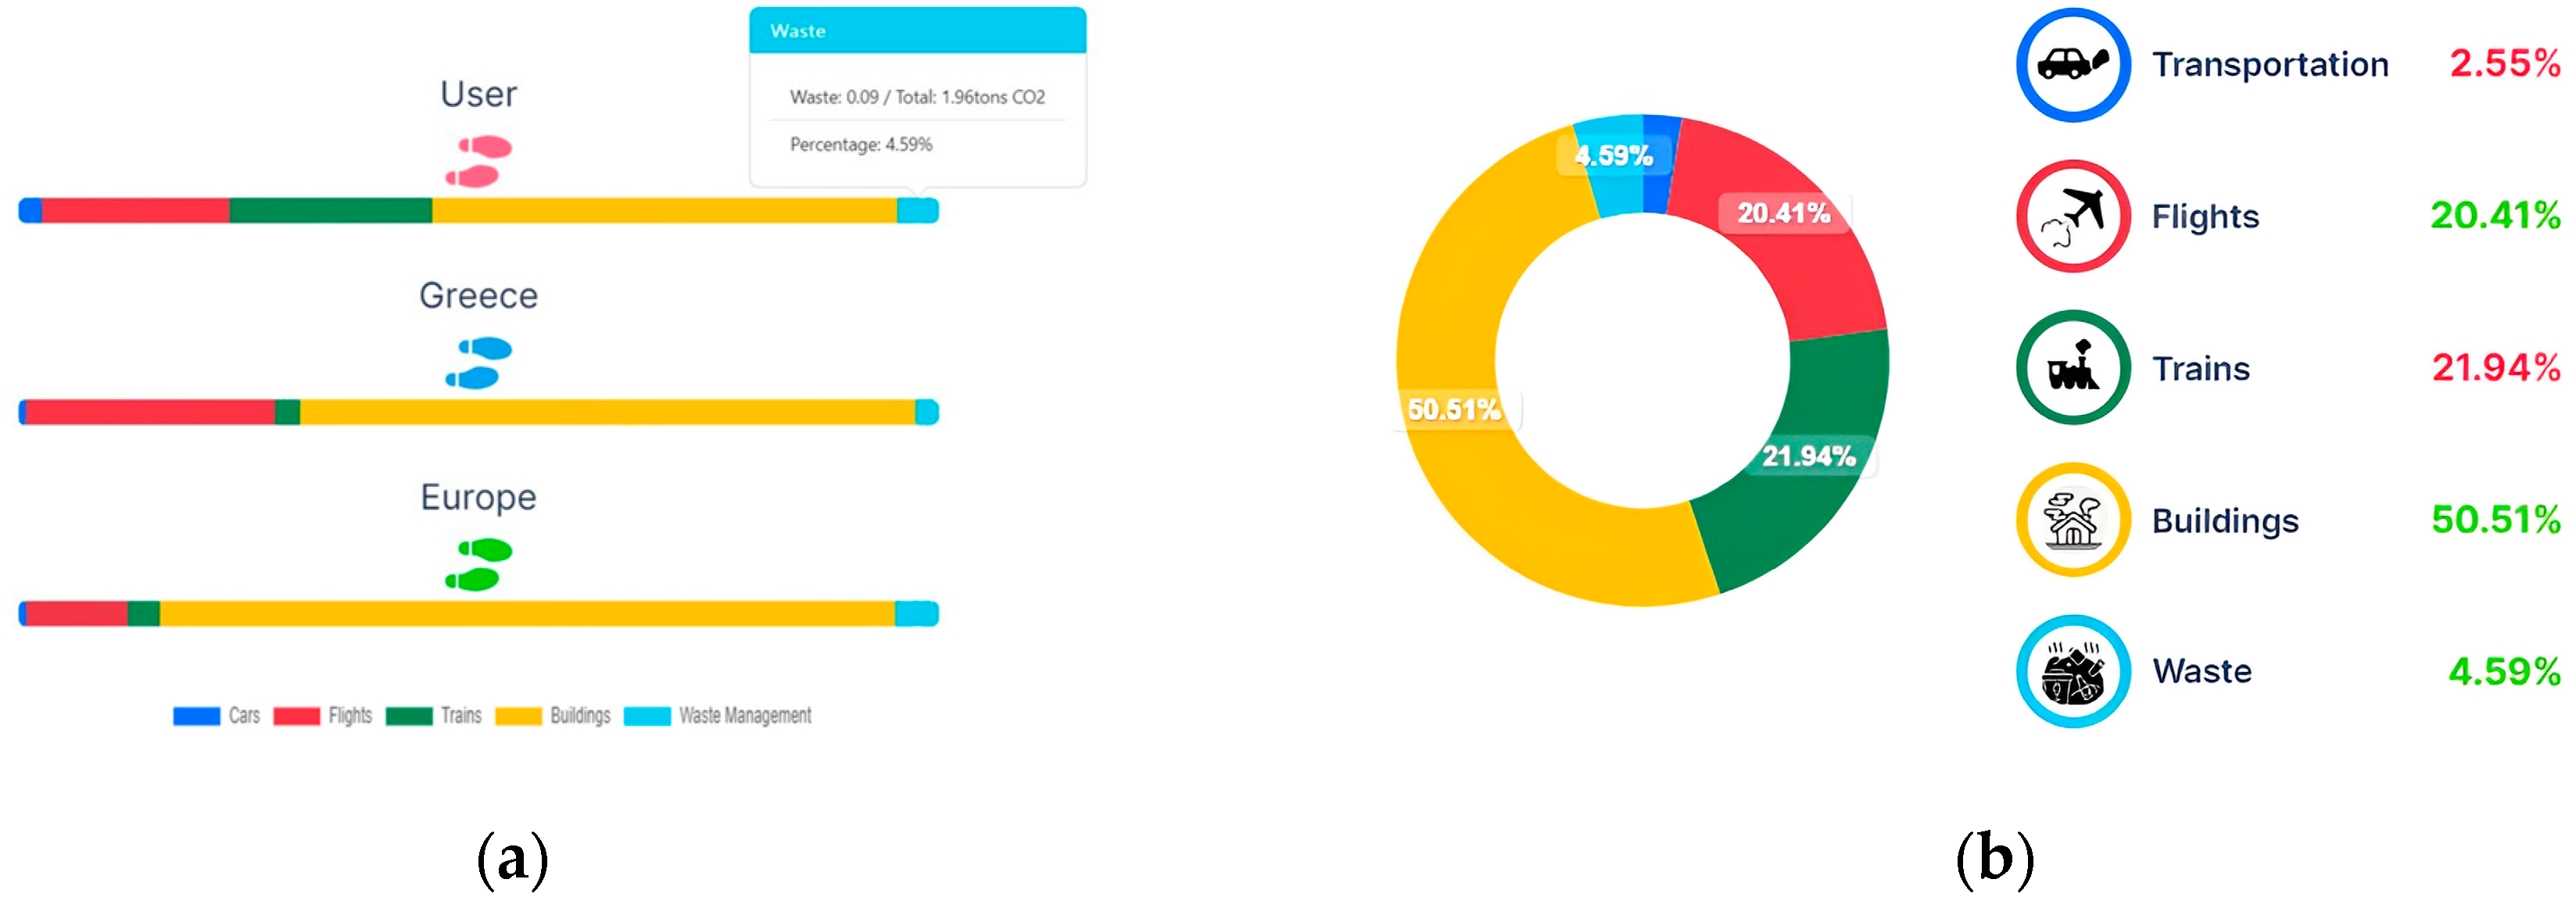
Also, in compliance with
Table 1, results of each category are available for a better understanding of how daily routine affects citizens’ carbon footprint (
Figure 5). Currently, visualisation options are still being tested within the pilots of the project in order to decide which graph types are considered most helpful and insightful to the user.
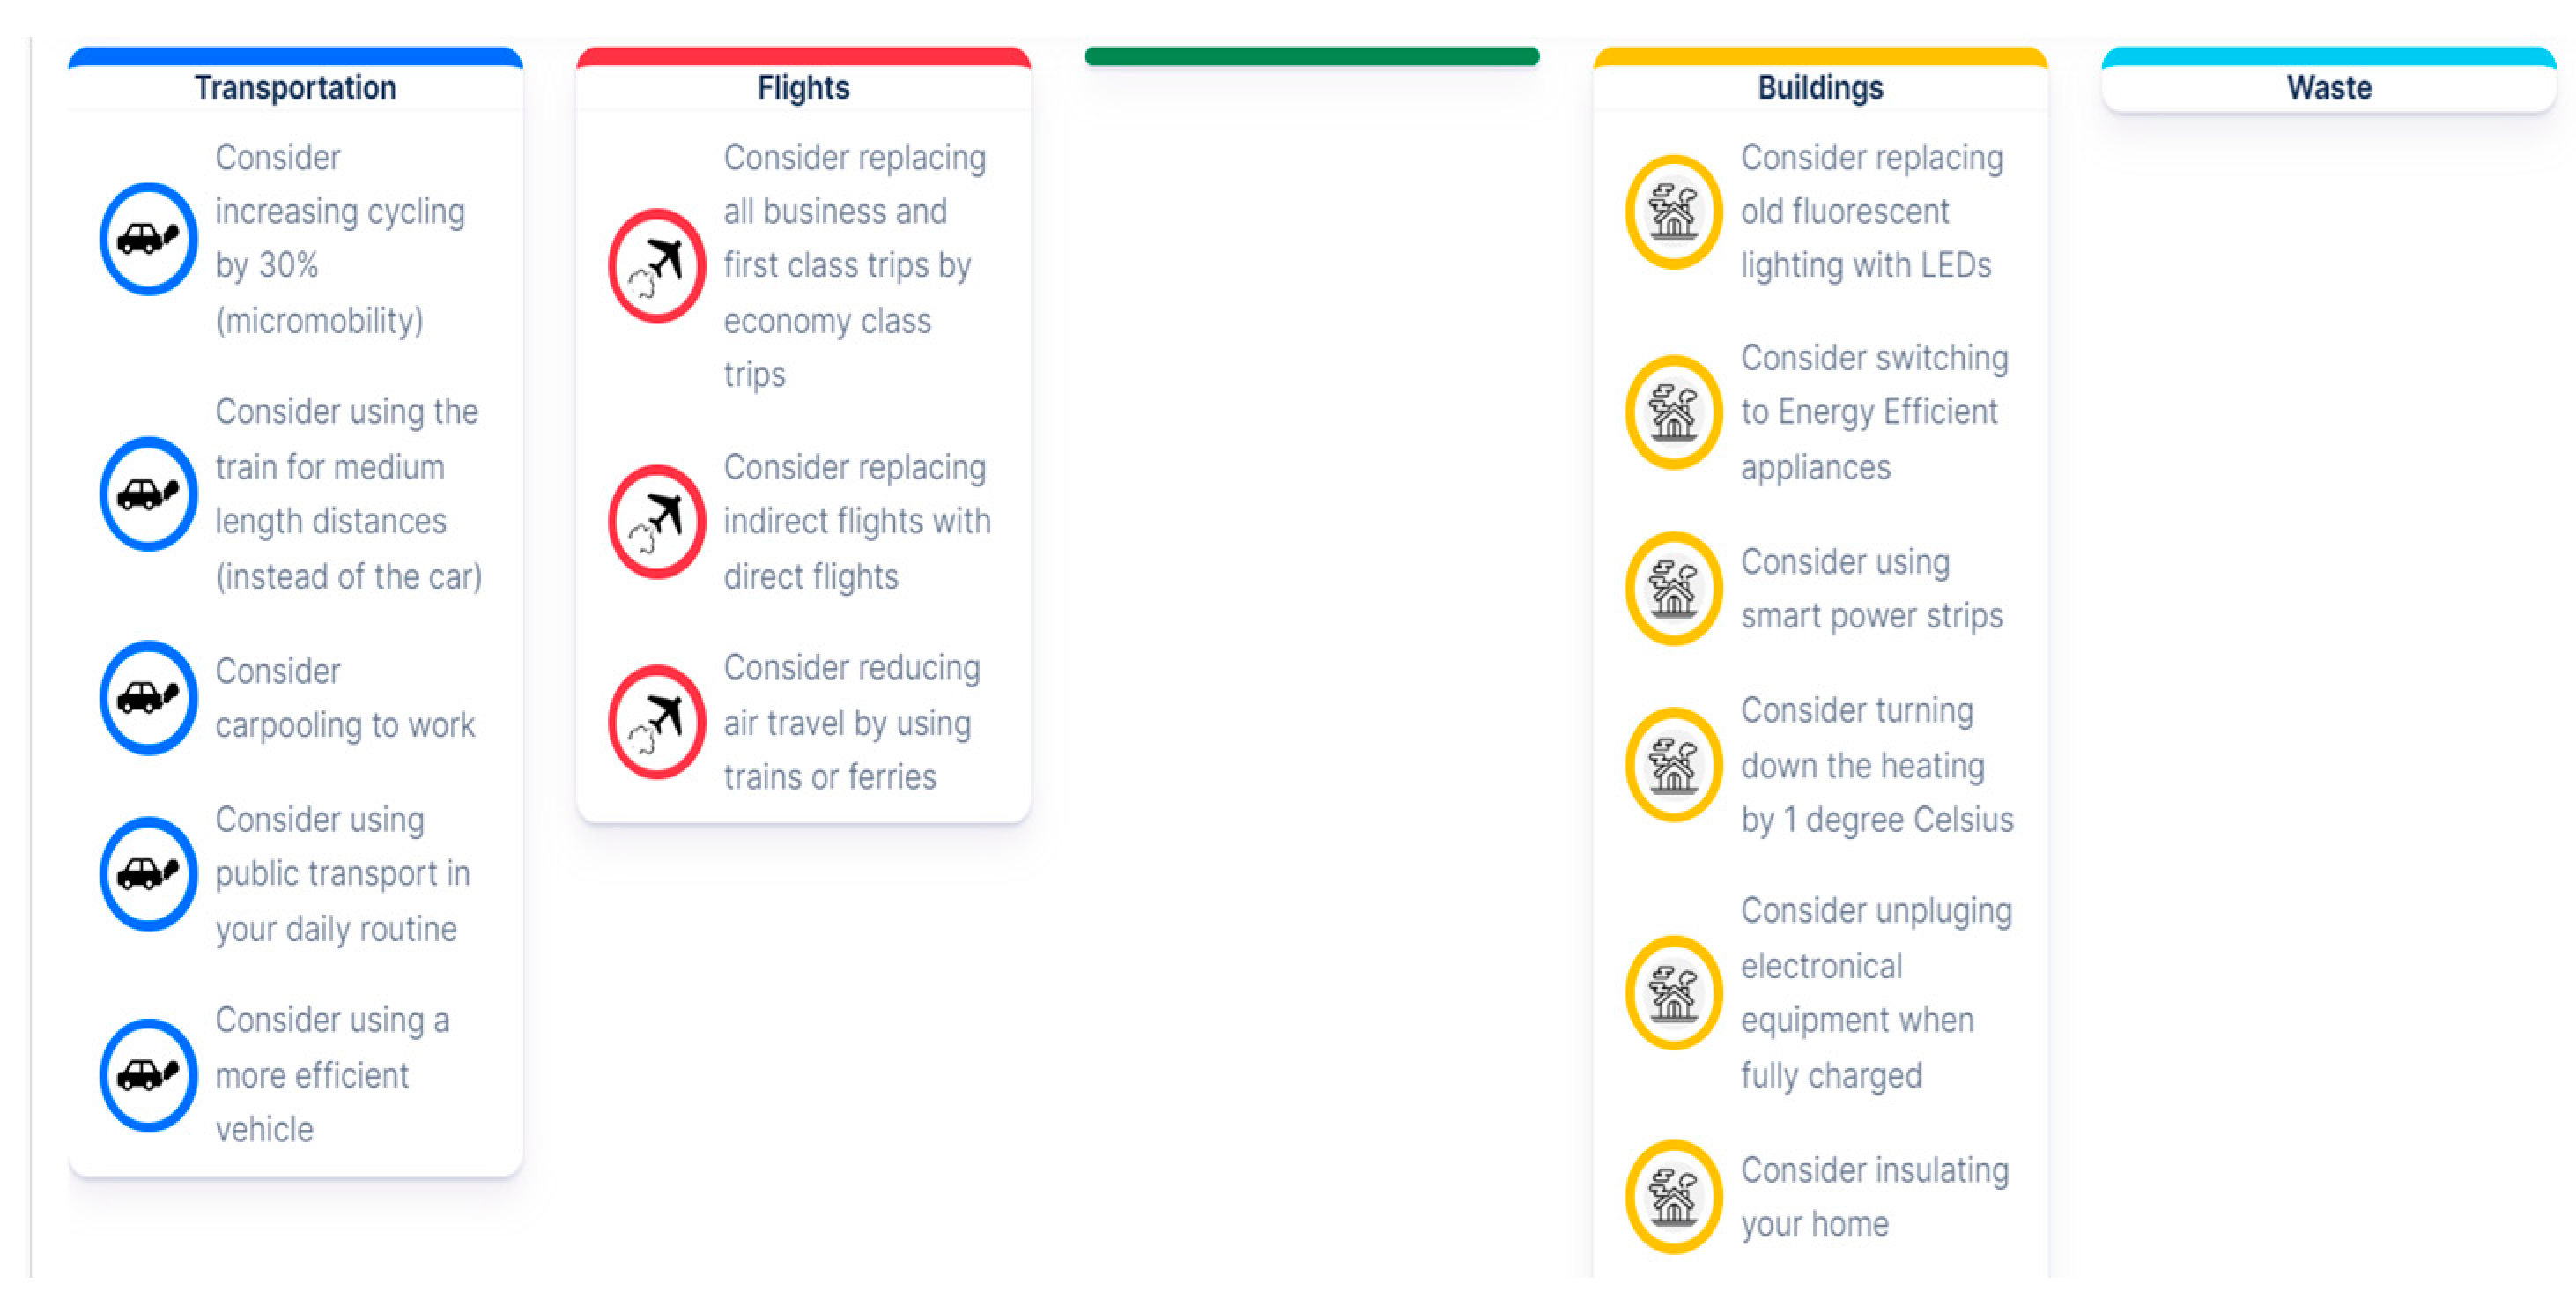
Based on the above results, a list of recommendations is available for each sector on how to reduce carbon footprint in case they exceed the desired threshold (
Figure 6). The citizen can choose each recommendation, and by clicking it, the user can see links with more analytical information regarding each recommendation, as well as ways how to adopt it. These links refer to the country that was selected in the beginning.
3.2.2. Scenario Simulation Dashboard
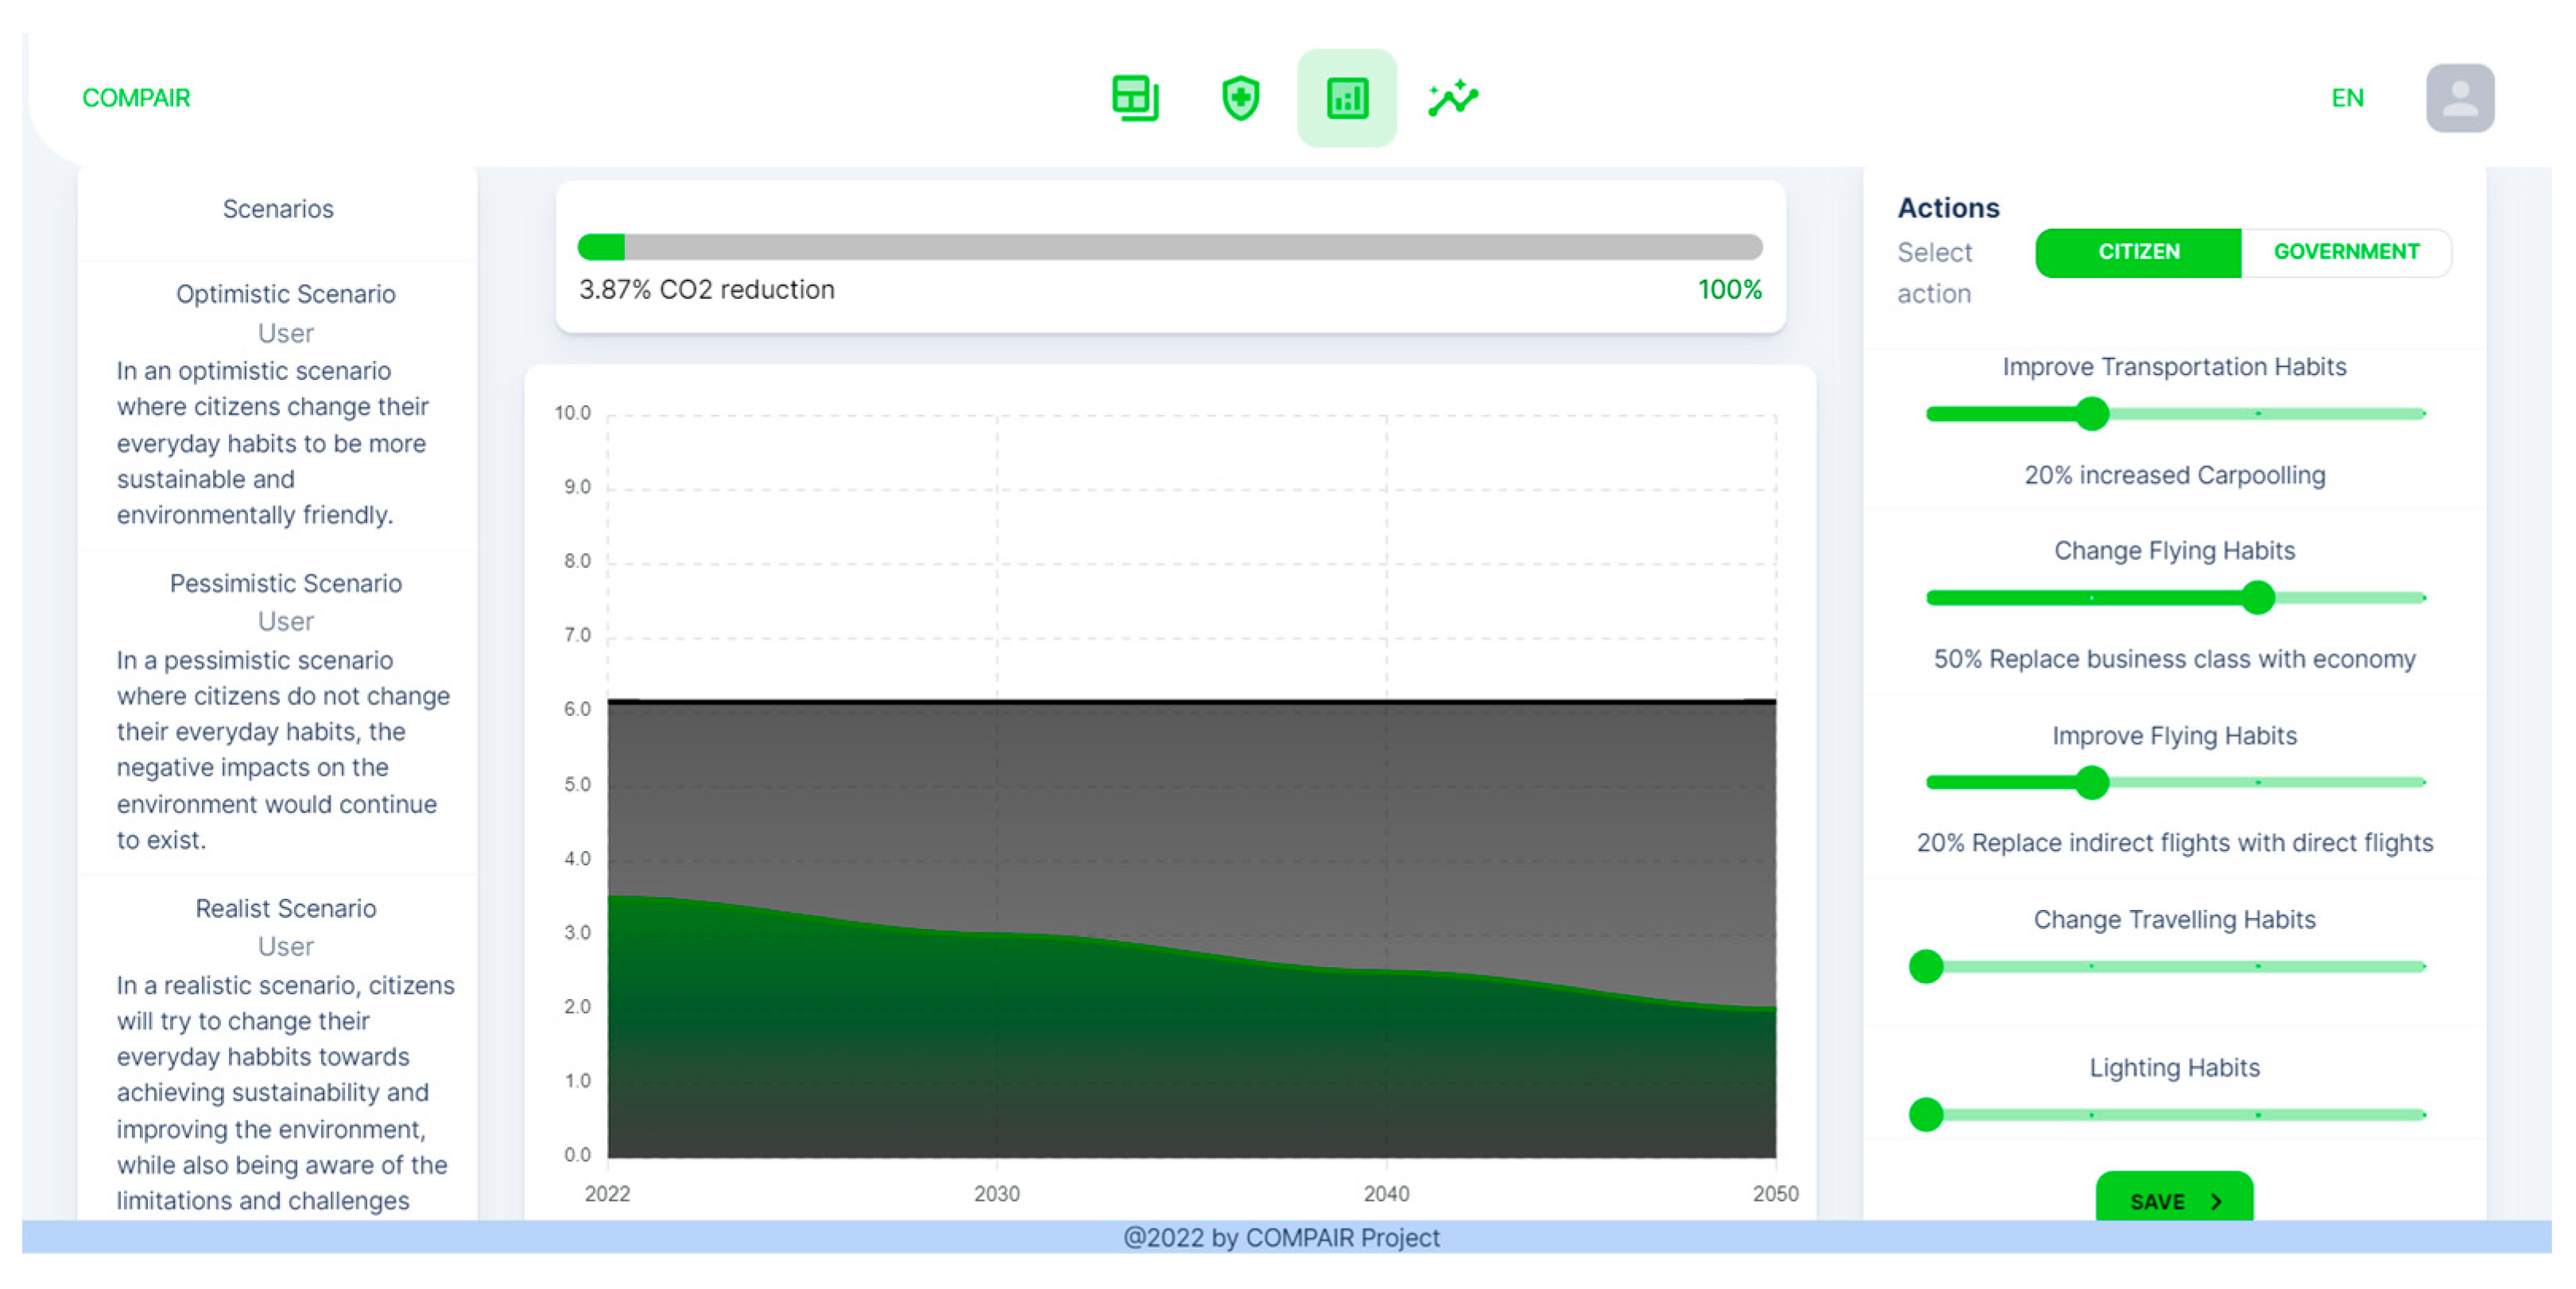
The Scenario Simulation Dashboard allows citizens to take part in policymaking. This tool offers a variety of actions that people are willing to do to reduce carbon emissions, as well as government actions they are open to accepting. Also, there are different levels available for each action, depending on how willing the users are to implement each action. By choosing the level they want to implement each action, the users can see the change in their carbon footprint displayed on a graph (
Figure 7). By selecting the actions, they are willing to adopt; citizens can create and submit their own customised scenarios. When a user’s scenario reaches the desired carbon footprint reduction, they can submit it. Also, there are some existing scenarios as examples, the Optimistic Scenario, the Pessimistic Scenario, and the Realistic Scenario.
These scenarios, as well as data collected through the first tool, the Carbon Footprint Calculator, will be available as anonymous data to policymakers and city officials, allowing them to gain a better understanding of citizens’ preferences and priorities and take them into consideration.
3.2.3. Profile Page
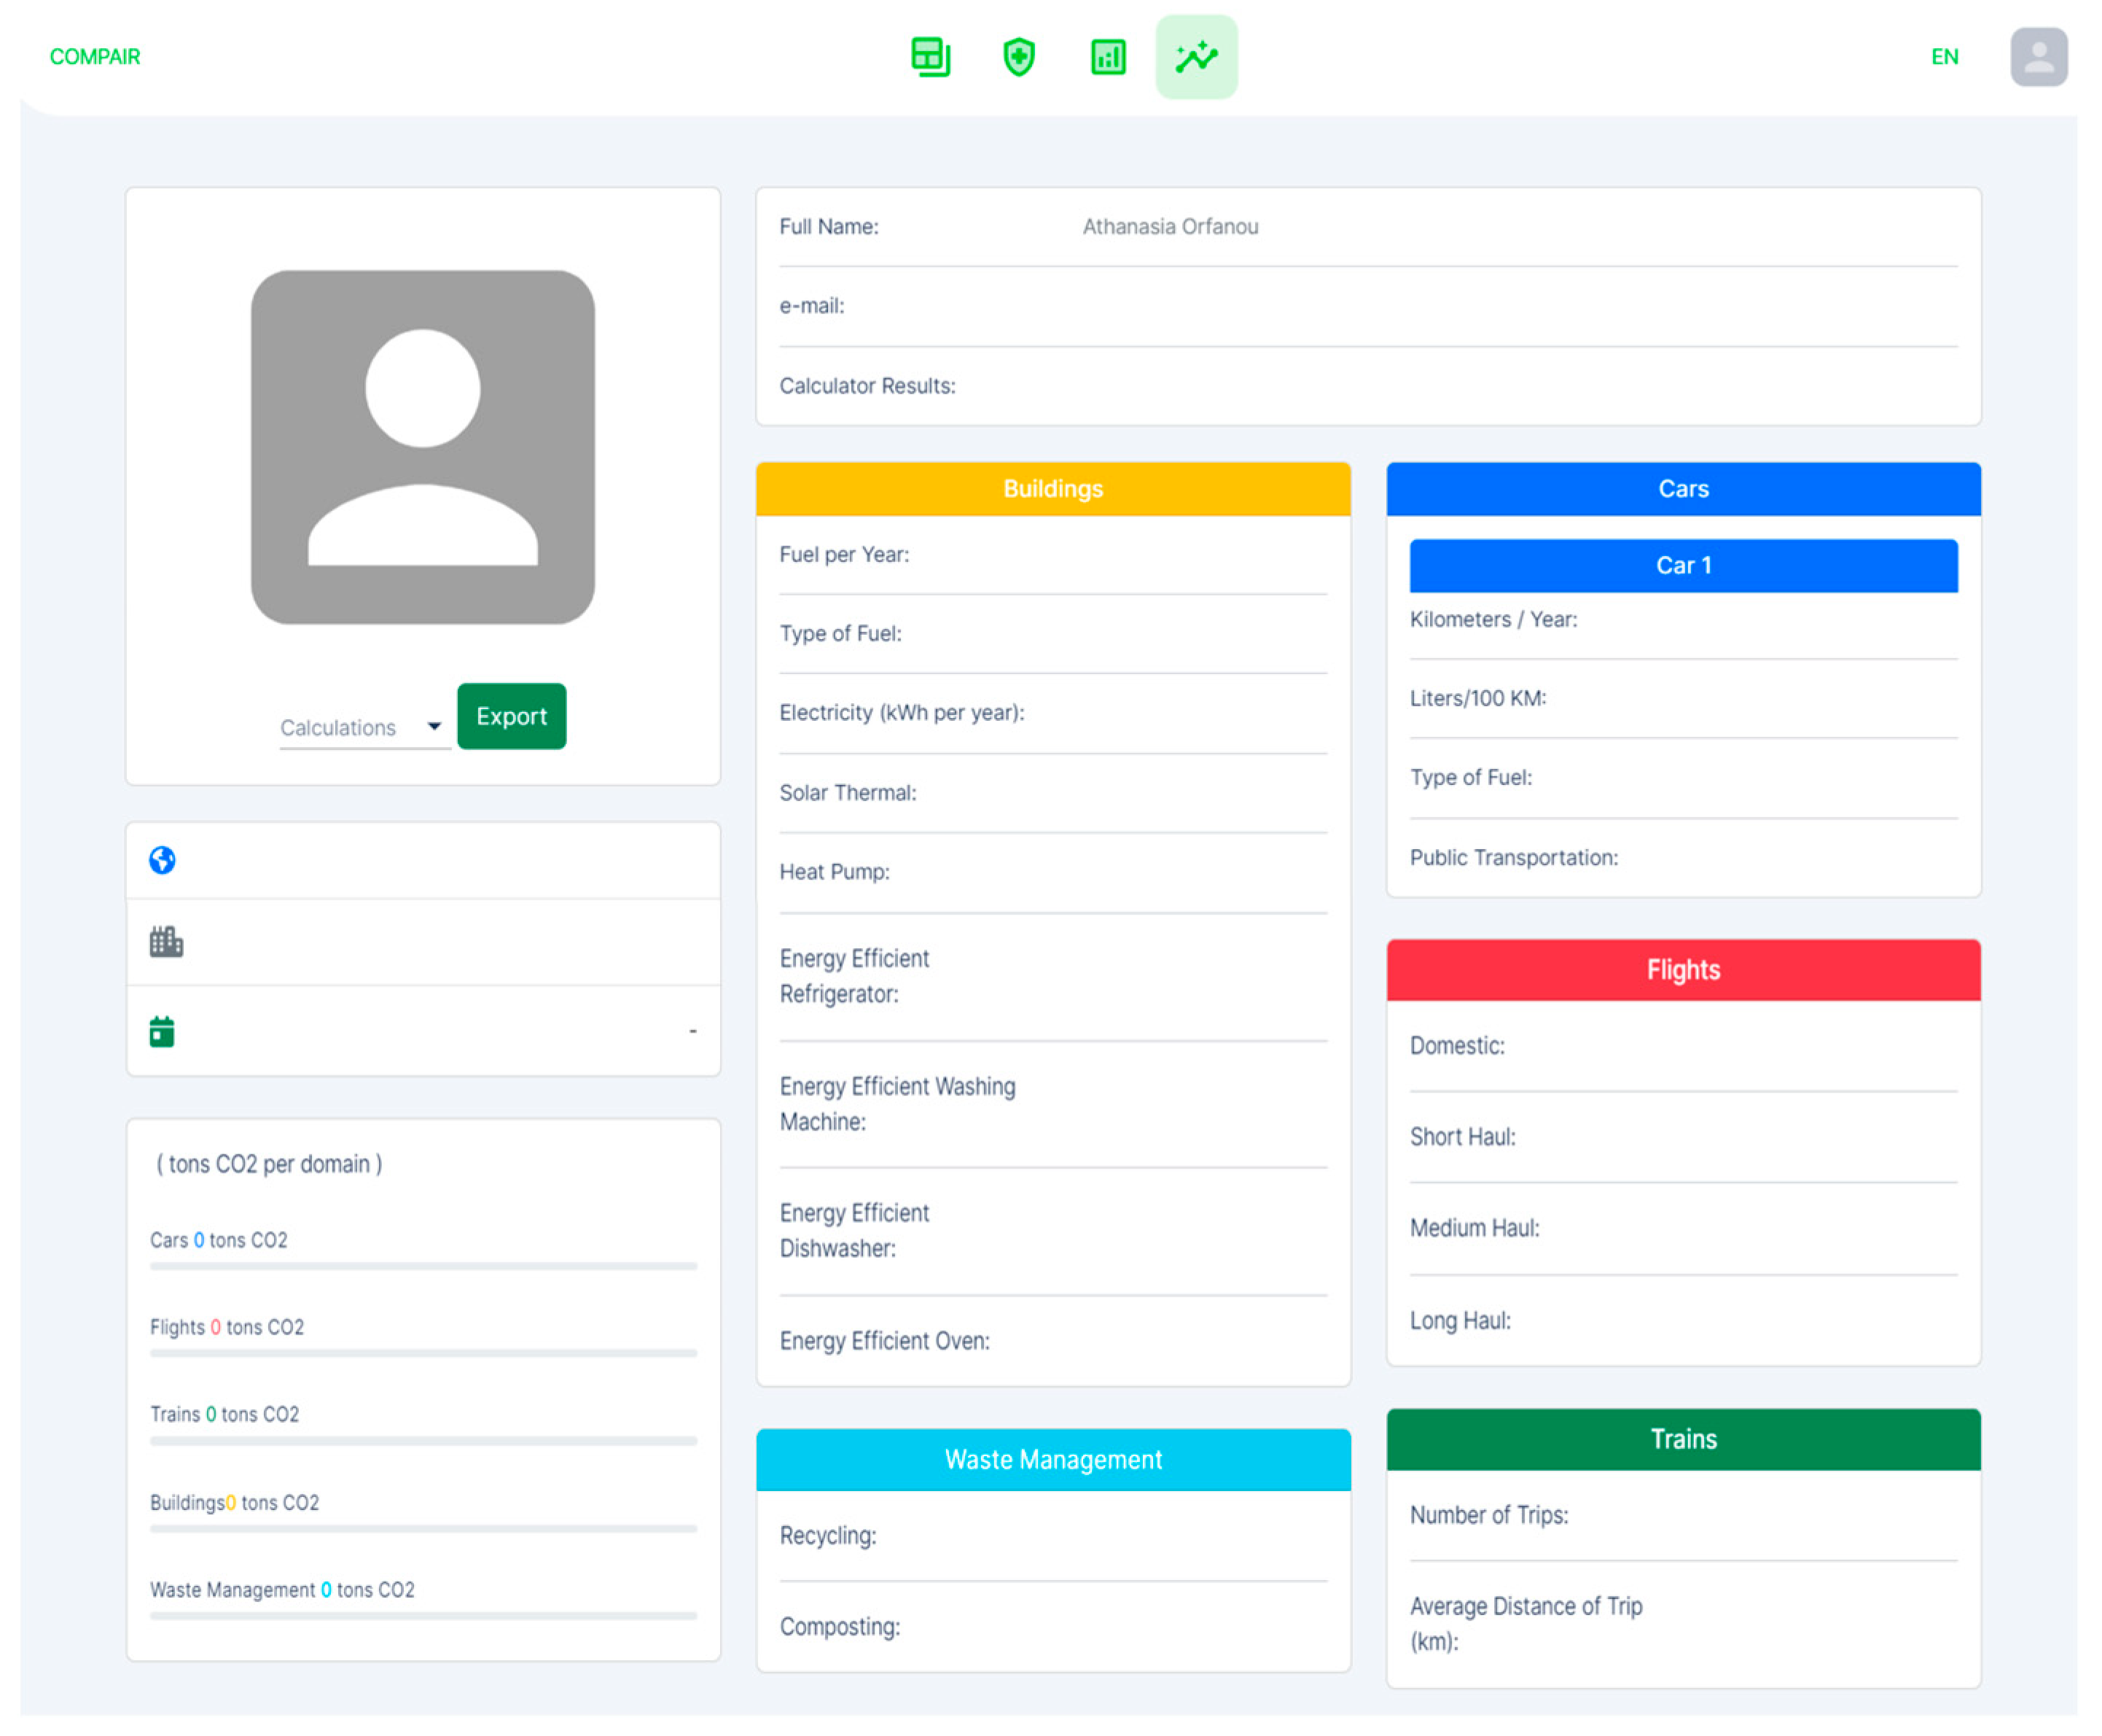
On the navigation menu of the Dashboard, there is also a fourth option, and by choosing it, the user is led to their Profile Page (
Figure 8). This profile page offers users access to the history of their results from the Carbon Footprint Calculator, including submitted results from the Scenario Simulation. The user could choose between calculations they want to browse from the dropdown menu that is available on the top left part of the screen.
Once the user chooses which calculation they want to browse, the data are presented on the rest of the screen and are distributed appropriately. Each carbon domain associated with the calculation is displayed within its own designated box, showcasing the user’s responses to each question. Users can also view the breakdown of their carbon footprint, as well as the comparison with the average carbon footprint of their country and the EU. Furthermore, users have the ability to browse the scenarios they have created using the Scenario Simulation. Similarly, there is a dropdown window that shows them their created scenarios.
A very significant feature of the Dashboard is that the recommendations, actions, and scenarios available on the Carbon Footprint Simulation Dashboard are not static. They can be managed by administrators of the Dashboard and, in the future, city officials and policymakers through an Admin Page. The purpose of this feature is to allow the tool to stay updated in the future.
3.2.4. Users Feedback
Several workshops have been taking place, organised from the pilot cities. The people that used the Carbon Footprint Simulation Dashboard have rated the content positively, emphasising aspects such as: (1) looks good and easy to navigate, (2) the availability to make comparisons of personal and national/global footprint, (3) the simplicity and relative transparency, clarity, and that it (4) provides progress, feedback, and recommendations or interventions at the end.
3.3. Scenarios for Waste Management
Next, to demonstrate the proper integration of waste management, two scenarios will be run with the calculator. In both scenarios, the same daily routines regarding transportation, travelling and buildings were chosen, with the only variation being the category of waste management.
In the first scenario, the option Less than average recycling—Less than average composting was selected to calculate the carbon footprint of the citizen who does not recycle and compost as a daily habit (
Figure 9).
In the second scenario, there was the intention to calculate the footprint of a citizen that includes recycling and composting almost every day in his life. That is why the option More than average recycling—More than average composting was chosen (
Figure 10).
From the comparison of the two cases, the proper integration of recycling and composting into the footprint resulting from waste management can be seen. For the citizen who recycles and composts less than average, the percentage is smaller (4.59%) than the one who recycles and composts more than average (6.97%). This approach does not reward the production of more waste but is reflecting the effects on the carbon footprint. This is also reflected in the recommendations in the field of waste management that encourage the reuse of products and the non-use of single-use products. Some examples are: ‘Consider circular products instead of single use’, ‘Consider shopping at a bulk foods store’, and ‘Consider using a reusable bag to the market’.
3.4. Future Work
Future work will focus on the integration of data derived from the use of the dashboard by citizens. From these data, it will be possible to compare the overall CO2 footprint of citizens for each pilot city, as these data are currently not available. This will highlight the difference in carbon footprint, depending on the different waste management practices in each pilot city. In addition, another future task will be to create relevant indicators for emissions from waste management. For example, emissions from landfills can be considered as “disposed CO2”, and those from recycling can be considered “circular CO2” on the grounds that in the future, the use of recycled material will reduce the footprint of subsequent products. In addition, the results will shape the formulation of scientific policy recommendations on proper waste management at a citizen as well as at a governmental level and how to handle scientific, ethical, and collaborative aspects of Citizen Science for policy making.
4. Conclusions
In conclusion, this present study has introduced the development of a Carbon Footprint Simulation Dashboard. This dashboard serves as a tool for evaluating citizens' carbon footprint and aims to gather the perspectives of citizens regarding the actions they’re ready to commit to meet policy goals. This feature provides an advantage when compared to the currently available carbon footprint displays.
Including citizen science in COMPAIR enriches public and private data on air quality and ensures that Citizen Science is a credible approach to addressing environmental issues. By using Compairs’ Carbon Footprint Simulation Dashboard, citizens can gain insights into the environmental sustainability of different modes of transportation (such as air travel, train travel, and car usage) and their daily habits within their households. More specifically, this study sheds light on the considerable impact of heating buildings and the related energy consumption, which contributes to nearly half of the overall CO2 emissions. Moreover, the study underscores the essential role of transportation as a significant parameter influencing carbon emissions.
Furthermore, the study reveals an intriguing correlation between the carbon footprint and the municipal waste disposal behaviours of citizens. Of particular interest is the outcome derived from the advanced recycling and composting scenario, where waste management practices were found to account for a noteworthy portion—up to 7%—of CO2 emissions. In addition, the integration of recycling, composting, and energy recovery into the carbon footprint derived from waste management is achieved effectively, as demonstrated by the two scenarios that were run. This integration, combined with the recommendations, will help promote sustainable waste management practices and reduce the environmental impact on the citizens.
Moreover, the development of the Scenario Simulation Dashboard, a tool designed to calculate the potential reduction in carbon footprint, is presented. This reduction is based upon citizens’ behaviour changes in their daily activities and on government actions accepted by citizens. The Scenario Simulation Dashboard empowers citizens to participate in policy-making processes by allowing them to choose actions they are willing to make and actions they expect the government to undertake to reduce their environmental impact. This level of involvement and decision-making can motivate citizens to adopt more environmentally friendly behaviour.
To sum up, this study introduces a novel Carbon Footprint Simulation Dashboard to examine the CO2 emissions related to several waste management scenarios and associated citizen behaviours. The outcomes elucidate the substantial energy consumption related to housing and transportation, as well as the importance of behavioural choices in shaping the overall carbon emissions landscape.


 ,
, 


