2.1. Test Rig Design and Construction
The construction of a suitable apparatus for investigating the hydrodynamic response of the Double L-Valve under cold conditions required the design of the following three different subsystems:
A piping system of granular material;
A pneumatic system of inlet air;
An electronic system of measuring instruments.
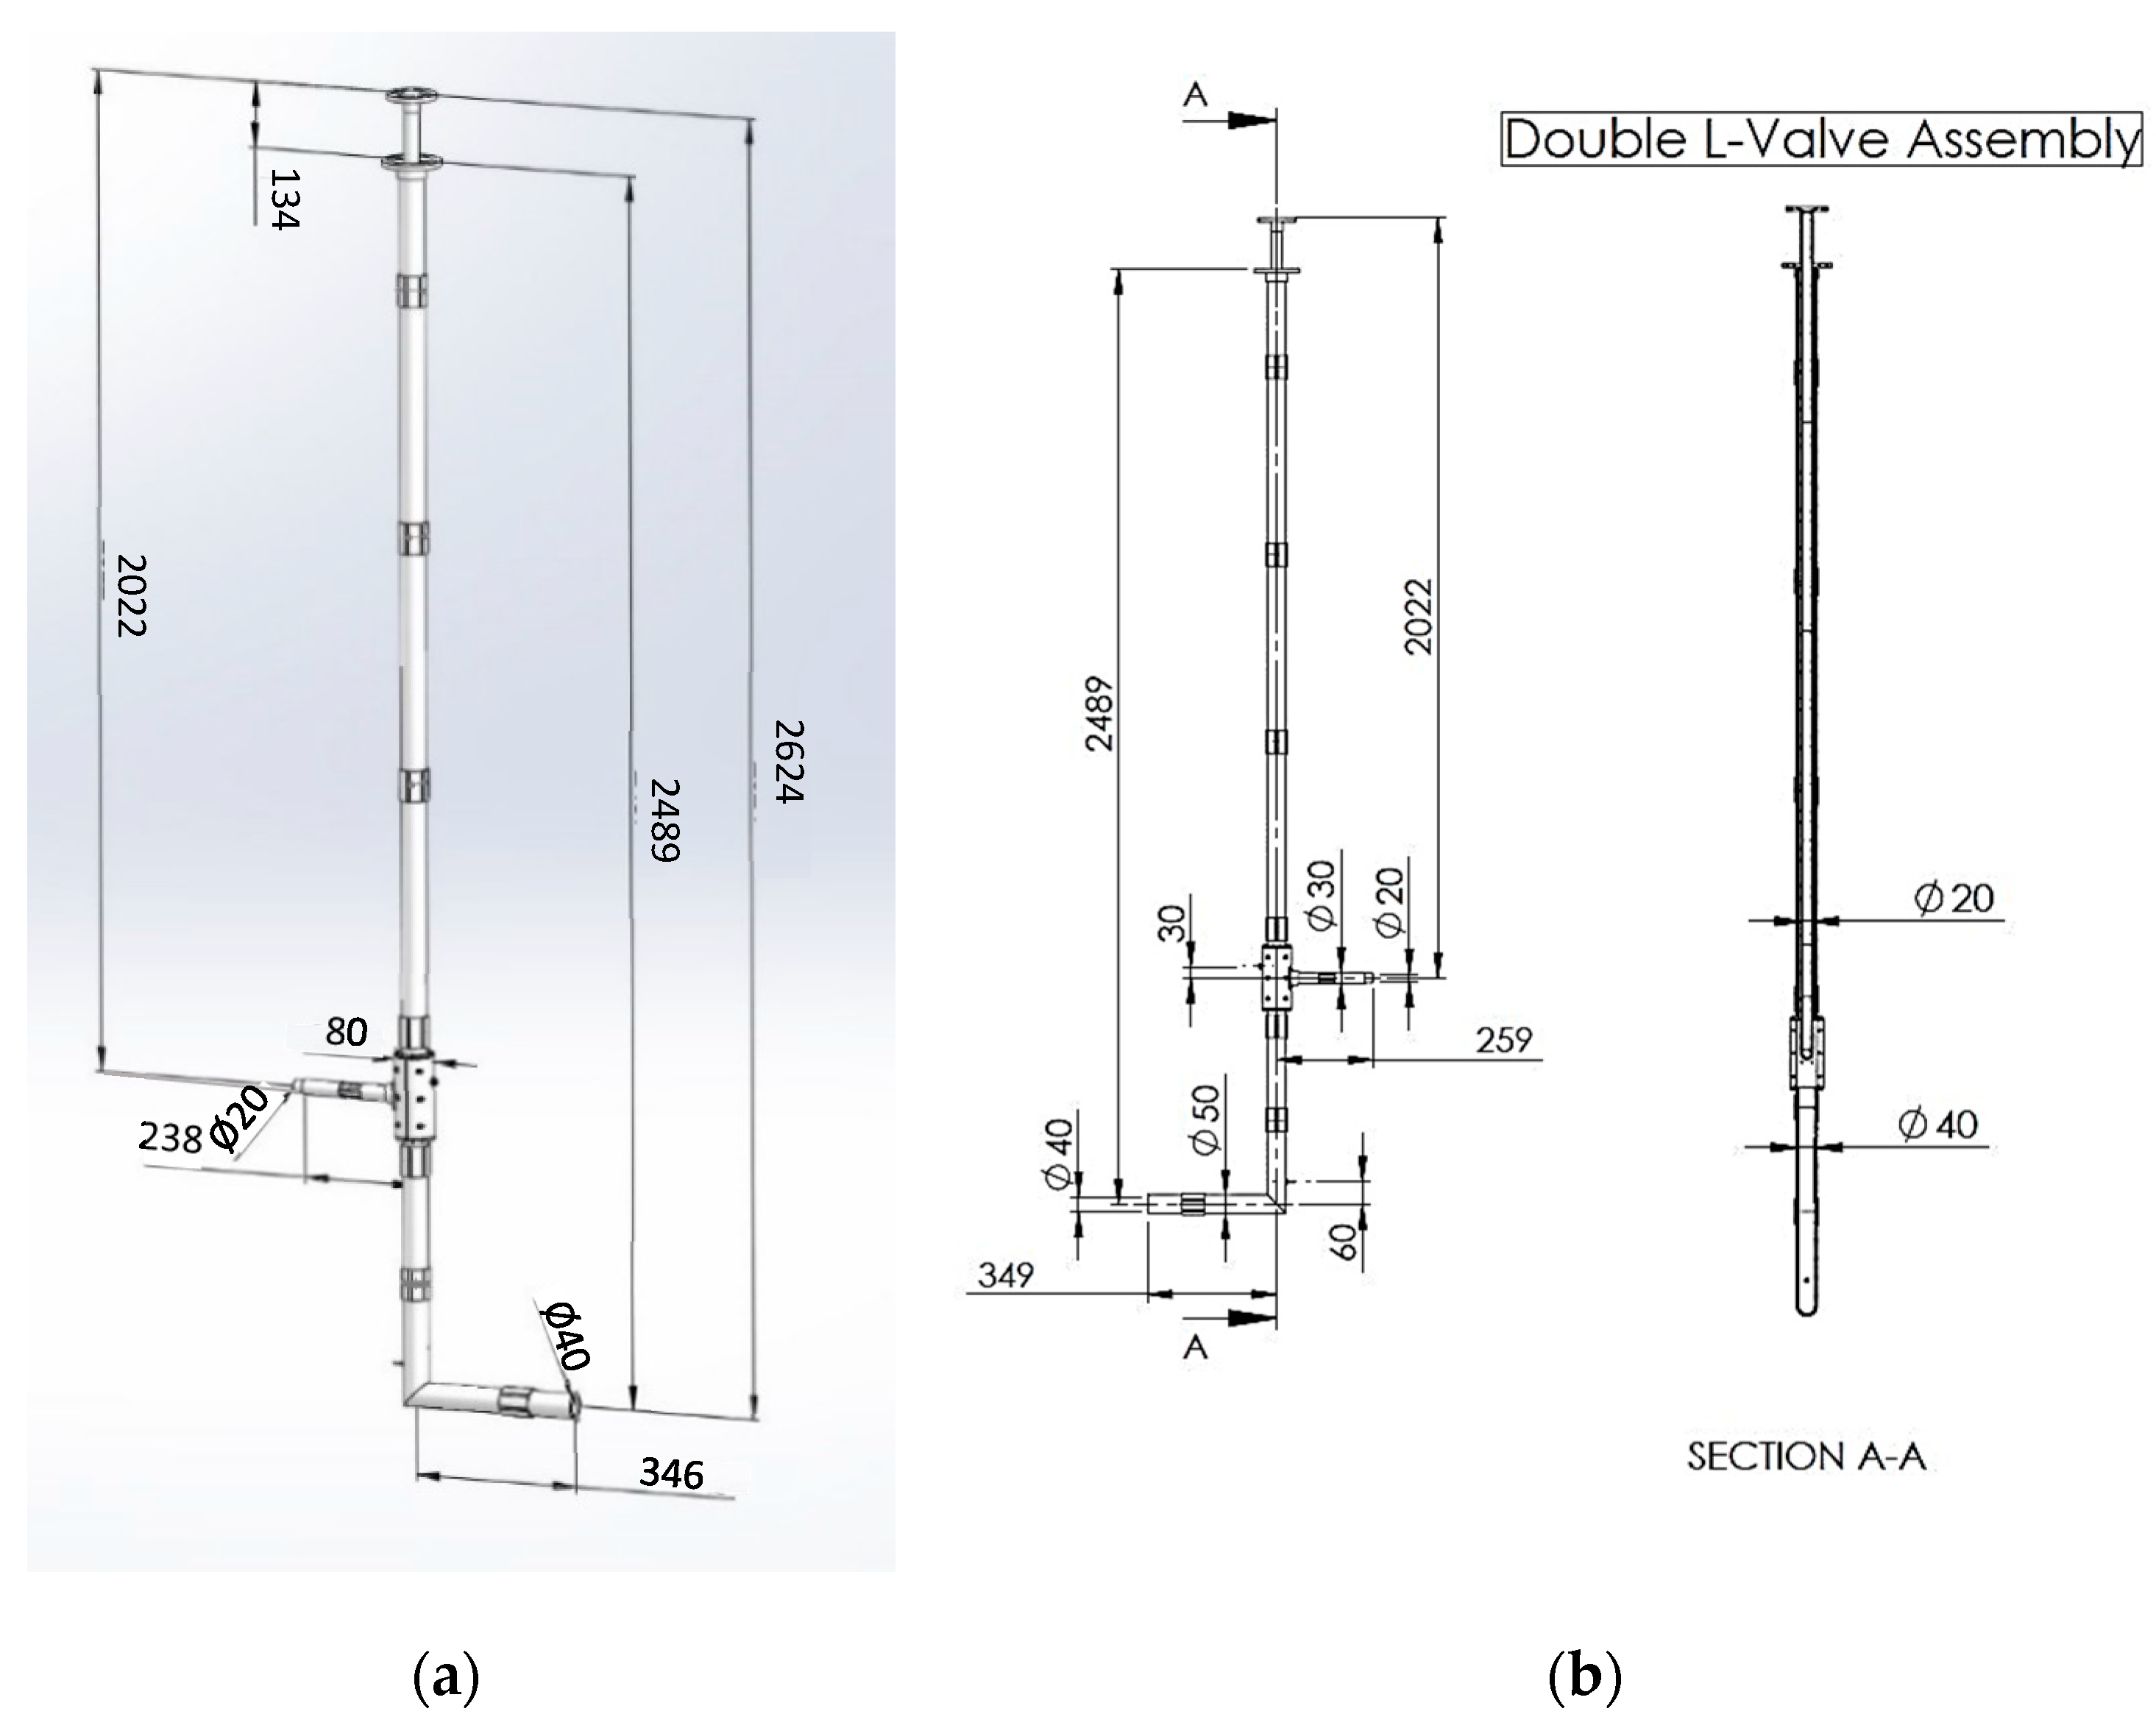
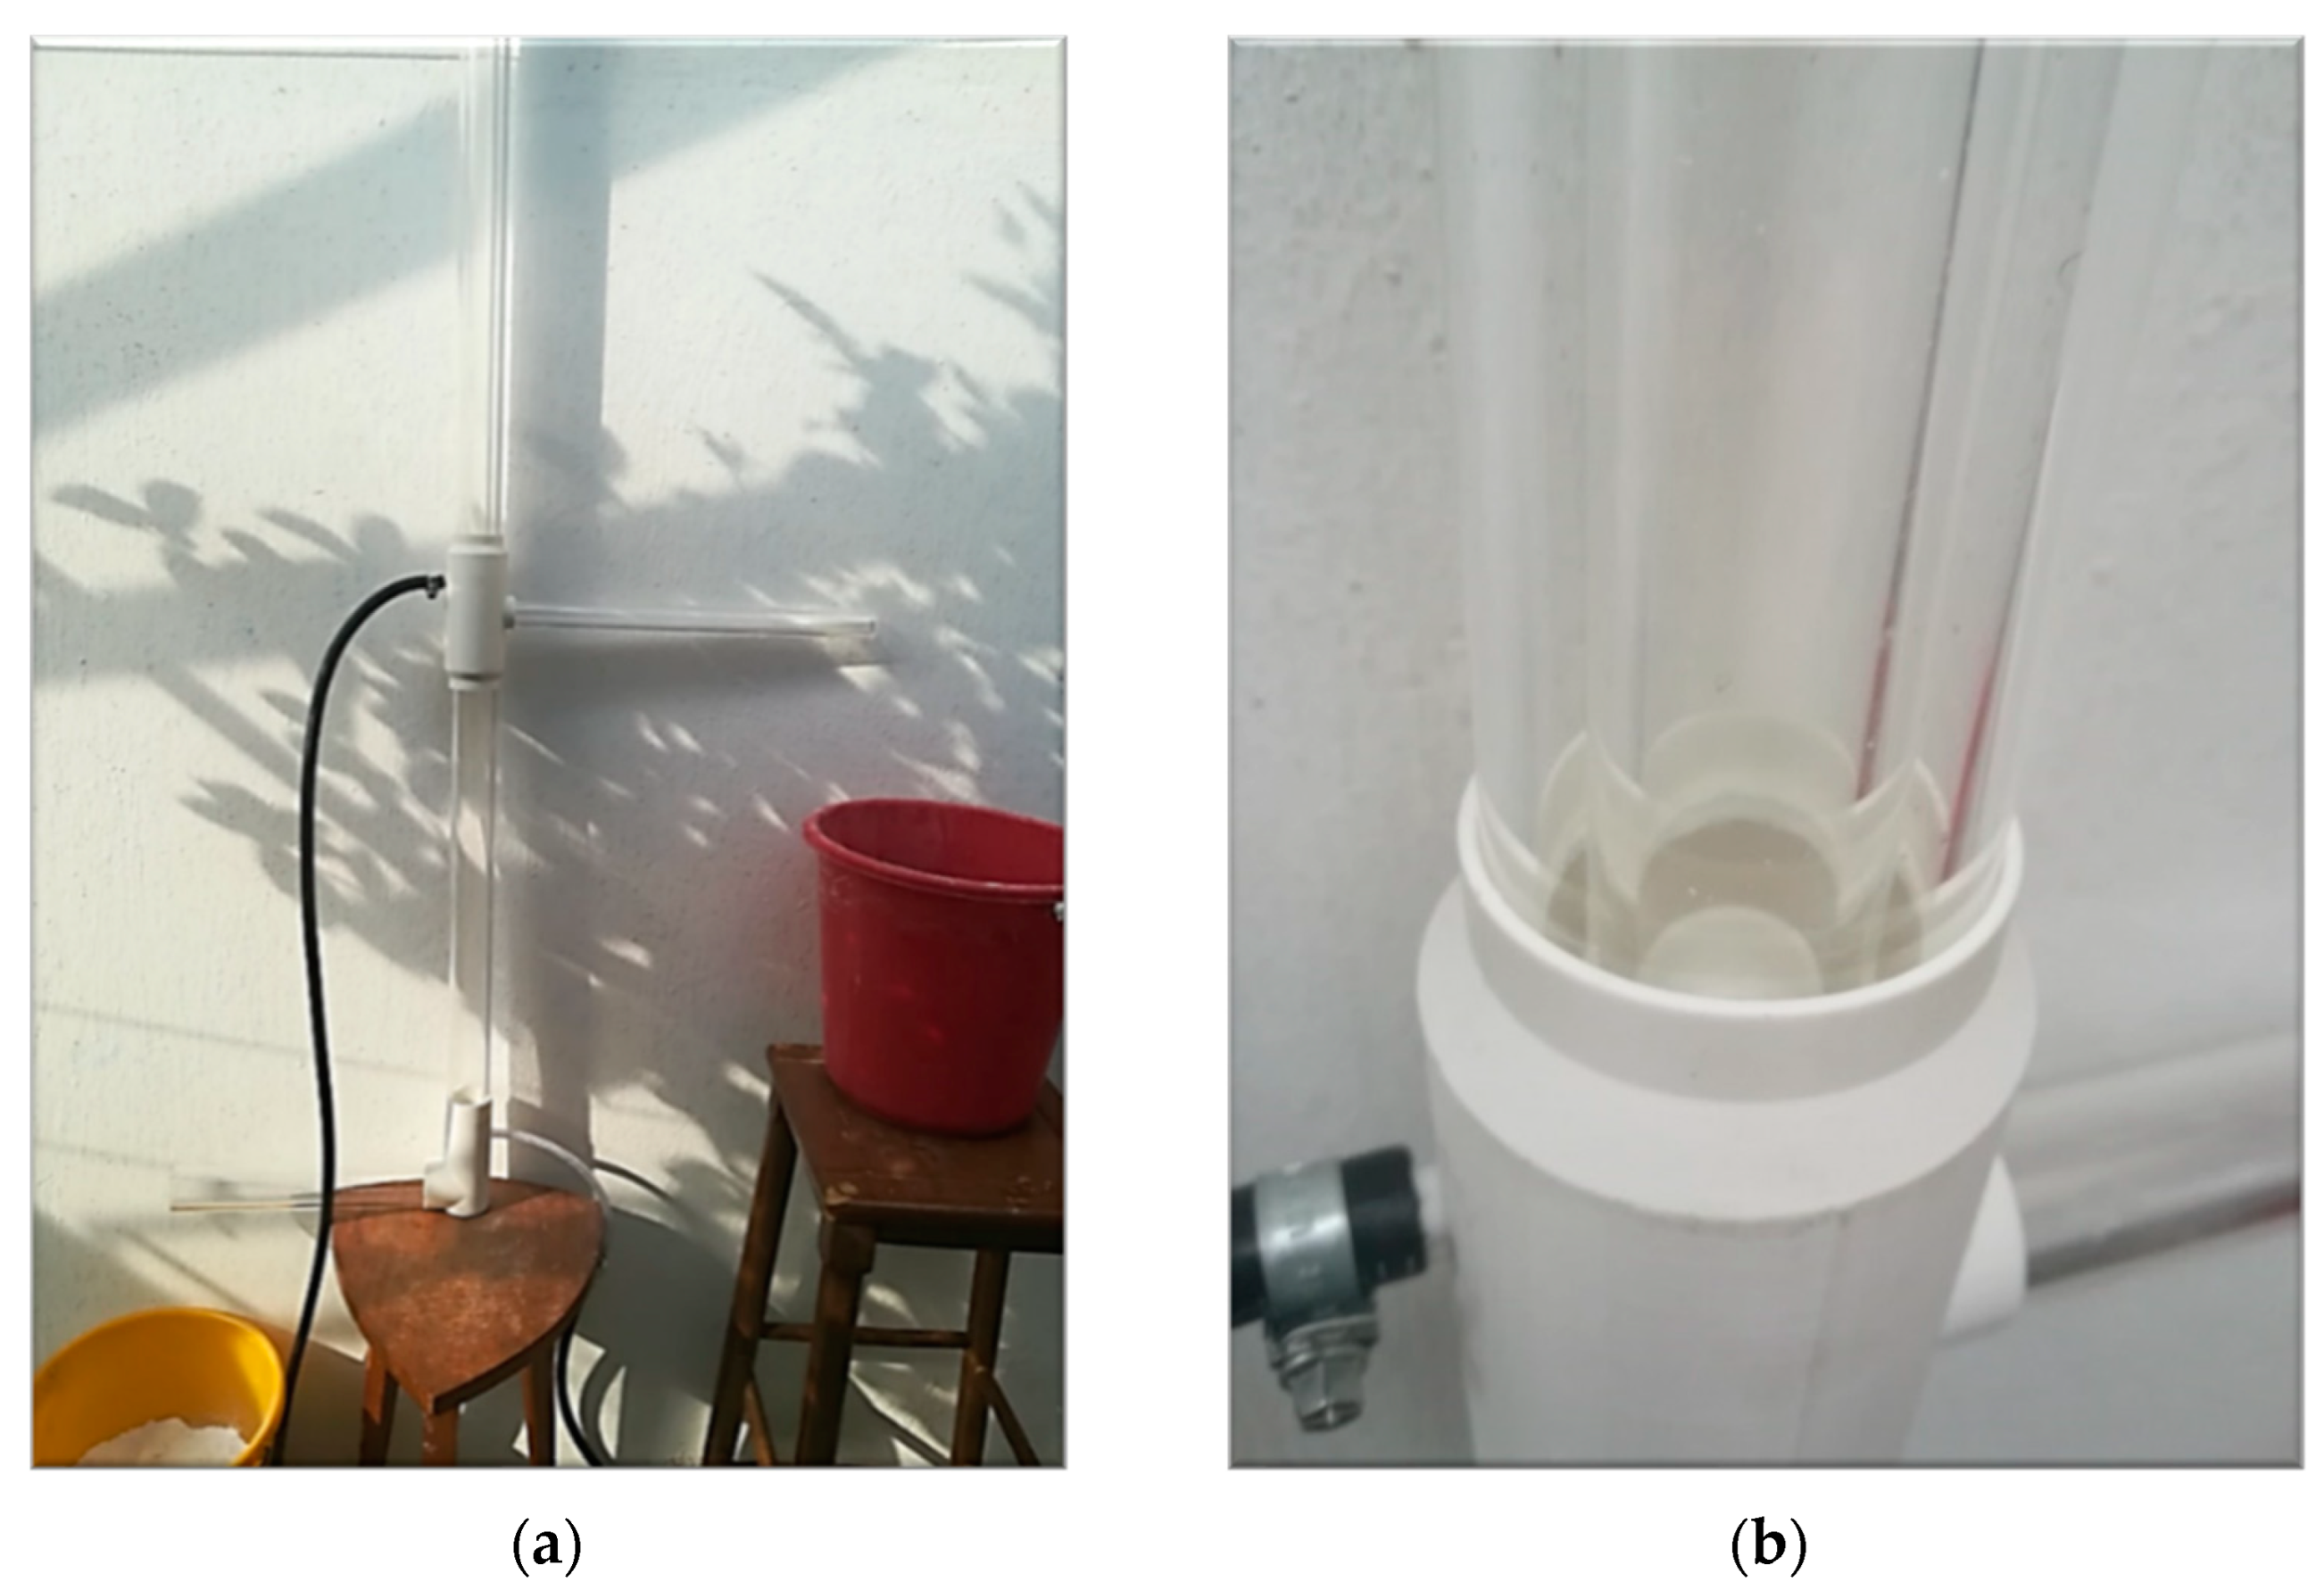
The piping system for the circulation of the granular material has the geometry of the Double L-Valve, and it consists of transparent Plexiglass tubes and appropriate sealed fittings. The system was designed as shown in
Figure 3a,b and constructed as
Figure 4 presents. The system was designed to be transparent, allowing the flow of granular material to be visually observed. It was also designed to be inexpensive, enabling the testing of various L-Valve diameters that can be purchased and evaluated. Moreover, the system is modular, facilitating the testing of different arrangements by easily changing the length of the horizontal and vertical tubes.
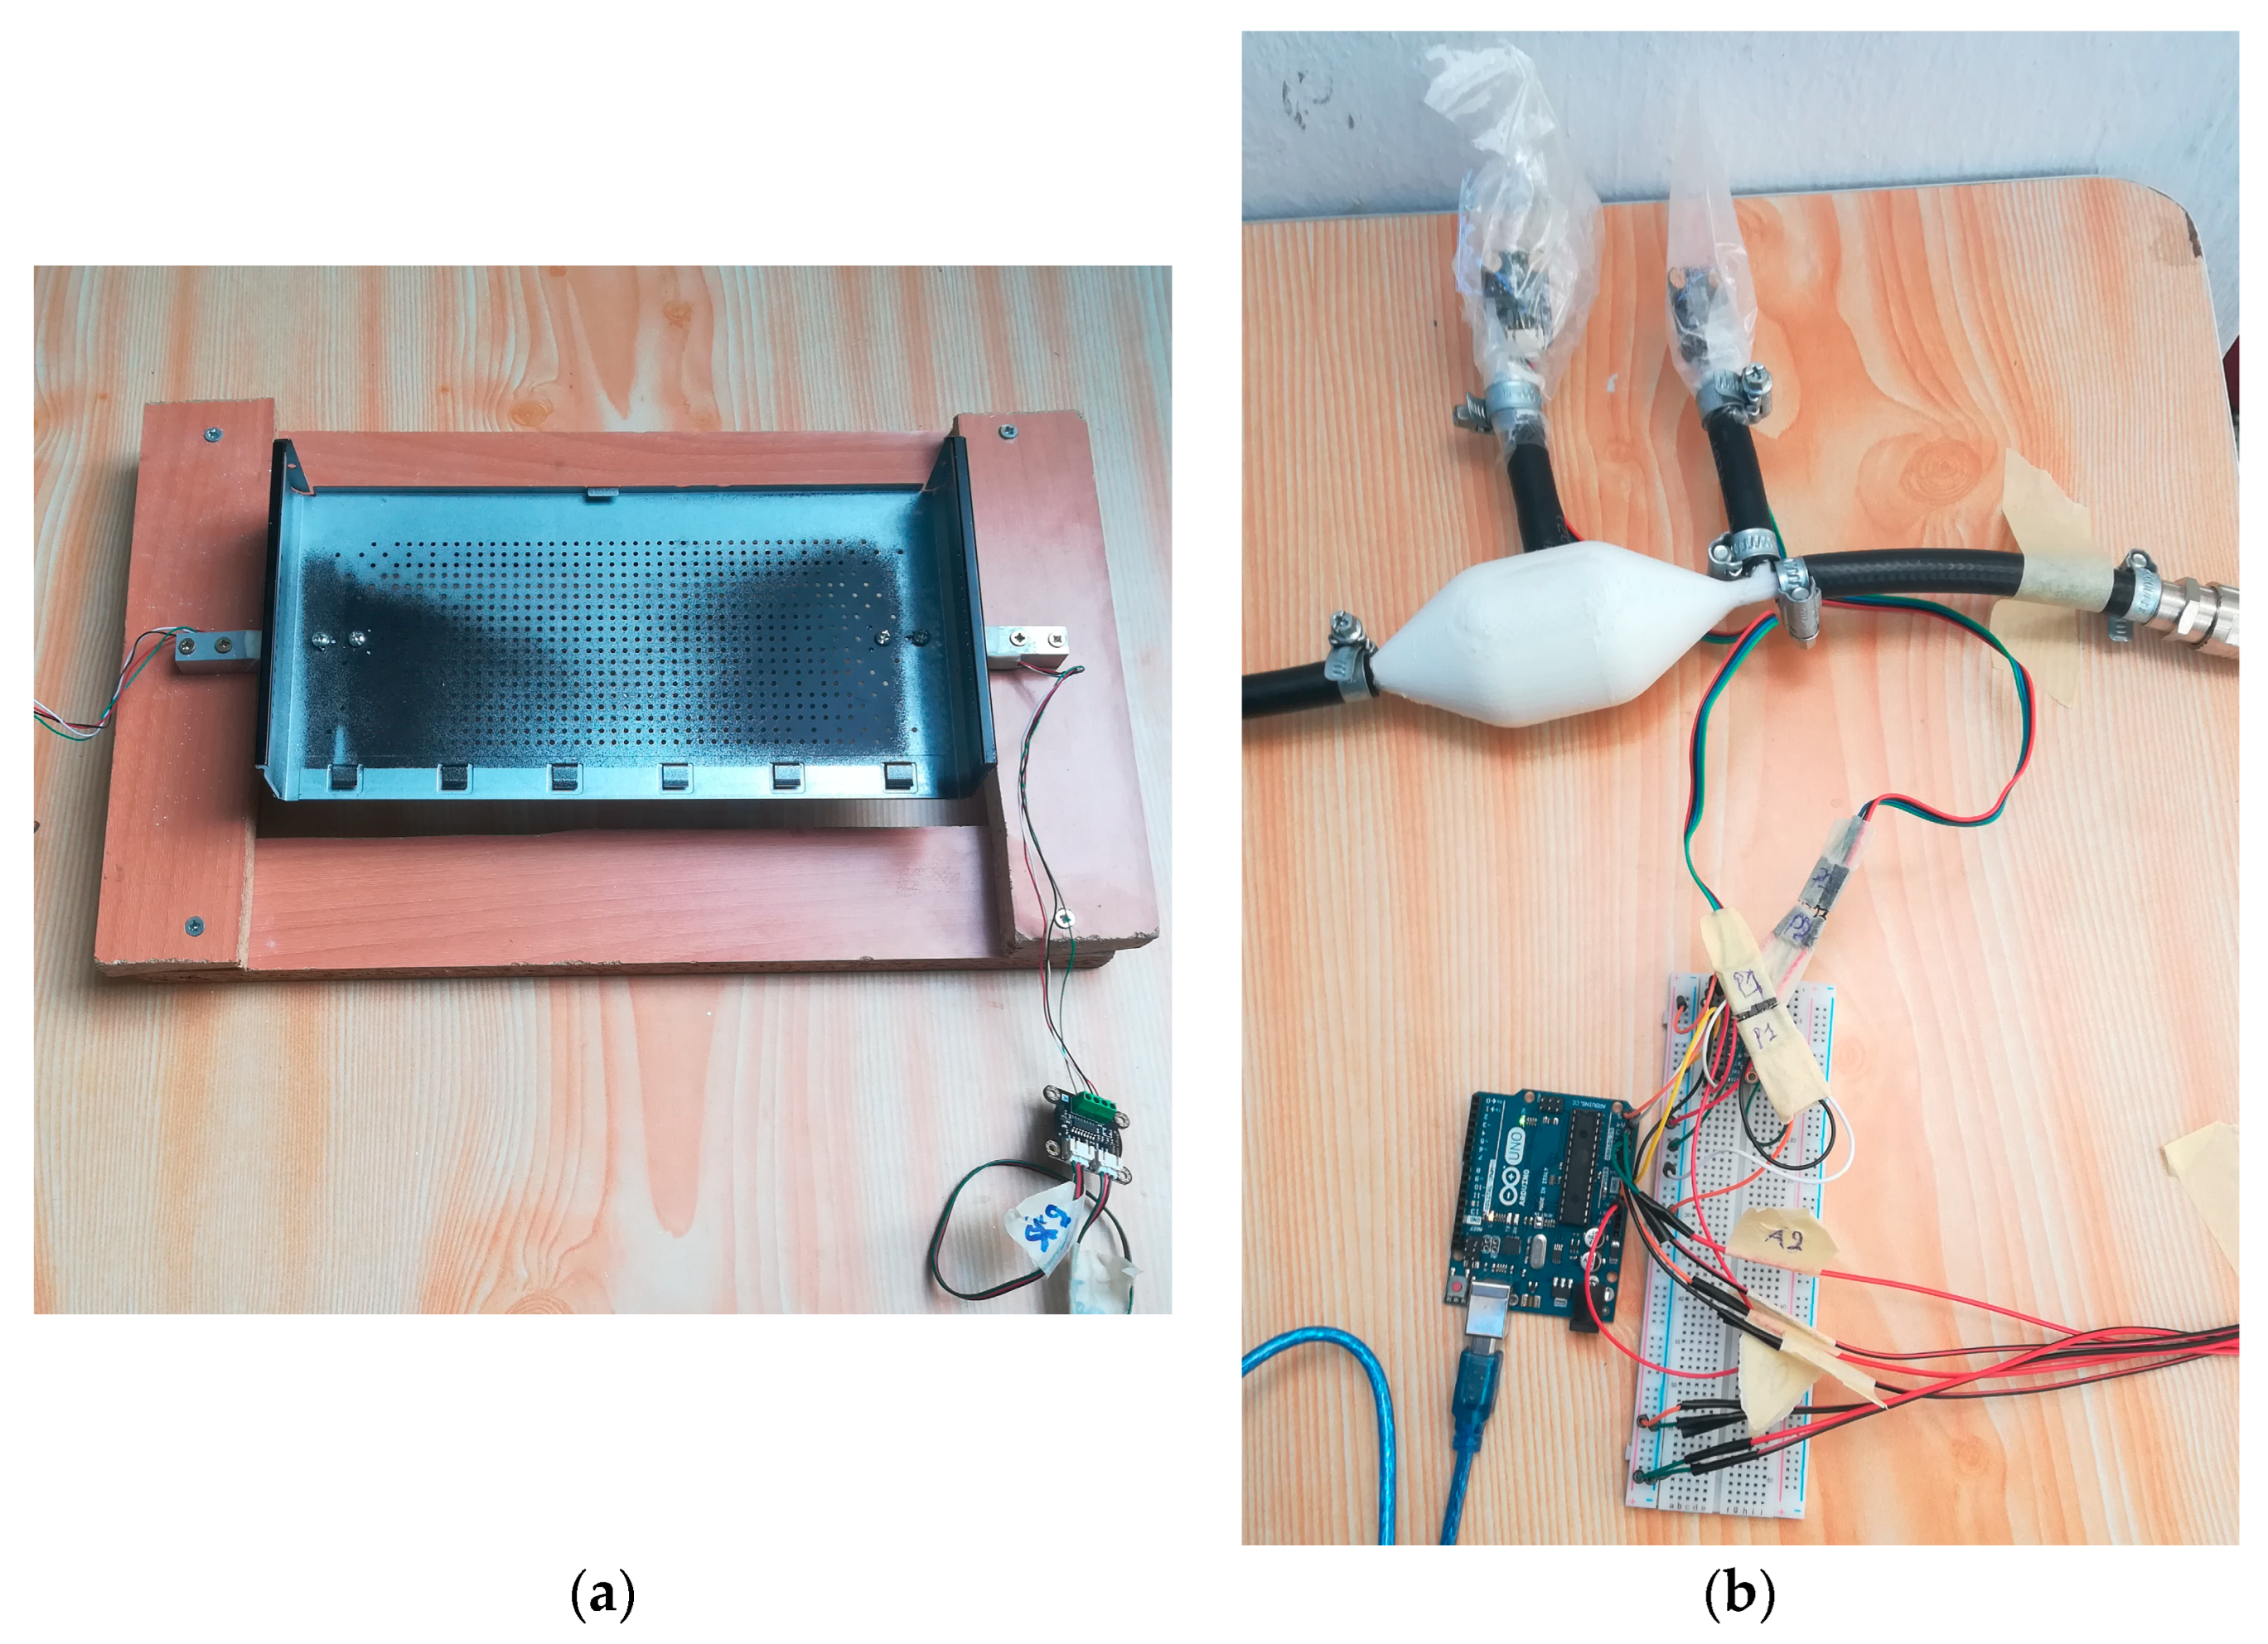
The pneumatic system of air supply at the inlets of the Double L-Valve consists of an air compressor and the air piping system from plastic pipes and fittings. The electronic system for the measurement of the airflow rate and the granular mass flux at the outlet of the cold model, consists of two custom measuring devices, their wiring system, one Arduino board and a computer. The weighing device (
Figure 5a) has a wooden frame and a metal surface to place the weight, which is connected to the frame by two load cells capable of measuring up to 10 kg each. Therefore, the total load capacity of the weighing device is 20 kg, and its accuracy is 1 g. On the metallic surface of the weighing device a container is placed into which the outgoing granular material falls. Using the weighing sensors, the increase in the weight of the sand as a function of time is recorded.
To accomplish the measurement of the airflow rate, another custom device was constructed, which consists of a 3D-printed venturi tube and two pressure–temperature sensors placed at the two cross sections of the venturi tube. More specifically, the sensors are “BMP388” by DFRobot based at Zhangjiang Hi-Tech Park, Shanghai, China and can measure both the temperature and the static pressure at a given point. Hence, by measuring the static pressure at the greater and the smaller cross section of the venturi, the volumetric airflow can be obtained by Equation (1):
The set-up of the venturi tube and the sensors is presented in
Figure 5b. All the sensors are connected to an Arduino board, and all the measurements are saved to a computer. The loadcells are connected to the analog pins of the Arduino. This is also the case for the pressure sensors; however, they use the I2C protocol, so the use of a multiplexer was necessary in order to address every sensor separately. All the sensors are carefully calibrated and programmed in the Arduino environment.
2.2. Experimental Results
The hydrodynamic response of the system was studied by simultaneously measuring the airflow and the granular mass flux. Several experiments were made under different airflow rates and different Double L-Valve designs, as shown in
Table 1. More specifically, the lengths of the horizontal tube parts tested were 20 cm, 30 cm and 40 cm. Several experiments were conducted on the internal L-Valve for different aeration rates, for every design, and the mass flux at the weighing device is measured. In
Figure 6a,b the raw data set of an indicative experiment is presented.
Figure 6a presents the airflow rate, while
Figure 6b presents the granular mass increase at the weighing device as a function of time. Every experiment has the same initial conditions for the consistency of the experimental data. Initially, the vertical tube is always filled with granular material, while the horizontal tube is always empty, in order to avoid the stick-slip effect of the granules in the horizontal tube at the beginning of every experiment. At the beginning, it can be observed that the airflow is negligible, and hence, there is no mass flux. When the airflow increases, the granular material starts to drop inside the weighing device until the inner tube is empty. From a practical point of view, it was not possible to ensure a continuous mass supply at the inlet of the vertical tube consistently. Therefore, it was decided to not add a new amount of granular material during the experiment, thus introducing randomness in each experiment, so that we could compare the experimental data.
During the hydrodynamic tests, a steady state is not attained because the mass leaving the L-Valve is not replenished at the inlet of the L-Valve. Nevertheless, the height of the granular material is calculated every moment, representing the equivalent height of the vertical tube at that specific time. With this consideration, the experimental data are used to develop a novel methodology that provides initial estimations. The experimental conditions described above do not exactly match real conditions of carbonate cycles, in which there are interconnected reactors under hot state. For each specific plant and L-Valve design configuration, the particles flow rate should be determined by the parameters of fluidization in the reactors, using other type of numerical tools or experimental data, which can also account for the capture efficiency of cyclones. The goal of the current work was to conduct a parametric investigation using indicative conditions, in order to estimate the required power for granular circulation utilizing only the main geometrical parameters of the L-Valve.
Prior studies have successfully formulated mathematically physical relationships in L-Valves, i.e., between the airflow rate and the flow of granular material [
29]. The goal of this work is to construct a reduced scale-up model in order to provide easily insight and preliminary rough estimations about the energy consumption of the system during operation in industrial-scale models. Thus, instead of re-exploring the physical relationships in L-Valves with highly complex models, the following methodology has been developed based on a simple energy method.
The following equations are applicable for a Newtonian fluid. For a given air flow (
Q), the mass flow (
) on the weighing device is measured. From the
, the Reynolds number of the flow is calculated depending on the viscosity of the granular.
where
is the equivalent viscosity of the granular flow, and
is the hydraulic diameter of the tube and the area of the tube’s cross section.
From the Reynolds number, using the Jain formula, the coefficient λ, which determines the pressure drop in the pipes, is calculated. For laminar flow, we can use the following expression:
Given the
λ coefficient, the linear losses at the horizontal tube,
, are calculated depending on its length and diameter. Hence, using Equation (4), the pressure drop
is calculated.
where the velocity
of the granular medium is calculated as:
where
ρ is the apparent density of the granular material,
is the hydraulic diameter of the tube, and
is the area of the tube’s cross section.
Thus, the theoretical required power from the compressor is equal to:
Measuring the actual mass flux from every experiment, it is possible to calculate the theoretical required power supply from the air compressor using Equations (2)–(6)
. In reality, however, the working medium is a granular material. That means that a fraction of the supplied airflow is passing through the porosity of the packed granular without transferring energy to it. The real power of the aeration at every experiment is calculated by Equation (7) at the narrow part of the venturi tube, where the total pressure (
) is given by Equation (8).
where
P is the measured static pressure at the point, and
Q is the calculated airflow.
It has been observed that the measured power of air supply (
from the compressor is greater than the calculated power
for the equivalent Newtonian fluid, since in the case of the granular material, there are additional power losses exerted, due to its porosity. Hence, it is necessary for a hydrodynamic effectiveness
to be introduced by Formula (9), which will be used as a correction factor to model the granular material as a Newtonian fluid.
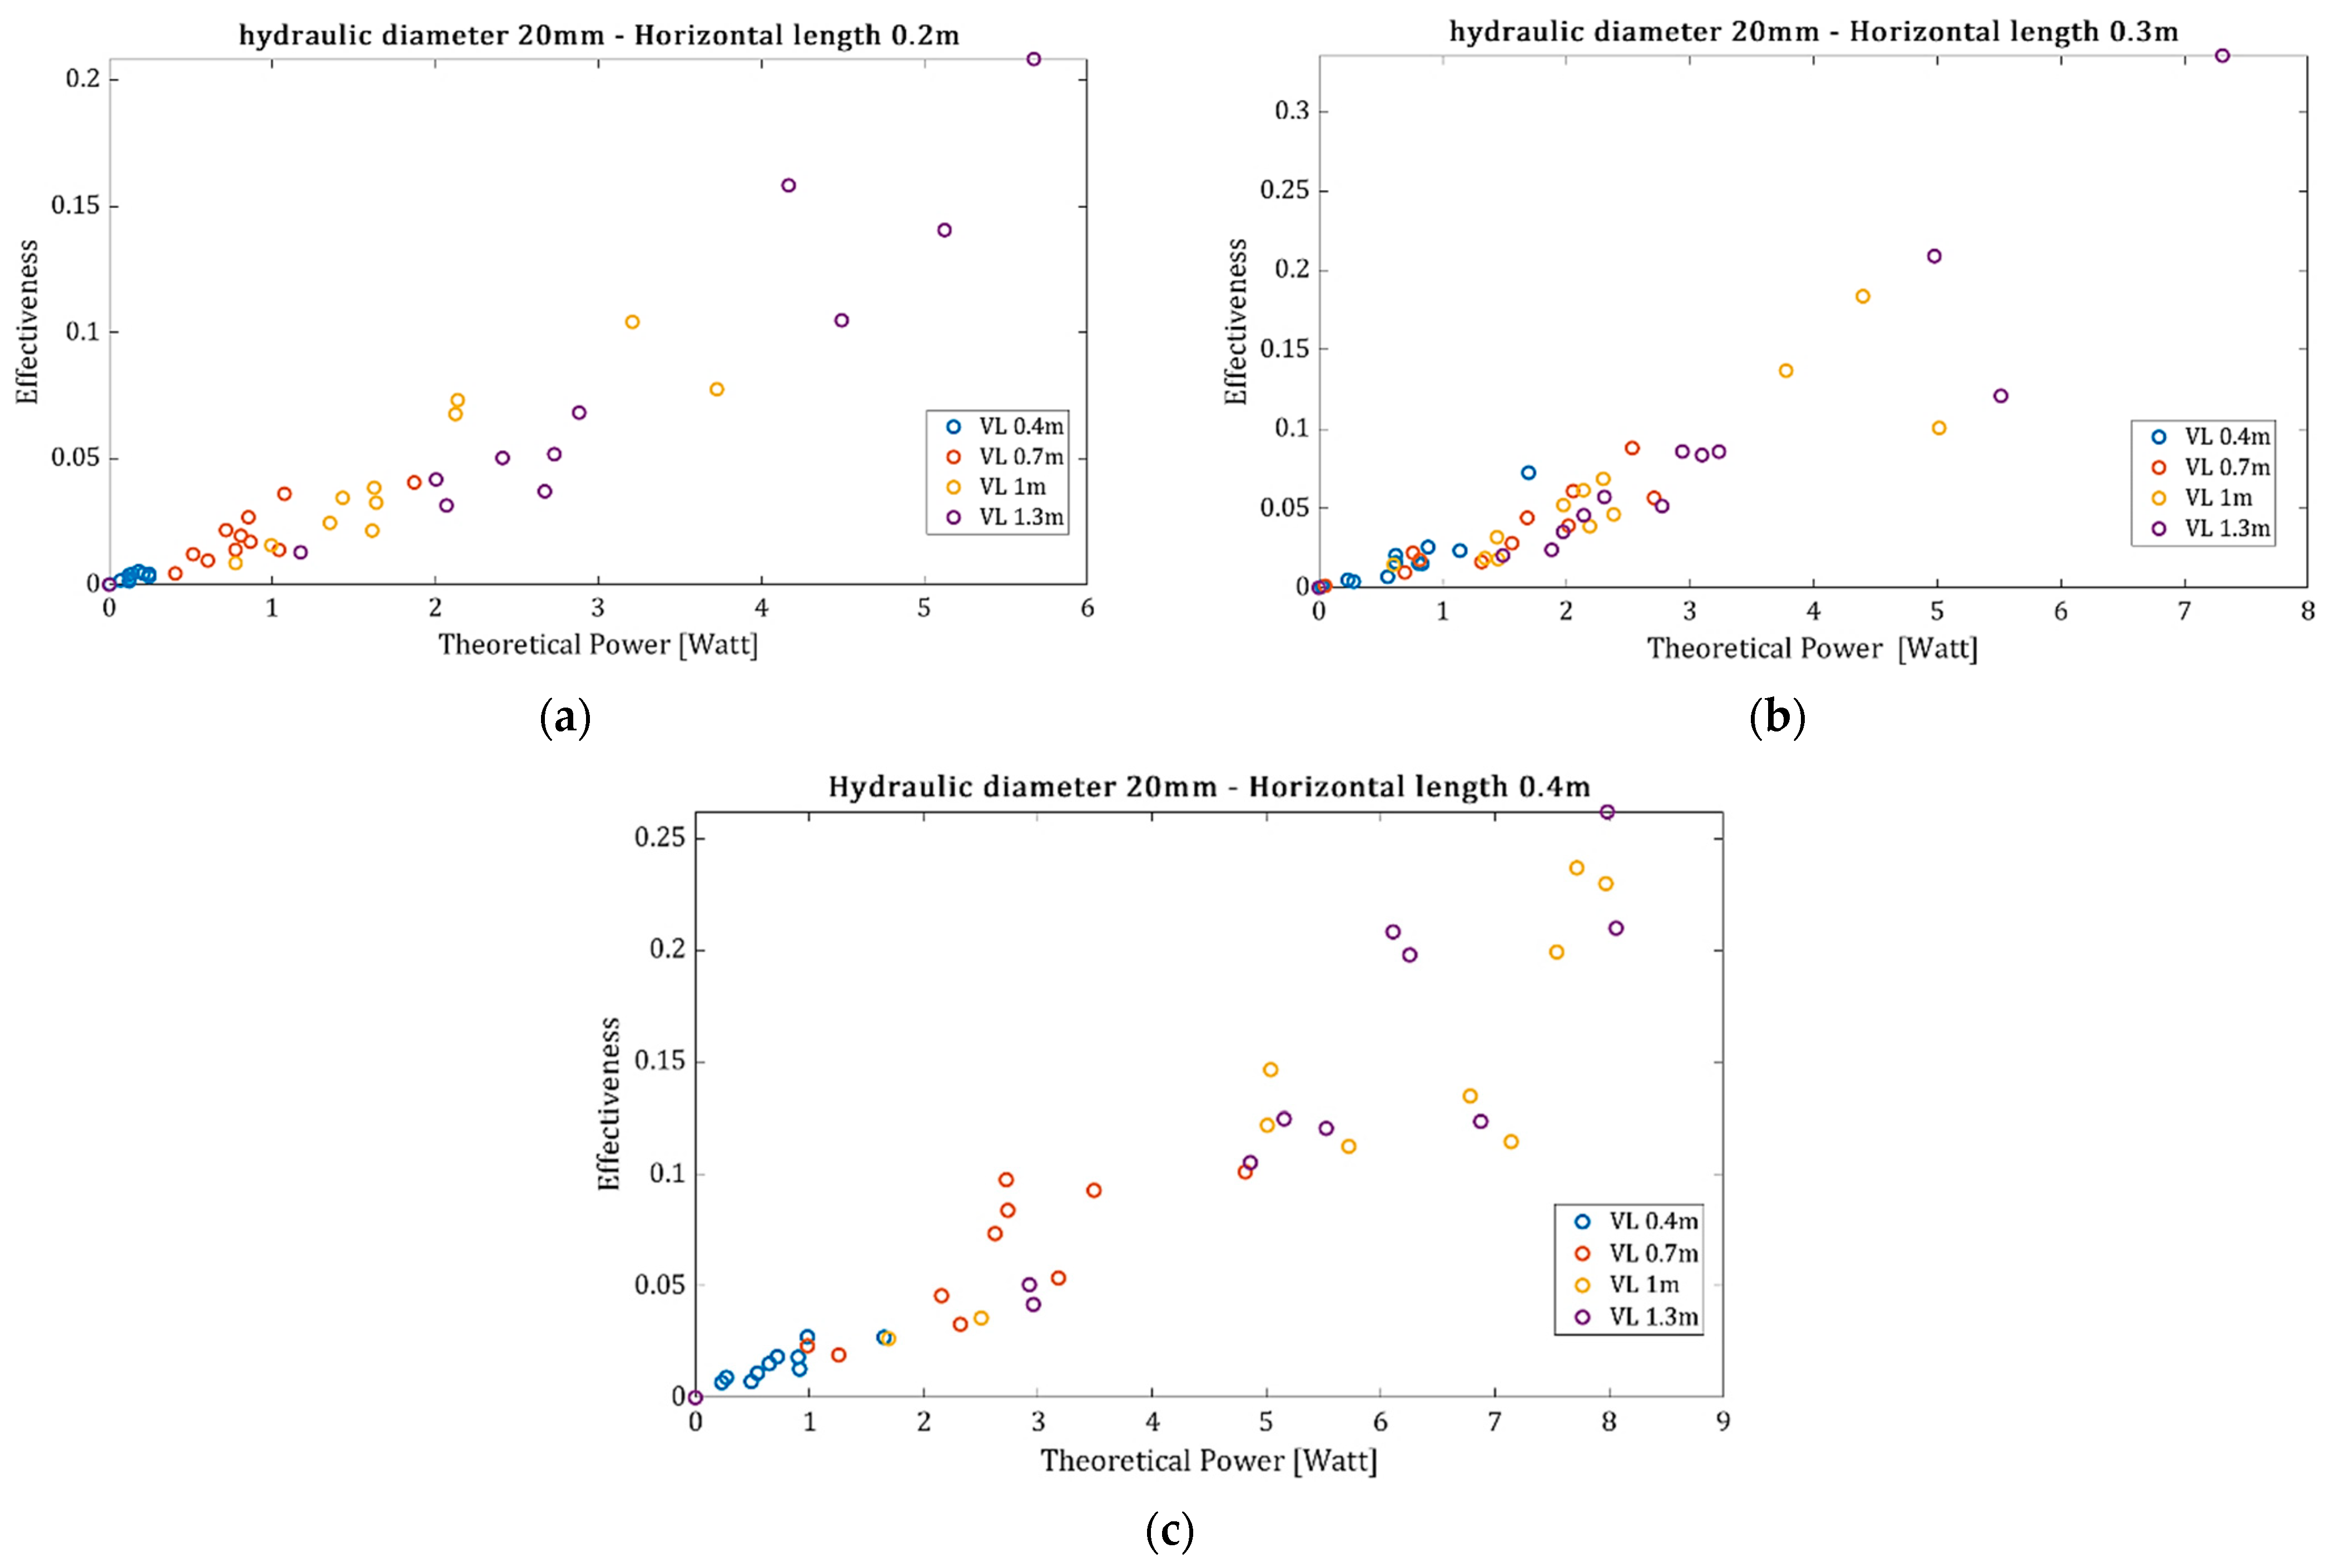
The effectiveness, as defined by Equation (9), for every conducted experiment in comparison to the theoretical required power from the air compressor is presented in
Figure 7 for a hydraulic diameter equal to 20 mm, and the rest of the parameters are summarized in
Table 1. The values of mass flux and aeration are calculated at four different heights of the vertical tube to observe the effect of the upstream pressure, while the horizontal tube is always filled by granular material. The apparent density
ρ of the stacked solids has been measured, and the viscosity
μ is calculated via the Hagen Poiseuille formula (Equation (35)) using the mass flux from an experiment with high aeration rate. The curves of mass and airflow obtained from the sensors are filtered with a moving average filter to reduce the measuring errors.
Figure 7a–c indicate that as the power supply from the air compressor increases, the effectiveness increases. When the level of the granular at the vertical tube is higher, the upstream pressure is greater, and thus, the resulting mass flux is also increased. Higher mass flux means higher pressure drop at the horizontal tube (Equations (2)–(6)).
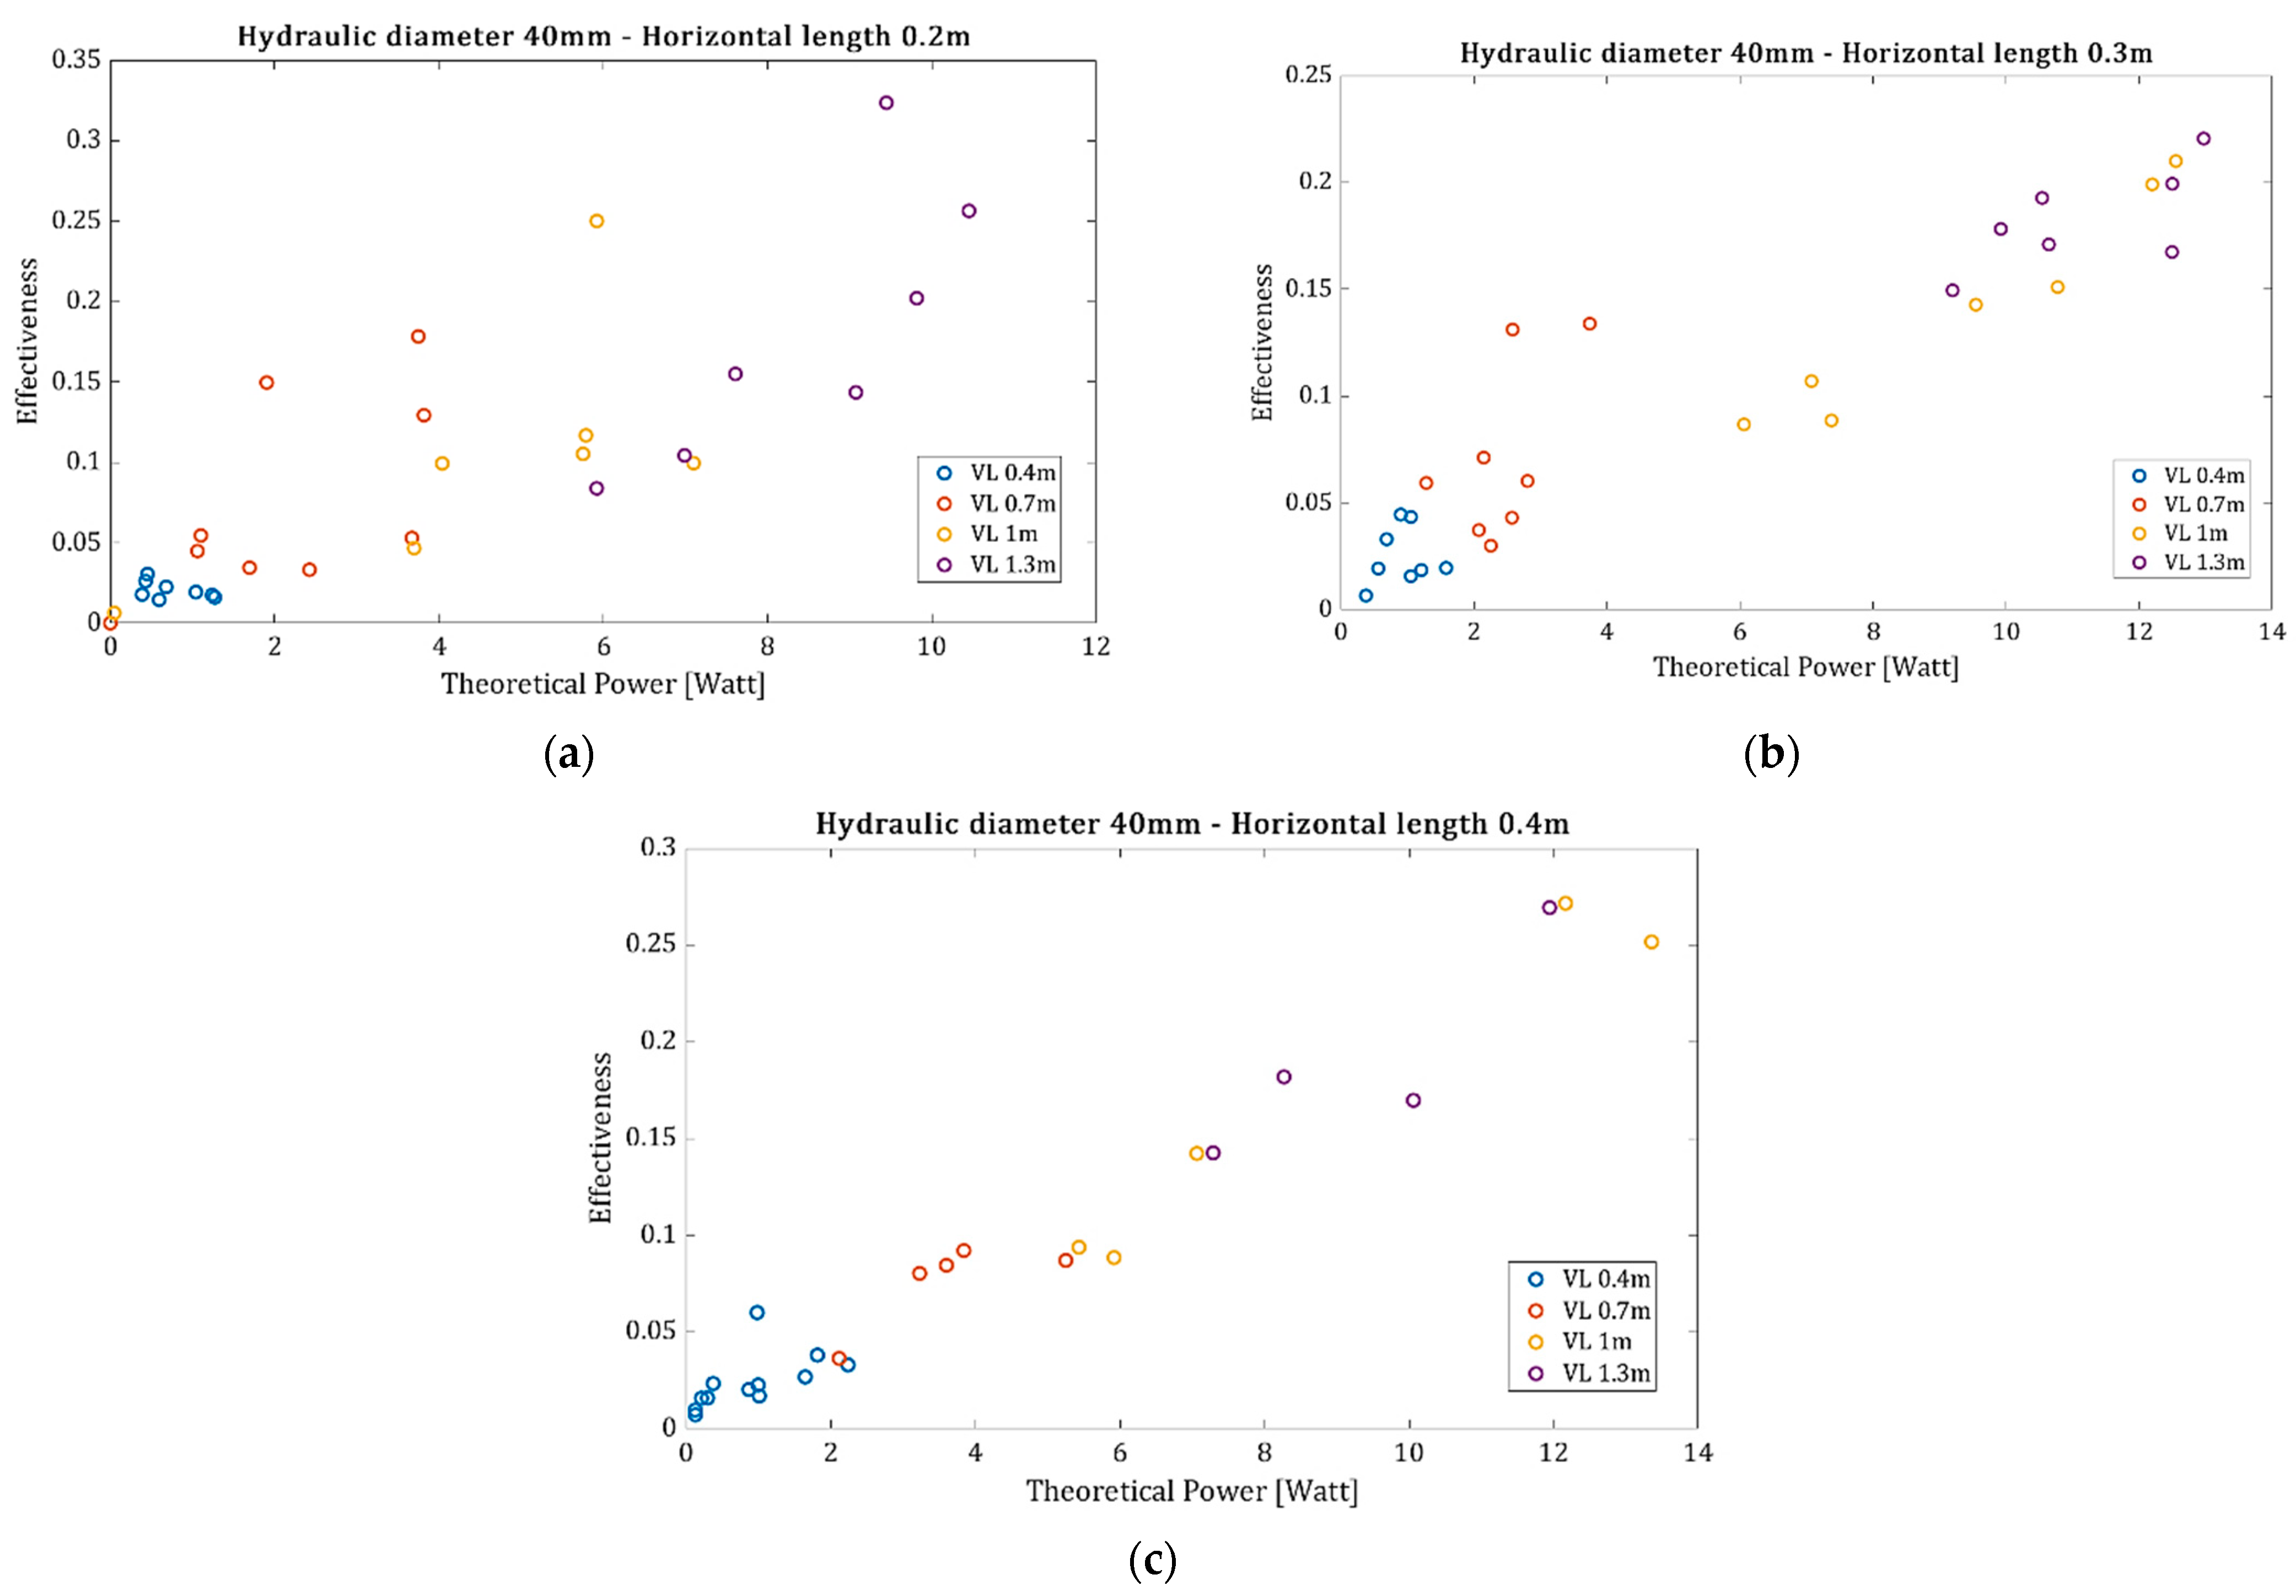
In addition, the experiments were conducted with the parameters of
Table 1, but for a hydraulic diameter equal to 40 mm. The data obtained are presented in
Figure 8a–c, where it can be observed that as the mass flux increases, the resulting effectiveness also increases but with a higher dispersion.
From the experimental data, it is clear that the lower the theoretical power requirement to overcome the linear pressure drop in a horizontal tube arrangement, the lower the resulting effectiveness. In fact, for a very small theoretical power, where the air supply is very small, the effectiveness is zero as the entire airflow passes through the porosity of the granular material without moving particles. From the experimental data, it is clear that longer horizontal pipes result in lower mass fluxes due to the increased linear pressure drop, while pipes with larger diameters result in higher mass fluxes due to the lower linear pressure drop.
2.3. Scale-Up Model
The aeration needs of every industrial-scale model can be calculated using a single formula. Equation (13) gives the necessary power supply for a case study with operating parameters given by Equation (10) as function of the equivalent parameters at a small scale:
The theoretical power losses at the horizontal tube can be easily scaled using the Formulas (2)–(6), reaching Equation (11). However, to calculate the real required power, the effectiveness has to be scaled as well. The scaling of the effectiveness will be accomplished via dimensional analysis to assess the effect of the theoretical required power and the height of the vertical tube. Hence, Equation (12) was introduced, for which the exponents m, n and the constant C will be fitted using the experimental data.
The best fit of the parameters
m,
n and
C was accomplished using some sets of experimental data and validated to other sets. First of all, the theoretical power (
), the vertical length (
) and the effectiveness (
) of an experiment were selected. The selected values are entered into Equation (12), which must have the appropriate parameters to give the scaled effectiveness. The best fit of the parameters m and
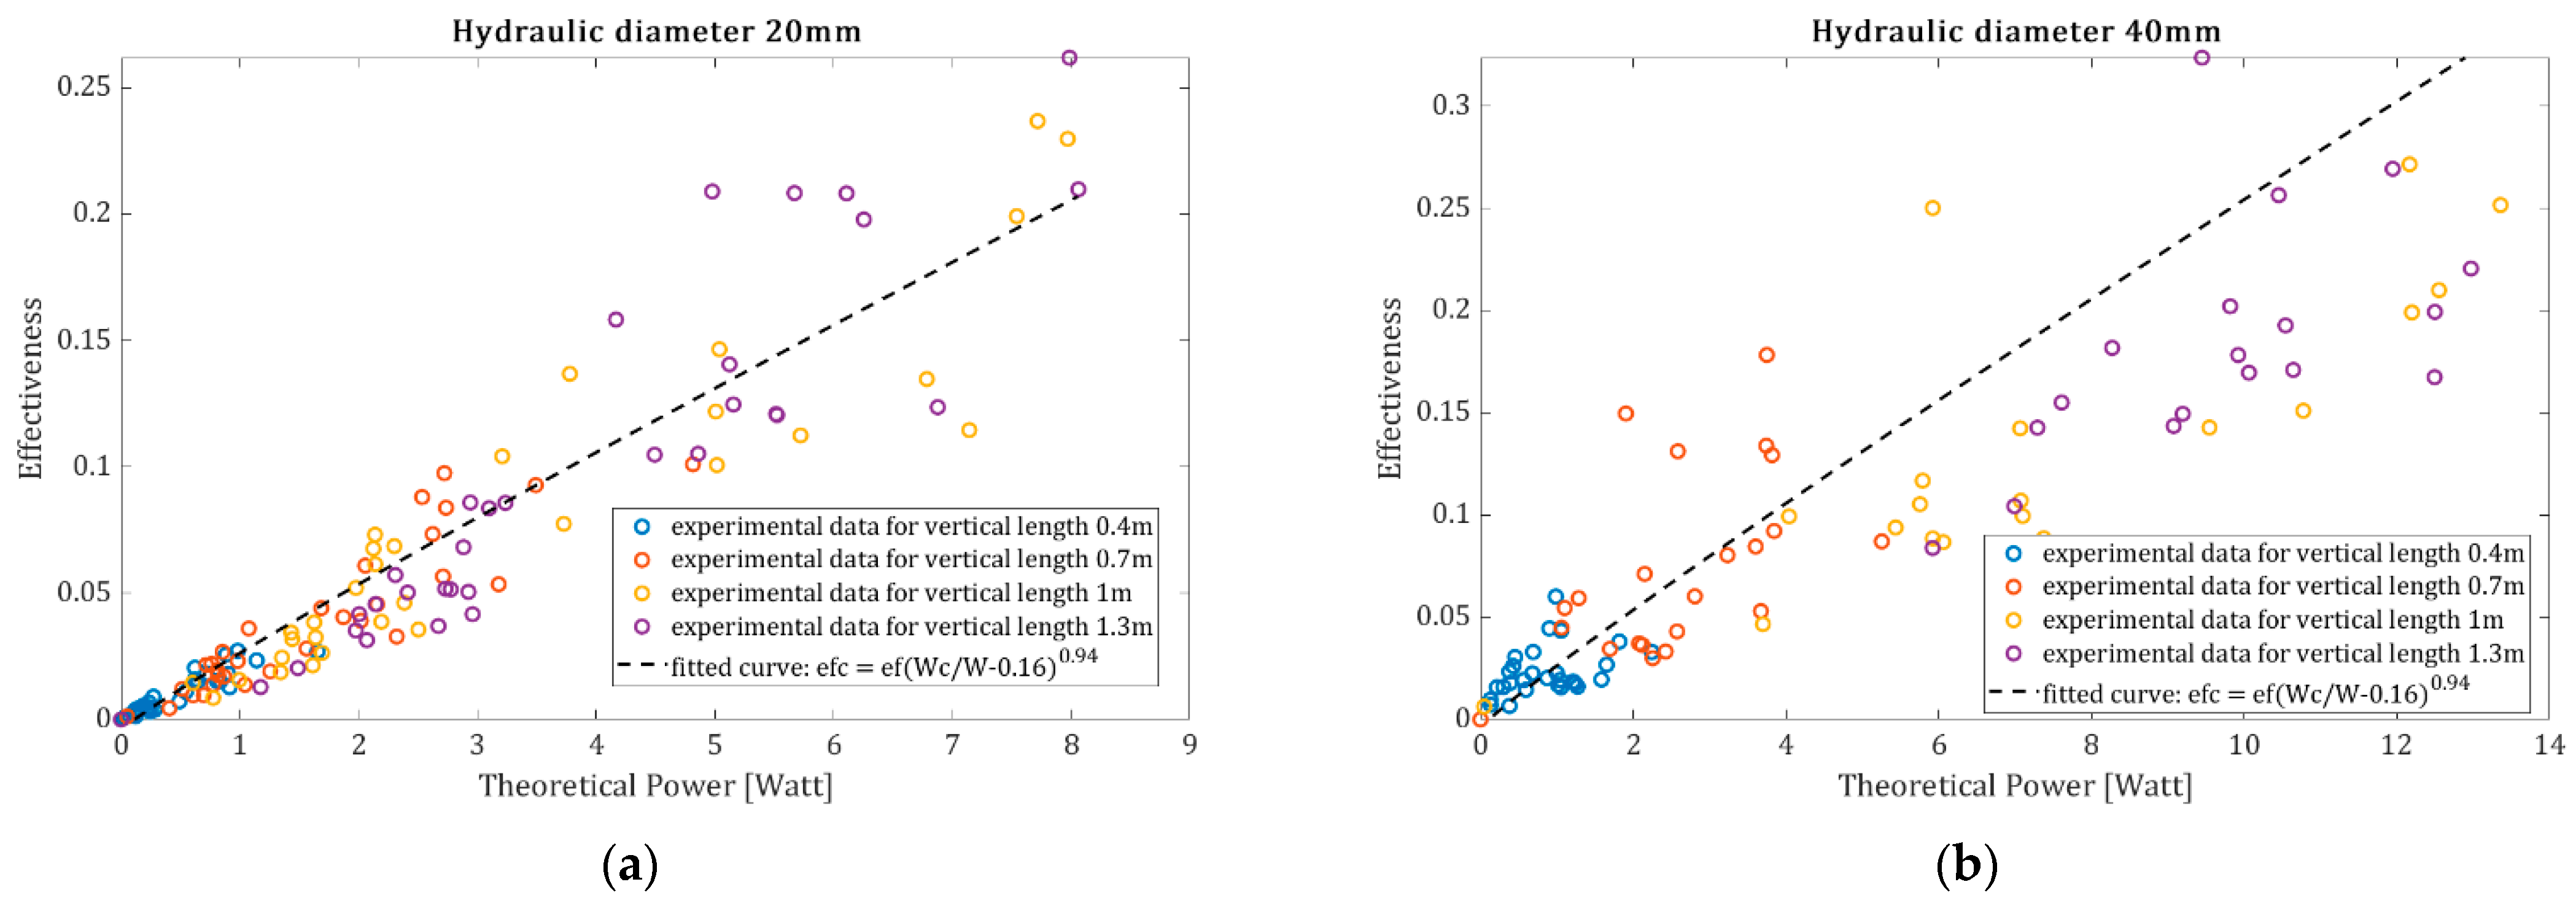
C in Equation (12) was conducted using experiments where the vertical length of the tube was the same as that in the selected experiment in order to remove the unknown n exponent from the equation. The best fit was performed against experimental data, where the hydraulic diameter was equal to 20 mm, and the vertical tube length was 0.7 m. The fitted curve is presented in Equation (14).
The
n exponent was calculated with a value close to zero via Equation (15) using experimental data from L-Valves with a vertical tube length of 1 m, and the results were validated for the series of available experimental data from the experiments conducted for tube heights of 0.4 m and 1.3 m.
where
is the amount of the experimental datapoints from L-Valves with a hydraulic diameter of 20 mm and a vertical length of 1 m, and
is the experimental effectiveness.
Since the exponent n is equal to zero, the scaling of effectiveness is given by the simple equation:
Figure 9a,b present the experimental data along with the fitted curve. Since the Double L-Valve does not have any moving parts, the energy consumption during operation is exclusively due to the air consumption provided by air-compressors and blowers, which can be estimated for a specific industrial application using Equation (16). It is important to note that the scale-up model can be used only for rough preliminary estimations. After all, conducting accurate estimations is very difficult due to the stochastic nature of this phenomenon, which exhibits a significant inherent variation, as shown in the scatterplots.
To conclude, based on the experimental data from the small prototype, a scaled-up hydrodynamic model is proposed (Equation (16)) that provides estimations for the operational requirements at an industrial scale. By using this model, initial conclusions can be drawn about the operating expenditures (OPEX) of the system and its requirements in pneumatic equipment. Consequently, the scale-up model may serve the industry as a useful tool for conducting preliminary feasibility studies about a Double L-Valve arrangement.
