
Numerical Simulation of the Cold-Start Process of Polymer Electrolyte Fuel Cell

Abstract
:1. Introduction
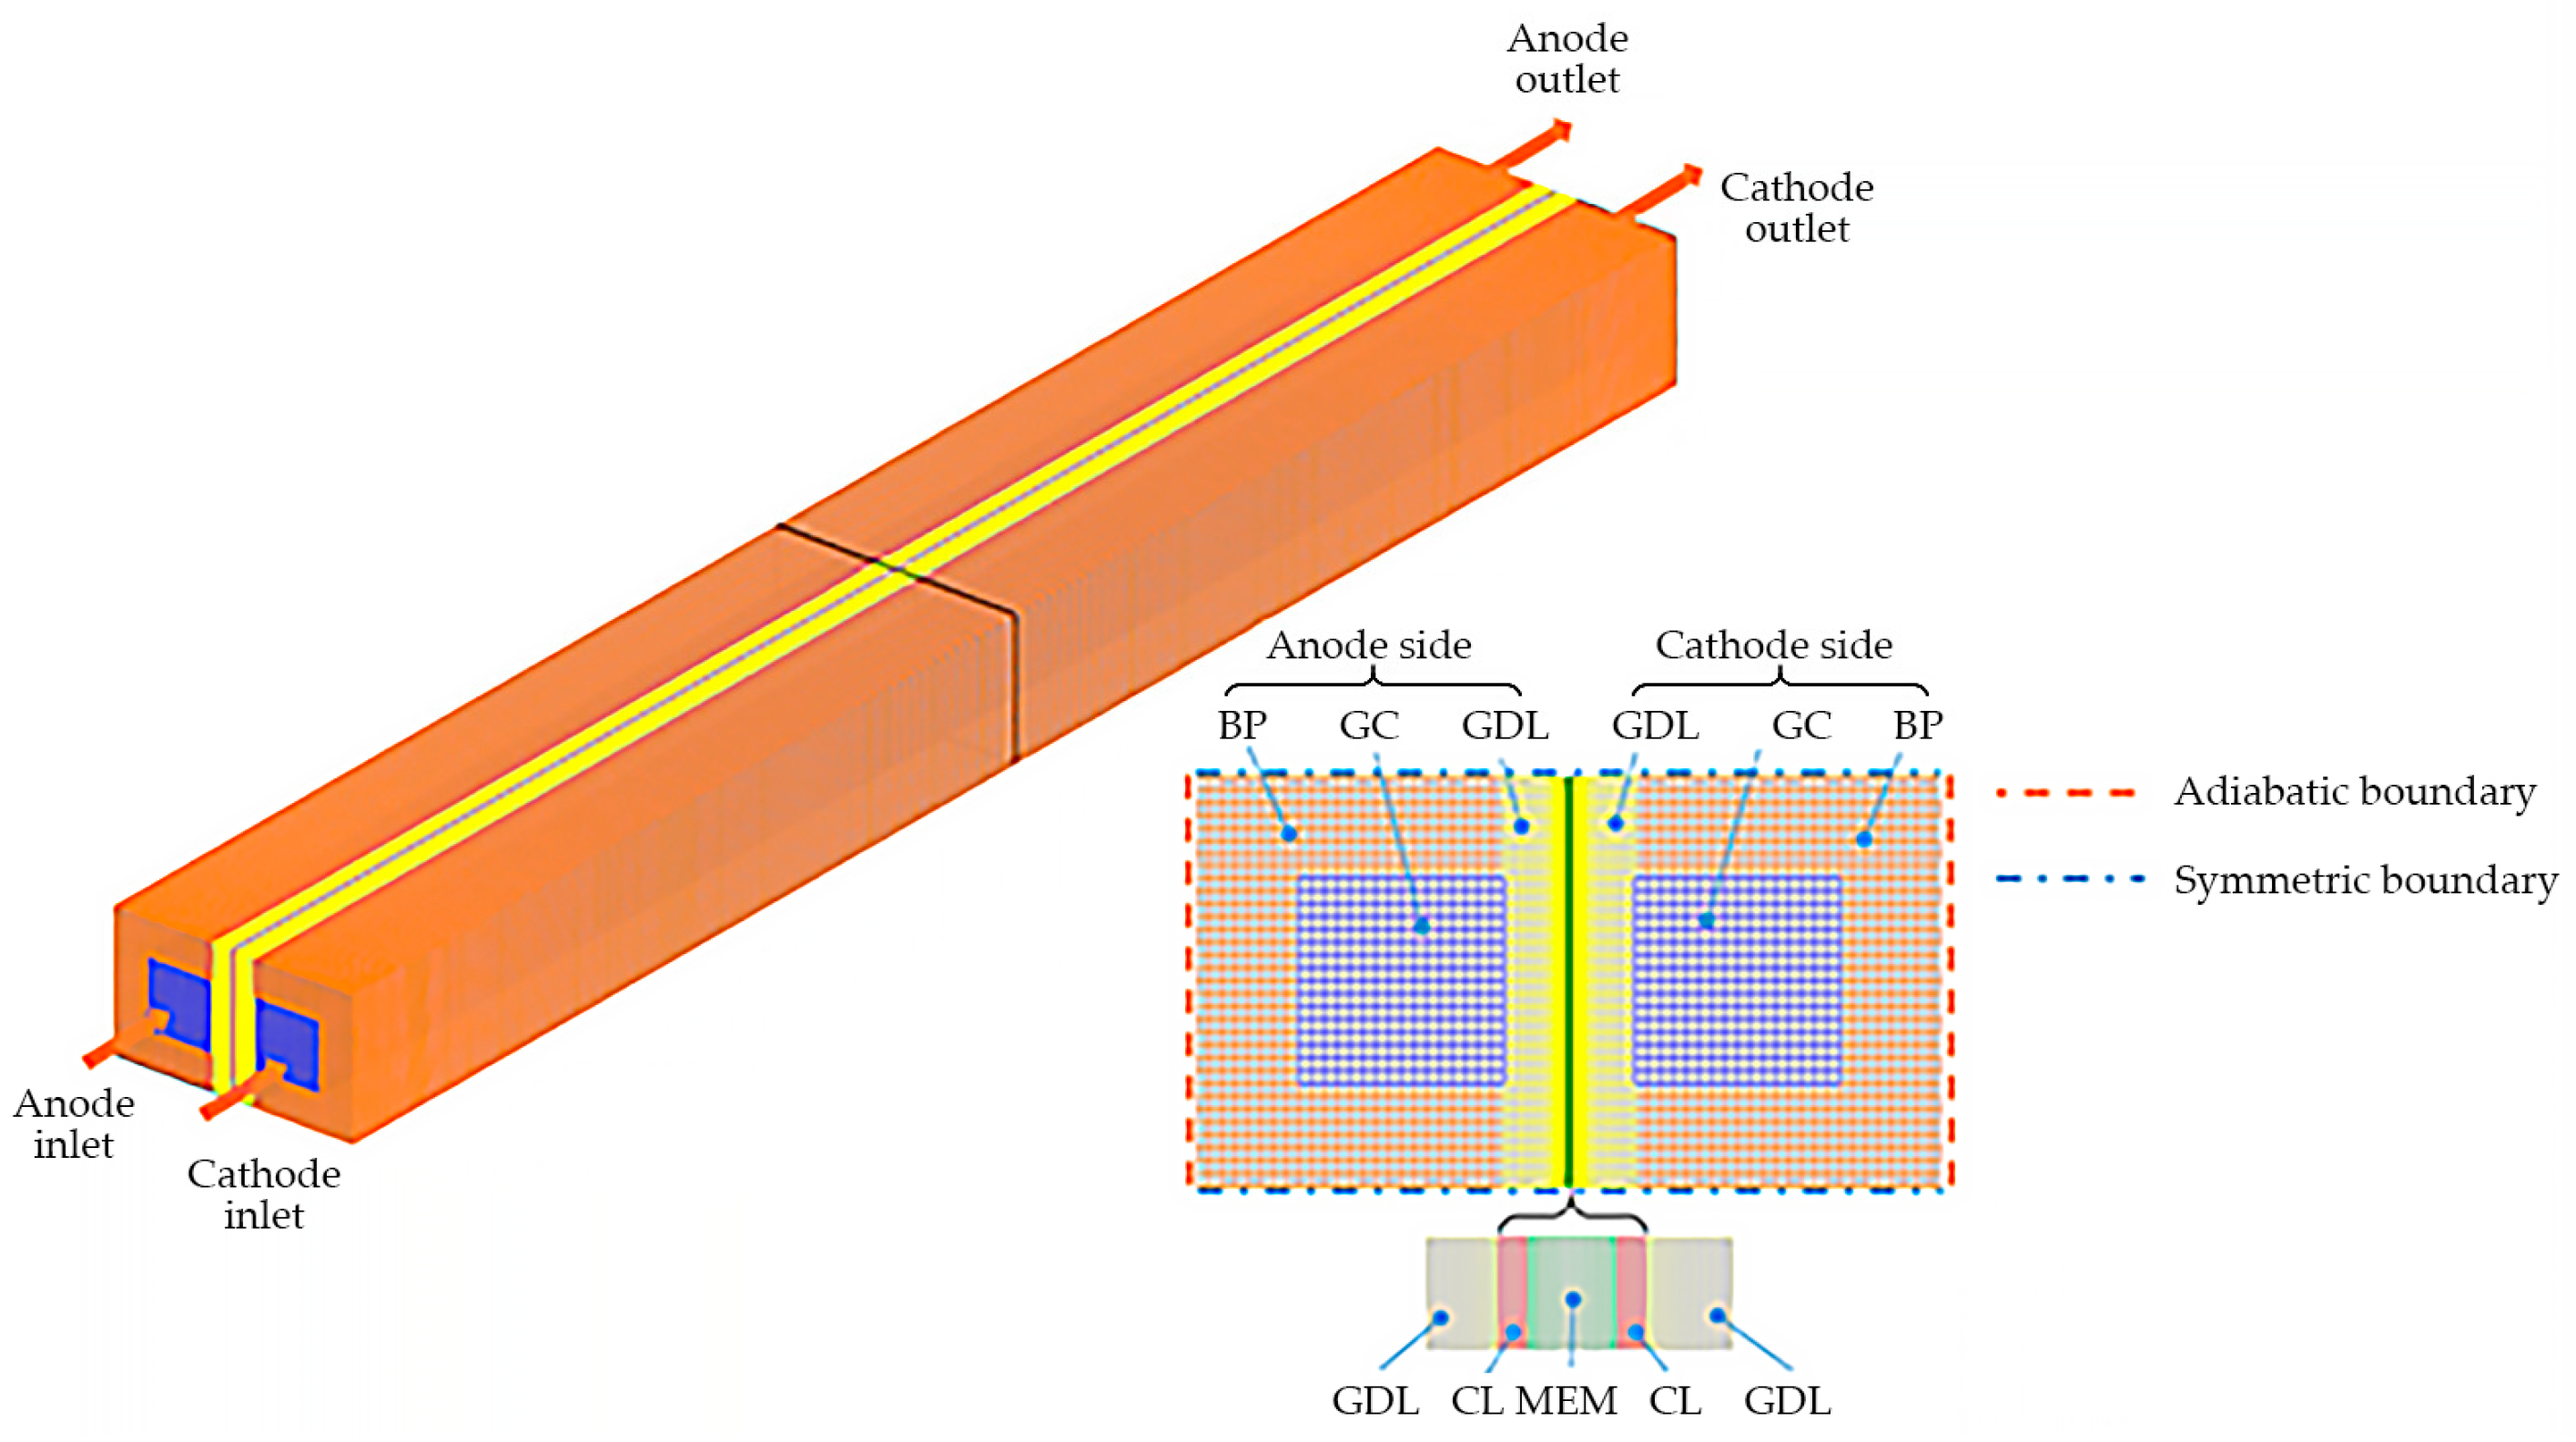
2. Numerical Model
- The porous components of the PEFC are isotropic and homogeneous.
- The gas mixture is incompressible and the gas flow is laminar due to the small pressure gradient and a low flow Reynolds number.
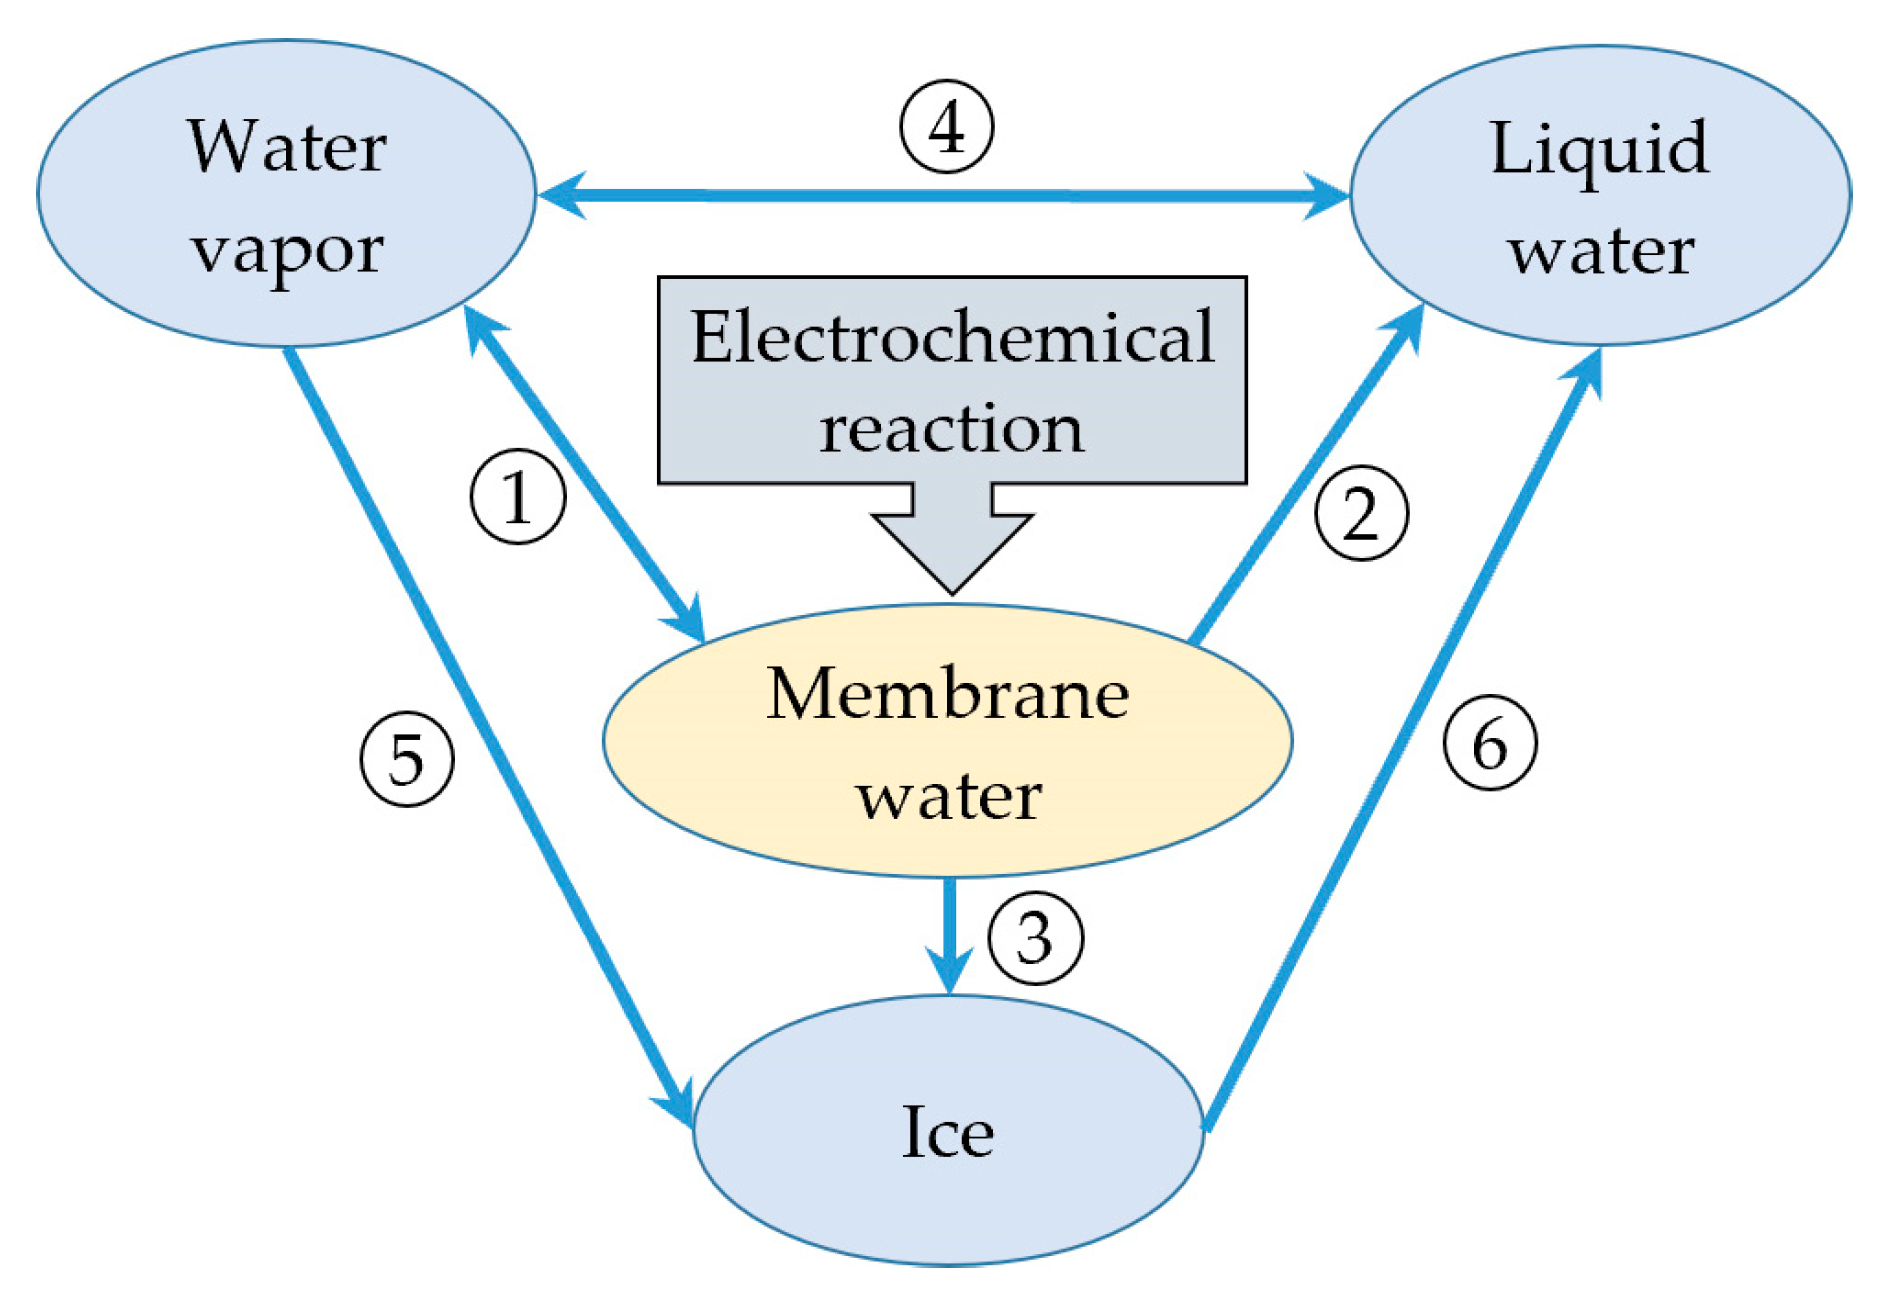
- The product water in the cathode CL resulting from the electrochemical reaction is considered to be membrane water, which can convert to vapor. The presence of liquid water or ice is taken into account when the membrane water content becomes saturated. However, the icing phenomenon of supercooled water is not considered in the model.
- The membrane water diffusion is considered, which is driven by the concentration gradient of membrane water content in MEM and is independent of the hydraulic pressure gradient.
- The electrochemical double-layer effect in CLs and the gravitational effect are ignored.
2.1. Governing Equations
2.2. Water Phase Transition
2.3. Boundary Conditions and Numerical Implementation
3. Results and Discussion
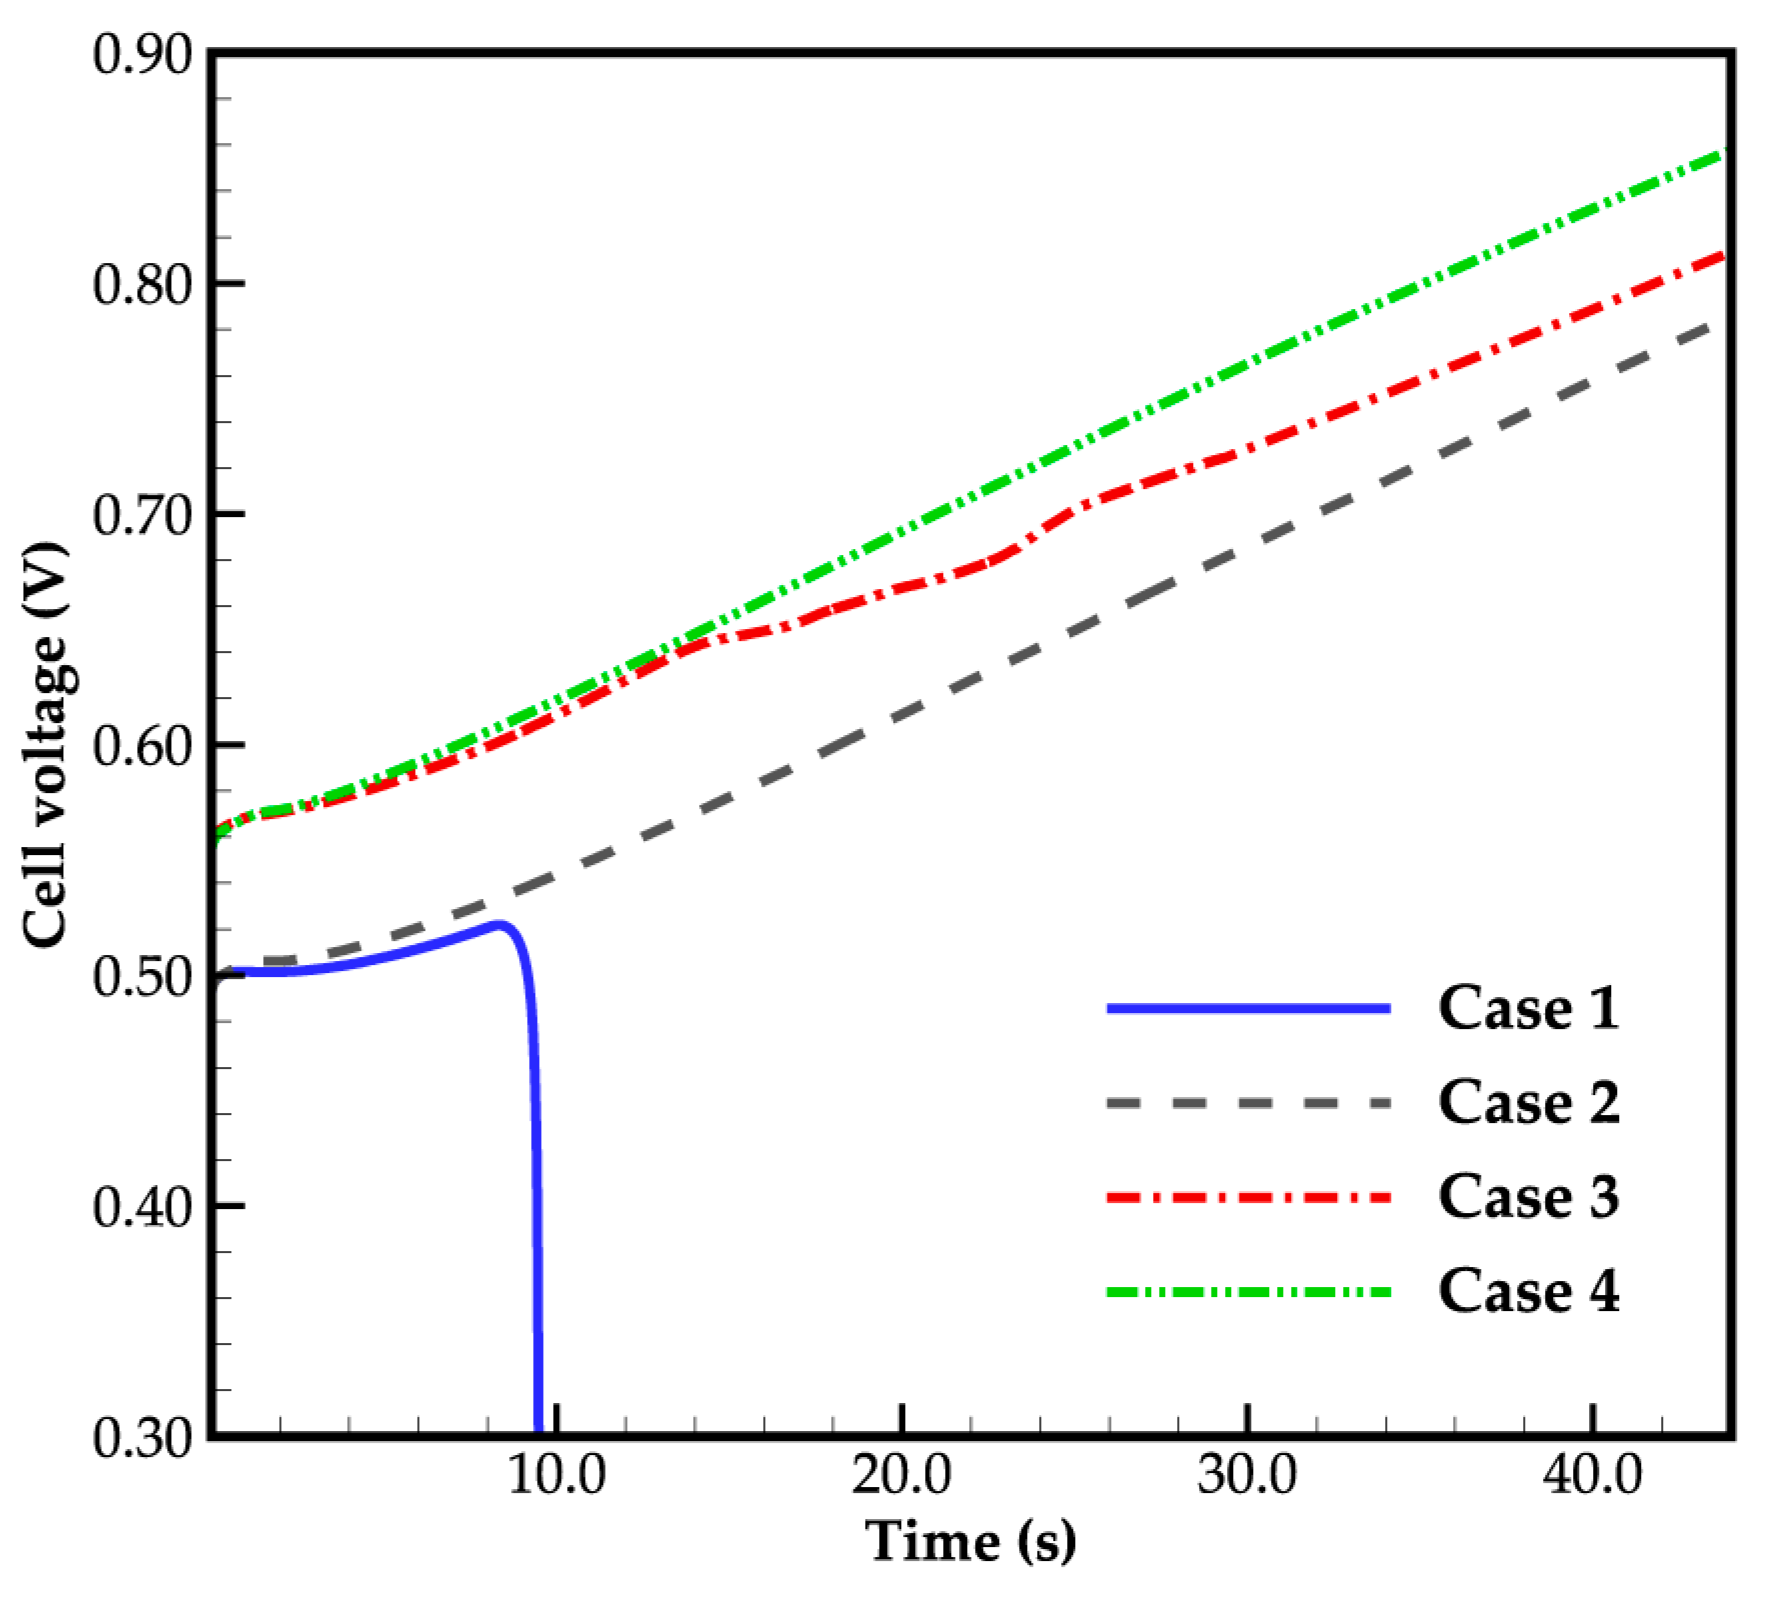
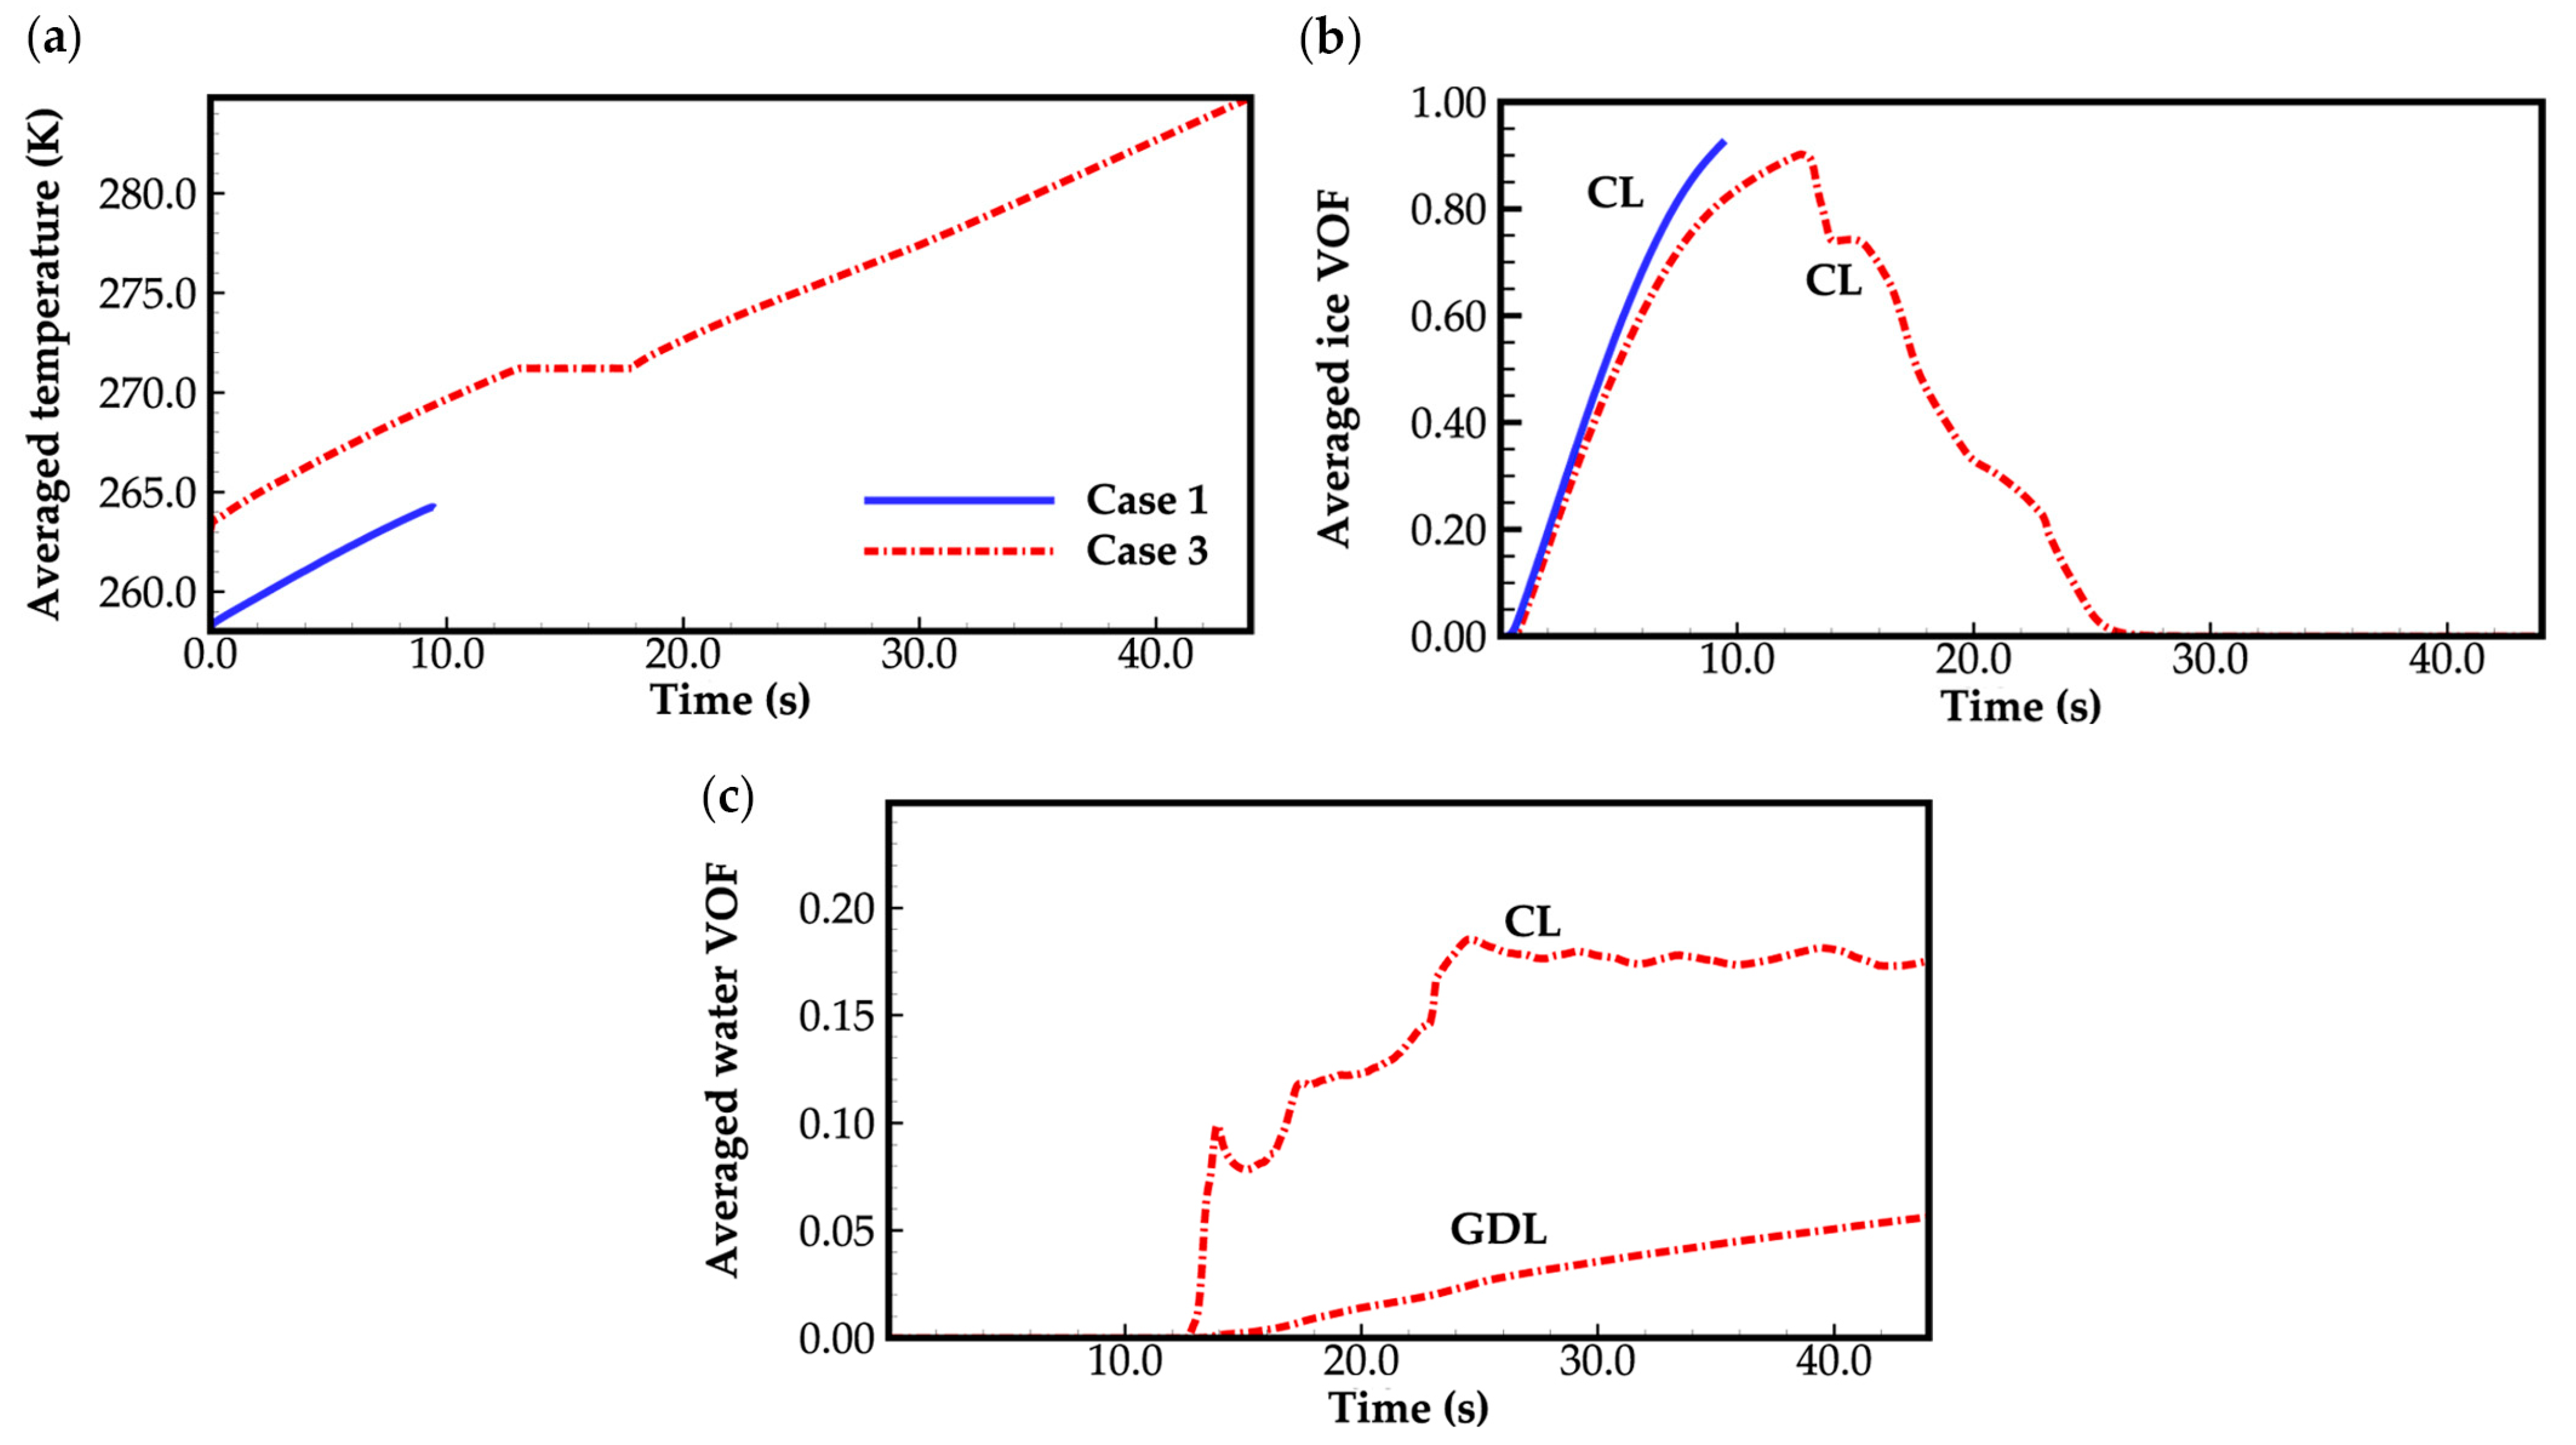
3.1. Effect of Ambient Temperature on Cold-Start Process
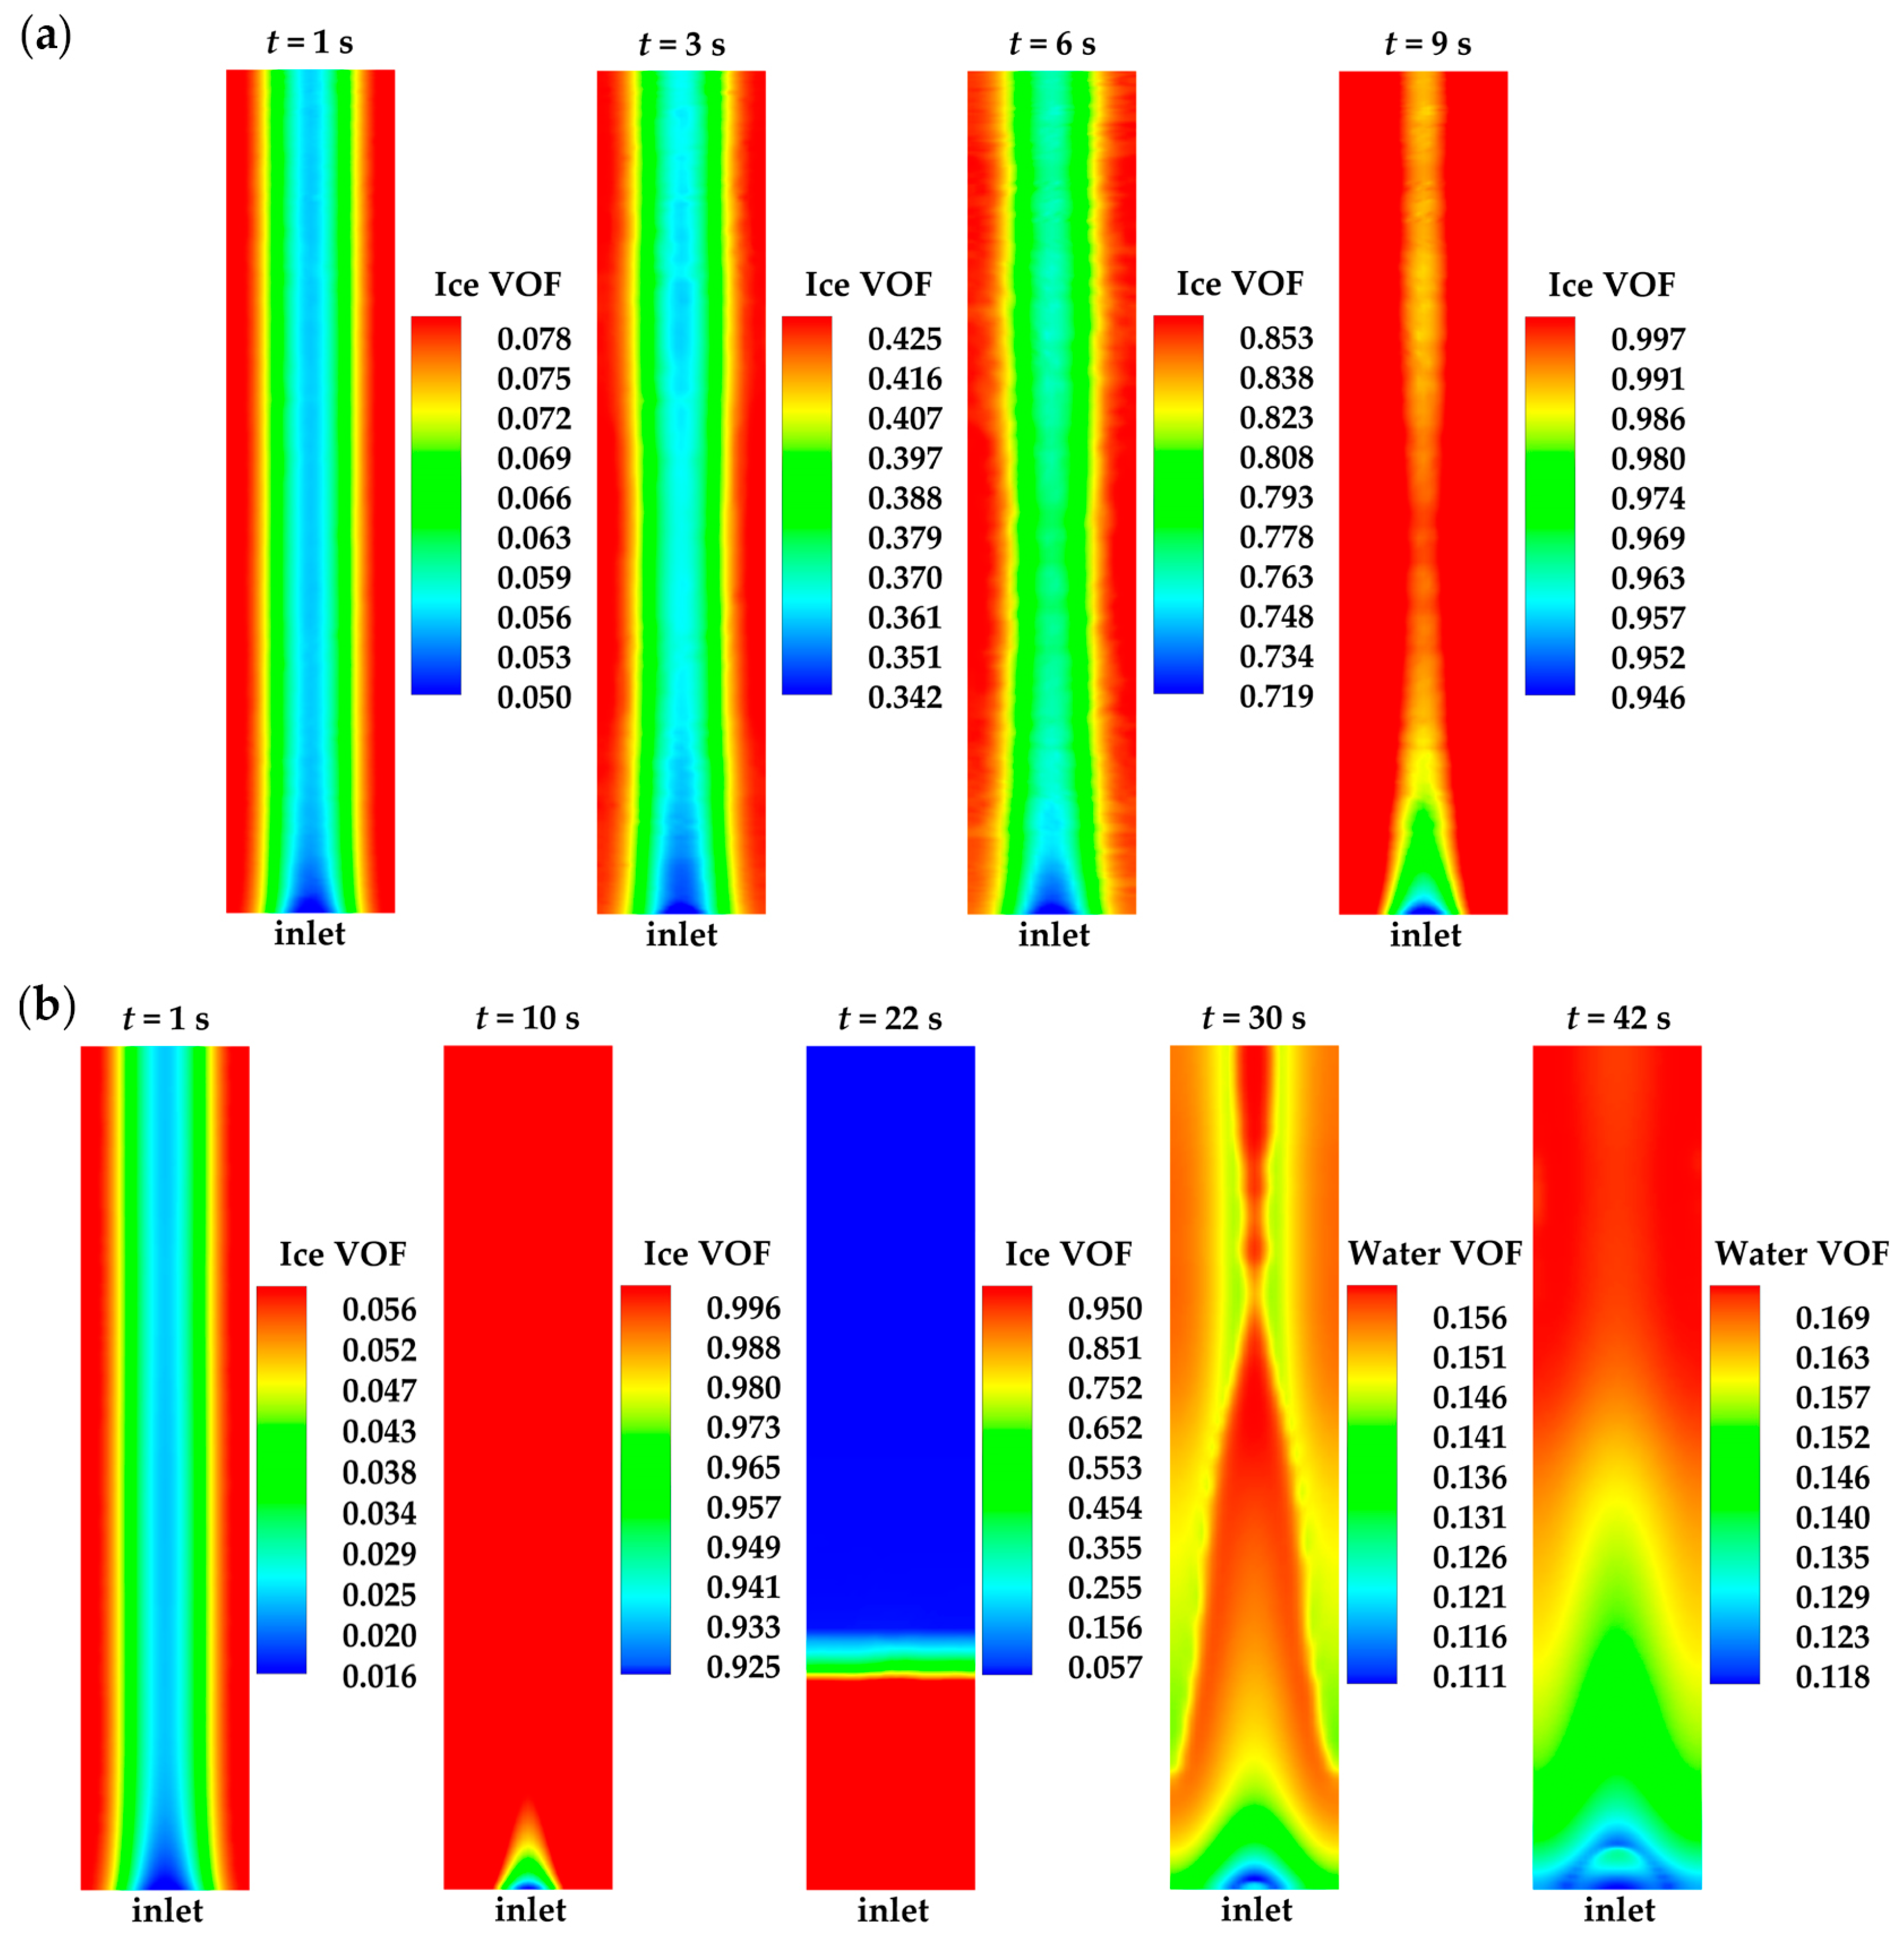
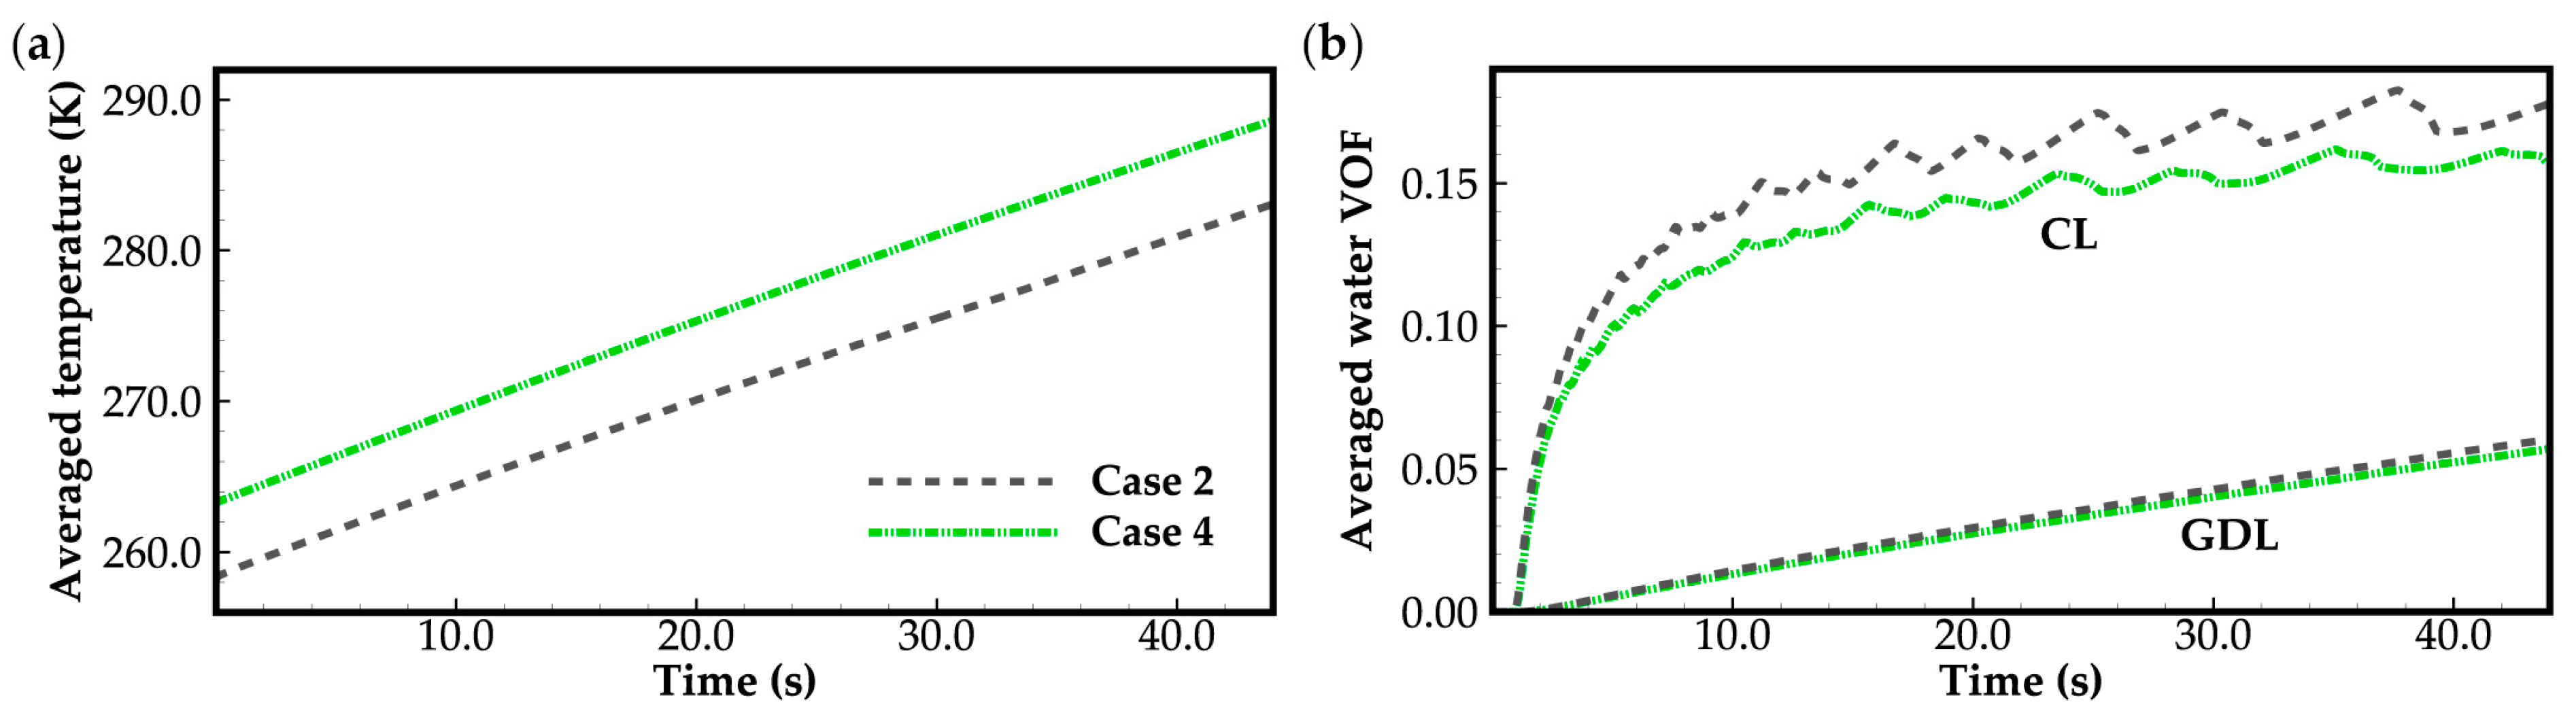
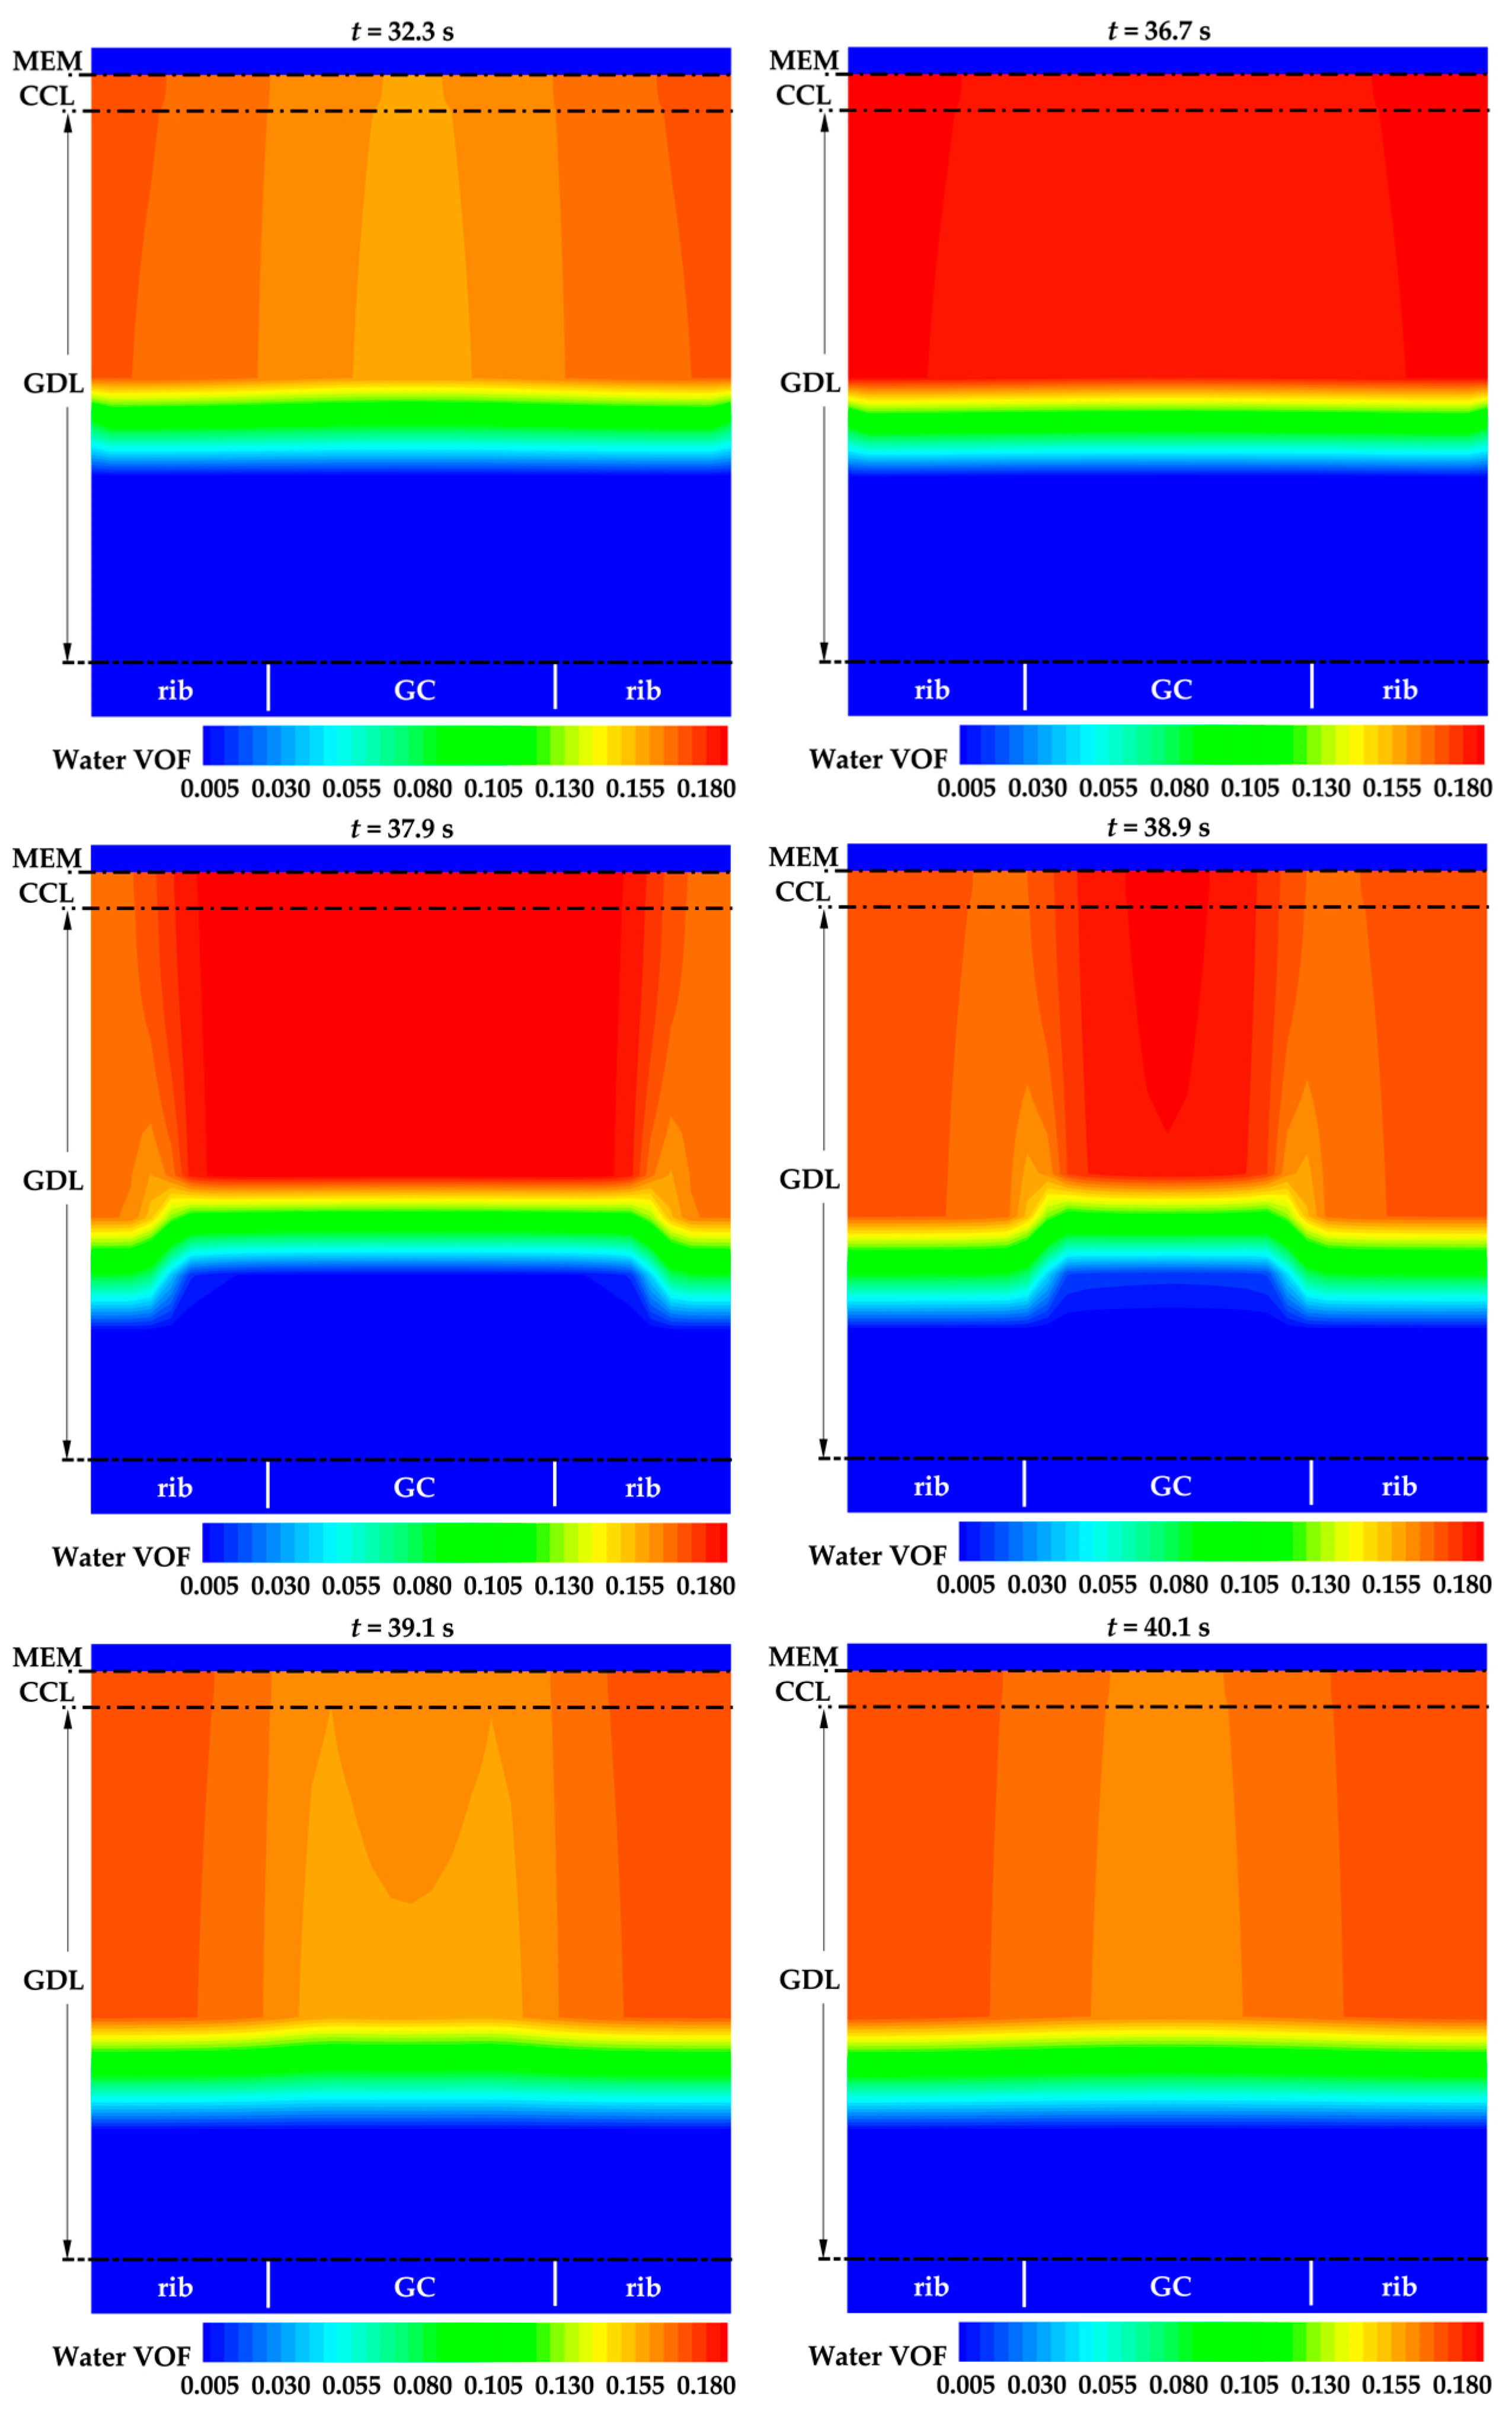
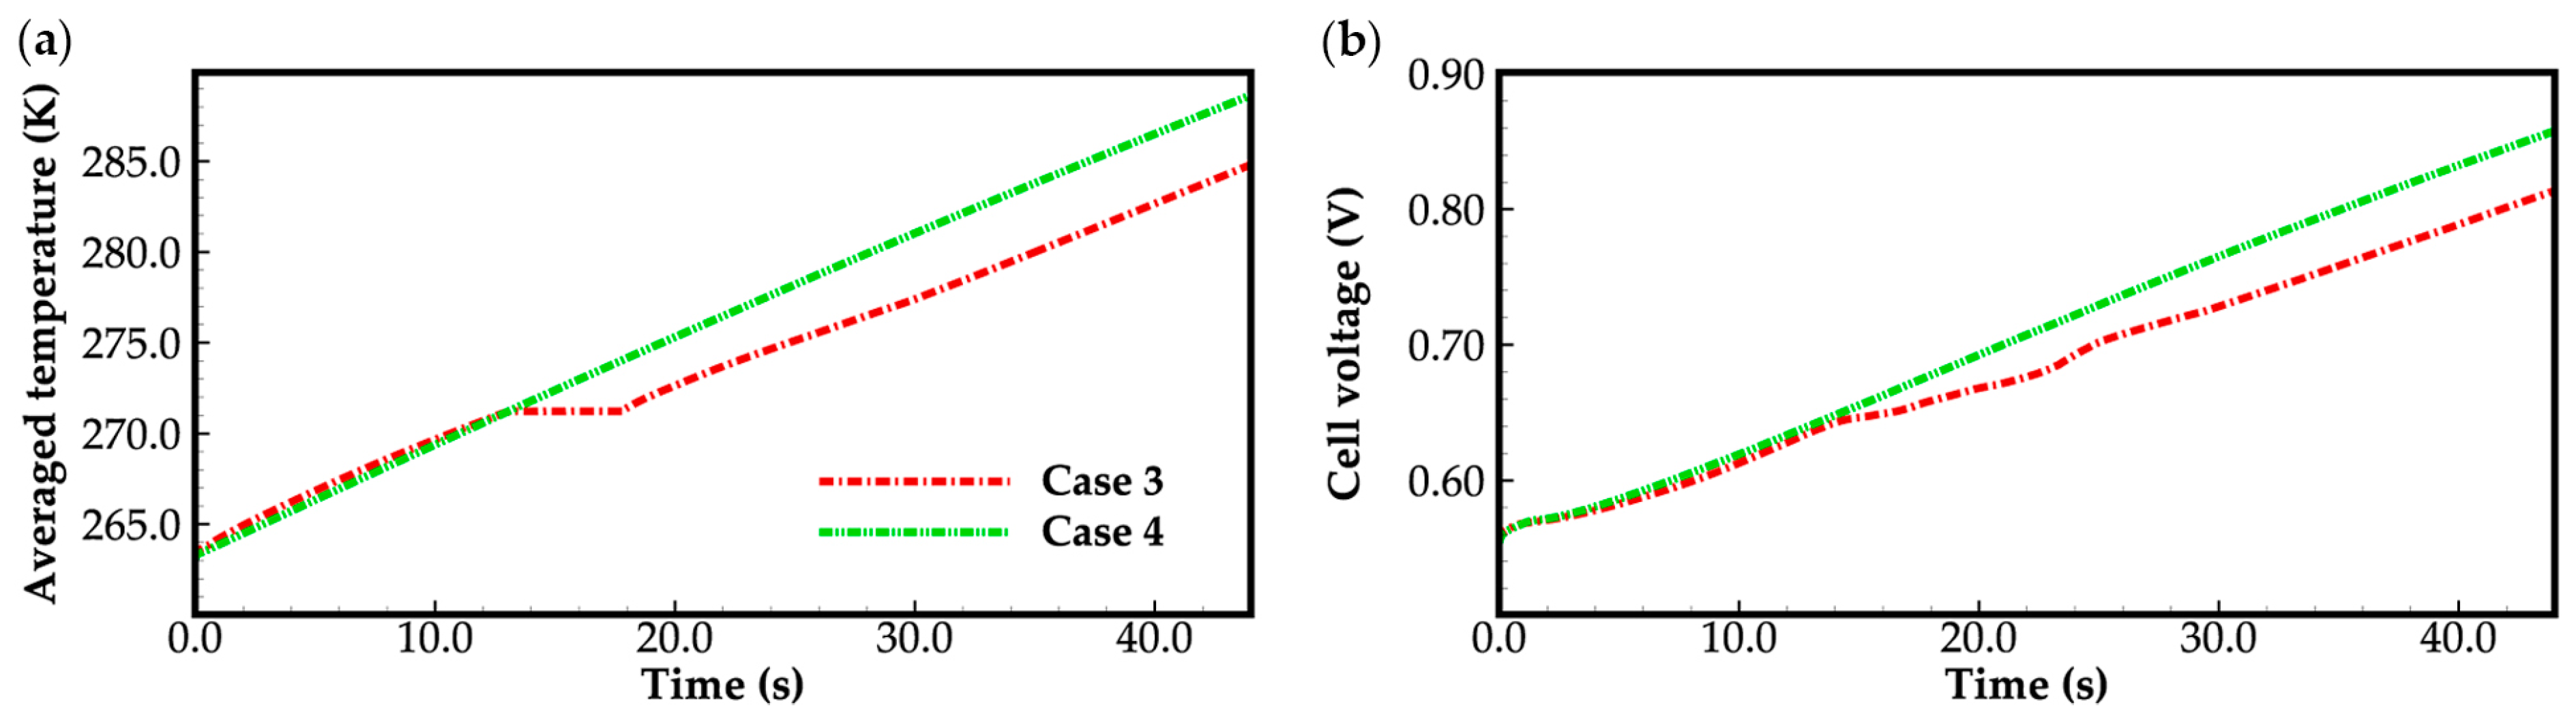
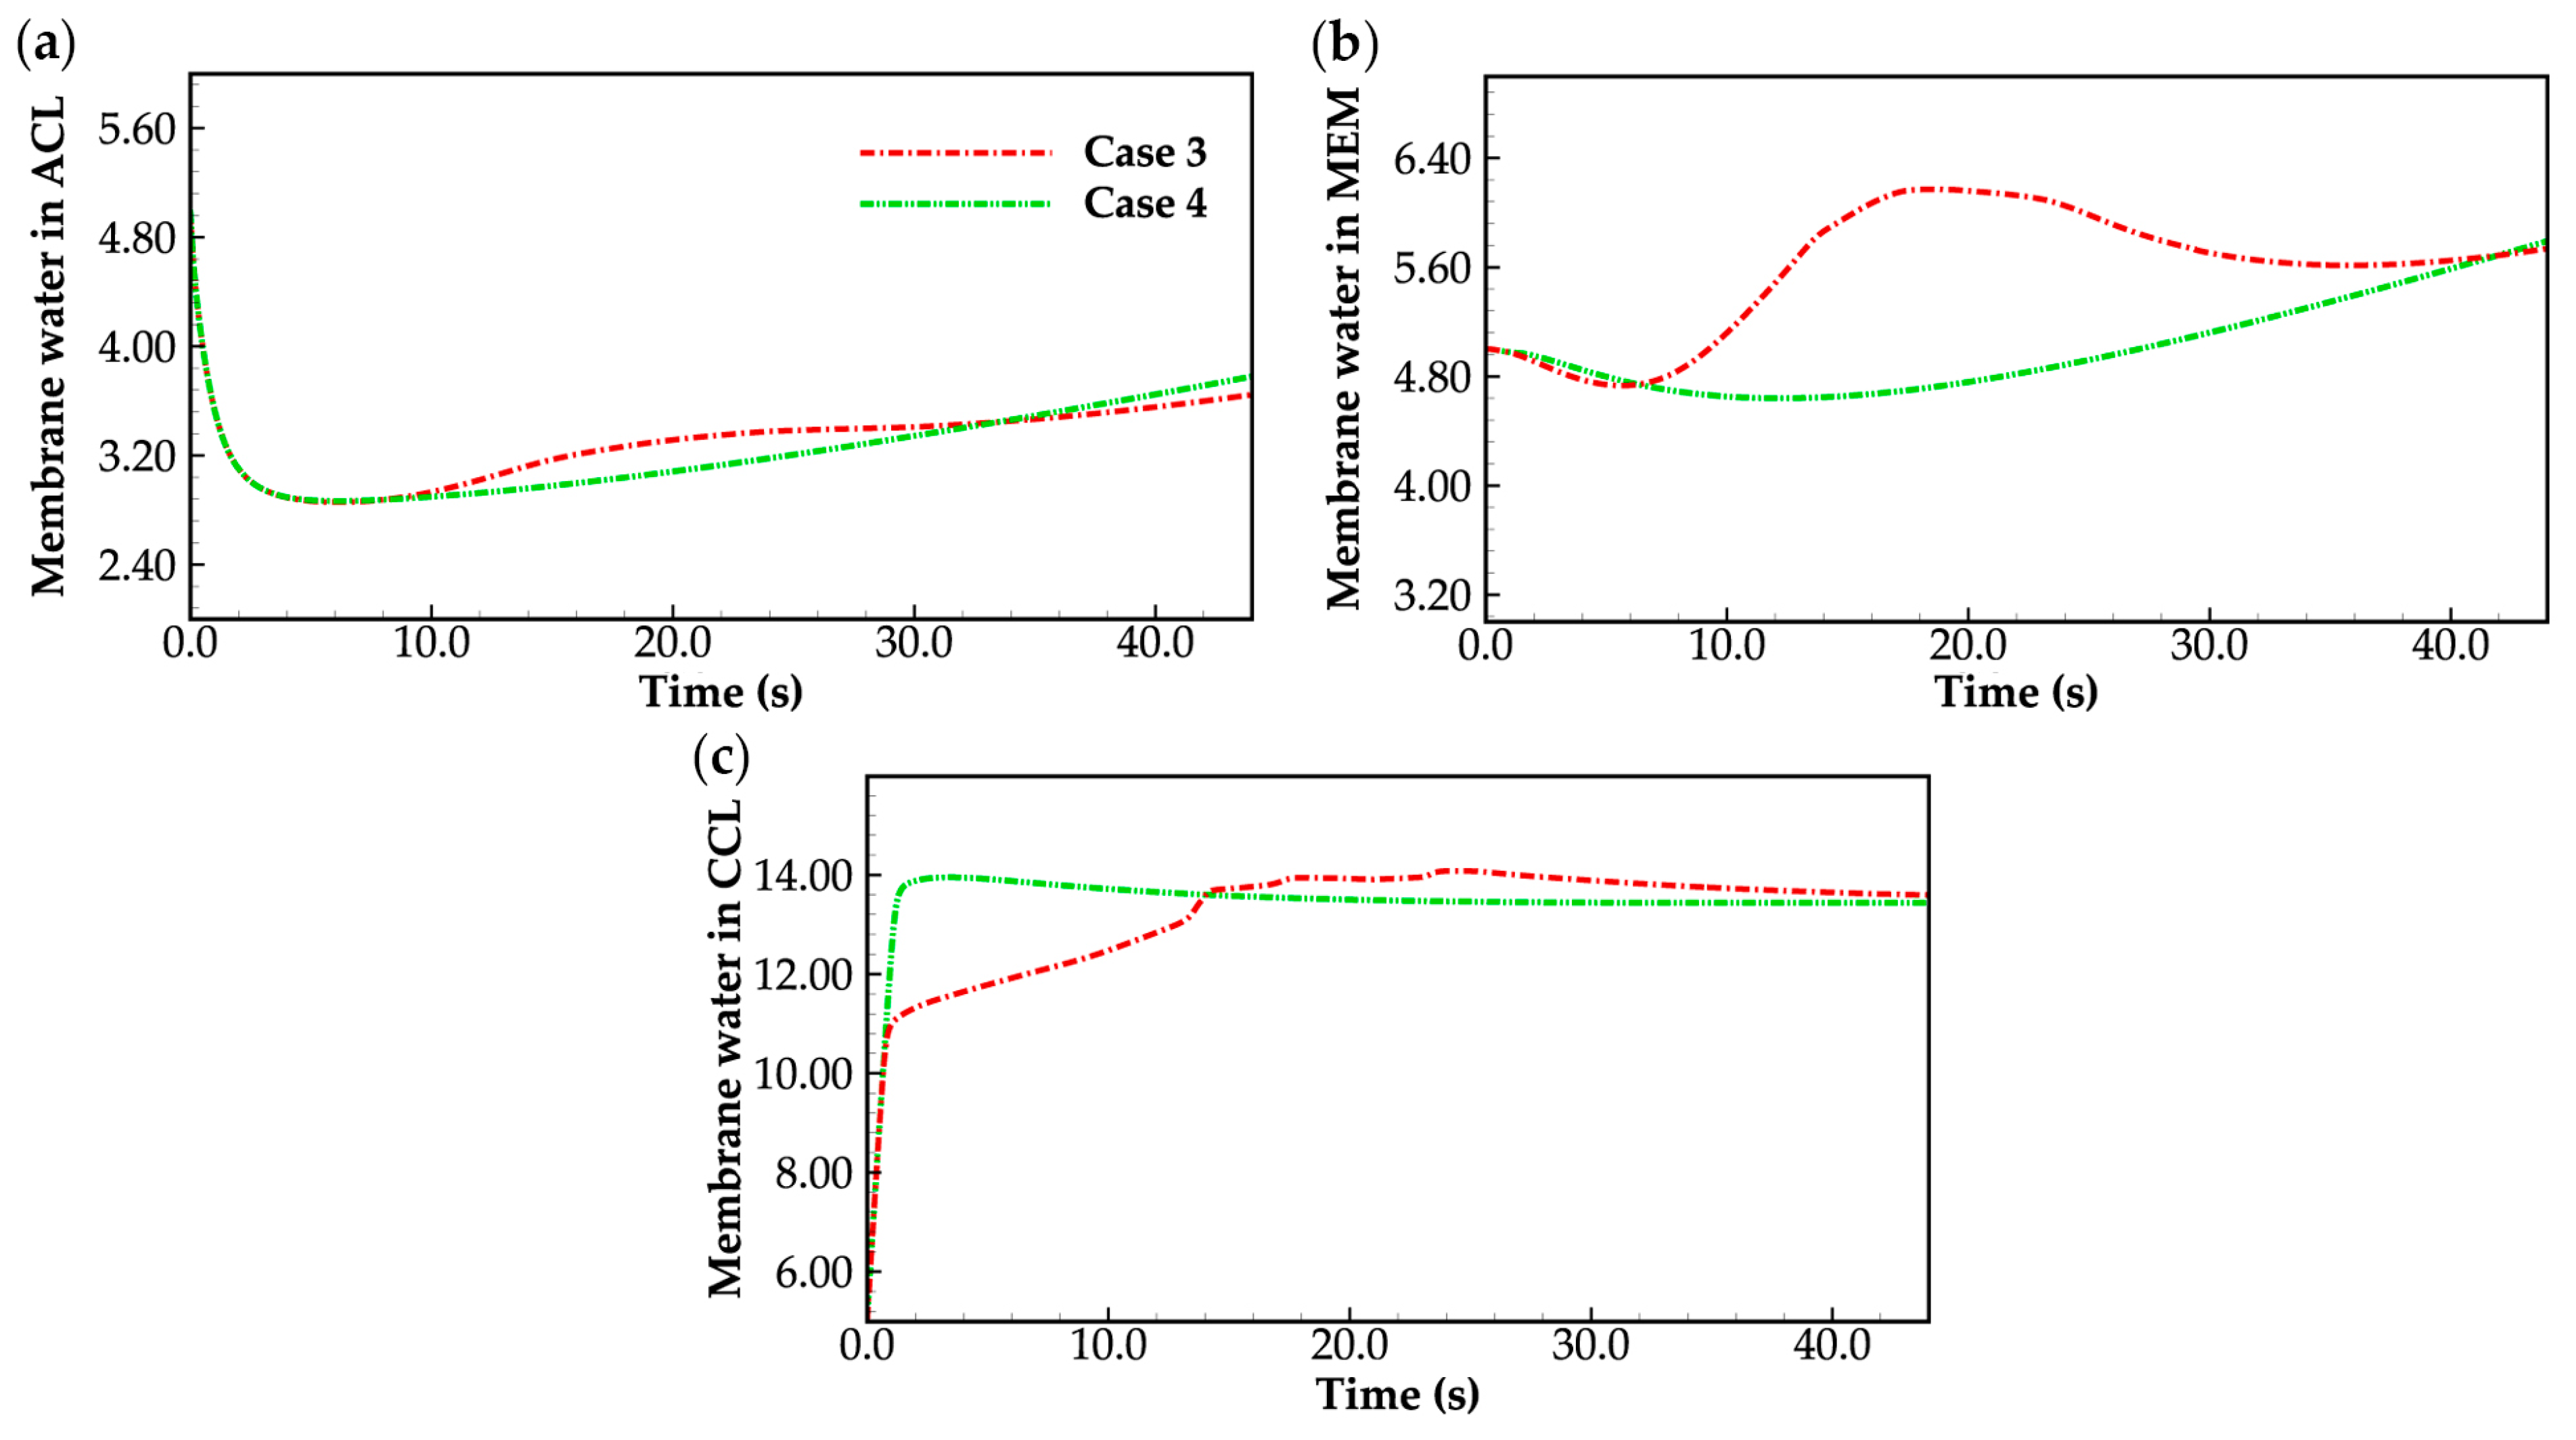
3.2. Effect of the State of Desorbed Water on Cold-Start Process
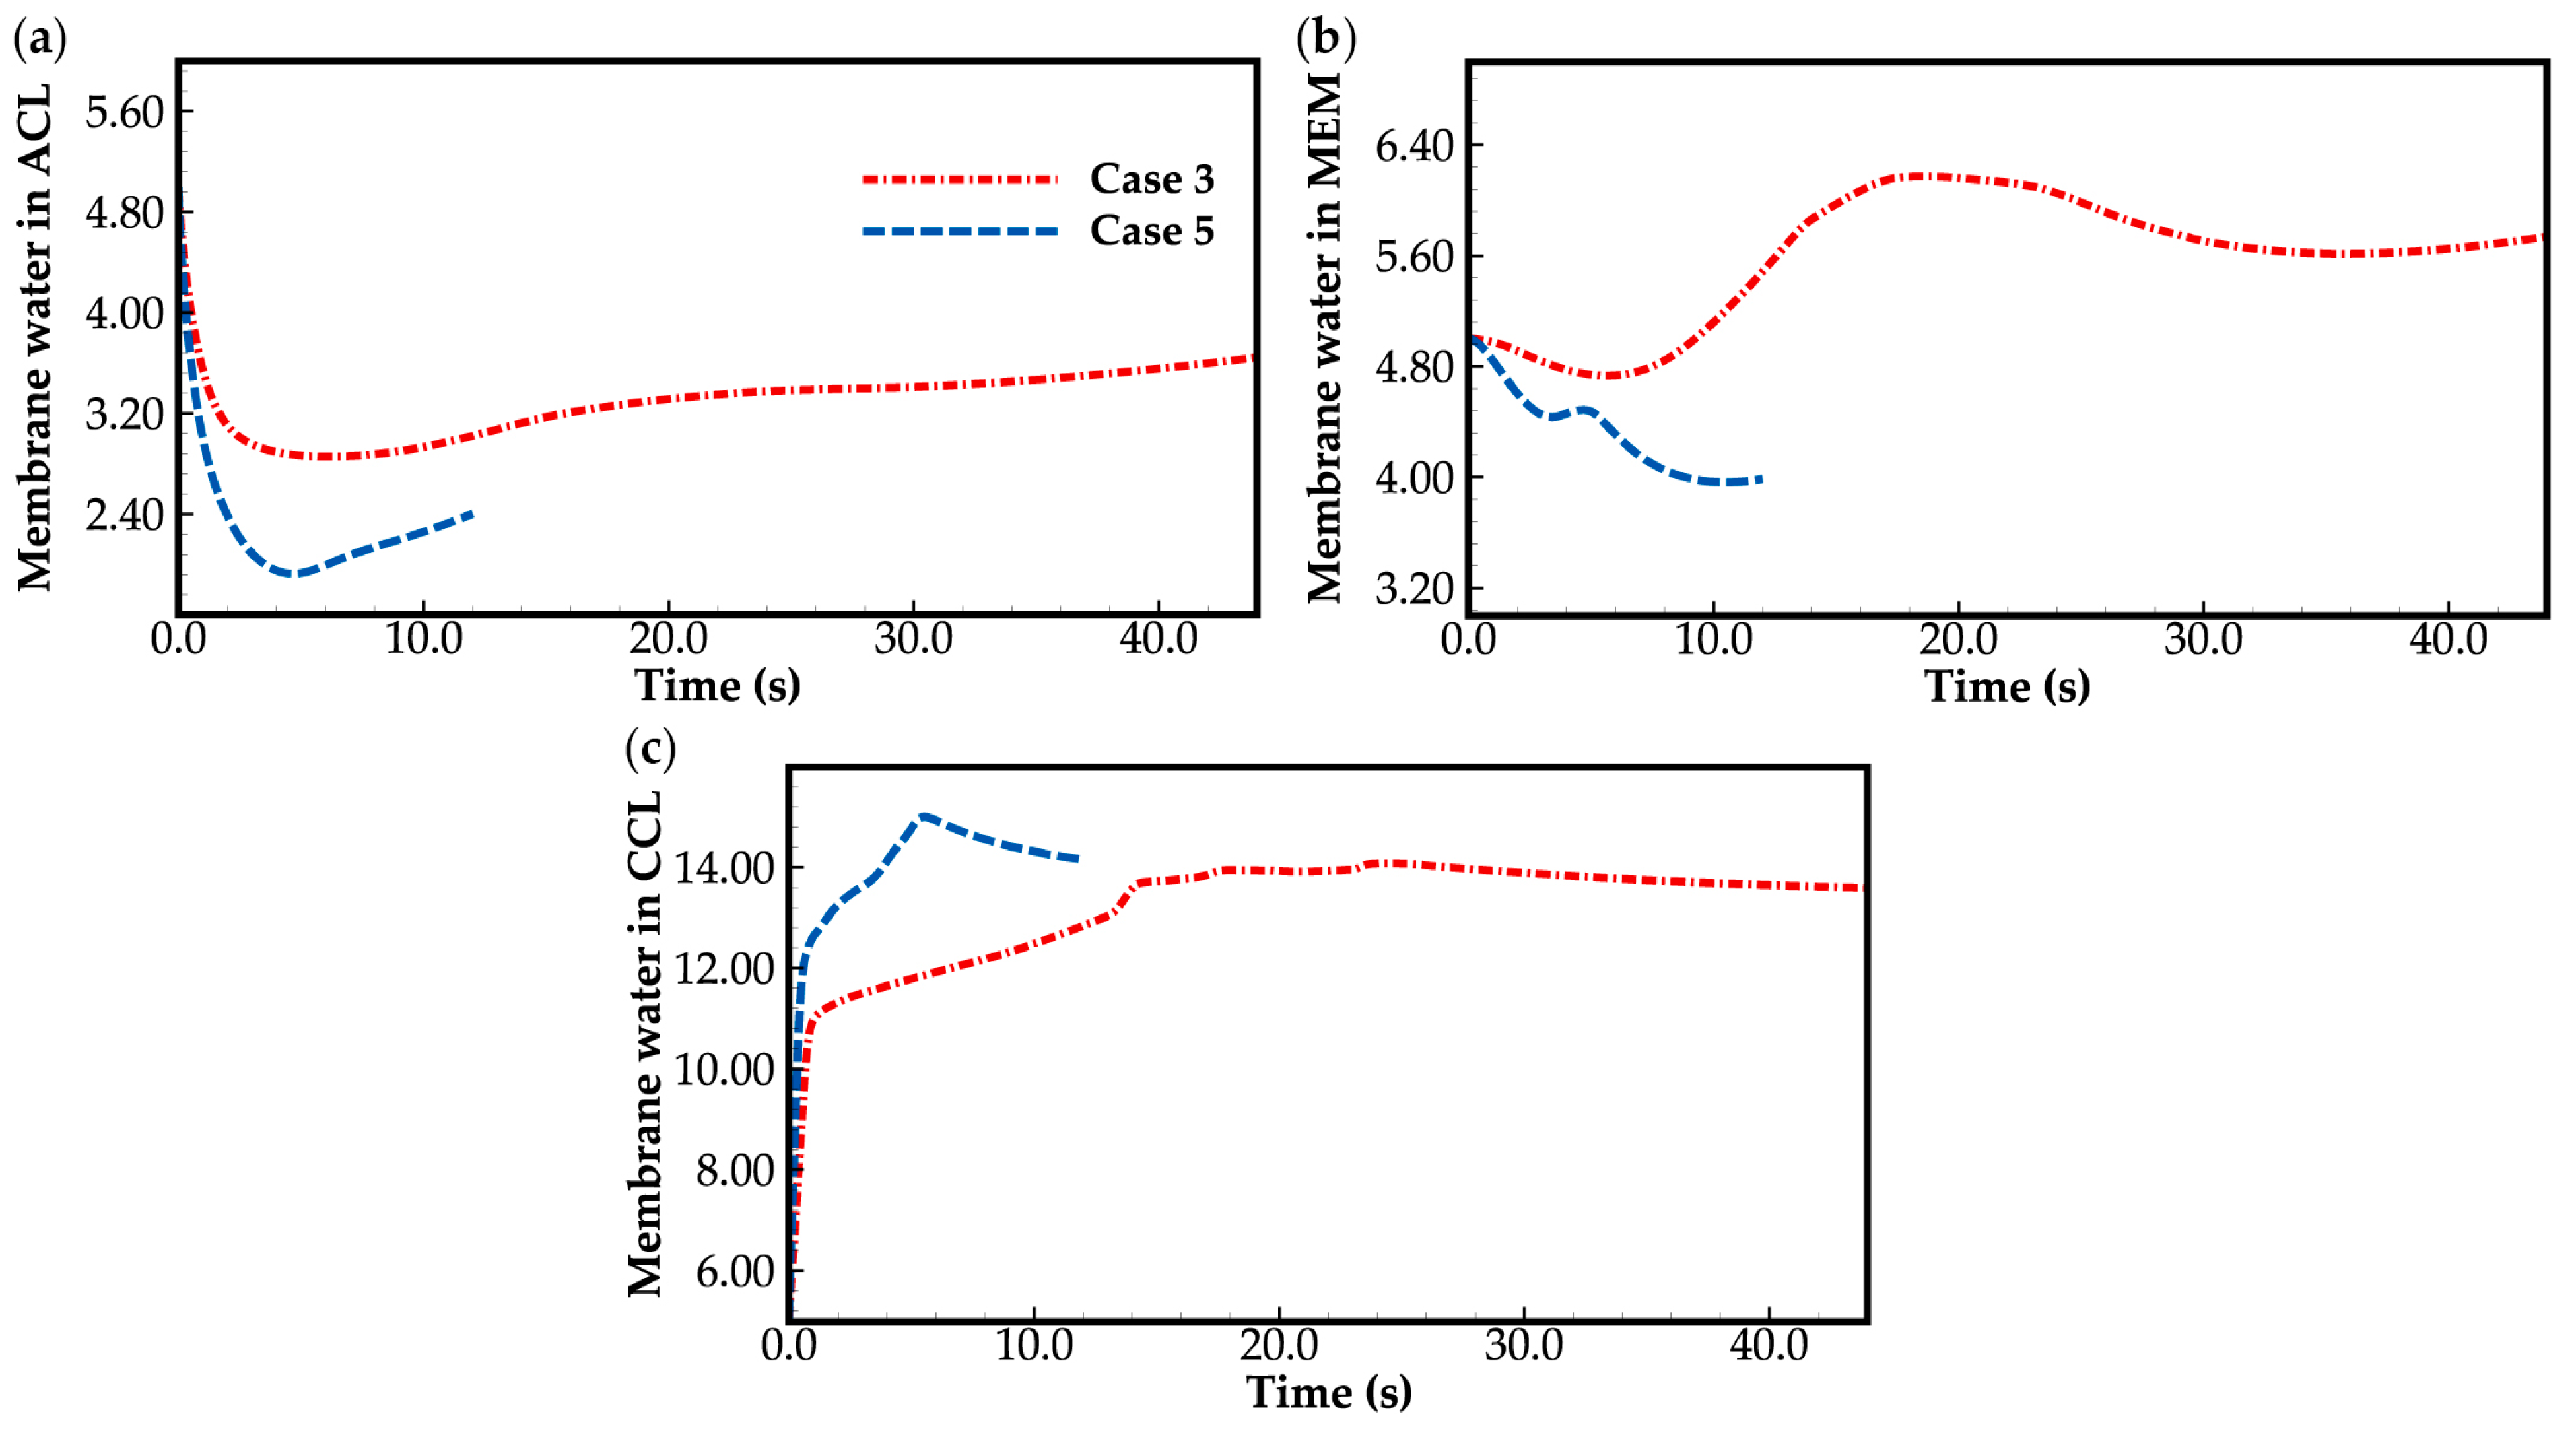
3.3. Effect of Current Density on Cold-Start Process
4. Conclusions
- The model successfully captures the evolution of cell voltage, temperature, membrane water content, and the averaged volume fraction of supercooled water or ice during the cold-start process. In cases where the water desorbed from the electrolyte is in the form of ice and the ambient temperature is sufficiently low, the cold-start process may fail due to ice blockage in the cathode CL. However, when the water desorbed from the electrolyte exists as supercooled water, it can diffuse from the cathode CL to the GDL, preventing clogging of the cathode CL and enabling a successful cold-start process.
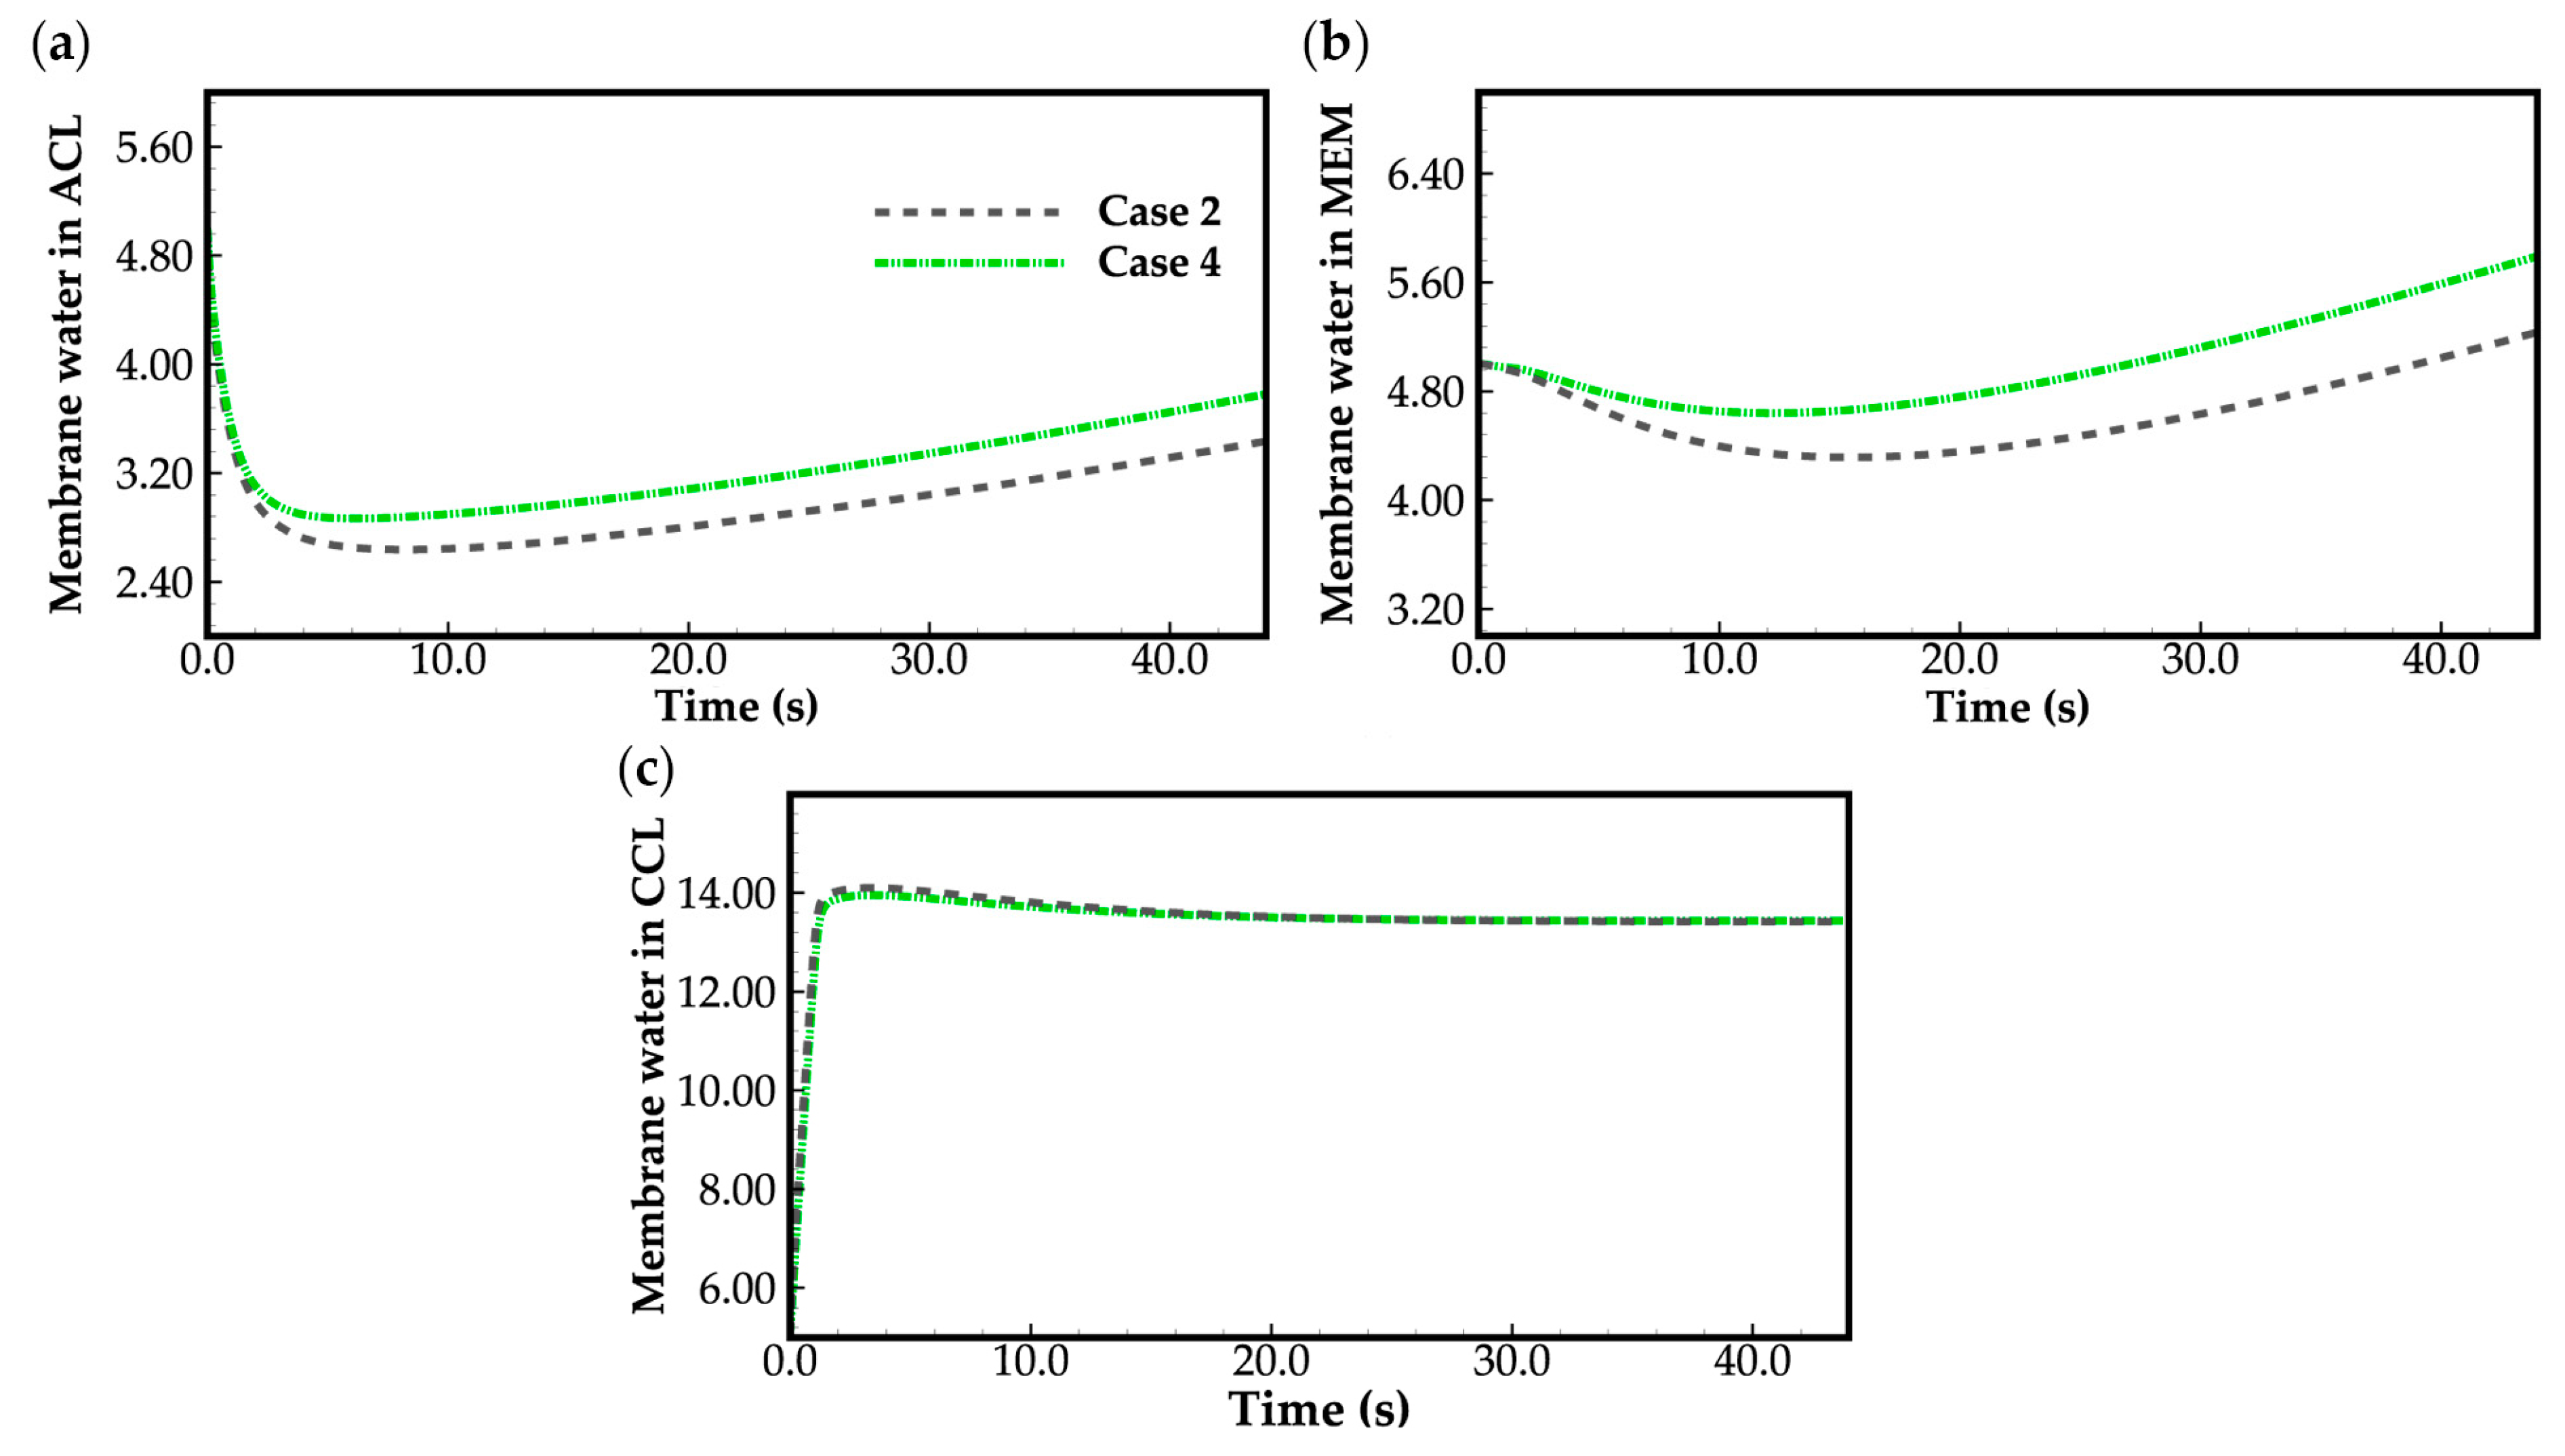
- During the initial stage of the cold-start process, the membrane water content in the cathode CL increases and reaches saturation rapidly, while the membrane water contents in the anode CL and MEM exhibit a decreasing trend. As the cell continues to operate, the membrane water contents in the anode CL and MEM gradually start to increase. Consequently, if the initial membrane water content is relatively low, it may lead to dehydration of the anode CL during the initial cold-start stage.
- In contrast to the cold-start process where the water desorbed from the electrolyte exists in a supercooled state, when the water desorbed from the electrolyte is in the form of ice, it is found that the membrane will become wetter due to the melting process of ice within the cell. We expect this phenomenon to be verified by the cell impedance test in the following study.
- In the case that the anode CL does not dehydrate (e.g., anode humidification), a larger operation current is beneficial to the cold-start process. This is due to the large ohmic heat it causes, which is helpful to increase the rate of cell temperature rise.
Author Contributions
Funding
Data Availability Statement
Conflicts of Interest
Nomenclature
| Water activity | |
| Specific heat, J kg−1 K−1 | |
| Diffusivity, m2 s−1 | |
| Equivalent weight, kg kmol−1 | |
| Faraday’s constant, 96,487 C mol−1 | |
| Exchange current density, A m−3 | |
| Current density, A m−2 | |
| Reaction rate, A m−3 | |
| Thermal conductivity, W m−1 K−1 | |
| Permeability, m2 | |
| Molecular weight, kg mol−1 | |
| Pressure, Pa | |
| Universal gas constant, 8.314 J K−1 mol−1 | |
| Volume fraction | |
| , | Source term |
| Time, s | |
| Time step, s | |
| Temperature, K | |
| Velocity, m s−1 | |
| Cell voltage, V | |
| Mass fraction | |
| Greek Letters | |
| Transfer coefficient | |
| Thickness, μm | |
| Contact angle, | |
| Local over-potential, V | |
| Ionic/electronic conductivity, S m−1 | |
| Membrane water content | |
| Viscosity, Pa s | |
| Density, kg m−3 | |
| Potential, V | |
| Surface tension, N m−1 | |
| Ionomer volume fraction | |
| Subscripts and superscripts | |
| Intrinsic/Initial | |
| an | Anode side |
| ca | Cathode side |
| con | Condensation |
| de-sub | De-sublimation |
| Electrolyte | |
| Effective | |
| equil | Equilibrium |
| evap | Evaporation |
| fl | Fluid phase |
| g | Gas phase |
| i | Ice |
| l | Liquid water |
| m | Mass, for source term |
| melting | Melt of ice |
| mem | Membrane |
| mw | Membrane water |
| n | The nth gas species |
| pc | Phase transition |
| s | Solid phase |
| sat | Saturation |
| Solid phase | |
| Energy, for source term | |
| vap | Vapor |
| Membrane water to liquid water | |
| Membrane water to ice | |
| Membrane water to vapor | |
| Vapor to ice | |
| Vapor to liquid water | |
| Ice to liquid water | |
| O2 | Oxygen |
| H2O | Water |
| H2 | Hydrogen |
References
- Cho, E.A.; Ko, J.J.; Ha, H.Y.; Hong, S.A.; Lee, K.Y.; Lim, T.W.; Oh, I.H. Characteristics of the PEMFC repetitively brought to temperatures below 0 degrees C. J. Electrochem. Soc. 2003, 150, A1667–A1670. [Google Scholar] [CrossRef]
- Tajiri, K.; Tabuchi, Y.; Wang, C.-Y. Isothermal cold start of polymer electrolyte fuel cells. J. Electrochem. Soc. 2007, 154, B147–B152. [Google Scholar] [CrossRef]
- Chen, L.; Nie, Y.-N.; Yu, H.; Tao, W.-Q. Study on the mechanism of destruction triggering of membrane electrode assembly of hydrogen fuel cell. Int. J. Heat Mass Transfer 2020, 159, 120144. [Google Scholar] [CrossRef]
- Luo, Y.; Wu, Y.; Li, B.; Qu, J.; Feng, S.-P.; Chu, P.K. Optimization and cutting-edge design of fuel-cell hybrid electric vehicles. Int. J. Energy Res. 2021, 45, 18392–18423. [Google Scholar] [CrossRef]
- Tajiri, K.; Tabuchi, Y.; Kagami, F.; Takahashi, S.; Yoshizawa, K.; Wang, C.-Y. Effects of operating and design parameters on PEFC cold start. J. Power Sources 2007, 165, 279–286. [Google Scholar] [CrossRef]
- Ge, S.; Wang, C.-Y. Characteristics of subzero startup and water/ice formation on the catalyst layer in a polymer electrolyte fuel cell. Electrochim. Acta 2007, 52, 4825–4835. [Google Scholar] [CrossRef]
- Gwak, G.; Ko, J.; Ju, H. Numerical investigation of cold-start behavior of polymer-electrolyte fuel-cells from subzero to normal operating temperatures Effects of cell boundary and operating conditions. Int. J. Hydrogen Energy 2014, 39, 21927–21937. [Google Scholar] [CrossRef]
- Mao, L.; Wang, C.-Y.; Tabuchi, Y. A multiphase model for cold start of polymer electrolyte fuel cells. J. Electrochem. Soc. 2007, 154, B341–B351. [Google Scholar] [CrossRef]
- Jiang, F.; Fang, W.; Wang, C.-Y. Non-isothermal cold start of polymer electrolyte fuel cells. Electrochim. Acta 2007, 53, 610–621. [Google Scholar] [CrossRef]
- Meng, H. Numerical analyses of non-isothermal self-start behaviors of PEM fuel cells from subfreezing startup temperatures. Int. J. Hydrogen Energy 2008, 33, 5738–5747. [Google Scholar] [CrossRef]
- Meng, H. A PEM fuel cell model for cold-start simulations. J. Power Sources 2008, 178, 141–150. [Google Scholar] [CrossRef]
- Ko, J.; Ju, H. Comparison of numerical simulation results and experimental data during cold-start of polymer electrolyte fuel cells. Appl. Energy 2012, 94, 364–374. [Google Scholar] [CrossRef]
- Gwak, G.; Ju, H. A rapid start-up strategy for polymer electrolyte fuel cells at subzero temperatures based on control of the operating current density. Int. J. Hydrogen Energy 2015, 40, 11989–11997. [Google Scholar] [CrossRef]
- Ishikawa, Y.; Morita, T.; Nakata, K.; Yoshida, K.; Shiozawa, M. Behavior of water below the freezing point in PEFCs. J. Power Sources 2007, 163, 708–712. [Google Scholar] [CrossRef]
- Chang, Y.; Qin, Y.; Yin, Y.; Zhang, J.; Li, X. Humidification strategy for polymer electrolyte membrane fuel cells–A review. Appl. Energy 2018, 230, 643–662. [Google Scholar] [CrossRef]
- Ishikawa, Y.; Hamada, H.; Uehara, M.; Shiozawa, M. Supercooled water behavior inside polymer electrolyte fuel cell cross-section below freezing temperature. J. Power Sources 2008, 179, 547–552. [Google Scholar] [CrossRef]
- Mayrhuber, I.; Marone, F.; Stampanoni, M.; Schmidt, T.J.; Buechi, F.N. Fast X-ray Tomographic Microscopy: Investigating Mechanisms of Performance Drop during Freeze Starts of Polymer Electrolyte Fuel Cells. ChemElectroChem 2015, 2, 1551–1559. [Google Scholar] [CrossRef]
- Roth, J.; Zurbrueg, M.; Irvine, S.; Marone, F.; Stampanoni, M.; Buechi, F.N. Investigation of PEFC Freeze Start by X-Ray Tomographic Microscopy. In Proceedings of the 13th Polymer Electrolyte Fuel Cell Symposium (PEFC), San Francisco, CA, USA, 27 October–1 November 2013; pp. 453–462. [Google Scholar]
- Oberholzer, P.; Boillat, P.; Siegrist, R.; Perego, R.; Kaestner, A.; Lehmann, E.; Scherer, G.G.; Wokaun, A. Cold-Start of a PEFC Visualized with High Resolution Dynamic In-Plane Neutron Imaging. J. Electrochem. Soc. 2012, 159, B235–B245. [Google Scholar] [CrossRef]
- Stahl, P.; Biesdorf, J.; Boillat, P.; Friedrich, K.A. An Investigation of PEFC Sub-Zero Startup: Evidence of Local Freezing Effects. J. Electrochem. Soc. 2016, 163, F1535–F1542. [Google Scholar] [CrossRef]
- Biesdorf, J.; Forner-Cuenca, A.; Siegwart, M.; Schmidt, T.J.; Boillat, P. Statistical Analysis of Isothermal Cold Starts of PEFCs: Impact of Gas Diffusion Layer Properties. J. Electrochem. Soc. 2016, 163, F1258–F1266. [Google Scholar] [CrossRef]
- Stahl, P.; Biesdorf, J.; Boillat, P.; Friedrich, K.A. An Investigation of PEFC Sub-Zero Startup: Influence of Initial Conditions and Residual Water. Fuel Cells 2017, 17, 778–785. [Google Scholar] [CrossRef]
- Yang, Z.; Du, Q.; Huo, S.; Jiao, K. Effect of membrane electrode assembly design on the cold start process of proton exchange membrane fuel cells. Int. J. Hydrogen Energy 2017, 42, 25372–25387. [Google Scholar] [CrossRef]
- Li, Y.; Pei, P.; Wu, Z.; Ren, P.; Jia, X.; Chen, D.; Huang, S. Approaches to avoid flooding in association with pressure drop in proton exchange membrane fuel cells. Appl. Energy 2018, 224, 42–51. [Google Scholar] [CrossRef]
- Huo, S.; Jiao, K.; Park, J.W. On the water transport behavior and phase transition mechanisms in cold start operation of PEM fuel cell. Appl. Energy 2019, 233, 776–788. [Google Scholar] [CrossRef]
- Yao, L.; Peng, J.; Zhang, J.-b.; Zhang, Y.-j. Numerical investigation of cold-start behavior of polymer electrolyte fuel cells in the presence of supercooled water. Int. J. Hydrogen Energy 2018, 43, 15505–15520. [Google Scholar] [CrossRef]
- Yao, L.; Ma, F.; Peng, J.; Zhang, J.; Zhang, Y.; Shi, J. Analysis of the Failure Modes in the Polymer Electrolyte Fuel Cell Cold-Start Process-Anode Dehydration or Cathode Pore Blockage. Energies 2020, 13, 256. [Google Scholar] [CrossRef]
- Wang, C.Y. Fundamental models for fuel cell engineering. Chem. Rev. 2004, 104, 4727–4765. [Google Scholar] [CrossRef] [PubMed]
- Springer, T.E.; Zawodzinski, T.A.; Gottesfeld, S. polymer electrolyte fuel-cell model. J. Electrochem. Soc. 1991, 138, 2334–2342. [Google Scholar] [CrossRef]
- Satterfield, M.B.; Benziger, J.B. Non-Fickian water vapor sorption dynamics by Nafion membranes. J. Phys. Chem. B 2008, 112, 3693–3704. [Google Scholar] [CrossRef]
- Murphy, D.M.; Koop, T. Review of the vapour pressures of ice and supercooled water for atmospheric applications. Q. J. R. Meteorol. Soc. 2005, 131, 1539–1565. [Google Scholar] [CrossRef]
- Gallagher, K.G.; Pivovar, B.S.; Fuller, T.F. Electro-osmosis and Water Uptake in Polymer Electrolytes in Equilibrium with Water Vapor at Low Temperatures. J. Electrochem. Soc. 2008, 156, B330–B338. [Google Scholar] [CrossRef]


| Description | Symbol | Value | Unit |
|---|---|---|---|
| Length, width, height/rib of GC | - | 50/1.0/1.0/1.0 | mm |
| Thickness of BP/GDL/CL/MEM | 2.0/0.2/0.01/0.03 | mm | |
| Density of BP/GDL/CL/MEM | 2230/1230/1230/1980 | kg m−3 | |
| Specific heat capacities of BP/GDL/CL/MEM | 1071/462/2683/833 | J kg−1 K−1 | |
| Thermal conductivity of BP/GDL/CL/MEM | 20/1.5/1.2/0.95 | W m−1 K−1 | |
| Electronic conductivity of BP/GDL/MPL/CL | 20,000/300/300/300 | S m−1 | |
| Porosity of GDL/CL | 0.78/0.43 | - | |
| Contact angle in pore GDL/CL | 140/100 | ||
| Pore radii of GDL/CL | 3.89 × 10⁻⁵/1.2 × 10−8 | m | |
| Permeability of GDL/CL | 10−12/10−13 | m2 | |
| Ionomer volume fraction in CL | 0.15 | - | |
| Equivalent weight of MEM | 1100 | kg kmol−1 | |
| Density of liquid water/ice | 998.2/920 | kg m−3 | |
| Dynamic viscosity of water | 1.01 × 10⁻³ | Pa s | |
| Specific heat capacities of liquid water/ice | 4182/2050 | J kg−1 K−1 | |
| Thermal conductivity of liquid water/ice | 0.6/0.22 | W m−1 K−1 |
| Sources | Expression | Application Domain |
|---|---|---|
| anode CL | ||
| cathode CL | ||
| GDLs | ||
| CLs and GDLs | ||
| anode CL | ||
| cathode CL | ||
| GDLs | ||
| anode CL cathode CL membrane | ||
| CLs | ||
| GDLs | ||
| CLs | ||
| GDLs | ||
| , | , | Anode CL |
| , | Cathode CL | |
| anode CL | ||
| cathode CL | ||
| membrane | ||
| GDLs | ||
| BPs |
| Case No. | Ambient Temperature (K) | Water State | Current Density (A cm−2) |
|---|---|---|---|
| 1 | 258 | Ice | 0.3 |
| 2 | 258 | Supercooled water | 0.3 |
| 3 | 263 | Ice | 0.3 |
| 4 | 263 | Supercooled water | 0.3 |
| 5 | 263 | ice | 0.6 |
Disclaimer/Publisher’s Note: The statements, opinions and data contained in all publications are solely those of the individual author(s) and contributor(s) and not of MDPI and/or the editor(s). MDPI and/or the editor(s) disclaim responsibility for any injury to people or property resulting from any ideas, methods, instructions or products referred to in the content. |
© 2023 by the authors. Licensee MDPI, Basel, Switzerland. This article is an open access article distributed under the terms and conditions of the Creative Commons Attribution (CC BY) license (https://creativecommons.org/licenses/by/4.0/).
Share and Cite
Chen, Y.; Li, S.; Peng, J.; Zhuge, W.; Zhang, Y. Numerical Simulation of the Cold-Start Process of Polymer Electrolyte Fuel Cell. Energies 2023, 16, 6081. https://doi.org/10.3390/en16166081
Chen Y, Li S, Peng J, Zhuge W, Zhang Y. Numerical Simulation of the Cold-Start Process of Polymer Electrolyte Fuel Cell. Energies. 2023; 16(16):6081. https://doi.org/10.3390/en16166081
Chicago/Turabian StyleChen, Yazhou, Sheng Li, Jie Peng, Weilin Zhuge, and Yangjun Zhang. 2023. "Numerical Simulation of the Cold-Start Process of Polymer Electrolyte Fuel Cell" Energies 16, no. 16: 6081. https://doi.org/10.3390/en16166081
APA StyleChen, Y., Li, S., Peng, J., Zhuge, W., & Zhang, Y. (2023). Numerical Simulation of the Cold-Start Process of Polymer Electrolyte Fuel Cell. Energies, 16(16), 6081. https://doi.org/10.3390/en16166081