Article

Large Eddy Simulation of Externally Induced Ingress about an Axial Seal by Stator Vanes

1
School of Aeronautics and Astronautics, Purdue University, West Lafayette, IN 47907, USA
2
Ames National Laboratory, United States Department of Energy, Ames, IA 50011, USA
3
National Energy Technology Laboratory, United States Department of Energy, Morgantown, WV 26505, USA
*
Author to whom correspondence should be addressed.
Energies 2023, 16(16), 5985; https://doi.org/10.3390/en16165985
Submission received: 1 July 2023 / Revised: 2 August 2023 / Accepted: 9 August 2023 / Published: 15 August 2023

Abstract

:
Turbine inlet temperatures in advanced gas turbines could be as high as 2000 °C. To prevent ingress of this hot gas into the wheelspace between the stator and rotor disks, whose metals can only handle temperatures up to 850 °C, rim seals and sealing flows are used. This study examines the abilities of large eddy simulation (LES) based on the WALE subgrid model and Reynolds-averaged Navier–Stokes (RANS) based on the SST model in predicting ingress in a rotor–stator configuration with vanes but no blades, a configuration with experimental data for validation. Results were obtained for an operating condition, where the ratio of the external Reynolds number to the rotational Reynolds number is 0.538. At this operating condition, both LES and RANS were found to correctly predict the coefficient of pressure, Cp, located downstream of the vanes and upstream of the seal, but only LES was able to correctly predict the sealing effectiveness. This shows Cp by itself is inadequate in quantifying externally induced ingress. RANS was unable to predict the sealing effectiveness because it significantly under predicted the pressure drop in the hot gas path along the axial direction, especially about the seal region. This affected the pressure difference across the seal in the radial direction, which ultimately drives ingress.

1. Introduction

The efficiency of gas turbines increases with the turbine inlet temperature (TIT). In advanced gas turbines, TITs are as high as 2000 °C. This hot gas could enter into the wheelspace between the stator disk and the rotor disk because of the pressure variations induced by the stator’s vanes, the rotor and its rotation, and the blades. The ingress of hot gas into the wheelspace could damage the stator and rotor disks because the metal used to make those disks could only handle temperatures up to about 850 °C. To prevent or minimize ingress, rim seals are used to increase the discharge coefficient, and sealing flows are used to increase the pressure in the wheelspace. Since the sealing flow is extracted from the compressor, flow that could be used for propulsion, it must be minimized for efficiency. For an advanced two-stage gas turbine, a 50% reduction in the required sealing flow could increase the turbine efficiency by 0.5% and result in a 0.9% reduction in fuel consumption [1]. To eliminate ingress with minimum sealing flow requires detailed understanding on how vanes, blades, and the rotor’s rotation induce ingress. A recent review on the flow mechanisms of ingress is given by Chew et al. [2]. In this study, the focus is on ingress induced by stator vanes, and this is referred to as externally induced (EI) ingress.
Bohn and co-workers experimentally studied EI ingress [3,4,5]. They showed ingress to increase with an increase in pressure asymmetries induced by stator vanes on the platform [3]. They also showed ingress to increase with an increase in the external Reynolds number, Rew, for all seals studied whether or not there are blades, but this is not true for rotational Reynolds number, Re ϕ , where the amount of ingress does depend on the seal geometry [4,5]. Green and Turner [6] experimentally studied ingress and showed that ingress is higher in a rotor–stator configuration if stator vanes are kept but rotor blades are removed. Sangan et al. [7] experimentally studied ingress in a one-stage turbine and showed the pressure coefficient (Cp) on the platform downstream of the stator vanes to be the dominant parameter controlling ingress. Sangan et al. [8] experimentally studied rotationally induced (RI) ingress with axial and radial seals and showed RI ingress could be prevented by using less sealing flow rate than that needed to prevent EI ingress. In the experimental study by Roy et al. [9], they showed the instantaneous pressure field to contain an unsteady blade periodic component and a circumferential variation which follows the vane pitch that depended on the flow rate in the hot gas path, the rotor’s angular speed, and the sealing flow rate.
Computational studies on hot gas ingestion into rim seals have also been conducted [10,11,12,13,14,15,16]. Laskowski et al. [10] used steady and unsteady Reynolds-averaged Navier–Stokes (RANS) to study ingress in a rotor–stator configuration with stator vanes but no rotor blades. Their study showed predictions made by unsteady RANS to be better than those made by steady RANS when compared with experimental data. Zhou et al. [11] used unsteady RANS based on the shear-stress transport (SST) model to study ingress in a turbine stage with three different rim seals. They confirmed the observation by Sangan et al. [7] that Cp dominates EI ingress. O’Mahoney et al. [12] used large eddy simulation (LES) to study ingress in a 13.33° sector of a turbine stage with one vane passage and two blade passages. Their study showed LES to provide closer agreement with experimentally measured sealing effectiveness, and that LES predicts higher levels of ingress than unsteady RANS. Liu et al. [13] showed steady RANS to predict with reasonable accuracy the pressure distribution induced by stator vanes and the swirl in the wheelspace, but unable to accurately predict ingress into the wheelspace. They also showed that if an inertial frame is used for the stator and a noninertial frame is used for the rotor, then the location where the two frames meet in the wheelspace must be downstream of the rim seal but upstream of the rotor. Nketia et al. [14] used LES and RANS to study RI ingress in a rotor–stator configuration with an axial seal and without vanes and blades. Their study showed RI ingress to be created by alternating regions of high and low pressures on the rotor side of the seal formed by Kelvin–Helmholtz instability above the rotor and by vortex shedding in the seal clearance. They also showed RI ingress to start on the rotor side of the seal. Pehle et al. [15] used unsteady RANS with the SST model to study a 1.5 stage turbine with vanes and blades. Two sector sizes were examined—a 22.5 degree sector with one vane passage and a 112.5 degree sector with five vane passages. They found the larger sector size was needed to resolve the large scale flow structures in the wheelspace. Vella et al. [16] examined the usefulness of the hybrid RANS/LES to predict ingress in a one-stage turbine with vanes and blades, where a 26 degree sector involving two vanes and four blades were simulated. They showed the hybrid RANS/LES to predict better than unsteady RANS.
The literature review given above shows experimental studies to have identified key parameters affecting ingress and provided data on the effects of those parameters. On computational studies, previous work highlighted issues connected to accuracy in predicting ingress. Nketia et al. [14] and Chew et al. [17] assessed the ability and the accuracy of LES and RANS to study flow mechanisms creating RI ingress. The objective of this study is to continue that effort in assessing the ability and accuracy of LES and RANS in predicting flow mechanisms creating EI ingress in a rotor–stator configuration with stator vanes but no rotor blades, a configuration with experimental data for validation. The operating condition chosen for study has R e w / R e ϕ = 0.538 —a condition where both externally and rotationally induced ingress play important roles.
The remainder of this paper is organized as follows. First, the rotor–stator configuration studied is described. Next, the governing equations and numerical methods used are summarized. This is followed by verification, validation, presentation of results, and summary of key findings.

2. Problem Description

A schematic of the rotor–stator configuration studied is shown in Figure 1. The hot gas path starts at the inlet of a long annular duct of length L1 = 476 mm and height h2 = 25 mm. This long annulus smoothly merges with a smaller annulus which contains the stator vanes. The height of the smaller annulus is h = 10 mm, and its inner radius is r1 = 195 mm. The distance between the trailing edge of the stator vane to the beginning of the axial seal located at z = −sc (sc = 2 mm) is Ld = 6 mm. The thickness of the rim seal on the stator side is dc = 5 mm. The clearance of the axial seal is between z = −sc and z = 0 mm, and the distance between the stator disk and the rotor disk is s = 20 mm. The rotor hub has a radius of ro = 193.8 mm, and the annulus with the rotor has a height of h3 = 11.233 mm. A non-rotating annulus of length Lext = 50 mm is appended to the exit of the annulus with the rotor to ensure no reverse flow at the outflow boundary. For this appended annulus, the heat flux and shear stress on the walls are zero.
For the configuration just described, the gas that enters the hot gas path at the inflow boundary ( z = L 1 L 2 L 3 L s L d s c ) is air with a temperature of Th = 23.34 °C and a mass flow rate of m ˙ h = 0.484 kg/s, which results in an external Reynolds number of Rew = 4.06 × 10 5 . The pressure at the exit of the hot gas path, the outflow boundary ( z =   L rot + L ext ), is P b = 101 , 325 Pa. The sealing flow that enters from the bottom of the wheelspace is air with 5% CO2 by mass, which corresponds to a concentration of co = 0.001384 kmol/m3. The sealing flow has a mass flow rate of m ˙ c = 0.0068 kg/s and a temperature of T c = 23.34   ° C , amounting to a nondimensional sealing flow rate of C W = 2027 . The rotor rotates at a constant angular velocity of ω = 3000 RPM, which gives rise to R e ϕ = 7.56 × 10 5 . All solid surfaces, except walls of the extended annulus, are isothermal at Tw = 23.34 °C and no slip. A simulation was also performed with no vanes and no blades to assess the impact of RI on this rotor–stator configuration.
The aforementioned configuration and operating condition were selected because they match an experimental study by Sangan et al. [7] with data that can be used to validate this study. Also, the operating condition studied is meaningful because it corresponds to a ratio of external to rotational Reynolds number of R e w / R e ϕ = V h / ω r o = 0.538 , where both EI ingress and RI ingress play important roles. The V h in R e w / R e ϕ = V h / ω r o is the mean axial velocity in the hot gas path.

3. Problem Formulation

LES and steady RANS were used to study the problem described in the previous section. For the rotor–stator configuration with vanes, only a θo = 22.5-degree sector was studied, and this sector size includes two vanes. For the rotor–stator configuration without vanes, a θo = 11.25-degree sector was studied. Periodic conditions were imposed at the two r-z periodic boundary planes.
The governing equations used for LES are the spatially filtered continuity, species, Navier–Stokes, and energy for a thermally and calorically perfect gas mixture. The species balance equation was used to track the concentration of the CO2 injected with the sealing flow. The subgrid scale stress, τ i j , is modeled as
τ ˜ i j = 2 ν s g s S ^ i j + 1 3 τ ˜ k k δ i j
where ν s g s is the subgrid scale turbulent viscosity, and S ^ i j is the filtered strain rate. In this study, ν s g s was modelled by the WALE model [18] given by
ν s g s = ( C L E S Δ ) 2 ( S i j d S i j d ) 3 2 ( S ^ i j S ^ i j ) 5 2 ( S i j d S i j d ) 5 4
S i j d = S ^ i k S ^ k j +   Ω ^ i k   Ω ^ k j 1 3 ( S ^ m n S ^ m n   Ω ^ m n   Ω ^ m n ) δ i j
where C L E S = 0.325 ; Δ is the cutoff width (grid spacing was used); and   Ω ^ i j is the rotation rate. Since the WALE model produces proper scaling (namely, υ s g s ~ y 3 ) near the wall, it does not require damping functions. Also, this model is sensitive to both strain and rotation rates of the resolved smaller structures. The subgrid scale turbulent thermal conductivity and species diffusion were obtained by setting the subgrid scale turbulent Prandtl and Schmidt numbers to be 0.85 and 0.7, respectively.
For LES, the inflow boundary condition is a challenge since the unsteady turbulent structures are unknown there. In this study, a mean velocity profile from a “full-developed” RANS solution based on incompressible flow was imposed at the inlet of the hot gas path, and synthetic turbulence was applied to initiate the turbulent fluctuations [19]. For the synthetic turbulence, the turbulence intensity and length scale were set at 3% and 25 mm, respectively. The length of the annulus preceding the stator vanes was made long enough (L1 = 476 mm) to ensure physically meaningful turbulent characteristics could be developed before reaching the stator vanes. The initial condition used for the LES is the RANS solution based on incompressible flow. At the outflow boundary, the back pressure was imposed and fluctuating components were extrapolated. At the inlet of the wheelspace, the mass flow rate, temperature, and mass fraction of CO2 were specified. All solid surfaces, except those on the appended annulus, are isothermal and no slip.
For RANS, the governing equations employed are the time averaged continuity, species, Navier–Stokes, and energy equations for a thermally and calorically perfect gas mixture. The turbulent viscosity was modeled by using the SST model [20]. The turbulent thermal conductivity and species diffusion coefficient were obtained by connecting them to the turbulent viscosity through the turbulent Prandtl and Schmidt numbers, which were set equal to 0.85 and 0.7, respectively. The boundary conditions used are as follows. At the inflow boundary, mass flow rate and temperature were specified. At the inlet of the wheelspace, the mass flow rate, temperature, and mass fraction of the CO2 were specified. Static pressure was specified at the outflow boundary. On all solid surfaces, except those of the appended annulus, the walls were isothermal and no slip.

4. Numerical Method of Solution

Solutions to the governing equations for LES and RANS were obtained by using ANSYS Fluent Version 22.1 [21]. For LES, the time derivatives were approximated by the bounded second-order implicit scheme, and all spatial derivatives were approximated by second-order central formulas. When there are vanes, the coupled scheme was used as the solver. When there are no vanes, the solver used was the SIMPLE scheme with PRESTO for pressure interpolation [22]. At the end of each time step in the LES, the “scaled” residuals plateaued and were <10−5 for continuity, <10−7 for the three components of the velocity, and <10−7 for CO2 concentration. The LES was run until statistically stationary solutions were obtained, which took three revolutions of the rotor if there are no vanes and eight revolutions if there are vanes. Once the LES solution became statistically stationary, it was time averaged to obtain the mean flow variables. The time averaging required two revolutions of the rotor without vanes and four with vanes. The simulation without vanes took about 700 CPU hours with 96 CPUs, and the simulations with vanes took about 1000 CPU hours with 128 CPUs. For steady RANS, the second-order upwind was used for all advection terms and the second-order central was used for all diffusion terms. The coupled scheme was used to generate solutions. At convergence, the “scaled” residuals plateaued and were <10−4 for continuity, <10−8 for the three components of the velocity, <10−8 for CO2 concentration, and <10−8 for the turbulence quantities. All grids used are structured and made up of hexahedral elements. The grids used are smooth when transitioning in grid spacing, and all grid lines are nearly orthogonal. Details of the grids used are given in the section on Verification and Validation.

5. Results and Discussion

In this section, the results from the verification and validation studies are first given. Next, the flow fields in the rotor–stator configuration with and without stator vanes are presented.

5.1. Verification and Validation

The verification and the validation of the computational study were performed by simulating three problems with experimental data for validation. The problems are (1) fully developed incompressible turbulent flow in an annulus, (2) a rotor–stator configuration without vanes, and (3) the rotor–stator configuration shown in Figure 1. The details of the grid sensitivity for the first two problems were reported in Ref. [13]. The grids used for the RANS and LES of the third problem were obtained based on understanding gained from the grid sensitivity on the first two problems.
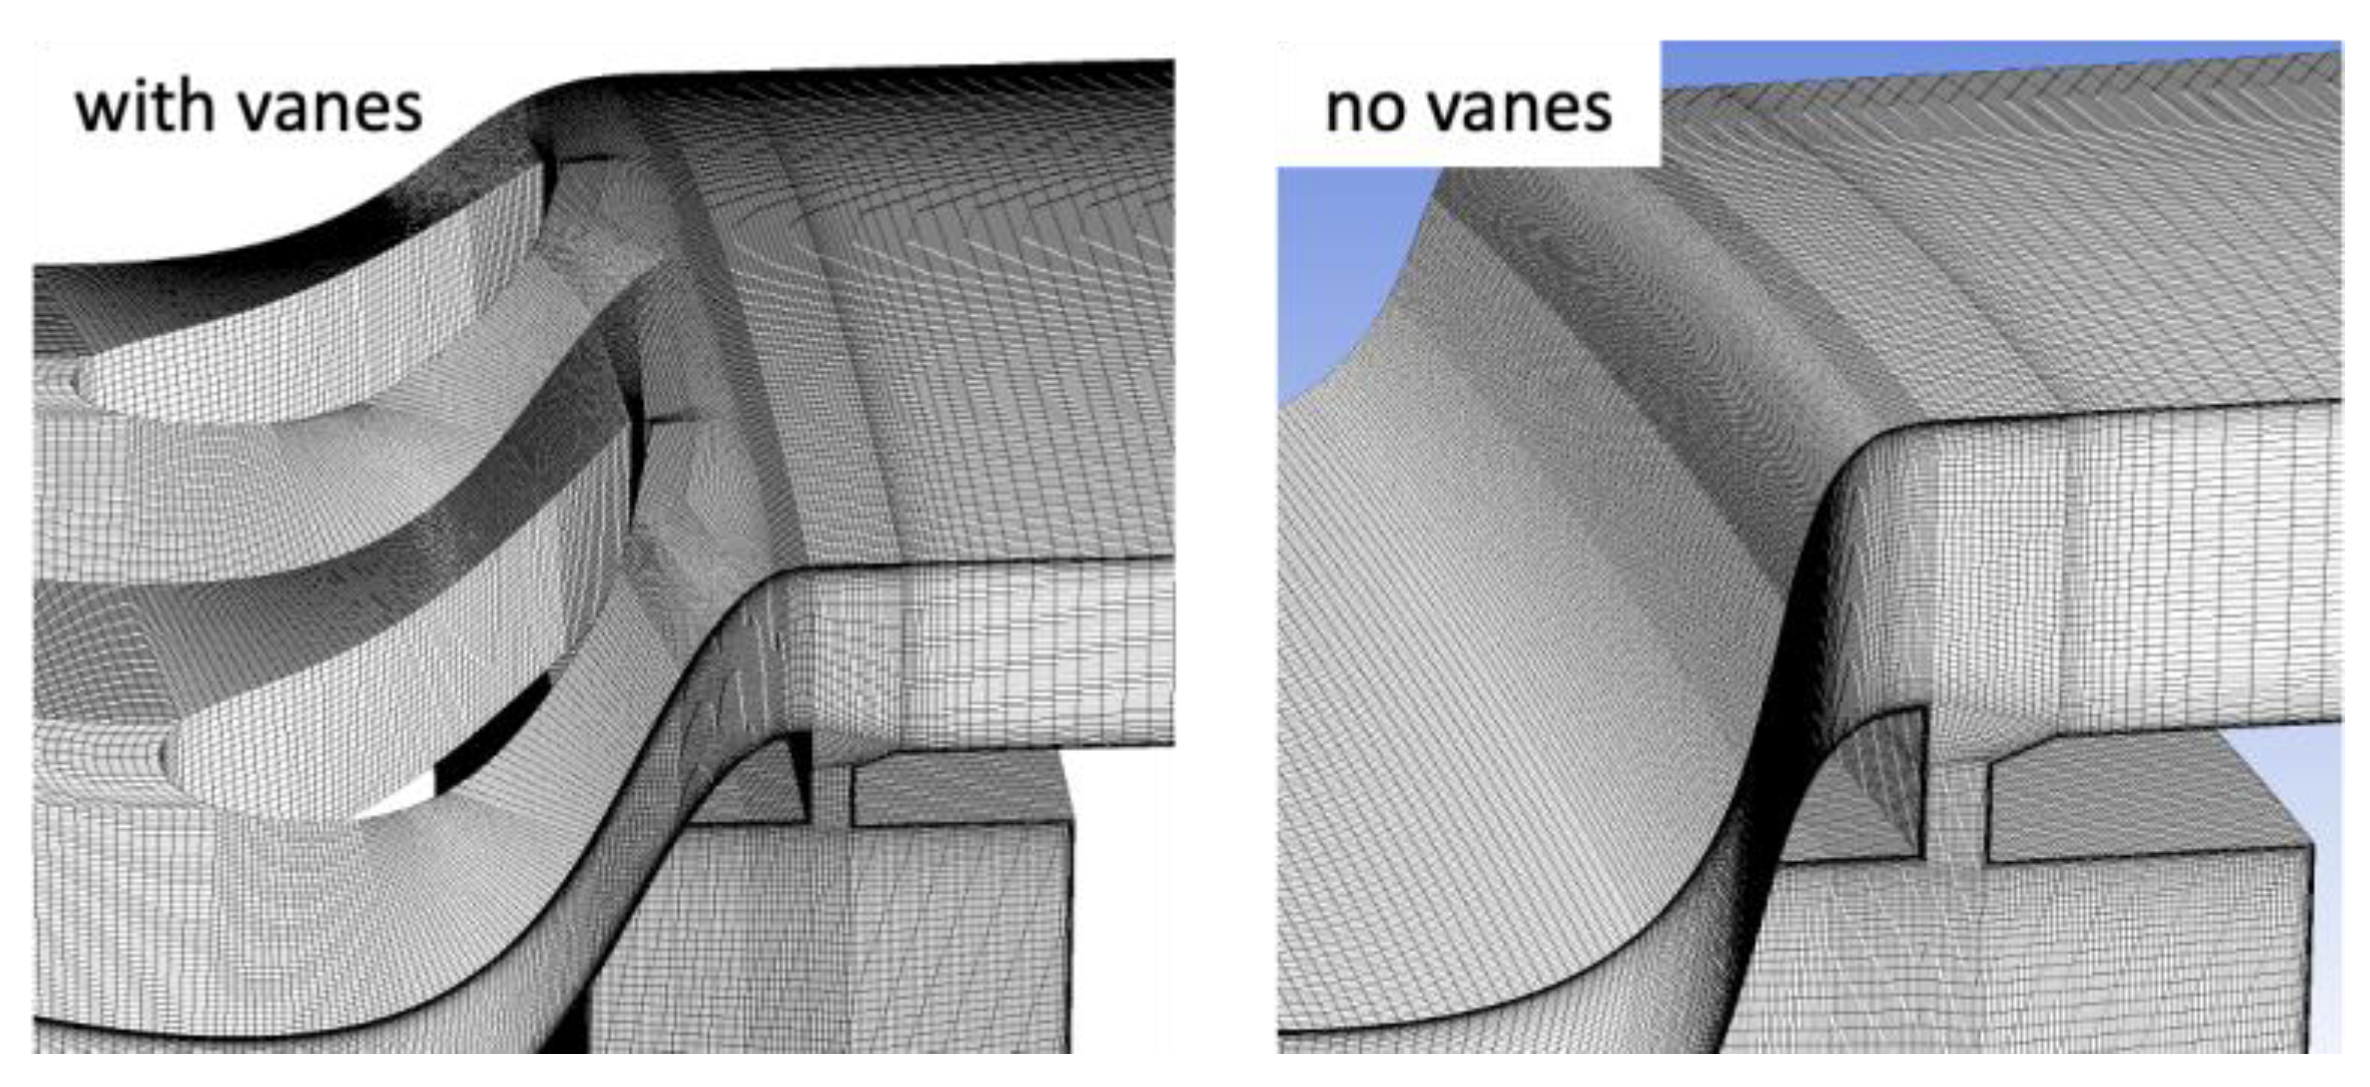
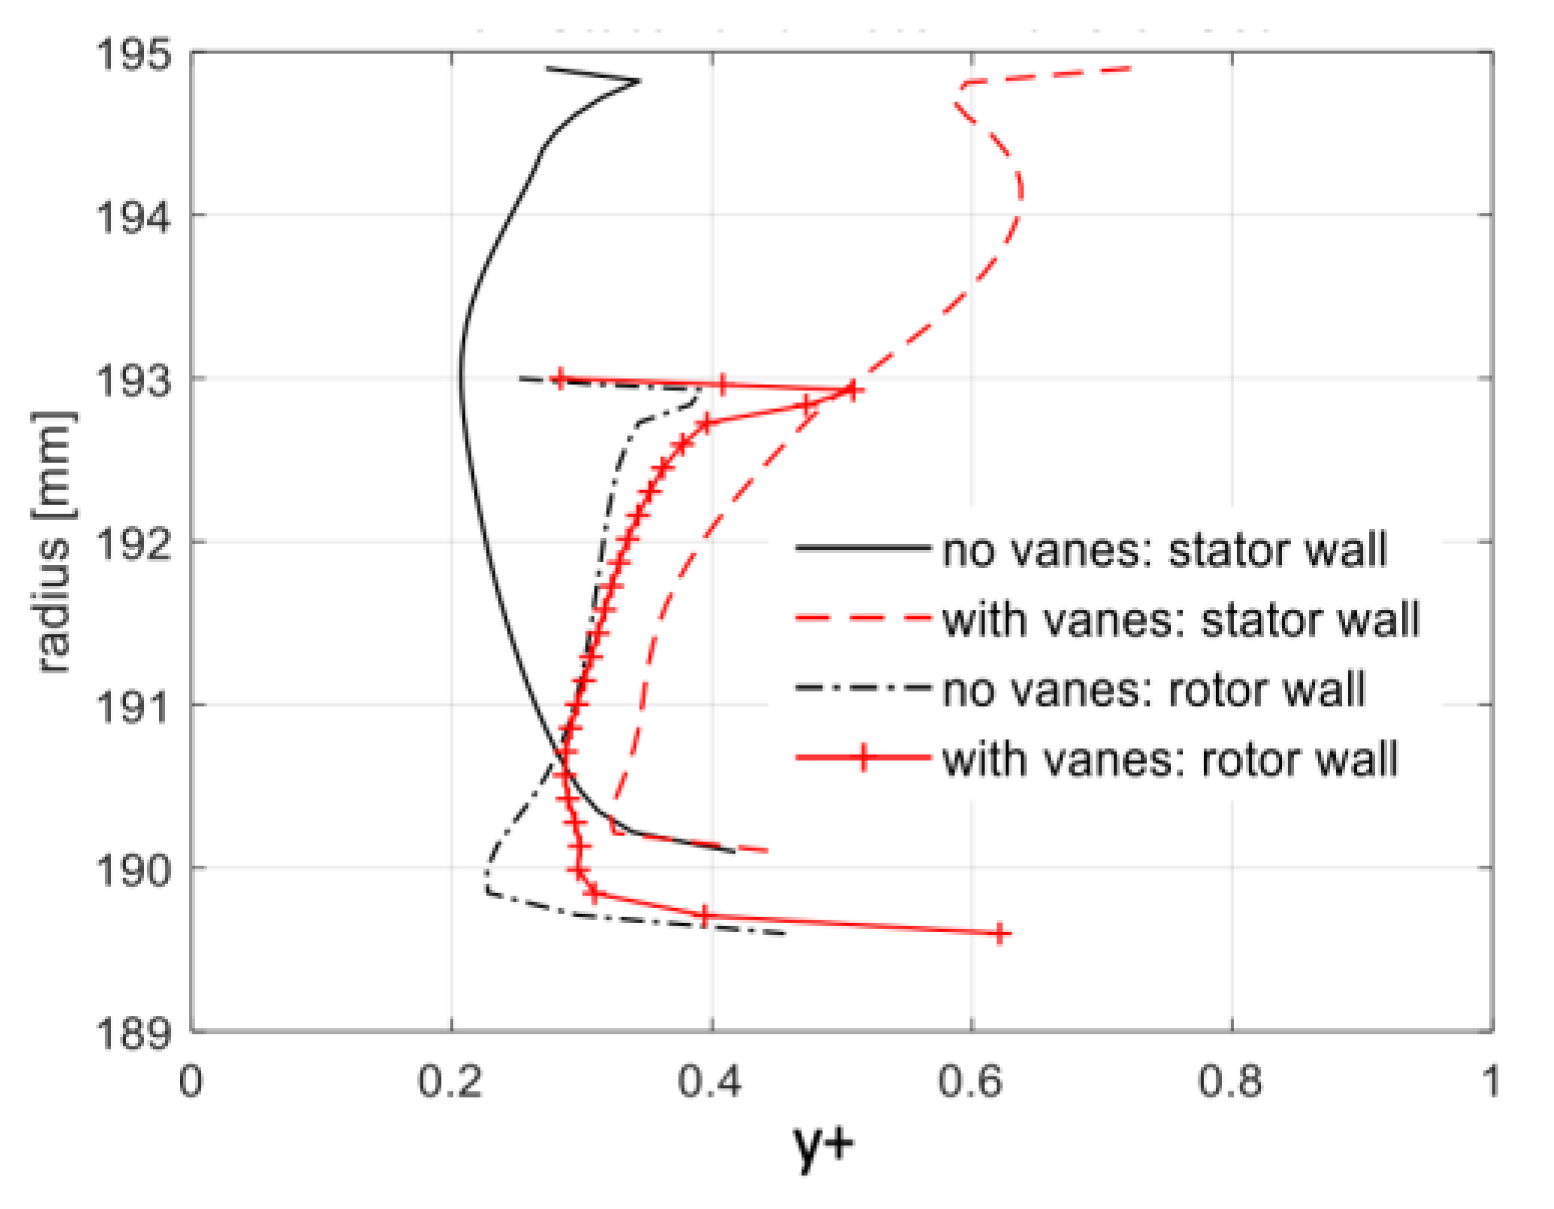
Figure 2 shows the grids used for the configuration without vanes and the configuration with vanes that were used for LES and RANS, and Figure 3 shows the values of the y+ at one grid point away from walls in the region about the seal. The grid points were clustered next to all solid surfaces with the y+ of the first grid point next to the walls being less than unity, and there were at least five cells within y+ of 5, which is required for the SST model. For LES, the nondimensional grid spacings satisfy Δr+ < 20, Δz+ < 20, and rΔθ+ < 20 throughout the flow domain with much lower values next to the wall. When computing the nondimensional grid spacings, the maximum “local” friction velocity was used. The total number of grid points for the configuration without vanes over a θo = 11.25-degree sector is 12.1 million, and the total number of grid points for the configuration with vanes over a θo = 22.5-degree sector is 20.2 million.
On the time-step size used in LES, it needs to be small enough to resolve the relevant time scales of the flow. The Kolmogorov time scale, τ η = ( ν / ε ) 0.5 , was used to estimate the lower limit on the time-step size needed. Figure 4 shows the Kolmogorov time scale, τ η , obtained from the RANS solution based on the SST model for the two configurations studied. From Figure 4, it can be seen that 10−5 s can resolve the time scales for the configuration without vanes. However, when there were vanes, 10−6 s was found to be needed to resolve the physics at the trailing edges of the vanes. The time scales connected to rotation are 0.02 s/revolution for the rotor rotating at 3000 rpm and 0.000625 s per vane passing for 32 vanes. With a time-step size of 10−5 s, one revolution is resolved by 2000 time steps, and with a time-step size of 10−6 s, one vane passing is resolved by 625 time steps.
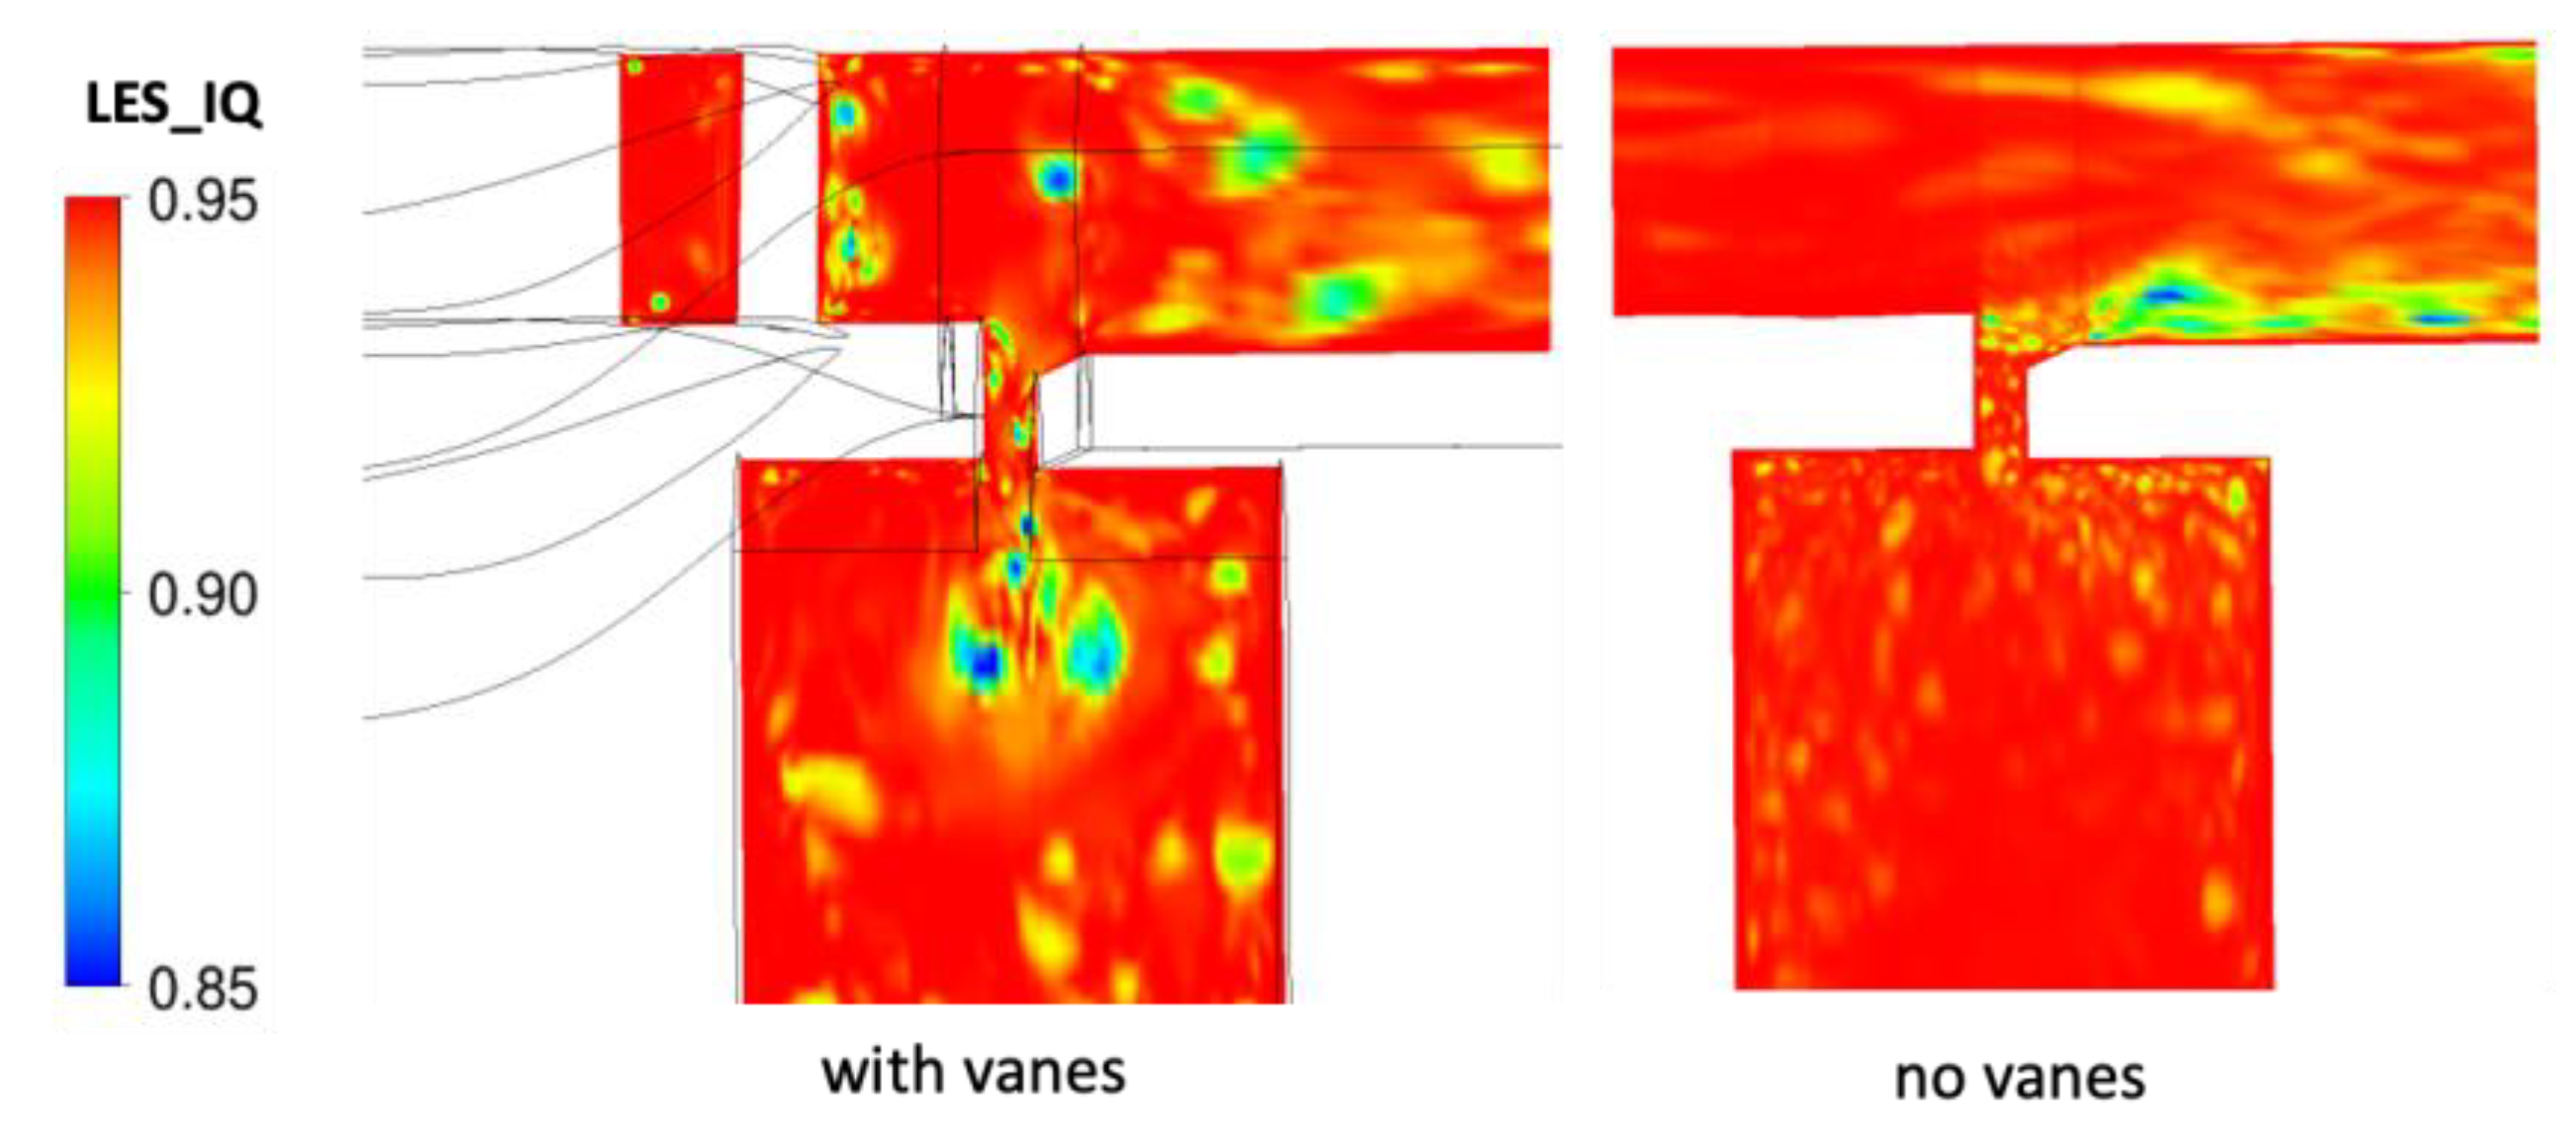
With the time-step sizes selected (10−5 s for the configuration without vanes and 10−6 s for the configuration with vanes), the grids used were inspected to see if they satisfy the Celik criterion [23], which states that the index, L E S _ I Q = 1 / ( 1 + 0.05 ( ν t , e f f / ν ) 0.53 ) , must be greater than 0.8. Figure 5 shows the LES_IQ for the grids used to be all greater than 0.85, which is greater than the required 0.8 value. This shows that at least 85% of the turbulent kinetic energy in the flow were resolved by the LES.
Figure 6 shows the energy spectra of the radial velocity obtained from four probes in the seal region. This figure shows the energy spectra to follow Kolmogorov’s −5/3 law before falling. This figure also shows the energy densities of the high frequencies at the cutoff are at least five orders of magnitude lower than those in the inertial sub-range. Based on the aforementioned, the grids and time-step sizes used are deemed sufficiently fine to resolve the relevant turbulent scales.
On validation, computed and measured sealing effectiveness, β = ( c s c a ) / ( c o c a ) , and pressure coefficient, = Cp = ( P   P ¯ ) / ( 0.5 ρ ω 2 r o 2 ) , were compared. Figure 7 shows the sealing effectiveness on the stator wall at r/(ro − dc) = 0.958 obtained in this study and in the experimental study by Sangan et al. [7]. With a nondimensional sealing flow rate of CW = 2027, the experimentally measured sealing effectiveness was β = 0.40 . As shown in Figure 7, LES was able to predict this value, indicating the correct prediction of ingress. RANS, however, predicted an incorrect value of β = 1 , where β = 1 corresponds to zero ingress. Figure 8 shows the pressure coefficient, Cp, as a function of the azimuthal direction at point A on the stator platform, where point A is 2.5 mm downstream of the stator vanes, and at point B located midway between the seal clearance on the outer casing. From this figure, results from both LES and RANS can be seen to compare reasonably well with the experimental data of Sangan et al. [7]. It is interesting to note that both LES and RANS were able to predict the Cp distribution, but only LES could predict the correct sealing effectiveness. The reasons for this and why this is important are explained in the next section. On validation, the good comparison with experimental data on β and Cp by LES shows the LES solution to provide physically meaningful results.

5.2. Flow Field with Stator Vanes

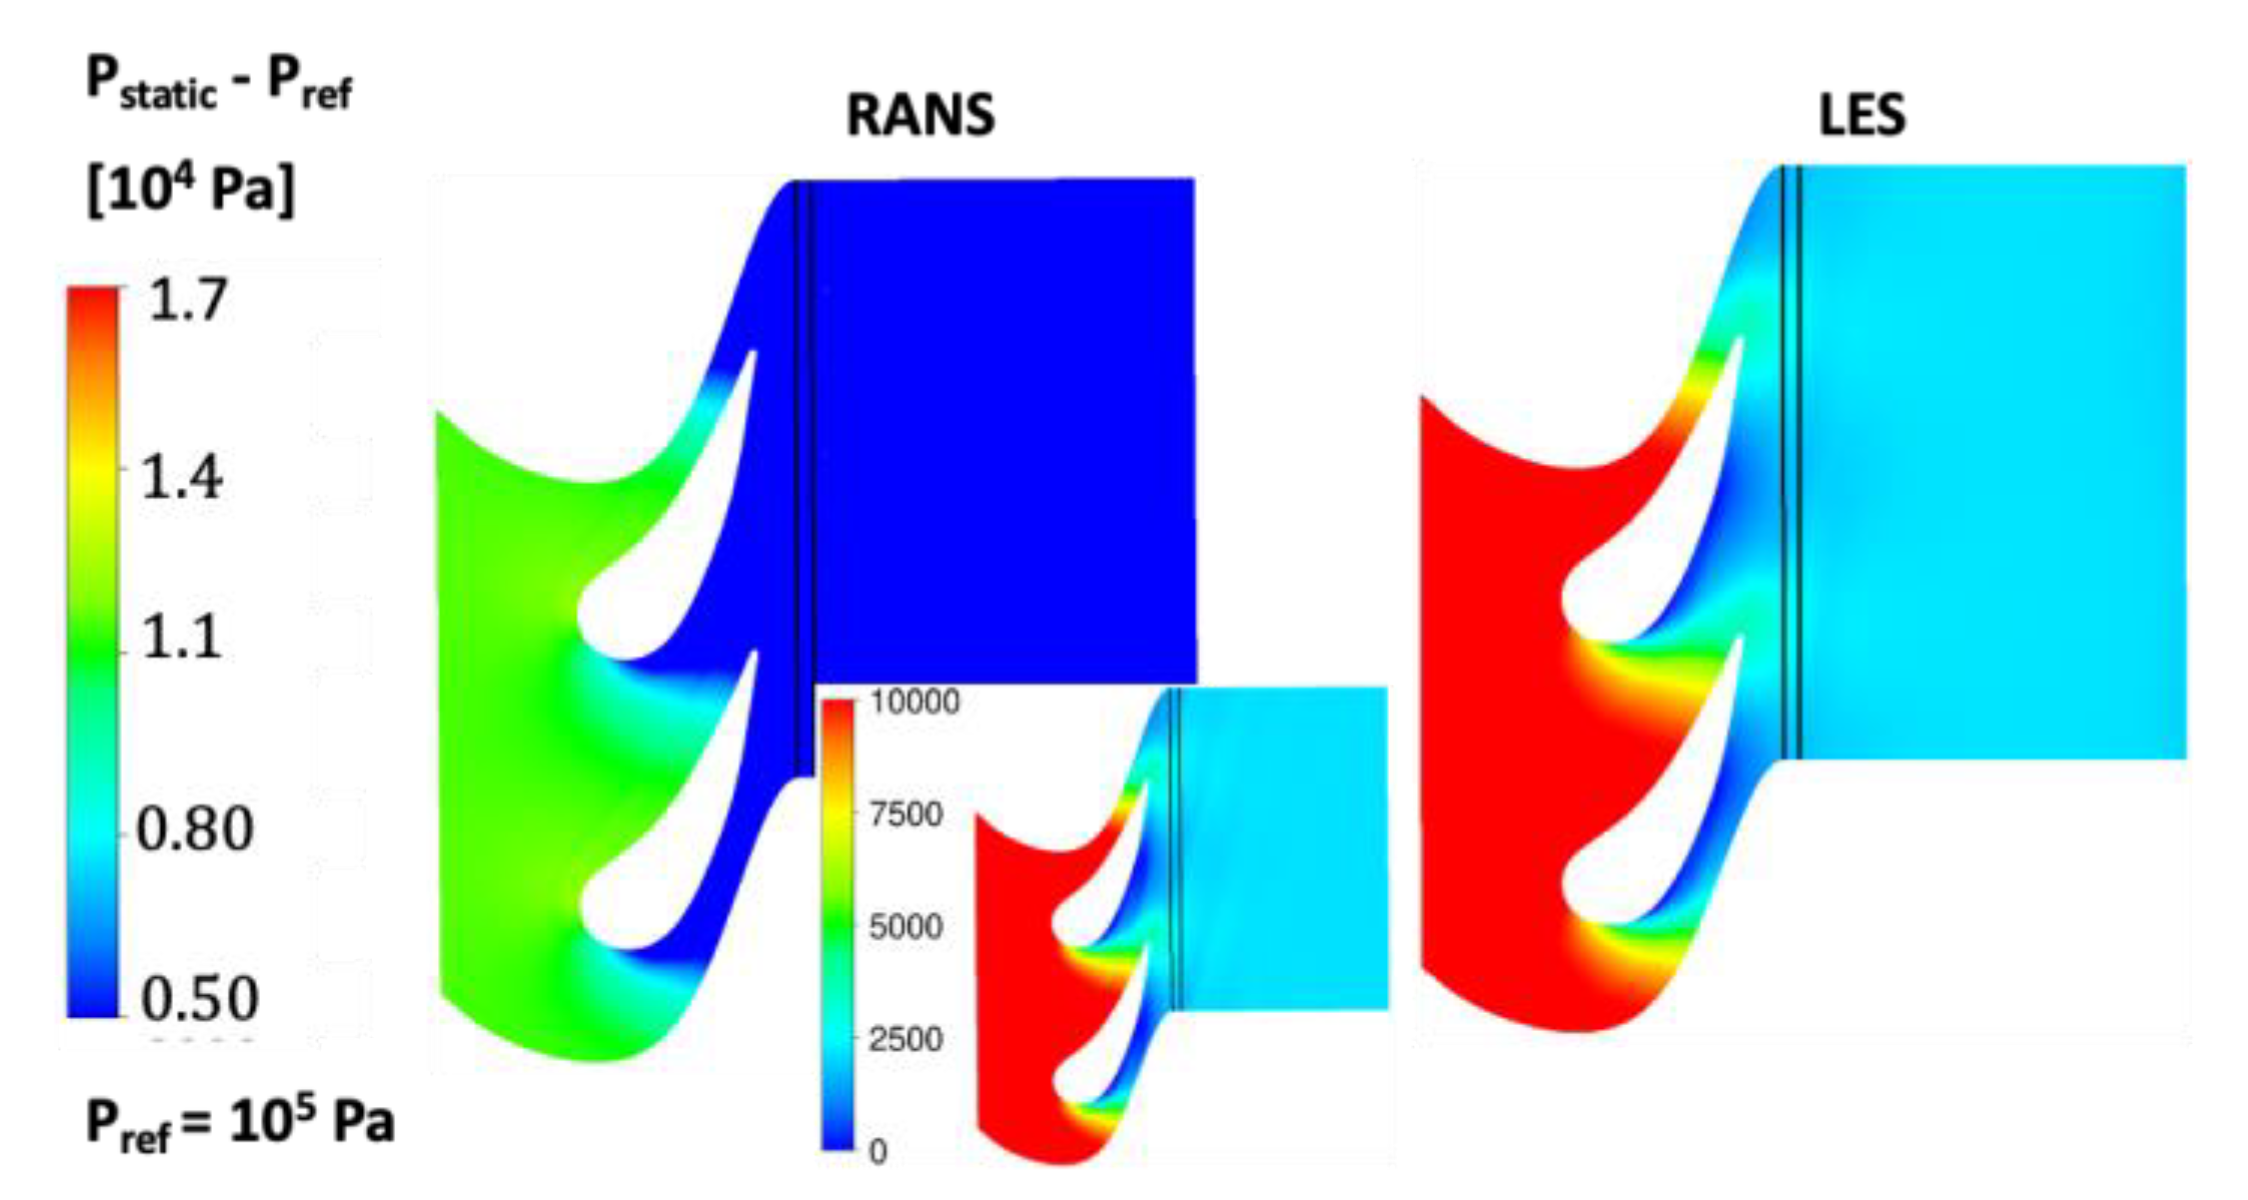
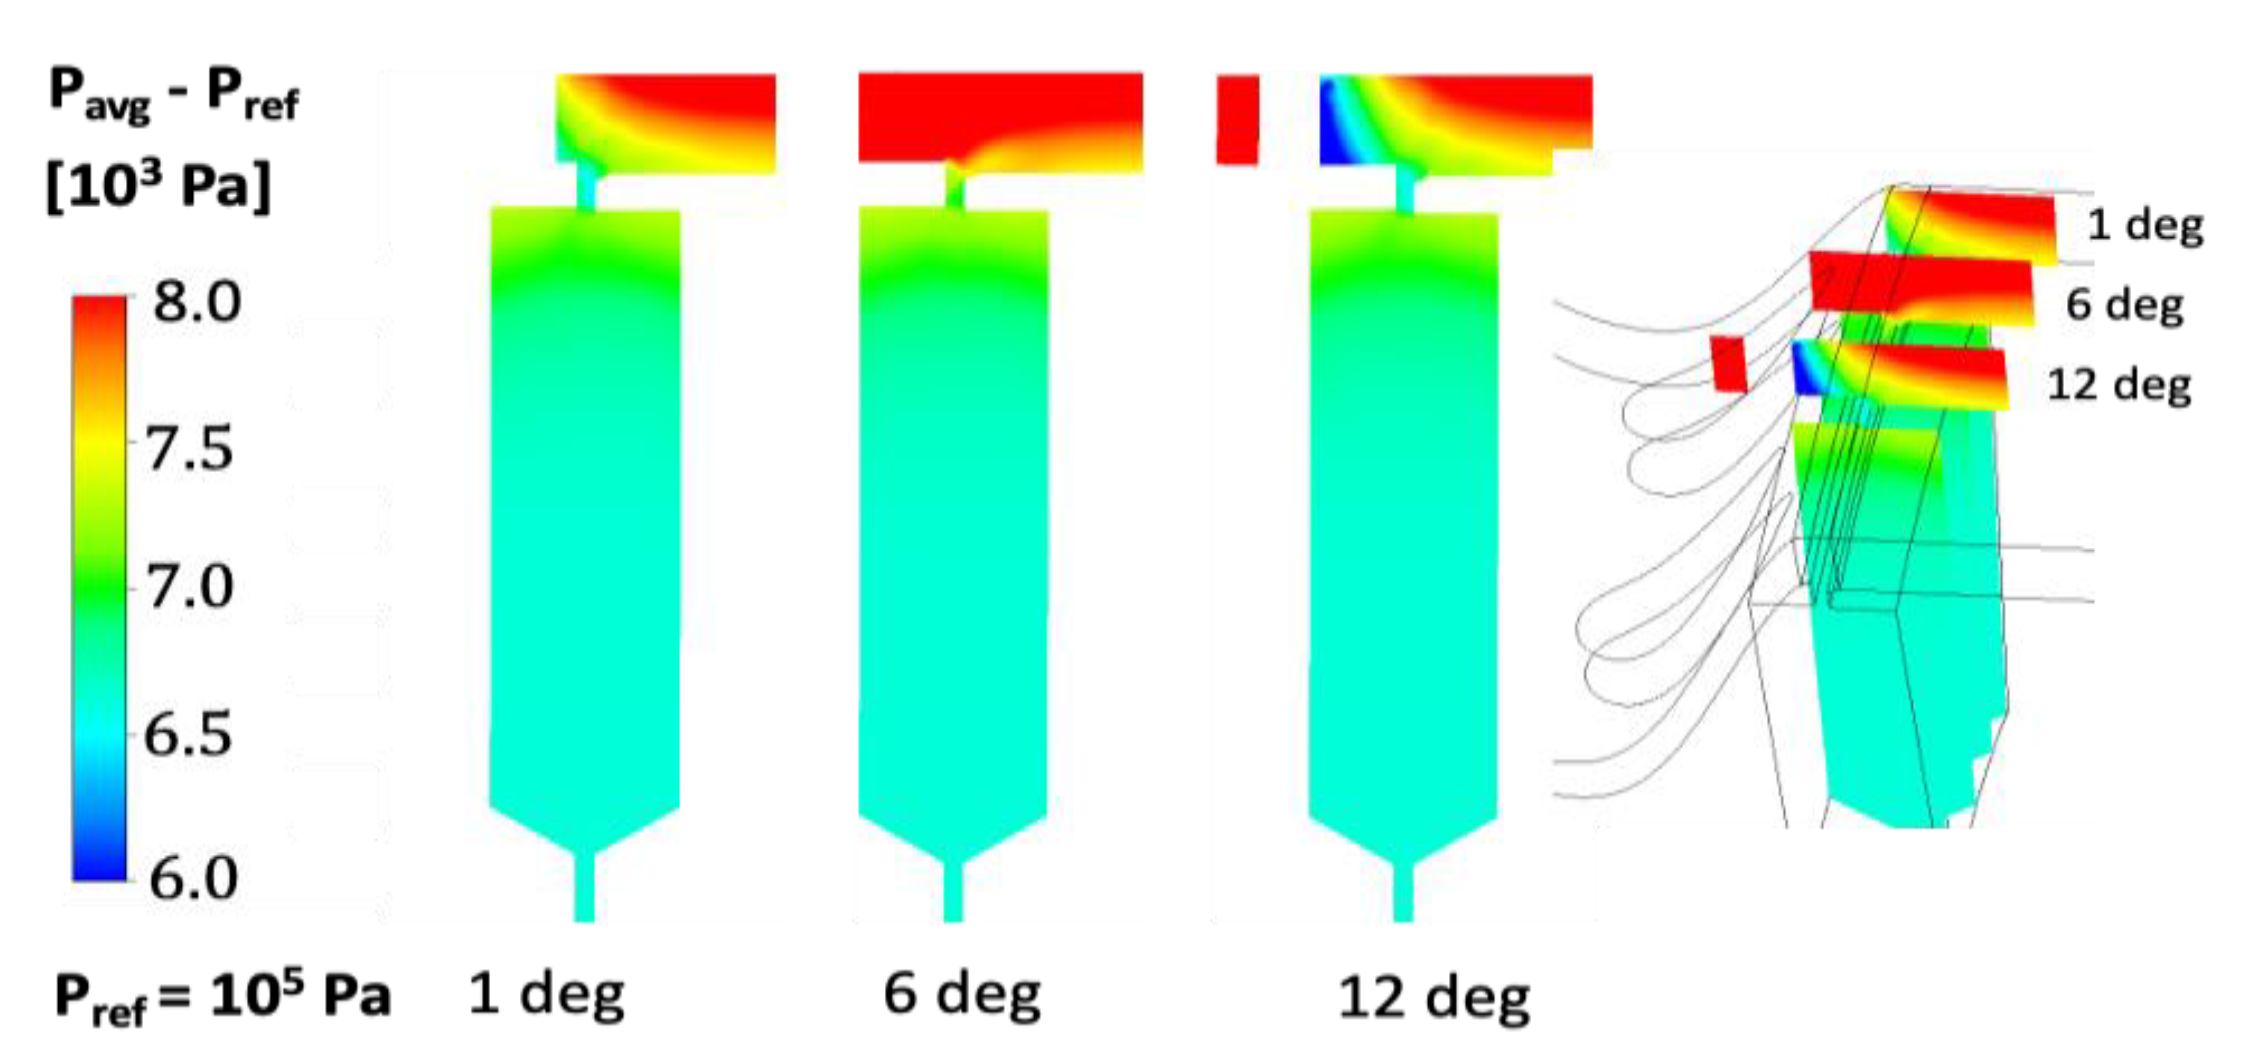
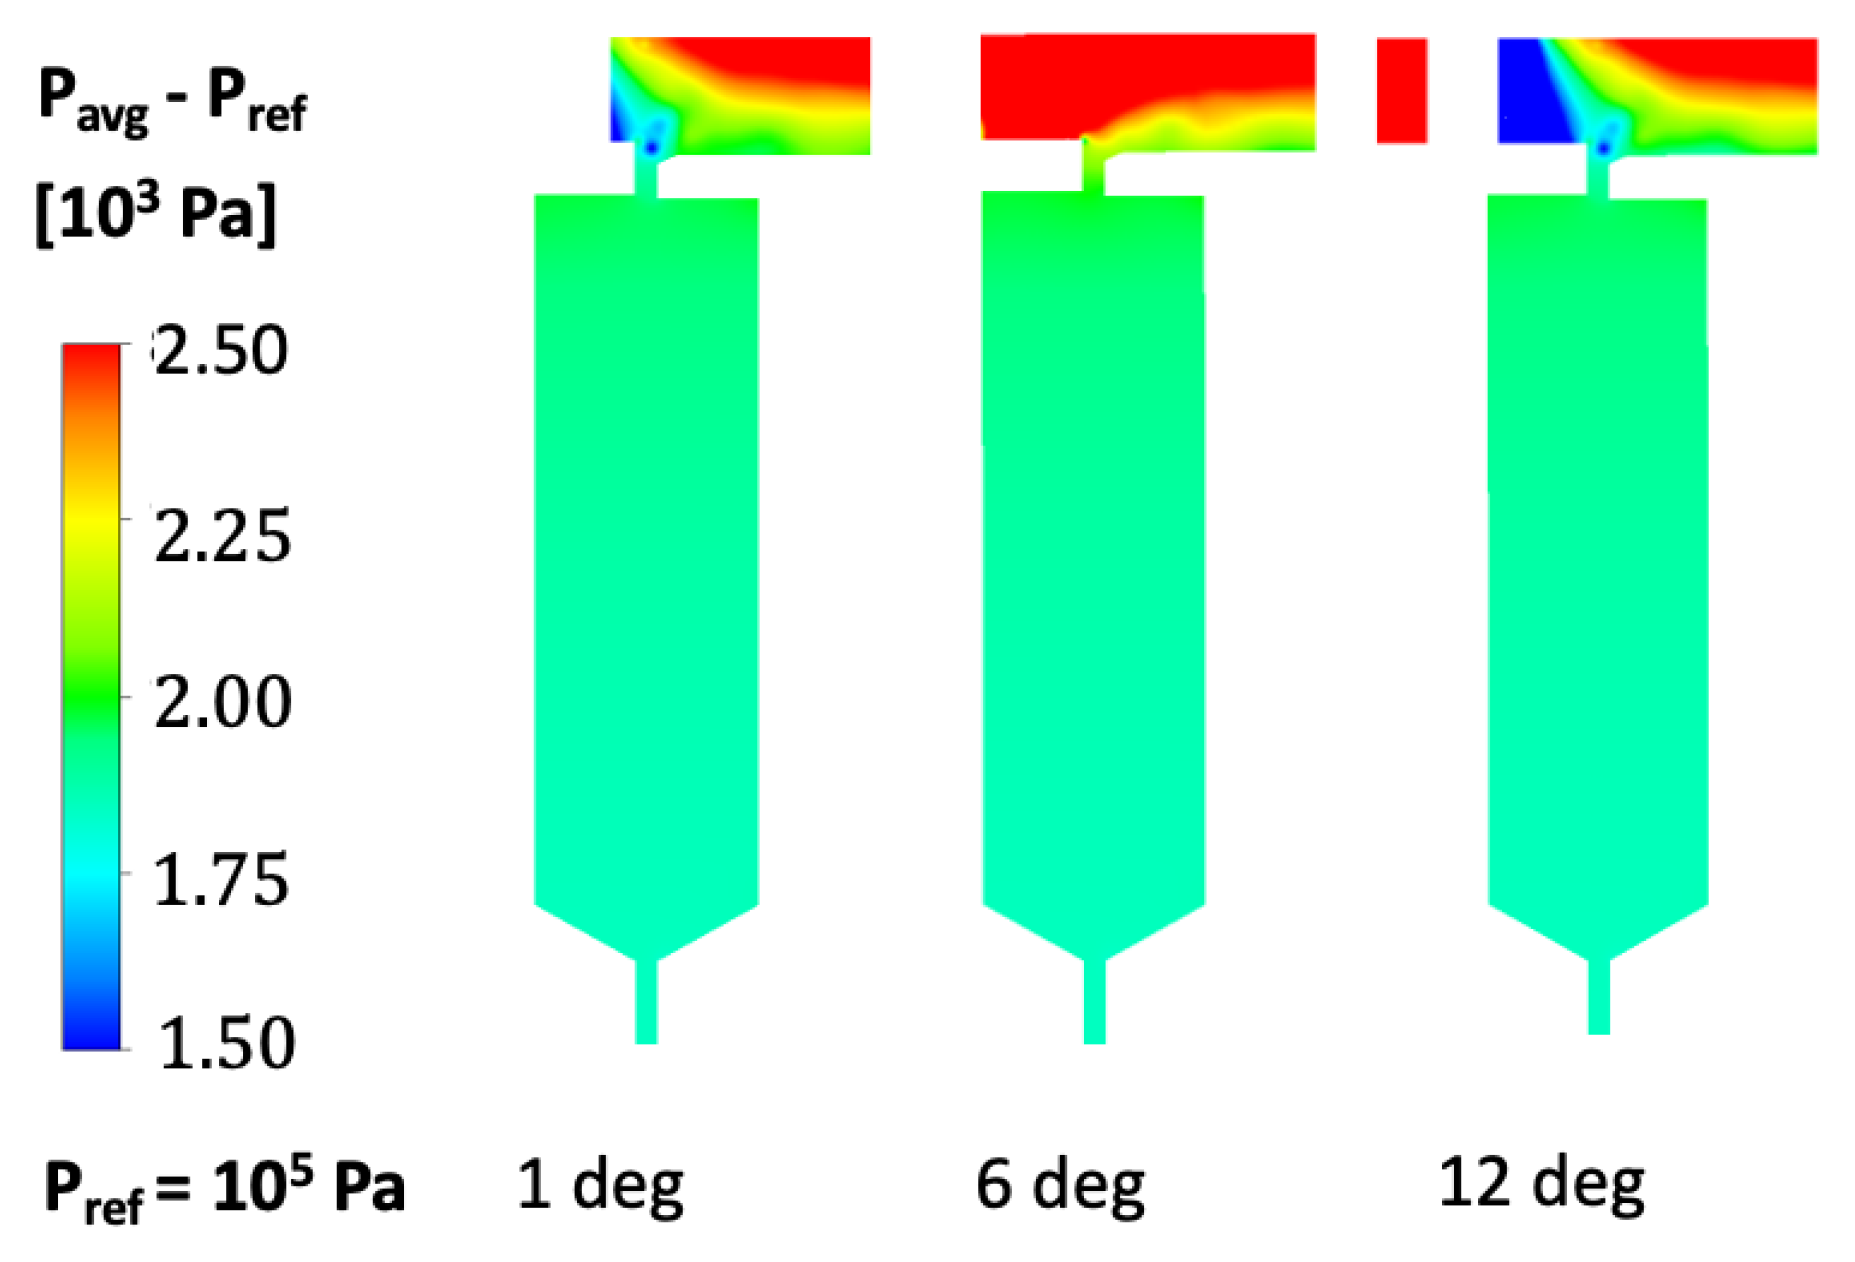
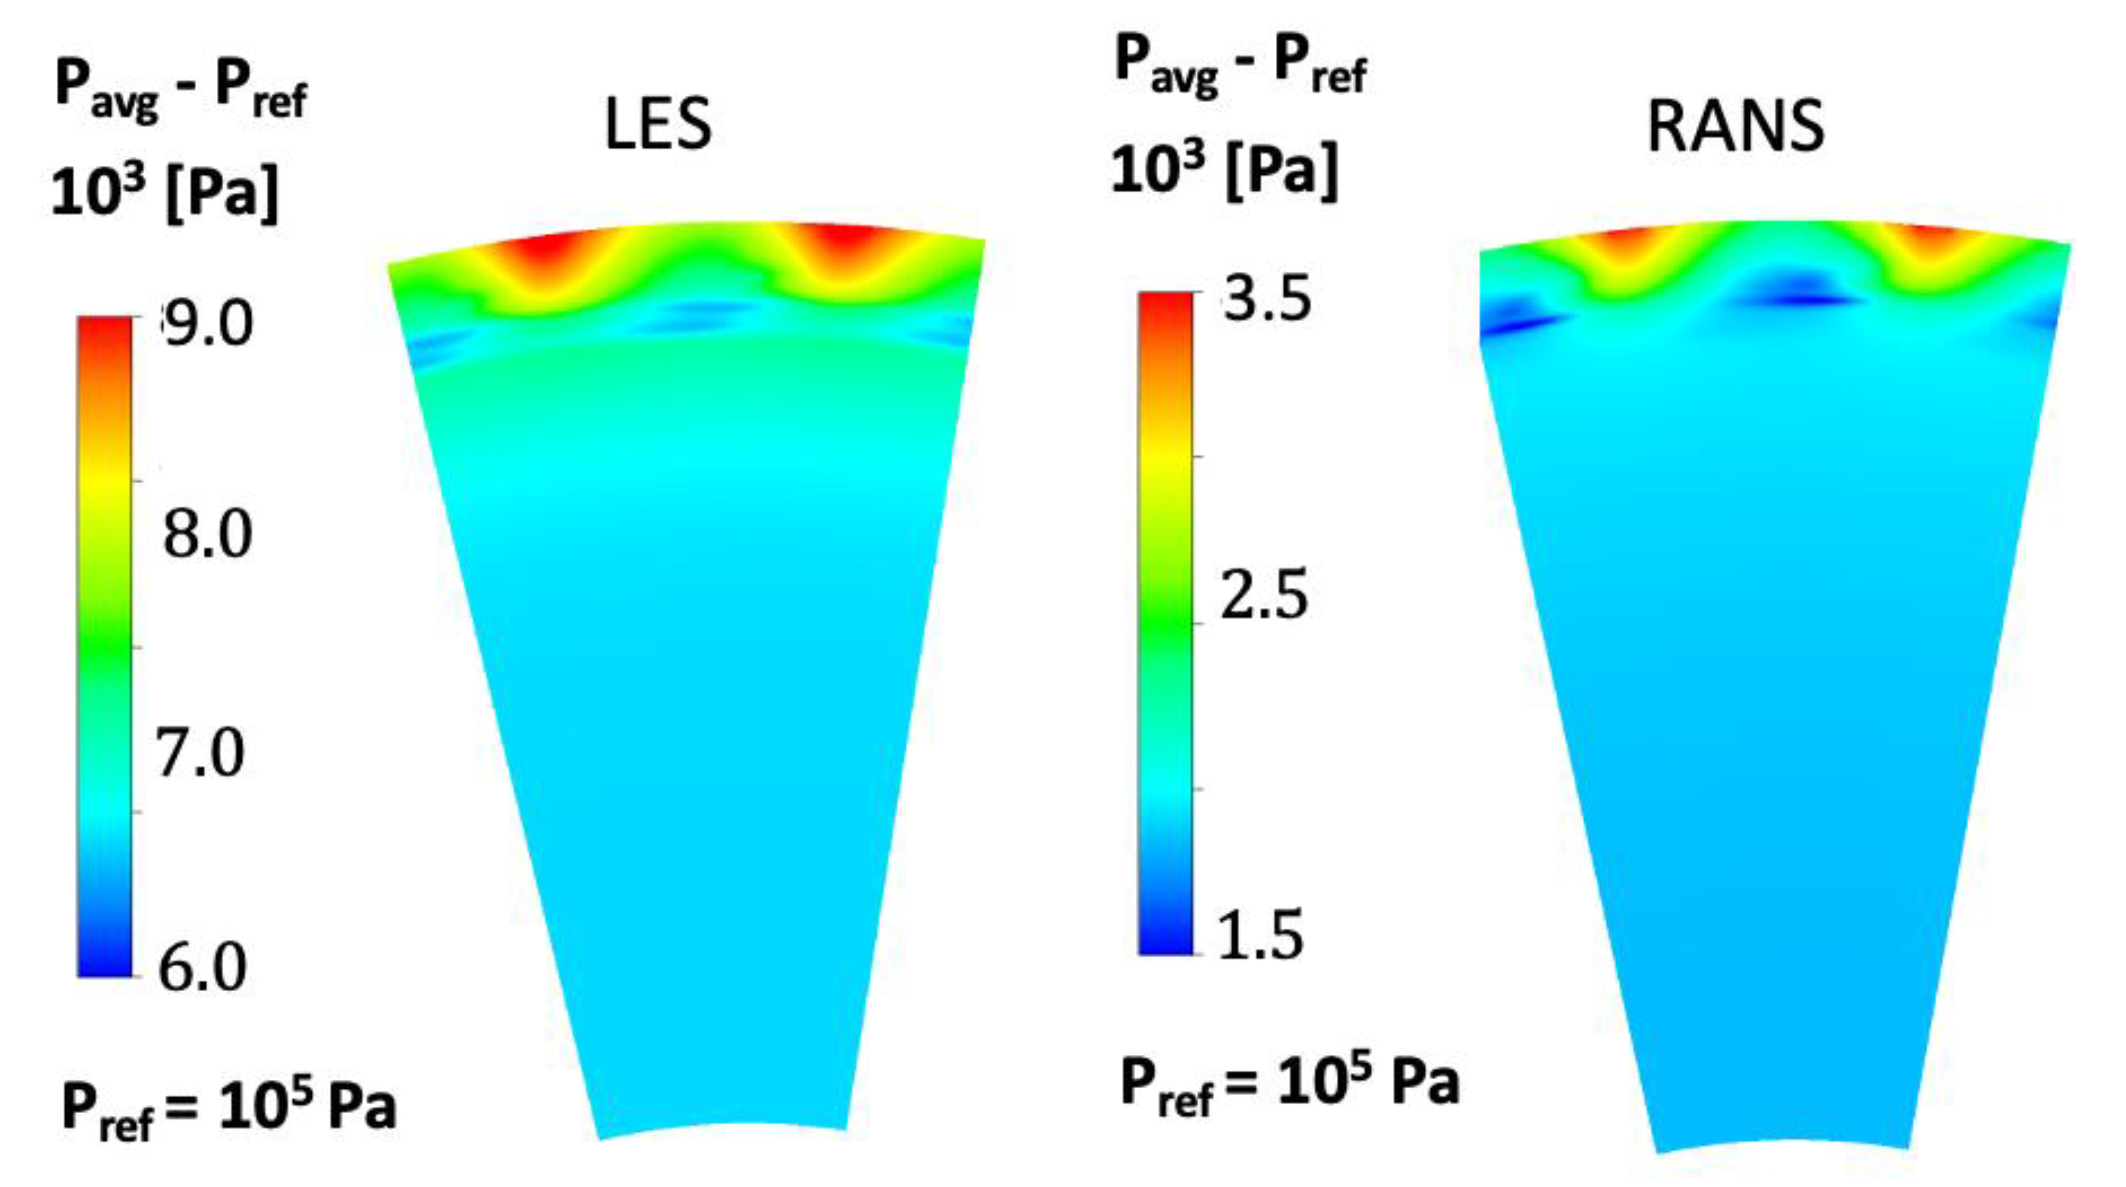
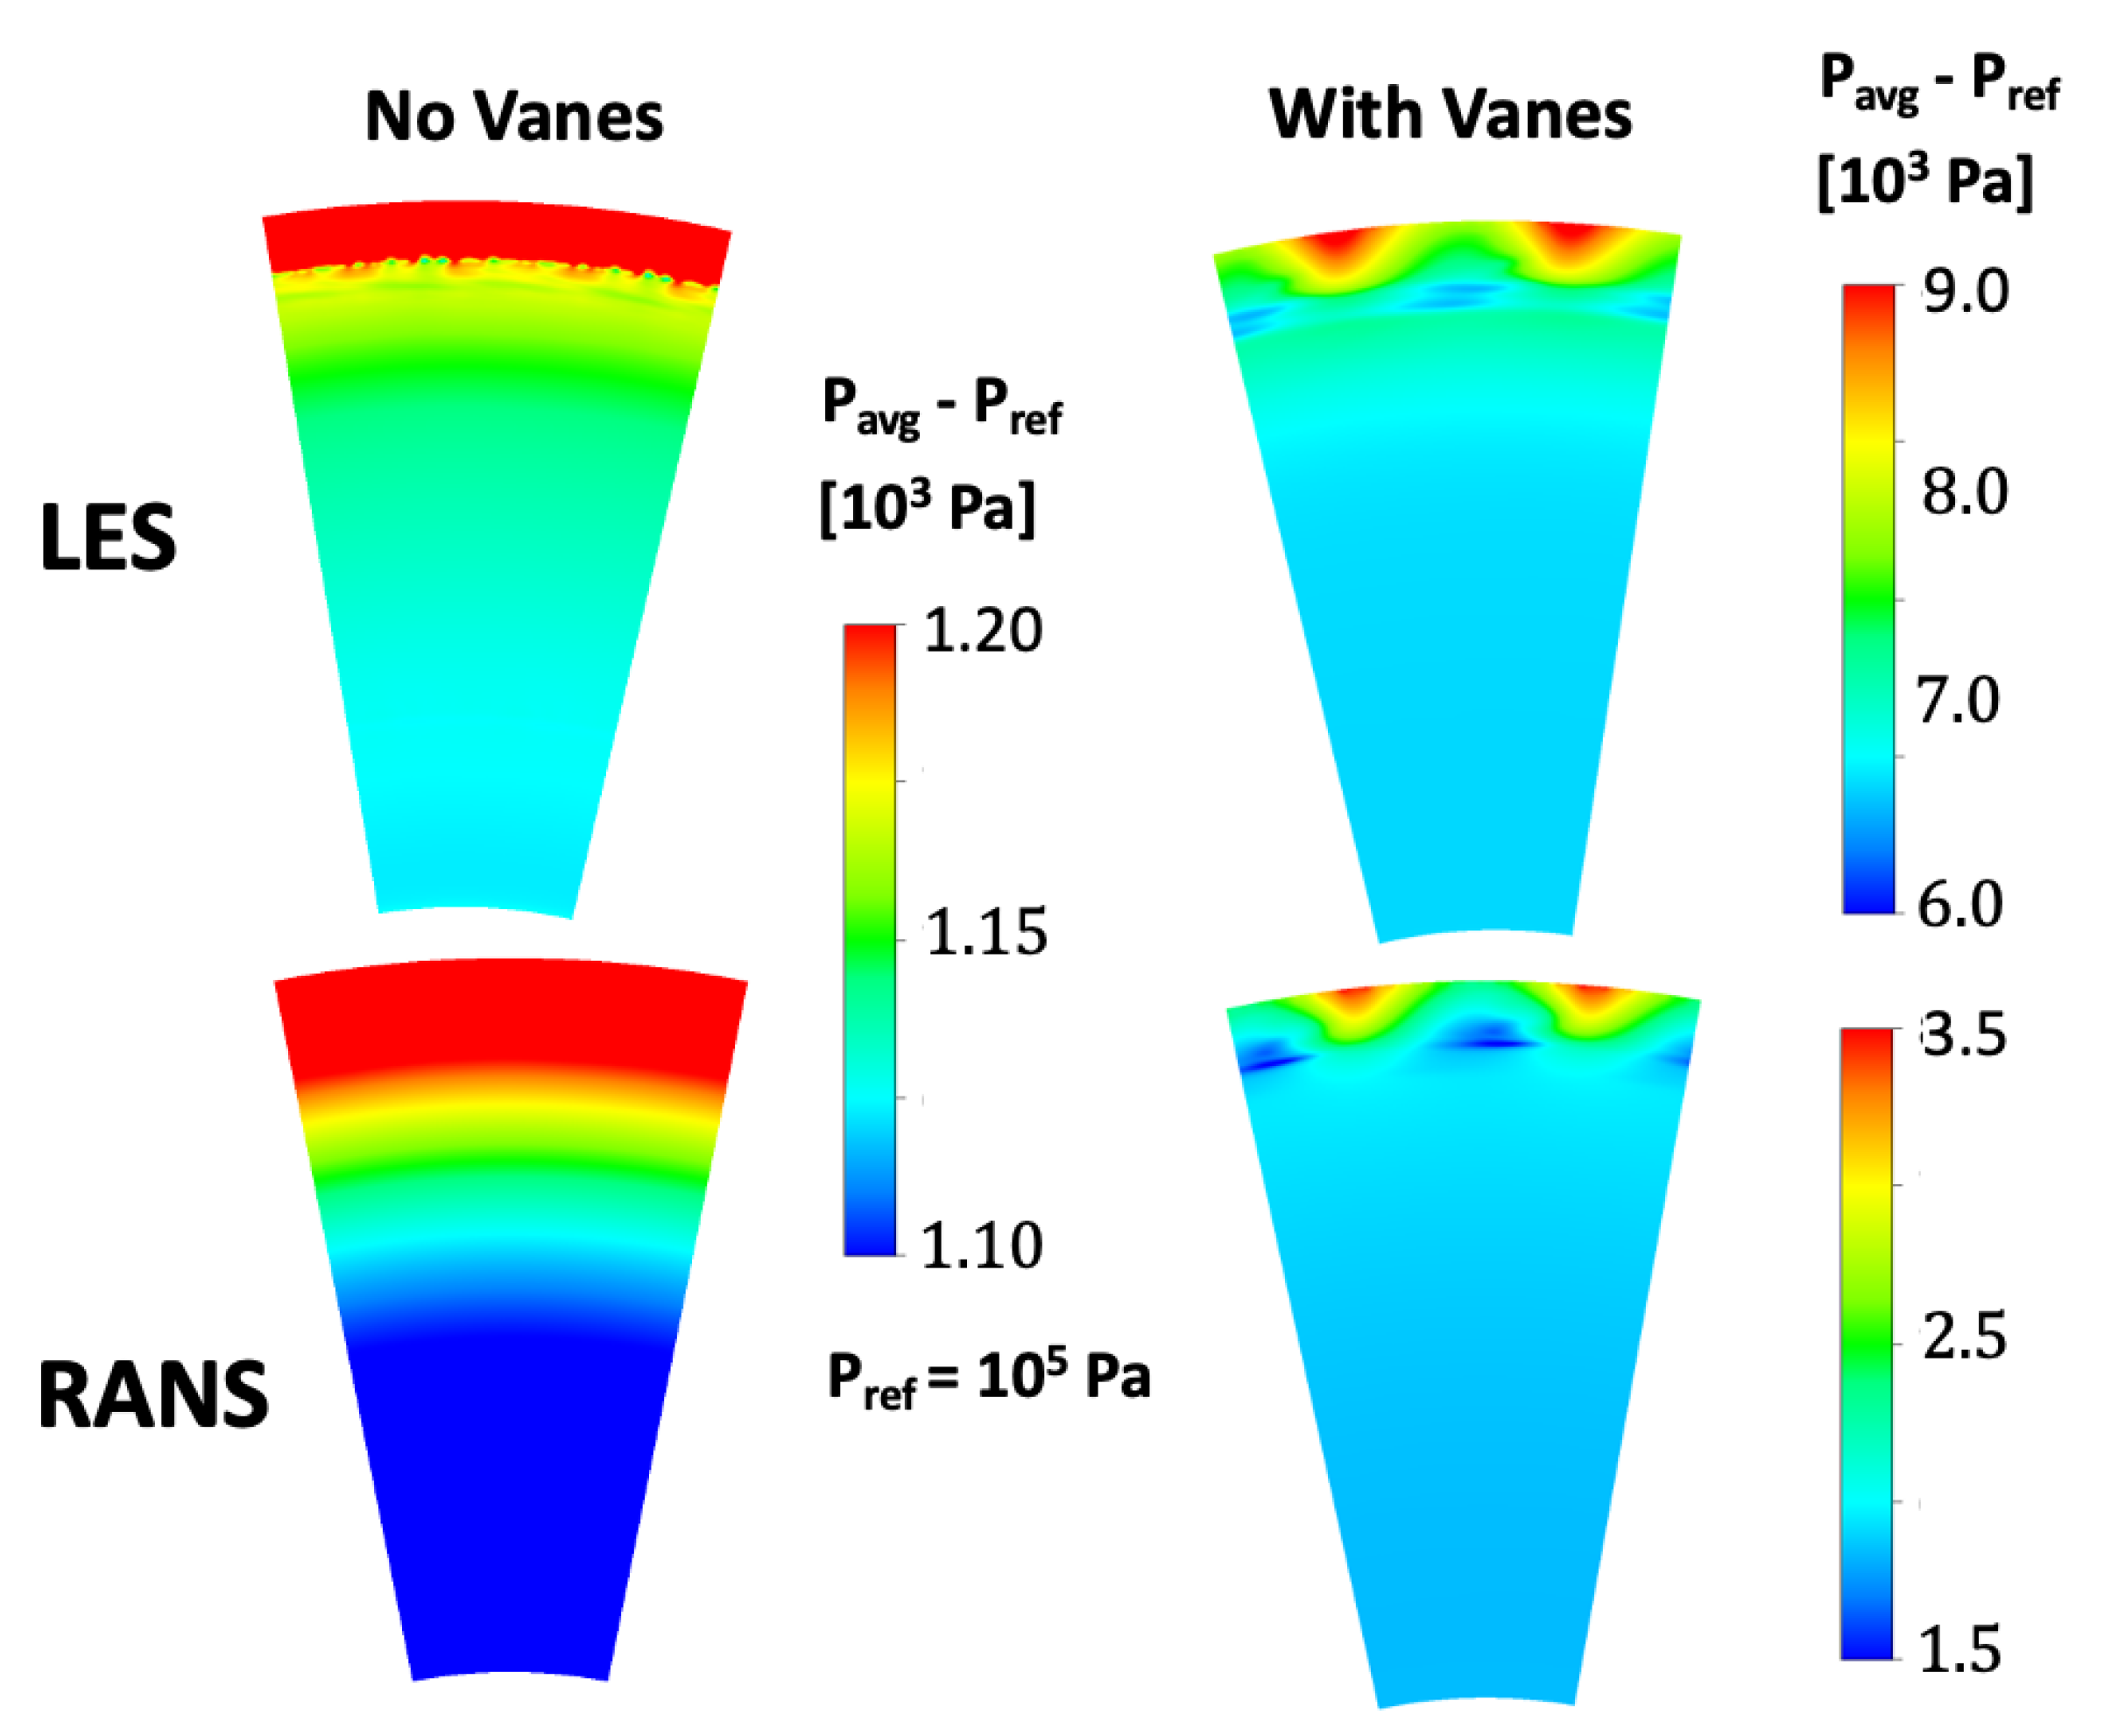
Figure 9, Figure 10, Figure 11 and Figure 12 show the mean pressure distribution about the seal for the rotor–stator configuration with vanes obtained using LES and RANS. Figure 9 shows the pressure distribution on the vane platform and 1.233 mm above the rotor hub, and Figure 10, Figure 11 and Figure 12 show the pressure distribution about the seal at three r-z planes and one r- θ plane. From these figures, one can see the pressure variation in the azimuthal direction induced by the pressure and suction sides of the stator vanes. From these figures, one can also see the pressure variation in the axial direction along the hot gas path induced by the stator vanes, the Kelvin–Helmholtz instabilities about the rotor disk created by the interaction of the flow exiting the passages between the vanes and the boundary layer flow formed by the rotor’s rotation, and the work conducted by the rotating rotor on the flow. From Figure 9, the pressure distributions obtained by LES and RANS can be seen to be qualitatively similar. However, the pressures about the seal predicted by LES are much higher than those predicted by RANS. As a result, Figure 10, Figure 11 and Figure 12 show the differences in pressure across the seal in the radial direction predicted by LES to be significantly higher than those predicted by RANS. For a given seal geometry, the magnitude of the pressure difference across the seal should play a significant role on ingress.
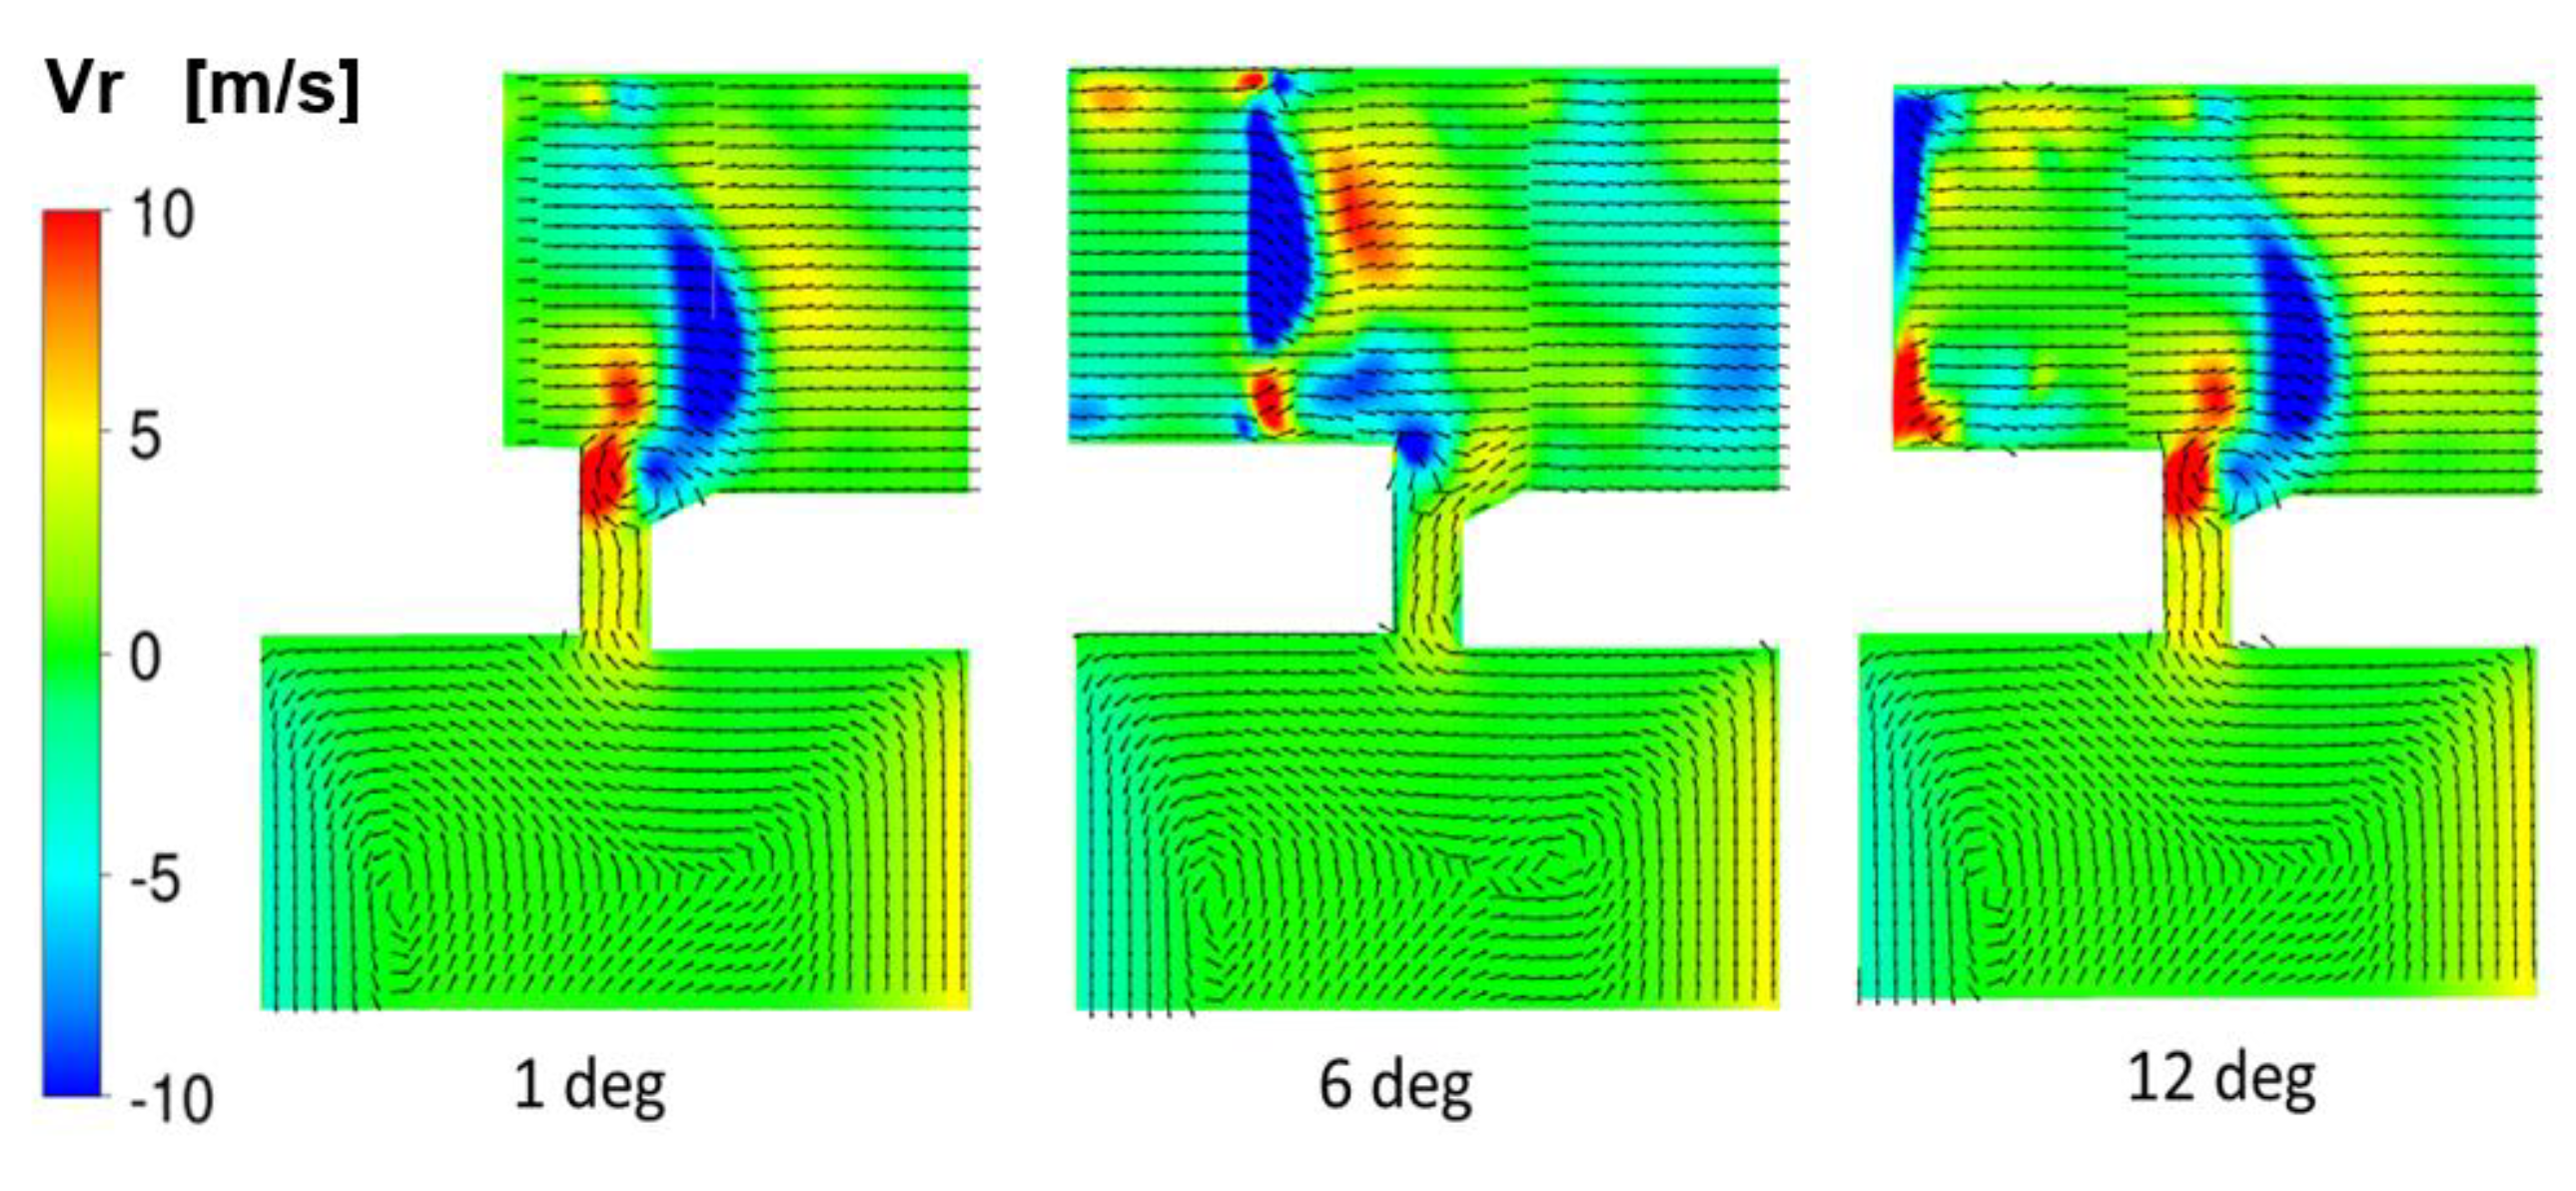
Figure 13, Figure 14 and Figure 15 show the mean radial velocity, Vr, in several planes about the seal region predicted by LES and RANS. Figure 14 and Figure 15 also show projections of the velocity vectors in three r-z planes. From Figure 13 and Figure 14, LES can be seen to predict negative Vr in the seal (ro + dc < r < ro) and in the wheelspace (r < ro + dc), with velocity vectors pointing radially inward in the seal and wheelspace. Thus, LES predicts ingress. As noted in Section 5.1, LES predicted the correct sealing effectiveness as shown in Figure 7. For RANS, Figure 13 and Figure 15 show Vr to be negative only near the seal entrance. With RANS, these figures show hot gas entering the seal to exit before reaching the wheelspace. Thus, RANS is unable to predict ingress, whereas LES could as shown in Figure 7.
Since (1) both LES and RANS could predict the normalized pressure in the azimuthal direction (i.e., Cp) downstream of stator vanes (Figure 8) and (2) only LES could predict ingress (Figure 7), this indicates accurate prediction of Cp by itself is inadequate in predicting ingress as previously thought. The magnitude of the pressure drop across the seal in the radial direction also plays a critical role in affecting ingress. This is one of the key findings of this study.
For both LES and RANS, the static pressure at the outflow boundary, the mass flow rate entering the hot gas path, and the sealing flow rate entering the wheelspace were the same. Thus, LES predicts higher pressure drop in the hot gas path than RANS. What are the flow physics that cause the higher pressure drop that LES could predict, but RANS could not? It is the turbulent length and time scales from the Kelvin–Helmholtz instabilities created by interactions between the flow exiting the passage between the vanes and the boundary layer flow developing on the rotating rotor. It is also the turbulent scales from the vortex shedding in the seal clearance. The inability of RANS with the SST model to predict the correct pressure drop and sealing effectiveness is because RANS averages all length and time scales from integral to Komogorov, and the larger scales are problem dependent. As a result, all RANS models, not just the SST model, cannot be universal. Basically, each class of turbulent flows will require a different RANS model or a different set of coefficients that are tuned to the flow so that it can correctly capture the effects of the large scales created by the problem’s geometry and operating conditions. Since LES resolves instead of models the large scales, it could capture the relevant turbulent length and times scales, including the integral scales associated with vortex shedding in the seal clearance. It is for this reason that the grid and time-step size sensitivity study focused on the region about the seal clearance because that region had the smallest integral scales. Thus, another key finding of this study is that LES is needed for this class of flows—namely, a rotor–stator configuration with an axial seal and operating with the ratio of the external Reynolds number to the rotational Reynolds number equal to 0.538—and that attention must be paid to all relevant integral scales in the grid time-step resolution.
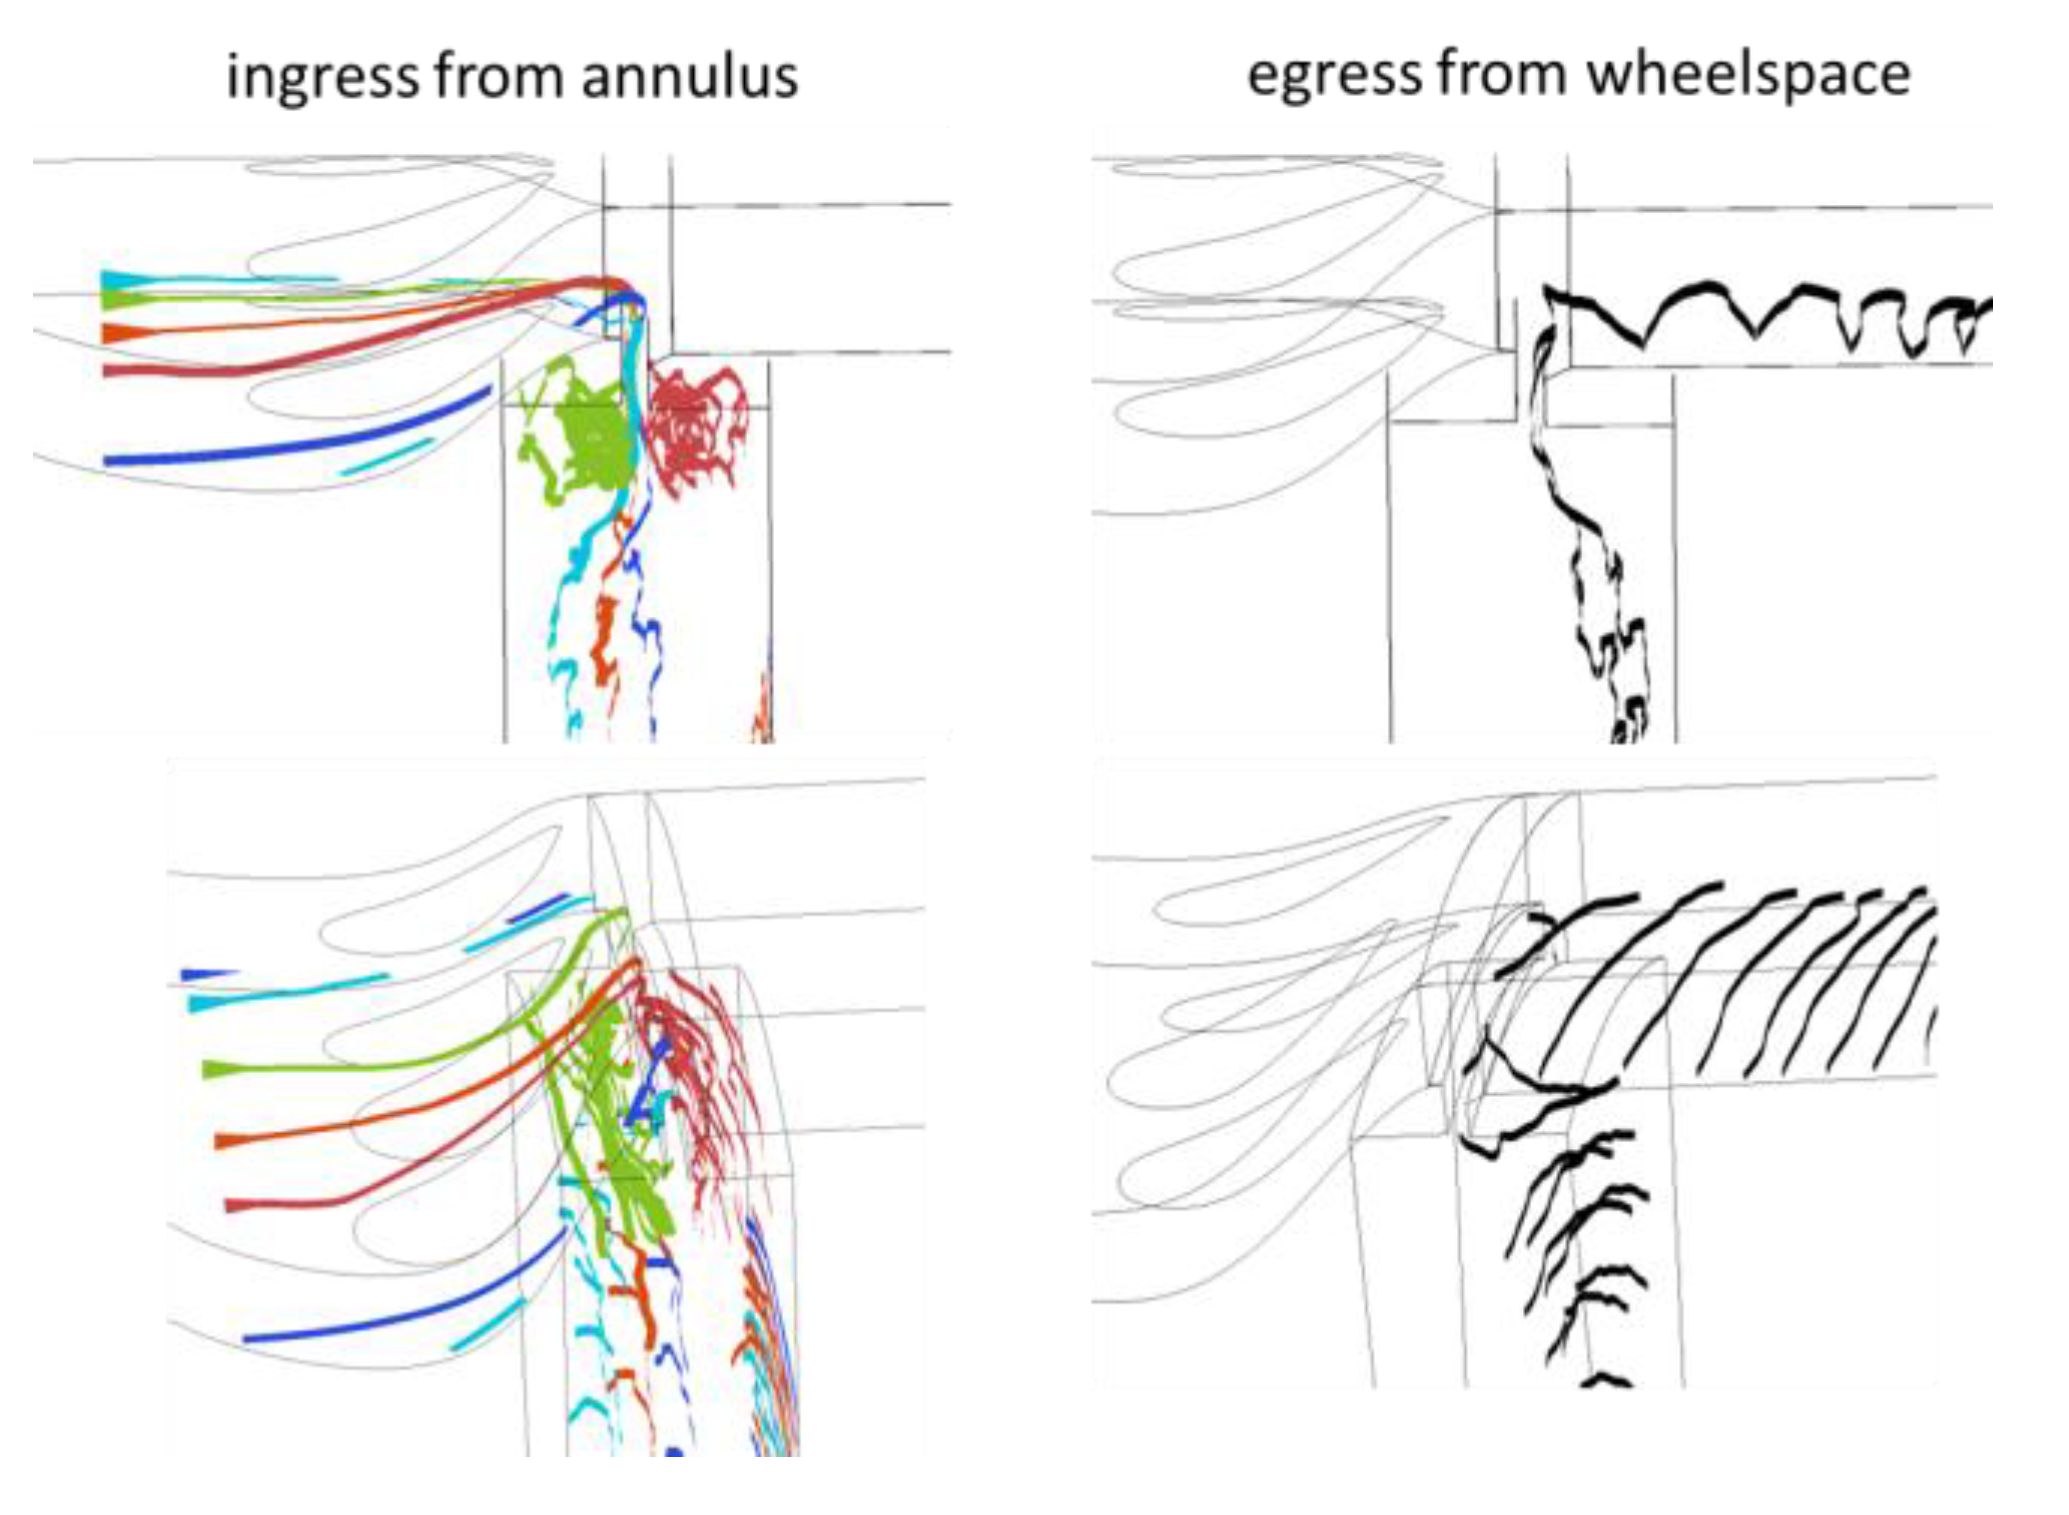
Figure 16 shows five trajectories of fluid particles that originate in the hot gas path (0.1 mm above the platform and equally spaced in the azimuthal direction between two vanes) and trajectories of fluid particles that originate from the inlet of the wheelspace. The trajectories are based on the time-averaged flow, where pathlines and streamlines coincide. For the configuration studied with vanes, a detailed analysis of these trajectories shows ingress to occur in the middle of the seal clearance. Once entering the seal clearance, it is deflected to the stator side of the seal and then into the wheelspace. Once in the wheelspace (i.e., r < ro − dc), the flow may be deflected to the stator side, the rotor side, or straight down while swirling in the azimuthal direction. Which path taken depends on where along the vane pitch the trajectories started. Here, it is noted that the trajectories shown were not significantly affected by the secondary flows in the vane passages. On egress of the sealing flow, it starts on the rotor side in the wheelspace and flows away from the rotor side and out of the seal clearance.
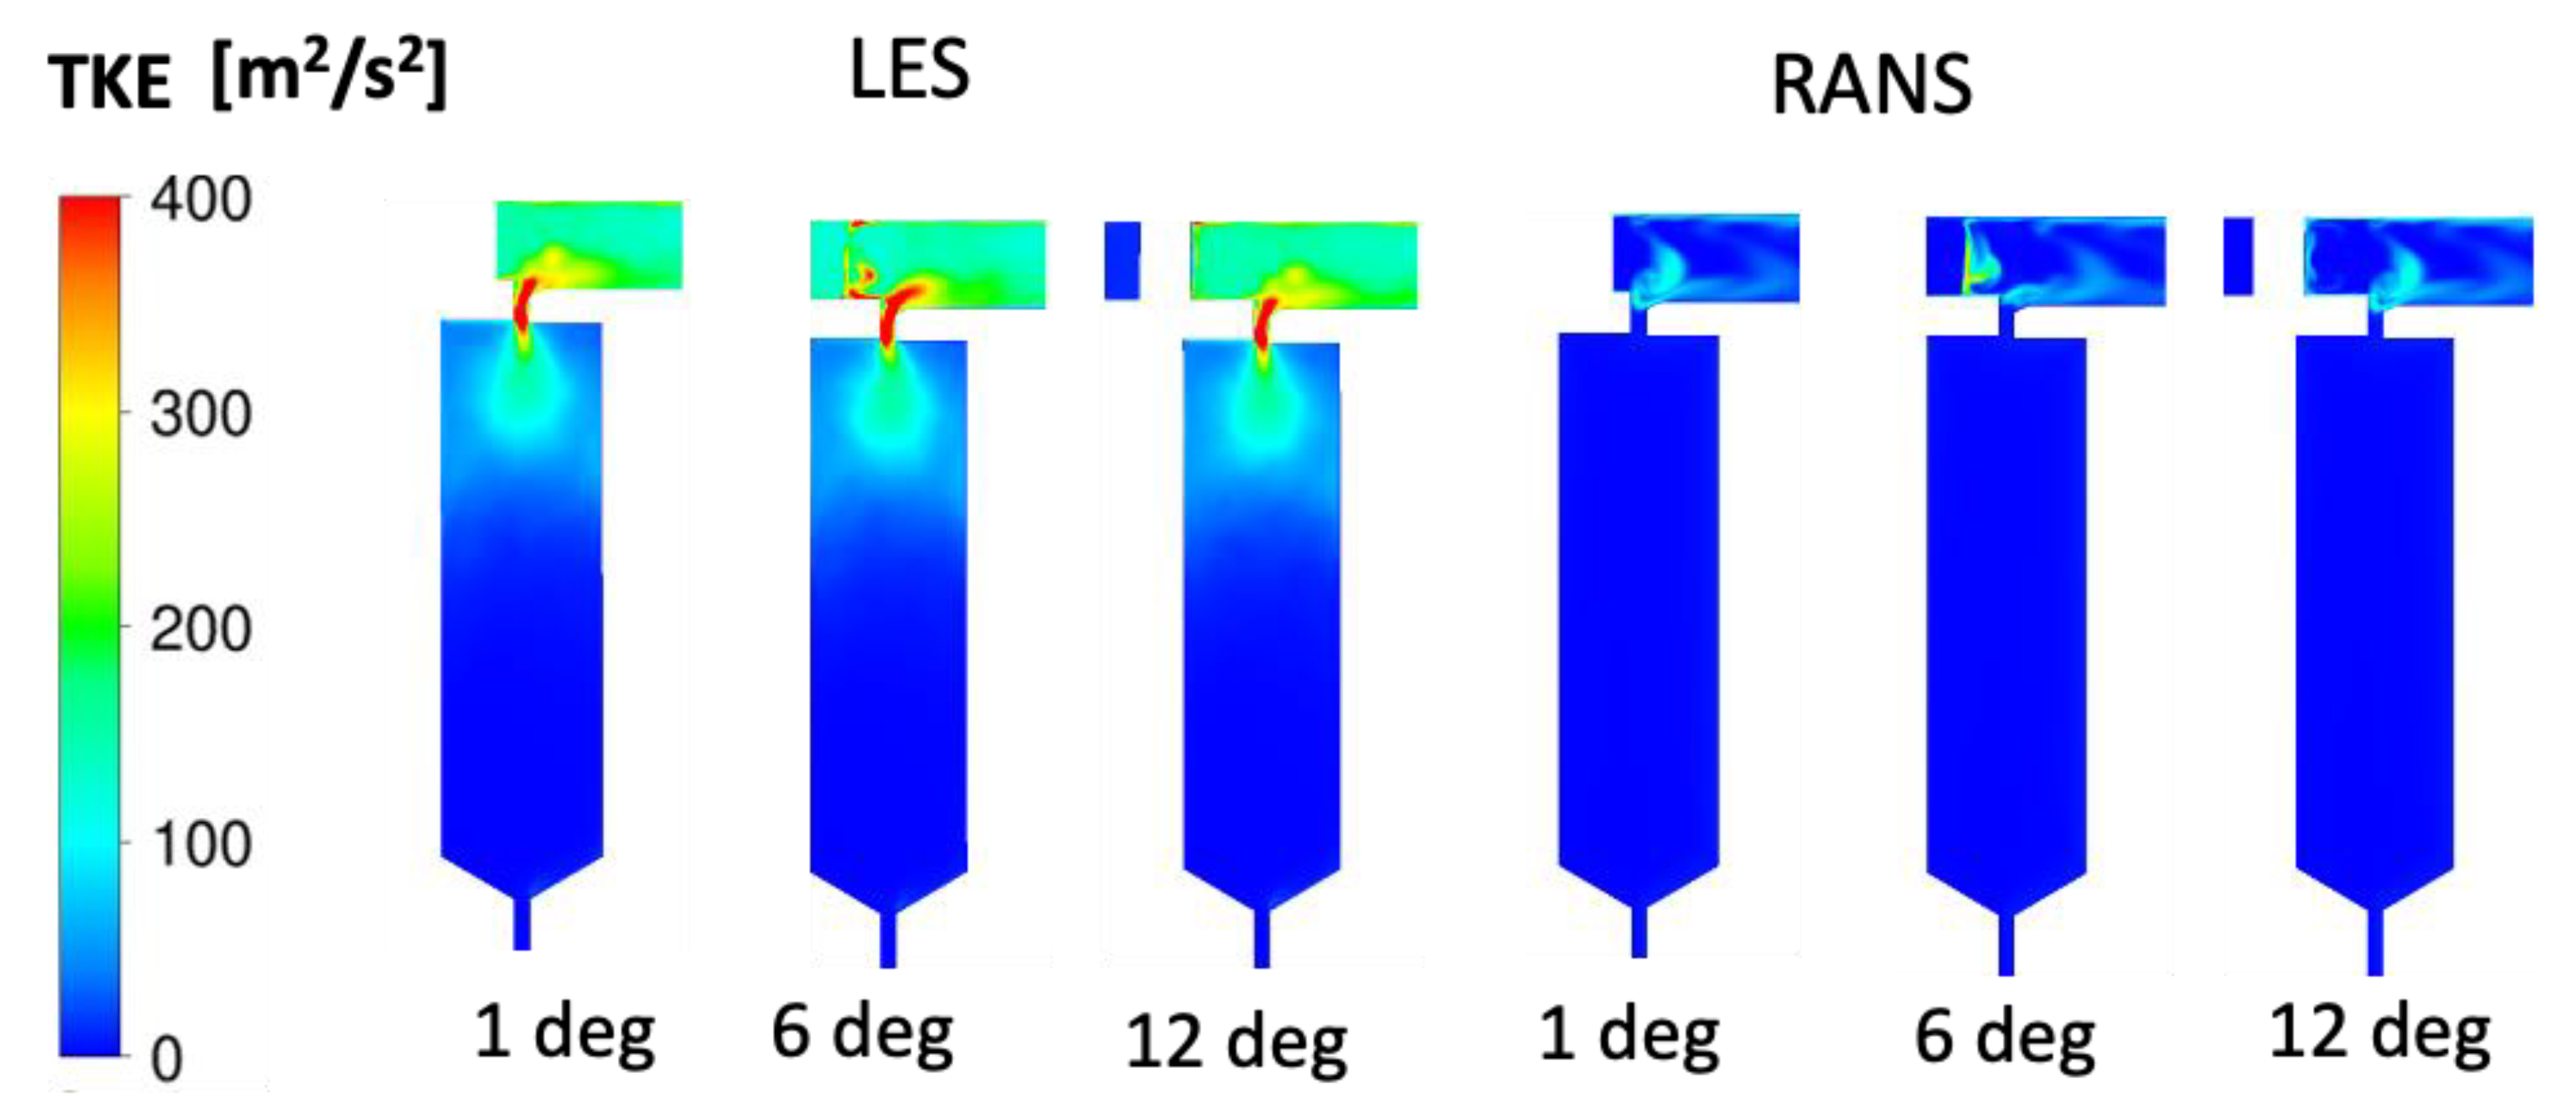
Figure 17 shows the turbulent kinetic energy (TKE) at three r-z planes about the seal region predicted by LES and RANS for the configuration with vanes. From this figure, LES can be seen to predict considerably higher TKE than RANS. This explains in part the higher variation in pressure along the axial direction. The higher TKE about the seal predicted by LES are due to the small scale turbulent structures created by the interaction of the hot gas flow exiting the passage between the vanes, the vortex shedding in the seal clearance, and the Kelvin–Helmholtz instabilities about the leading edge of the rotating rotor. The resolution of these small scale turbulent structures by LES were found to be necessary to predict ingress.
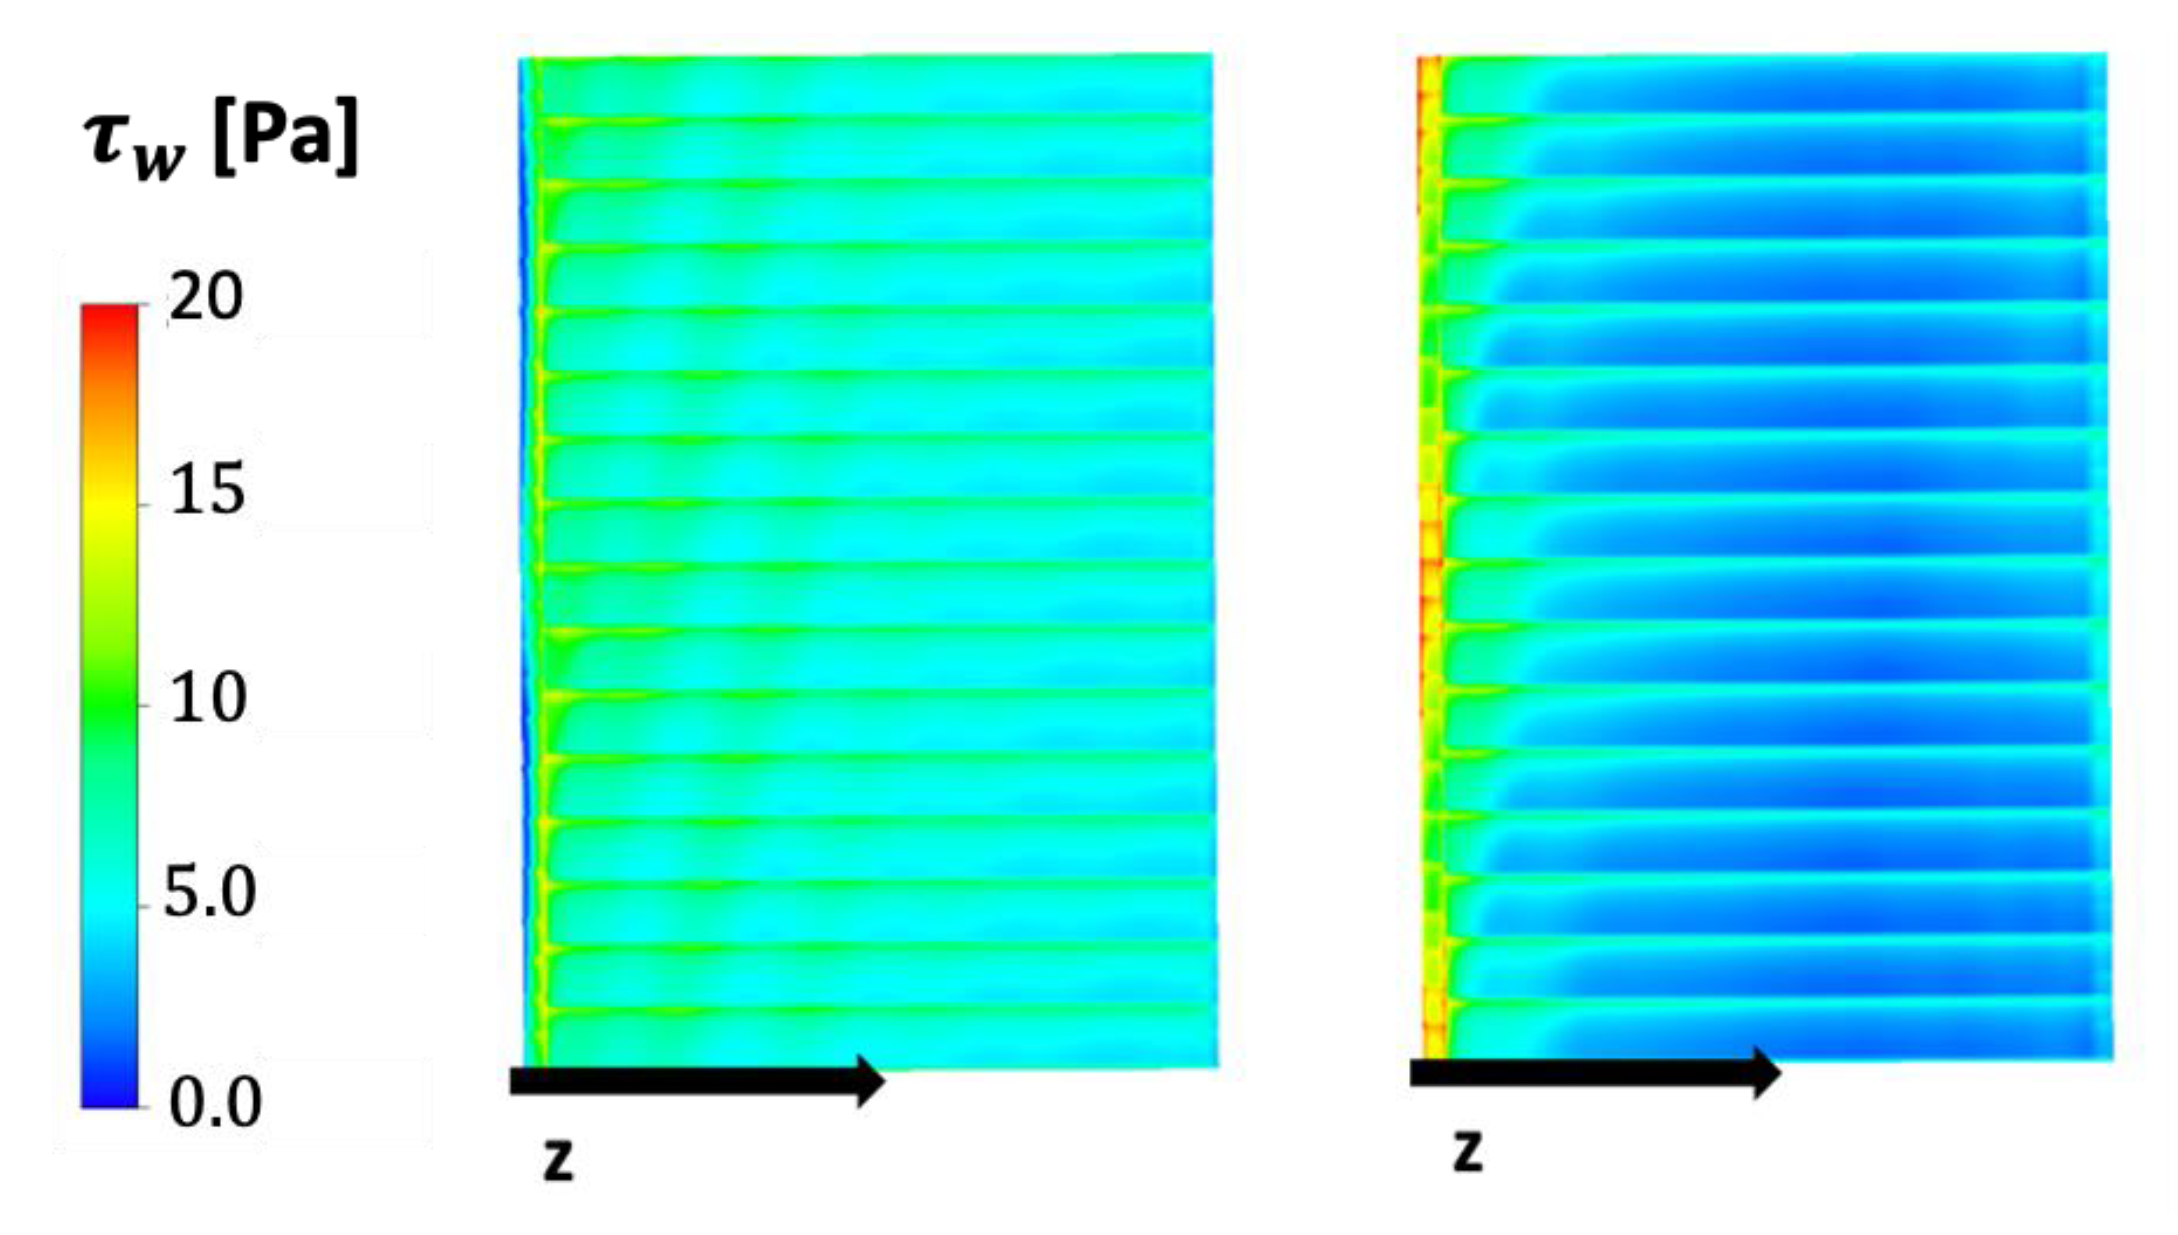
Figure 18 and Figure 19 show the mean shear stress and rate of work per unit area, respectively, on the rotor hub for the configuration with vanes from RANS and LES. The mean wall shear stress, τ w on the rotor hub was used to calculate the rate of work output per unit area by the rotating rotor, W ˙ , as W ˙ = τ w · ω r . From Figure 18 and Figure 19, it can be seen that at the leading edge of the rotor hub (i.e., around z = 0), LES predicts higher shear stress and work output on the rotor wall than RANS does. However, further down the rotor disk, LES predicts lower shear stress and rate of work output.

5.3. Flow Field with and without Stator Vanes

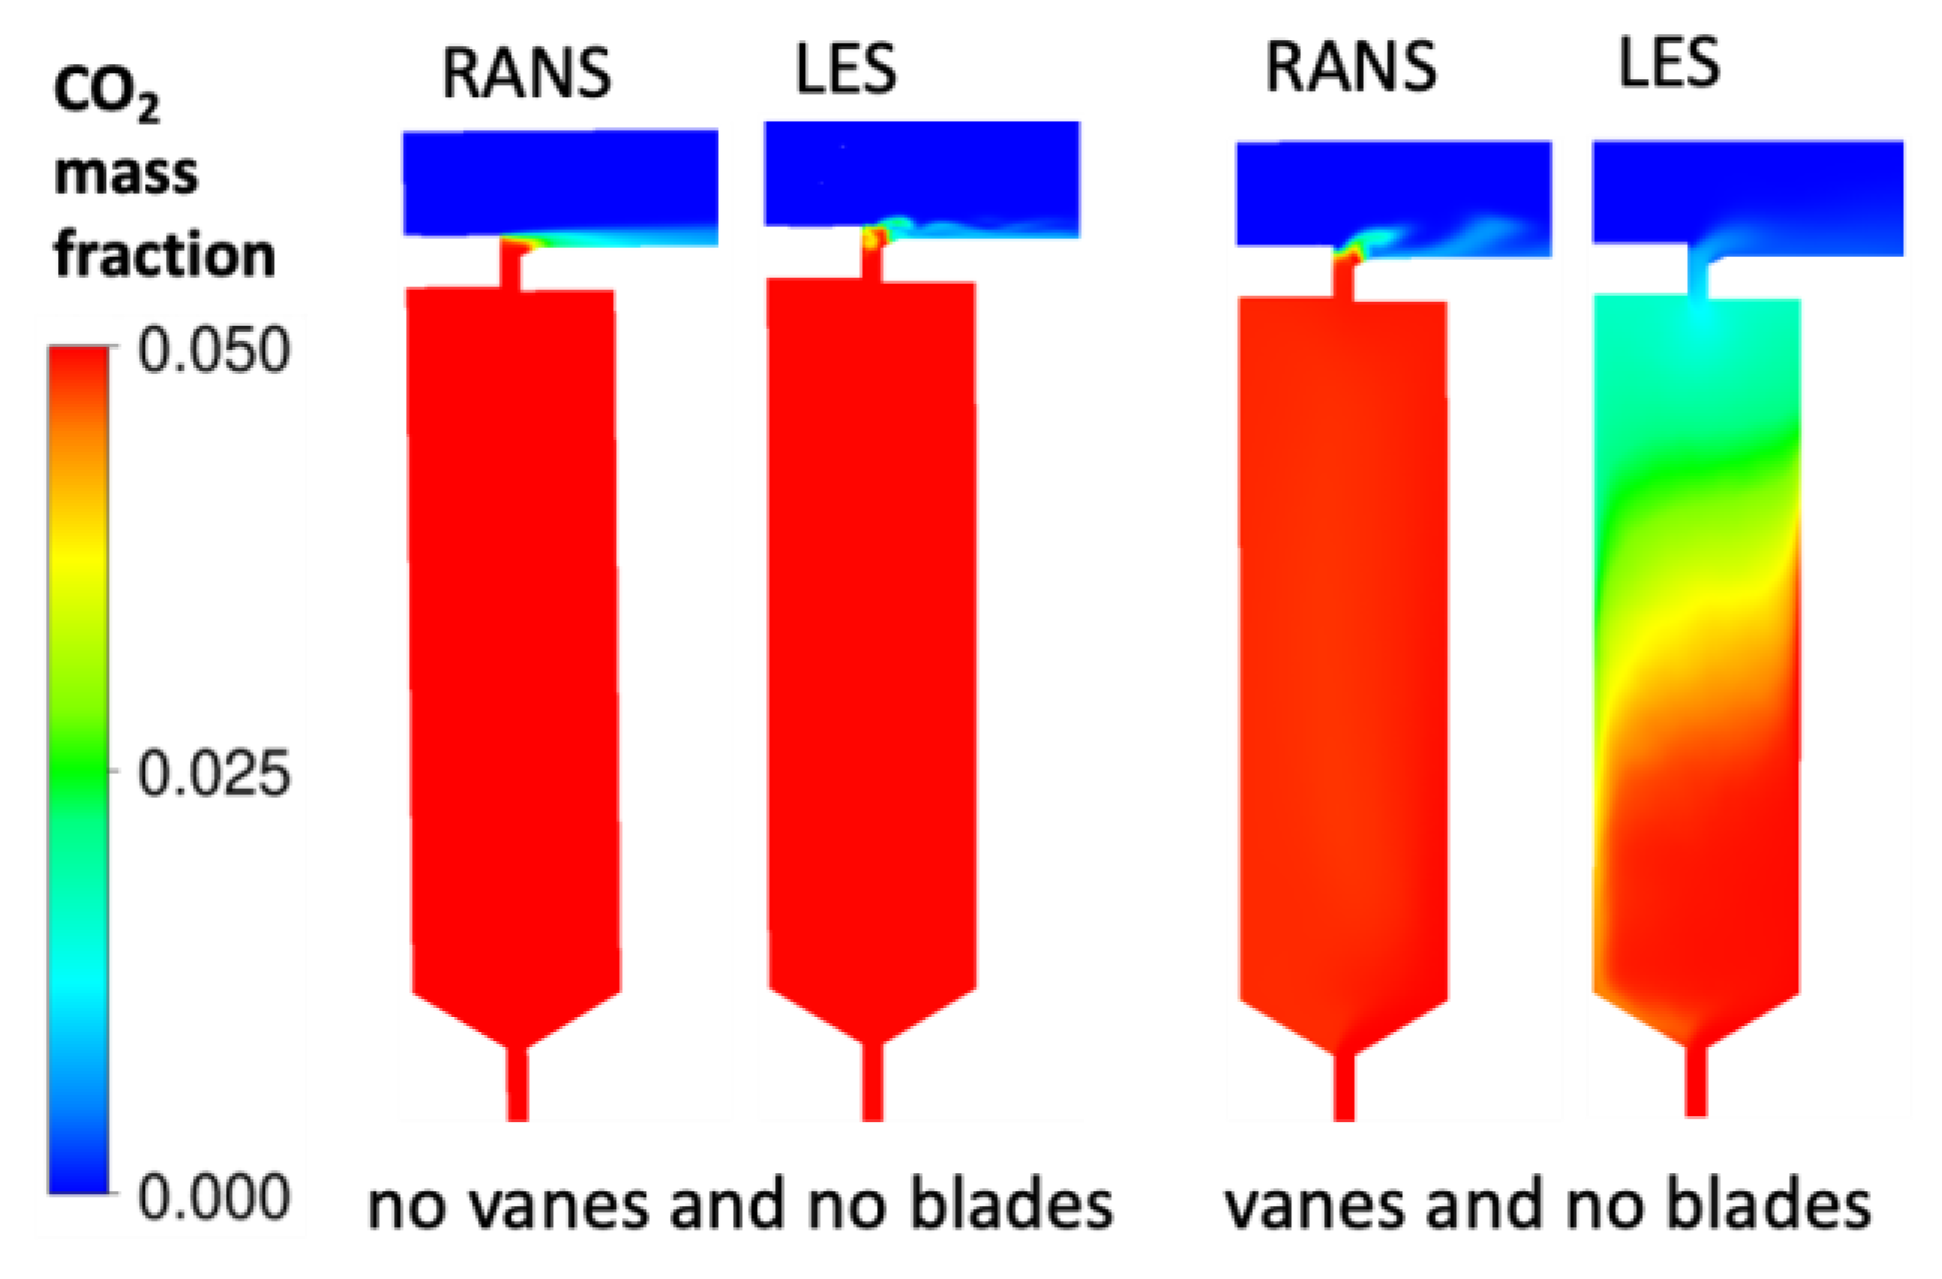
Figure 20, Figure 21, Figure 22 and Figure 23 show the flow in the configuration studied with and without vanes. Figure 20 shows the mean CO2 mass fraction in the wheelspace and seal region predicted by LES and RANS. If there is no ingress, then the concentration of CO2 in the wheelspace should be constant at its value when entering with the sealing flow. If there is ingress, then the concentration of CO2 will be diluted by the gas from the hot-gas path. From Figure 20, LES can be seen to predict ingress if there are vanes and no ingress if there are no vanes. However, RANS predicts zero ingress with or without vanes. This is confirmed by Figure 21 via the sign of the radial velocity. In Figure 21, only the LES results have negative radial velocity in the wheelspace, indicating ingress.
Figure 22 and Figure 23 show the mean pressure distribution. Without vanes, the results from LES show regions of alternating high and low pressures in the seal region created by interactions between the hot gas flow in the axial direction and the boundary layer flow induced by the rotor in the azimuthal direction that produced Kelvin–Helmholtz instability and by the shedding of vortices at the backward facing side of the seal in the seal clearance. These observations are consistent with those made by Nketia et al. [13] for rotationally induced ingress. Though these structures were resolved, the pressure difference across the seal in the radial direction was insufficient to create ingress. Thus, the configuration studied with the radius of the rotor disk is slightly less than the radius of the stator disk, reducing the effects of rotationally induced ingress. When compared to LES, RANS predicts a slightly higher pressure difference across the seal in the radial direction if there are no vanes, but significantly lower pressure difference if there are vanes.

6. Conclusions

LES based on the WALE model and steady RANS based on the SST model were used to study ingress in a rotor–stator configuration with and without stator vanes at an operating condition of R e w / R e ϕ = 0.538 . Key findings are as follows:
  • Both LES and RANS could predict the normalized pressure coefficient, Cp, on the stator platform downstream of the stator vanes and upstream of the seal with reasonable accuracy.
  • LES could predict ingress and the correct sealing effectiveness for the configuration and operating condition studied.
  • Steady RANS could not predict ingress and predicted a grossly incorrect sealing effectiveness.
  • Since steady RANS could predict Cp with reasonable accuracy but could not predict ingress or the correct sealing effectiveness, Cp by itself is inadequate in quantifying ingress.
  • LES predicted a much higher pressure drop in the axial direction about the seal region than RANS, and this produced a much higher pressure drop across the seal in the radial direction to drive ingress into the wheelspace.
  • For LES to correctly predict ingress, the grid size and time-step size must be small enough to resolve the small-scale structures created by the interaction between the hot gas flow in the axial direction, the boundary layer flow induced by rotation in the azimuthal direction, and the shedding of vortices in the seal clearance.
  • On ingress induced by the stator vanes, it starts in the middle of the seal and later deflects onto the stator side. Once in the wheelspace, the flow is entrained by the vortical structures there.
  • On egress, it flows along the rotor side of the wheelspace and exits on the rotor side of the seal.

Author Contributions

Conceptualization, S.N. and T.I.-P.S.; Methodology, S.N. and T.I.-P.S.; validation, S.N.; writing—original draft preparation, S.N. and T.I.-P.S.; writing—review and editing, S.N., T.I.-P.S., K.M.B. and R.D.; funding acquisition, K.M.B. and R.D. All authors have read and agreed to the published version of the manuscript.

Funding

This project was supported by the Ames National Laboratory and the National Energy Technology Laboratory (NETL) of the U.S. Department of Energy under Contract No. DE-AC02-07CH11358/Agreement No. 26110-AMES-CMI. The authors are grateful for this support. The authors are also grateful to Rich Dennis for discussions on the research.

Data Availability Statement

Contact the first author to get data.

Conflicts of Interest

The authors declare no conflict of interest.

Nomenclature

caconcentration of CO2 in annulus
coconcentration of CO2 in sealing flow
csconcentration of CO2 in the wheelspace
Cppressure coefficient: C P = ( P   P   ¯ ) / ( 0.5 ρ ω 2 r o 2 )
c W nondimensional coolant flow rate: c W = m ˙ c / μ c r o
hheight of annulus (see Figure 1)
Iturbulence intensity
Lilength (i = 1, 2; see Figure 1)
mass flow rate
Pstatic pressure
P ¯ mean static pressure
Pbback pressure
rradial coordinate
roradius of hub/inner radius of annulus
r1outer radius of annulus
R e w external flow Reynolds number: R e w = ρ h V h r o / μ h
R e ϕ rotational Reynolds number: R e ϕ = ρ h ω r o 2 / μ h
saxial distance between rotor and stator (gap)
scaxial distance in seal opening (clearance)
Twwall temperature
u τ local friction velocity: u τ = τ w / ρ , where τ w is the averaged wall shear stress
Vvelocity
y+nondimensional turbulent distance
zaxial coordinate
Δ α + normalized grid spacing: Δ α + = Δ α u τ / ν where α = r ,   z ,   or   r Δ θ
β sealing effectiveness based on CO2 concentration: β = ( c s c a ) / ( c o c a )
εrate of turbulence dissipation
θazimuthal coordinate
θosector size of configuration
μ dynamic viscosity
ν kinematic viscosity
ν t ,   e f f effective kinematic viscosity (laminar + turbulent)
ρdensity
τ η Kolmogorov time scale: τ η = ( ν / ε ) 0.5
ω angular speed of rotor disk
Subscripts
ccoolant flow
hmainstream flow

References

  1. Johnson, B.V.; Mack, G.J.; Paolillo, R.E.; Daniels, W.A. Turbine Rim Seal Gas Path Flow Ingestion Mechanisms; Paper No. 94-2703; AIAA: Reston, VA, USA, 1994. [Google Scholar]
  2. Chew, J.W.; Gao, F.; Palermo, D.M. Flow Mechanisms in Axial Turbine Rim Sealing. J. Mech. Eng. Sci. 2019, 233, 7637–7657. [Google Scholar] [CrossRef] [Green Version]
  3. Bohn, D.; Johann, E.; Krüger, U. Experimental and Numerical Investigations of Aerodynamic Aspects of Hot Gas Ingestion in Rotor-Stator Systems with Superimposed Cooling Mass Flow. In Proceedings of the SME 1995 International Gas Turbine and Aeroengine Congress and Exposition, Houston, TX, USA, 5 June 1995; Volume 1: Turbomachinery. p. V001T01A034. [Google Scholar] [CrossRef] [Green Version]
  4. Bohn, D.; Rudzinski, B.; Sürken, N.; Gärtner, W. Influence of Rim Seal Geometry on Hot Gas Ingestion into the Upstream Cavity of an Axial Turbine Stage, 1999. In Proceedings of the ASME 1999 International Gas Turbine and Aeroengine Congress and Exhibition, Indianapolis, IN, USA, 7–10 June 1999; Volume 3: Heat Transfer; Electric Power; Industrial and Cogeneration. p. V003T01A066. [Google Scholar] [CrossRef] [Green Version]
  5. Bohn, D.; Rudzinski, B.; Sürken, N.; Gärtner, W. Experimental and Numerical Investigation of the Influence of Rotor Blades on Hot Gas Ingestion into the Upstream Cavity of an Axial Turbine Stage. In Proceedings of the ASME Turbo Expo 2000: Power for Land, Sea, and Air, Munich, Germany, 8–11 May 2000; Volume 3: Heat Transfer; Electric Power; Industrial and Cogeneration. p. V003T01A088. [Google Scholar] [CrossRef]
  6. Green, T.; Turner, A.B. Ingestion into the Upstream Wheelspace of an Axial Turbine Stage. J. Turbomach. 1994, 116, 327–332. [Google Scholar] [CrossRef]
  7. Sangan, C.M.; Pountney, O.J.; Zhou, K.; Wilson, M.; Owen, J.M.; Lock, G.D. Experimental Measurements of Ingestion Through Turbine Rim Seals—Part I: Externally Induced Ingress. J. Turbomach. 2013, 135, 021012. [Google Scholar] [CrossRef]
  8. Sangan, C.M.; Pountney, O.J.; Zhou, K.; Owen, J.M.; Wilson, M.; Lock, G.D. Experimental Measurements of Ingestion through Turbine Rim Seals—Part II: Rotationally Induced Ingress. J. Turbomach. 2013, 135, 021013. [Google Scholar] [CrossRef]
  9. Roy, R.P.; Feng, J.; Narzary, D.; Paolillo, R.E. Experiment on Gas Ingestion Through Axial-Flow Turbine Rim Seals. ASME J. Eng. Gas Turbines Power. 2005, 127, 573–582. [Google Scholar] [CrossRef]
  10. Laskowski, G.M.; Bunker, R.S.; Bailey, J.C.; Kapetanovic, S.; Itzel, G.M.; Sullivan, M.A.; Farrell, T.R. An Investigation of Turbine Wheelspace Cooling Flow Interactions with a Transonic Hot Gas Path—Part II: CFD Simulations. J. Turbomach. 2009, 133, 041020. [Google Scholar] [CrossRef]
  11. Zhou, D.W.; Roy, R.P.; Wang, C.; Glahn, J.A. Main Gas Ingestion in a Turbine Stage for Three Rim Cavity Configurations. ASME J. Turbomach. 2011, 133, 031023. [Google Scholar] [CrossRef]
  12. Mahoney, T.; Hills, N.; Chew, J.; Scanlon, T. Large-Eddy Simulation of Rim Seal Ingestion. Proc. Inst. Mech. Eng. C J. Mech. Eng. Sci. 2011, 225, 2881–2891. [Google Scholar] [CrossRef]
  13. Liu, J.; Weaver, A.; Shih, T.I.-P.; Sangan, C.M.; Lock, G.D. Modelling and Simulation of Ingress into the Rim Seal and Wheelspace of a Gas-Turbine Rotor-Stator Configuration. In Proceedings of the AIAA SciTech Forum, 53rd AIAA Aerospace Sciences Meeting, Kissimmee, FL, USA, 5–9 January 2015. [Google Scholar] [CrossRef]
  14. Nketia, S.; Shih, T.I.-P.; Bryden, K.; Dalton, R.; Dennis, R.A. Large Eddy Simulation of Rotationally Induced Ingress and Egress around an Axial Seal between Rotor and Stator Disks. Energies 2023, 16, 4354. [Google Scholar] [CrossRef]
  15. Pehle, L.; Wirsum, M.; Stotz, S. Unsteady Flow Phenomena in a 1.5-Stage Test Turbine with an Axial Rim Seal, GT2023-103434. In Proceedings of the ASME Turbo Expo, Boston, MA, USA, 26–30 June 2023. [Google Scholar]
  16. Vella, S.; Darby, P.; Carnevale, M.; Scobie, J.A.; Lock, G.D.; Jarrossay, C.; Salvatori, F.; Bonneau, D.; Sangan, C.M. A Combined Experimental and Turbulence-Resolved Modelling Approach for Aeroengine Turbine Rim Seals. GT2023-103895. In Proceedings of the ASME Turbo Expo, Boston, MA, USA, 26–30 June 2023. [Google Scholar]
  17. Burden, S.; Chew, J.W.; Gao, F.; Marxen, O. Effect of Rim Seal Geometry on Rotationally-Driven Ingestion. GT2023-103041. In Proceedings of the ASME Turbo Expo, Boston, MA, USA, 26–30 June 2023. [Google Scholar]
  18. Nicoud, F.; Ducros, F. Subgrid-Scale Stress Modelling Based on the Square of the Velocity Gradient Tensor. Flow Turbul. Combust. 1999, 62, 183–200. [Google Scholar] [CrossRef]
  19. Dhamankar, N.; Blaisdell, G.; Lyrintzis, A. Overview of Turbulent Inflow Boundary Conditions for Large-Eddy Simulations. AIAA J. 2018, 56, 1317–1334. [Google Scholar] [CrossRef]
  20. Menter, F.R. Zonal Two-Equation k-ω Turbulence Models for Aerodynamic Flows; AIAA Paper 93-2906. In Proceedings of the 23rd Fluid Dynamics, Plasmadynamics, and Lasers Conference, Orlando, FL, USA, 6–9 July 1993. [Google Scholar]
  21. Ansys Fluent Fluid Simulation Software. Available online: https://www.ansys.com/products/fluids/ansys-fluent (accessed on 30 June 2023).
  22. Patankar, S.V. Numerical Heat Transfer and Fluid Flow; Hemisphere Publishing Corp.: Washington, DC, USA, 1980. [Google Scholar]
  23. Celik, I.B.; Cehreli, Z.N.; Yavuz, I. Index of Resolution Quality for Large Eddy Simulations. J. Fluids Eng. 2005, 127, 949–958. [Google Scholar] [CrossRef]
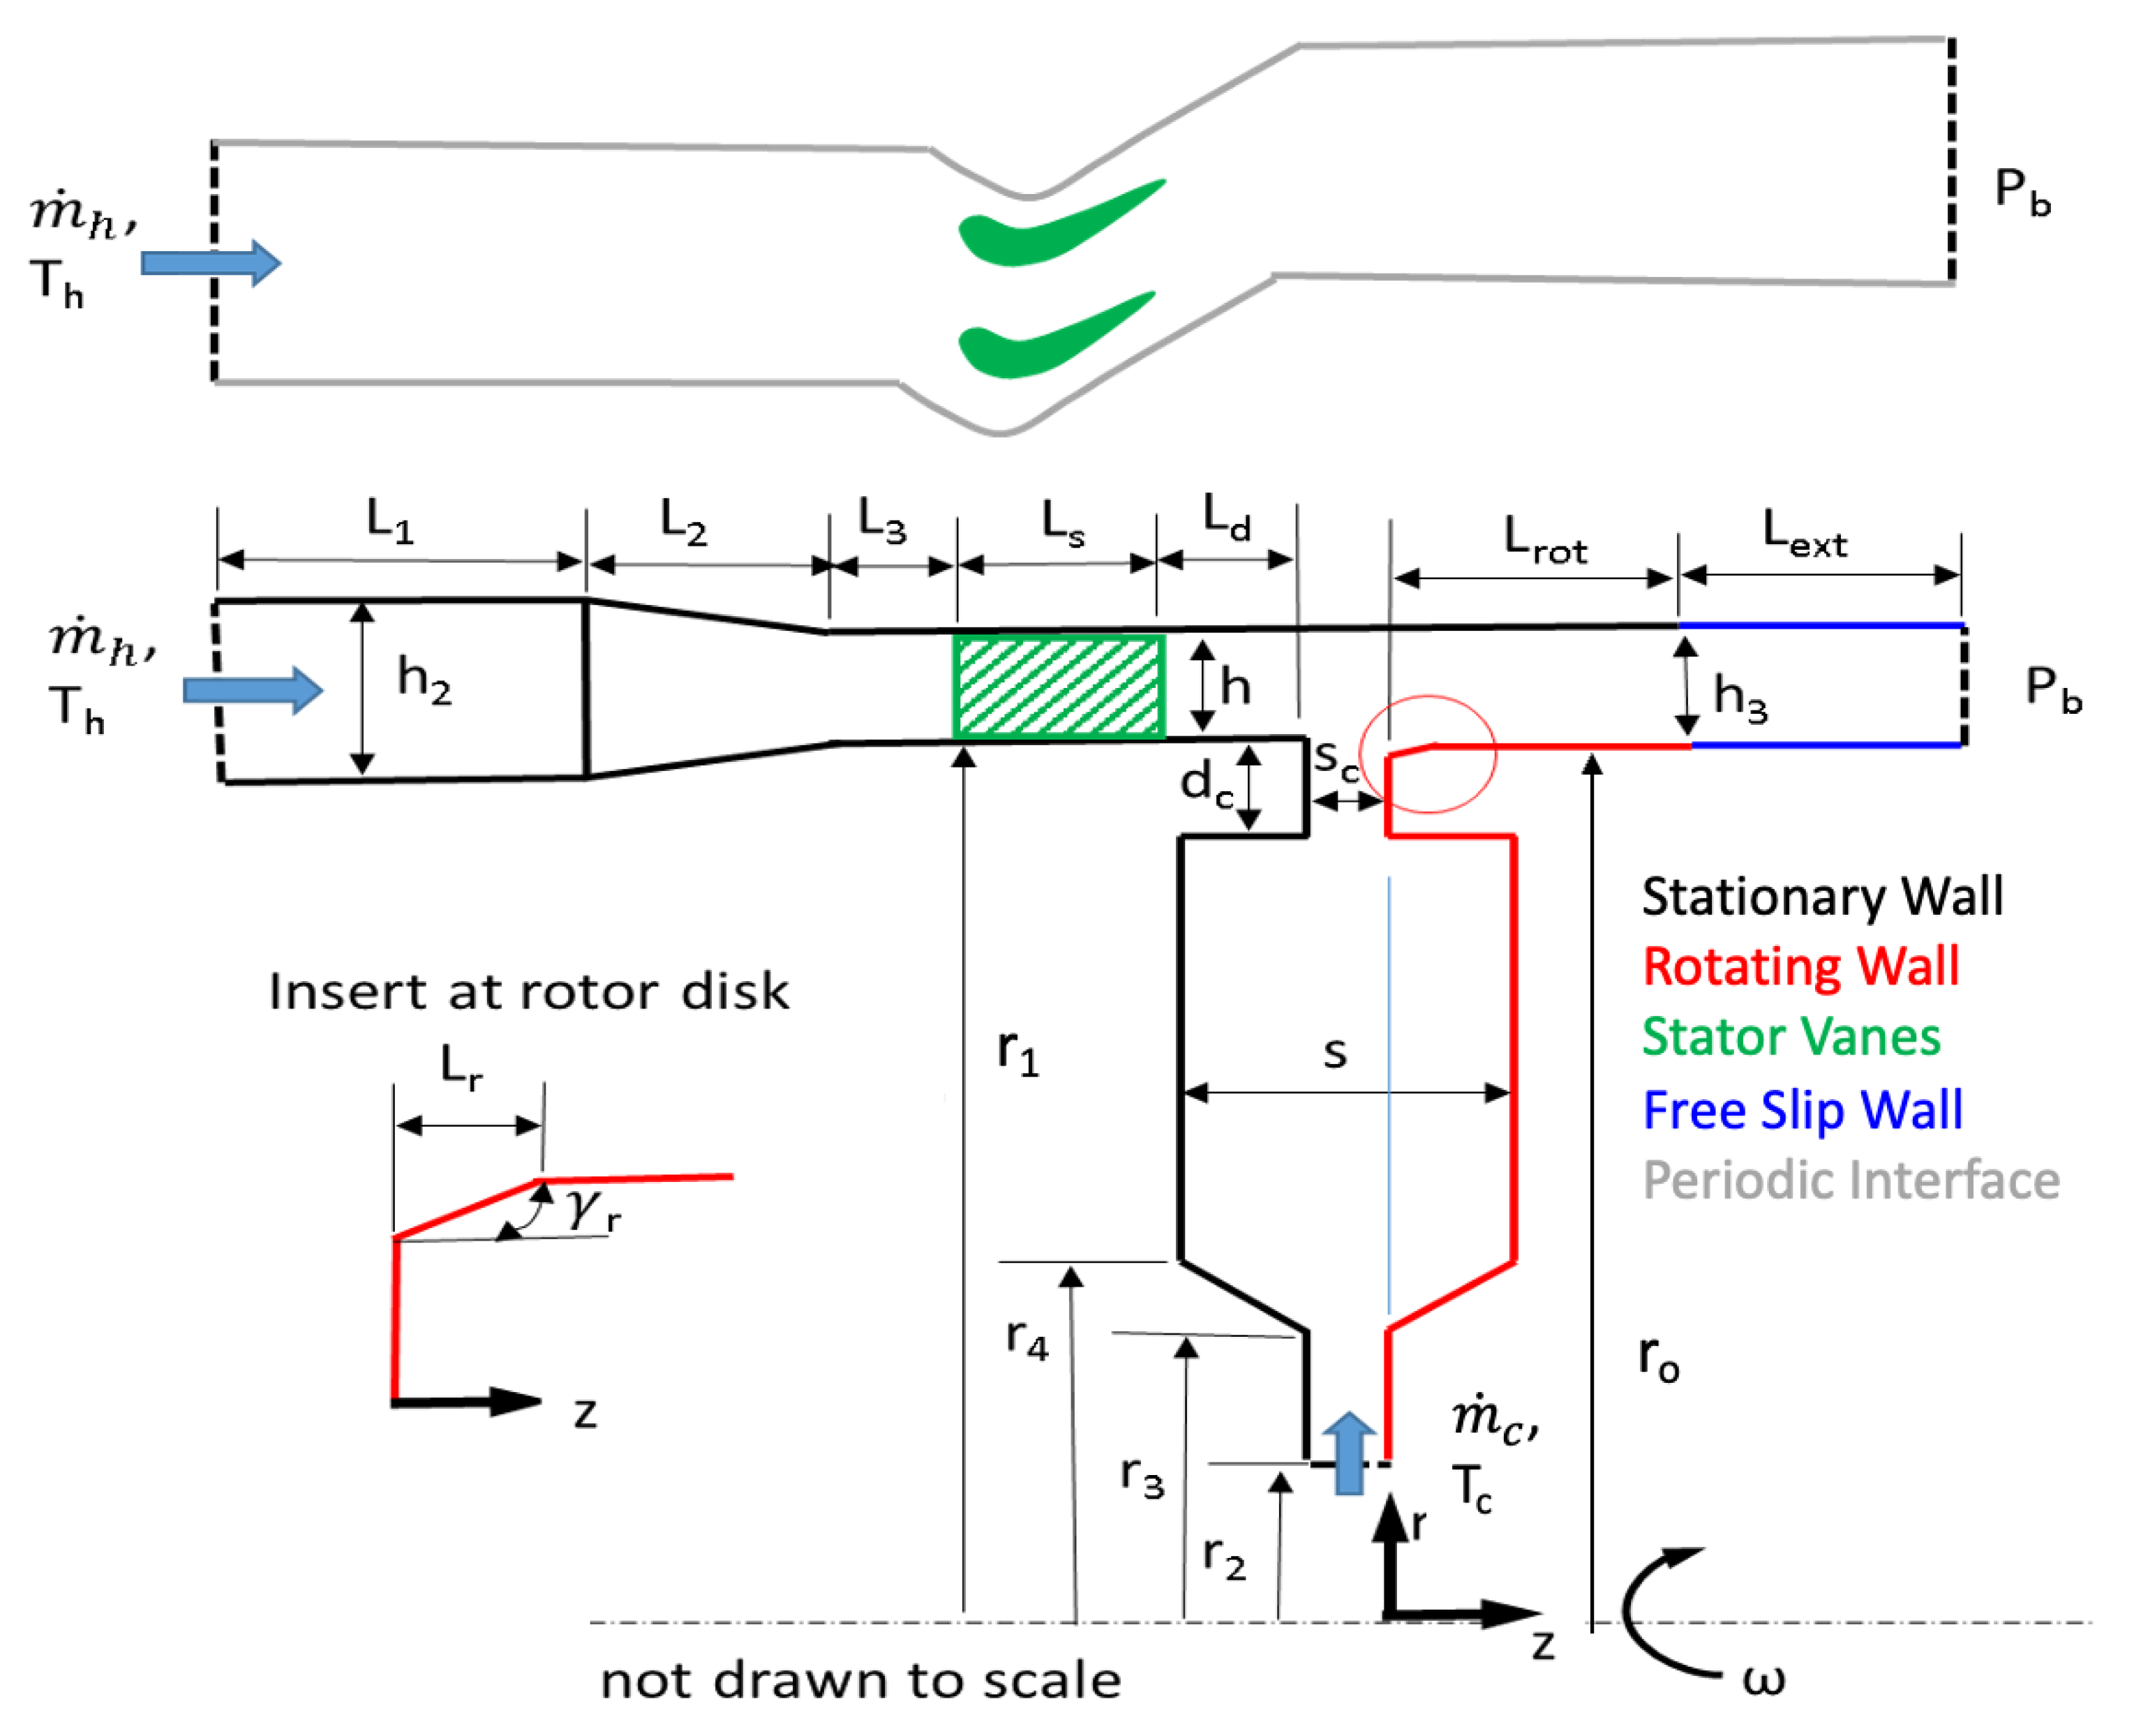
Figure 1. Schematic of rotor–stator configuration studied: h2 = 25 mm, h3 = 11.233 mm, h = 10 mm, dc = 5 mm, L1 = 476 mm, L2 = 94 mm, L3 = 18 mm, LS = 20.5 mm, Ld = 6 mm, Lr = 1.787 mm, Lrot = 50 mm, sc = 2 mm, s = 20 mm, ro = 193.8 mm, r1 = 195 mm, r2 = 84.5 mm, r3 = 116.64 mm, r4 = 122 mm, γr = 24.89°, ω = 3000 RPM, Th = 23.34 °C, m ˙ h = 0.484 kg/s, P b = 101 , 325 Pa, T c = 23.34   ° C , m ˙ c = 0.0068 kg/s.
Energies 16 05985 g001
Figure 2. Grids used for configurations with and without vanes.
Energies 16 05985 g002
Figure 3. y+ at first grid points away from the stator and rotor in seal.
Energies 16 05985 g003
Figure 4. Kolmogorov time scale for the two configurations studied.
Energies 16 05985 g004
Figure 5. LES_IQ for the grids used.
Energies 16 05985 g005
Figure 6. Energy spectra of radial velocity at four locations about the seal.
Energies 16 05985 g006
Figure 7. Predicted and measured sealing effectiveness, β , on the wall of stator disk in the wheelspace at r/(ro − dc)= 0.958, and computed β about the seal and in the wheelspace in one r-z plane.
Energies 16 05985 g007
Figure 8. Distribution of Cp over one vane pitch [7].
Energies 16 05985 g008
Figure 9. Mean pressure on the vane platform and 1.233 mm above the rotor hub for the configuration with vanes.
Energies 16 05985 g009
Figure 10. Time-averaged pressure from LES at three r-z planes.
Energies 16 05985 g010
Figure 11. Mean pressure from RANS at three r- θ planes.
Energies 16 05985 g011
Figure 12. Mean pressure in an r-θ plane at z = sc/2 (middle of seal clearance).
Energies 16 05985 g012
Figure 13. Mean radial velocity in an r-θ plane at z = sc/2 (r = ro is the rotor hub radius).
Energies 16 05985 g013
Figure 14. Mean velocity from LES projected in three r-z planes colored by magnitude of the radial velocity for the configuration with vanes.
Energies 16 05985 g014
Figure 15. Mean velocity from RANS projected in three r-z planes colored by magnitude of the radial velocity for the configuration with vanes.
Energies 16 05985 g015
Figure 16. Ingress from hot gas flow (left) and egress from sealing flow (right) for the configuration with vanes from LES. Colors are used to differentiate different path lines.
Energies 16 05985 g016
Figure 17. Turbulent kinetic energy (TKE) at three r-z planes for the configuration with vanes.
Energies 16 05985 g017
Figure 18. Magnitude of shear stress, τ w , on the rotor hub from the configuration with vanes.
Energies 16 05985 g018
Figure 19. Mean rate of work, W”, per unit area by rotor on the rotor hub for the configuration with vanes.
Energies 16 05985 g019
Figure 20. Mean CO2 mass fraction in an r-z plane of the configuration with and without vanes.
Energies 16 05985 g020
Figure 21. Mean radial velocity in an r-θ plane at z = sc/2 (r = ro is the hub radius).
Energies 16 05985 g021
Figure 22. Mean pressure in an r-θ plane at z = sc/2.
Energies 16 05985 g022
Figure 23. Mean pressure on the vane platform and 1.233 mm above the rotor hub for the configuration without vanes.
Energies 16 05985 g023
Disclaimer/Publisher’s Note: The statements, opinions and data contained in all publications are solely those of the individual author(s) and contributor(s) and not of MDPI and/or the editor(s). MDPI and/or the editor(s) disclaim responsibility for any injury to people or property resulting from any ideas, methods, instructions or products referred to in the content.