Article

A J-Type Air-Cooled Battery Thermal Management System Design and Optimization Based on the Electro-Thermal Coupled Model

School of Mechanical Engineering, Shijiazhuang Tiedao University, Shijiazhuang 050000, China
*
Author to whom correspondence should be addressed.
Energies 2023, 16(16), 5962; https://doi.org/10.3390/en16165962
Submission received: 14 July 2023 / Revised: 3 August 2023 / Accepted: 8 August 2023 / Published: 12 August 2023
(This article belongs to the Section D2: Electrochem: Batteries, Fuel Cells, Capacitors)

Abstract

:
Air-cooled battery thermal management system (BTMS) is a widely adopted temperature control strategy for lithium-ion batteries. However, a battery pack with this type of BTMS typically suffers from high temperatures and large temperature differences (∆T). To address this issue, this study conducted an electro-thermal coupled model to optimize the flow channel structure for reducing the maximum temperature (Tmax) and ∆T in a battery pack for a “J-type” air-cooled BTMS. The parameters required to predict battery heat generation were obtained from a single battery testing experiment. The flow and heat transfer model in a battery pack that had 24 18650 batteries was established by the Computational Fluid Dynamics software ANSYS Fluent 2020R2. The simulation results were validated by the measurement from the battery testing experiment. Using the proposed model, parameter analysis has been implemented. The flow channel structure was optimized in terms of the duct size, battery spacing, and battery arrangement for the air-cooled BTMS. The original BTMS was optimized to reduce Tmax and ∆T by 1.57 K and 0.80 K, respectively. This study may provide a valuable reference for designing air-cooled BTMS.

1. Introduction

Transportation-related CO2 emissions are considered one of the uppermost contributors to artificial greenhouse gas emissions. Therefore, an increasing number of countries and regions are actively promoting the gradual substitution of electric vehicles (EVs) for fuel vehicles to achieve the goal of carbon neutrality [1]. Lithium-ion batteries, which offer high energy density and strong power density, are considered the best power source to date and have thus been widely adopted in EVs [2,3]. It is suggested that the temperature of a lithium-ion battery should maintain between 20 °C to 40 °C owing to its intrinsic chemistry and thermal properties [4]. Also, the temperature difference (∆T) in a battery pack should not be too large; otherwise, it can lead to capacity decay, exacerbating the problem [5]. Thus, a reliable battery thermal management system (BTMS) [6] is crucial for the timely dissipation of heat generated by batteries.
A high-accuracy model to predict heat generation and dissipation accurately is fundamental to designing and optimizing a BTMS. Thus, the model comprises two sub-models: a battery heat generation model and a cooling model for the batteries. The heat generation mechanism by electrochemical reactions during charging and discharging for batteries tended to be complex. Several thermal models were established to predict the relationship between battery heat generation and factors such as the state of charge (SOC) and the battery temperature. These models were primarily divided into two categories: electrochemical-thermal coupled models [7] and electro-thermal coupled models [8]. The electrochemical-thermal model was originally proposed by Kumaresan [9], which related to the temperature changes in the ion diffusion and electrochemical reaction processes of the battery and was utilized to predict the temperature changes and distribution under various operating conditions. Moreover, it investigated the relationship between the solid–liquid phase concentration diffusion coefficient and ionic conductivity with temperature and ion concentration. Mastali et al. [10] developed a three-dimensional electrochemical model to predict temperature distribution for a square battery and validated the model by comparing the voltage and temperature distribution with experiment data. Li et al. [11] studied the relationship between the total heat generation rate distribution and battery current density using an improved three-dimensional electrochemical-thermal coupled model under the influence of discharge rate and ambient temperature, and it is of great importance for optimizing the design of square battery electrode structures and BTMS. The electrochemical-thermal coupled model approaches the battery from the perspective of electrochemistry to obtain its characteristics. This model tends to be highly complex, involves numerous parameters, and requires significant computational resources. The electro-thermal coupled model is used to investigate the temperature distribution within a battery and provides a macroscopic description of the battery’s electrical and thermal properties. Compared with the former coupled model, the electro-thermal coupled model provides lower model complexity, making it a more practical option for real-world applications. Zhang et al. [12] utilized an electro-thermal coupled model to analyze the temperature distribution of thermal runaway during high-rate discharge and short circuit conditions of a 6S4P battery pack. They obtained the three-dimensional temperature distributions for the cold plate cooling channel. Under a discharge rate of 5 C, the maximum temperature (Tmax) of the battery pack was below 40 °C and the maximum temperature difference (∆Tmax) was below 5 °C. Huang et al. [13] applied a square battery to experimentally verify a combined simulation method of an equivalent circuit model (ECM) and computational fluid dynamics combined with an electro-thermal coupled model under different temperature and charge-discharge rate conditions. The comparison between the simulated and the measured demonstrated excellent agreement. Chen et al. [14] coupled the thermal model with the second-order RC ECM and proposed a battery temperature adaptive estimation method that employed joint Kalman filtering. The method represents the battery’s thermal resistance with resistance, the heat source with current, and the thermal capacity with capacitance. Compared with traditional electro-thermal coupled model results, the method has higher temperature estimation accuracy.
Among several cooling methods, liquid cooling and air cooling have been commercialized. Liquid-cooled BTMSs with high efficiency and compactness are usually applied in mid to high-end EVs, whereas an air-cooled BTMS is widely adopted in light-duty EVs owing to its simpler design, high reliability, lightweight and lower cost [15,16]. However, the performance of fast charge and discharge is poor because of the significantly low heat transfer rate and specific heat of air. Those specific manifestations include that (1) the Tmax may increase because the air-cooled BTMS may be unable to supply the required cooling load to the battery pack [17]; and (2) a large ∆T within the battery pack is likely to occur. Furthermore, an air-cooled BTMS tends to be with high energy consumption [18]. To address the problems, many efforts to change the flow channel structures and control strategies have been carried out to decrease the ∆T and energy consumption [19]. Kirad et al. [20] investigated the effect of the lateral and longitudinal distances between batteries on temperature and temperature uniformity. Park [21] discovered that using a tapered flow channel in U-type BTMS with the inlet and outlet on the same side can distribute airflow more evenly to every cooling channel, resulting in improved heat dissipation. Xie et al. [22] optimized the inlet angle, outlet angle, and battery spacing of U-type BTMS and achieved reductions of 12.82 % and 29.72 % in the Tmax and ∆Tmax, respectively. Hai et al. [23] numerically studied a battery pack consisting of 16 cells arranged in various ways in a Z-type airflow channel. Research revealed that aligning the batteries in a pack can effectively reduce the average temperature (Tav) of the battery pack, as compared to using a non-aligned arrangement. Liu et al. [24] analyzed the performance of Z-type and U-type air-cooled BTMS under various battery operating conditions. The results showed that the J-type was more effective than the Z-type and U-type in controlling both temperature rise and pressure drop. By integrating these two structure types and incorporating adjustable valves at the two outlets, the temperature uniformity of the battery pack could be substantially enhanced. Previous research has demonstrated that the cooling efficiency of BTMS was significantly influenced by the flow pattern, which changed according to the inlet and outlet positions. The flow pattern of BTMS changes with the positions of the inlet and outlet, which has a significant impact on the cooling efficiency of the parallel air-cooling BTMS. Considering the different outlet positions, BTMS forms different flow patterns, including Z-type, U-type, and J-type. However, most studies are limited to comparisons of Z-type and U- type structures, with few studies on the influence of changing structural parameters on the cooling performance of cylindrical lithium-ion batteries on the cooling performance of J-type BTMS.
In this paper, the analysis focuses on the impact mechanism of air duct size, spacing between batteries, arrangement of batteries, and air velocity on the performance of the air-cooled BTMS for J-type cylindrical lithium-ion batteries. The rest of the paper is organized as follows. Section 2 constructs a platform for testing the thermal characteristics and develops a battery electro-thermal coupled model. The structural parameters are optimized by simulation in Section 3. Lastly, the relevant conclusions are drawn in Section 4.

2. Model Development

2.1. Computational Fluid Method

Computational Fluid Dynamics (CFD) method is an effective way to calculate the flow field and the temperature field. In ANSYS Fluent, the governing equations were discrete by the finite volume method, including the continuity, momentum, and energy equations. For the cooling air, these equations are expressed as [15]:
Continuity equation:
ρ a t + ρ a ν = 0
Momentum equation:
( ρ a ν ) t + ( ρ a ν ν ) = P a
Energy equation:
( ρ a C p a T a ) t + ( ρ a C p a ν T a ) = ( K a T a )
The energy governing equation for the battery cell is given by:
ρ b C p b T t = ( K b T ) + q
where ρ represents the density, Cp is the specific heat, T is the temperature, P is the pressure, K is the heat conductivity coefficient, and q represents the heat generation rate per unit volume of the battery. To clarify, the subscripts a and b are used to represent the air and battery, respectively.
The heat generation rate is gained by integrating with Ohm’s Law [25]:
q = 1 V I 2 R e I T U O C V T
where V, I, Re, T, U O C V , U O C V T is the volume of the battery, the current flowing through the battery, and the total internal resistance of the battery, comprising the ohmic resistance and the polarization resistance, temperature, open circuit voltage, and entropy heat coefficient, respectively.
Since the Reynolds number of the air-cooled BTMS typically exceeds 3000 [26], the airflow is turbulent. To account for the effects of turbulence, the widely validated standard k-ε model has been selected for this study. This turbulence model has been shown to be effective in modeling general low-speed and low-pressure flow around obstacles in previous research [27,28,29]. The k-ε turbulence model includes two equations [3] for the turbulent kinetic energy k and the turbulent kinetic energy dissipation rate ε.
Turbulent kinetic energy equation:
t ( ρ k ) + x j ( ρ k u j ) = x j ( ( μ + μ t α k ) k x j ) + G k + G b ρ ε Y M + S k
Turbulent kinetic energy dissipation equation:
t ( ρ ε ) + x j ( ρ ε u j ) = x j ( ( μ + μ t α ε ) ε x j ) + C 1 ε ε k ( G k + C 3 ε G b ) ρ C 2 ε ε 2 k + S ε
where k is turbulent kinetic energy, ε is turbulent dissipation rate, uj is the jth component of the velocity vector, and μ and μt represent molecular and turbulent dynamic viscosity coefficients, respectively. Gk is the turbulent kinetic energy generation caused by mean velocity gradients, Gb is the turbulent kinetic energy generated by buoyancy effects, YM is the fluctuating dilatation contribution in compressible turbulence to the overall dissipation rate, and Sk and Sε represent source terms of k and ε, respectively, αk and αε represent the inverse effective Prandtl numbers for k and ε, respectively, and C1ε and C2ε represent empirical parameters.

2.2. Model and Boundary Conditions Setup

Figure 1a depicts the air-cooled BTMS sketchily. Reference [30] investigated a square-type battery, while this study focused on ICR18650 cylindrical lithium-ion batteries. Cylindrical batteries have been in development for a longer time and are more standardized, which makes it easier to achieve uniform industry standards. Additionally, the manufacturing process for cylindrical batteries is more mature and cost-effective. Considering the battery dimensions and the spatial constraints of the air-cooling system, we designed a parallel arrangement of 24 cells was designed, with 3 cells in series and 8 cells in parallel. Designing a J-type air-cooled BTMS for battery packs, the air is drawn into the system through a lower left inlet and exits through two outlets on the upper left and right sides. The J-type structure is derived from the commonly used U- and Z-type configurations. Its thermal performance is superior to that of the U-type and Z-type, as it features an additional outlet. The J-type BTMS incorporates two outlets that effectively target hot areas, ensuring a narrow range temperature uniformity and significantly enhancing thermal performance. The detailed geometrical parameters of the BTMS are shown in the three-view diagram in Figure 1b. The height of the inlet and outlet ducts is 8 mm, and the distance between the battery pack and the system wall is 5 mm. The external surface distance between adjoining cells is 3 mm. During the simulation process, the thermal-physical field coupling between the air-fluid and the solid battery was defined. The initial conditions for the BTMS were set, including the initial SOC of the battery at 1, the discharge rate, and the physical properties of the battery and air (Table 1 for physical properties of ICR18650 cylindrical lithium-ion batteries and air [31]). The settings for the boundary conditions are shown in Table 2.

2.3. Experimental Setup and Procedure

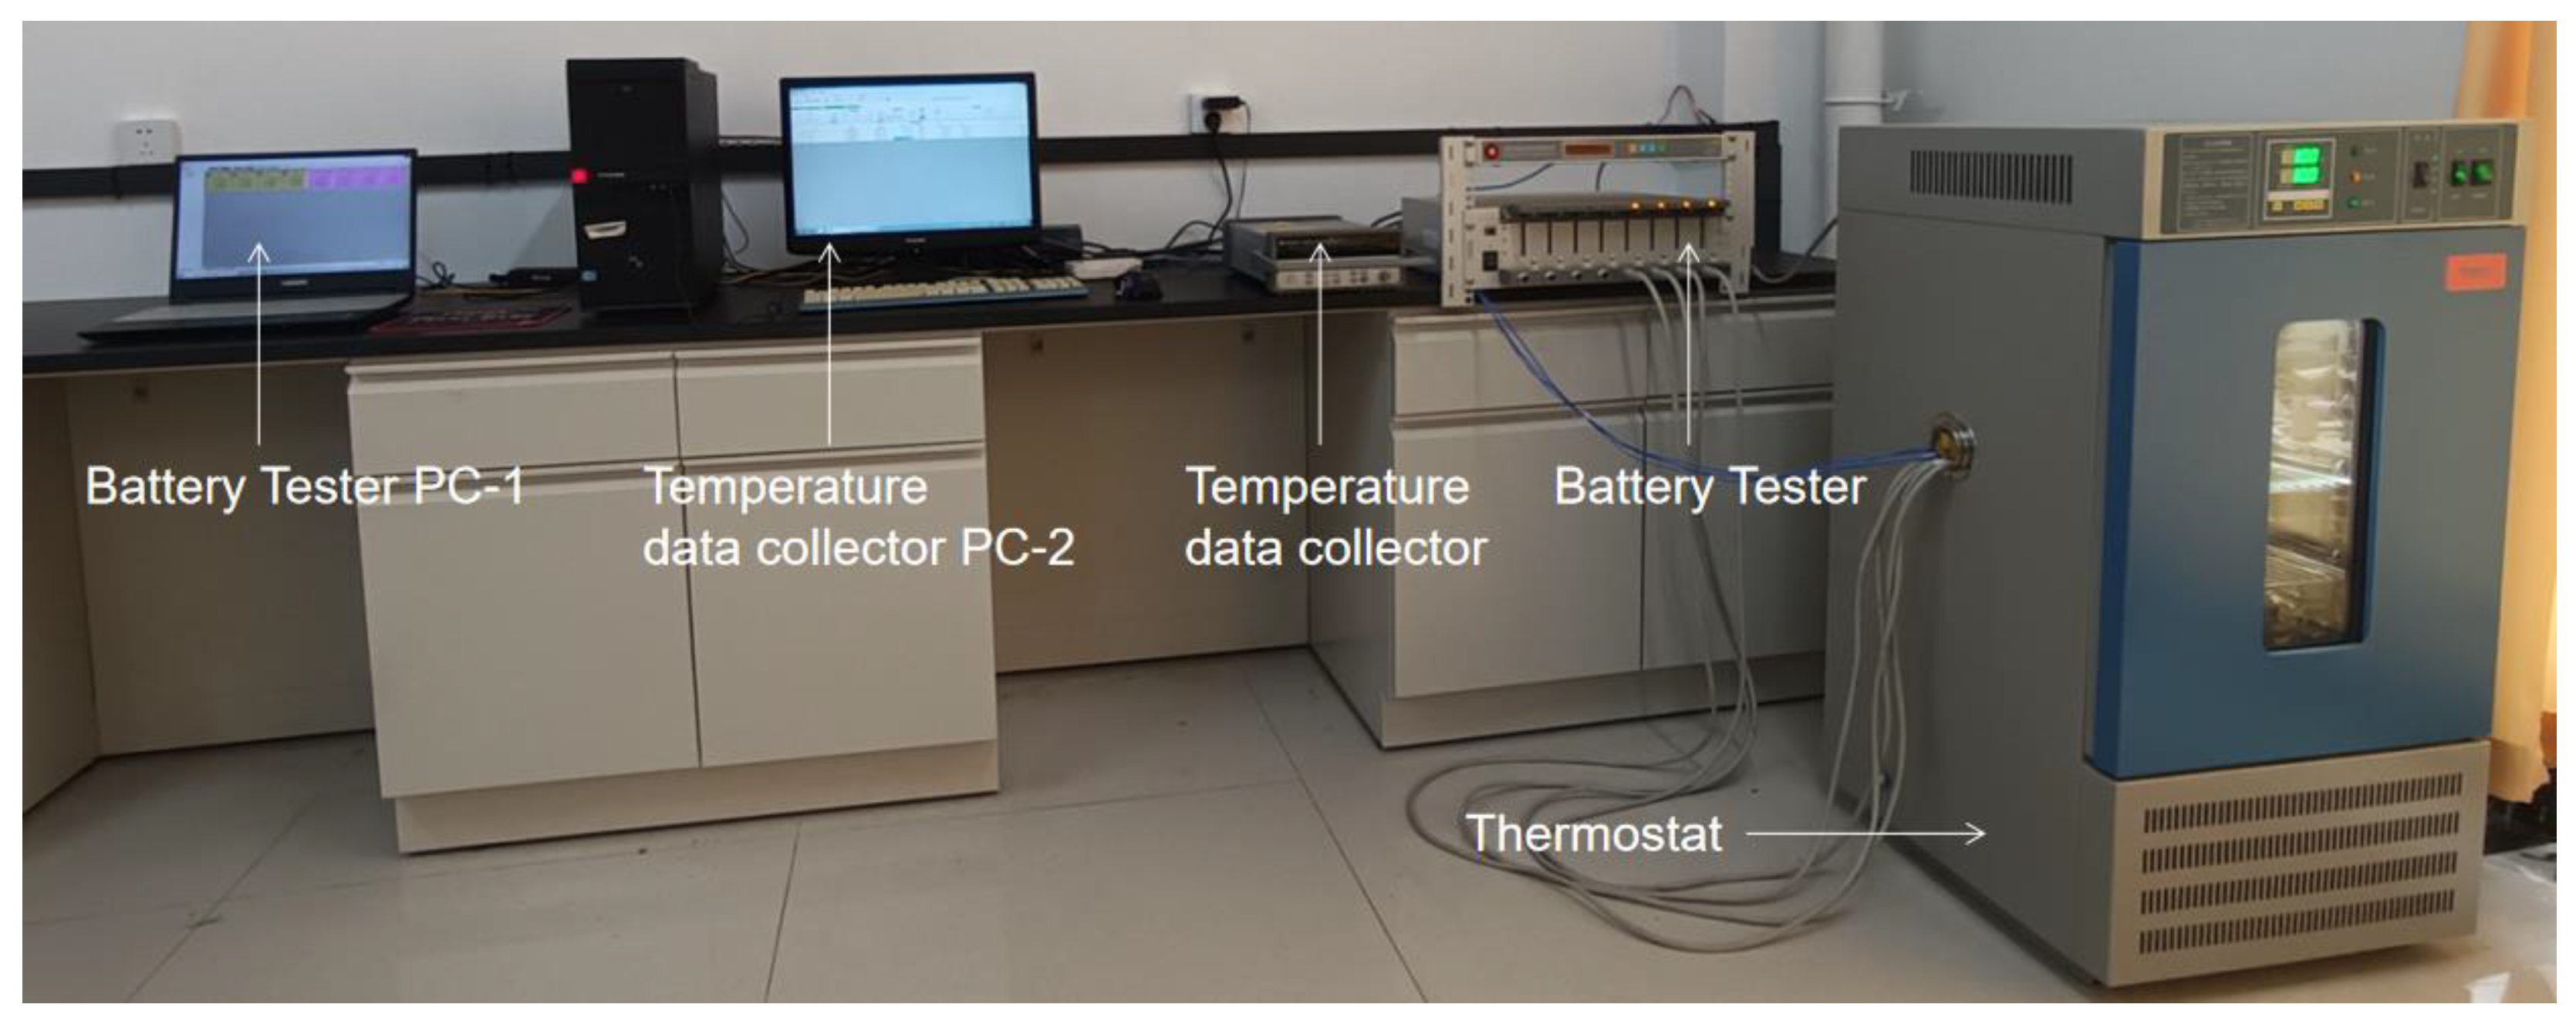
To acquire the parameters required for battery heat generation and validate the subsequent results predicted by the model, an experiment was carried out. Figure 2 displays the experimental setup. An ICR18650 lithium-ion battery was applied for the test. Table 3 exhibits the cell specifications. The Battery Tester (CT-4008T-5V6A-S1) setup comprises a mid-range computer, a testing instrument, and a router switch, all interconnected via Ethernet cables to the PC-1. PC-1 provides the charge and discharge instructions for the battery through BTS8.0.0 software, while PC-2 is used for monitoring temperature data. The Temperature Data Collector (34970A) used in this experiment needs to pair with computer software and a K-type thermocouple (SSM1-50) connected via a slot, for the purpose of collecting and recording temperature test data. The experimental system was used in the paper to perform capacity testing and internal resistance testing on cylindrical lithium-ion batteries under different environmental temperatures and different charging and discharging rates.
This study employed an electro-thermal coupled model based on the ECM to experimentally and numerically examine the thermal characteristics of lithium-ion batteries. Figure 3 shows the six-parameter model proposed by Chen [32], which consists of a simulation circuit composed of three resistors and two capacitors, where Rs, R1 + R2 represents the ohmic resistance and the polarization resistance of the battery, respectively.
The relationship between voltage and current in the circuit is gained by:
V = V ocv s o c V 1 - V 2 - R s s o c I T
d V 1 d T = - 1 R 1 s o c C 1 s o c V 1 - 1 C 1 s o c I T d V 2 d T = - 1 R 2 s o c C 2 s o c V 2 - 1 C 2 s o c I T
d s o c d T = I T 3600 C
where VOCV is open circuit voltage, SOC is the state of charge of a battery, Rs represents the ohmic resistance of the battery, R1 + R2 represents the polarization resistance of the battery, and C represents the capacity of a battery.
Figure 4 demonstrates that the charge and discharge capacity exhibits the same trend with changes in ambient temperature at different charge and discharge rates. Between the ambient temperatures of 283 K and 313 K, the charge and discharge capacity of the battery increases with the rise in temperature under the same charge and discharge rates. Between the charge and discharge rates of 0.5 C and 2 C, under the same ambient temperature, the charge and discharge capacity of the battery decreases as the charge and discharge rate increases. At an ambient temperature of 313 K and charge and discharge rates of 0.5 C and 1 C, the charge and discharge capacities both exceed the rated capacity, leading to overcharging, which is one of the critical risks for thermal runaway in lithium-ion batteries. It is therefore necessary to perform thermal management of the battery pack under high-temperature conditions. Figure 5 shows that the charge and discharge efficiency increases with temperature. According to the working principle of lithium-ion batteries, the activity of conductive ions in the electrolyte is poor in a low-temperature environment, which affects the battery’s charge and discharge efficiency. As the temperature increases, the battery’s charge and discharge efficiency improves. A charge and discharge efficiency exceeding 1 indicates the risk of overcharging the battery, also highlighting the importance of the cooling system.
The voltage step-change curves of the pulse current at different states of charge were obtained through internal resistance testing experiments under different environmental temperatures and charge–discharge rates [33]. Figure 6a shows a comparison of the pulse voltage step-change curves at the charge–discharge rate of 0.5 C and environmental temperatures of 283 K and 313 K. It can be seen that different environmental temperatures have an impact on pulse charge–discharge, with a larger step-change observed at a lower temperature of 283 K than at a higher temperature of 313 K. The sudden change in voltage since during the measurement of the battery voltage, the voltage drops during constant current discharge, and after a certain period of idle time, the battery voltage returns to a stable state. The stable voltage does not recover to the stable voltage at the previous (SOC). Figure 6b shows a contrast of the pulse discharge voltage step-change at discharge rates of 1 C and 2 C and environmental temperature of 293 K. From the curves presented, it is clear that different discharge rates have an impact on pulse discharge, with a larger step-change observed at a higher discharge rate of 2 C than under a lower discharge rate of 1 C under the same environmental temperature.
The ohmic resistance Rs and polarization resistance R1 + R2 under different operating conditions have been calculated by fitting the voltage pulse step change curves obtained from experiments, as shown in Figure 7.
Figure 7 shows a comparison of the difference of the ohmic resistance Rs and polarization resistance R1 + R2 with SOC under different environmental temperatures. The change of the ohmic resistance Rs with SOC is relatively stable under different charge-discharge rates and different temperatures, with slightly higher values observed at SOC of 0.1 and 1.0. For the same charge–discharge rate, the ohmic resistance Rs decreases with increasing temperature (283 K–313 K), with the highest value observed at 283 K. The polarization resistance R1 + R2 decreases with increasing temperature. At low temperatures (283 K), the polarization resistance R1 + R2 is significantly higher at low SOC (0.1–0.2) and high SOC (0.8–1.0). With increasing environmental temperature, the polarization resistance R1 + R2 decreases significantly at lower and higher SOC, especially at higher SOC. In accordance with the working principle of lithium-ion batteries, the increase in ohmic resistance and polarization resistance is caused by the influence of environmental temperature and charge–discharge rate on the migration speed of lithium ions in the concentrated solution inside the battery.
Within a certain temperature range (283 K–313 K), the ohmic resistance and polarization resistance decrease gradually with increasing temperature. At the same temperature, the ohmic resistance Rs remains almost unchanged as the SOC increases. At lower environmental temperatures, the polarization resistance is higher at lower and higher SOC, and the decreasing trend of the polarization resistance R1 + R2 at low SOC is less than that at high SOC as the environmental temperature increases. The ohmic resistance and polarization resistance together constitute the total internal resistance of the lithium-ion battery, and their variations determine the different heat generation of the lithium-ion battery under various working conditions.

2.4. Grid Independence Analysis

This paper used structured mesh division of multiple levels of refinement in the BTMS model, and the simulation results began to converge when the grid count exceeded 1.25 million. During the simulation, we monitored the battery’s central region and examined how different grid sizes affected the temperature under simulated conditions.
Figure 8 shows the Tmax change at different numbers of temperature monitoring points with different grid sizes. Gradual stabilization of the Tmax in the simulation occurs as the grid size becomes finer and the number of grids increases, with stabilization being achieved when the number of grids exceeds 1.25 million. Considering the computational resources available for this study, a grid division method with 1,567,850 grids was ultimately chosen for the simulation calculation. Figure 9 presents the result of grid partitioning with a grid size of 0.1 mm and a total of 1,567,850 body grids. The contact surface between the battery and air has been divided into four boundary layers with a growth rate of 1.4×.

2.5. Thermal Model Verification

Finite element simulation was carried out on a single thermal model, and the temperature rise curves obtained from experiments and simulations under different environmental temperatures were compared in Figure 10. At a consistent ambient temperature, an increase in discharge rate is associated with a proportional increase in temperature rise on the battery surface. The temperature rise curves demonstrate similar trends and magnitudes across various discharge rates, indicating the reliability and precision of the ECM utilized in this research to predict temperature changes in lithium-ion batteries.

3. Simulation Results and Optimization of Air-Cooled BTMS

3.1. Analysis of Simulation Results for Air-Cooled BTMS

Before the simulation process, a fluid–structure coupled heat transfer design was carried out, and the SIMPLE algorithm for solving coupled equations was chosen for the simulation of the lithium-ion battery. The heat generation model was designed using the ECM of the battery module in Fluent 20R2, which was fitted with the polynomial of the internal resistance by HPPC hybrid pulse voltage experimental data. The physical property parameters of the lithium-ion battery were input and set in the Fluent 20R2 software, taking into account the anisotropic thermal conductivity [34]. The radial and axial thermal conductivity coefficients of the battery were set separately, with specific parameters presented in Section 2.2, Table 1. This table encompasses the ICR18650 cylindrical lithium-ion battery and air physical properties.
The reference operating conditions for the battery pack thermal management system were set as follows: ambient temperature of 300 K, incoming air velocity of 2 m/s, and physical parameters of the battery obtained from battery testing experiments. The battery pack was discharged under the 2 C discharge rate, and Figure 11 illustrates the temperature contour map of the J-type BTMS under these reference conditions. It is apparent that during the discharge process, the Tmax of all batteries was 307.97 K, and the temperature of the battery remained within the optimal working temperature range. However, an increase in air temperature from the front side towards the rear side leads to the hottest region near the rear side of the module due to a decrease in the local heat transfer coefficient. The batteries above the inlet of the BTMS had less contact with air, and the temperature was higher compared to the batteries near the outlet on the right side. Therefore, this air cooling system was unable to effectively solve the problem of temperature distribution non-uniformity, and further optimization design was needed.

3.2. Optimization of Air Duct Size for Air-Cooled BTMS

In this section, the sizes of the air ducts in the BTMS were studied under reference operating conditions. Given that the width of the air inlet is directly dependent on the width of the battery pack, the optimization of this section was restricted to the height of the air inlet. Four different heights of the air inlet, including 5 mm, 8 mm, 10 mm, and 12 mm, were designed, and the temperature simulation results were studied as illustrated in Figure 12. The operating conditions were an ambient temperature of 300 K, battery discharge rate of 2 C, and incoming air velocity of 2 m/s. For each case, the temperature changes were closely monitored.
The simulation results of the temperature contour maps for different air duct heights are shown in Figure 12, which indicates that the change in air duct size affects battery pack temperature. The contrast of the Tmax and the minimum temperature (Tmin) in Figure 13 illustrates that as the height of the air duct increases, the Tmax and Tmin generally tend to decrease. The increasing height can promote more air into the flow passage and take away more heat. The increase in the height of the air duct will increase the Reynolds number of the airflow, enhancing the turbulent effect, and thereby improving the efficiency of heat exchange. The Tmax is the lowest when the air duct height is 10 mm, and it rises again as the air duct size gradually increases. While the air duct height of 5 mm provides the best temperature uniformity, the smaller channel size may also result in higher flow resistance, resulting in the highest temperature of the battery pack. If the height of the air duct is too small, the cooling airflow may not be able to diffuse sufficiently, potentially creating a thermal gradient within the battery pack. Taking into account both battery pack temperature and temperature uniformity, the optimized air duct height is 10 mm. Optimizing the air duct size can ensure efficient airflow within the battery pack and enhance heat transfer between the surrounding air and the battery pack.

3.3. Optimization of Battery Spacing for Air-Cooled BTMS

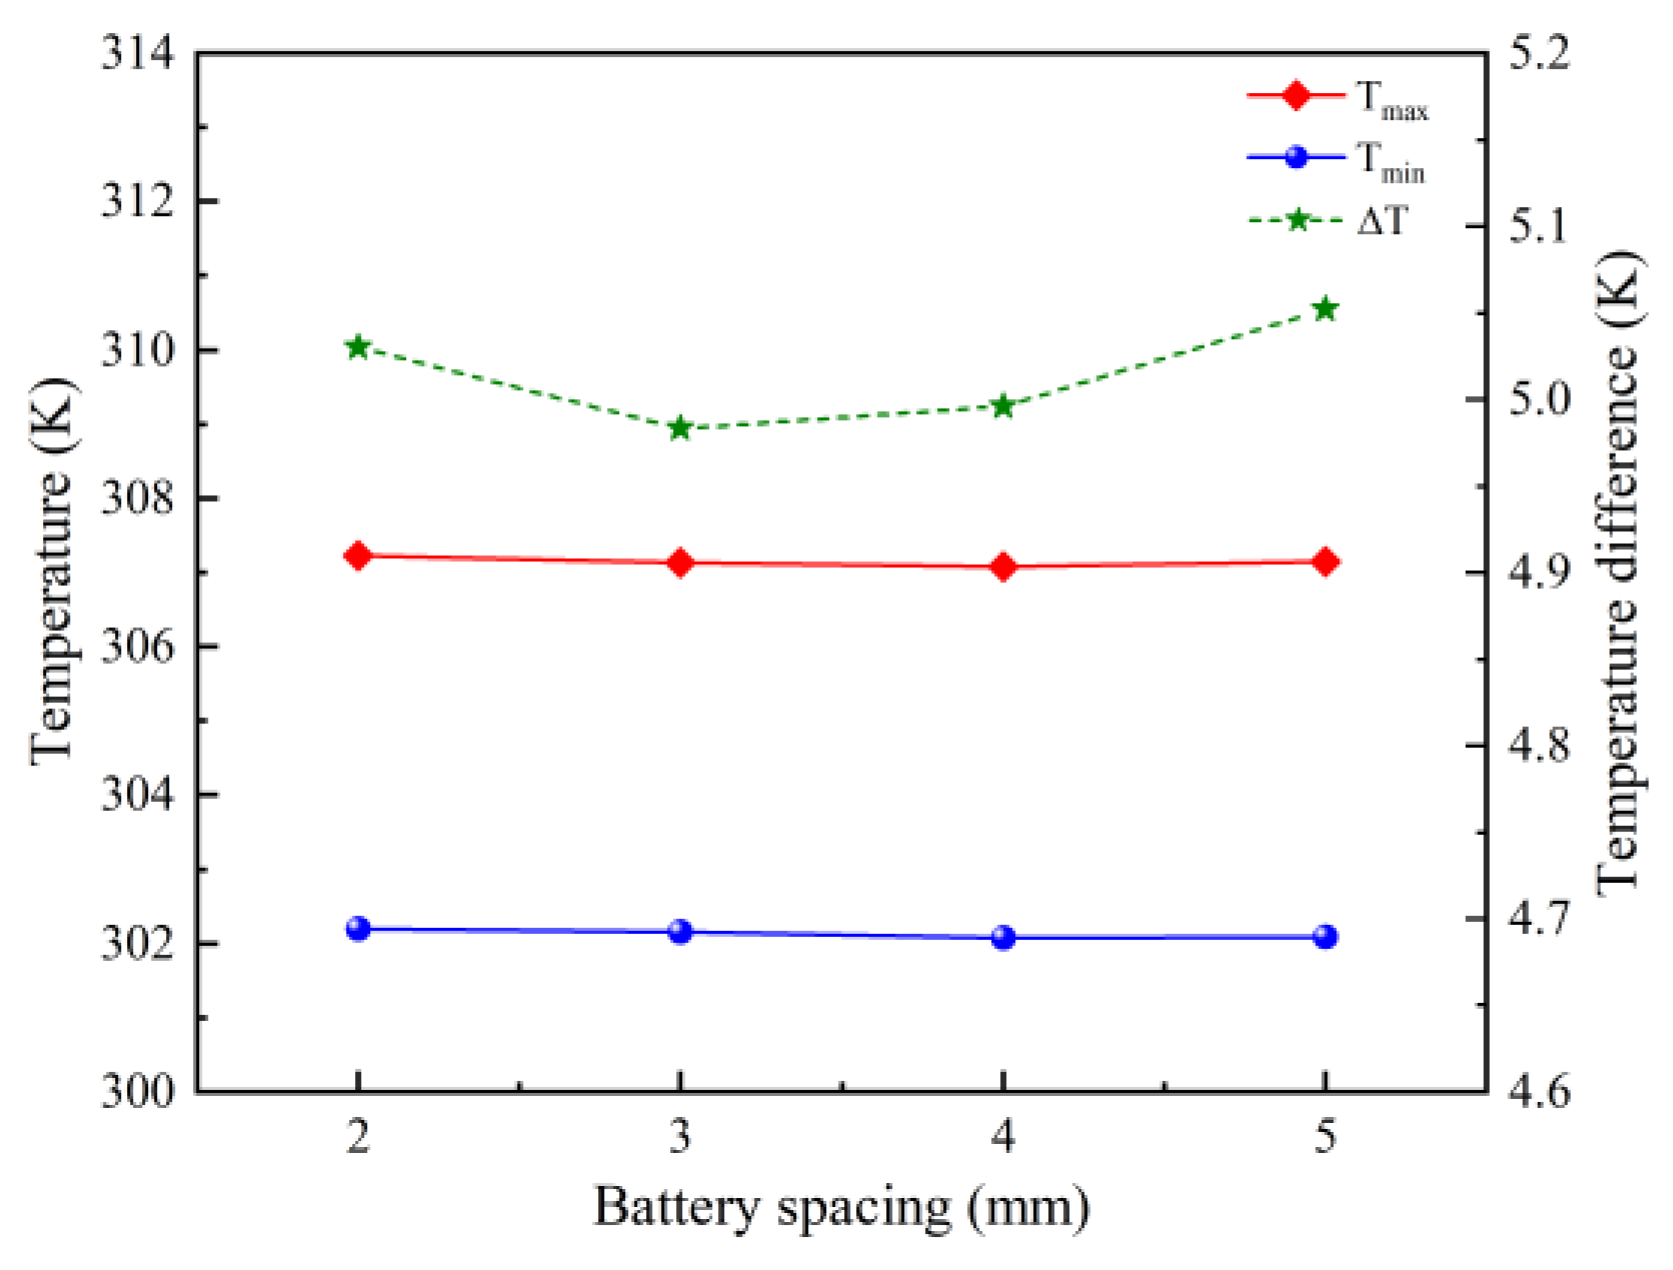
In this section, the influence of battery spacing was considered, with spacings of 2 mm, 3 mm, 4 mm, and 5 mm studied in the thermal management simulation as shown in Figure 14. The operating conditions were an ambient temperature of 300 K, battery discharge rate of 2 C, and incoming air velocity of 2 m/s. The temperature changes were monitored for each case.
As shown in Figure 15, the variation in battery spacing did not cause a significant change in the temperature of the battery pack. The Tmax observed was 307.23 K at a battery spacing of 2 mm. Gradual increases in battery spacing resulted in minor changes to both the Tmax and Tmin. However, when the battery spacing increased from 3 mm to 5 mm, the ∆T of the battery pack continued to increase, from 4.98 K to 5.05 K, which affected the temperature uniformity. The spacing among the batteries determines the cross-sectional area of individual channels, which dominates the distribution of airflow rate in each flow channel, and, finally, the cooling performance of the module. As the battery spacing increases, the airflow rate between the batteries slows down, absorbing heat from the batteries, and the air temperature increases. The Tmin appeared near the outlet of the air duct because the heat is carried out by the air through the right outlet. The temperature uniformity of a battery pack whose battery spacing is too small is worse evidently than that of a battery pack whose battery spacing is large. The reason is that too small battery spacing will affect the development of flow from the laminar boundary layer to the turbulent boundary layer and further deteriorates the heat exchange ability. For this BTMS, the battery spacing of 3 mm is more suitable considering the temperature uniformity.

3.4. Optimization of Battery Arrangement for Air-Cooled BTMS

In this section, the battery pack was arranged in a cross pattern, with parallel arrangement in the X and Y directions and staggered arrangement in the Z direction. The purpose of this arrangement was to optimize heat transfer between the battery and the surrounding air, thereby enhancing overall cooling efficiency. In both the X and Y directions, the battery pack was spaced at 3 mm intervals, and the displacement of the battery cross arrangement was 11 mm, which could move the battery to the middle position of the next row of batteries and increase the disturbance of the battery to the airflow. Since the air duct height was set to 10 mm, the staggered displacement of the battery in the Z direction was set to 5 mm, and the battery was moved up and down to the middle position of the air duct.
The arrangement method affects the speed of air flowing over the battery surface and the intensity of turbulence, both of which are crucial in determining the efficiency of convective heat dissipation. Figure 16 illustrates that the battery pack arranged in a cross arrangement in the Z direction exhibits superior temperature uniformity compared to the cross arrangement in the X and Y directions. As shown in Figure 17, under the operating condition of the 2 C discharge rate and ambient temperature of 300 K, the cross arrangement in the Z direction is optimal for the Tmax, Tmin, and ∆T of the battery pack. Compared with the original BTMS, the Tmax and ∆T in the cross arrangement in the Z direction have decreased by 1.57 K and 0.8 K, respectively. The battery pack’s cross arrangement in the Z direction not only allows for sufficient contact between the air and the battery pack but also changes the flow path of the air, enhancing the local convective heat transfer. In addition, the cross arrangement in the Z direction structure distributed the air more evenly to each cooling channel than the cross arrangement in the X and Y directions and the corresponding airflow directly influenced the cooling effect of the battery.

3.5. Impact of Air Velocity on Air-Cooled BTMS

In the air-cooled BTMS, the system’s heat dissipation is directly influenced by the air velocity. Figure 18 presents the velocity distributions on the cross-section at x = 35 mm, under different inlet air velocities. The velocity distributions reveal that the high-speed airflow allows more heat to be transferred via convective heat transfer, leading to low-temperature rise. The high airflow velocity increases the convective heat transfer coefficient between air and batteries. Apparently, the temperature distribution of batteries in BTMS is largely determined by the hydrodynamic and heat transfer characteristics of the airflow. When air enters and passes through different batteries, local vortices appear at the junction of their windward sides, increasing the level of turbulence in the channel. Higher air velocity can improve the efficiency of air heat dissipation, but excessively high air velocity can cause uneven airflow inside the battery pack, thereby affecting the heat dissipation effect and increasing the power loss of BTMS. Therefore, it is necessary to determine the most suitable air velocity range for the air cooling system. Under the benchmark conditions, the effects of different air velocities on the battery pack temperature and air power loss were studied for the optimized BTMS.
The cooling power of the air-cooled BTMS can be quantified through the calculation of total pressure differentials at both the inlet and outlet. The air cooling power is calculated using the following formula:
m = ρ × A × V
Δ P = P 1 P 2 + P 3 / 2
G = m × Δ P
In the formula, m is the mass flow rate of the air, A is the cross-sectional area through which the airflows, V is the velocity of the fluid, ρ is the density of the air, ∆P is the pressure drop of the air in the system, P1 is the inlet pressure, P2 and P3 are the pressures at the left and right air outlets, and G is the cooling power of the airflow, respectively.
Under the benchmark conditions, assuming that the air is in an ideal gas state, and the cross-sectional area A of the air inlet and outlet for the air cooling system is 0.7 m2. Table 4 presents the specific data for the calculation.
Figure 19a shows the effect of different air velocities on the Tmax, Tmin, Tav, and ∆T of the battery pack. Increasing the air velocity effectively improves the heat dissipation of BTMS. To achieve optimal cooling performance and temperature uniformity in the battery pack, increasing the air velocity within the range of 1 m/s to 5 m/s is recommended. This has been demonstrated to enhance cooling efficiency. However, the graph shows that the slope of the temperature change gradually decreases, indicating that increasing the air velocity proportionally does not result in a proportional increase in the cooling effect. Figure 19b compares the change of temperature and cooling power by calculating the mass flow rate of the air cooling system, the average pressure drop, and the cooling power of the air cooling system. The graph shows that the increase in cooling power is not proportional to the decrease in battery pack temperature. Increasing air velocity from 1 m/s to 2 m/s results in a 4.589 W improvement in cooling power and a 5.451 K reduction in the Tmax. When the air velocity is raised from 3 m/s to 4 m/s, the cooling power increases by 12.844 W and the Tmax decreases by 0.855 K. In conclusion, while increasing the air velocity can effectively optimize the cooling effect and the temperature uniformity, excessively high air velocity can significantly increase cooling power and lead to poor economic benefits. Taking all factors into consideration, the air velocity of approximately 3 m/s is the optimal setting for the BTMS.

4. Conclusions

This study constructed a lithium-ion battery thermal characteristic testing platform using experimental research methods and conducted voltage testing, internal resistance testing, and temperature rise experiments on lithium-ion batteries. An electro-thermal coupled model was conducted to optimize the flow channel structure in the J-type air-cooled BTMS. The main conclusions of this study are as follows:
(1) The internal resistance of the lithium-ion battery under different operating conditions was computed by fitting and calculating the pulse voltage data of the battery obtained through HPPC hybrid pulse power characterization tests. Within the temperature range of 283 K–313 K, both the ohmic resistance and polarization resistance exhibit a gradual decrease with increasing temperature. At lower ambient temperatures, the polarization resistance is larger at both low and high states of charge.
(2) At a consistent ambient temperature, an increase in discharge rate is related to a proportional increase in temperature rise on the battery surface, signifying a corresponding rise in heat generation with an increase in discharge rate. Through the comparison between the temperature simulation and experiment of the lithium-ion battery, the effectiveness and accuracy of the electro-thermal coupled model selected in this study were verified.
(3) A J-type air-cooled BTMS comprising 24 lithium-ion batteries was designed. After optimizing the air cooling system in terms of duct size, battery spacing, and battery arrangement, it was found that the J-type air-cooled BTMS with a duct height of 10 mm, a battery spacing of 3 mm, and a cross arrangement in the Z direction can reduce the Tmax and ∆T by 1.57 K and 0.80 K, respectively. The investigation of the optimized air cooling system at various air velocities revealed that the most economically efficient energy consumption air velocity was around 3 m/s, while ensuring that the Tmax of the battery pack was within an acceptable range and the temperature uniformity was maintained.

Author Contributions

Methodology, H.F.; software, H.F. and P.W.; validation, L.W.; formal analysis, H.F. and B.L.; resources, L.W. and W.C.; data curation, H.F. and W.C.; writing—original draft preparation, H.F. and P.W.; writing—review and editing, B.L., L.W. and W.C.; visualization, H.F. and L.W.; supervision, L.W. and W.C. All authors have read and agreed to the published version of the manuscript.

Funding

This research was funded by Hebei Province, China to introduce returnee, grant number C20210308.

Data Availability Statement

Not applicable.

Conflicts of Interest

The authors declare no conflict of interest.

References

  1. Tiwari, N.; Verma, P.; Kumar, S.; Kumar, S.; Dutt, H.; Ahmad, S.; Chauhan, S.S. Converting gasoline vehicle into an electric vehicle (EV)—A review. Mater. Today Proc. 2023, 79, 379–388. [Google Scholar] [CrossRef]
  2. Zhou, Z.Y.; Liu, Y.G.; You, M.X. Two-stage aging trajectory prediction of LFP lithium-ion battery based on transfer learning with the cycle life prediction. Green Energy Intell. Transp. 2022, 1, 100008. [Google Scholar] [CrossRef]
  3. Li, W.Z.; Zhou, Y.H.; Zhang, H.N.; Tang, X. A Review on Battery Thermal Management for New Energy Vehicles. Energies 2023, 16, 4845. [Google Scholar] [CrossRef]
  4. Tan, X.; Lyu, P.; Fan, Y.; Rao, J.; Ouyang, K. Numerical investigation of the direct liquid cooling of a fast-charging lithium-ion battery pack in hydrofluoroether. Appl. Therm. Eng. 2021, 196, 117279. [Google Scholar] [CrossRef]
  5. Fang, Q.H.; Wei, X.Z.; Lu, T.Y.; Dai, H.F.; Zhu, J.G. A State of Health Estimation Method for Lithium-Ion Batteries Based on Voltage Relaxation Model. Energies 2019, 12, 1349. [Google Scholar] [CrossRef]
  6. Sikarwar, S.; Kumar, R.; Yadav, A.; Gwalwanshi, M. Battery thermal management system for the cooling of Li-Ion batteries, used in electric vehicles. Mater. Today Proc. 2023; in press. [Google Scholar] [CrossRef]
  7. Li, D.; Yang, L.; Li, C. Control-oriented thermal-electrochemical modeling and validation of large size prismatic lithium battery for commercial applications. Energy 2021, 214, 119057. [Google Scholar] [CrossRef]
  8. Perez Estevez, M.A.; Calligaro, S.; Bottesi, O.; Caligiuri, C.; Renzi, M. An electro-thermal model and its electrical parameters estimation procedure in a lithium-ion battery cell. Energy 2021, 234, 121296. [Google Scholar] [CrossRef]
  9. Kumaresan, K.; Sikha, G.; White, R.E. Thermal Model for a Li-Ion Cell. J. Electrochem. Soc. 2008, 155, A164–A171. [Google Scholar] [CrossRef]
  10. Mastali, M.; Foreman, E.; Modjtahedi, A.; Samadani, E.; Amirfazli, A.; Farhad, S.; Fraser, R.A. Electrochemical-thermal modeling and experimental validation of commercial graphite/LiFePO4 pouch lithium-ion batteries. Int. J. Therm. Sci. 2018, 129, 218–230. [Google Scholar] [CrossRef]
  11. Li, H.H.; Saini, A.; Liu, C.Y.; Yang, J.F.; Wang, Y.P.; Yang, T.; Pan, C.F.; Chen, L.; Jiang, H.B. Electrochemical and thermal characteristics of prismatic lithium-ion battery based on a three-dimensional electrochemical-thermal coupled model. J. Energy Storage 2021, 42, 102976. [Google Scholar] [CrossRef]
  12. Zhang, H.Y.; Li, C.S.; Zhang, R.J.; Lin, Y.X.; Fang, H.S. Thermal analysis of a 6s4p Lithium-ion battery pack cooled by cold plates based on a multi-domain modeling framework. Appl. Therm. Eng. 2020, 173, 115216. [Google Scholar] [CrossRef]
  13. Huang, W.N.; Zhang, W.G.; Chen, A.; Zhang, Y.R.; Li, M. A Co-Simulation Method Based on Coupled Thermoelectric Model for Electrical and Thermal Behavior of the Lithium-ion Battery. IEEE Access 2019, 7, 180727–180737. [Google Scholar] [CrossRef]
  14. Chen, L.G.; Hu, M.H.; Cao, K.B.; Li, S.X.; Su, Z.; Jin, G.Q.; Fu, C.Y. Core temperature estimation based on electro-thermal model of lithium-ion batteries. Int. J. Energy Res. 2020, 44, 5320–5333. [Google Scholar] [CrossRef]
  15. Chen, W.; Hou, S.B.; Shi, J.L.; Han, P.; Liu, B.; Wu, B.P.; Lin, X.X. Numerical Analysis of Novel Air-Based Li-Ion Battery Thermal Management. Batteries 2022, 8, 128. [Google Scholar] [CrossRef]
  16. Falcone, M.; Palka, B.D.; Hellany, A.; Rossi, C.; Pulvirenti, B. Lithium-Ion Battery Thermal Management Systems: A Survey and New CFD Results. Batteries 2021, 7, 86. [Google Scholar] [CrossRef]
  17. Wang, Y.S.; Liu, B.; Han, P.; Hao, C.S.; Li, S.H.; You, Z.P.; Wang, M.Q. Optimization of an air-based thermal management system for lithium-ion battery packs. J. Energy Storage 2021, 44, 103314. [Google Scholar] [CrossRef]
  18. Habib, A.K.; Hasan, M.K.; Issa, G.F.; Singh, D.; Islam, S.; Ghazal, T. Lithium-Ion Battery Management System for Electric Vehicles: Constraints, Challenges, and Recommendations. Batteries 2023, 9, 152. [Google Scholar] [CrossRef]
  19. Mahek, M.K.; Alkhedher, M.; Ghazal, M.; Abdelkareem, M.A. Effects of control volume outlet variation on axial air cooling of lithium-ion batteries. Int. J. Thermofluids 2023, 19, 100373. [Google Scholar] [CrossRef]
  20. Kirad, K.; Chaudhari, M. Design of cell spacing in lithium-ion battery module for improvement in cooling performance of the battery thermal management system. J. Power Sources 2021, 481, 229016. [Google Scholar] [CrossRef]
  21. Park, H. A design of air flow configuration for cooling lithium ion battery in hybrid electric vehicles. J. Power Sources 2013, 239, 30–36. [Google Scholar] [CrossRef]
  22. Xie, J.H.; Ge, Z.J.; Zang, M.Y.; Wang, S.F. Structural optimization of lithium-ion battery pack with forced air cooling system. Appl. Therm. Eng. 2017, 126, 583–593. [Google Scholar] [CrossRef]
  23. Hai, T.; Abidi, A.; Abed, A.M.; Zhou, J.C.; Malekshah, E.H.; Aybar, H. Three-dimensional numerical study of the effect of an air-cooled system on thermal management of a cylindrical lithium-ion battery pack with two different arrangements of battery cells. J. Power Sources 2022, 550, 232117. [Google Scholar] [CrossRef]
  24. Liu, Y.; Zhang, J. Design a J-type air-based battery thermal management system through surrogate-based optimization. Appl. Energy 2019, 252, 113426. [Google Scholar] [CrossRef]
  25. Jeon, D.H.; Baek, S.M. Thermal modeling of cylindrical lithium ion battery during discharge cycle. Energy Convers. Manag. 2011, 52, 2973–2981. [Google Scholar] [CrossRef]
  26. Chen, K.; Wu, W.X.; Yuan, F.; Chen, L.; Wang, S.F. Cooling efficiency improvement of air-cooled battery thermal management system through designing the flow pattern. Energy 2019, 167, 781–790. [Google Scholar] [CrossRef]
  27. Kiša, M.; Jelemenský, Ľ. CFD dispersion modelling for emergency preparadnes. J. Loss Prev. Process Ind. 2009, 22, 97–104. [Google Scholar] [CrossRef]
  28. Xing, J.; Liu, Z.Y.; Huang, P.; Feng, C.G.; Zhou, Y.; Zhang, D.P.; Wang, F. Experimental and numerical study of the dispersion of carbon dioxide plume. J. Hazard. Mater. 2013, 256–257, 40–48. [Google Scholar] [CrossRef]
  29. Zhang, F.R.; Lin, A.Z.; Wang, P.W.; Liu, P.W. Optimization design of a parallel air-cooled battery thermal management system with spoilers. Appl. Therm. Eng. 2021, 182, 116062. [Google Scholar] [CrossRef]
  30. Liu, Y.; Zhang, J. Self-adapting J-type air-based battery thermal management system via model predictive control. Appl. Energy 2020, 263, 114640. [Google Scholar] [CrossRef]
  31. Behi, H.; Karimi, D.; Behi, M.; Ghanbarpour, M.; Jaguemont, J.; Sokkeh, M.A.; Gandoman, F.H.; Berecibar, M.; Van Mierlo, J. A new concept of thermal management system in Li-ion battery using air cooling and heat pipe for electric vehicles. Appl. Therm. Eng. 2020, 174, 115280. [Google Scholar] [CrossRef]
  32. Chen, M.; Rincon-Mora, G.A. Accurate electrical battery model capable of predicting runtime and I-V performance. IEEE Trans. Energy Convers. 2006, 21, 504–511. [Google Scholar] [CrossRef]
  33. Wang, T.T.; Liu, X.; Qin, D.C.; Duan, Y.C. Thermal Modeling and Prediction of The Lithium-ion Battery Based on Driving Behavior. Energies 2022, 15, 9088. [Google Scholar] [CrossRef]
  34. Spinner, N.S.; Hinnant, K.M.; Mazurick, R.; Brandon, A.; Rose-Pehrsson, S.; Tuttle, S. Novel 18650 lithium-ion battery surrogate cell design with anisotropic thermophysical properties for studying failure events. J. Power Sources 2016, 312, 1–11. [Google Scholar] [CrossRef]
Figure 1. Geometric model of J-type BTMS: (a) 3-D model; (b) Three-view diagram.
Energies 16 05962 g001
Figure 2. Experimental setup for battery testing.
Energies 16 05962 g002
Figure 3. Circuit diagram of second-order RC equivalent circuit model (ECM).
Energies 16 05962 g003
Figure 4. Variations in charge and discharge capacity under the different charge and discharge rates and the ambient temperature: (a) charge capacity; (b) discharge capacity.
Energies 16 05962 g004
Figure 5. Variations in charge and discharge efficiency under the different charge and discharge rates and the ambient temperature: (a) charge efficiency; (b) discharge efficiency.
Energies 16 05962 g005
Figure 6. Pulse discharge voltage step-change curves under (a) the charge–discharge rate of 0.5 C and environmental temperatures of 283 K and 313 K; (b) the discharge rates of 1 C and 2 C and environmental temperature of 293 K.
Energies 16 05962 g006
Figure 7. Variations in ohmic resistance Rs and polarization resistance R1 + R2 with cell SOC under the different charge–discharge rates and the ambient temperature of (a) 283 K, (b) 293 K, (c) 303 K, (d) 313 K.
Energies 16 05962 g007
Figure 8. Grid number independence test.
Energies 16 05962 g008
Figure 9. The grid generated on the present geometry: (a) overall grid structure; (b) refined grid at the interface of air and the battery.
Energies 16 05962 g009
Figure 10. Comparison of experiment and simulation results for different discharge rates under the ambient temperature of (a) 283 K, (b) 293 K, (c) 303 K, (d) 313 K.
Energies 16 05962 g010
Figure 11. Temperature distribution of the battery pack under the reference operating conditions.
Energies 16 05962 g011
Figure 12. Temperature distribution of the battery pack under different air duct heights: (a) 5 mm, (b) 8 mm, (c) 10 mm, (d) 12 mm.
Energies 16 05962 g012aEnergies 16 05962 g012b
Figure 13. Temperature variation of the battery pack under different air duct heights.
Energies 16 05962 g013
Figure 14. Temperature distribution of the battery pack under battery spacing: (a) 2 mm, (b) 3 mm, (c) 4 mm, (d) 5 mm.
Energies 16 05962 g014
Figure 15. Temperature variation of the battery pack under different battery spacing.
Energies 16 05962 g015
Figure 16. Temperature distribution of the battery pack under different cross-arrangement methods: (a) X direction, (b) Y direction, (c) Z direction.
Energies 16 05962 g016aEnergies 16 05962 g016b
Figure 17. Temperature variation under different arrangement methods.
Energies 16 05962 g017
Figure 18. Velocity distribution of different inlet velocities: (a) 1 m/s, (b) 2 m/s, (c) 3 m/s, (d) 4 m/s, (e) 5 m/s.
Energies 16 05962 g018
Figure 19. (a) Temperature and temperature difference; (b) change of temperature and cooling power variations under different air velocities.
Energies 16 05962 g019
Table 1. The properties parameters of air and ICR18650 cylindrical Lithium-ion cell.
Density   ρ
(kg/m3)
Specific Heat
Capacity Cp
(J/kg/K)
Thermal Conductivity k
(W/m/K)
Viscosity   Coefficient   μ
(kg/m/s)
Air1.2251006.430.0242 1.7894 × 10 5
Cathode1347.31437.41.04
Anode2328.51269.21.58
Cell27221200Radial thermal conductivity:
kx = 1.27
Axial thermal conductivity:
kz = 27.58
Table 2. Boundary condition settings.
RegionInletOutletTop, Side and BottomInterfaces
between
Batteries
and Fluid
Initial
Temperature
Ambient
Temperature
Boundary
conditions
Velocity
inlet (1–5 m/s)
Pressure
Outlet (1.013 × 10⁵ Pa)
Adiabatic non-slip wallsCoupled
walls
300 K300 K
Table 3. ICR18650 cylindrical cell specifications.
SpecificationsValue
Battery brandSamsung ICR18650
Battery sizeDiameter of 18.06 mm, height of 65.02 mm
Charge cut-off voltage
Discharge cut-off voltage
4.3 V
2.6 V
Nominal voltage3.7 V
Nominal capacity2 600 mAh
Battery temperatureCharge (283–318 K); discharge (253–333 K)
Anode materialLithium cobaltate
Cathode materialGraphite
Table 4. Calculation results of cooling power under different air velocities.
Air Velocity (m/s)12345
Mass flow rate (kg/s)0.8191.6382.4573.2764.095
Inlet and outlet pressure difference (Pa)0.94142.38854.19436.39479.0499
Cooling power (W)1.71246.300914.499627.343946.1092
Disclaimer/Publisher’s Note: The statements, opinions and data contained in all publications are solely those of the individual author(s) and contributor(s) and not of MDPI and/or the editor(s). MDPI and/or the editor(s) disclaim responsibility for any injury to people or property resulting from any ideas, methods, instructions or products referred to in the content.