
Modelling of the Standalone Onshore Charging Station: The Nexus between Offshore Renewables and All-Electric Ships


Abstract
:1. Introduction
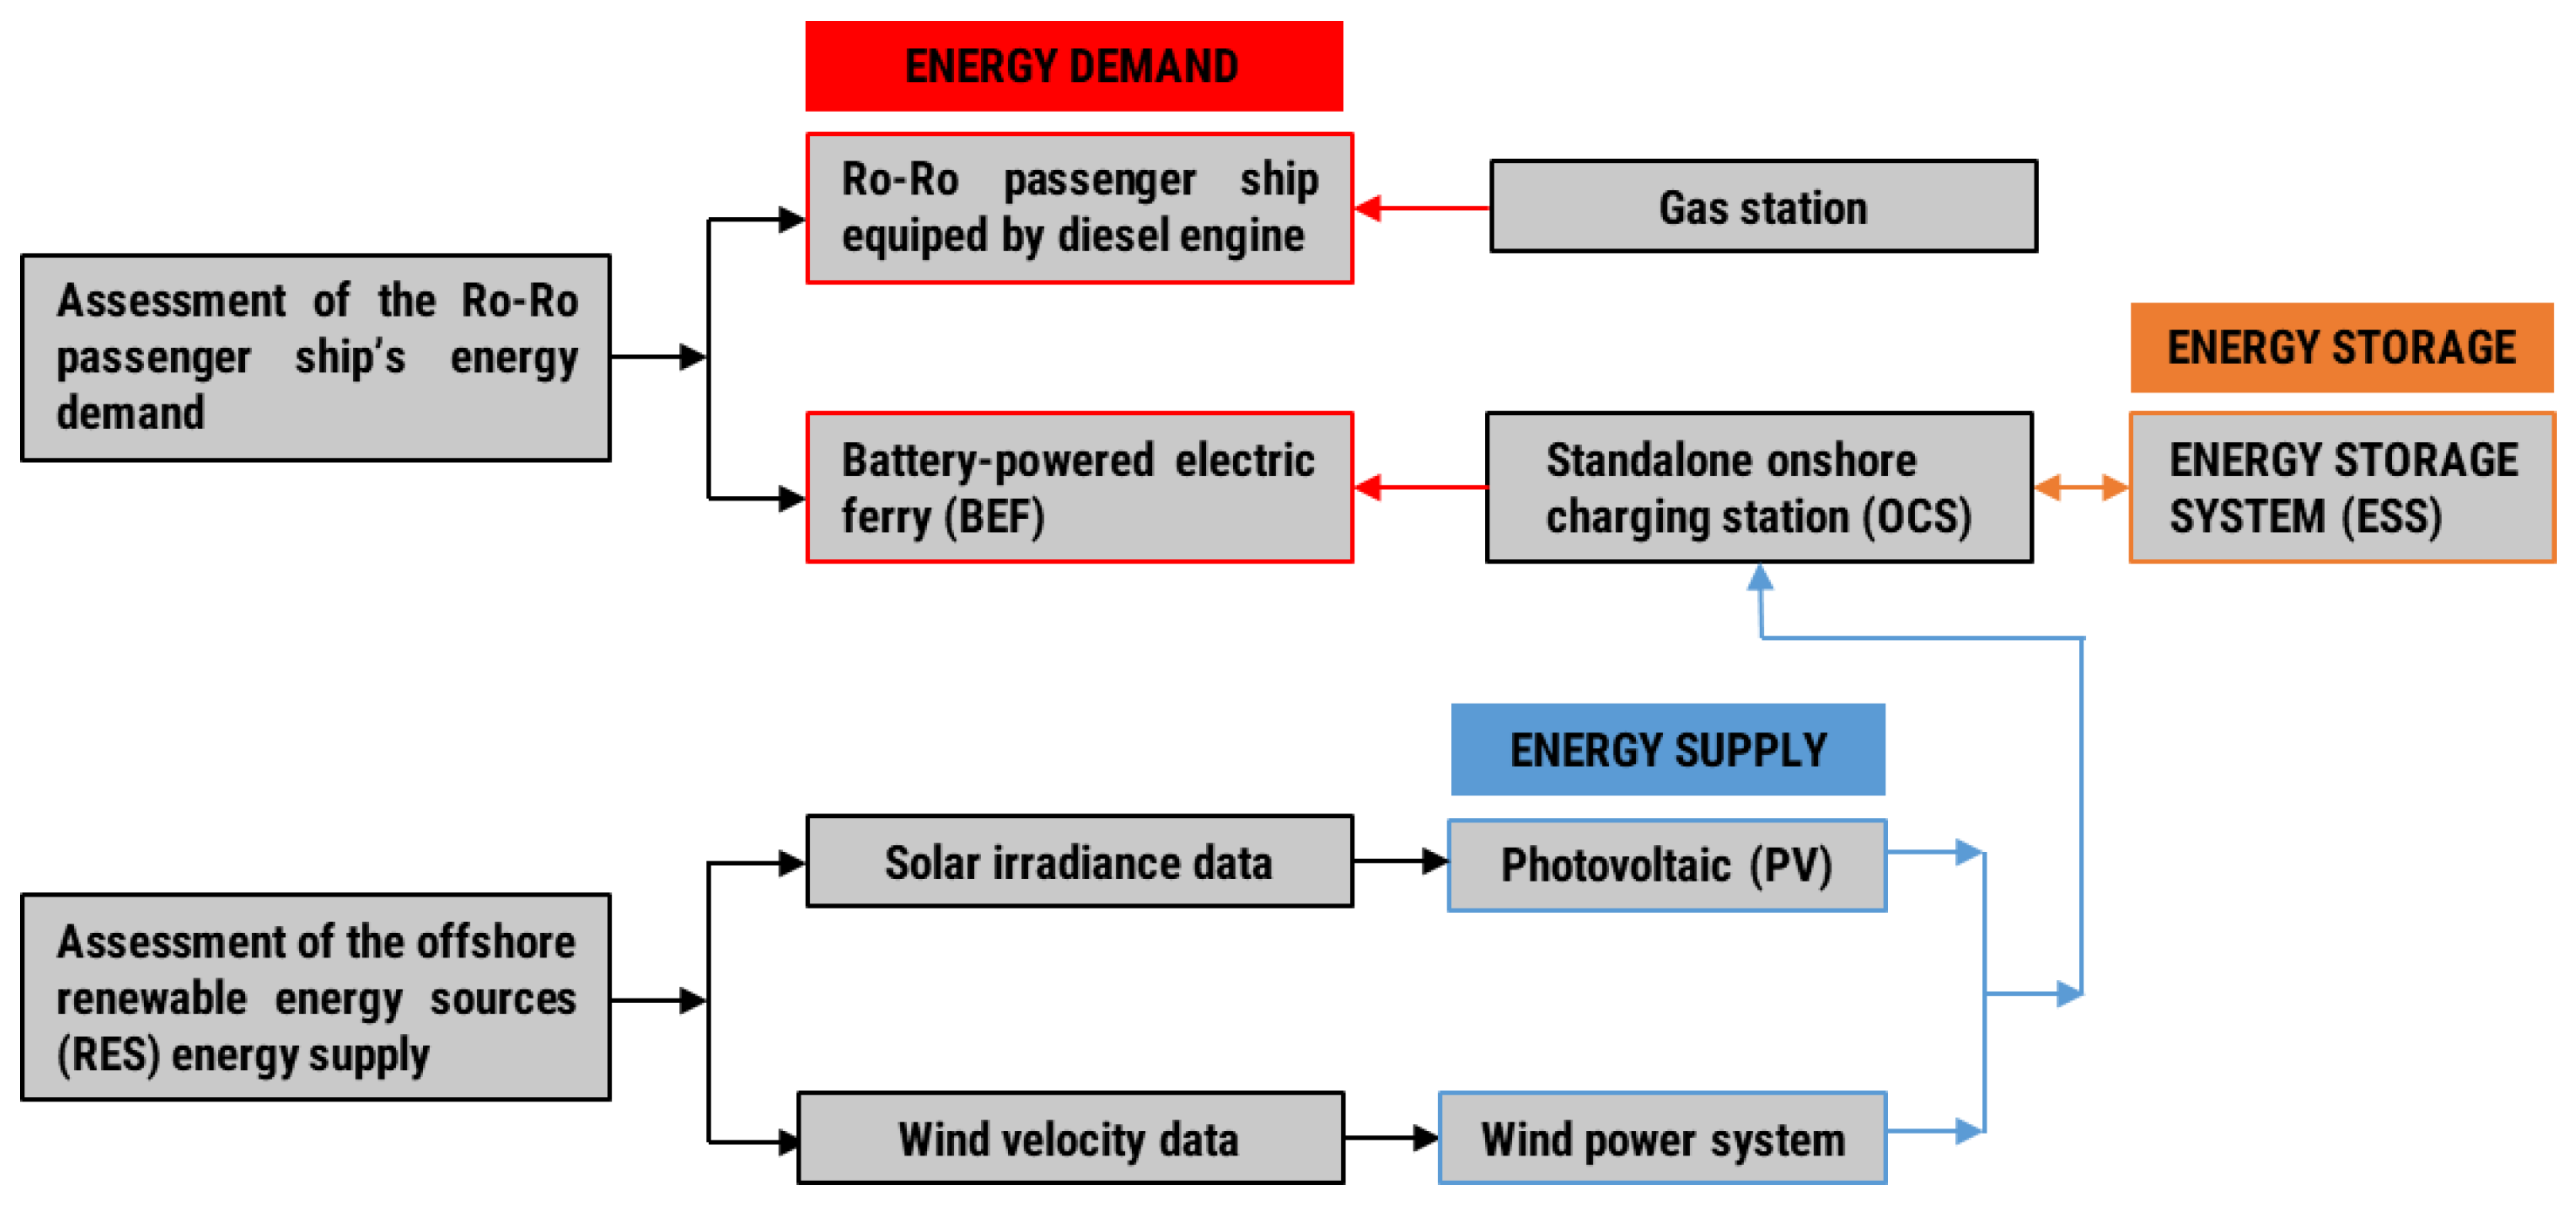
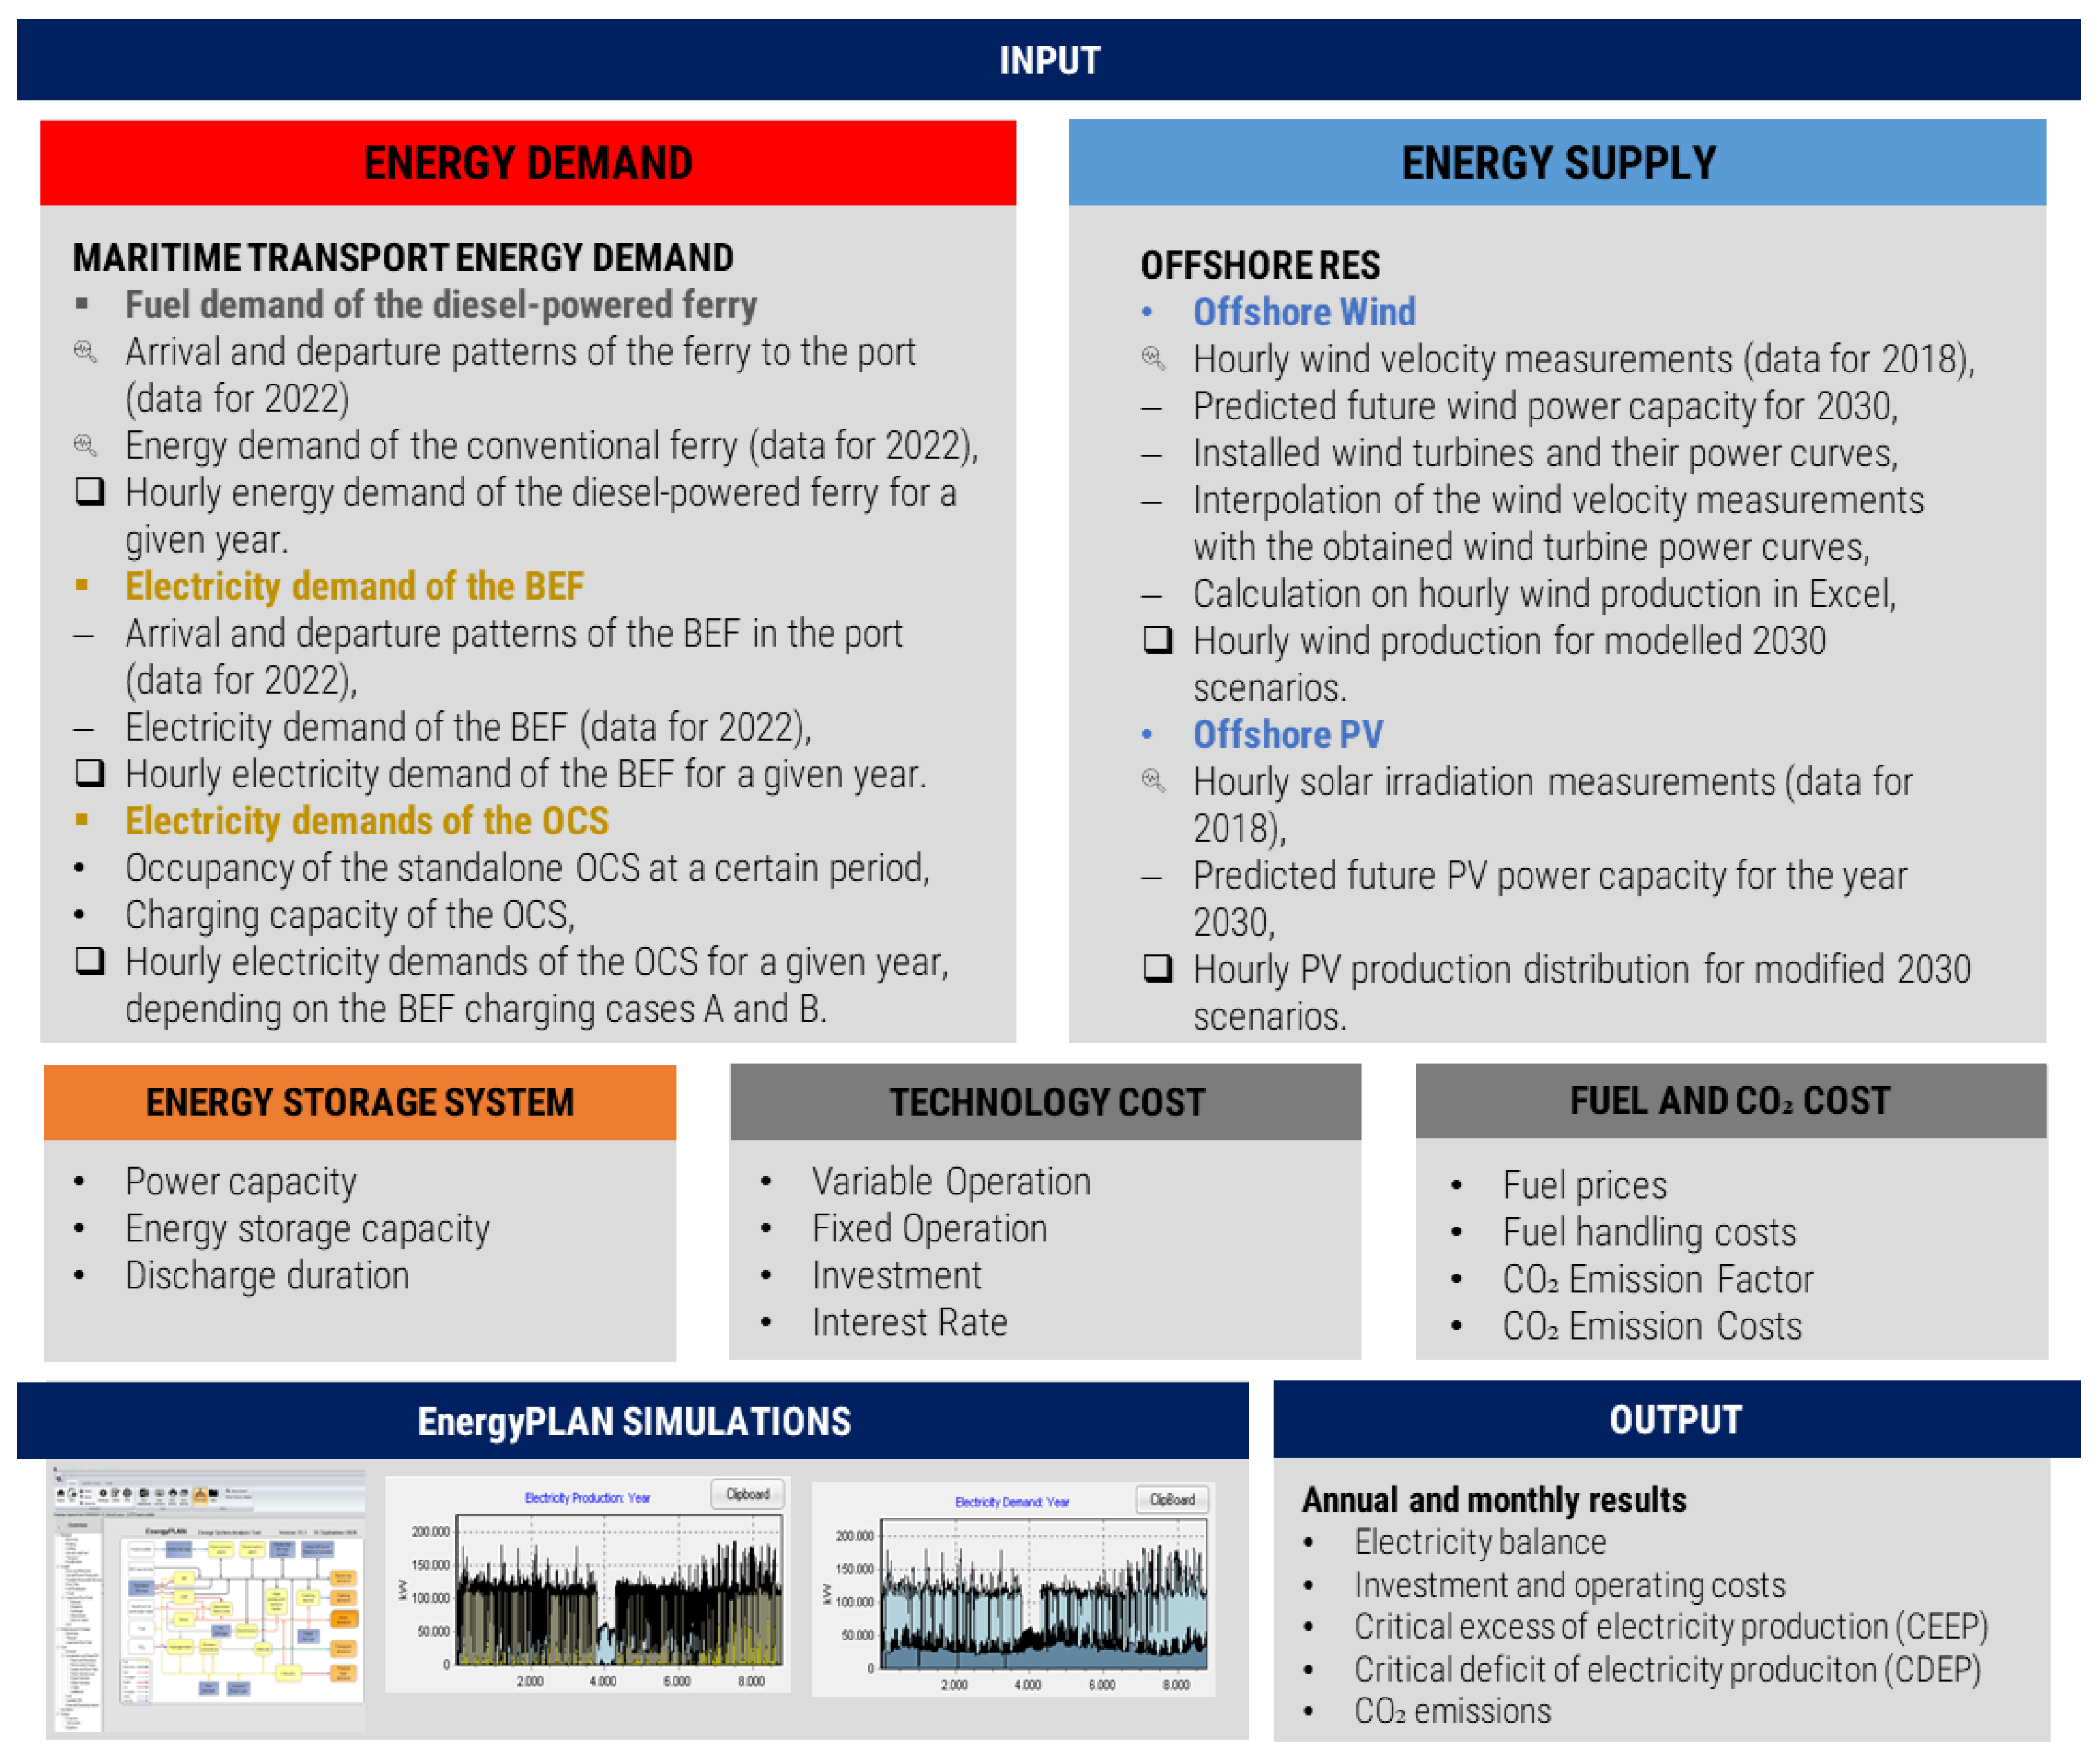
2. Materials and Methods
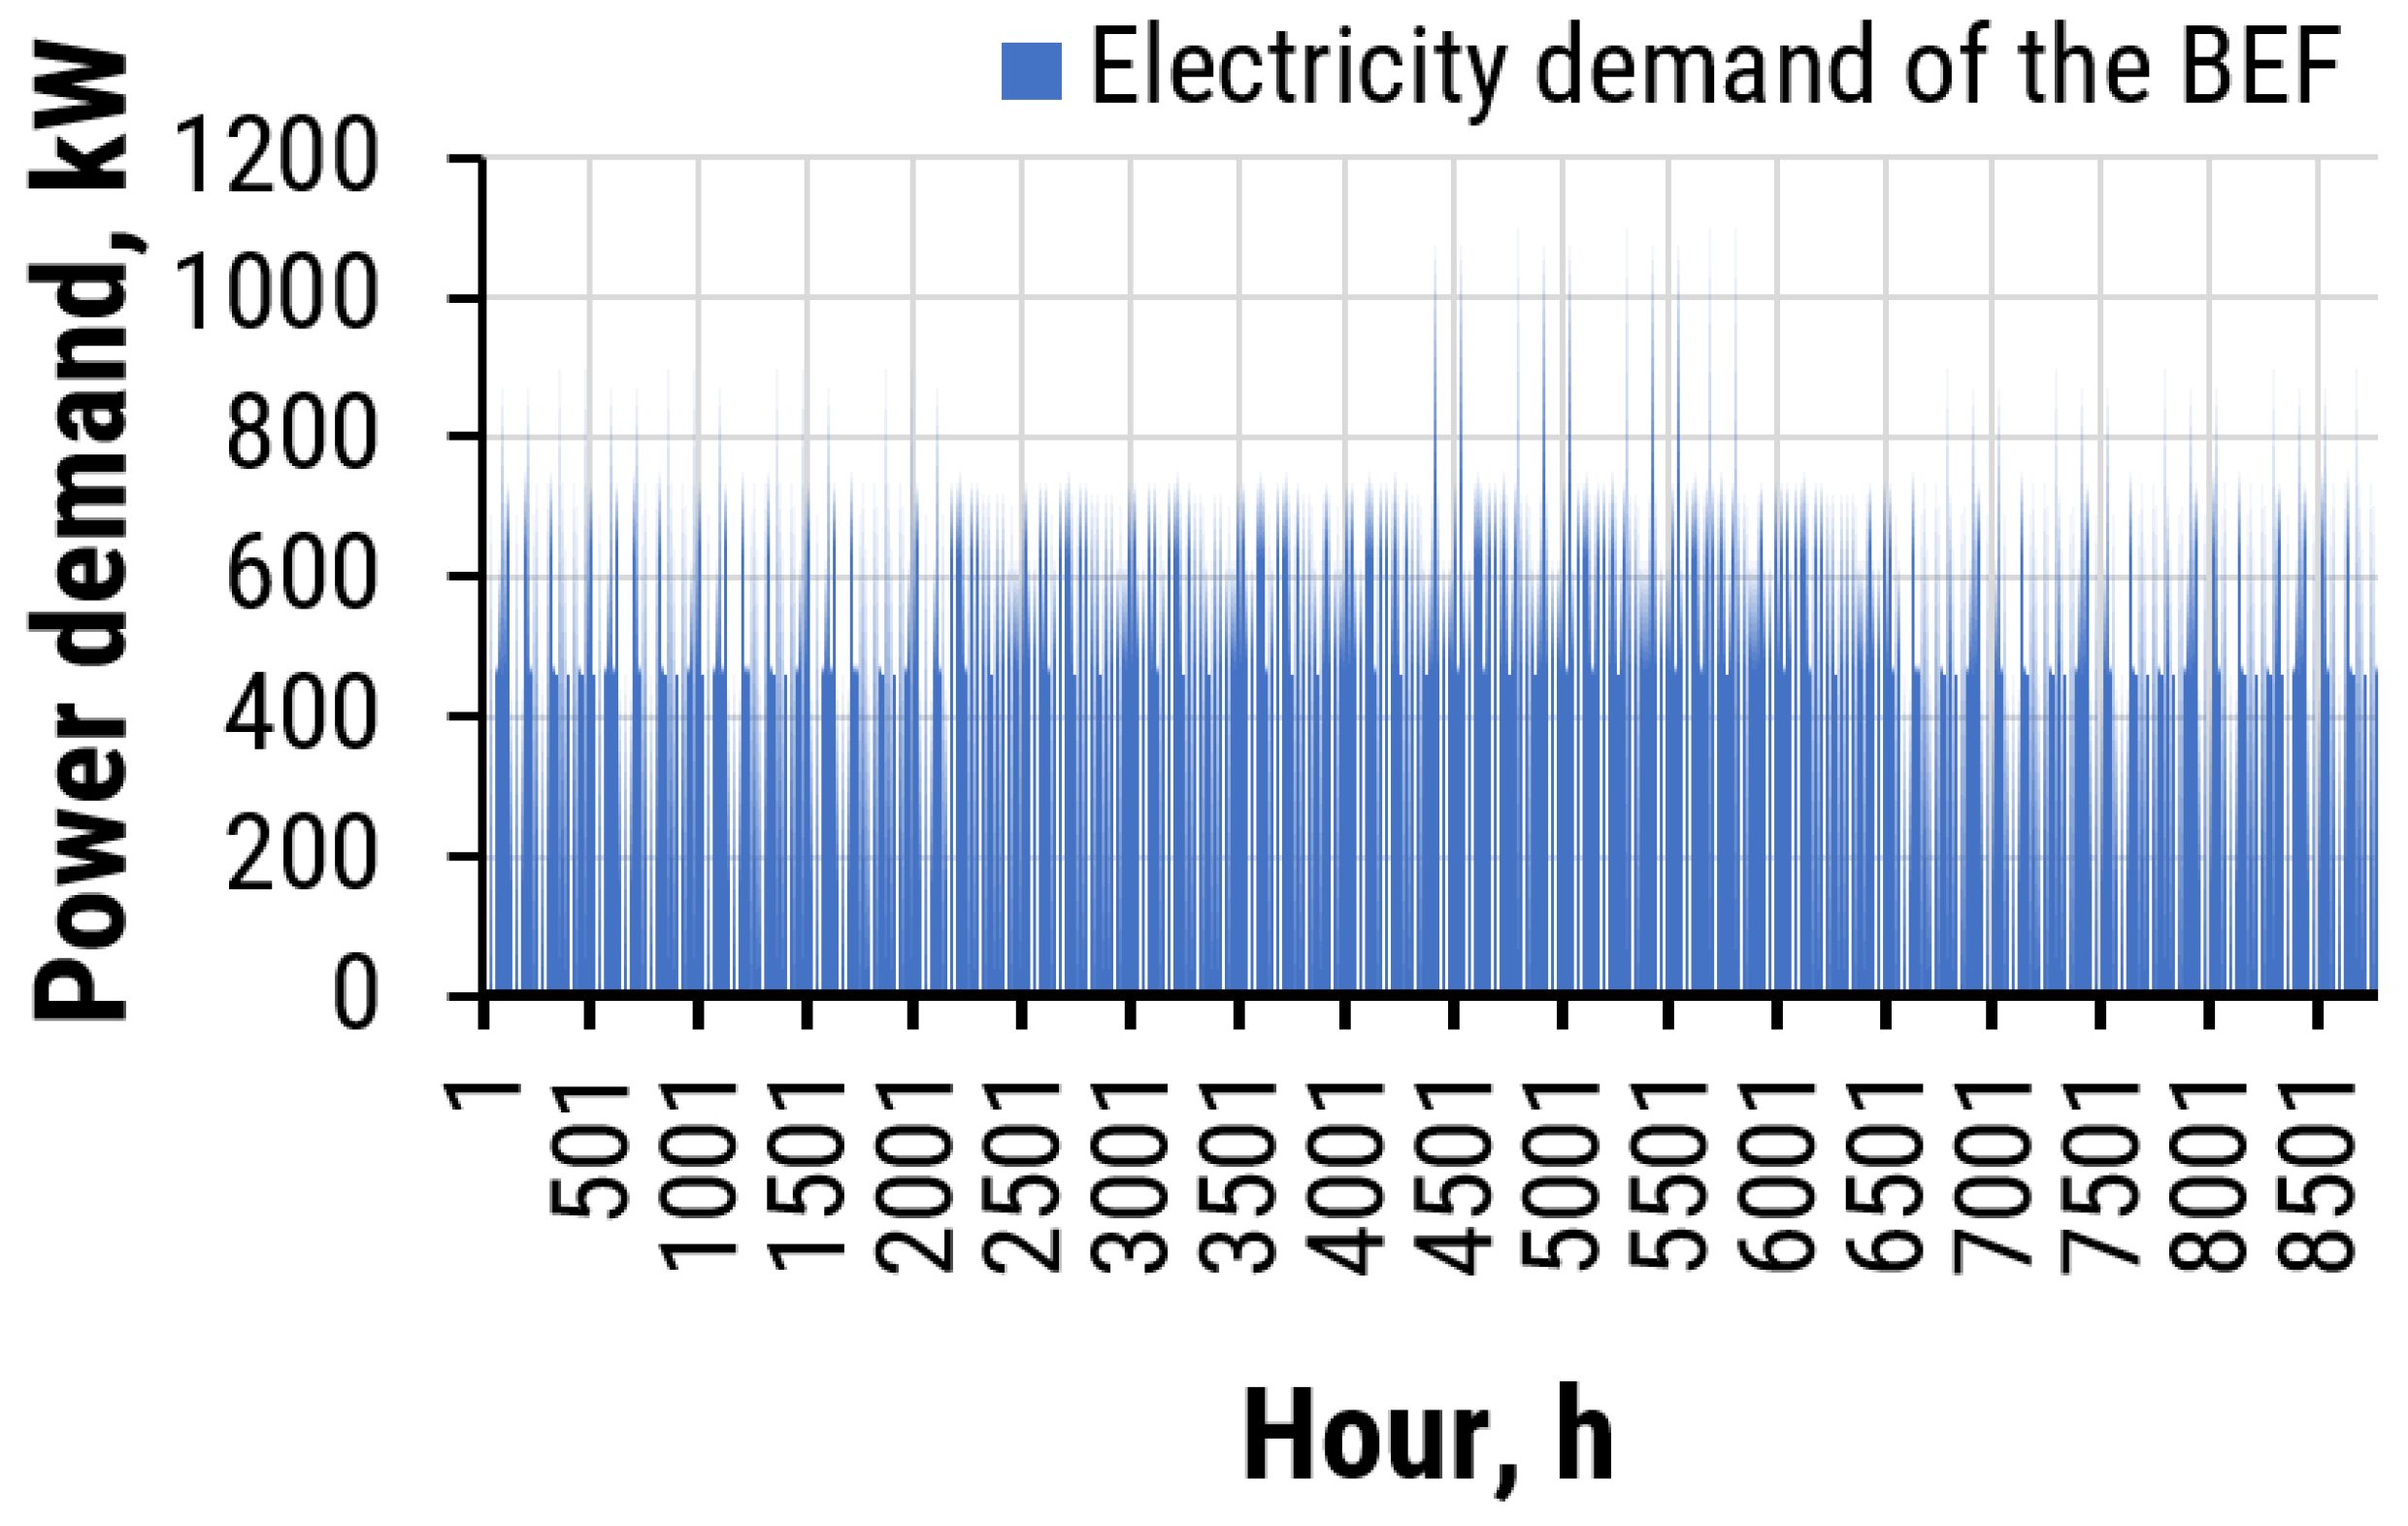
2.1. Assessment of the Ro-Ro Passenger Ship’s Demand
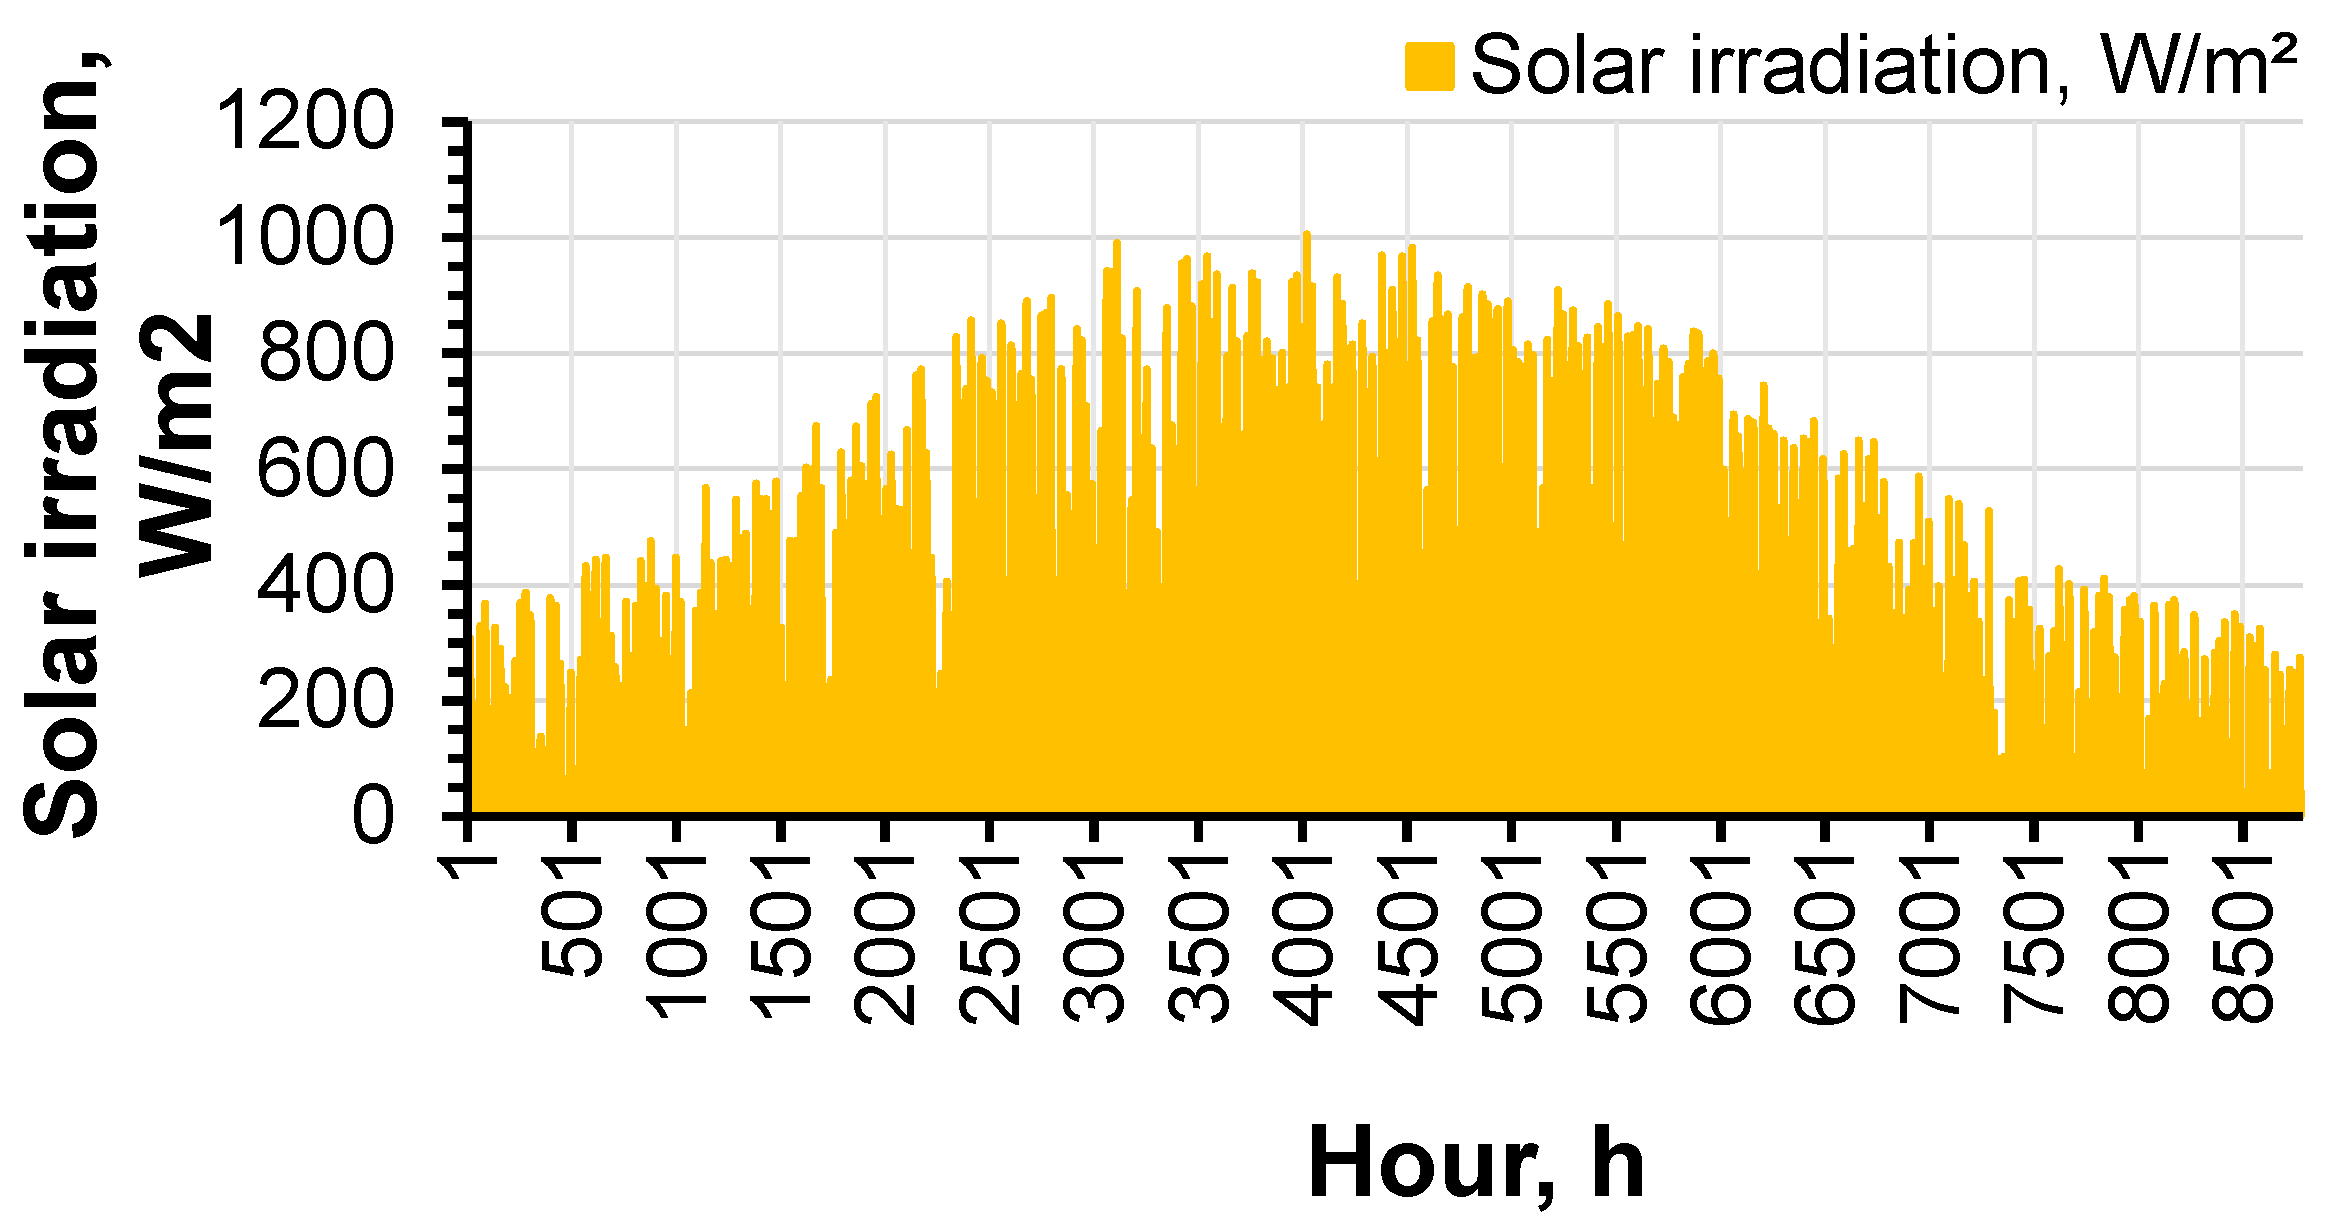
2.2. Assessment of the Offshore RES Power Supply
2.3. Economic Assessment of the Ship’s Power System and Offshore RES
3. Case Study
4. Results and Discussion
5. Conclusions
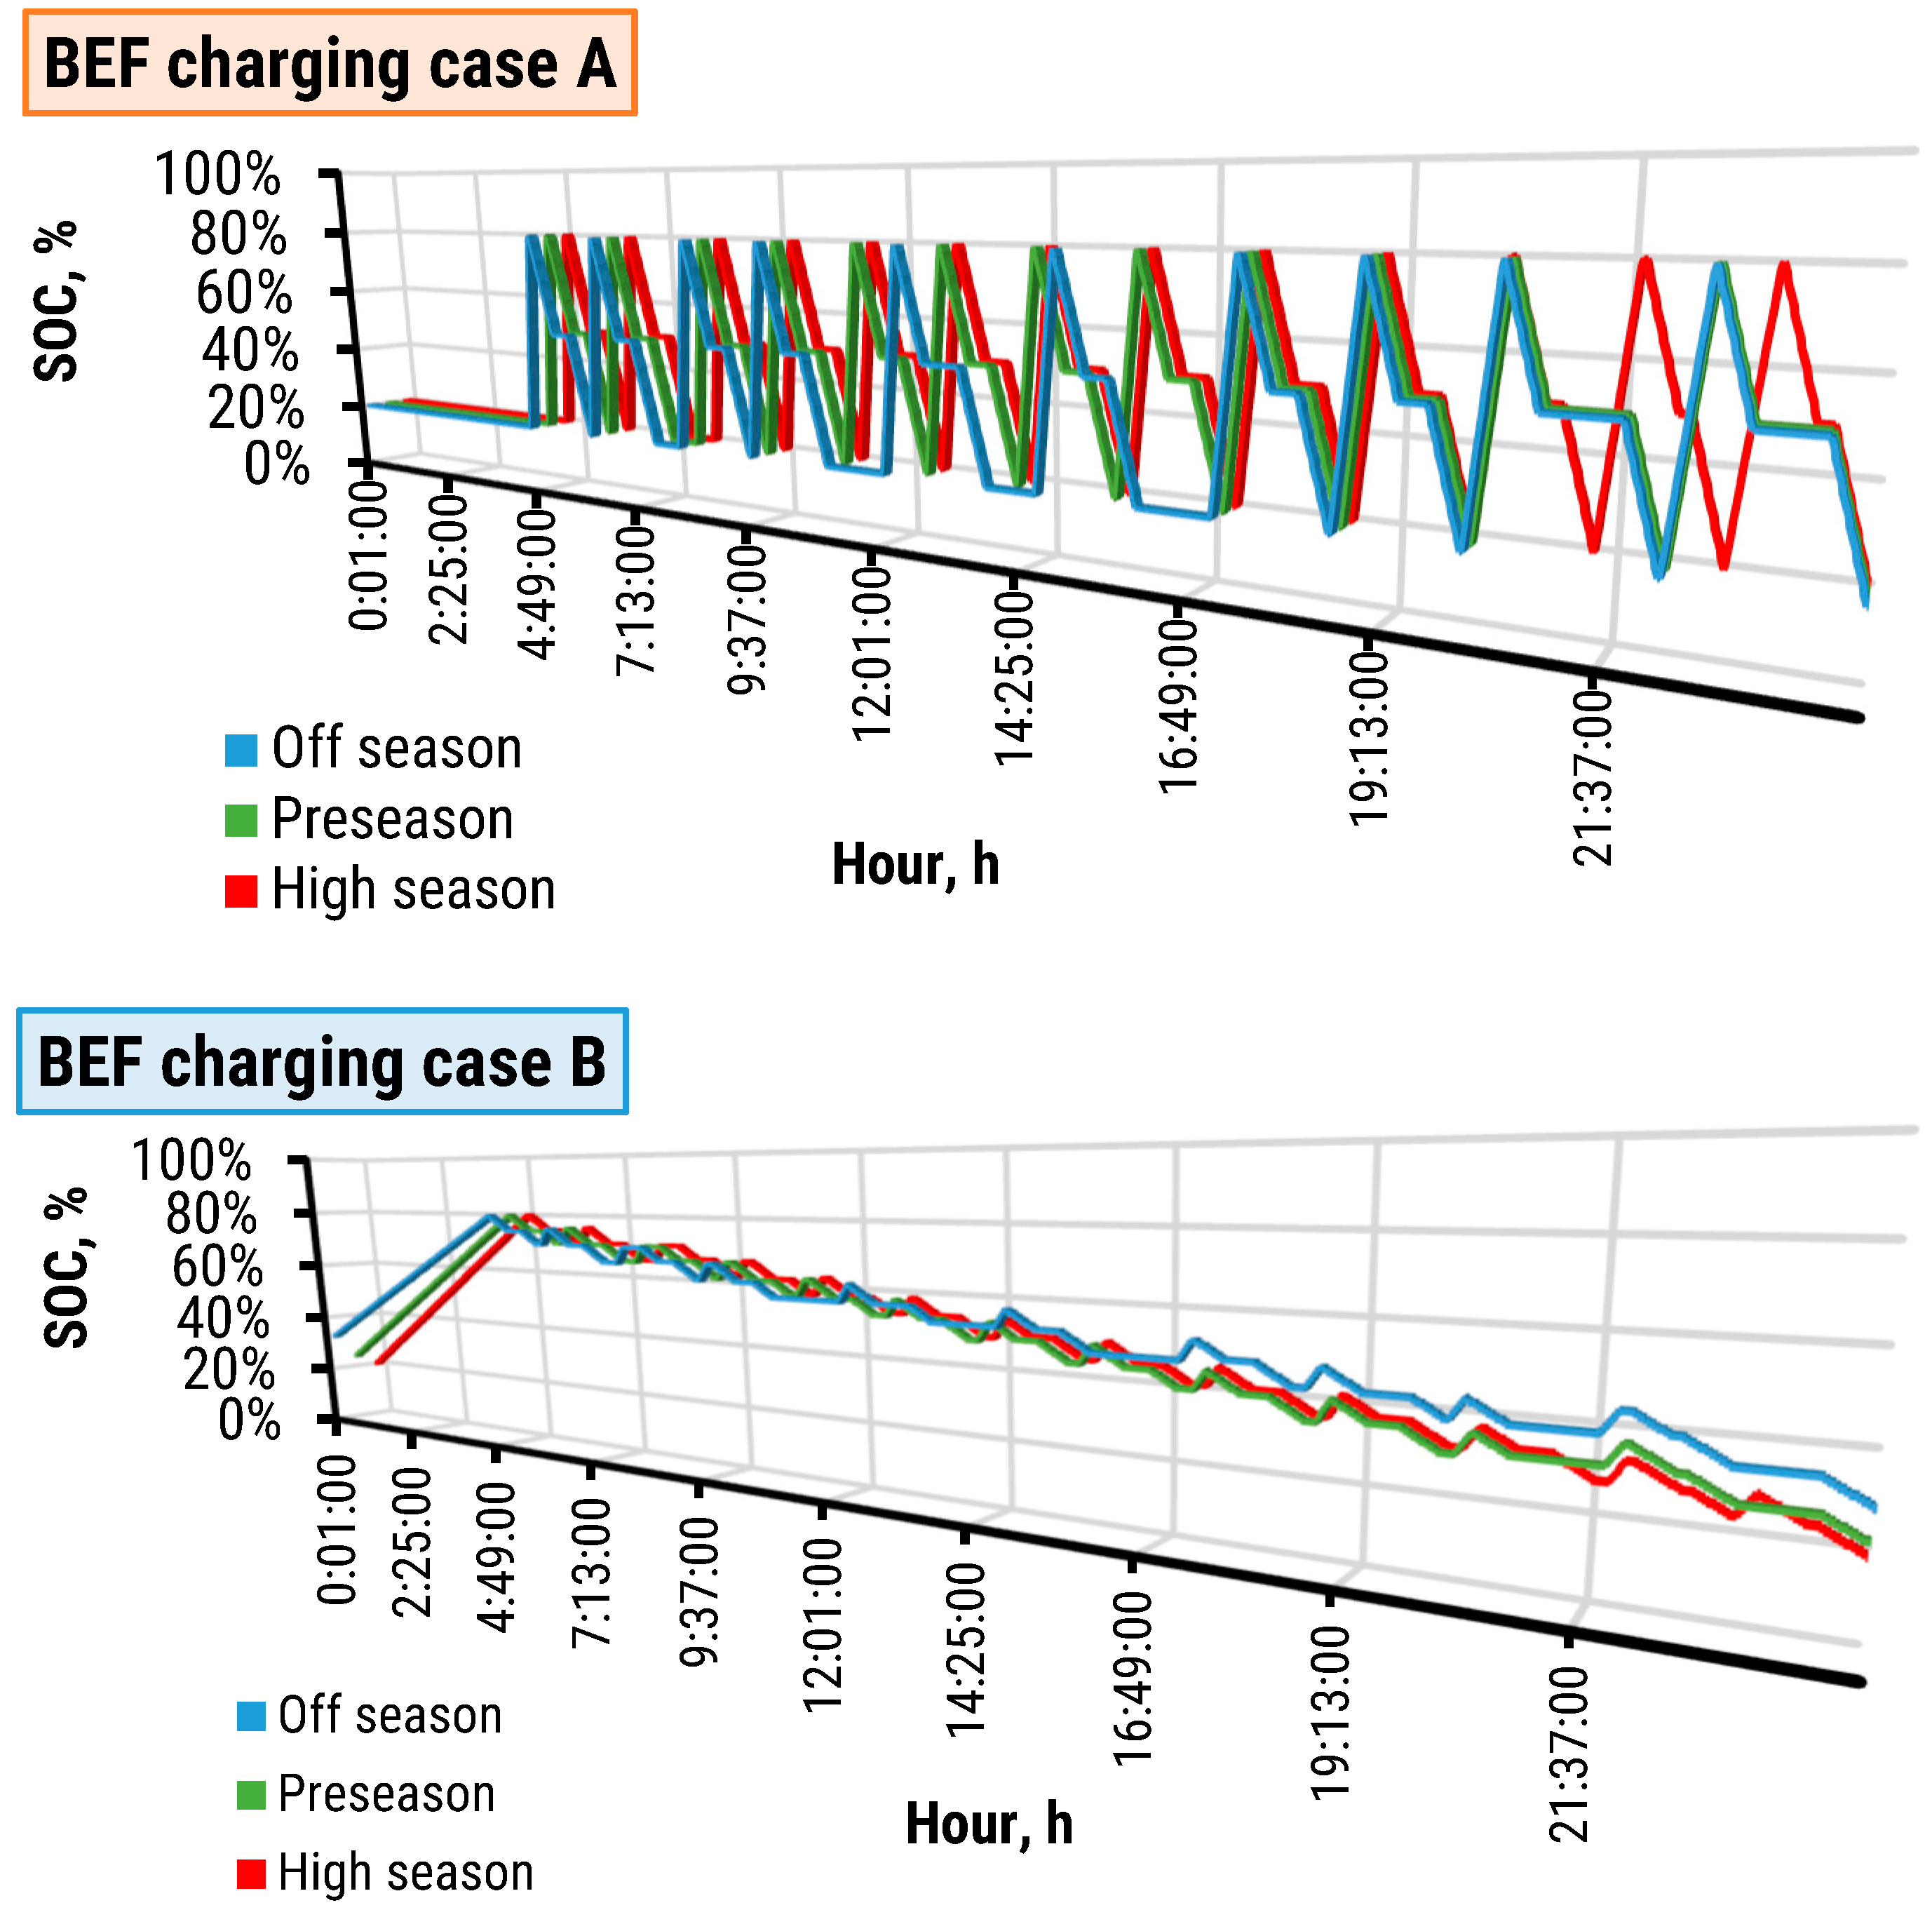
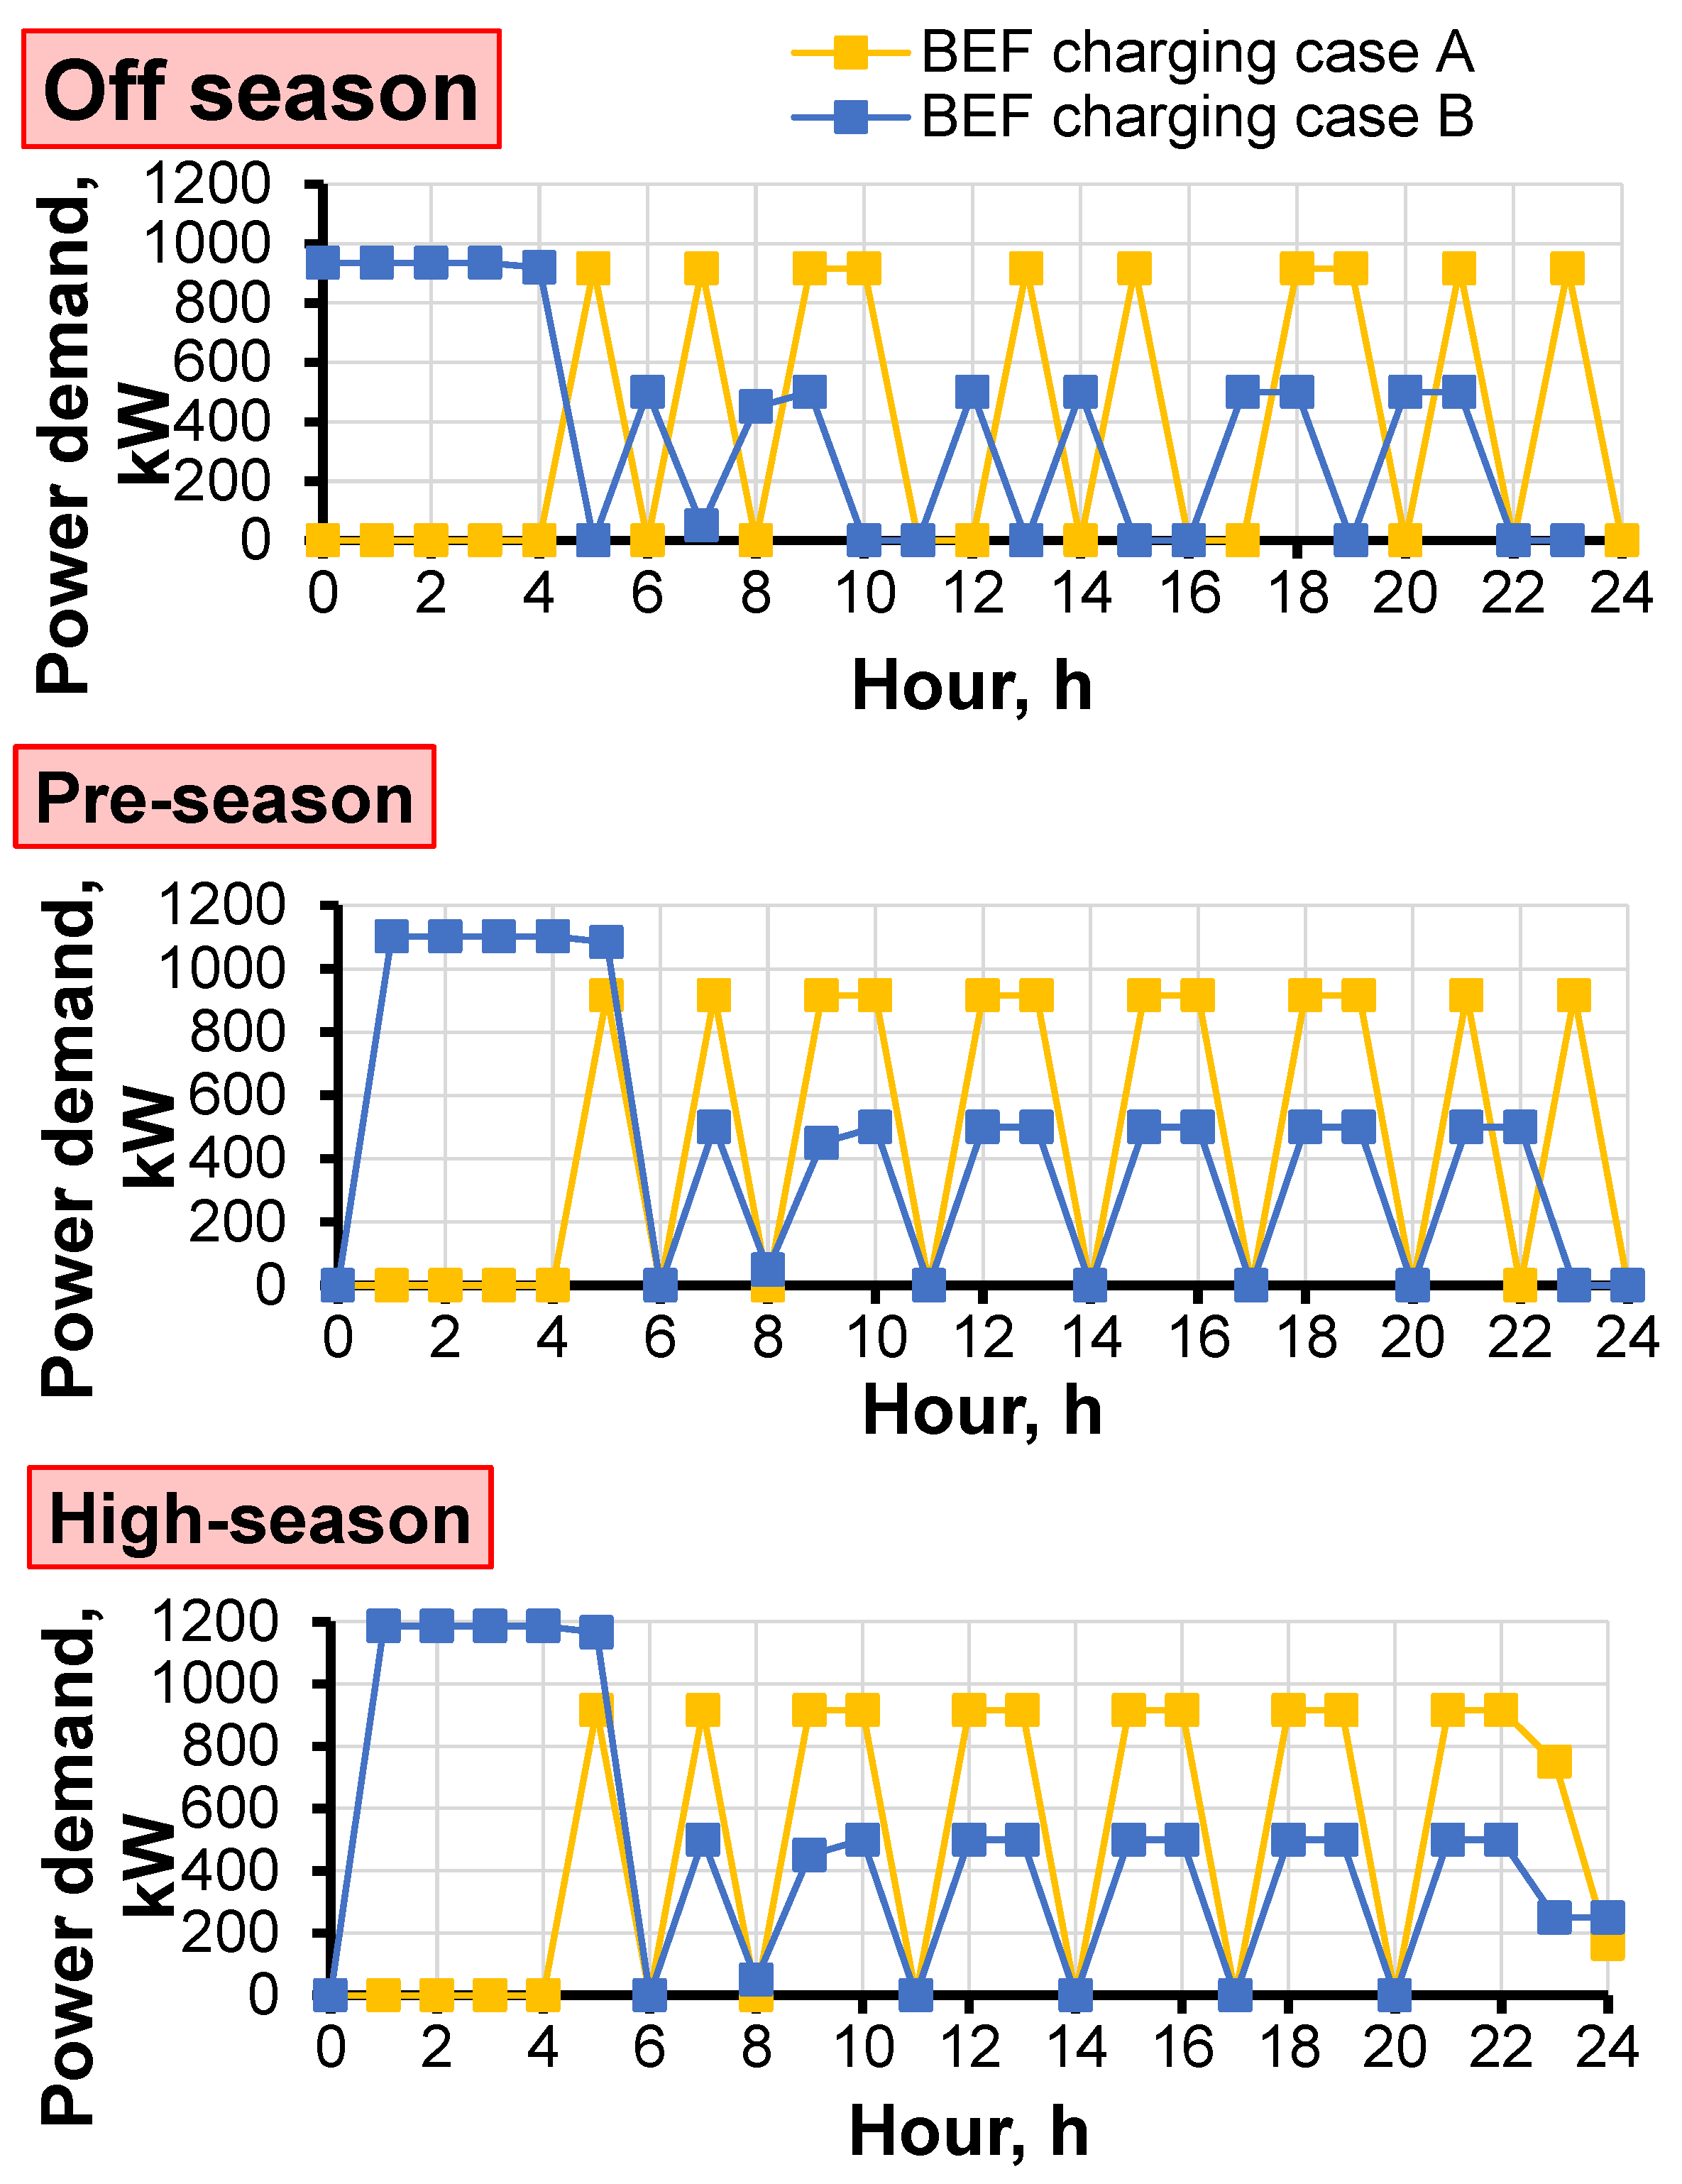
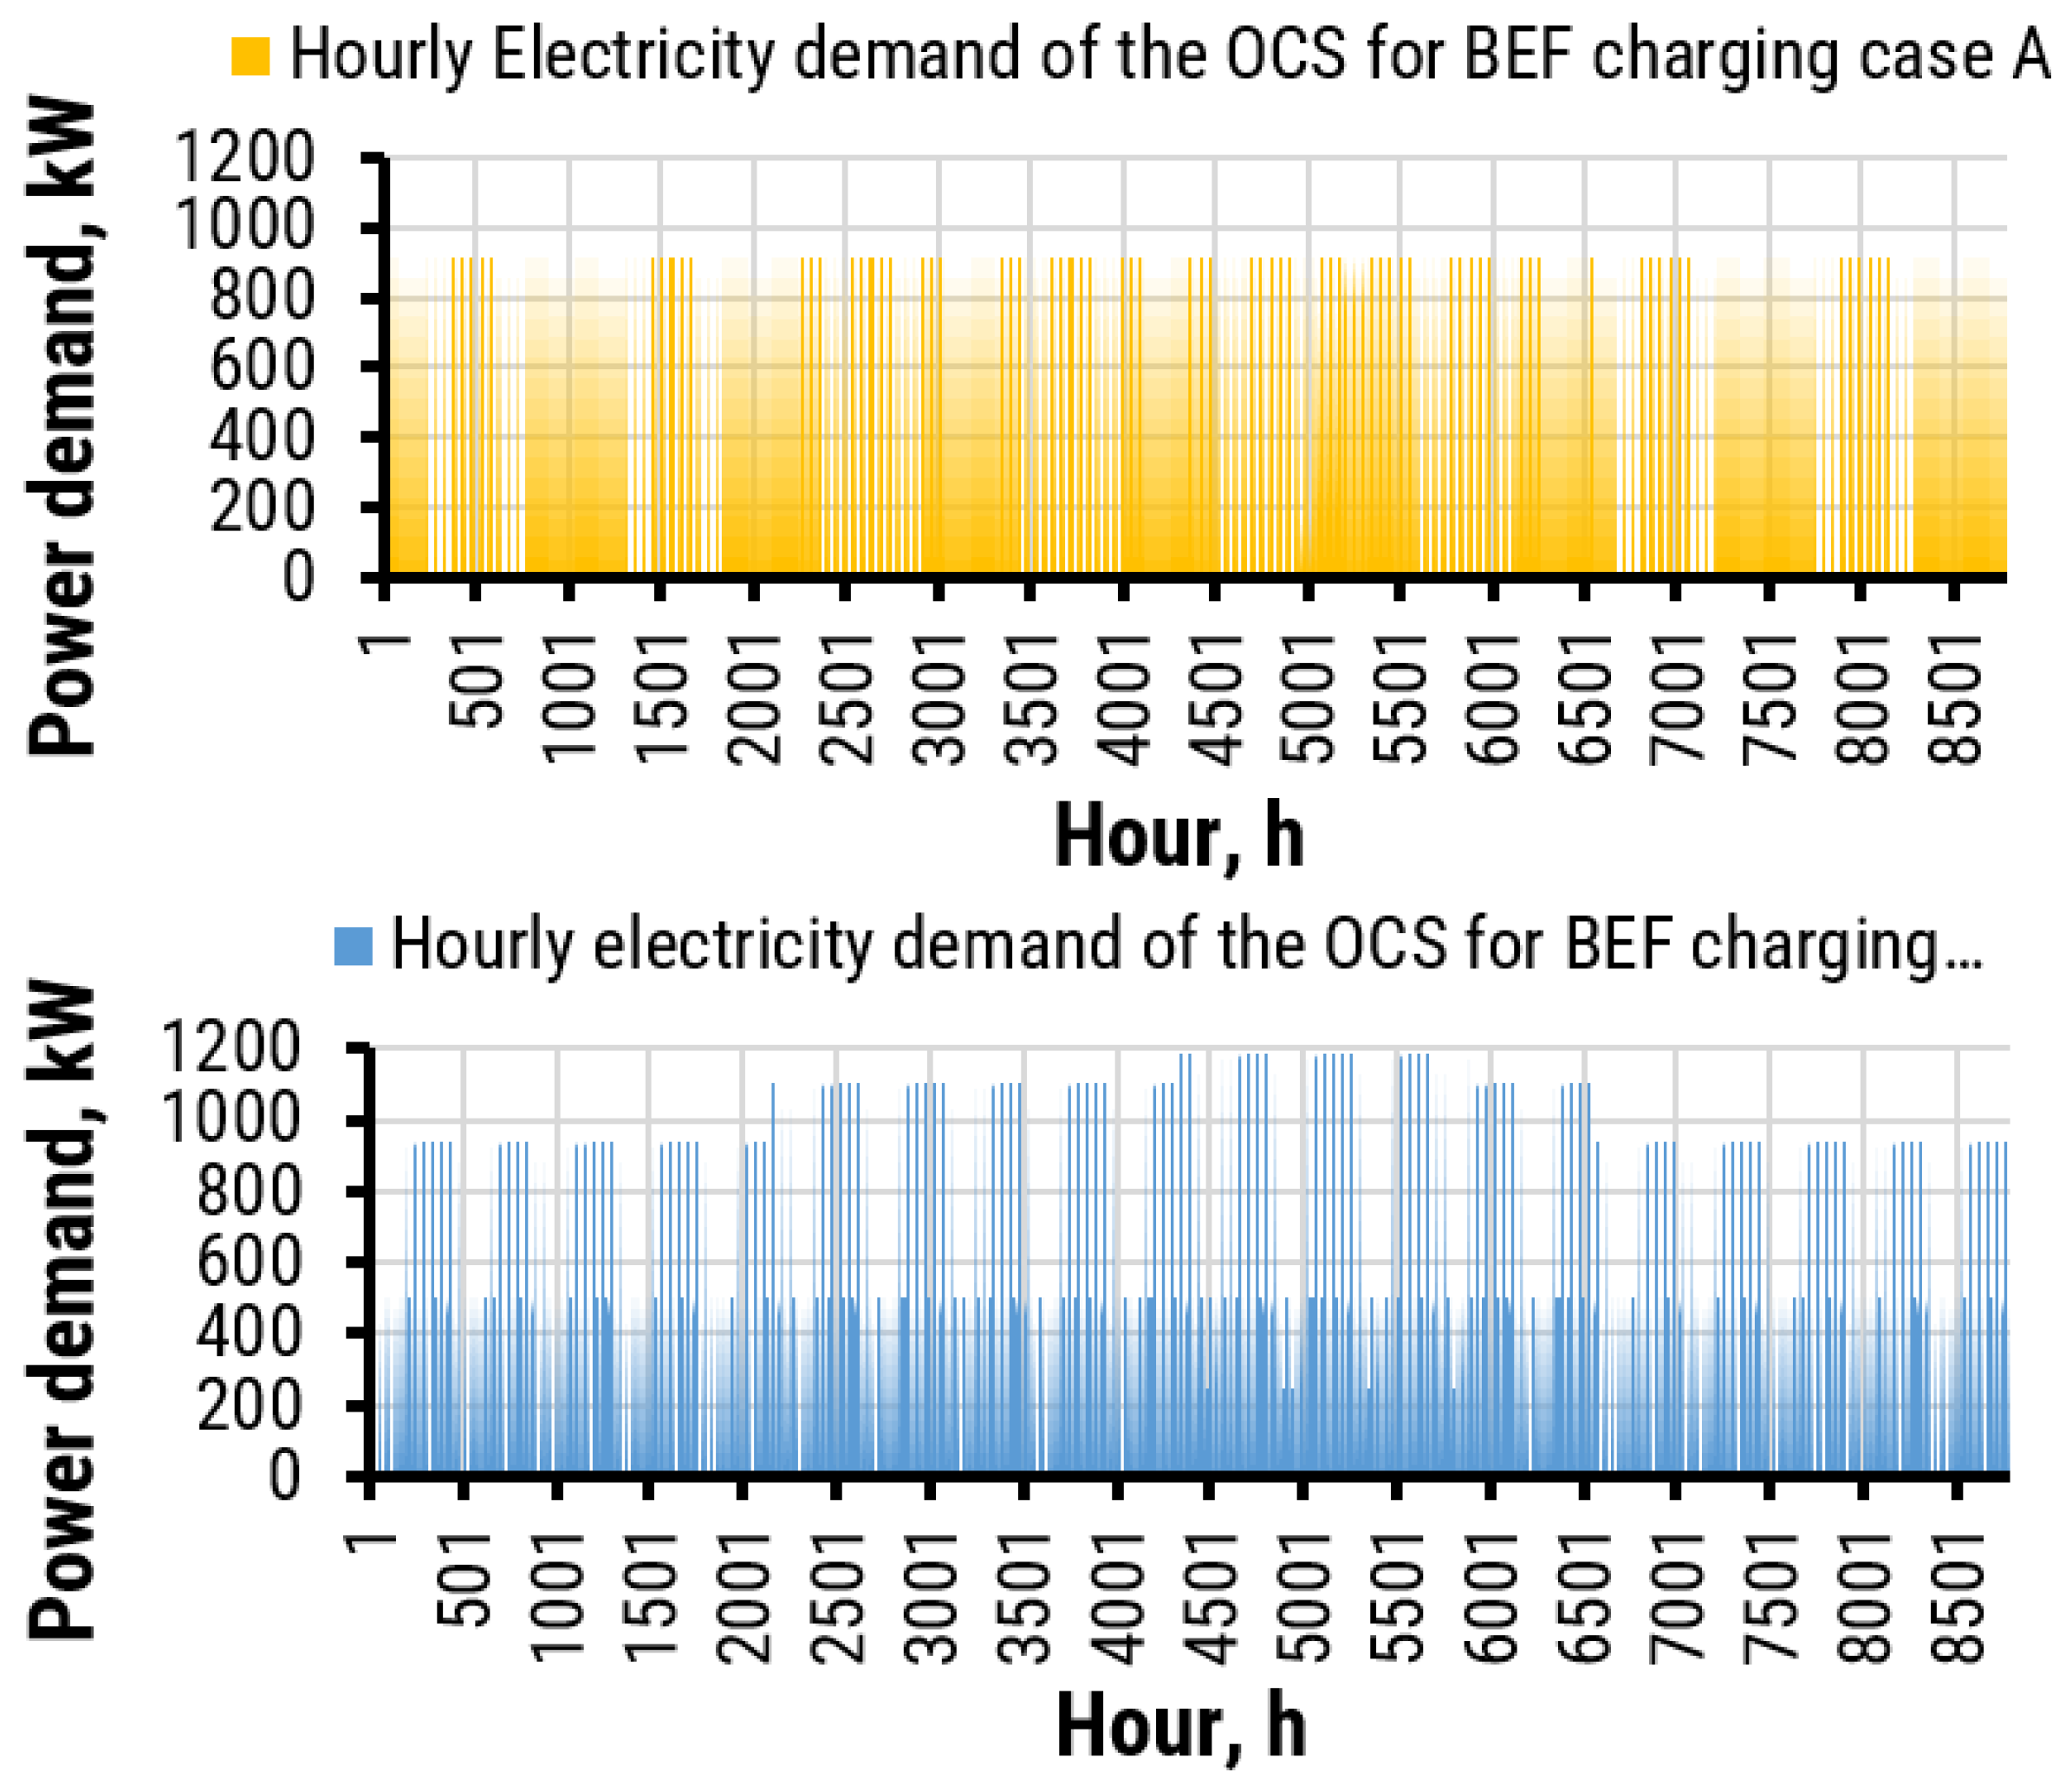
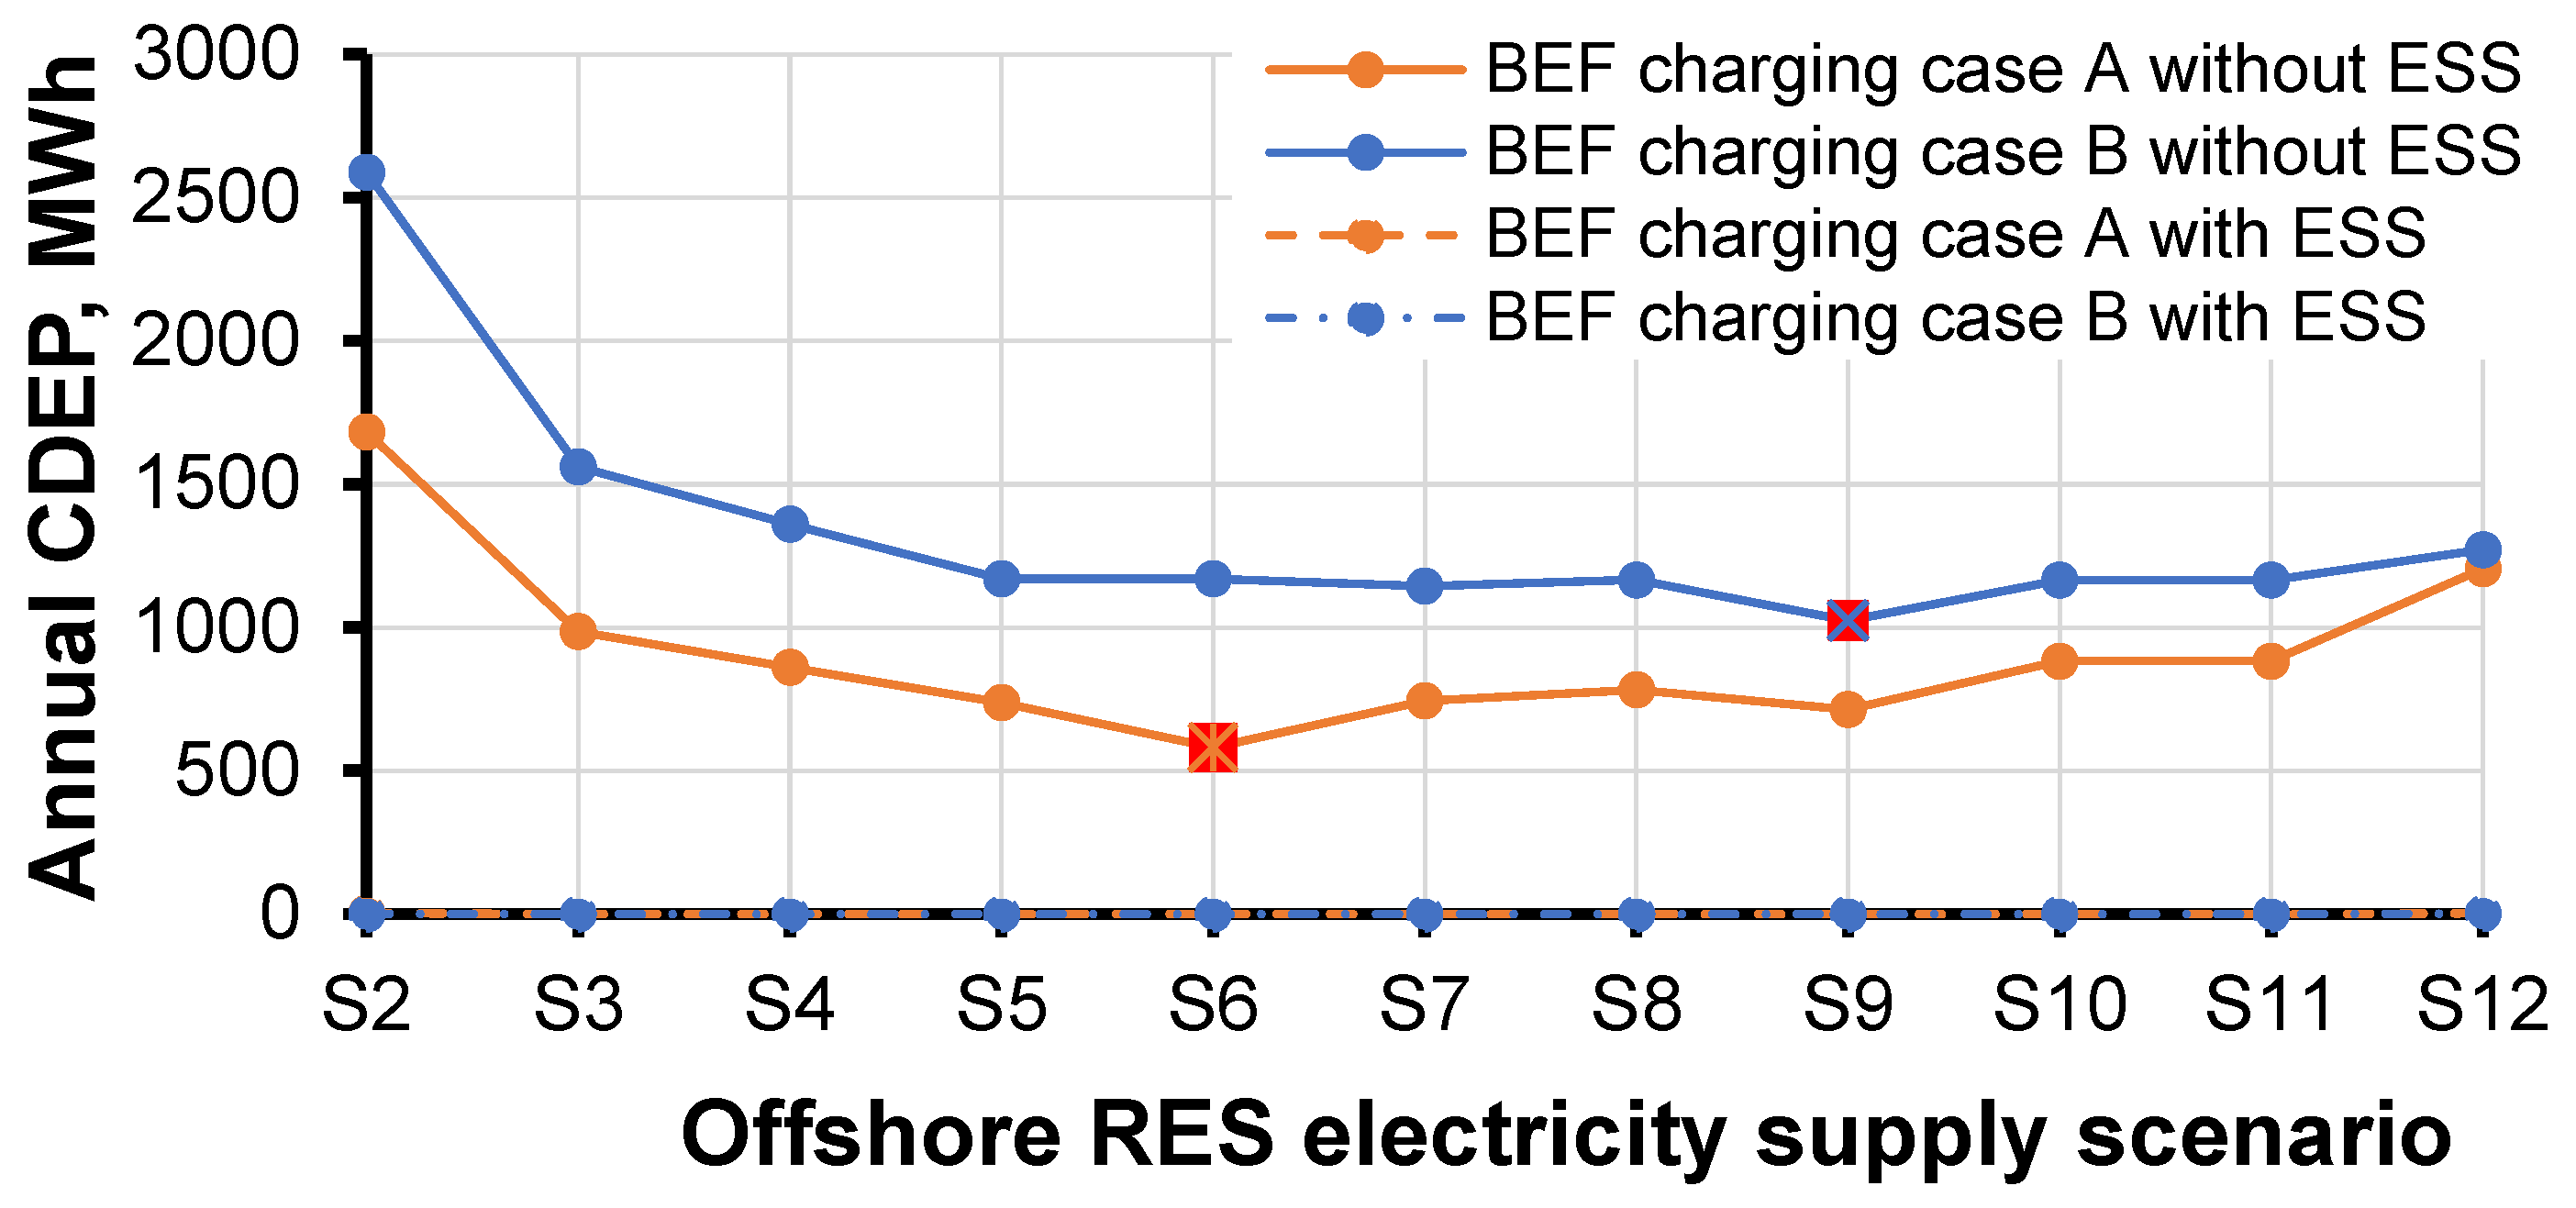
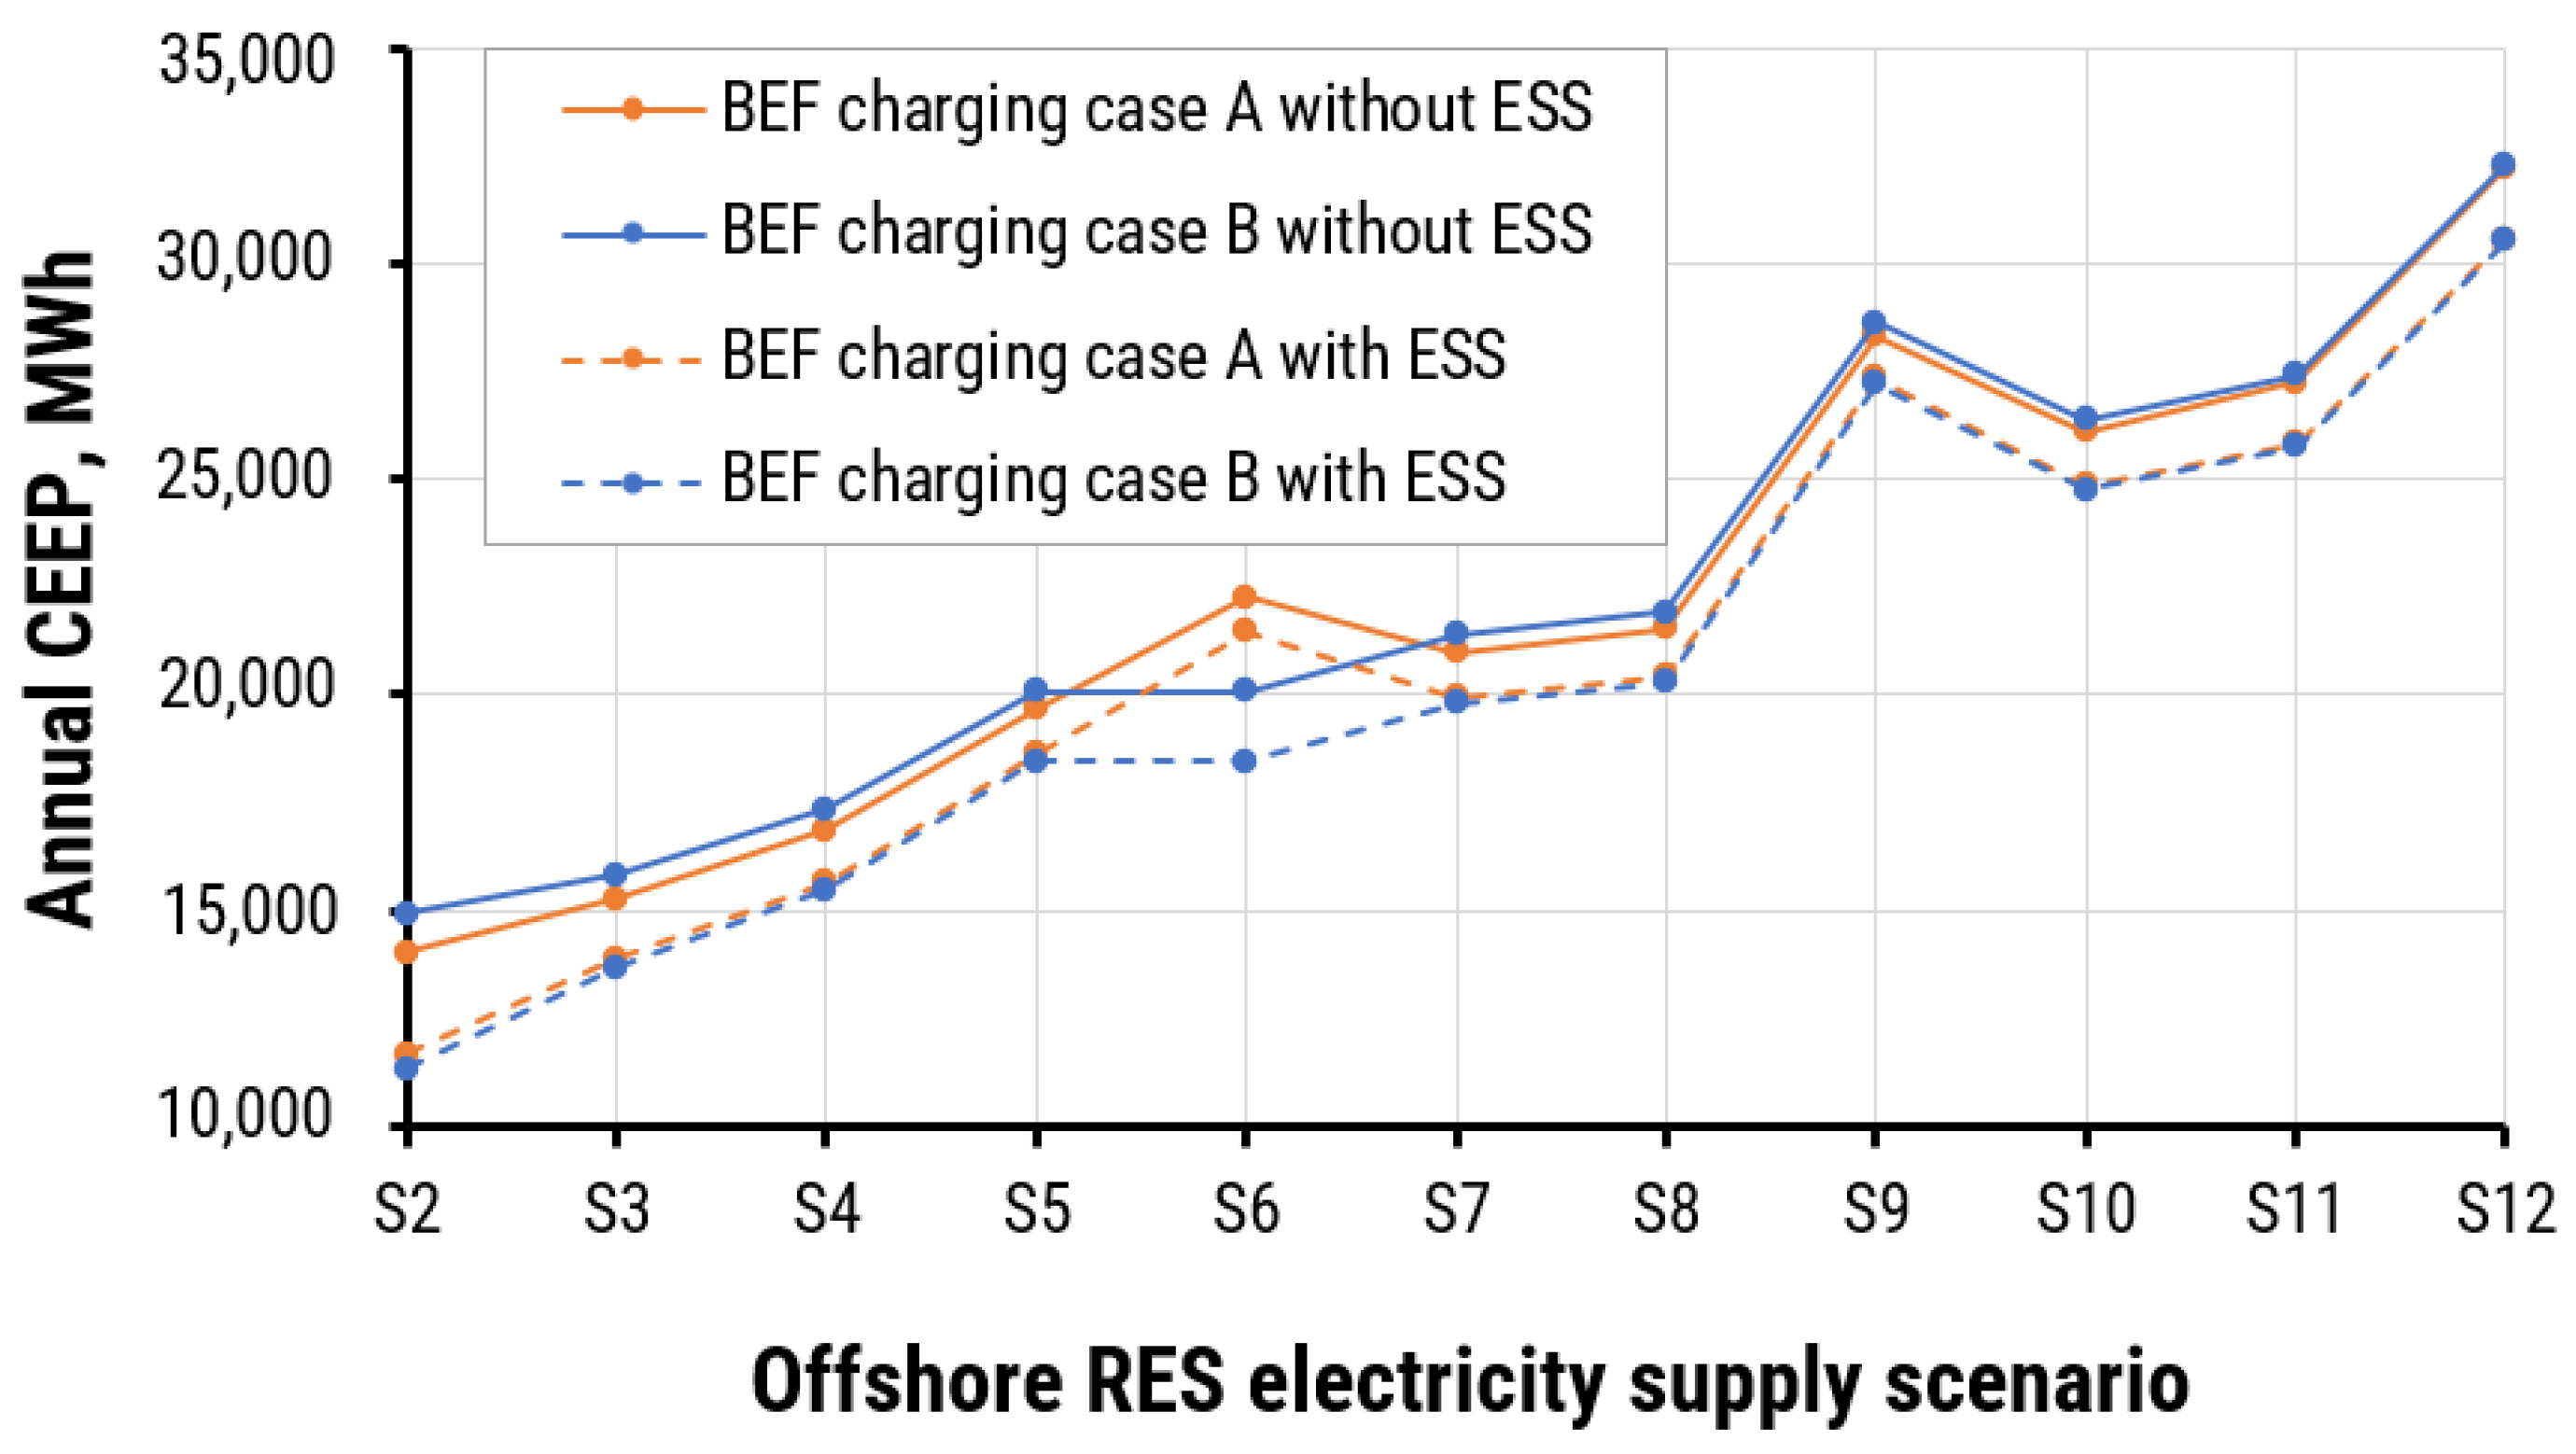
- The electricity supply scenario 6 (60% PV and 40% wind power system) provides the minimal annual value of the CDEP in the BEF charging case A, because charging of the BEF in case A occurs mainly during the day.
- The electricity supply scenario 9 (30% PV and 70% wind power system) provides the minimal annual value of the CDEP in the BEF charging case B, because charging of the BEF in case B occurs mainly during the night.
- The integration of the ESS did not manage to eliminate the CDEP in the boundary with 100% PV and 100% wind power system scenarios. However, the installed capacity of the ESS managed to eliminate the CDEP in the offshore hybrid PV–wind power system scenarios.
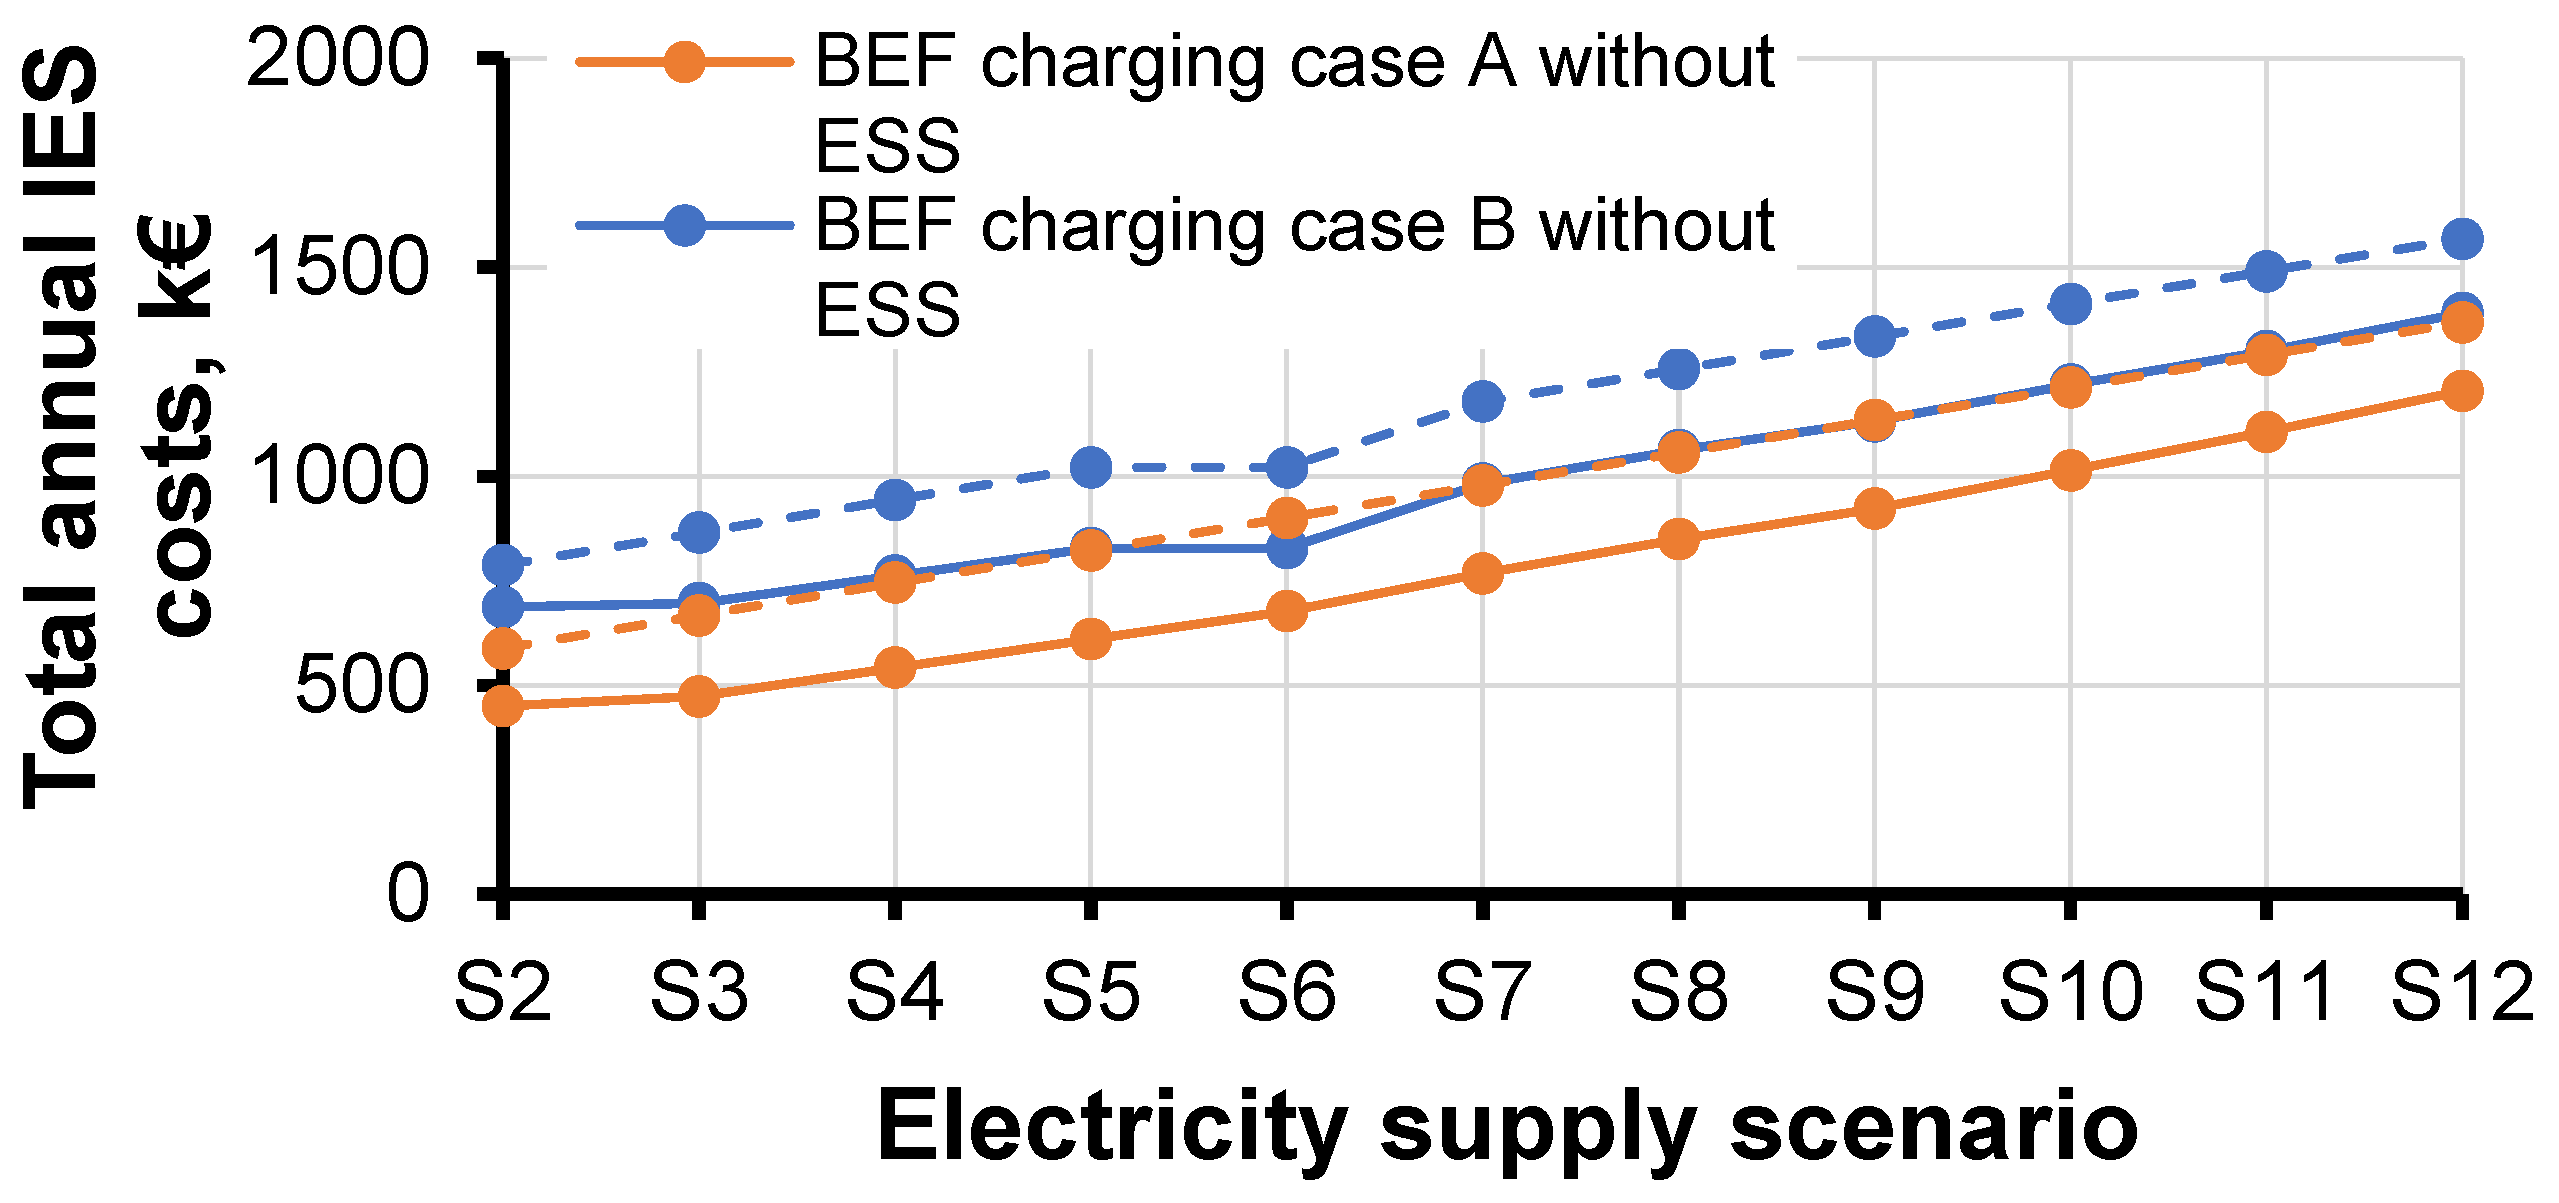
- The analysis indicated that combination of the BEF charging case A and electricity supply scenario 3 (90% PV and 10% wind power system) with ESS is the appropriate configuration for the standalone OCS, because it ensures the lowest total annual IES costs, CEEP and CDEP.
Author Contributions
Funding
Acknowledgments
Conflicts of Interest
References
- Nuchturee, C.; Li, T.; Xia, H. Energy efficiency of integrated electric propulsion for ships—A review. Renew. Sustain. Energy Rev. 2020, 134, 110145. [Google Scholar] [CrossRef]
- Perčić, M.; Ančić, I.; Vladimir, N. Life-cycle cost assessments of different power system configurations to reduce the carbon footprint in the Croatian short-sea shipping sector. Renew. Sustain. Energy Rev. 2020, 131, 110028. [Google Scholar] [CrossRef]
- Armand, M.; Axmann, P.; Bresser, D.; Copley, M.; Edström, K.; Ekberg, C.; Guyomard, D.; Lestriez, B.; Novák, P.; Petranikova, M.; et al. Lithium-ion batteries—Current state of the art and anticipated developments. J. Power Sources 2020, 479, 228708. [Google Scholar] [CrossRef]
- Fan, A.; Wang, J.; He, Y.; Perčić, M.; Vladimir, N.; Yang, L. Decarbonising inland ship power system: Alternative solution and assessment method. Energy 2021, 226, 120266. [Google Scholar] [CrossRef]
- Ali, A.; Shakoor, R.; Raheem, A.; Muqeet, H.A.U.; Awais, Q.; Khan, A.A.; Jamil, M. Latest Energy Storage Trends in Multi-Energy Standalone Electric Vehicle Charging Stations: A Comprehensive Study. Energies 2022, 15, 4727. [Google Scholar] [CrossRef]
- Eldeeb, H.H.; Faddel, S.; Mohammed, O.A. Multi-Objective Technique for the Operation of Grid tied PV Powered EV Charging Station. Electr. Power Syst. Res. 2018, 164, 201–211. [Google Scholar] [CrossRef]
- Aaslid, P.; Korpås, M.; Belsnes, M.M.; Fosso, O.B. Stochastic operation of energy constrained microgrids considering battery degradation. Electr. Power Syst. Res. 2022, 212, 108462. [Google Scholar] [CrossRef]
- Jakhrani, A.Q.; Rigit, A.R.H.; Othman, A.K.; Samo, S.R.; Kamboh, S.A. Life cycle cost analysis of a standalone PV system. In Proceedings of the International Conference on Green and Ubiquitous Technology, Bandung, Indonesia, 7–8 July 2012; pp. 82–85. [Google Scholar] [CrossRef]
- Yan, J.; Qu, T.; Han, S.; Liu, Y.; Lei, X.; Wang, H. Reviews on characteristic of renewables: Evaluating the variability and complementarity. Int. Trans. Electr. Energy Syst. 2020, 30, e12281. [Google Scholar] [CrossRef]
- Golroodbari, S.Z.M.; Vaartjes, D.F.; Meit, J.B.L.; van Hoeken, A.P.; Eberveld, M.; Jonker, H.; van Sark, W.G.J.H.M. Pooling the cable: A techno-economic feasibility study of integrating offshore floating photovoltaic solar technology within an offshore wind park. Sol. Energy 2021, 219, 65–74. [Google Scholar] [CrossRef]
- López, M.; Rodríguez, N.; Iglesias, G. Combined Floating Offshore Wind and Solar PV. J. Mar. Sci. Eng. 2020, 8, 576. [Google Scholar] [CrossRef]
- Sterl, S.; Liersch, S.; Koch, H.; van Lipzig, N.P.M.; Thiery, W. A new approach for assessing synergies of solar and wind power: Implications for West Africa. Environ. Res. Lett. 2018, 13, 094009. [Google Scholar] [CrossRef]
- Wankouo Ngouleu, C.A.; Koholé, Y.W.; Fohagui, F.C.V.; Tchuen, G. Techno-economic analysis and optimal sizing of a battery-based and hydrogen-based standalone photovoltaic/wind hybrid system for rural electrification in Cameroon based on meta-heuristic techniques. Energy Convers. Manag. 2023, 280, 116794. [Google Scholar] [CrossRef]
- Simoes, S.; Zeyringer, M.; Mayr, D.; Huld, T.; Nijs, W.; Schmidt, J. Impact of different levels of geographical disaggregation of wind and PV electricity generation in large energy system models: A case study for Austria. Renew. Energy 2017, 105, 183–198. [Google Scholar] [CrossRef]
- Couto, A.; Estanqueiro, A. Exploring Wind and Solar PV Generation Complementarity to Meet Electricity Demand. Energies 2020, 13, 4132. [Google Scholar] [CrossRef]
- Peter, J. How does climate change affect electricity system planning and optimal allocation of variable renewable energy? Appl. Energy 2019, 252, 113397. [Google Scholar] [CrossRef]
- EnergyPLAN. Advanced Energy Systems Analysis Computer Model. Available online: https://www.energyplan.eu/ (accessed on 21 July 2023).
- Perčić, M.; Vladimir, N.; Fan, A. Life-cycle cost assessment of alternative marine fuels to reduce the carbon footprint in short-sea shipping: A case study of Croatia. Appl. Energy 2020, 279, 115848. [Google Scholar] [CrossRef]
- Eurostat. Statistics Explained. 2018. Available online: https://ec.europa.eu/eurostat/statistics-explained/index.php?title=Glossary:Tonnes_of_oil_equivalent_(toe) (accessed on 18 May 2023).
- Ančić, I.; Vladimir, N.; Cho, D.S. Determining environmental pollution from ships using Index of Energy Efficiency and Environmental Eligibility (I4E). Mar. Policy 2018, 95, 1–7. [Google Scholar] [CrossRef]
- Perčić, M.; Frković, L.; Pukšec, T.; Ćosić, B.; Li, O.L.; Vladimir, N. Life-cycle assessment and life-cycle cost assessment of power batteries for all-electric vessels for short-sea navigation. Energy 2022, 251, 123895. [Google Scholar] [CrossRef]
- Lund, H.; Thellufsen, J.Z. EnergyPLAN. Advanced Energy Systems Analysis Computer Model, Documentation Version 15 [WWW Document]. 2019. Available online: https://www.energyplan.eu/wp-content/uploads/2019/09/EnergyPLAN-Documentation-Version15.pdf (accessed on 5 June 2023).
- Iannaccone, T.; Landucci, G.; Tugnoli, A.; Salzano, E.; Cozzani, V. Sustainability of cruise ship fuel systems: Comparison among LNG and diesel technologies. J. Clean. Prod. 2020, 260, 121069. [Google Scholar] [CrossRef]
- ENTSOG. Fuel Commodities and Carbon Prices. 2020. Available online: https://2020.entsos-tyndp-scenarios.eu/fuel-commodities-and-carbon-prices/ (accessed on 18 May 2023).
- European Parliament. 2030 Climate Target Plan: Extension of European Emission Trading System (ETS) to Transport Emissions. ENVI Workshop Proceedings. 2021. Available online: https://www.europarl.europa.eu/RegData/etudes/IDAN/2021/662927/IPOL_IDA(2021)662927_EN.pdf (accessed on 18 May 2023).
- Christos, B. Techno-Economical Feasibility Study on the Retrofit of Double-Ended Ro/Pax Ferries into Battery-Powered Ones. Ph.D. Dissertation, National Technical University of Athens, Athens, Greece, 2017. [Google Scholar] [CrossRef]
- Kortsari, A.; Mitropoulos, L.; Heinemann, T.; Mikkelsen, H.; Aifadoupoulou, G. Evaluating the Economic Performance of a Pure Electric and Diesel Vessel: The Case of E-ferry in Denmark. Trans. Marit. Sci. 2022, 11, 95–109. [Google Scholar] [CrossRef]
- EnergyPLAN. Useful Resources. Cost Database. Available online: https://www.energyplan.eu/useful_resources/costdatabase/ (accessed on 18 May 2023).
- Killer, M.; Farrokhseresht, M.; Paterakis, N.G. Implementation of large-scale Li-ion battery energy storage systems within the EMEA region. Appl. Energy 2020, 260, 114166. [Google Scholar] [CrossRef]
- Google Earth. 2023. Available online: https://earth.google.com/web/@44.86087805,14.2059433,-53.67737137a,198707.33108981d,34.96775148y,0h,0t,0r (accessed on 25 March 2023).
- CRS Web Reports. Available online: http://report.crs.hr/HRBWebReports/Default.aspx?ReturnUrl=%2Fhrbwebreports%2F (accessed on 25 March 2023).
- Jadrolinija. Državna Trajektna Linija Br 332. Available online: https://agencija-zolpp.hr/wp-content/uploads/2019/04/T-332-Valbiska-Merag-2023.pdf (accessed on 2 February 2023).
- Cerinski, V. Energetsko Planiranje Pametnog Otoka Cresa. Undergraduate Thesis, University of Zagreb, Faculty of Mechanical Engineering and Naval Architecture, Zagreb, Croatia, 2019. Available online: https://zir.nsk.hr/islandora/object/fsb%3A5261/datastream/PDF/view (accessed on 8 December 2022).
- Meteonorm. Available online: https://meteonorm.com/en/ (accessed on 1 May 2019).
- DHMZ. Croatian Meteorological and Hydrological Service. Available online: https://meteo.hr/index_en.php (accessed on 8 December 2022).
- Akhtar, N.; Geyer, B.; Rockel, B.; Sommer, P.S.; Schrum, C. Accelerating deployment of offshore wind energy alter wind climate and reduce future power generation potentials. Sci. Rep. 2021, 11, 11826. [Google Scholar] [CrossRef] [PubMed]
- Wind-Turbines-Models.Com. Turbines. Windturbines Database. Available online: https://en.wind-turbine-models.com/turbines (accessed on 4 March 2023).
- 2020ATB_NREL_Reference_7MW_200—NREL/Turbine-Models Power Curve Archive 0 Documentation. Available online: https://nrel.github.io/turbine-models/2020ATB_NREL_Reference_7MW_200.html (accessed on 13 March 2023).
- Pandit, R.; Kolios, A. SCADA Data-Based Support Vector Machine Wind Turbine Power Curve Uncertainty Estimation and Its Comparative Studies. Appl. Sci. 2020, 10, 8685. [Google Scholar] [CrossRef]


| RES Technology | Year | Investment Cost, EUR /kW | Lifetime, Years | Fixed Operation and Maintenance Cost, % of Investment |
|---|---|---|---|---|
| Wind | 2030 | 1990 [28] | 30 | 1.9 |
| PV | 2030 | 690 [28] | 40 | 1.28 |
| ESS | 2030 | 250 [29] | 15 | 2 |
| BEF Charging Case | A | B |
|---|---|---|
| Description | BEF charging to 80% SOC after each round trip | BEF charging for 10 min after each round trip and slow-charging to 80% SOC during the night |
| Required battery capacity, kWh | 1524 | 8862 |
| Battery lifetime, years | 10 | 15 |
| OCS charging power, MW | 3 | 3 |
| OCS charging capacity, kWh/min | 50 | 50 |
| ESS capacity, MW | 20 | 20 |
| Scenario # | Installed PV Power Capacity, MW (Share of PV, %) | Installed Wind Power Capacity, MW (Share of the Wind Power, %) |
|---|---|---|
| S1 | 0 (0%) | 0 (0%) |
| S2 | 10 (100%) | 0 (0%) |
| S3 | 9 (90%) | 1 (10%) |
| S4 | 8 (80%) | 2 (20%) |
| S5 | 7 (70%) | 3 (30%) |
| S6 | 6 (60%) | 4 (40%) |
| S7 | 5 (50%) | 5 (50%) |
| S8 | 4 (40%) | 6 (60%) |
| S9 | 3 (30%) | 7 (70%) |
| S10 | 2 (20%) | 8 (80%) |
| S11 | 1 (10%) | 9 (90%) |
| S12 | 0 (0%) | 10 (100%) |
| Ship’s Power System | Diesel Engine | Battery (BEF Charging Case A) | Battery (BEF Charging Case B) |
|---|---|---|---|
| Diesel fuel costs, EUR | 1,688,000.00 | 0 | 0 |
| Electricity costs, EUR | 0 | 292,500.00 | 292,500.00 |
| CO2 emission costs, EUR | 450,000.00 | 0 | 0 |
| Fixed operation and maintenance costs, EUR | 131,000.00 | 40,640.00 | 129,976.00 |
| Annual investment costs, EUR | 16,400.00 | 20,320.00 | 129,976.00 |
| Total annual costs, EUR | 1,836,551.36 | 353,460.00 | 552,452.00 |
| BEF Charging Case | A |
|---|---|
| Electricity supply scenario | Scenario 2 |
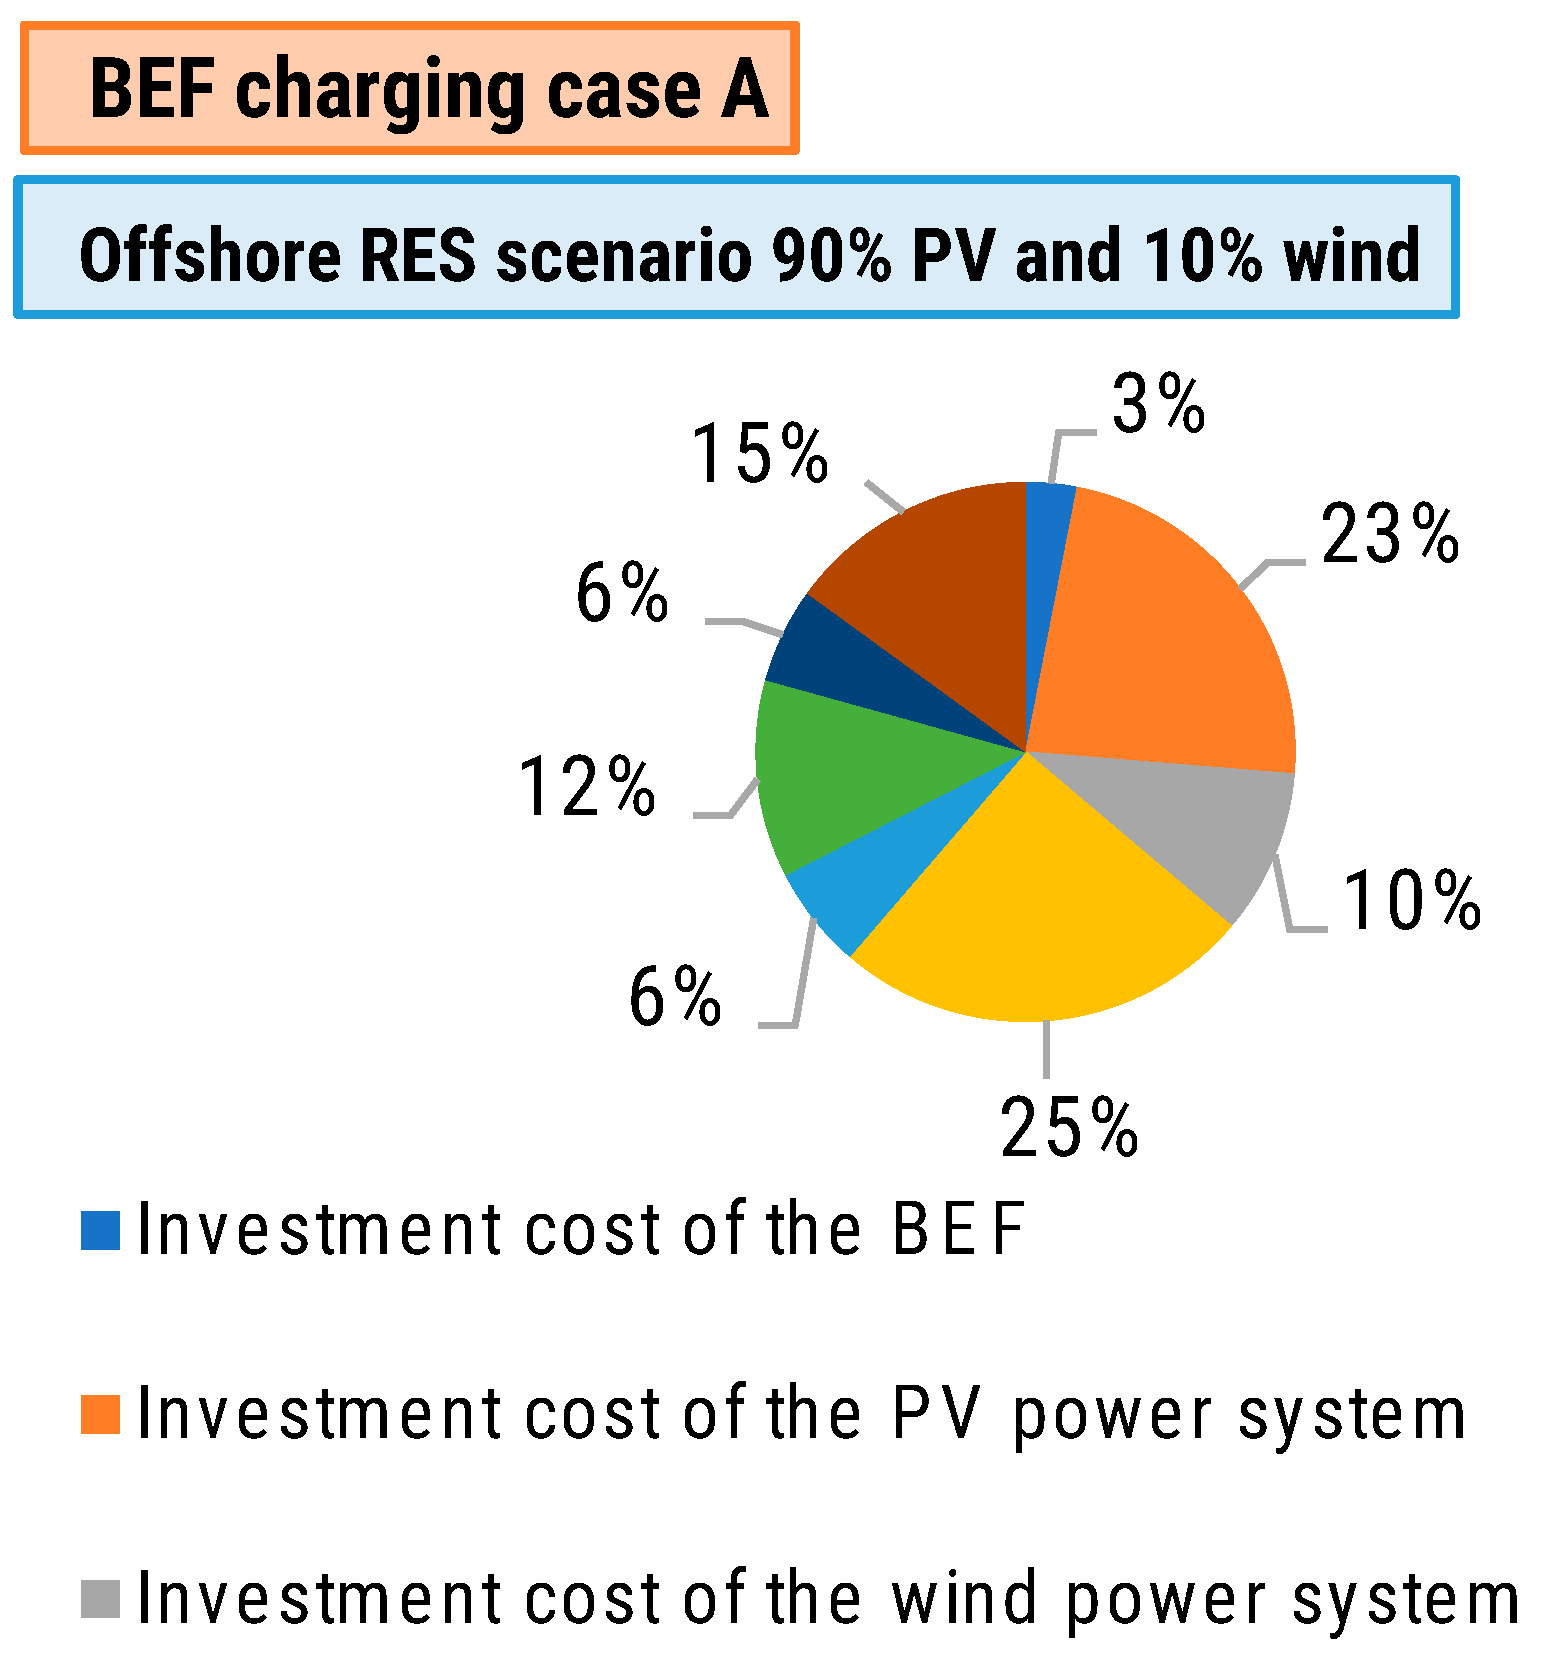
| Investment costs of the BEF, EUR | 20,320.00 |
| Investment costs of the PV power system, EUR | 155,000.00 |
| Investment costs of the wind power system, EUR | 66,000.00 |
| Investment costs of the ESS, EUR | 167,666.67 |
| Total annual investment costs of the IES, EUR | 409,000.67 |
| Fixed maintenance costs of the BEF, EUR | 41,000.00 |
| Fixed operation and maintenance costs of the PV power system, EUR | 79,000.00 |
| Fixed operation and maintenance costs of the wind power system, EUR | 38,000.00 |
| Fixed operation and maintenance costs of the ESS, EUR | 100,000.00 |
| Total annual fixed operation and maintenance costs, EUR | 258,000.00 |
| Total annual IES costs, EUR | 667,000.00 |
Disclaimer/Publisher’s Note: The statements, opinions and data contained in all publications are solely those of the individual author(s) and contributor(s) and not of MDPI and/or the editor(s). MDPI and/or the editor(s) disclaim responsibility for any injury to people or property resulting from any ideas, methods, instructions or products referred to in the content. |
© 2023 by the authors. Licensee MDPI, Basel, Switzerland. This article is an open access article distributed under the terms and conditions of the Creative Commons Attribution (CC BY) license (https://creativecommons.org/licenses/by/4.0/).
Share and Cite
Frković, L.; Ćosić, B.; Pukšec, T.; Vladimir, N. Modelling of the Standalone Onshore Charging Station: The Nexus between Offshore Renewables and All-Electric Ships. Energies 2023, 16, 5789. https://doi.org/10.3390/en16155789
Frković L, Ćosić B, Pukšec T, Vladimir N. Modelling of the Standalone Onshore Charging Station: The Nexus between Offshore Renewables and All-Electric Ships. Energies. 2023; 16(15):5789. https://doi.org/10.3390/en16155789
Chicago/Turabian StyleFrković, Lovro, Boris Ćosić, Tomislav Pukšec, and Nikola Vladimir. 2023. "Modelling of the Standalone Onshore Charging Station: The Nexus between Offshore Renewables and All-Electric Ships" Energies 16, no. 15: 5789. https://doi.org/10.3390/en16155789
APA StyleFrković, L., Ćosić, B., Pukšec, T., & Vladimir, N. (2023). Modelling of the Standalone Onshore Charging Station: The Nexus between Offshore Renewables and All-Electric Ships. Energies, 16(15), 5789. https://doi.org/10.3390/en16155789