


A Simple Model for Wake-Induced Aerodynamic Interaction of Wind Turbines


 and
and 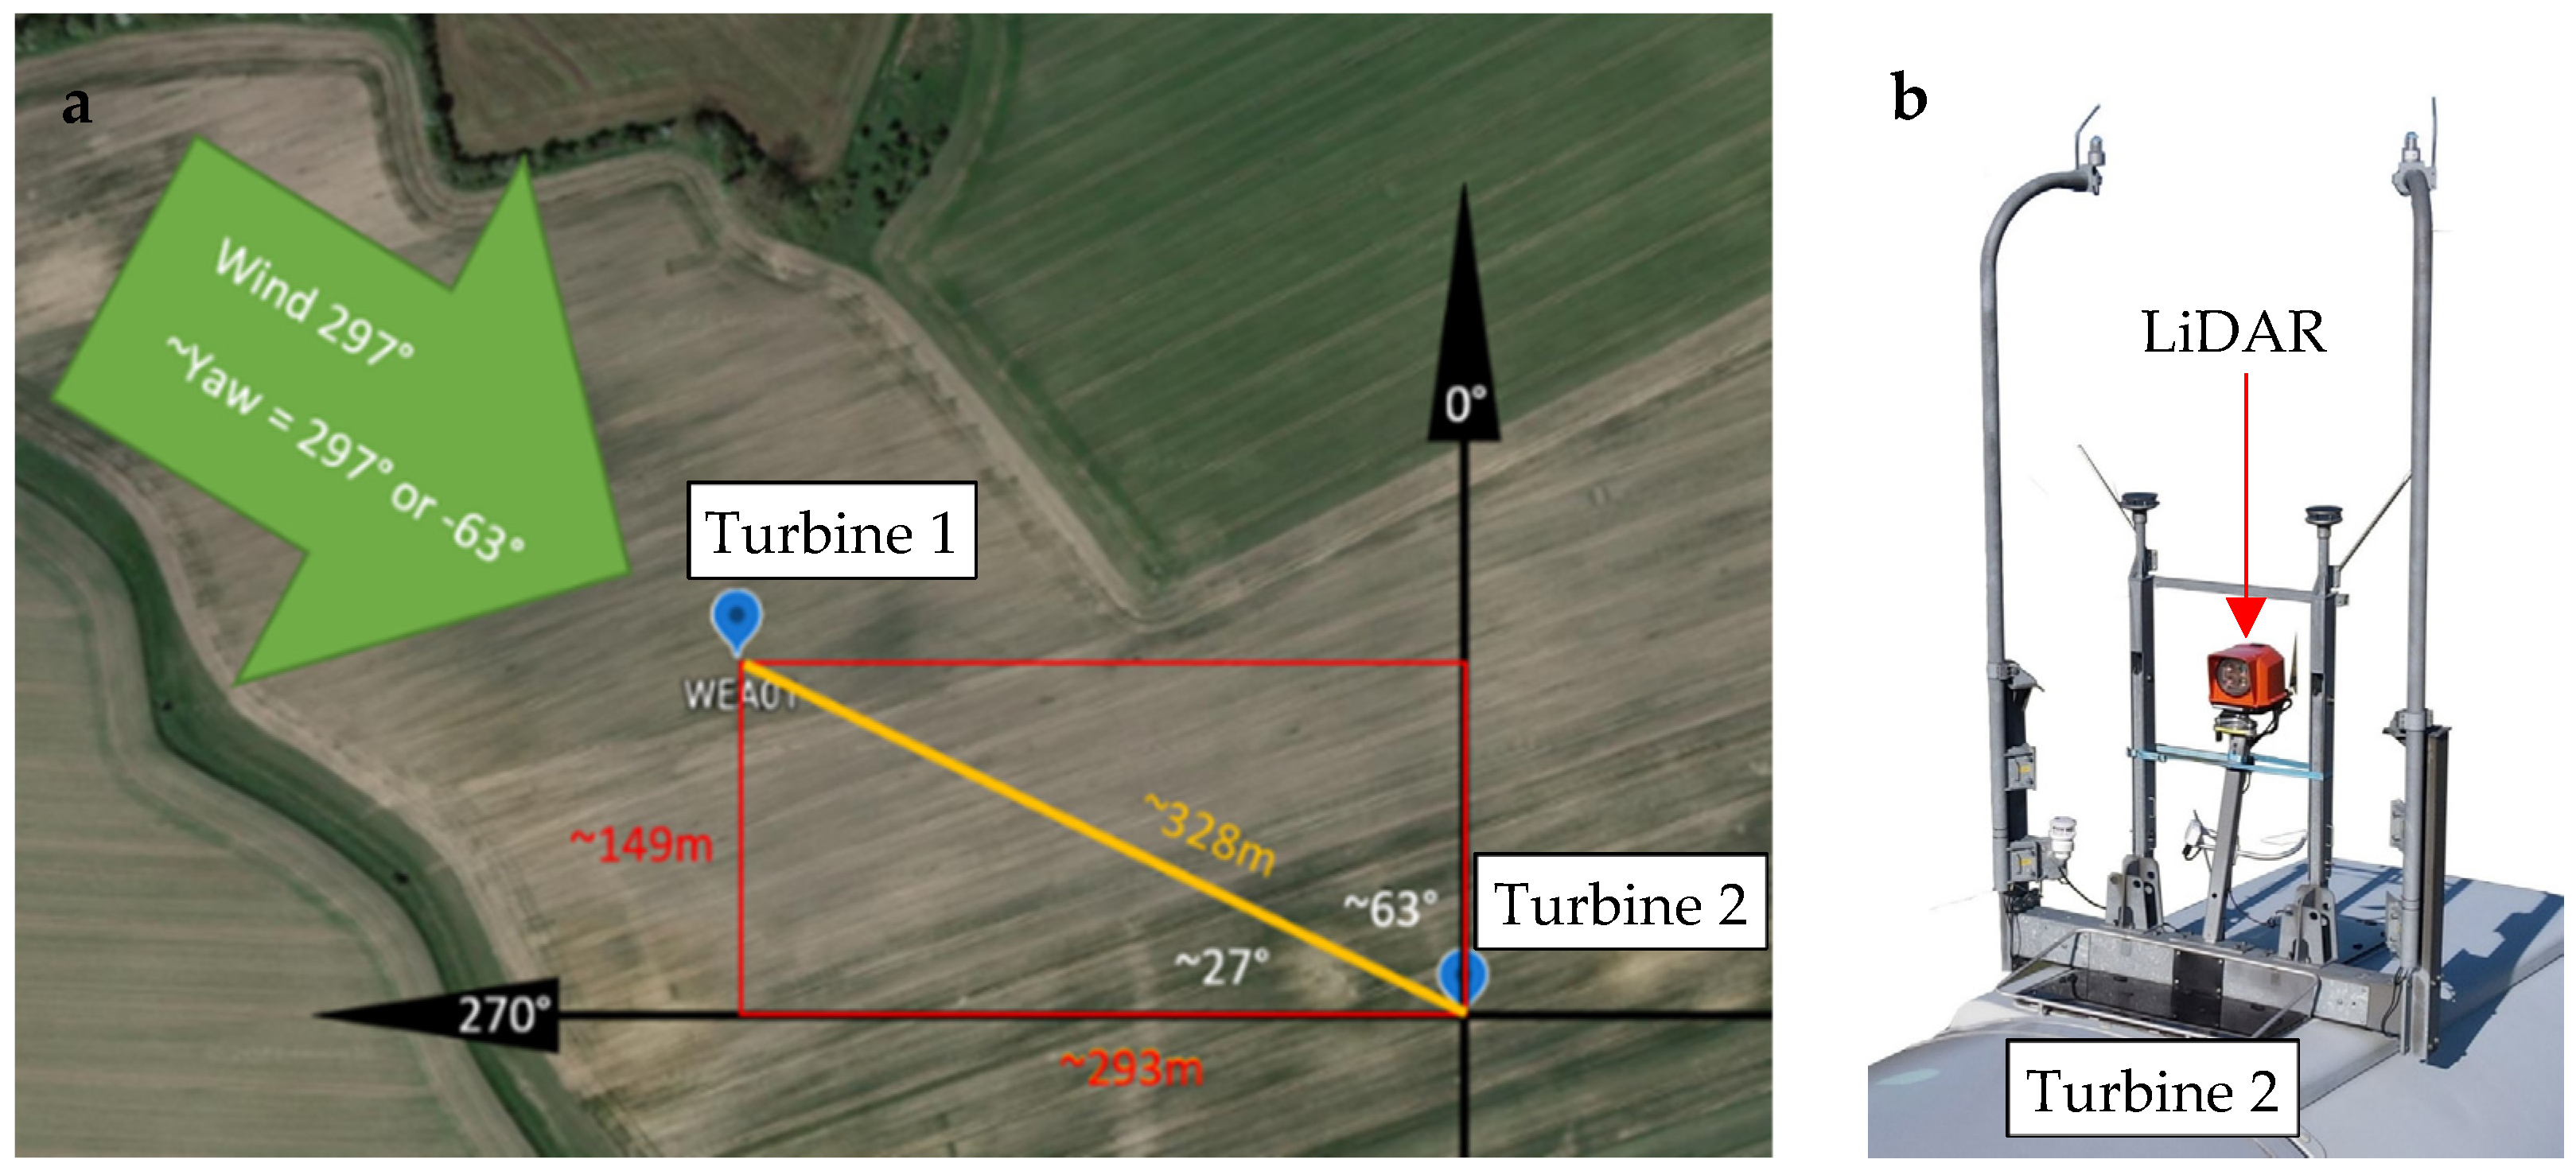
Abstract
1. Introduction
2. Materials and Methods
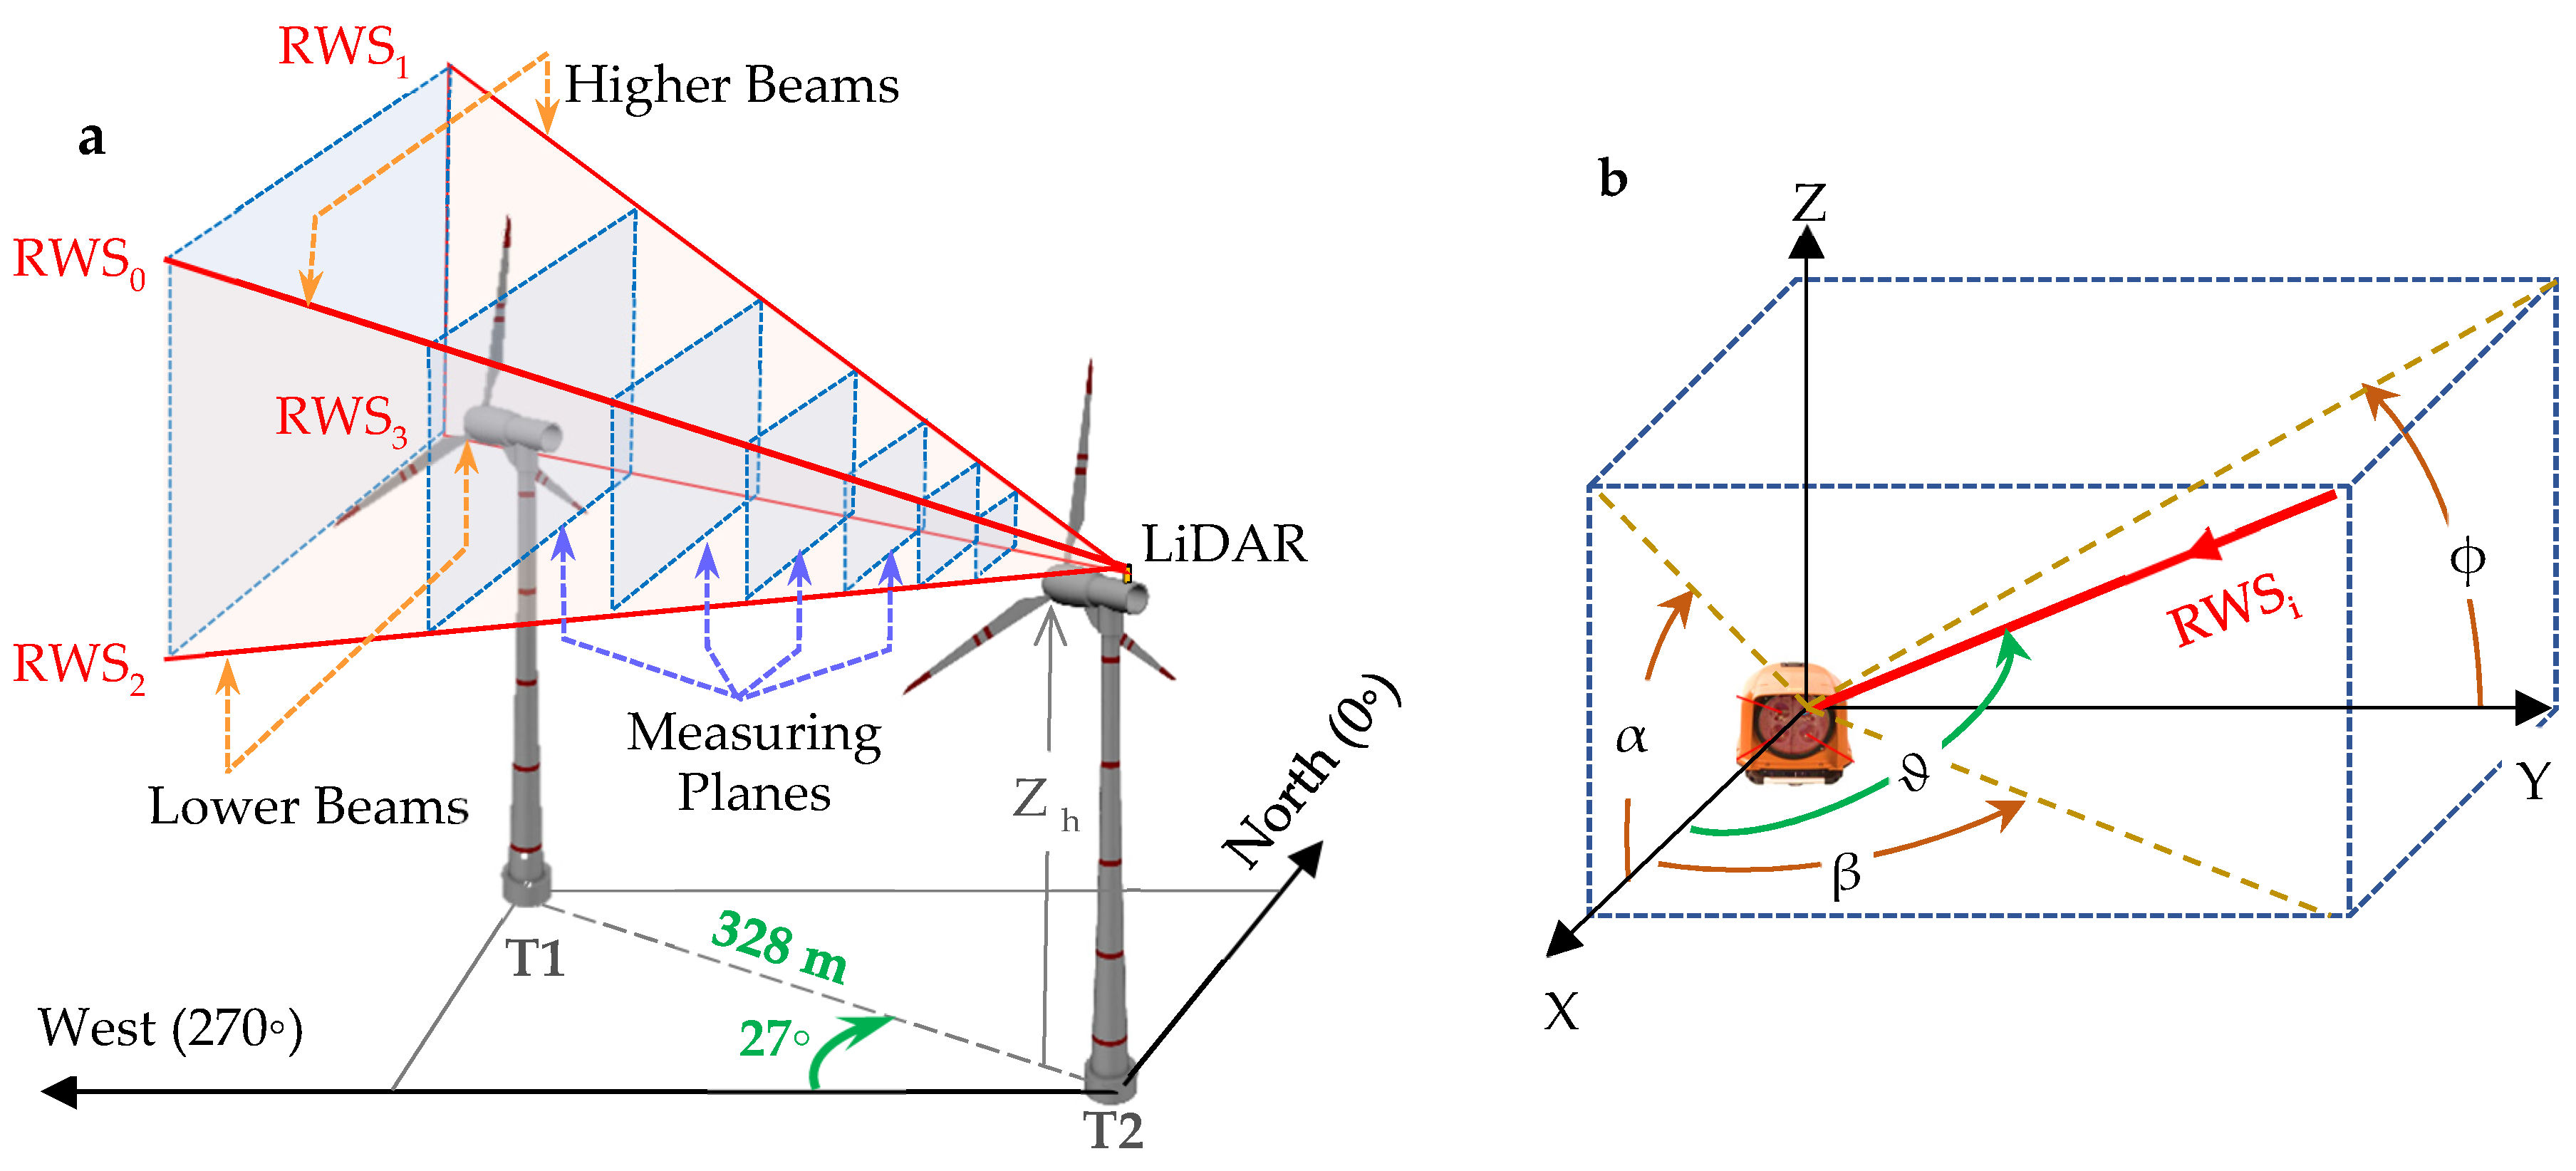
2.1. Field Setup
2.2. Two-Dimensional Gaussian Jensen Wake Model
2.3. Cylindrical Vortex Induction Model
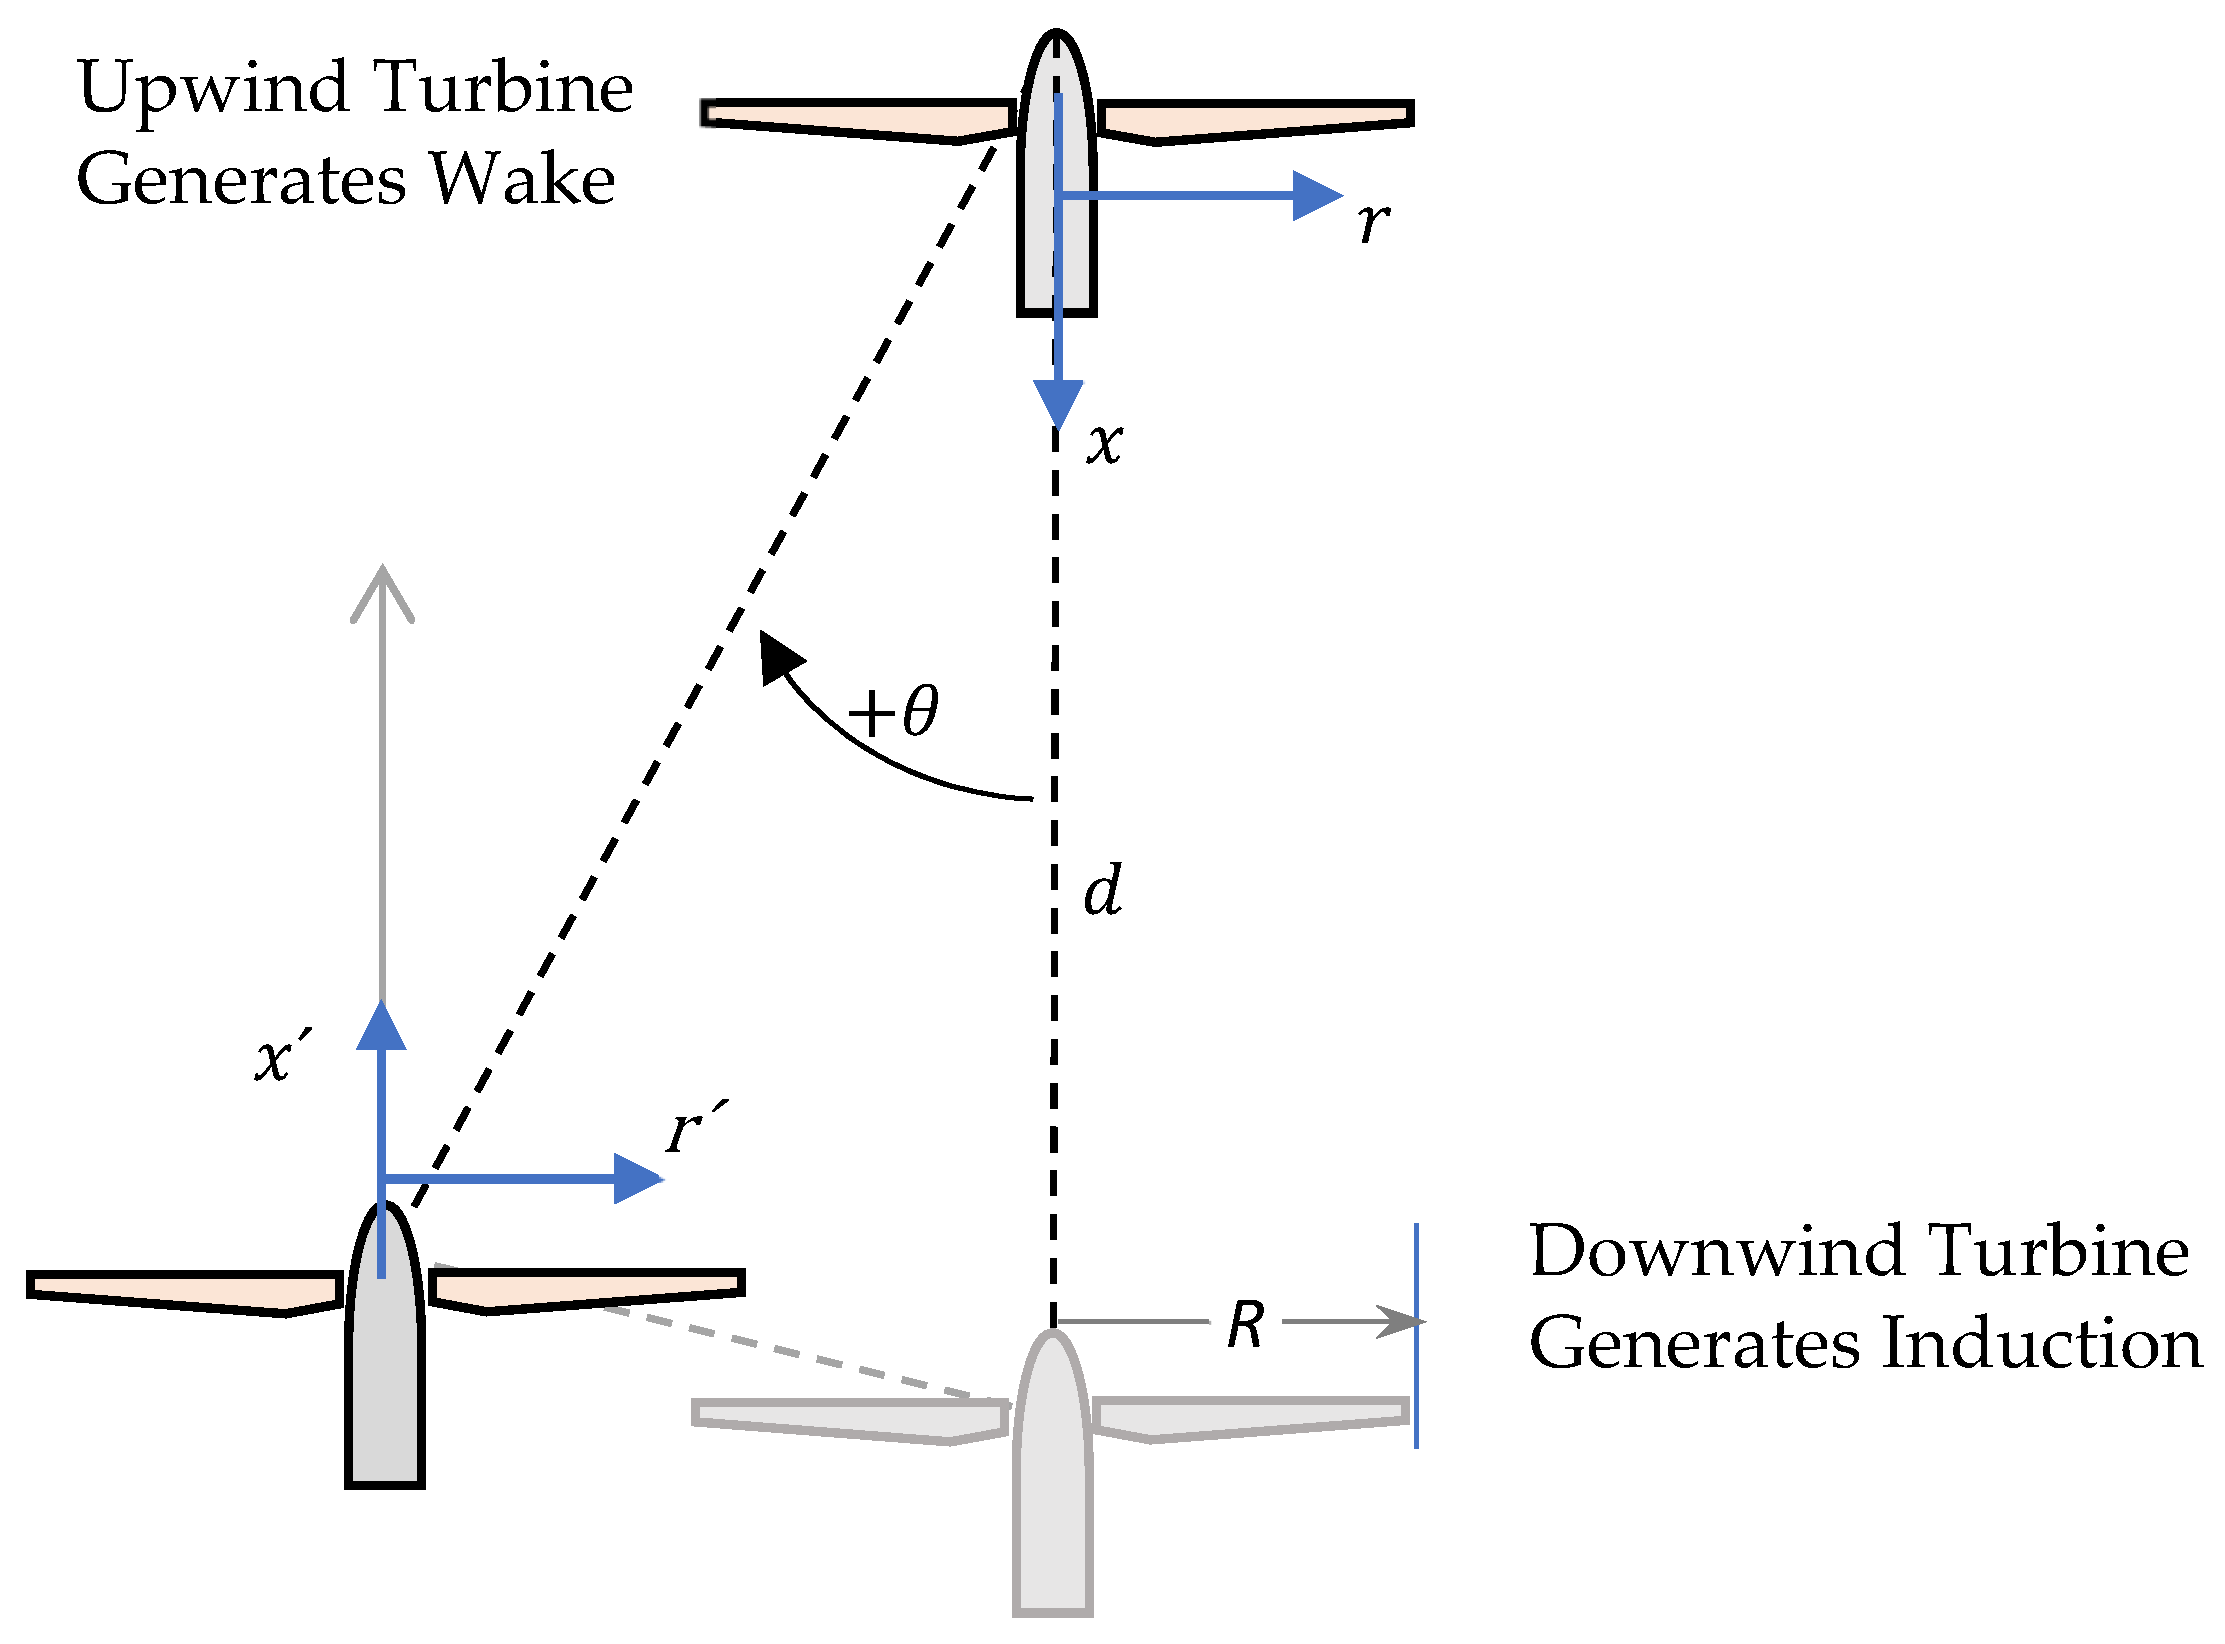
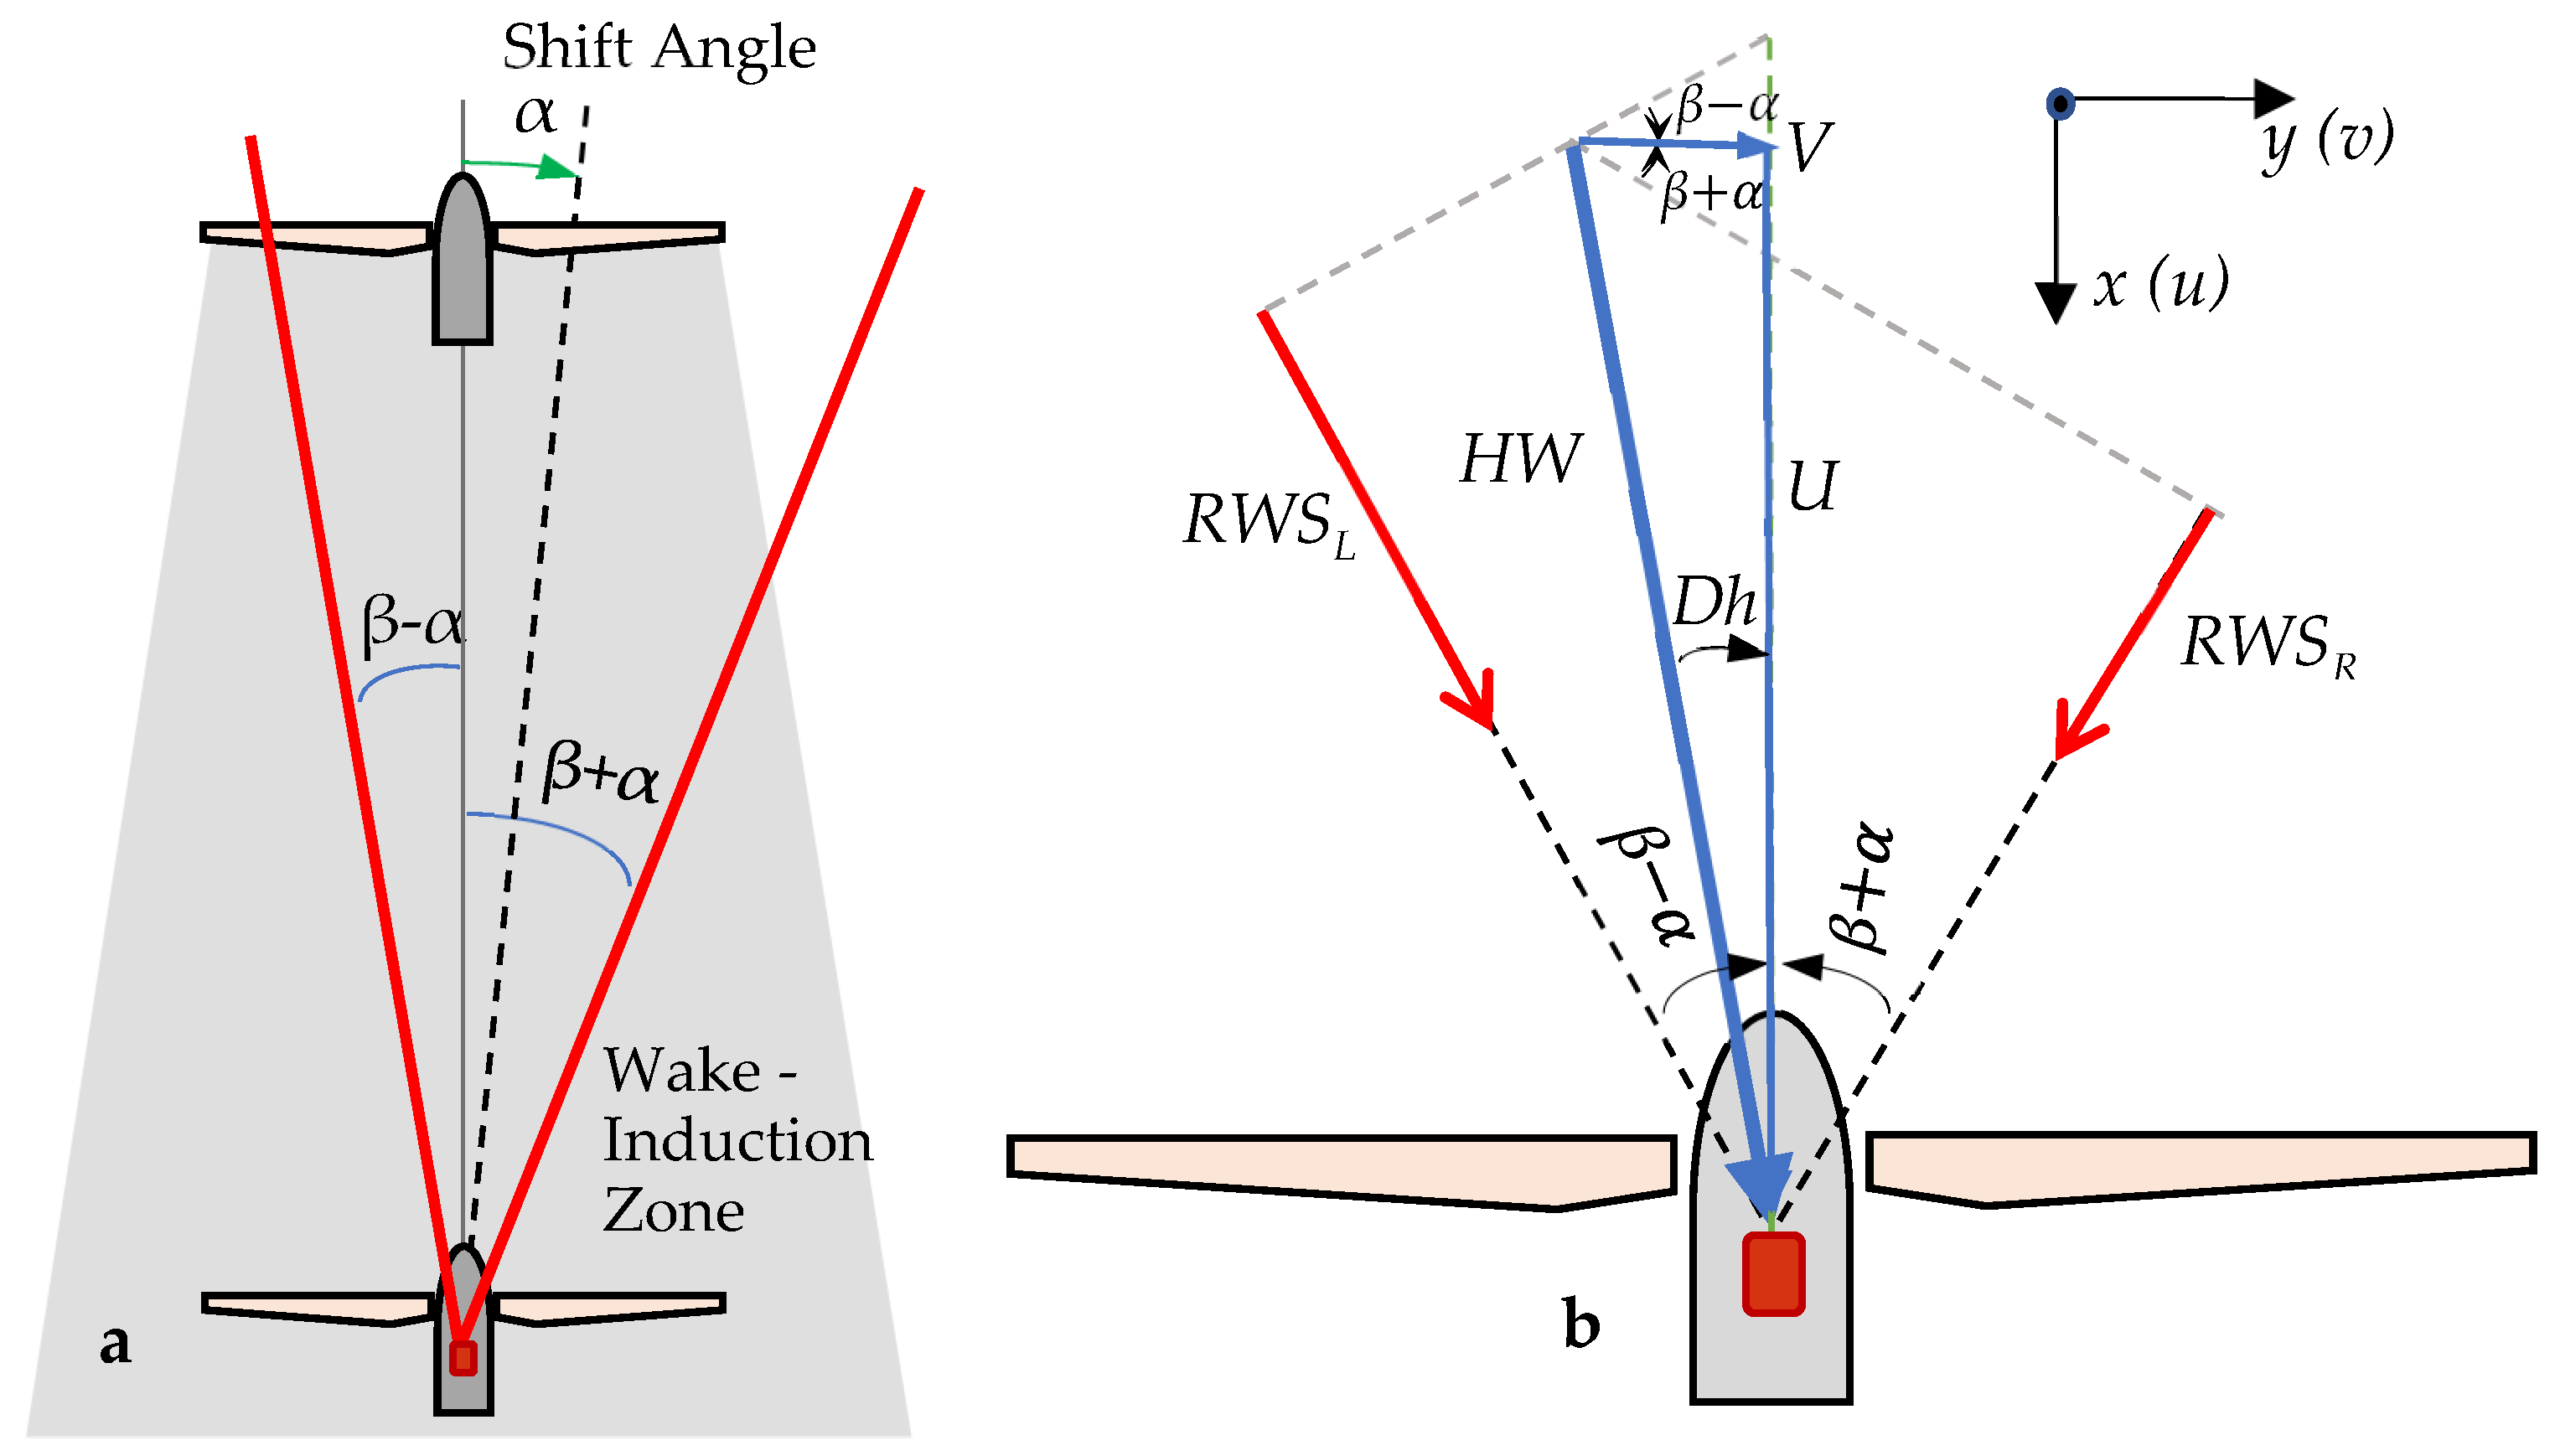
2.4. A Simple Interaction Model
2.5. Evaluation Methodology
3. Results and Discussion
4. Conclusions
Author Contributions
Funding
Data Availability Statement
Acknowledgments
Conflicts of Interest
References
- Thresher, R.; Robinsion, M.; Veers, P. Wind Energy Technology: Current Status and R&D Future; National Renewable Energy Lab. (NREL): Golden, CO, USA, 2008. [Google Scholar]
- Barthelmie, R.J.; Rathmann, O.; Frandsen, S.T.; Hansen, K.S.; Politis, E.; Prospathopoulos, J.; Rados, K.; Cabezón, D.; Schlez, W.; Phillips, J. Modelling and measurements of wakes in large wind farms. J. Phys. Conf. Ser. 2007, 78, 12049. [Google Scholar] [CrossRef]
- Jensen, N.O. A Note on Wind Generator Interaction; Risø National Laboratory Citeseer: Roskilde, Denmark, 1983; Volume 2411. [Google Scholar]
- Bastankhah, M.; Porté-Agel, F. A new analytical model for wind-turbine wakes. Renew. Energy 2014, 75, 116–123. [Google Scholar] [CrossRef]
- Bastankhah, M.; Porté-Agel, F. Experimental and theoretical study of wind turbine wakes in yawed conditions. J. Fluid Mech. 2016, 806, 506–541. [Google Scholar] [CrossRef]
- Shapiro, C.R.; Gayme, D.F.; Meneveau, C. Modelling yawed wind turbine wakes: A lifting line approach. J. Fluid Mech. 2018, 841, R1. [Google Scholar] [CrossRef]
- Gao, X.; Yang, H.; Lu, L. Optimization of wind turbine layout position in a wind farm using a newly-developed two-dimensional wake model. Appl. Energy 2016, 174, 192–200. [Google Scholar] [CrossRef]
- Qian, G.-W.; Ishihara, T. A New Analytical Wake Model for Yawed Wind Turbines. Energies 2018, 11, 665. [Google Scholar] [CrossRef]
- Larsen, G.C.; Madsen, H.A.; Bingöl, F.; Mann, J.; Ott, S.; Sørensen, J.N.; Okulov, V.; Troldborg, N.; Nielsen, M.; Thomsen, K.; et al. Dynamic Wake Meandering Modeling; Risø-R-1607; Risø National Laboratory: Roskilde, Denmark, 2007. [Google Scholar]
- Blondel, F.; Cathelain, M. An alternative form of the super-Gaussian wind turbine wake model. Wind Energy Sci. 2020, 5, 1225–1236. [Google Scholar] [CrossRef]
- Shapiro, C.R.; Starke, G.M.; Meneveau, C.; Gayme, D.F. A wake modeling paradigm for wind farm design and control. Energies 2019, 12, 2956. [Google Scholar] [CrossRef]
- Martínez-Tossas, L.A.; King, J.; Quon, E.; Bay, C.J.; Mudafort, R.; Hamilton, N.; Howland, M.F.; Fleming, P.A. The curled wake model: A three-dimensional and extremely fast steady-state wake solver for wind plant flows. Wind Energy Sci. 2021, 6, 555–570. [Google Scholar] [CrossRef]
- Bastankhah, M.; Shapiro, C.R.; Shamsoddin, S.; Gayme, D.F.; Meneveau, C. A vortex sheet based analytical model of the curled wake behind yawed wind turbines. J. Fluid Mech. 2022, 933, A2. [Google Scholar] [CrossRef]
- Mohammadi, M.; Bastankhah, M.; Fleming, P.; Churchfield, M.; Bossanyi, E.; Landberg, L.; Ruisi, R. Curled-Skewed Wakes behind Yawed Wind Turbines Subject to Veered Inflow. Energies 2022, 15, 9135. [Google Scholar] [CrossRef]
- Abkar, M.; Sørensen, J.N.; Porté-Agel, F. An analytical model for the effect of vertical wind veer on wind turbine wakes. Energies 2018, 11, 1838. [Google Scholar] [CrossRef]
- Sorensen, J.N.; Shen, W.Z. Numerical modeling of wind turbine wakes. J. Fluids Eng. 2002, 124, 393–399. [Google Scholar] [CrossRef]
- Mahmoodi, E.; Schaffarczyk, A.P. Actuator disc modeling of the MEXICO rotor experiment. In Wind Energy-Impact of Turbulence; Springer: Berlin/Heidelberg, Germany, 2014; pp. 29–34. [Google Scholar]
- Stein, V.P.; Kaltenbach, H.-J. Validation of a Large-Eddy Simulation Approach for Prediction of the Ground Roughness Influence on Wind Turbine Wakes. Energies 2022, 15, 2579. [Google Scholar] [CrossRef]
- Howland, M.F.; Quesada, J.B.; Martínez, J.J.P.; Larrañaga, F.P.; Yadav, N.; Chawla, J.S.; Sivaram, V.; Dabiri, J.O. Collective wind farm operation based on a predictive model increases utility-scale energy production. Nat. Energy 2022, 7, 818–827. [Google Scholar] [CrossRef]
- Forsting, A.R.M. Modelling Wind Turbine Inflow: The Induction Zone; DTU Wind Energy: Lyngby, Denmark, 2017. [Google Scholar] [CrossRef]
- Kidambi Sekar, A.P.; van Dooren, M.F.; Rott, A.; Kühn, M. Lower Order Description and Reconstruction of Sparse Scanning Lidar Measurements of Wind Turbine Inflow Using Proper Orthogonal Decomposition. Remote Sens. 2022, 14, 2681. [Google Scholar] [CrossRef]
- Conti, D.; Dimitrov, N.; Peña, A. Aeroelastic load validation in wake conditions using nacelle-mounted lidar measurements. Wind Energy Sci. 2020, 5, 1129–1154. [Google Scholar] [CrossRef]
- Borraccino, A.; Schlipf, D.; Haizmann, F.; Wagner, R. Wind field reconstruction from nacelle-mounted lidar short-range measurements. Wind Energy Sci. 2017, 2, 269–283. [Google Scholar] [CrossRef]
- Wagner, R.; Pedersen, T.F.; Courtney, M.; Antoniou, I.; Davoust, S.; Rivera, R.L. Power curve measurement with a nacelle mounted lidar. Wind Energy 2014, 17, 1441–1453. [Google Scholar] [CrossRef]
- Dimitrov, N.; Borraccino, A.; Peña, A.; Natarajan, A.; Mann, J. Wind turbine load validation using lidar-based wind retrievals. Wind Energy 2019, 22, 1512–1533. [Google Scholar] [CrossRef]
- Conti, D.; Dimitrov, N.; Peña, A.; Herges, T. Probabilistic estimation of the Dynamic Wake Meandering model parameters using SpinnerLidar-derived wake characteristics. Wind Energ. Sci. 2021, 6, 1117–1142. [Google Scholar] [CrossRef]
- Angelou, N.; Sjöholm, M. Data Reliability Enhancement for Wind-Turbine-Mounted Lidars. Remote Sens. 2022, 14, 3225. [Google Scholar] [CrossRef]
- Scholbrock, A.; Fleming, P.; Fingersh, L.; Wright, A.; Schlipf, D.; Haizmann, F.; Belen, F. Field Testing LIDAR-Based Feed-Forward Controls on the NREL Controls Advanced Research Turbine. Aerospace Sciences Meeting Including the New Horizons Forum and Aerospace Exposition; ARC: Grapevine, TX, USA, 2013; p. 818. [Google Scholar]
- Giyanani, A.; Bierbooms, W.; van Bussel, G.J.W. Estimation of rotor effective wind speeds using autoregressive models on Lidar data. J. Phys. Conf. Ser. 2016, 753, 072018. [Google Scholar] [CrossRef]
- Fleming, P.; Annoni, J.; Scholbrock, A.; Quon, E.; Dana, S.; Schreck, S.; Raach, S.; Haizmann, F.; Schlipf, D. Full-scale field test of wake steering. J. Phys. Conf. Ser. 2017, 854, 012013. [Google Scholar] [CrossRef]
- Adcock, C.; King, R.N. Data-driven wind farm optimization incorporating effects of turbulence intensity. In Proceedings of the 2018 Annual American Control Conference (ACC), Milwaukee, WI, USA, 27–29 June 2018; pp. 695–700. [Google Scholar]
- Giyanani, A.; Savenije, F.J.; Van Bussel, G.J.W. Correlation between Lidar measured wind speeds and aerodynamic loading. J. Phys. Conf. Ser. 2018, 1037, 052038. [Google Scholar] [CrossRef]
- Qu, C.; Lin, Z.; Han, X.; Wang, C.; Wu, Q.; Li, X.; Zhang, Z.; Gong, Y.; Jiang, G. Improved Data-Driven Yaw Misalignment Calibration of Wind Turbine via LiDAR Verification. In Proceedings of the Chinese Automation Congress 2020, Shanghai, China, 6–8 November 2020; pp. 5611–5616. [Google Scholar]
- Chen, Y.; Guo, F.; Schlipf, D.; Cheng, P.W. 4d wind field generation for the aeroelastic simulation of wind turbines with lidars. Wind Energy Sci. Discuss. 2021, 2021, 539–558. [Google Scholar]
- Rinker, J.M. Impact of rotor size on aeroelastic uncertainty with lidar-constrained turbulence. J. Phys. Conf. Ser. 2022, 2265, 032011. [Google Scholar] [CrossRef]
- Couto, A.; Justino, P.; Simões, T.; Estanqueiro, A. Impact of the wave/wind induced oscillations on the power performance of the WindFloat wind turbine. J. Phys. Conf. Ser. 2022, 2362, 012010. [Google Scholar] [CrossRef]
- Russell, A.J.; Collu, M.; McDonald, A.; Thies, P.R.; Mortimer, A.; Quayle, A.R. Review of LIDAR-assisted control for offshore wind turbine applications. J. Phys. Conf. Ser. 2022, 2362, 012035. [Google Scholar] [CrossRef]
- Iungo, G.V.; Wu, Y.-T.; Porté-Agel, F. Field measurements of wind turbine wakes with lidars. J. Atmos. Ocean. Technol. 2013, 30, 274–287. [Google Scholar] [CrossRef]
- Lundquist, J.K.; Churchfield, M.J.; Lee, S.; Clifton, A. Quantifying error of lidar and sodar Doppler beam swinging measurements of wind turbine wakes using computational fluid dynamics. Atmos. Meas. Tech. 2015, 8, 907–920. [Google Scholar] [CrossRef]
- Klaas, T.; Emeis, S. The five main influencing factors on lidar errors in complex terrain. Wind. Energy Sci. Discuss. 2021, preprint. [Google Scholar] [CrossRef]
- Li, X.; Qiu, Y.; Feng, Y.; Wang, Z. Wind turbine power prediction considering wake effects with dual laser beam LiDAR measured yaw misalignment. Appl. Energy 2021, 299, 117308. [Google Scholar] [CrossRef]
- Forsting, A.M.; Rathmann, O.S.; Laan, M.P.v.d.; Troldborg, N.; Gribben, B.; Hawkes, G.; Branlard, E. Verification of induction zone models for wind farm annual energy production estimation. J. Phys. Conf. Ser. 2021, 1934, 12023. [Google Scholar] [CrossRef]
- Branlard, E.; Gaunaa, M. Cylindrical vortex wake model: Right cylinder. Wind Energy 2015, 18, 1973–1987. [Google Scholar] [CrossRef]
- Branlard, E.S.P.; Forsting, A.R.M. Using a cylindrical vortex model to assess the induction zone infront of aligned and yawed rotors. In Proceedings of the EWEA Offshore 2015 Conference, Copenhagen, Denmark, 10–12 March 2015. [Google Scholar]
- Brugger, P.; Fuertes, F.C.; Vahidzadeh, M.; Markfort, C.D.; Porté-Agel, F. Characterization of Wind Turbine Wakes with Nacelle-Mounted Doppler LiDARs and Model Validation in the Presence of Wind Veer. Remote Sens. 2019, 11, 2247. [Google Scholar] [CrossRef]
- Keane, A.; Nisbet, I.; Calvo, G.; Pickering, G.; Tulloch, J.; More, G.; Koronka, N. Wind farm cumulative induction zone effect and the impact on energy yield estimation. Renew. Energy 2022, 181, 1209–1222. [Google Scholar] [CrossRef]
- Khanjari, A.; Mahmoodi, E.; Ahmadi, M.H. Energy and exergy analyzing of a wind turbine in free stream and wind tunnel in CFD domain based on actuator disc technique. Renew. Energy 2020, 160, 231–249. [Google Scholar] [CrossRef]
- Segalini, A. An analytical model of wind-farm blockage. J. Renew. Sustain. Energy 2021, 13, 33307. [Google Scholar] [CrossRef]
- Troldborg, N.; Meyer Forsting, A.R. A simple model of the wind turbine induction zone derived from numerical simulations. Wind Energy 2017, 20, 2011–2020. [Google Scholar] [CrossRef]


Disclaimer/Publisher’s Note: The statements, opinions and data contained in all publications are solely those of the individual author(s) and contributor(s) and not of MDPI and/or the editor(s). MDPI and/or the editor(s) disclaim responsibility for any injury to people or property resulting from any ideas, methods, instructions or products referred to in the content. |
© 2023 by the authors. Licensee MDPI, Basel, Switzerland. This article is an open access article distributed under the terms and conditions of the Creative Commons Attribution (CC BY) license (https://creativecommons.org/licenses/by/4.0/).
Share and Cite
Mahmoodi, E.; Khezri, M.; Ebrahimi, A.; Ritschel, U.; Chamorro, L.P.; Khanjari, A. A Simple Model for Wake-Induced Aerodynamic Interaction of Wind Turbines. Energies 2023, 16, 5710. https://doi.org/10.3390/en16155710
Mahmoodi E, Khezri M, Ebrahimi A, Ritschel U, Chamorro LP, Khanjari A. A Simple Model for Wake-Induced Aerodynamic Interaction of Wind Turbines. Energies. 2023; 16(15):5710. https://doi.org/10.3390/en16155710
Chicago/Turabian StyleMahmoodi, Esmail, Mohammad Khezri, Arash Ebrahimi, Uwe Ritschel, Leonardo P. Chamorro, and Ali Khanjari. 2023. "A Simple Model for Wake-Induced Aerodynamic Interaction of Wind Turbines" Energies 16, no. 15: 5710. https://doi.org/10.3390/en16155710
APA StyleMahmoodi, E., Khezri, M., Ebrahimi, A., Ritschel, U., Chamorro, L. P., & Khanjari, A. (2023). A Simple Model for Wake-Induced Aerodynamic Interaction of Wind Turbines. Energies, 16(15), 5710. https://doi.org/10.3390/en16155710