Article

Optimization of Flow Channel Design with Porous Medium Layers in a Proton Exchange Membrane Electrolyzer Cell

1
Department of Aeronautics and Astronautics, National Cheng Kung University, Tainan 701, Taiwan
2
Research Center for Smart Sustainable Circular Economy, Tunghai University, Taichung 407, Taiwan
3
Department of Mechanical Engineering, National Chin-Yi University of Technology, Taichung 411, Taiwan
4
Department of Energy Engineering, National United University, Miaoli 360, Taiwan
5
Department of Mechanical and Materials Engineering, Tatung University, Taipei 104, Taiwan
6
Institute of Building Environment and Sustainable Technology, School of Human Settlements and Civil Engineering, Xi’an Jiaotong University, Xi’an 710049, China
7
Lee Kong Chian Faculty of Engineering and Science, Tunku Abdul Rahman University, Kajang 43000, Malaysia
8
Hydrogen Energy Department, Low-Carbon Energy & Energy Storge Technology Division, Green Energy and Environment Research Laboratories, Industrial Technology Research Institute, Tainan 71150, Taiwan
*
Authors to whom correspondence should be addressed.
Energies 2023, 16(15), 5642; https://doi.org/10.3390/en16155642
Submission received: 17 June 2023 / Revised: 12 July 2023 / Accepted: 25 July 2023 / Published: 27 July 2023
(This article belongs to the Topic Sustainable Energy Technology, 2nd Volume)

Abstract

:
This study aims to optimize the flow channel design for a proton exchange membrane electrolyzer cell (PEMEC) to minimize the pressure drop across the cell. The pattern of parallel flow channels is considered with a dual-porous layer structure sandwiched between the flow channel plate and the catalyst layer. Four geometric factors are considered in the optimization analysis, including the width of the flow channel, the depth of the flow channel, the particle diameter of the large-pore porous layer, and the particle diameter of the small-pore porous layer. Computational fluid dynamics (CFD) is used to simulate the flow field, and based on the results of the CFD simulation, the Taguchi method is employed to analyze the optimal flow channel design. The importance of the factors is further analyzed by the analysis of variance (ANOVA) method. Three inlet velocities are assigned in the Taguchi analysis, which are 0.01, 0.1332, and 0.532 m/s, and then an orthogonal array is constructed and analyzed for each inlet flow condition. It is found that the optimal combination of the factors is the depth of the flow channel 1 mm, the width of the flow channel 3 mm, the particle diameter of the large-pore porous layer 0.212 mm, and the particle diameter of the small-pore porous layer 0.002 mm. The pressure drop across the PEMEC is minimized at the condition with the optimal combination of the factors. The ANOVA analysis shows that the depth of the flow channel exhibits the most significant impact on the pressure drop, while the other factors play minor roles only.

1. Introduction

In the last decade, the impact of global warming has become more apparent and an environmental crisis. One of the main reasons causing global warming is the wide employment of fossil fuels. Therefore, it is urgent to find clean alternatives to replace traditional fossil fuels [1,2,3]. For the possible clean energy sources, hydrogen has received much attention due to its great potential for practical applications. It possesses higher energy density than other types of fossil fuels, and the cost of developing hydrogen energy is affordable [4]. Numerous studies have been devoted to the mass production of hydrogen in the literature, in which the electrolysis method is an attractive way to produce hydrogen by splitting water into hydrogen and oxygen in a proton exchange membrane electrolyzer cell (PEMEC) [5,6,7]. In this device, a solid polymer electrolyte membrane (PEM) typically made of a fluorinated polymer (i.e., Nafion) is used to separate the cathode flow channel and the anode flow channel [8,9]. The water molecules can be split into hydrogen ions and oxygen gas by passing a current through the cell. The hydrogen ions are transported through the PEM to the cathode side of the cell, and the oxygen gas is released at the anode side simultaneously. The PEM is selective in allowing only protons to pass through while blocking the passage of electrons and other species [10,11]. The PEMEC has been used for various purposes, such as hydrogen production in fuel cell vehicles, energy storage, and industrial processes. It has also been considered a promising technology for hydrogen production from renewable energy sources, such as wind [12] and solar [13].
The usage of PEMEC for hydrogen production has many advantages. One is its high efficiency in hydrogen generation, which means that most of the supplied electrical energy into the cell could be converted into chemical energy stored in hydrogen gas [14]. In addition, the produced hydrogen has high purity, which is essential for many applications, such as fuel cells [15]. It can also operate at relatively low temperatures, typically between 50 °C [16] and 80 °C [17]. This characteristic reduces its energy consumption and enables the usage of inexpensive materials in the cell. It also makes it easier to start and stop the cell as needed. However, the PEMEC has one major demerit: low durability, with a short lifespan of around 10,000 h [18]. After that, the device needs to be replaced or refurbished, which increases the operating cost and reduces the technology’s economic viability.
The pressure drop across the water flow channel is one of the primary causes that may significantly affect the system’s durability. Excessive pressure drop can increase the mechanical stress inside the cell structure, resulting in a short lifespan [19]. An increase in pressure drop can also produce several adverse effects on the cell; for example, the transport of water from the bulk channel to the membrane depends on the difference in water concentration between these two sites. An increase in pressure drop indicates a lower pressure in the flow channels, which generally implies a lower concentration of water. As a result, the rate of water transport to the membrane would be reduced, which could lead to insufficient hydration and poor cell performance [20]. In addition, the heat generated during the reaction in the cell needs to be removed to maintain the cell temperature within a suitable range [21]. The heat transfer rate can be affected significantly by the pressure drop. In the study by Nie et al. [22], it was noted that due to the relatively high pressure drop within the inlet and outlet channels, the flow velocity tends to increase as the flow approaches the end of the channel, which leads to the occurrence of reverse flow within the channel. Hence, the overall fluid flow rate is reduced, which degrades the performance and durability of the cell. Furthermore, a higher pressure drop represents a greater pressure difference between the inlet and the outlet of the PEMEC. Because the pressure in the flow channel would affect the water transport rate through the porous layer to the membrane, the uniformity of electrolyte distribution would be worse under a higher pressure drop. It may also result in local flooding or drying out of the membrane. This phenomenon could lower the cell performance greatly [22]. In summary, the pressure drop across the water flow channel influences the water transport, heat transfer, and electrolyte distribution in a PEM electrolyzer cell. Therefore, it is essential to optimize the design of the water flow channel to minimize pressure drop and enhance cell performance and durability [23].
In the recent experimental study conducted by Kang et al. [24], they developed a dual-layer structure of a thin/tunable liquid/gas diffusion layer or porous transport layer (TT-LGDL/PTL) to improve the mass transport performance for a PEMEC. Their results revealed that the dual-layer structure presents smaller ohmic resistance and mass transport resistance. Consequently, the PEMEC performance could be enhanced significantly. The dual-layer structure consists of an ~830 μ m pore TT-LGDL/PTL stacking on a ~100 μ m pore TT-LGDL/PTL. They suggested that it is strongly feasible to raise the PEMEC efficiency by stacking the in-plane transport enhancement layer with large pore sizes onto a TT-LGDL/PTL with small pore sizes. However, they did not explore how the dual-layer porous structure affects the flow field and the pressure variation in the flow channel.
The flow field within a PEMEC is important as it governs the processes of mass transport and distribution within the cell. Numerous researchers have utilized computational fluid dynamics (CFD) simulations to offer insights and recommendations for design enhancements and optimization of parameters. Ruiz et al. [25] employed computational fluid dynamics (CFD) to simulate the pressure distribution across different flow paths and to analyze hydrogen generation. Nafchi et al. [26] conducted numerical simulations and identified that reducing the film thickness, channel height, and width can effectively decrease electrical pressure while improving overall efficiency. In another study, Tijani et al. [27] examined the hydrodynamic characteristics of three different flow plate designs, revealing that parallel flow channel configurations exhibited the most promising outcomes.
The optimal flow channel design with dual porous layers has also not been investigated yet. Accordingly, the present study intends to perform exploration to optimize flow channel design for a PEMEC with a dual porous-layer structure. The Taguchi method was employed to perform the analysis for optimization. This method has been widely used to determine the optimal operating parameters for a PEM electrolyzer cell system [28,29] or a PEM fuel cell system [30]. Toghyani et al. [28] used the Taguchi method to optimize the operating parameters for a PEMEC to decrease the required input voltage. They also employed the analysis of variance (ANOVA) method to evaluate the significance of each of the parameters, and the results showed that the anode exchange current density presents the most significant effect on the input voltage. Saikia et al. [29] considered the electrolyzer system integrated with a solar photovoltaic device and used the Taguchi method to optimize the hydrogen production rate. Several key operating parameters were selected in the analysis, and they found the hydrogen production rate could be raised dramatically after optimization. Chen et al. [30] used four methods, including the Taguchi and ANOVA, to optimize the PEM fuel cell stack’s inlet/outlet flow channel geometries. The results indicated the tube diameter is the most impactive factor on the pressure uniformity within the stack.
Because a uniform pressure distribution is quite important for a PEMEC to lengthen its lifespan, this study explores how to minimize the pressure drop across the flow channel by adjusting the geometric design of the flow channel and the geometric properties of the dual-layer porous structure. The flow field in the PEMEC is simulated by computational fluid dynamics (CFD). Then, the Taguchi method is used in the optimization analysis, and the impact of each selected parameter is evaluated by the analysis of variance (ANOVA) method. The results will benefit the enhancement of PEMEC performance.

2. Materials and Methods

2.1. CFD Model and Simulation

The anode side of a PEMEC was considered, which consists of a flow channel plate and a dual-layer structure of porous transport layer, as shown in Figure 1a,b. The pattern of parallel flow channels was used, and the catalyst layer was assumed to be an impermeable boundary on the bottom of the dual-layer porous structure. The dual-layer porous structure was constructed based on a reported study, [31], where the porous layer with large pores adjacent to the flow channel plate was approximated by a porous medium layer composed of particles with a larger diameter. The other porous layer with small pores was simulated by a porous medium layer composed of particles with a smaller diameter and sandwiched between the catalyst layer and the large-pore porous layer. The dimensions of the simulation domain were 67 mm × 67 mm × 2 mm, with the inlet and outlet positioned on diagonal corners. The width and depth of the flow channel would be adjusted to evaluate their effects in the analysis of the Taguchi method. The width of the ribs in the flow plate was fixed at 1 mm, and the widths of the inlet channel and outlet channel were 2.5 mm and 2 mm, respectively, based on the design of parallel flow channels [32]. Figure 1b illustrates the cross-sectional view of the flow channels with the porous layers, in which both the large-pore and small-pore porous layers have the same thickness of 0.05 mm as the dimensions used in another study [31].
The water flow was assumed to be a steady and incompressible flow. The continuity and momentum equations were given as follows:
· u = 0
ρ u · u = p + μ u + u T · I + F
where u is the velocity vector, ρ is the density, p is the pressure, μ is viscosity, I is a unit vector, and F is the body force vector acting on the fluid. For the flow in the dual-layer porous structure, Darcy’s law was used as the formula:
u = K μ ( p F )
where K is the permeability of the porous medium. The porosity, permeability, and effective mean particle diameter dp of the porous layer are correlated by the Carman–Kozeny equation [33] of the form:
K = d p 2 ε 3 180 1 ε 2
This equation is appropriate for the porous medium with approximately spherical particles. The flow field was simulated by COMSOL software (6.1), and the chemical reaction on the catalyst layer was ignored. The objective function in the analysis is the pressure drop across the PEMEC, which is expressed by:
P = P i n P o u t
where P i n and P o u t are the pressures at the flow channel plate’s inlet and outlet, respectively.

2.2. Validation and Grid Independence

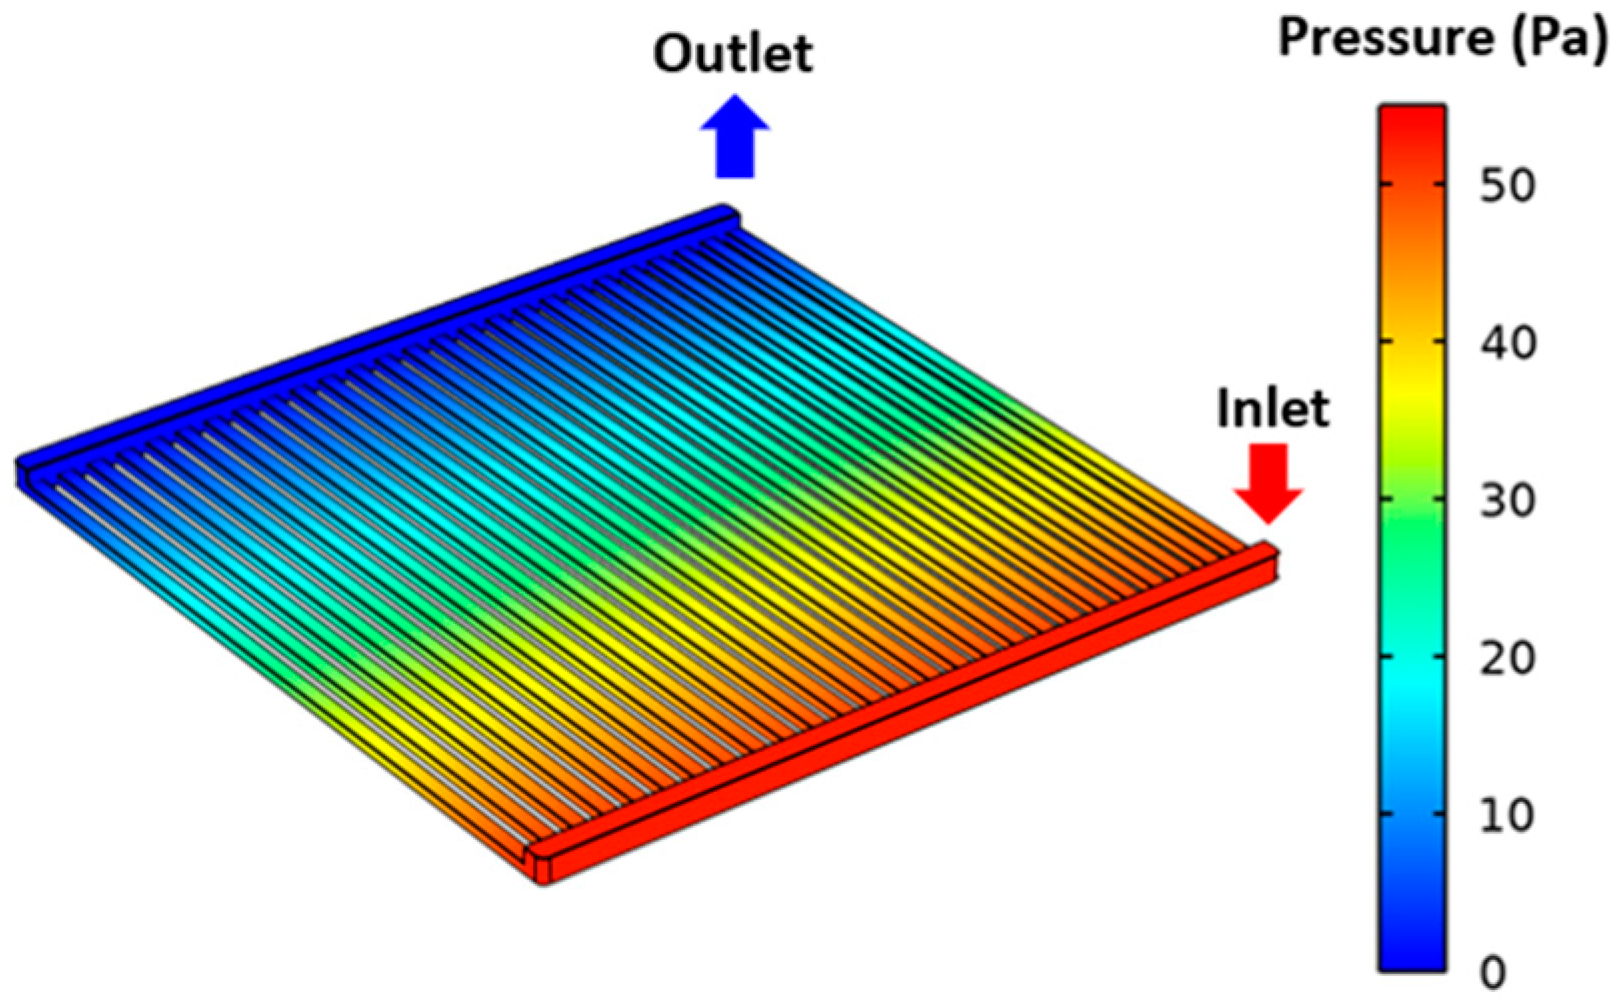
The accuracy of the numerical results was first verified by comparing the results with those of the study by Lin et al. [34]. A PEMEC model was constructed that is the same as the pattern of parallel flow channels built in the work of Lin et al. [34] without the design of a porous layer for comparison. The dimensions of the flow channel plate were 53 mm × 53 mm, and the channel width, channel depth, and rib width were all set to 1 mm. The direction of inlet flow was normal to the flow plate, and the flow rate was 50 mL‧min−1. The water flow at the outlet was assumed to be a natural outflow, and the flow also exited in the normal direction to the flow plate. Figure 2 shows the pressure distribution inside the flow channels. The result is consistent with the simulation of the study of Lin et al. [34], in which the predicted pressure drop across the flow plate is 49.75 Pa by the present model and 50 Pa in the study by Lin et al. [34]. The difference is less than 0.5%.
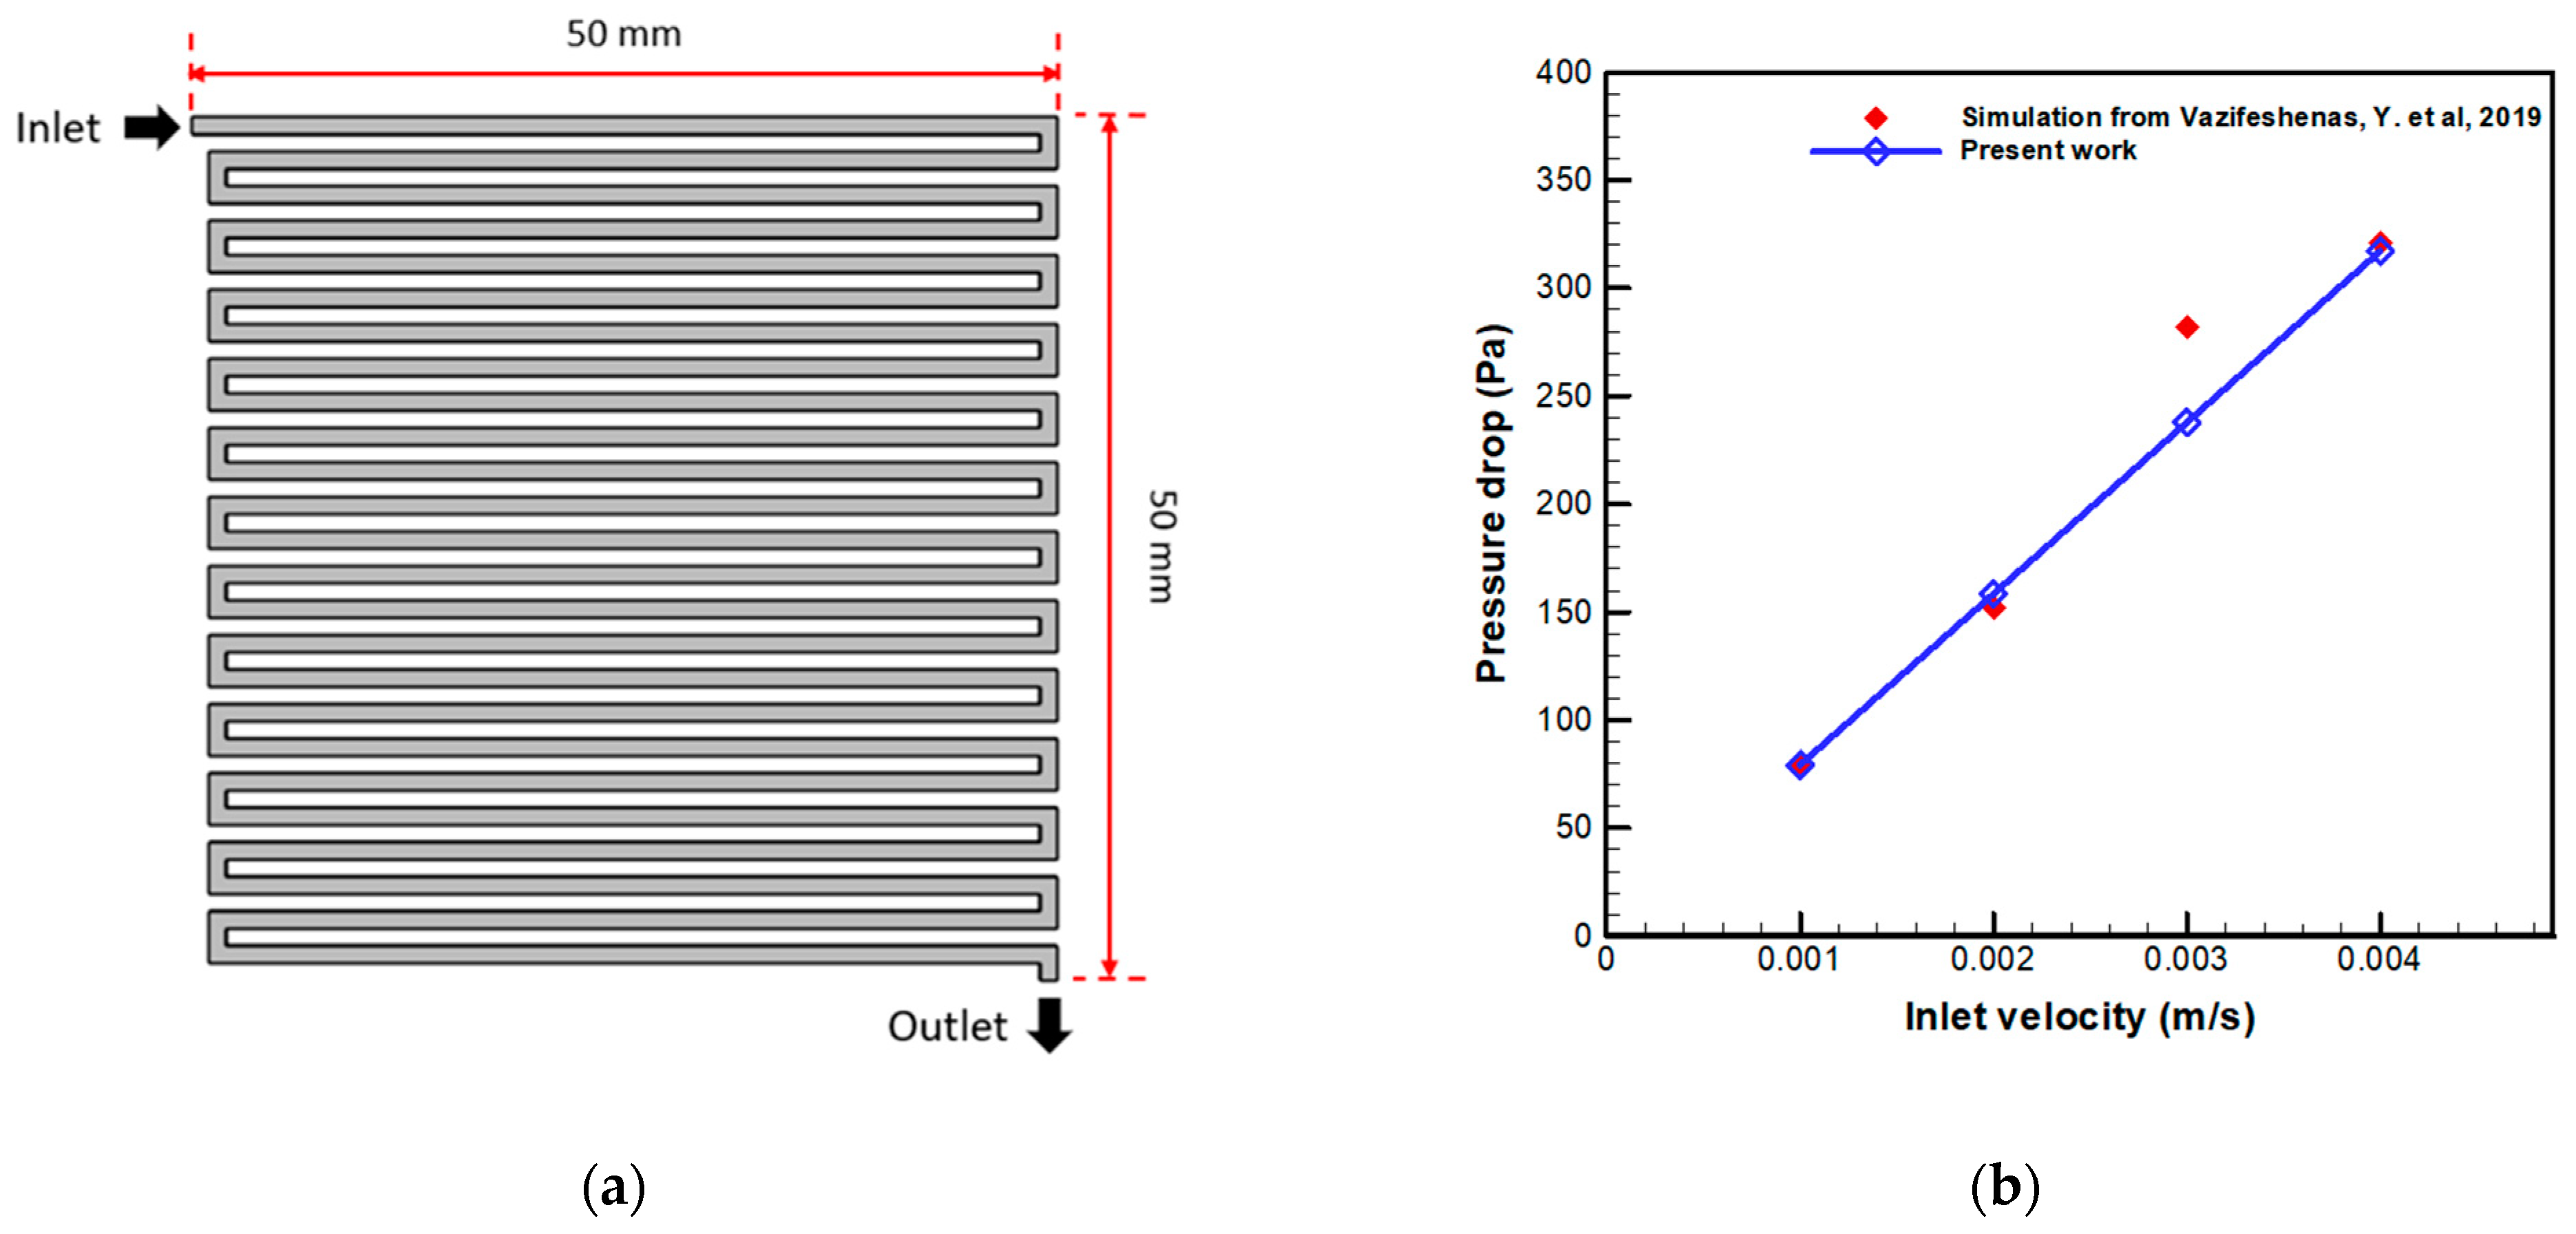
The model built by Vazifeshenas et al. [35] with a serpentine flow channel pattern was chosen to validate the water flow simulation in a porous medium, as shown in Figure 3a. The width of the square coolant plate is 50 mm, in which the channel width and rib width are 1 mm. The serpentine flow channel is filled with a high-porosity porous medium, where the porosity is 0.9, and the mean fiber diameter of the porous medium is 0.35 mm. Calculations were performed for four typical cases with different inlet flow velocities. The corresponding pressure drop for each case is shown in Figure 3b. In comparison with the results of Vazifeshenas et al. [35], it is found that the deviation of the predicted pressure drop across the porous serpentine flow channel is generally less than 5%, except in the case of inlet velocity 0.003 m/s, where the deviation is about 15%. The comparison indicates that the present numerical model is reliable and could successfully simulate the water flow in a porous channel.
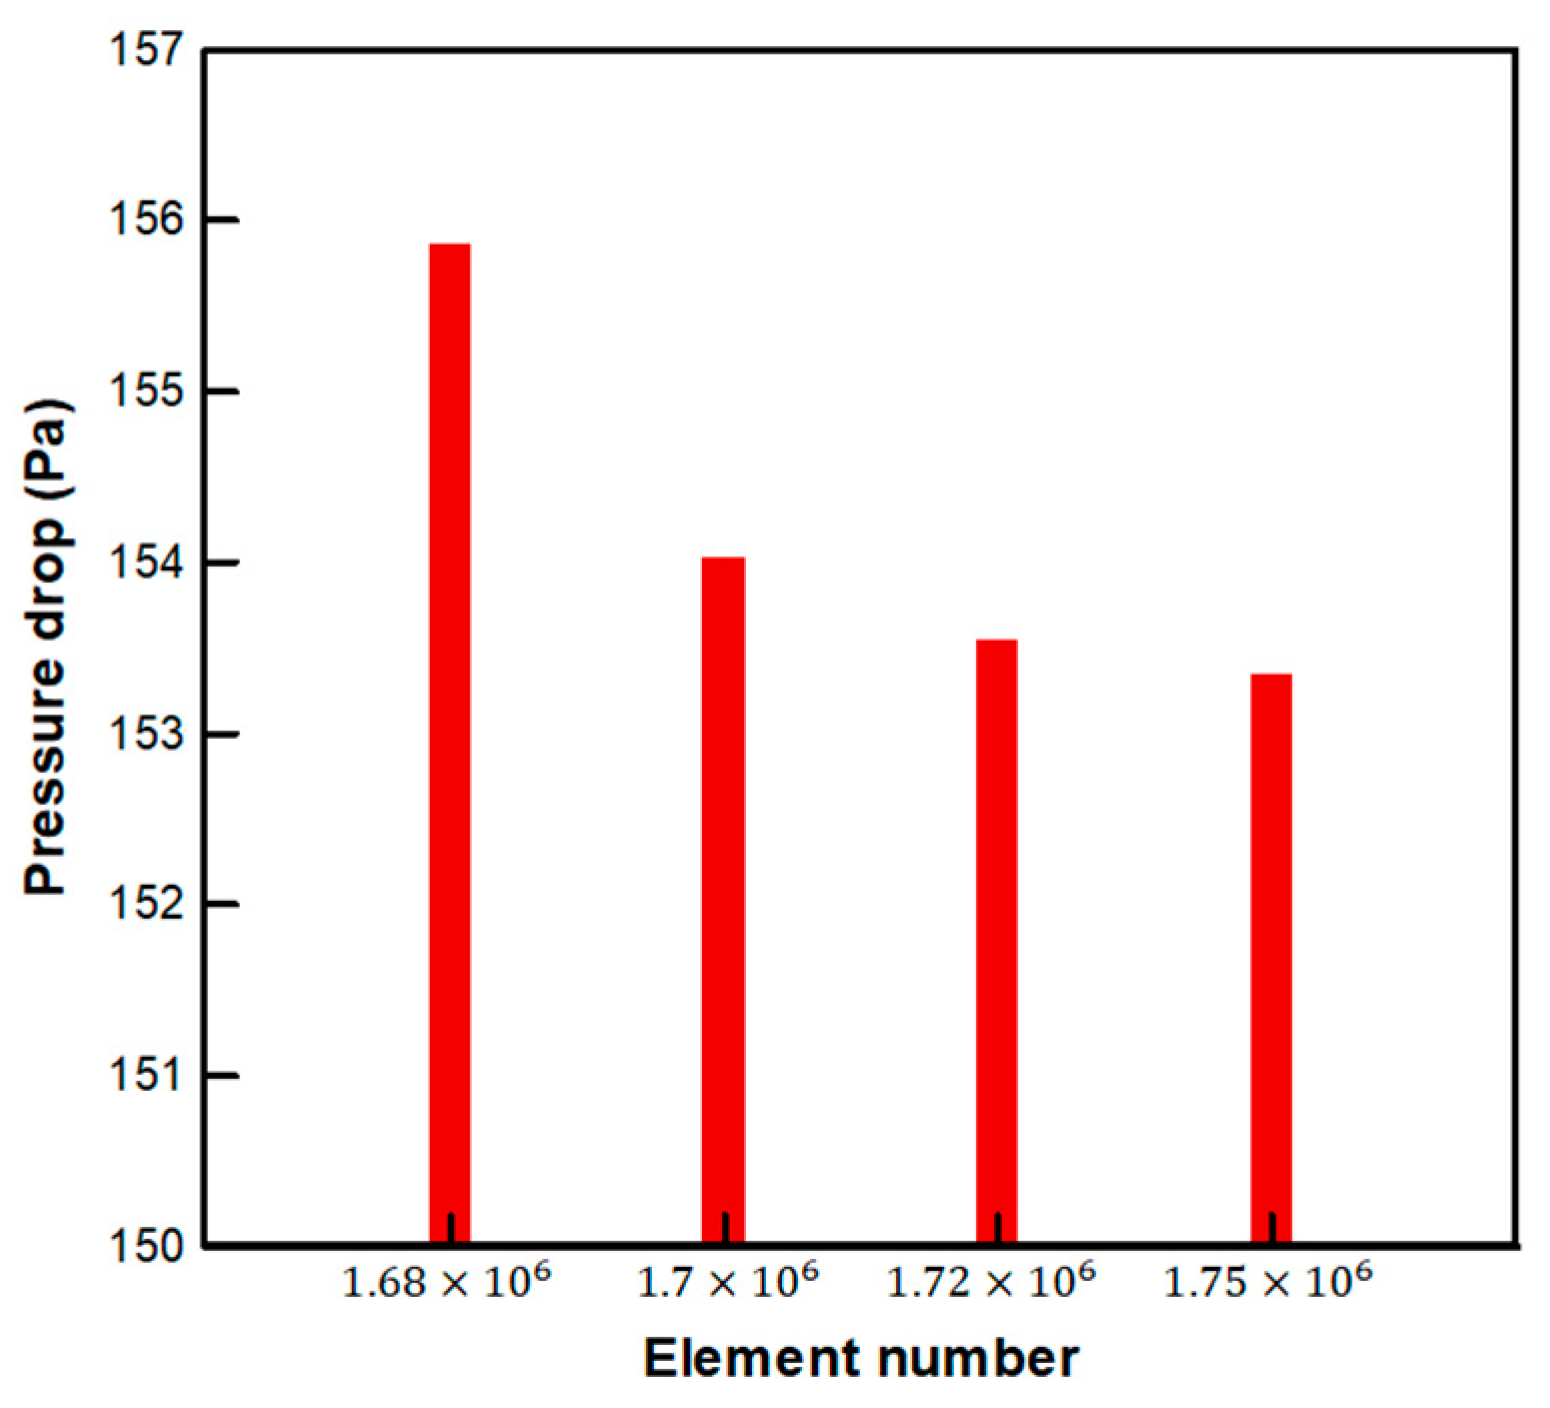
The grid independence test was also conducted to evaluate the mesh quality of the flow channel system. Here, we consider the typical case with 1 mm channel width, 1 mm channel depth, 180 μm of particle diameter for the large-pore porous layer, and 2 μm of particle diameter for the small-pore porous layer. At the inlet velocity of 0.1332 m‧s−1, we adjusted the number of elements and performed the numerical simulation to calculate the pressure drop across the flow channel plate. For the four typical element numbers of 1.6825 × 10⁶, 1.7008 × 10⁶, 1.7281 × 10⁶, and 1.7507 × 10⁶, the corresponding pressure drops are 155.87, 154.03, 153.56, and 153.35 Pa, respectively, as depicted in Figure 4. As the element number increases from 1.72 × 10⁶ to 1.75 × 10⁶, the variation in the pressure drop is less than 0.15%. Therefore, the mesh system with element number 1.72 × 10⁶ was selected and employed in the simulations.

2.3. Optimization with the Taguchi Method

The Taguchi method involves designing experiments to identify the optimal conditions of process variables that will result in a good output, which is the pressure drop across the flow channel of the PEMEC in the present study. An orthogonal array was constructed to select the appropriate combination of input variables or factors and to design the levels for testing. It is a mathematical tool that enables a researcher to test many variables with a minimum number of experiments. This study focuses on the geometric design, and the considered factors include the width of the flow channel, the depth of the flow channel, the particle diameter of the large-pore porous layer, and the particle diameter of the small-pore porous layer, which are denoted by the factors A, B, C, and D, respectively. The levels for each factor are listed in Table 1. Three levels were designed for each factor, resulting in 81 different combinations of the factors and levels. The L 9 orthogonal array, as listed in Table 2, gives the number of simulations needed for optimization.
The effects of the factor on the objective function were evaluated by the signal-to-noise (S/N) ratio. The Taguchi method has three types of the S/N ratio [31]. This work employed the type of smaller-the-better (SB) S/N ratio because the optimization goal was to minimize the pressure drop of the flow field. The definition is:
S N S B = 10 log Y 2
where Y is the objective function, standing for the pressure drop as defined in Equation (6). The S/N ratio for each run in the orthogonal array was calculated and used to evaluate the S/N ratios of the cases outside the orthogonal array. In this way, the optimal combination of the factors that produced the lowest pressure drop could be determined.

2.4. Analysis of Variance

The ANOVA method was used to explore the significance of each factor for the pressure drop of the PEMEC. The total variation attributable to the system factors could be determined by the sum of the squares of deviation (Si), defined as:
S i = 3 × j = 1 3 K i j y ¯ 2
where K i j is the pressure drop, i is the factor, j is level, and y ¯ is the mean pressure drop of the 9 runs [36]. The variance ratio test (also named the F-test) was then performed to detect and compare the significance of the factor. The following formula determined the F-value of each factor:
F t e s t = S i / f S f / N 1 f
where f is the degree of freedom, which is equal to the number of levels minus one, N is the total number of tests, and S f is the sum of the squares of errors calculated by the minimum value of each factor [37].

3. Results and Discussion

3.1. Flow Field Analysis and Pressure Distribution

The simulation result was explored based on the typical case R5, as listed in Table 2. The water flow channel’s depth and width are 1 mm, and the particle diameter for the large-pore and small-pore porous layers are 0.212 mm and 0.005 mm, respectively. For the boundary conditions, the inlet velocity was 0.1332 m·s−1, and the gauge pressure at the outlet was set to 0 Pa. The 2D velocity contour is shown in Figure 5 at the middle plane of the flow channels. When the water enters the inlet flow channel, most of the water flows along the entrance of the flow channel, and the flow velocity decreases gradually because some of the water flow passes through the parallel flow channels. It can be observed that the velocity magnitude in the inlet region is smaller than that in the outlet region, where the maximum velocity is about 0.13 m·s−1 in the inlet region and 0.3 m/s in the outlet region. The difference in the widths of the inlet and outlet flow channels mainly causes this phenomenon. It is also found that the flow speed in the parallel flow channels is slightly higher on the left side, and that the jet flow structure is prominently observed in the outlet channel, particularly for the flow channels located near the inlet side. This phenomenon has also been documented in previous studies [38].
The 3D pressure contour for this typical case in the flow channels is shown in Figure 6a. The highest pressure is 172.3 Pa, which occurs at the inlet boundary. The pressure decreases gradually along the flow channels to 0.4 Pa at the outlet boundary. Note that the pressure at the outlet boundary is set to zero, while the pressure of 0.4 Pa is the mean pressure in the interior region close to the outlet boundary. The inlet pressure in the flow field is higher than the outlet pressure, which aligns with findings from similar studies on flow fields [38,39]. The pressure drop is more significant within the inlet and outlet flow channels, at about 90 Pa throughout the channel. But the pressure drop in the parallel flow channels is generally less than 40 Pa in each channel. For the dual-porous layer, the structure is adjacent to the flow channel plate. Hence, the flow in the channels would penetrate into the dual-porous layer structure. The distribution of pressure in both porous layers is similar to that in the flow channels, as shown in Figure 6b, for the pressure profile within the large-pore porous layer. The pressure difference between the flow channel and the porous layers in the normal direction to the flow channel plane is insignificant because the thicknesses of the porous layers are quite small.

3.2. Orthogonal Array and Taguchi Analysis

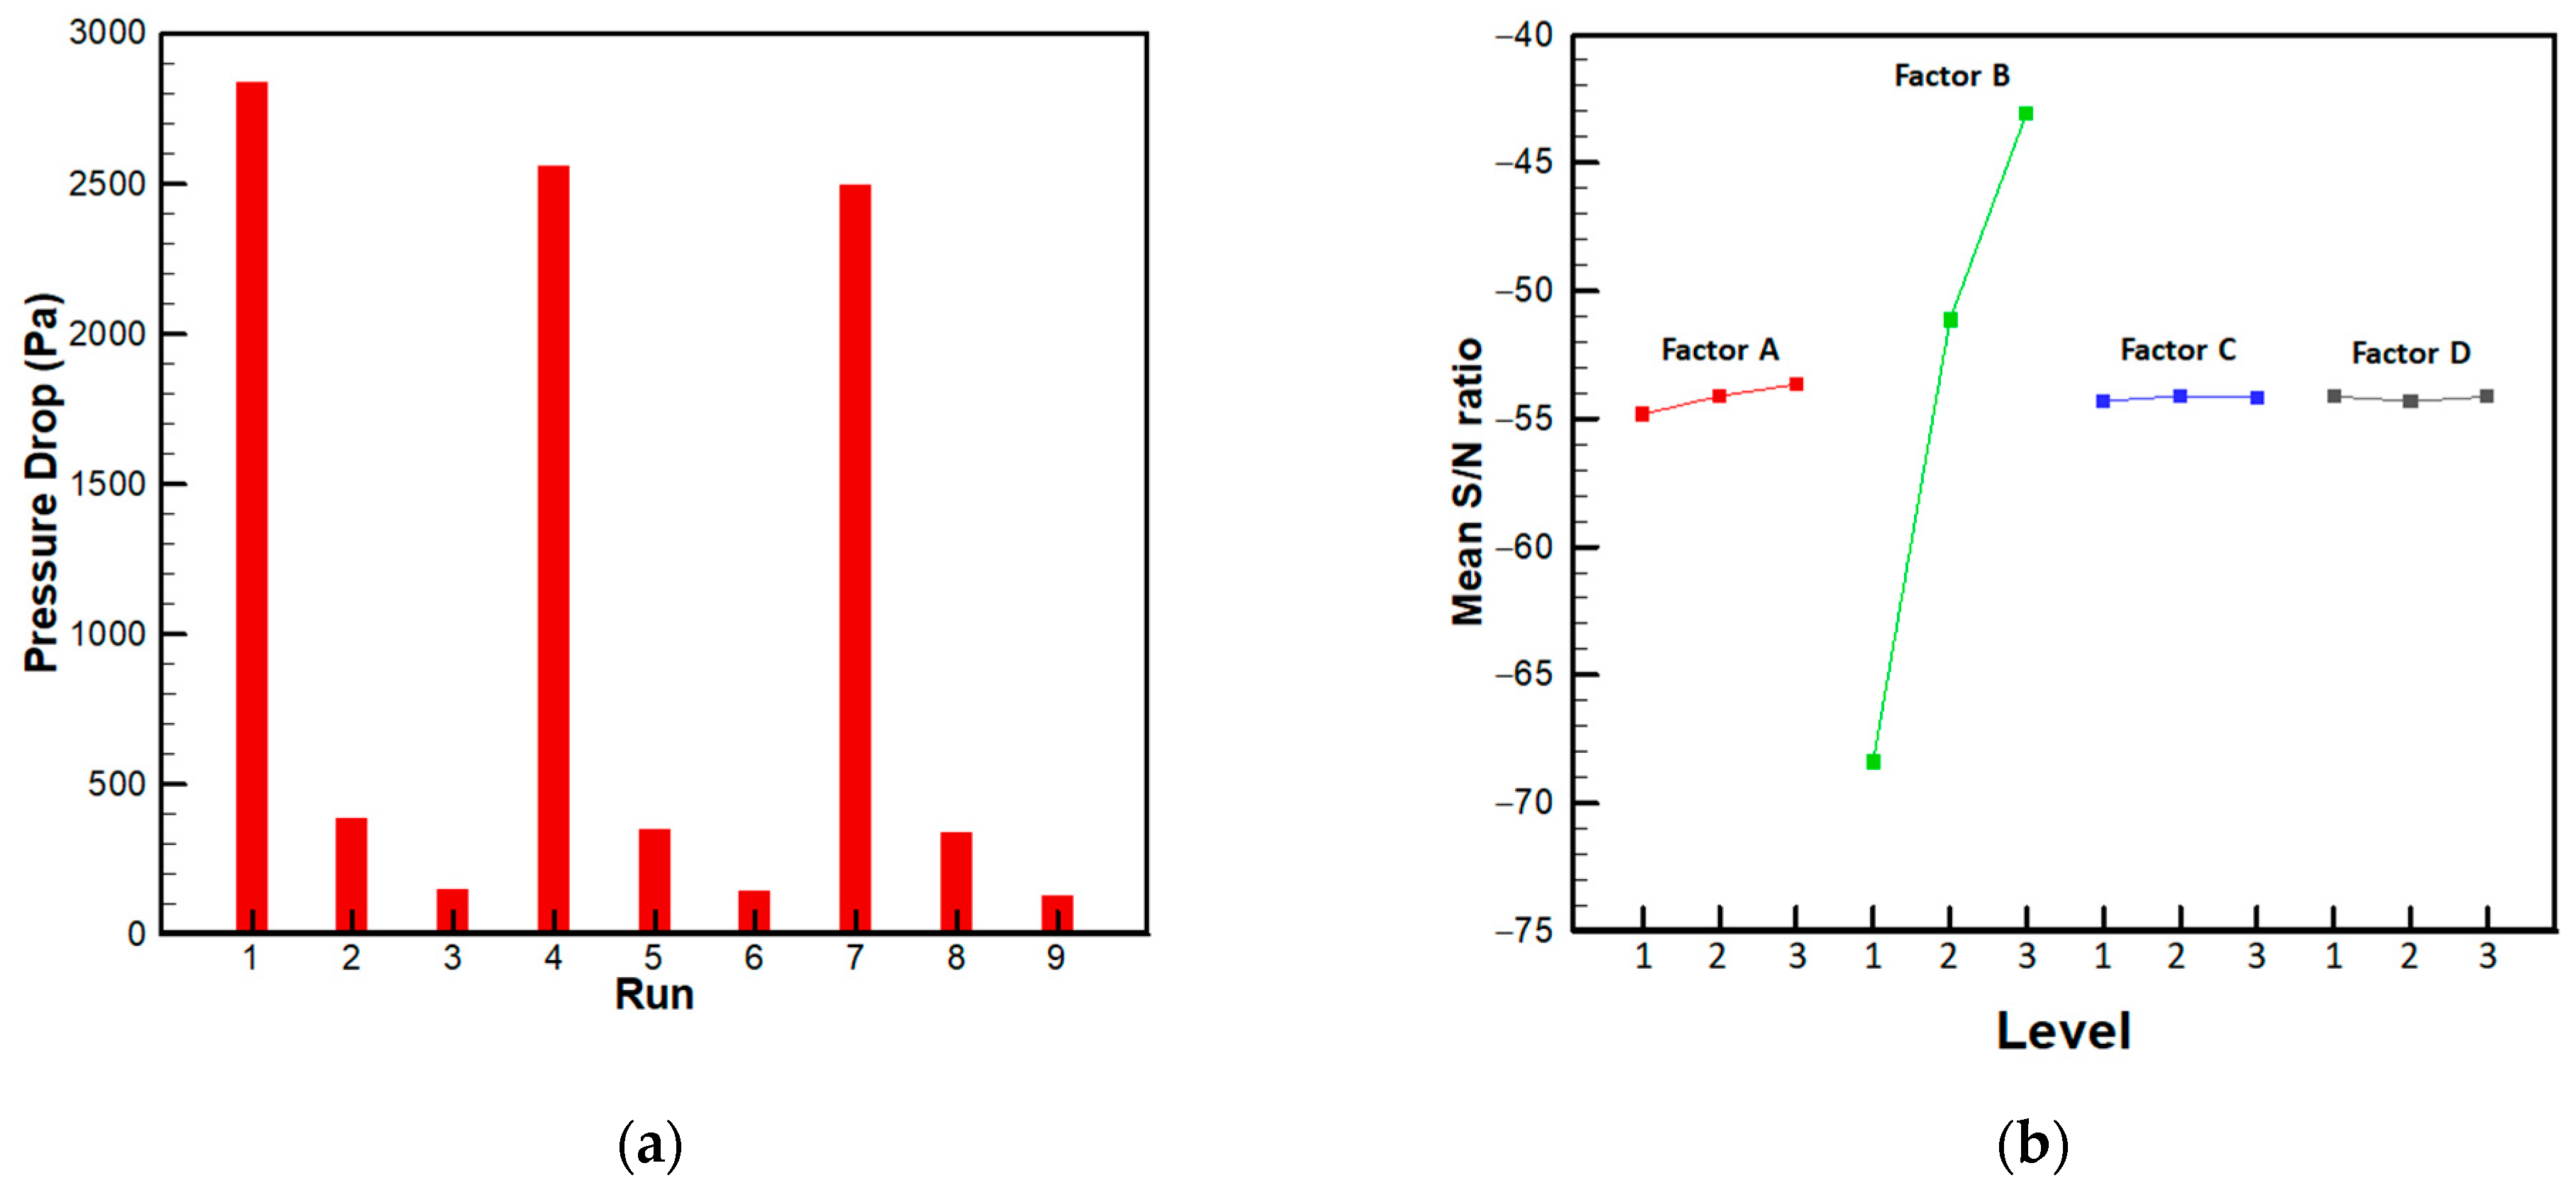
To determine the influence of each factor on the objective functions, the Taguchi method was used as design of experience [40], and using an orthogonal array significantly reduced the required number of experiments [41]. The Taguchi method designed and analyzed the L9 orthogonal array, as listed in Table 2, to obtain the optimal conditions that lead to the minimum pressure drop. The simulations of the L9 orthogonal array were performed under the boundary conditions of the flow velocity 0.1332 m·s−1 at the inlet, and the gage pressure was 0 Pa at the outlet. The water flows through the parallel flow channels and can be transported to the catalyst layer through the large- and small-pore porous layers. The pressure drop for each run in the L9 orthogonal array is shown in Figure 7a. The results were then used to calculate the S/N ratio of each run. A lower pressure drop will result in a higher S/N ratio, preferable in the present analysis. It is found that the run R9 gives the highest S/N ratio in the orthogonal array. The variation of the mean S/N ratio for each factor with the level is shown in Figure 7b. The average S/N ratio of Factor A at Level 1 for pressure drop is calculated as −54.8, derived from the mean of R1 (−69.1), R2 (−51.8), and R3 (−43.6) [30]. The optimal combination of the factors with the highest S/N ratio exists outside the orthogonal array. The corresponding levels are as follows: the depth of the flow channel of 1 mm, the width of the flow channel of 3 mm, the particle diameter of the large-pore porous layer of 0.212 mm, and the particle diameter of the small-pore porous layer of 0.002 mm. This model exhibits the lowest pressure drop of 129.25 Pa.
The same simulation procedures for the orthogonal array were also performed at different inlet flow velocities. At a lower flow velocity of 0.01 m·s−1, the pressure drops for the nine runs are shown in Figure 8a. The minimum pressure drop still occurs at run R9 at only 7.26 Pa. According to the mean S/N ratio for each level, as shown in Figure 8b, the optimal combination of the geometric factors is still the same as that of the case with the inlet velocity of 0.1332 m·s−1, which leads to a pressure drop of 6.91 Pa. The difference in the pressure drop before and after optimization is relatively insignificant because the pressure drop is small under such a low inlet velocity condition. Hence, the improvement in the pressure drop is limited.
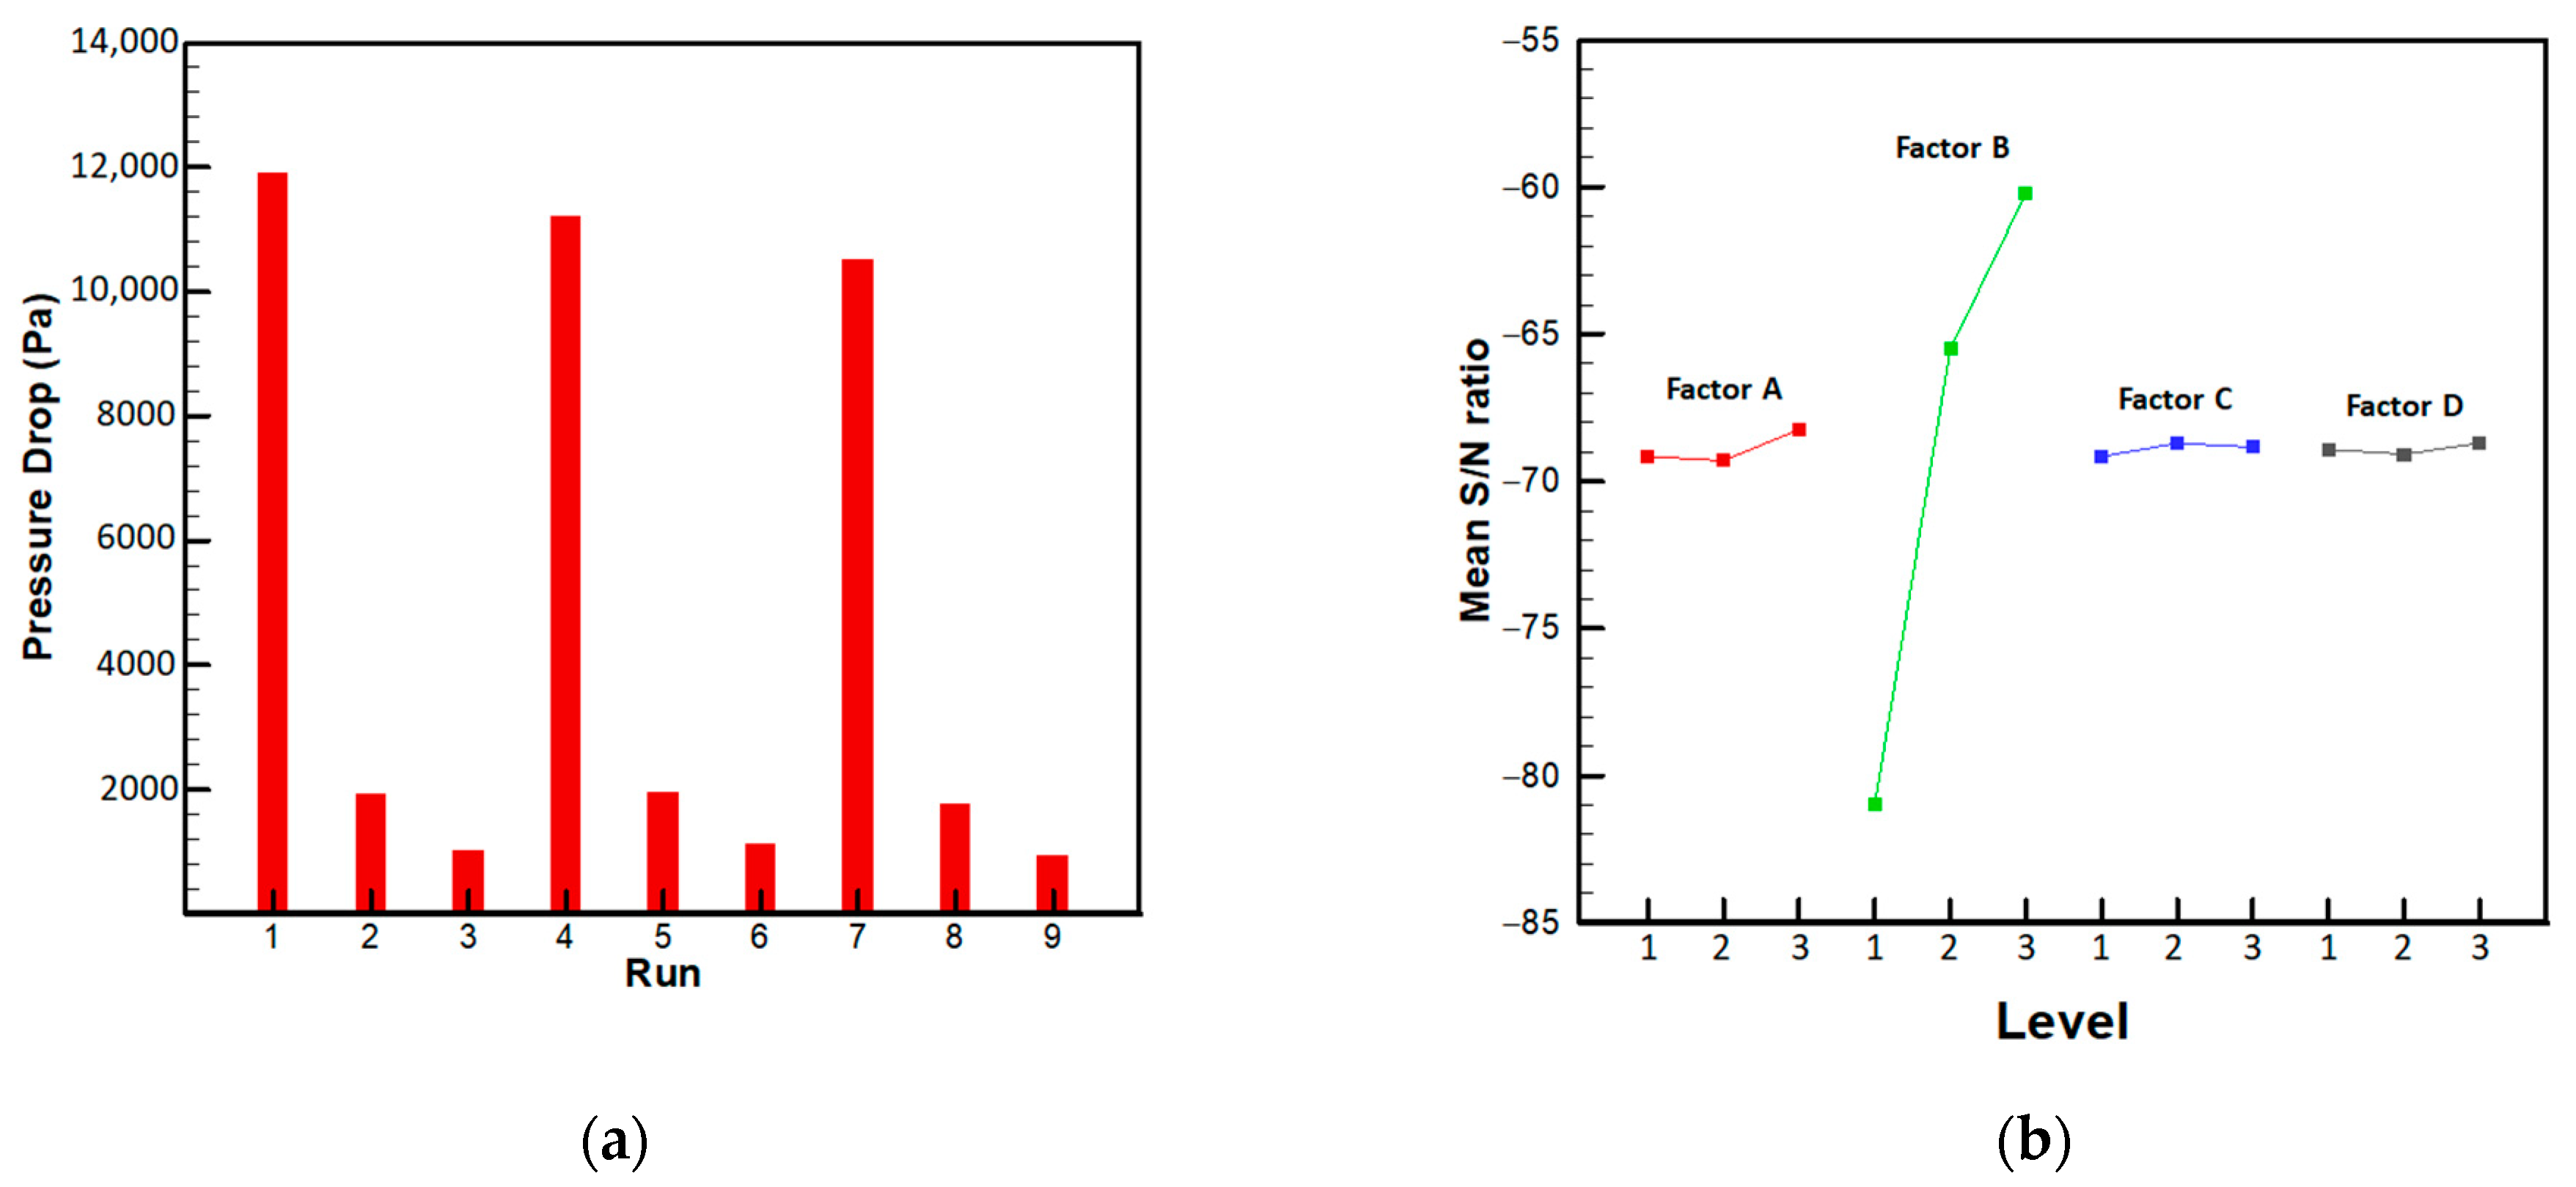
On the other hand, the model was further tested at a higher inlet velocity of 0.532 m·s−1. The corresponding pressure drop for each run is shown in Figure 9a. The lowest pressure drop is 930.6 Pa, which is still dominated by the run R9. It is seen that the difference in pressure drop between the typical runs is significant at a higher inlet velocity, where the pressure drop rises to 11,911.8 Pa for run R1. Based on the results of the mean S/N ratios shown in Figure 9b, the optimal combination of the factors is the same as both of the previous cases, except for Factor D, for which the particle diameter of the small-pore porous layer changes to 0.007 mm, where the minimum pressure drop is 902.3 Pa.
The effect of each factor on the pressure drop is demonstrated in Figure 10a–c for the three assigned inlet velocities. The effect is calculated by the S/N ratio in the Taguchi method. The average S/N ratio is first calculated for each level of the specified factor, and then the difference between the maximum and minimum average S/N ratios of the factor is determined as the effect of the factor on the objective function. It is found that the flow channel depth is always the most significant factor and the next is the factor of flow channel width. The effects of Factors C and D are relatively insignificant. The pressure drop in the flow channel depends heavily on the friction factor and the hydraulic diameter. As the hydraulic diameter increases, the Reynolds number would also increase, which results in a smaller friction factor and lower pressure drop. This effect is more significant as the flow channel depth increases. The optimal flow channel depth and width equal 3 mm for the three selected inlet velocities, which present the minimum pressure drop across the PEMEC. For Factors C and D, the optimal particle diameter of the large-pore and small-pore porous layers could vary, which may depend on the inlet flow velocity. But, their effects play minor roles only.

3.3. Analysis of Variance (ANOVA)

The ANOVA method was used to estimate the influence of the selected factors and to identify the important factors that would affect the pressure drop significantly in a PEMEC. The results for the inlet velocities of 0.01, 0.1332, and 0.532 m‧s1 are listed in Table 3, Table 4 and Table 5, respectively. In these tables, the F-value is the mean square for the term divided by the mean square for the residual. Therefore, a higher F-value indicates the factor possesses a stronger influence on the objective function. On the contrary, the p-value exhibits an inverse relationship with the F-value, where a lower p-value indicates the factor is more significant. Referring to the results of the Taguchi analysis, the influence of Factor D is relatively lower. Hence, this factor is counted as the residual to provide a sufficient degree of freedom for the calculations of F-values for the other factors. According to the critical value table of F α [42], where α denotes the false-rejection probability, under 2° of freedom for the sum of the square of treatment and 6° of freedom for the sum of the square of error, the critical values are F 0.1 = 3.46, F 0.05 = 5.14, and F 0.01 = 10.92. Therefore, the factor’s influence is slight if the F-value is less than 3.46, and the influence is substantial if the F-value is greater than 10.92. In all three conditions with different inlet velocities, the F-value for the factor of flow channel depth is always much higher than 10.92. This result implies that Factor B significantly influences the pressure drop across the flow channels of the PEMEC. For the other factors, however, the corresponding F-values are all less than 3.46, indicating their effects on the objective function are insignificant and can almost be ignored.
The effect of the selected factor could also be evaluated by the percentage of contribution of the factor estimated by the ratio of the corresponding value of the sum of square (SS) to the sum of all the SS values [43]. According to the data in Table 3, Table 4 and Table 5, Factor B presents the major dominant factor, in which the percentage is over 99% in the three cases. The contributions of Factor A are between 0.25% and 0.3%, and the percentages of Factor C and Factor D are generally less than 0.16%. As the inlet velocity increases from 0.01 m‧s−1 to 0.532 m‧s−1, the contribution of Factor B increases slightly, while the contribution of Factor A tends to decrease gradually. This character indicates the influence of the factors can be affected by the variation of the inlet boundary condition.
The ANOVA method presents results that are as consistent as the Taguchi method, where the rank for the factors’ influence is flow channel depth > flow channel width > large-pore porous layer > small-pore porous layer. Notably, the flow channel depth (Factor B) is the main factor for the pressure drop within the PEMEC flow channel plate.

4. Conclusions

The present study utilizes the Taguchi and ANOVA methods to examine how the geometric factors affect the pressure drop across the flow channels of a PEMEC. The flow pattern of parallel channels was considered with a dual porous-layer structure between the flow channel plate and the catalyst layer. Based on the CFD results and the following the Taguchi analysis, it is found that the flow channel geometry and the pore sizes of the porous layers may affect the pressure drop of the PEMEC. However, the pressure drop seems to be dominated by the factor of flow channel depth. The other factors, including the flow channel width and the pore sizes of the porous layers, play minor roles only. The results of ANOVA analysis also show that the flow channel depth displays the most significant influence on the pressure drop, and its effect increases with increasing the inlet velocity. The impact of the other factors appears to be negligible. The optimal combination of the factors’ levels is found to be 1 mm of the depth of the flow channel, 3 mm of the width of the flow channel, 212 μm of the particle diameter of the large-pore porous layer, and 2 μm of the particle diameter of the small-pore porous layer. With these geometric conditions, the model of PEMEC exhibits a minimum pressure drop. However, as the inlet velocity increases to 0.532 m·s−1, the optimal level for the particle diameter of the small-pore porous layer changes to 7 μm. This result indicates the optimal design may vary and depend on the inlet flow velocity. Further studies that take the effects of electrochemical reaction and mass transport through the porous layer will be helpful for the understanding of optimal design for the flow channel structure of a PEMEC.

Author Contributions

Conceptualization, W.-H.C.; methodology, Y.-S.W.; software, W.-H.C.; validation, Y.-S.W. and M.-H.C.; formal analysis, Y.-S.W. and M.-H.C.; investigation, W.-H.C., Y.-S.W., M.-H.C., L.J., L.H.S., C.-C.L. and C.-Y.H.; resources, W.-H.C.; data curation, Y.-S.W.; writing—original draft preparation, Y.-S.W.; writing—review and editing, Y.-S.W. and M.-H.C.; visualization, Y.-S.W.; supervision, W.-H.C.; project administration, W.-H.C.; funding acquisition, W.-H.C. All authors have read and agreed to the published version of the manuscript.

Funding

This research was funded by the financial support from the Bureau of Energy, Ministry of Economic Affairs, Taiwan, ROC, under contract number 112-D0111 for this research.

Data Availability Statement

Data are unavailable due to privacy.

Conflicts of Interest

The authors declare no conflict of interest.

Nomenclature

F External force acting on the fluid (N)
F t e s t Variance ratio test
f Degree of freedom
I Unit vector
k Permeability of the porous media (m2)
N Number of tests
P i n Inlet pressure (Pa)
P o u t Outlet pressure (Pa)
P Pressure drop (Pa)
p Pressure (Pa)
S i Squares of deviation
S / N S B Signal-to-noise ratio; smaller is better
u Fluid velocity vector (m · s−1)
Greek letters
β F Drag coefficient
ε p Porosity
ρ Fluid density (kg · m−1)
μ dynamic viscosity (Pa · s)

References

  1. Baykara, S.Z. Hydrogen: A brief overview on its sources, production and environmental impact. Int. J. Hydrogen Energy 2018, 43, 10605–10614. [Google Scholar] [CrossRef]
  2. Chen, W.-H.; Chen, C.-Y. Water gas shift reaction for hydrogen production and carbon dioxide capture: A review. Appl. Energy 2020, 258, 114078. [Google Scholar] [CrossRef]
  3. Bockris, J.O.M. The hydrogen economy: Its history. Int. J. Hydrogen Energy 2013, 38, 2579–2588. [Google Scholar] [CrossRef]
  4. Nikolaidis, P.; Poullikkas, A. A comparative overview of hydrogen production processes. Renew. Sustain. Energy Rev. 2017, 67, 597–611. [Google Scholar] [CrossRef]
  5. Colella, W.; O’Hayre, R.; Cha, S.-W.; Prinz, F.B. Fuel Cell Fundamentals; John Wiley: Hoboken, NJ, USA, 2009. [Google Scholar]
  6. Neef, H.-J. International overview of hydrogen and fuel cell research. Energy 2009, 34, 327–333. [Google Scholar] [CrossRef]
  7. Villagra, A.; Millet, P. An analysis of PEM water electrolysis cells operating at elevated current densities. Int. J. Hydrogen Energy 2019, 44, 9708–9717. [Google Scholar] [CrossRef]
  8. Lamy, C. From hydrogen production by water electrolysis to its utilization in a PEM fuel cell or in a SO fuel cell: Some considerations on the energy efficiencies. Int. J. Hydrogen Energy 2016, 41, 15415–15425. [Google Scholar] [CrossRef]
  9. Bessarabov, D.; Wang, H.; Li, H.; Zhao, N. Pem Electrolysis for Hydrogen Production: Principles and Applications; CRC Press: Boca Raton, FL, USA, 2016. [Google Scholar]
  10. Zhang, K.; Liang, X.; Wang, L.; Sun, K.; Wang, Y.; Xie, Z.; Wu, Q.; Bai, X.; Hamdy, M.S.; Chen, H.; et al. Status and perspectives of key materials for PEM electrolyzer. Nano Res. Energy 2022, 1, e9120032. [Google Scholar] [CrossRef]
  11. Falcão, D.S.; Pinto, A.M.F.R. A review on PEM electrolyzer modelling: Guidelines for beginners. J. Clean. Prod. 2020, 261, 121184. [Google Scholar] [CrossRef]
  12. Barbir, F. PEM electrolysis for production of hydrogen from renewable energy sources. Sol. Energy 2005, 78, 661–669. [Google Scholar] [CrossRef]
  13. Zaik, K.; Werle, S. Solar and wind energy in Poland as power sources for electrolysis process-A review of studies and experimental methodology. Int. J. Hydrogen Energy 2023, 48, 11628–11639. [Google Scholar] [CrossRef]
  14. Thomas, C. Fuel cell and battery electric vehicles compared. Int. J. Hydrogen Energy 2009, 34, 6005–6020. [Google Scholar] [CrossRef] [Green Version]
  15. Pivovar, B.; Rustagi, N.; Satyapal, S. Hydrogen at scale (H2@ Scale): Key to a clean, economic, and sustainable energy system. Electrochem. Soc. Interface 2018, 27, 47. [Google Scholar] [CrossRef]
  16. García-Valverde, R.; Espinosa, N.; Urbina, A. Simple PEM water electrolyser model and experimental validation. Int. J. Hydrogen Energy 2012, 37, 1927–1938. [Google Scholar] [CrossRef]
  17. Carvela, M.; Lobato, J.; Rodrigo, M.A. Chloralkali low temperature PEM reversible electrochemical cells. Electrochim. Acta 2021, 387, 138542. [Google Scholar] [CrossRef]
  18. Guo, Q.; Ye, F.; Guo, H.; Ma, C.F. Gas/Water and Heat Management of PEM-Based Fuel Cell and Electrolyzer Systems for Space Applications. Microgravity Sci. Technol. 2017, 29, 49–63. [Google Scholar] [CrossRef]
  19. Dang, J.; Yang, F.; Li, Y.; Zhao, Y.; Ouyang, M.; Hu, S. Experiments and microsimulation of high-pressure single-cell PEM electrolyzer. Appl. Energy 2022, 321, 119351. [Google Scholar] [CrossRef]
  20. Upadhyay, M.; Lee, S.; Jung, S.; Choi, Y.; Moon, S.; Lim, H. Systematic assessment of the anode flow field hydrodynamics in a new circular PEM water electrolyser. Int. J. Hydrogen Energy 2020, 45, 20765–20775. [Google Scholar] [CrossRef]
  21. Toghyani, S.; Afshari, E.; Baniasadi, E. Three-dimensional computational fluid dynamics modeling of proton exchange membrane electrolyzer with new flow field pattern. J. Therm. Anal. Calorim. 2019, 135, 1911–1919. [Google Scholar] [CrossRef]
  22. Nie, J.; Chen, Y.; Cohen, S.; Carter, B.D.; Boehm, R.F. Numerical and experimental study of three-dimensional fluid flow in the bipolar plate of a PEM electrolysis cell. Int. J. Therm. Sci. 2009, 48, 1914–1922. [Google Scholar] [CrossRef]
  23. Badduri, S.R.; Siripuram, R. Effect of Width of a Serpentine Flow Channel on PEM Fuel Cell Performance. In Proceedings of the Recent Advances in Renewable Energy Sources-RARES2021, Online, 26–27 February 2021. [Google Scholar]
  24. Kang, Z.; Yu, S.; Yang, G.; Li, Y.; Bender, G.; Pivovar, B.S.; Green, J.B.; Zhang, F.-Y. Performance improvement of proton exchange membrane electrolyzer cells by introducing in-plane transport enhancement layers. Electrochim. Acta 2019, 316, 43–51. [Google Scholar] [CrossRef]
  25. Ruiz, D.D.H.; Sasmito, A.P.; Shamim, T. Numerical investigation of the high temperature PEM electrolyzer: Effect of flow channel configurations. ECS Trans. 2013, 58, 99. [Google Scholar] [CrossRef]
  26. Nafchi, F.M.; Afshari, E.; Baniasadi, E.; Javani, N. A parametric study of polymer membrane electrolyser performance, energy and exergy analyses. Int. J. Hydrogen Energy 2019, 44, 18662–18670. [Google Scholar] [CrossRef]
  27. Tijani, A.S.; Barr, D.; Rahim, A.A. Computational modelling of the flow field of an electrolyzer system using CFD. Energy Procedia 2015, 79, 195–203. [Google Scholar] [CrossRef] [Green Version]
  28. Toghyani, S.; Fakhradini, S.; Afshari, E.; Baniasadi, E.; Abdollahzadeh Jamalabadi, M.Y.; Safdari Shadloo, M. Optimization of operating parameters of a polymer exchange membrane electrolyzer. Int. J. Hydrogen Energy 2019, 44, 6403–6414. [Google Scholar] [CrossRef]
  29. Saikia, S.; Verma, V.; Kakati, B.K.; Sivasakthivel, T.; Tarodiya, R. Optimization of solar integrated electrolyser system for hydrogen production using Taguchi method. Mater. Today Proc. 2022, 49, 397–402. [Google Scholar] [CrossRef]
  30. Chen, W.-H.; Tsai, Z.-L.; Chang, M.-H.; You, S.; Kuo, P.-C. Geometry optimization and pressure analysis of a proton exchange membrane fuel cell stack. Int. J. Hydrogen Energy 2021, 46, 16717–16733. [Google Scholar] [CrossRef]
  31. Marschall, R. 50 Years of Materials Research for Photocatalytic Water Splitting. Eur. J. Inorg. Chem. 2021, 2021, 2435–2441. [Google Scholar] [CrossRef]
  32. Hossain, M.S.; Shabani, B.; Cheung, C.P. Enhanced gas flow uniformity across parallel channel cathode flow field of Proton Exchange Membrane fuel cells. Int. J. Hydrogen Energy 2017, 42, 5272–5283. [Google Scholar] [CrossRef]
  33. Zick, A.; Homsy, G. Stokes flow through periodic arrays of spheres. J. Fluid Mech. 1982, 115, 13–26. [Google Scholar] [CrossRef]
  34. Lin, R.; Lu, Y.; Xu, J.; Huo, J.; Cai, X. Investigation on performance of proton exchange membrane electrolyzer with different flow field structures. Appl. Energy 2022, 326, 120011. [Google Scholar] [CrossRef]
  35. Vazifeshenas, Y.; Sedighi, K.; Shakeri, M. Heat transfer in PEM cooling flow field with high porosity metal foam insert. Appl. Therm. Eng. 2019, 147, 81–89. [Google Scholar] [CrossRef]
  36. Chen, W.-H.; Lin, Y.-Y.; Liu, H.-C.; Baroutian, S. Optimization of food waste hydrothermal liquefaction by a two-step process in association with a double analysis. Energy 2020, 199, 117438. [Google Scholar] [CrossRef]
  37. Chen, W.-H.; Wang, J.-S.; Chang, M.-H.; Mutuku, J.K.; Hoang, A.T. Efficiency improvement of a vertical-axis wind turbine using a deflector optimized by Taguchi approach with modified additive method. Energy Convers. Manag. 2021, 245, 114609. [Google Scholar] [CrossRef]
  38. Chen, W.H.; Tsai, Z.L.; Chang, M.H.; Hsu, T.H.; Kuo, P.C. Flow field simulation and pressure drop modeling by a porous medium in PEM fuel cells. Int. J. Energy Res. 2022, 46, 163–177. [Google Scholar] [CrossRef]
  39. Chen, W.H.; Li, Y.W.; Lin, C.C.; Chang, M.H.; Saravanakumar, A.; Saw, L.H. Multi—objective optimization design for pressure uniformity in a proton exchange membrane fuel cell stack. Int. J. Energy Res. 2022, 46, 18947–18963. [Google Scholar] [CrossRef]
  40. Ozdemir, S.N.; Taymaz, I.; Okumuş, E.; San, F.G.B.; Akgün, F. Experimental investigation on performance evaluation of PEM electrolysis cell by using a Taguchi method. Fuel 2023, 344, 128021. [Google Scholar] [CrossRef]
  41. Chauhan, R.; Singh, T.; Kumar, N.; Patnaik, A.; Thakur, N.S. Experimental investigation and optimization of impinging jet solar thermal collector by Taguchi method. Appl. Therm. Eng. 2017, 116, 100–109. [Google Scholar] [CrossRef]
  42. Wang, Y.; Chen, G.; Li, Y.; Yan, B.; Pan, D. Experimental study of the bio-oil production from sewage sludge by supercritical conversion process. Waste Manag. 2013, 33, 2408–2415. [Google Scholar] [CrossRef] [PubMed]
  43. Chen, W.-H.; Uribe, M.C.; Luo, D.; Jin, L.; Saw, L.H.; Lamba, R. Taguchi optimization and analysis of variance for thermoelectric generators with forced convection air cooling. Appl. Therm. Eng. 2023, 231, 120878. [Google Scholar] [CrossRef]
Figure 1. (a) Top view of the flow channels of the PEMEC model, and (b) the cross-sectional view of the flow channels and porous layers.
Energies 16 05642 g001
Figure 2. The pressure distribution simulated by the present model within the flow channel plate without a porous medium layer.
Energies 16 05642 g002
Figure 3. (a) The model of serpentine flow channel filled with porous medium. (b) Comparison of the pressure drop at different inlet velocities between the previous work [35] and the present study.
Energies 16 05642 g003
Figure 4. Grid independence test with four different element numbers.
Energies 16 05642 g004
Figure 5. The 2D velocity contour within the flow channel plate of the case R5.
Energies 16 05642 g005
Figure 6. The 3D pressure contour of the case R5 within (a) the flow channel and (b) the large-pore porous layer.
Energies 16 05642 g006
Figure 7. The results of Taguchi analysis at the inlet velocity of 0.1332 m/s; (a) the pressure drops of the 9 runs and (b) the variations of mean S/N ratio for the four factors.
Energies 16 05642 g007
Figure 8. The results of Taguchi analysis at the inlet velocity of 0.01 m/s; (a) the pressure drops of the 9 runs and (b) the variations of mean S/N ratio for the four factors.
Energies 16 05642 g008
Figure 9. The results of Taguchi analysis at the inlet velocity of 0.532 m/s; (a) the pressure drops of the 9 runs and (b) the variations of mean S/N ratio for the four factors.
Energies 16 05642 g009
Figure 10. The effects of the four factors at the three assigned inlet velocities; (a) 0.01 m/s, (b) 0.1332 m/s, and (c) 0.532 m/s.
Energies 16 05642 g010
Table 1. The selected factors and level settings in the Taguchi analysis.
SymbolFactorUnitLevel
123
AFlow channel widthmm123
BFlow channel depthmm0.10.51
CParticle diameter of large-pore porous layerμm180212250
DParticle diameter of small-pore porous layerμm257
Table 2. The design of an L9 (34) orthogonal array with different combinations of levels.
SimulationLevel
ABCD
R11111
R21222
R31333
R42123
R52231
R62312
R73132
R83213
R93321
Table 3. Results of the ANOVA analysis at the inlet velocity of 0.01 m/s.
SourceDFSum of SquareMean SquareF-Valuep-ValuePercentage (%)
A2193.7296.862.050.330.30
B264,391.3032,195.65682.500.0199.40
C2101.8950.941.080.480.16
D294.3547.17--0.15
Table 4. Results of the ANOVA analysis at the inlet velocity of 0.1332 m/s.
FactorDFSum of SquareMean SquareF-Valuep-ValuePercentage (%)
A230,817.3115,408.651.750.360.27
B21.14 × 1075.7 × 106646.400.0099.41
C218,780.359390.181.060.480.16
D217,636.598818.29--0.15
Table 5. Results of the ANOVA analysis at the inlet velocity of 0.532 m/s.
FactorDFSum of SquareMean SquareF-Valuep-ValuePercentage (%)
A24.77 × 1052.39 × 1051.860.3490.25
B21.92 × 1089.58 × 107748.321.33 × 10−399.47
C22.79 × 1051.40 × 1051.090.4780.14
D22.56 × 1051.28 × 105--0.13
Disclaimer/Publisher’s Note: The statements, opinions and data contained in all publications are solely those of the individual author(s) and contributor(s) and not of MDPI and/or the editor(s). MDPI and/or the editor(s) disclaim responsibility for any injury to people or property resulting from any ideas, methods, instructions or products referred to in the content.