1. Introduction
Integrating distributed energy resources (DER) into a distribution network requires rethinking traditional protection settings to face challenges such as correcting parameter settings [
1]. For example, the magnitude of the fault current and its direction can change with the operation of DER in a distribution network [
2]. In addition, the coordination of different protections, such as relays, reclosers, and sectionalizers, is one of the main issues to solve [
3,
4,
5,
6].
From the point of view of overcurrent protections, the concepts of DER and microgrids are not so different [
7,
8,
9,
10]. Thus, power flows present the same behaviors, and the distributed generation technologies can be the same. The main difference lies in the control and the capacity of the microgrid to operate in different operation modes [
7,
9,
10,
11]. With the continuous improvement and the high integration of DER, such as photovoltaic (PV) panels, wind turbines, thermal generators, and energy storage systems, these technologies are more accessible and attractive due to the economic and environmental benefits. In addition, as the integration of these technologies increases, the operation is more complex and requires creating distribution networks where loads, storage systems, DER, and the power grid interact [
2,
3,
8,
9]. However, based on the level of integration of DER, the interaction with other sources, and different types of electronic devices, the system has a fundamental impact on the protection scheme due to the short-circuit current level that must be studied [
2,
12,
13].
The digital twin approach designed in this study is implemented as power hardware-in-the-loop (PHIL), suitable for developing and validating complex systems with real-time simulation. Therefore, some authors have started to use this technique in power systems. For example, Reference [
14] reviewed the use of PHIL for power systems, key aspects, recent advances, and some testbed developments. The authors of [
15] reviewed the concept of the digital twin and explored different applications in MGs and future trends; they also analyzed the potential enhancement of technology and a conceptual model for resilient operation management of microgrids. In addition, Reference [
16] shows an emulation system for testing AC microgrids, where the system emulates voltage control, current control, droop control, and secondary control schemes. Furthermore, Reference [
17] illustrates a testbed with a hardware-in-the-loop controller to represent multiple distributed controllers, configuring a classic cooperative control case for active power output and validating the effectiveness of the co-simulation testbed. Moreover, Reference [
18] describes the uses of PHIL for evaluating microgrid islanding/reconnection transitions and protection scheme performance.
Reference [
19] presents a hierarchical energy management strategy for isolated microgrids (MG), using the hardware-in-the-loop (HIL) test to validate the hierarchical control. Reference [
20] presents a fault identification framework for low-level components that combines real-time systems with the digital twin concept to guarantee the dynamic consistency of the low-level components. In addition, the authors of [
21] have presented a digital twin for monitoring the power flow of a remote microgrid, where validation is performed for different types of loads. Reference [
22] shows an energy storage system operation scheduling model for virtual space when constructing a microgrid using a digital twin.
All these applications presented in the literature consider a significant advance in the topic, where this technology allows for studying complex problems related to the system operation. However, few papers have been presented related to the use of PHIL for validating protection schemes, and more research is needed to understand the different issues associated with the integration of DER. Therefore, this paper considers a conventional distribution network where a protection coordination study is conducted without the insertion of DER. Then, an analysis of the impact of the DER on the previously defined protection scheme is carried out. In addition, a real-time simulation software is employed to implement the PHIL-based digital twin model. Load flow and short-circuit analyses are compared between the results obtained by the digital twin and the off-line simulation performed in the off-line simulation software to validate the model under test. The network stability index is calculated to select the buses for integrating DER. The integration of DER in the distribution network is performed based on the power according to the recommendation of electrical standards.
The contributions of the work are the following:
A new protection coordination method is performed in a distribution network with DER.
PHIL scheme for real-time simulation is designed to monitor short-circuit currents.
Digital twins are designed as a new protection coordination scheme for a distribution network with DER using a real-time simulation software.
The present paper is divided into four more sections.
Section 2 presents the characteristics of the selected test network and the considerations for modeling the network as a digital twin.
Section 3 shows the results related to the operation of the overcurrent protection scheme without and with DER. Finally, the conclusions and future work are presented.
2. Materials and Methods
This section presents the materials and methods of the research. First, the general procedure is presented. Then, all the models designed for the test and the details are given for each device. In addition, the overcurrent protection scheme is defined, and the application of PHIL for digital twins is presented.
2.1. General Procedure
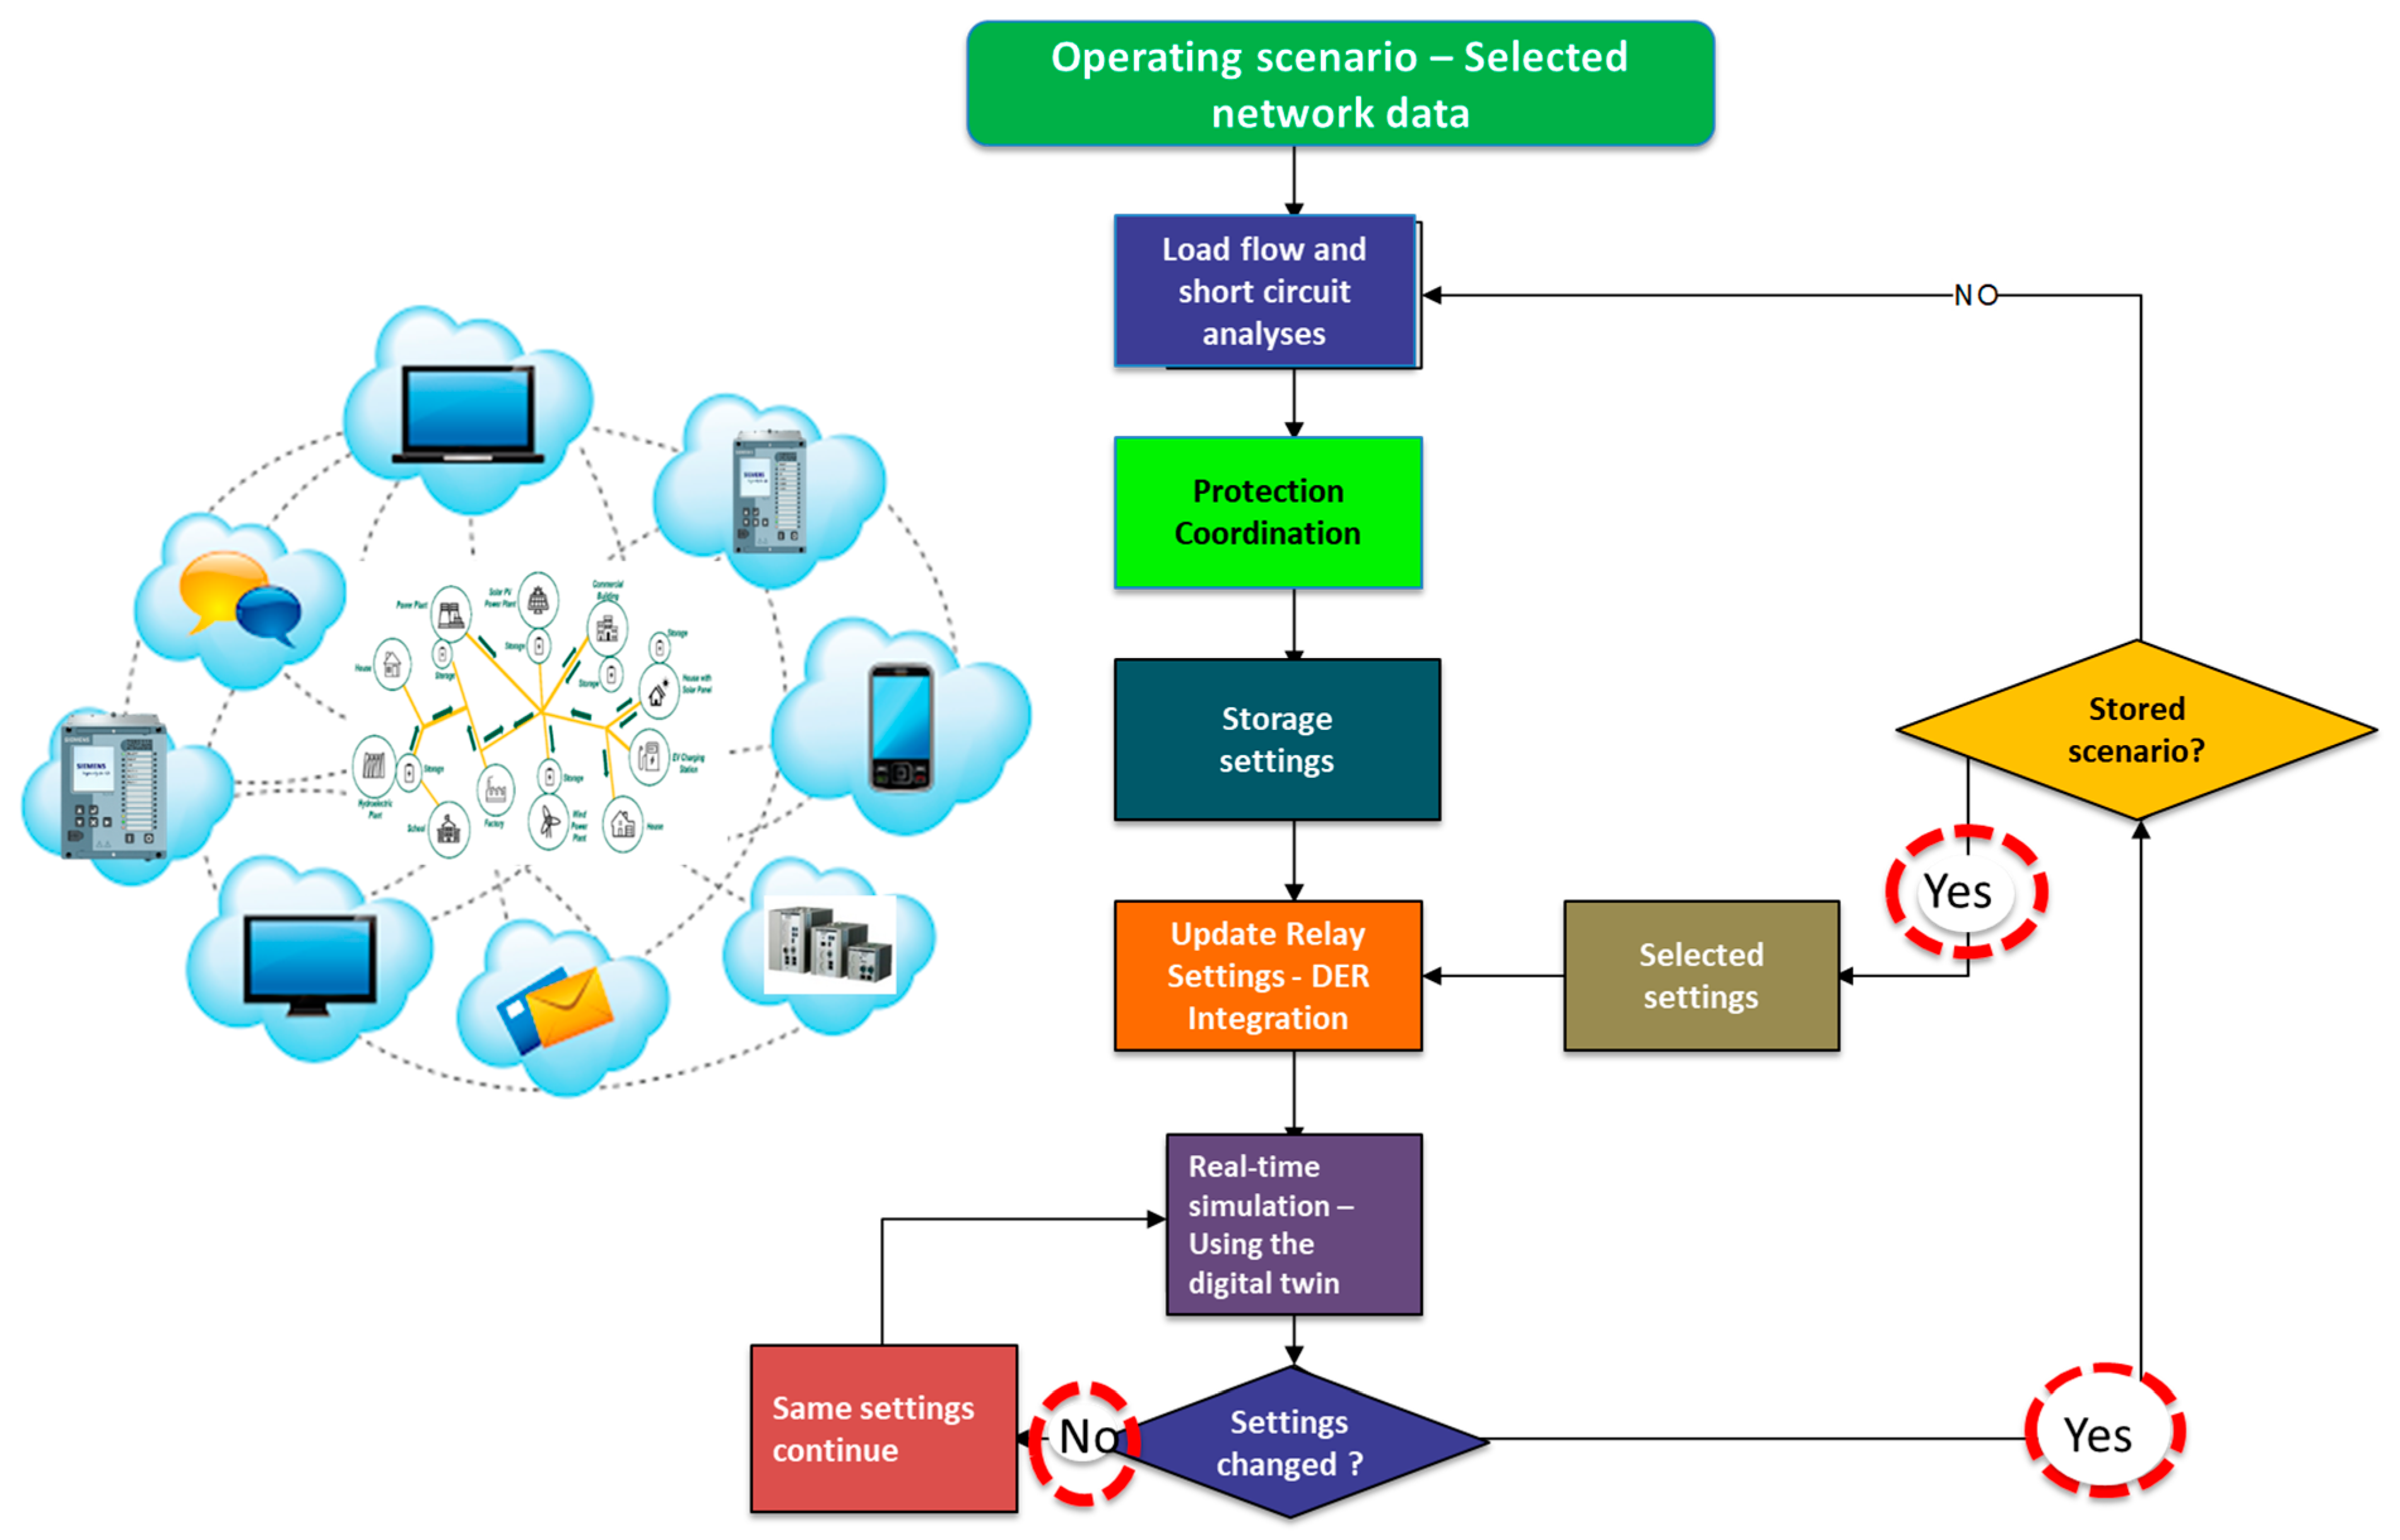
Figure 1 shows the methodology of the research. Step 1 is defined to select a conventional distribution network, and the data of the selected system test are read. Step 2 evaluates the load flow and short-circuit currents of the distribution network. Step 3 is designed to coordinate protection for the selected network without DER. Step 4 saves the protection settings calculated and Step 5 updates them to the relay settings and integrates DER and energy storage into the distribution network. Step 6 performs a real-time simulation of the network using the digital twin to verify the behavior of previously coordinated protections. Then, the new settings are calculated in the real-time simulation. Finally, the protection scheme is verified according to the previous coordination (Step 6).
2.2. Modeling the Distribution System
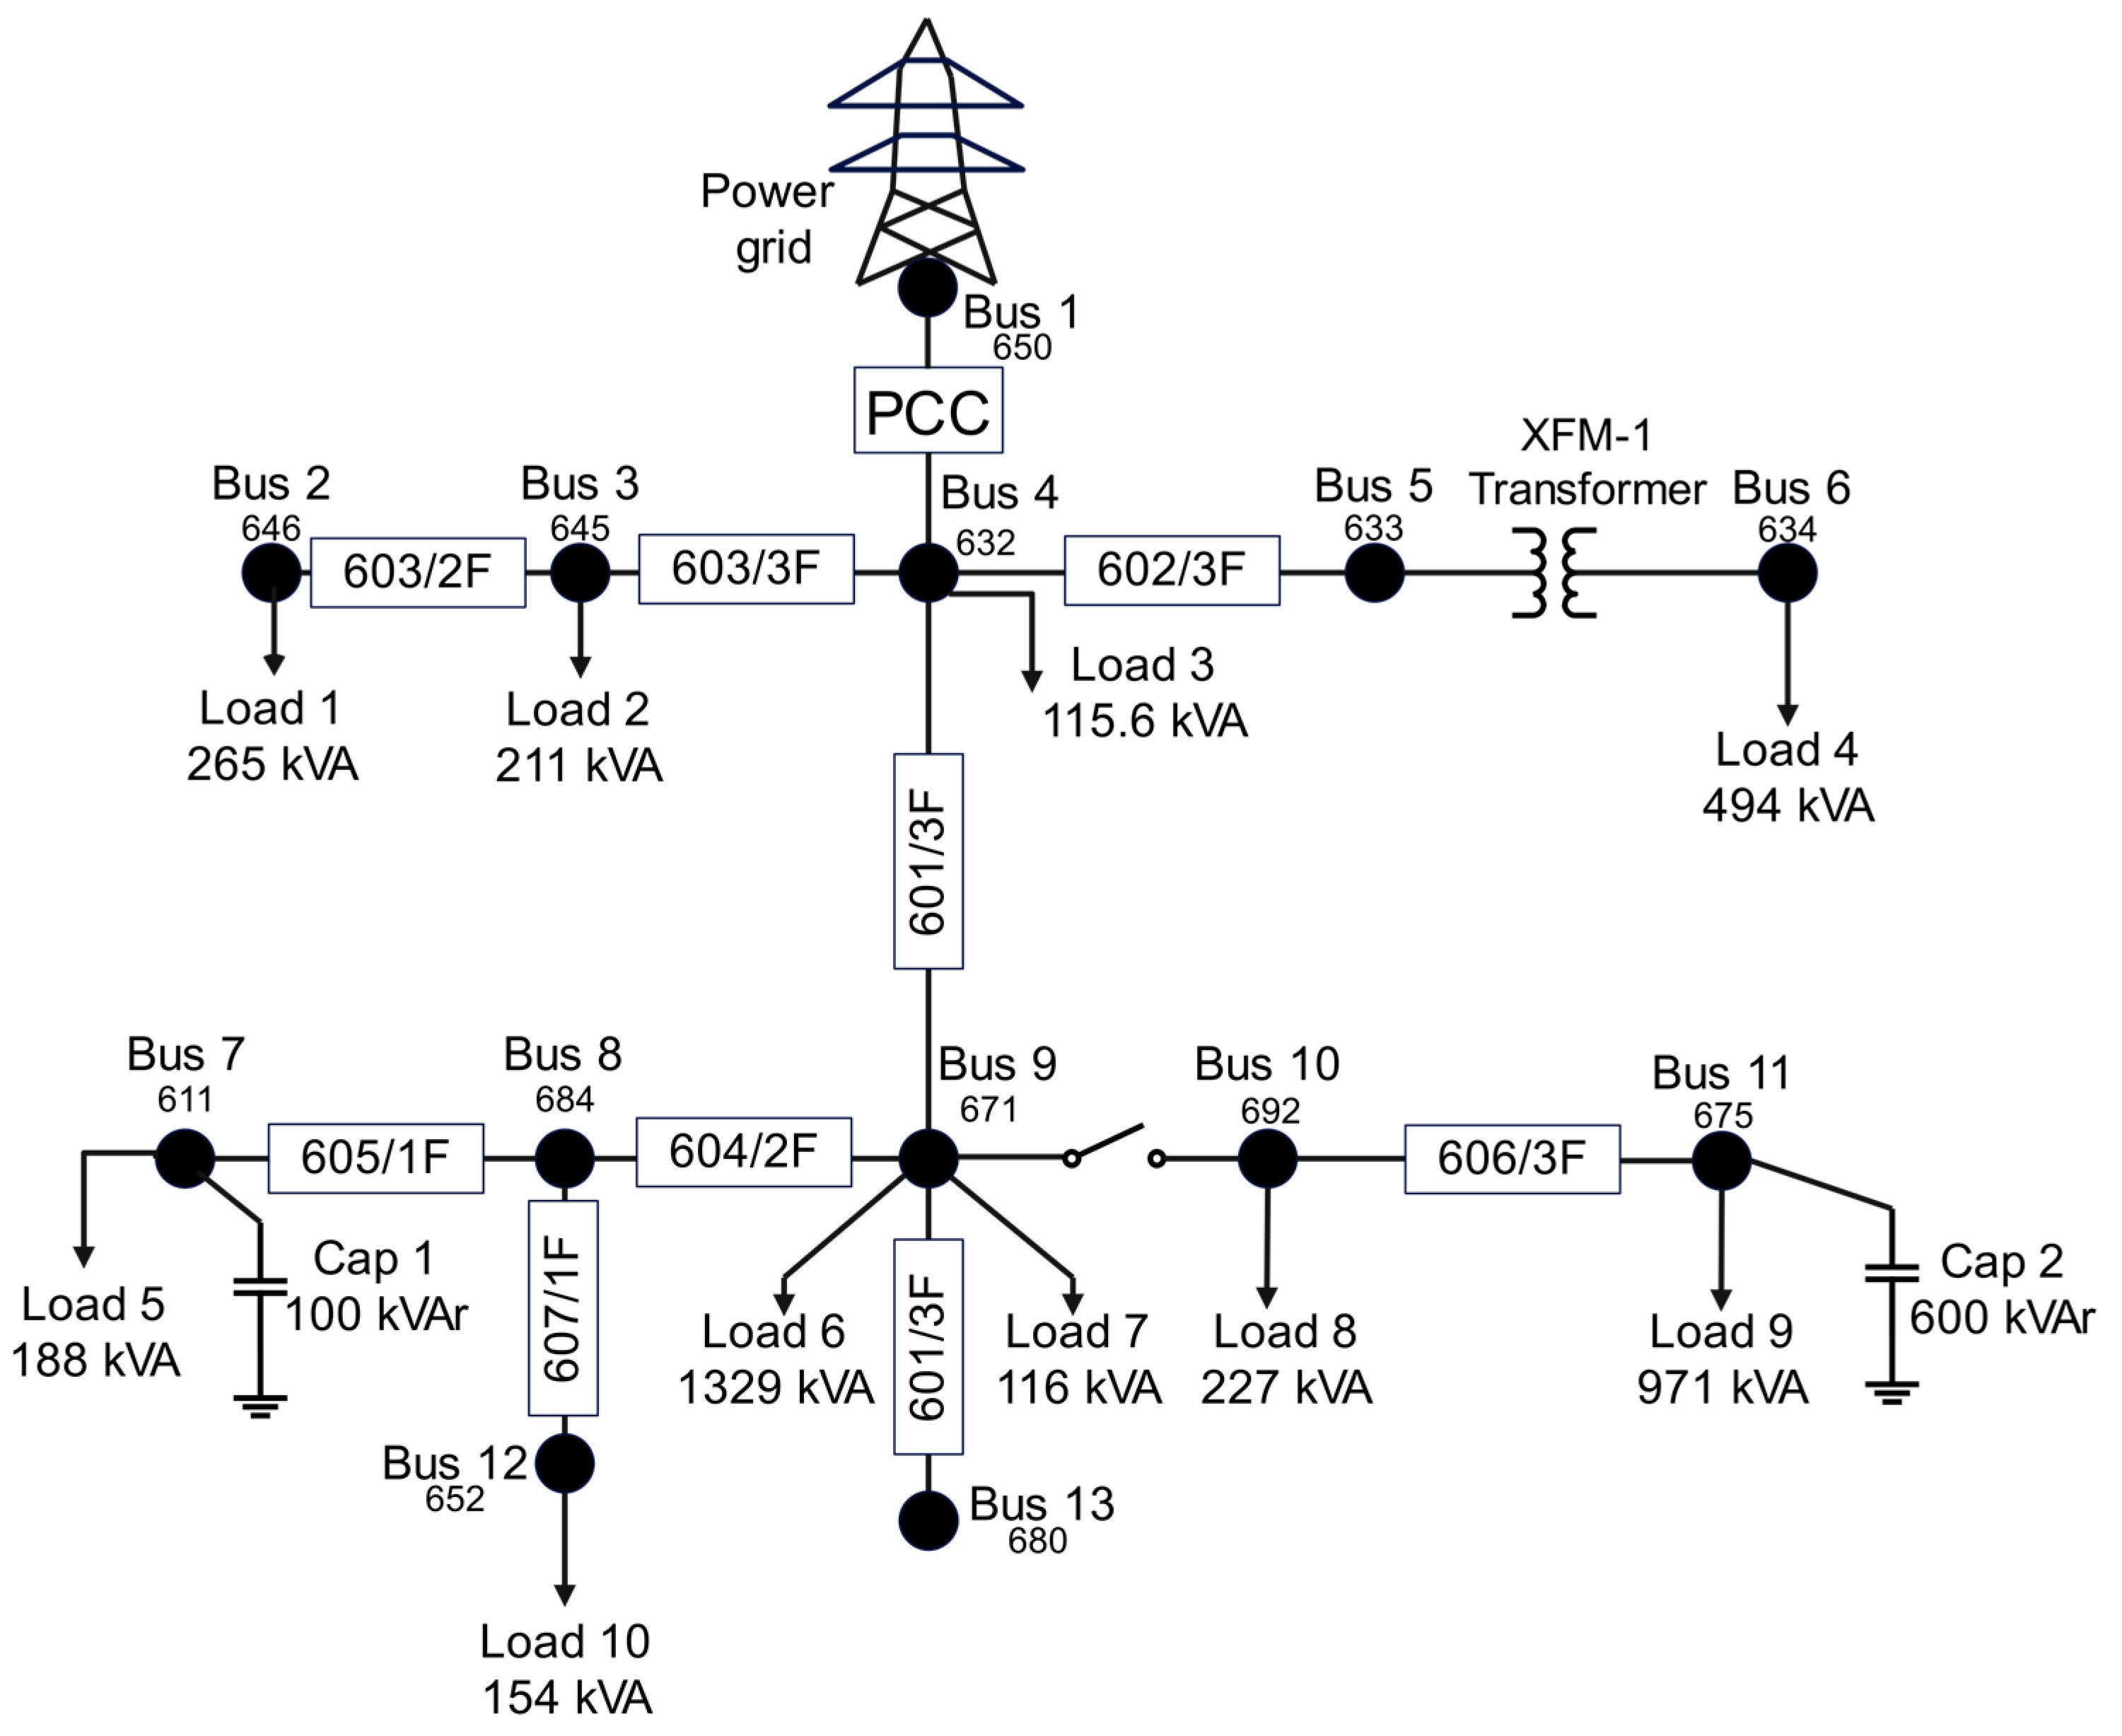
This research employs the IEEE 13-node test feeder network [
7], as shown in
Figure 2. This system meets the characteristics of a conventional power distribution network [
8]. The network has topological features and a variety of representative components of urban electrical networks, such as capacitor banks for reactive compensation, long and short lines, lightly loaded circuits, and uniformly distributed loads. It is a highly loaded network with overhead and underground lines with various phases, shunt capacitor banks, and unbalanced and distributed loads.
The network comprises 13 buses with a nominal voltage of 4.16 kV. It has 10 lines with lengths of around 92 m and 610 m. Ten unbalanced three-phase and single-phase loads have capacities between 60 kW and 485 kW. In addition, the network comprises one 5000 kVA transformer with a Dy configuration and ratio of 115/4.16 kV and one 500 kVA transformer with a Yy configuration and ratio of 4.16/0.48 kV. There are also a three-phase and a single-phase capacitors connected in the network [
23].
This network allows for observing the behavior of bidirectional power flows, among other phenomena that occur with the integration of DER. Bus 1 is the interconnection point of the distribution network and the power grid and is called the Common Point of Coupling (PCC), where the power can flow in both directions. According to the status of the PCC, the distribution network can operate in two modes: island or connected to the power grid. The test network was modeled and validated in the off-line simulation software [
24,
25,
26] and the real-time simulation software.
2.2.1. Network Equivalent
Table 1 shows the parameters for the network equivalent modeled in the off-line simulation software and real-time simulation software. A voltage source with a series RLC scheme is employed for the network equivalent, representing the short-circuit impedance.
2.2.2. Capacitors
The system has two capacitor banks connected to two different buses in the network.
Table 2 shows the reactive power of the capacitor banks connected to the network defined by each phase. The first element is a single-phase capacitor bank of 100 kVAr connected to phase C of bus 7. The second element is a three-phase capacitor bank of 200 kVAr per phase connected to bus 11.
2.2.3. Loads
In the test network, these loads are distributed according to the power and the type of representation of industrial, commercial, and residential loads.
Table 3 shows the parameters of the loads defined for each software (off-line simulation software and real-time simulation software). The active and reactive power of the loads can be calculated using the model presented in Equations (1) and (2).
where the term
is the rated active power and the term
is the rated reactive power. In addition, the term
is the rated bus voltage. Furthermore,
and
are the parameters of the exponential load model, which can obtain values of 0, 1, and 2 for constant power, constant current, and constant impedance loads, respectively. The values of the parameters
and
can be found in
Table 3.
Table 4 shows the parameters to model the loads in off-line simulation software; the model is defined according to the power of the loads. In addition, for the real-time simulation software, loads are modeled with equivalent impedances. Therefore, the RLC components offered by real-time simulation software are employed to represent single-phase loads. These values are adjusted depending on the power demanded.
2.2.4. Distributed Energy Resources
The location of the DER is required to guarantee technical aspects, such as improving voltage profiles, reducing energy losses, improving power transfer capacity, and increasing network reliability. Hence, the stability indicator (SI) is calculated in this research to locate DER, which is commonly employed for radial networks [
27,
28].
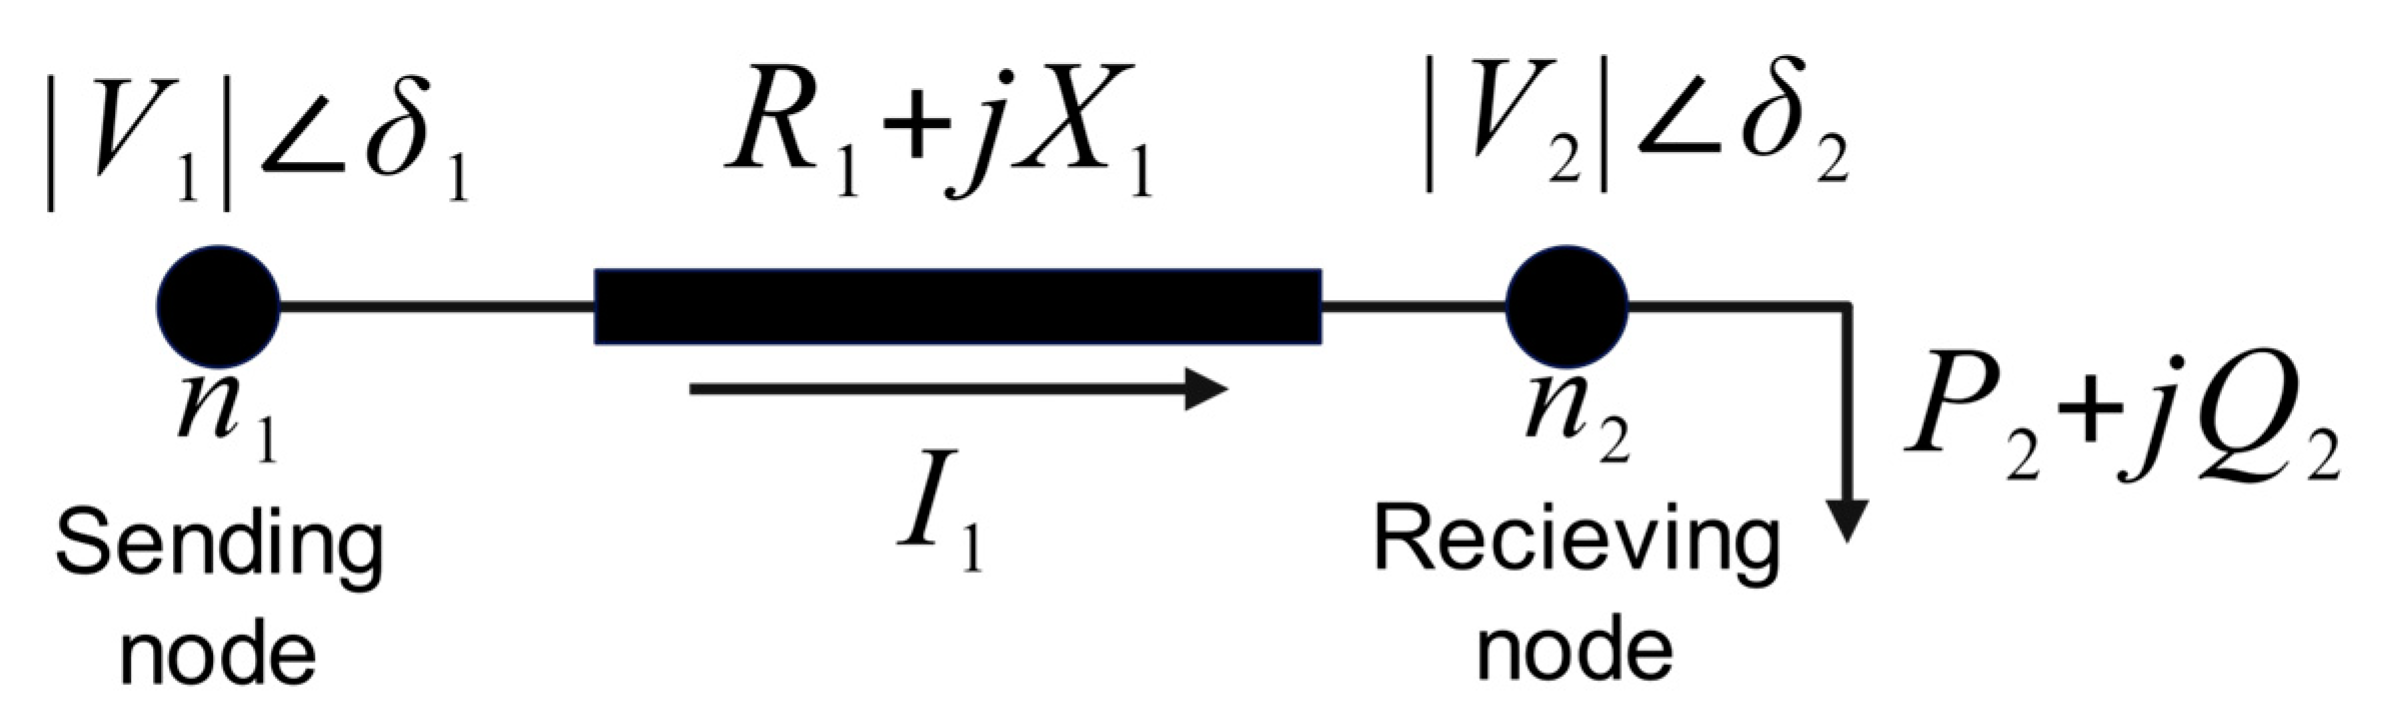
Figure 3 presents a general network with two nodes, where the sending node is the power source and the receiving node is where the load is connected. A line transports the power from the sending node to the receiving node.
The terms
and
are the sending and receiving nodes, respectively. The terms
and
are the voltages at the sending and receiving nodes, respectively. The terms
and
are the resistance and reactance of the line that connects the two nodes. Finally,
and
are the active and reactive power in the receiving node, respectively. Therefore, the SI is calculated according to the parameters and variables presented in
Figure 3, as shown in Equation (3) [
27,
28].
3. Case Study
Engineers aim to provide validated systems with reliability, security, speed, and selectivity when designing, configuring, and implementing protection systems. Testing is necessary to ensure systems meet performance criteria, but the increasing complexity of interconnected equipment has made end-to-end testing more challenging. Testing complex protection schemes in networks with DER poses even more significant challenges. In addition, it is required to increase the resistance and resilience of the electrical network capable of handling the separation of the bulk transmission system into small networks. Furthermore, protection and control tests require tools capable of delivering high fidelity and realistic test conditions.
Figure 4 shows the case study that implements a PHIL scheme to verify the overcurrent protection. The configuration consists of performing a real-time simulation with the OP5600. The IEEE 13-node test feeder was modeled in real-time simulation software and validated with the results of the off-line simulation software. The ISA DTRS33 sources are those in charge of amplifying the OP5600 signals. Each amplifying source has three current output signals, and each of these outputs is connected to one of the phases of each relay. Therefore, it is necessary to use two of these sources.
Real-time simulation software runs from the WorkStation, where the faults at different network points are executed and parameterized, the DER sources are coupled or uncoupled, and the real-time simulation software ScopeView module displays the oscillographs. It shows the voltage and current signals of all the protection relays. It visualizes the trips of each relay using the communication protocol IEC61850 standard for Generic Object-Oriented Substation Events (GOOSE) messages [
29]. This configuration facilitates the evaluation of the selectivity regarding the overcurrent protection scheme and the measurement of fault clearance times. With digital twins, it is possible to reproduce with a greater degree of accuracy the dynamics and response times of a real system, allowing for the evaluation of complete electrical systems with their respective protection schemes. With the digital twin, it is possible to validate the response times of real protection devices with high fidelity. With this technology, the protection relays do not perceive the difference between being in the field and the laboratory.
3.1. Coordination and Configuration of the Overcurrent Protection Scheme
Once the test network is selected, the methodology for coordinating the overcurrent protection scheme is proposed based on the IEEE Std 242-2001 standard [
30]. It must be considered that the coordination adjustments are made without the insertion of DER to know the impact on the overcurrent protection scheme after integrating DER. The coordination of the protection scheme is conducted with the off-line simulation software.
Once the scheme is coordinated, it is evaluated with the STAR Auto-Evaluation of off-line simulation software. This software tool allows for the detection and automatic evaluation of the protection and coordination systems based on the design criteria. The software considers the NFPA 70 (NEC) electrical safety in workplaces [
31], IEEE Std 446-1995 recommended practices for emergencies and stability of power systems [
32], and IEEE Std 242-2001 for evaluating the coordination of the protection scheme [
30].
3.2. Communication Architecture under IEC 61850-GOOSE
In IEC 61850 environments, GOOSE messages are employed to distribute protection status information. Thus, multicast messages are published and distributed on the network, where any IED or test unit can use them. The IEC 61850-5 standard related to communication protocol is configured to see the protection trips [
29], which presents time-critical information, such as protection trip commands. Thus, this information is of the highest priority and requires fast communication.
Therefore, the methodology for coordinating the protection scheme based on the criteria of the IEEE Std 242-2001 standard was proposed [
30]. Thus, off-line simulation software was employed with its protection and coordination module, which facilitates calculations. The IEC 61850-8-1 communication protocol gives excellent flexibility for evaluating the protection coordination and, at the same time, the communication system of the protection device. Thanks to its benefits, rapid implementation was achieved by facilitating the connection of the relays to the OP5600 by reducing connections to a network cable.
3.3. Location of Power Sources
Table 5 presents the values of the SI index calculated for all the buses with three-phase loads. The power selected is 1 MVA, the voltage is 4.16 kV, and the impedance is 17.3 Ω. In this table, the information related to the bus is the number identified as ID and the voltage
V (p.u.). The information related to the load and line is the real power
P (p.u.) and the reactive power
Q (p.u.). In the steady-state operation of the electrical network, the SI index must be greater than or equal to zero. Values closer to zero indicate less voltage stability. Therefore, buses 9, 10, and 13 are candidates for integrating DER.
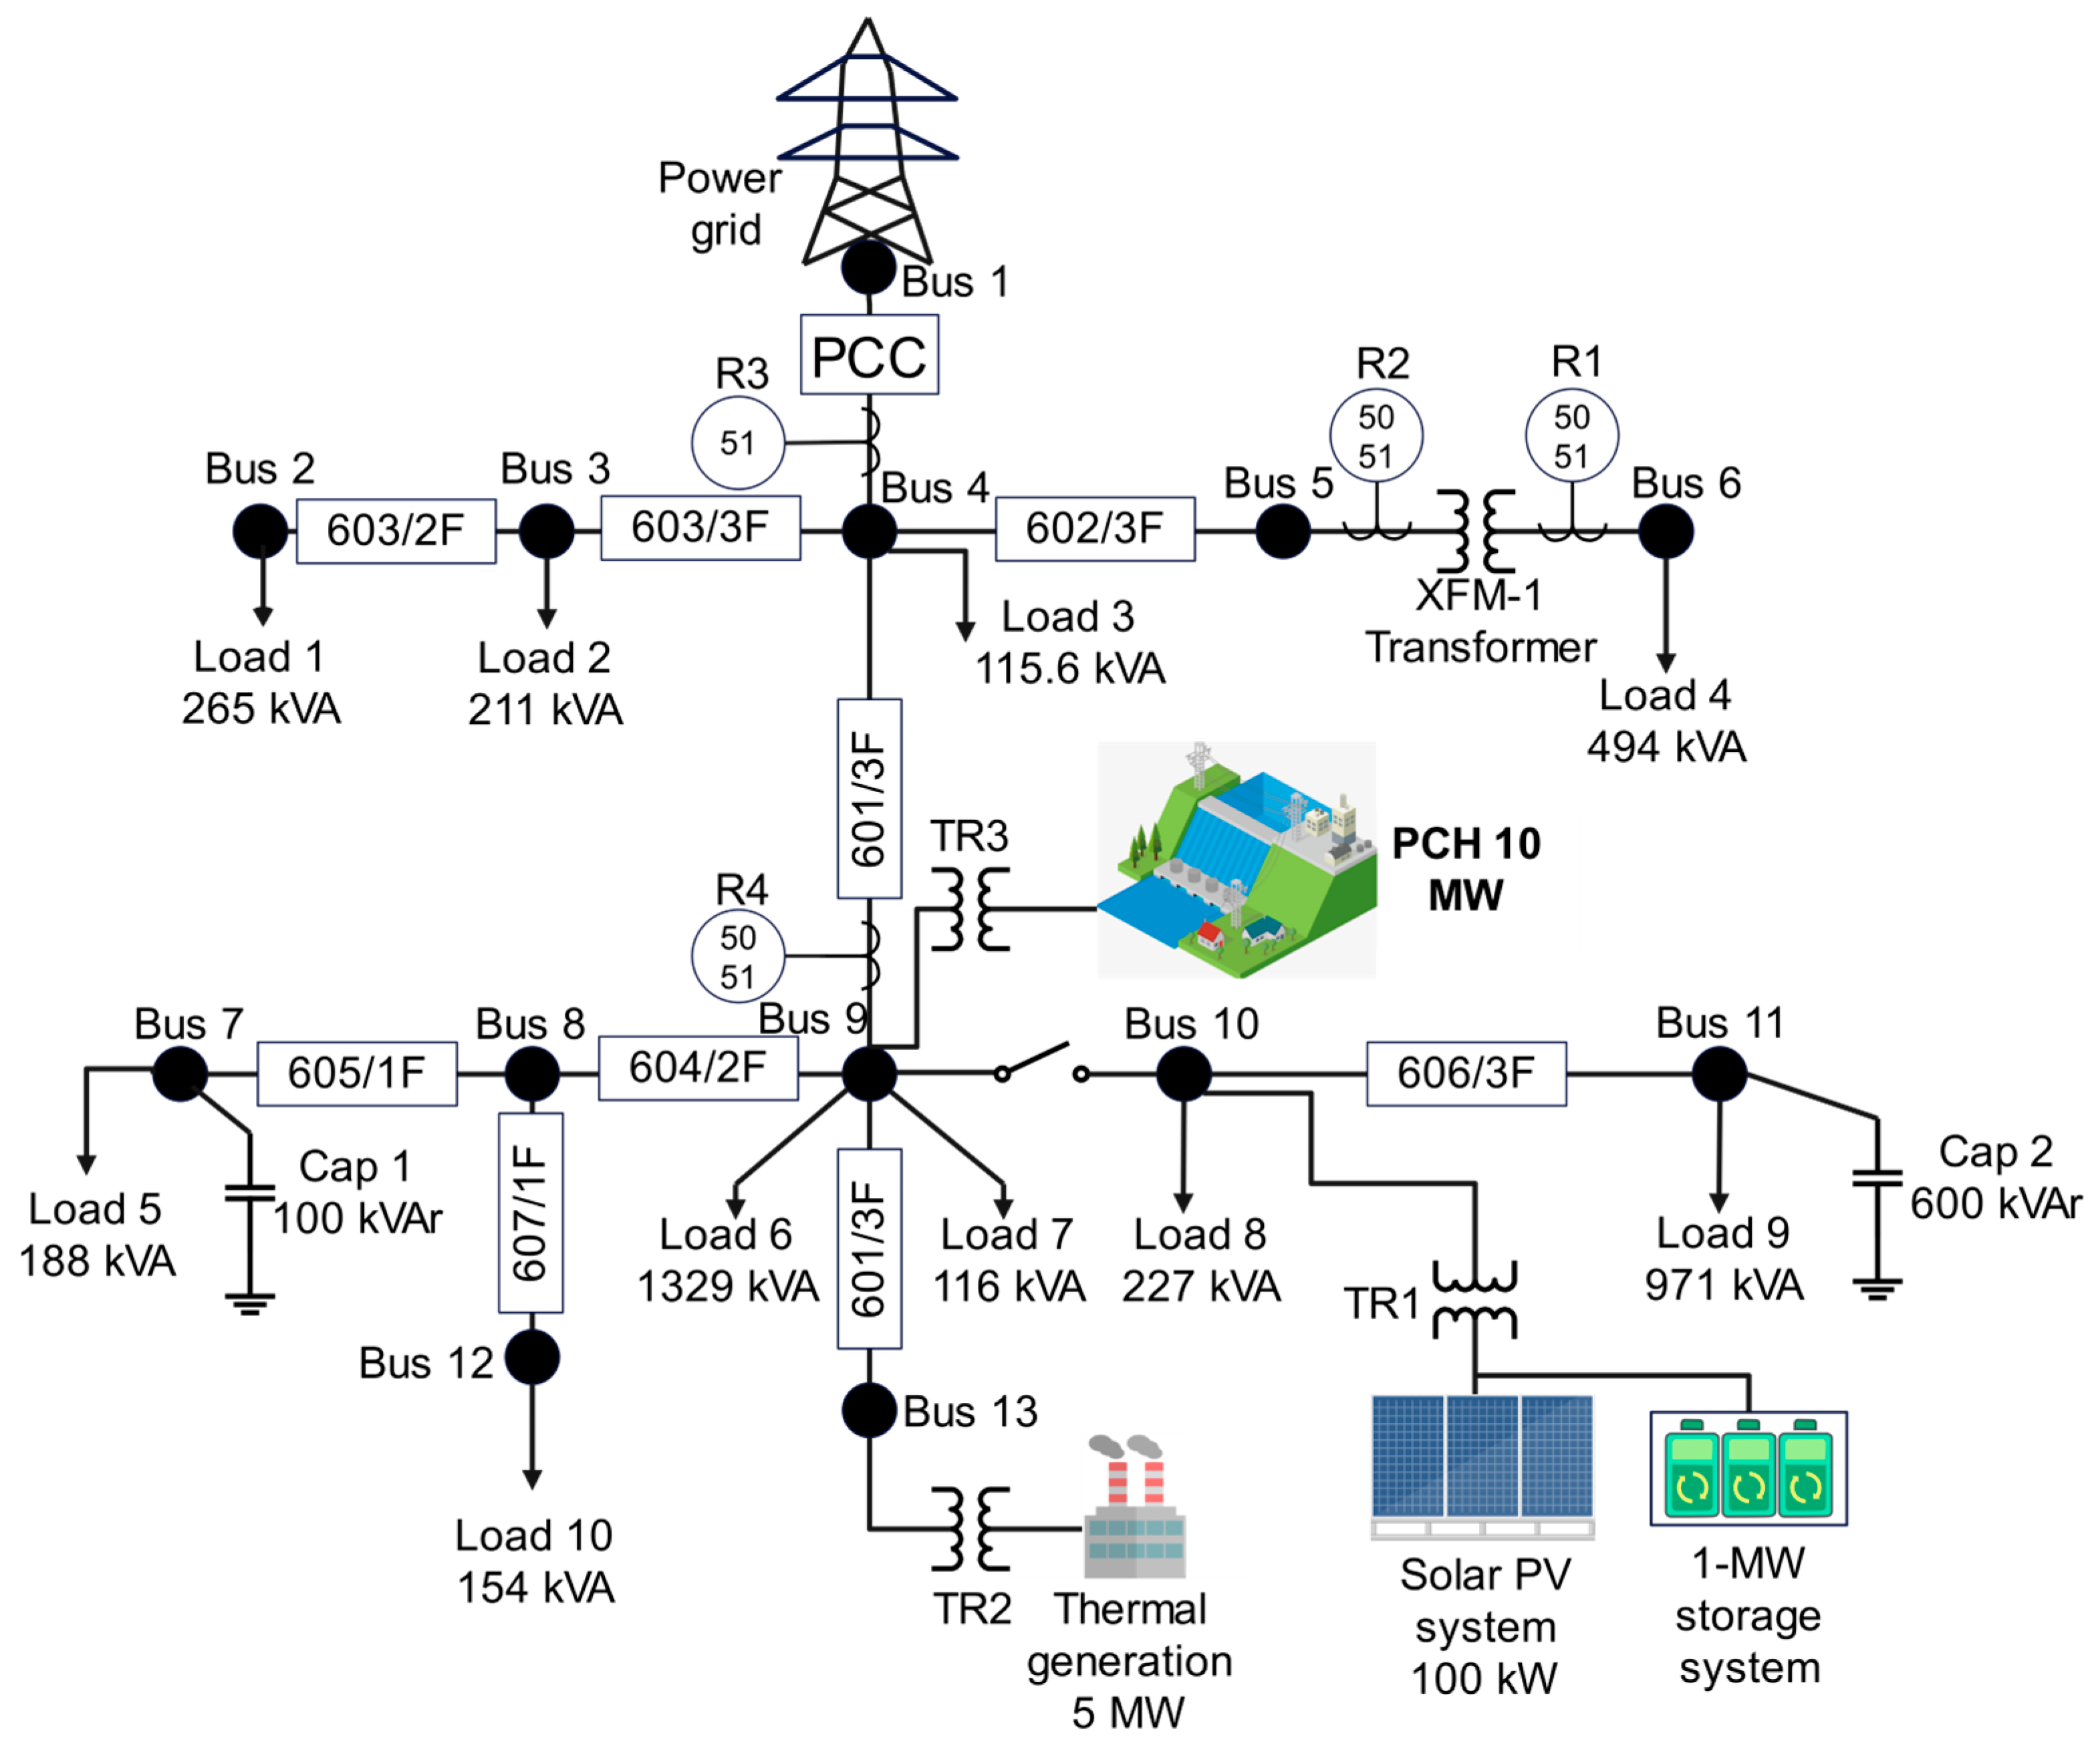
Figure 5 shows the integration of four power sources in the selected buses. In bus 10, a 100 kVA PV system is inserted, representing the distributed generation according to CREG 030-2018. Its electronic converter has a Phase-Locked Loop (PLL) controller operating at 60 Hz. The model has an irradiance parameter ranging from 0 to 1000 W/m
2, allowing for the simulation of different power levels. The PV system is connected at 4.16 kV, and the model is adapted from a distribution network test.
A battery energy storage (BES) system is incorporated into bus 10, as is the solar panel arrangement. The parameters for its control are Pref and Qref, which allude to the reference active and reactive power. These parameters can be varied from −1 to 1 p.u., allowing for simulations of different states of charge of the bank. The power is 1 MW, representing a small-scale self-generation (SSSG) system according to CREG 030-2018, and it is connected to the 4.16 kV circuit. It has an electronic converter with a PLL controller, and its operating frequency is 60 Hz.
The power generation process through combined heat and power (CHP) uses a gas turbine, a steam turbine, and a recovery boiler. This DER is incorporated into bus 13, and its model is based on a 7001B General Electric turbine coupled to a 3600 rpm synchronous generator. The real power supplied by this generator is 5 MW, representing the large-scale self-generation according to CREG 030-2018. The generator is connected to the 4.16 kV circuit using a transformer adapted to the rating power. The model has as input parameters the active power, and just like the two models mentioned above, a controlled current source injects power into the network in real-time simulation. The SIMULINK model is compiled and adapted for real-time simulation software.
As bus 9 has the lowest SI, it is selected to incorporate the DER with the highest power. Then, a small hydropower plant (SHP) with 10 MW is incorporated into the network and classified as large-scale self-generation according to CREG 030-2018. A synchronous generator model for a hydraulic turbine is employed for the test. The parameters for the speed regulator, the turbine, AVR, and the synchronous generator are generic and considered according to the model available in the real-time simulation software.
The same IEEE 13-node test feeder with distributed generation is implemented in the real-time simulation software to perform all evaluations with digital twins.
Figure 6 shows the distribution network diagram with the relays at the location selected for evaluating the protection scheme.
3.4. Protection Settings
Table 6 shows the current transformers and the protection settings selected for the test. The ratio of the current transformer is chosen by comparing the nominal and three-phase short-circuit currents, and the highest current value is taken as a reference for the selection. The IEC 61869-2:2012 standard is employed to select the required transformation ratios from its standard values [
33]. The protection coordination is carried out with the off-line simulation software STAR protection module. Thytronic NA60, Thytronic NA80, and Thytronic NV100 employ the same relay library. The Siemens 7SJ81 relay library is employed to adjust the settings of the Siemens 7SJ82 relay. All the settings are loaded to the respective relays using the manufacturer software: Thyvisor for the Thytronic relays and DIGSI for the Siemens relay. The other protection functions that the IEDs integrate with the configuration are deactivated.
Figure 7 presents the coordination performed to the four relays. These curves show that each pair of relays has the corresponding separation time to respond to three-phase fault events without losing selectivity.
3.5. Protection Scheme
The selectivity, speed, sensitivity, safety, and coordination support are reviewed for the overcurrent protection scheme as specified in IEEE Std 242-2001 [
30]. The analysis begins by changing the power of DER and coupling and uncoupling the distributed generation to know the changes in the short-circuit current according to CREG 030-2018 [
34] and CREG 024-2015 [
35] standards. Finally, three-phase short-circuit faults at three points are performed to verify the coordination of protections.
When inserting DER in power systems, the levels of short-circuit currents can increase or decrease. Then, the following procedure is carried out to determine how much fault current variation depends on the type of DER. First, the three-phase short-circuit faults are parameterized in real-time simulation software to achieve the same short-circuit currents of the calculation based on the IEC 60909 method carried out in off-line simulation software to obtain the fault impedance value.
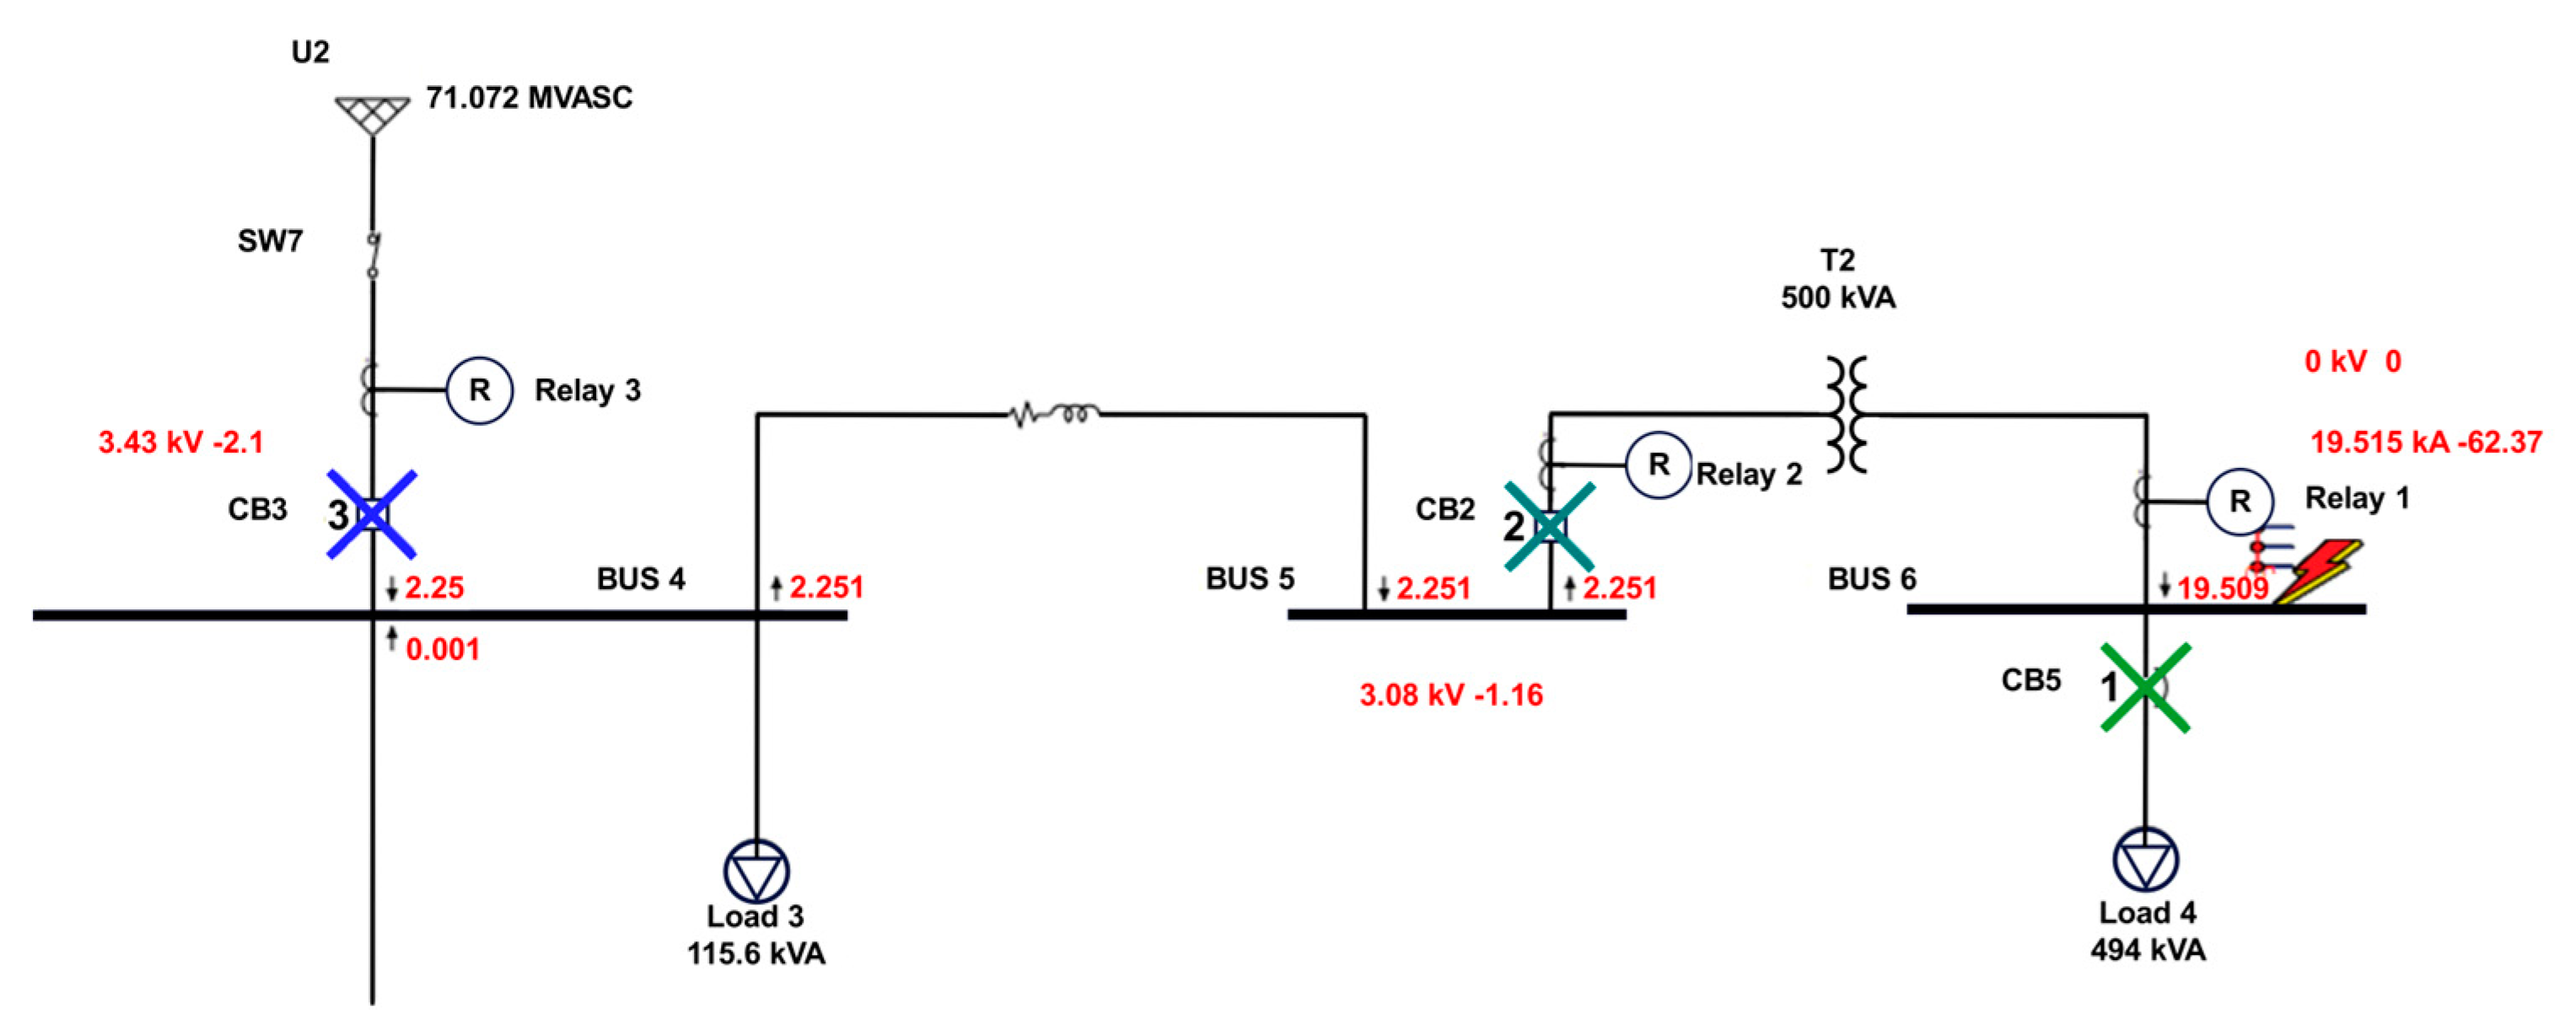
Table 7 shows the contribution to the short-circuit current of the power sources connected to the IEEE 13-node test feeder. First, the table shows the bus and the fault impedance. Next, the short-circuit currents of the network without integration of DER are presented. Then, all the short-circuit currents are presented when integrating the different distributed generators. This table also shows the short-circuit current of the network with the PV and BES systems, called PV-BES. Then, the short-circuit current of the network with CHP is displayed, followed by the results after integrating the SHP. The last two tests consider all the distributed generation resources and once the distribution network is disconnected (island mode).
According to the percentages of change in the short-circuit currents presented in
Table 7, the impact on the distribution network of the photovoltaic solar system, based on the non-rotating machines, is insignificant for the scheme. With the BES system, changes of approximately 4% in the short-circuit current affect the operation speed of the overcurrent relays. However, this affectation is minimum considering that the selected curves are very inverse (VI); as for extremely inverse curves, these changes could create more significant variations in the operating times of the relays.
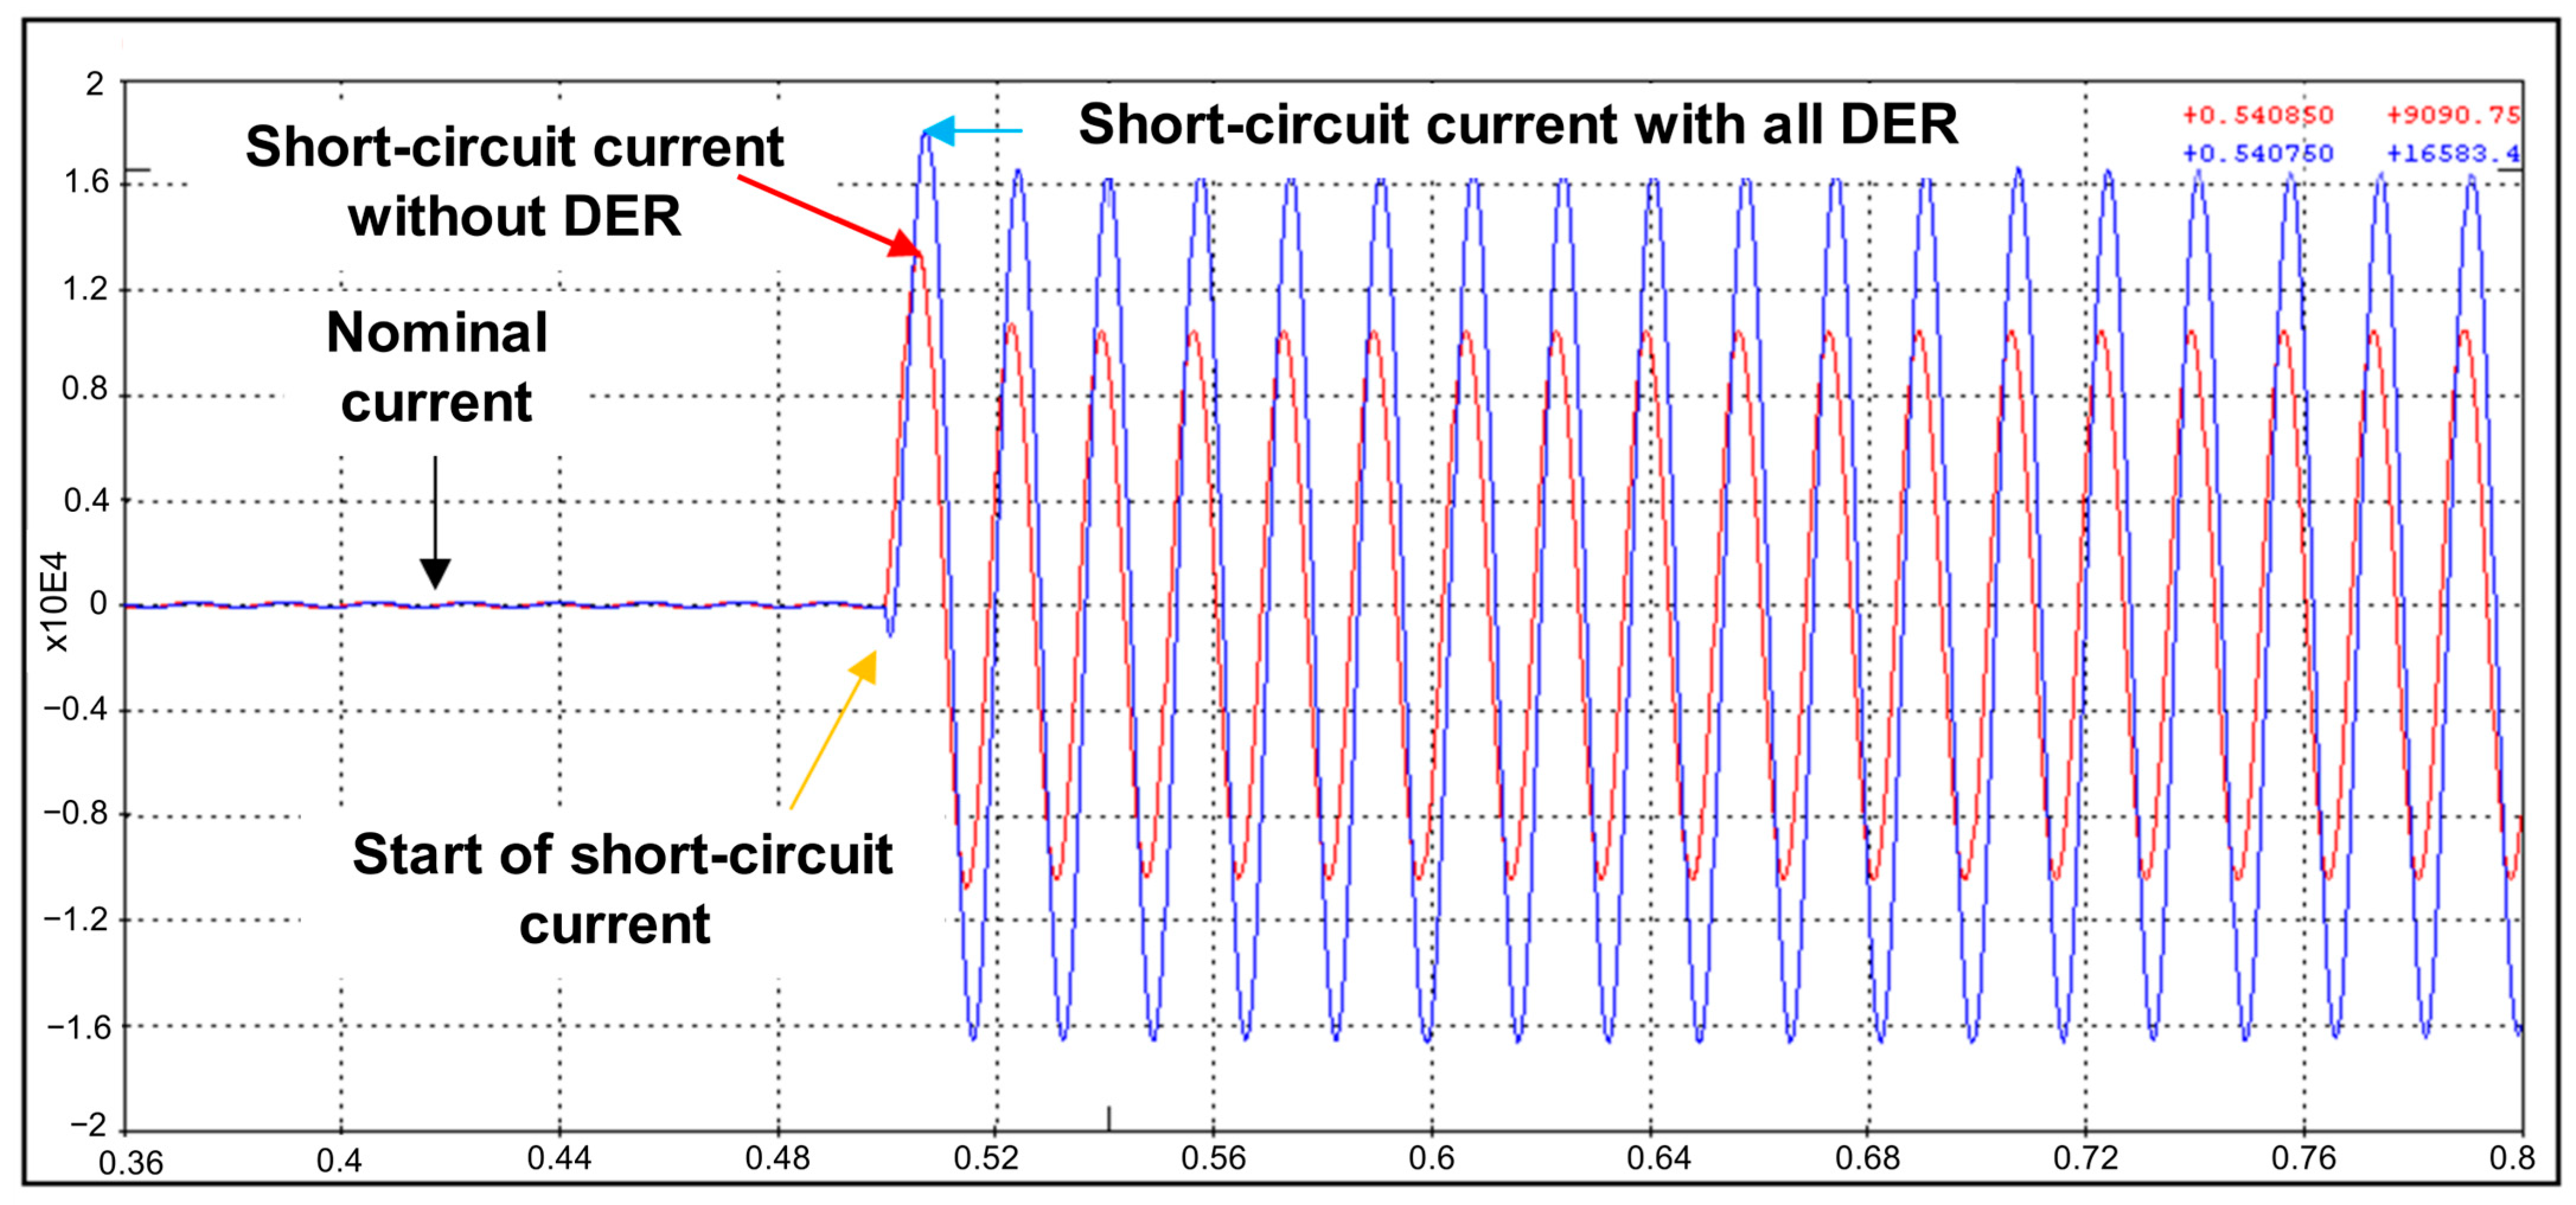
Figure 8 compares the two oscillographs with the short-circuit current in bus 5 and what is observable in relay 2. The blue signal corresponds to the short circuit in the network with the integration of all DER and the red signal to the fault without DER.
However, with more significant changes in the short-circuit current contribution related to LSSG, such as the CHP, SHP, and all DER, where there are more impacts on the relay operating times. This impact depends on the point where the fault occurs. When bidirectional power flows occur, the contributions to the fault come from the different buses where there is DER integration. However, the contributions seen by the relays are directly related to the sources.
4. Results and Analysis
In this section, the operation of the overcurrent protection scheme of a distribution network is evaluated before and after integrating DER. Hence, the operation sequences, operation times, and short-circuit currents in the distribution network are studied. Based on the operation of different scenarios, the behavior of the short-circuit current is analyzed, and the impact on the operation of the overcurrent relays connected with PHIL to the distribution network is identified.
4.1. Overcurrent Protection Validation
Three-phase short circuits are simulated in the network at three points to validate the fault clearance times and the selectivity of the relays. Thus, fault 1 is performed at bus 6, fault 2 is performed at bus 9, and fault 3 is performed in the high-side voltage of the transformer XFM-1. Next, all the results related to each scenario are presented with detailed information in tables and figures.
4.1.1. Three-Phase Fault at Bus 4 (Fault 1)
With fault 1, the coordination of relays 1, 2, and 3 in charge of protecting the first three-phase branch with its respective power transformer is verified. For the fault in bus 4, a simulation scenario is proposed where the IEEE 13-node test feeder operates with all the coupled distributed generation and without being connected to the power grid (island mode).
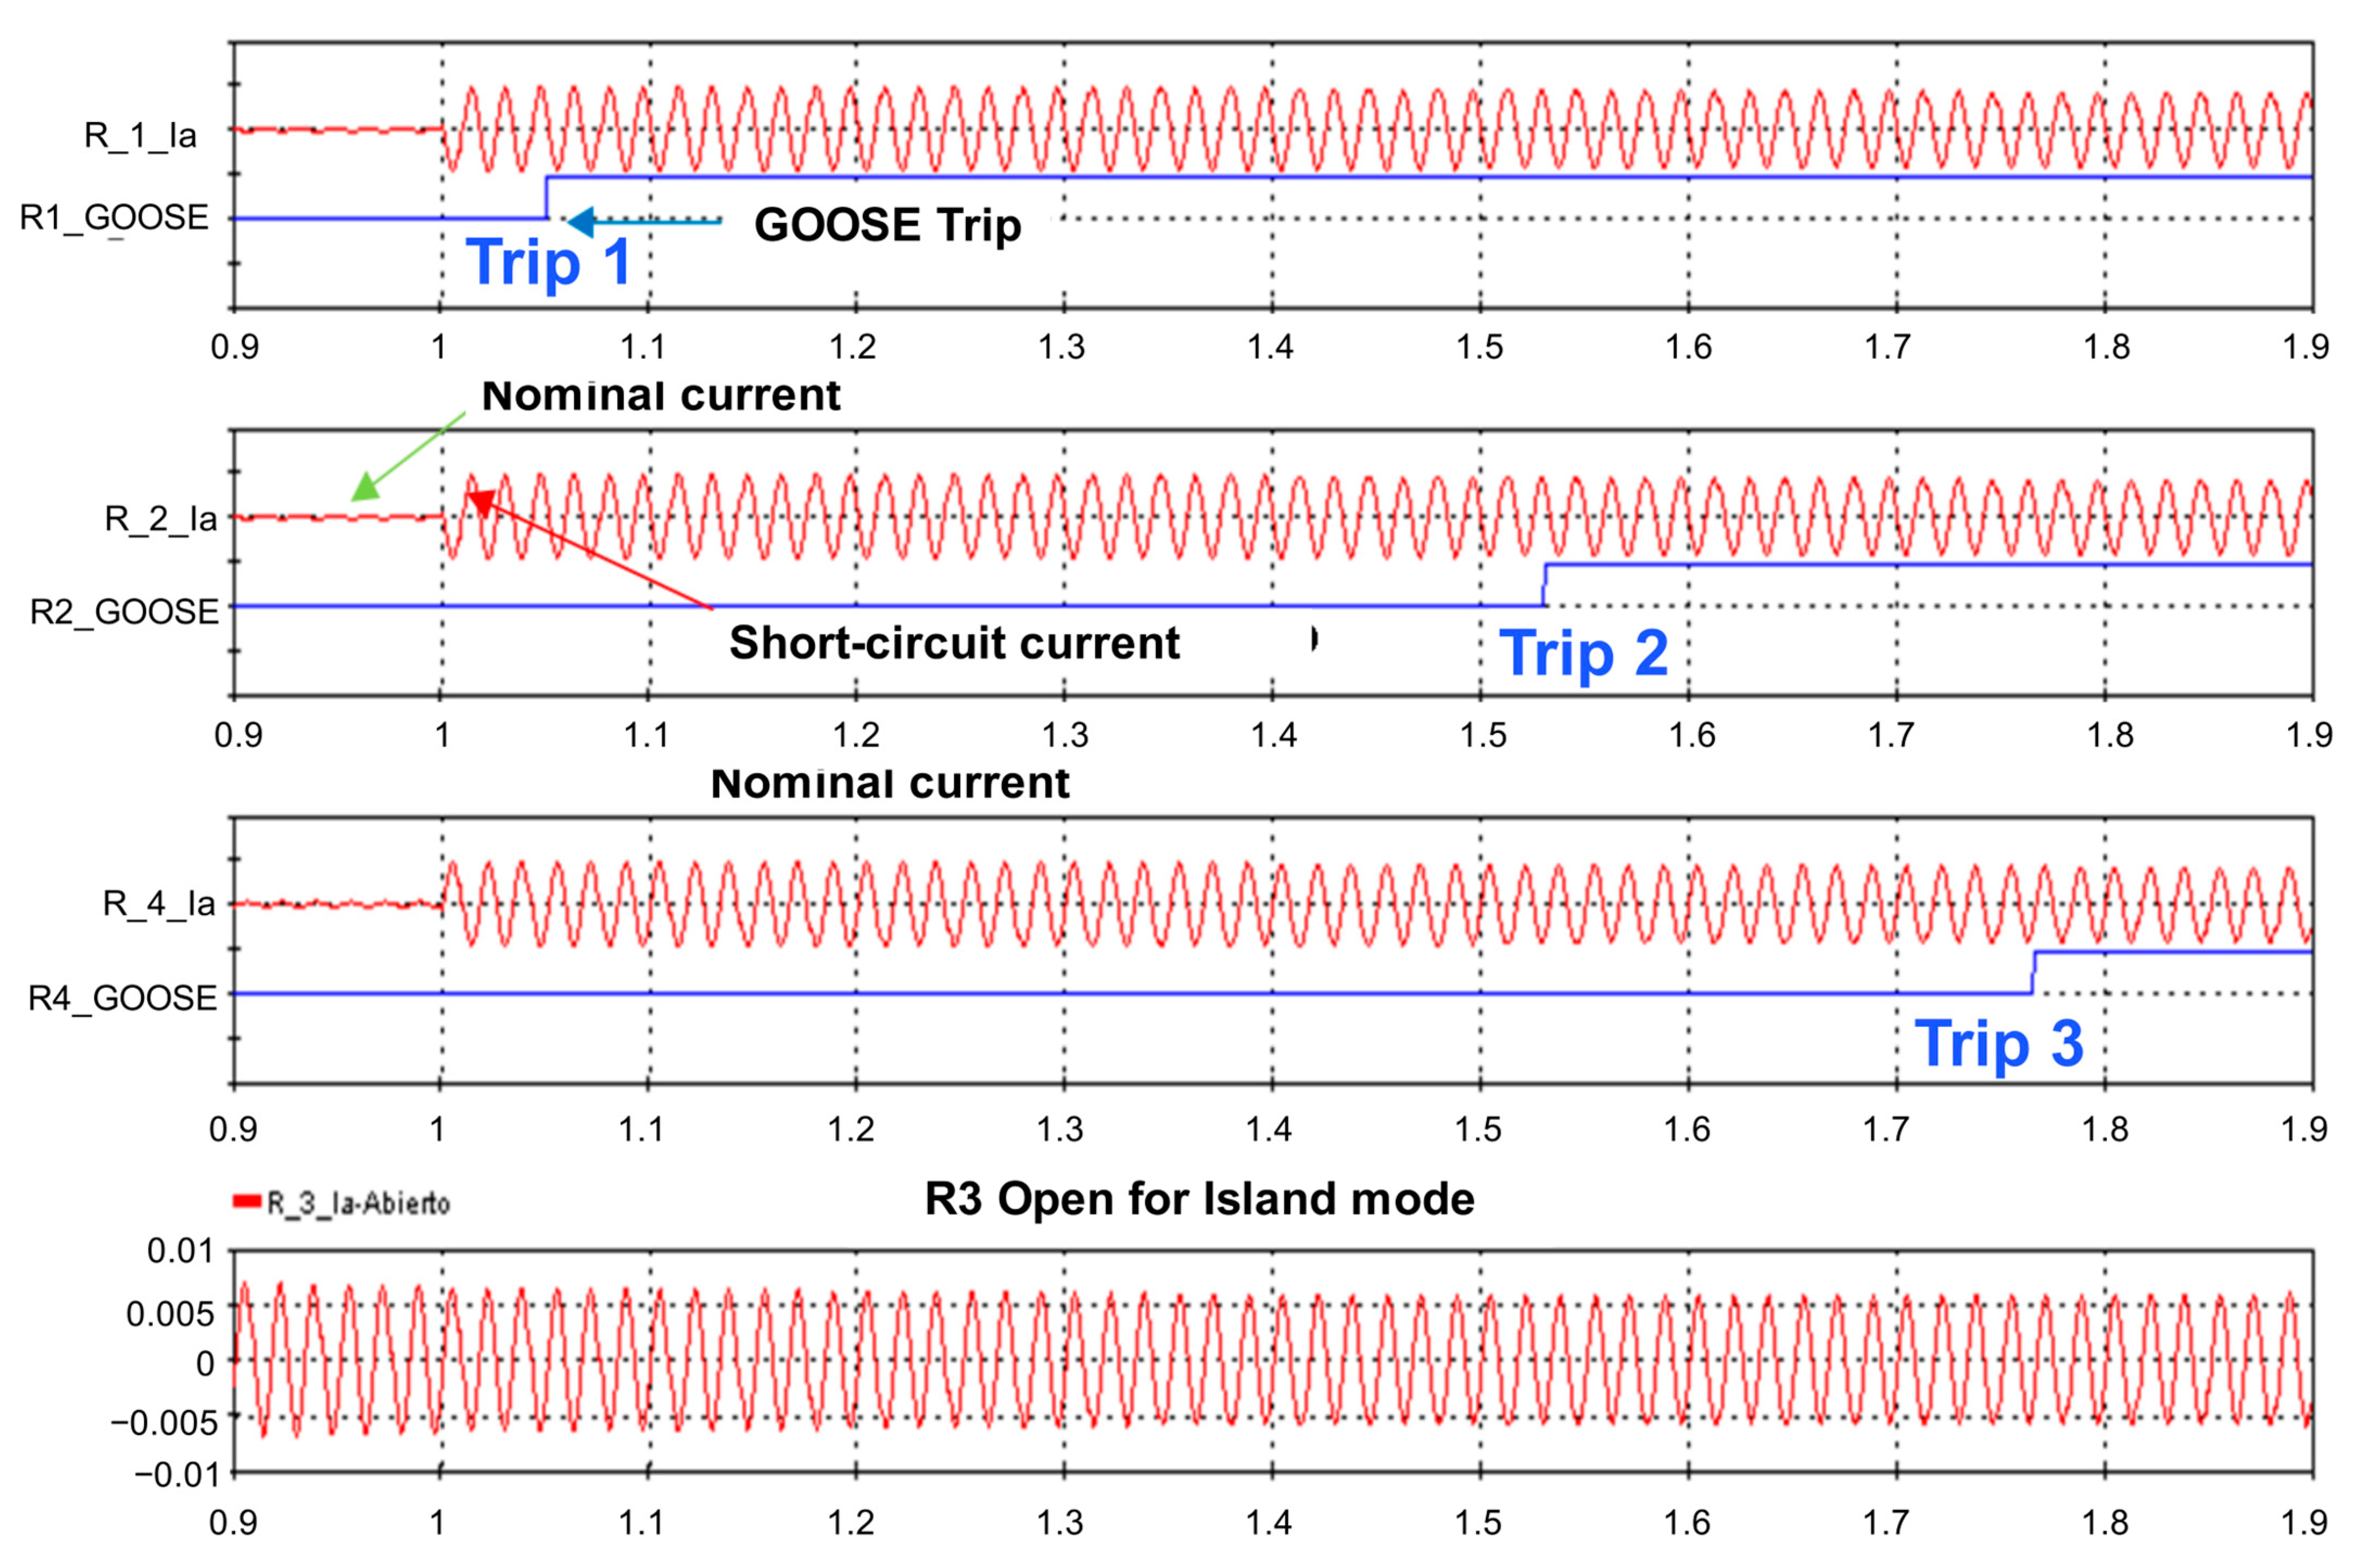
Figure 9 shows the short-circuit currents for a 2 s fault that starts in second 1. The oscillographs show the change from the nominal current to the short-circuit current. The GOOSEs of relay trips 1, 2, and 4 are also presented in the graphic, and the oscillographs of relay 3 showing that the current is close to zero when it works in island mode.
The IEEE 13-node test feeder undergoes changes in short-circuit currents and operating times, but despite these variations, the selectivity is not affected; therefore, the operating sequence is maintained. Then, relay 1 can clear the fault without any problem and in a prudent time of at least three cycles. It is also observed that relay 2 operates as a backup to relay 1, as indicated by the operation and backup selectivity criteria of the IEEE Std 242-2001 [
30].
The following observations can be obtained when comparing the operation sequence of the protection scheme for the distribution network working in island mode and connected to the power grid without DER (
Figure 10). In island mode, relay 3 does not operate as this relay does not see any contribution to the short-circuit fault. When the distribution network is connected to the network without DER, relay 3 works as backup protection for relay 2. In addition, a variation in the trips of relay 4 is observed for the distribution network connected to the power grid and without DER, as this equipment does not have to operate, and no contribution of short-circuit fault is observed. With the distribution network working in island mode with DER, relay 4 registers the contributions to short-circuit currents and operates as a backup for relay 2 in case relays 1 and 2 cannot clear the fault.
The PHIL scheme evaluates the performance of the real overcurrent relays.
Table 8 presents the characteristics of each relay for clearing the faults. A comparison is made between the operating times taking as reference the theoretical value calculated with the trip curve of each relay in off-line simulation software and the times obtained from the digital twin. Thus, this comparison is made with the same short-circuit current (Isc).
The absolute errors do not exceed the offset criteria for static and electronic relays, according to IEEE Std 242-2001 [
30]. This indicates that relays 1, 2, and 4 are operating correctly.
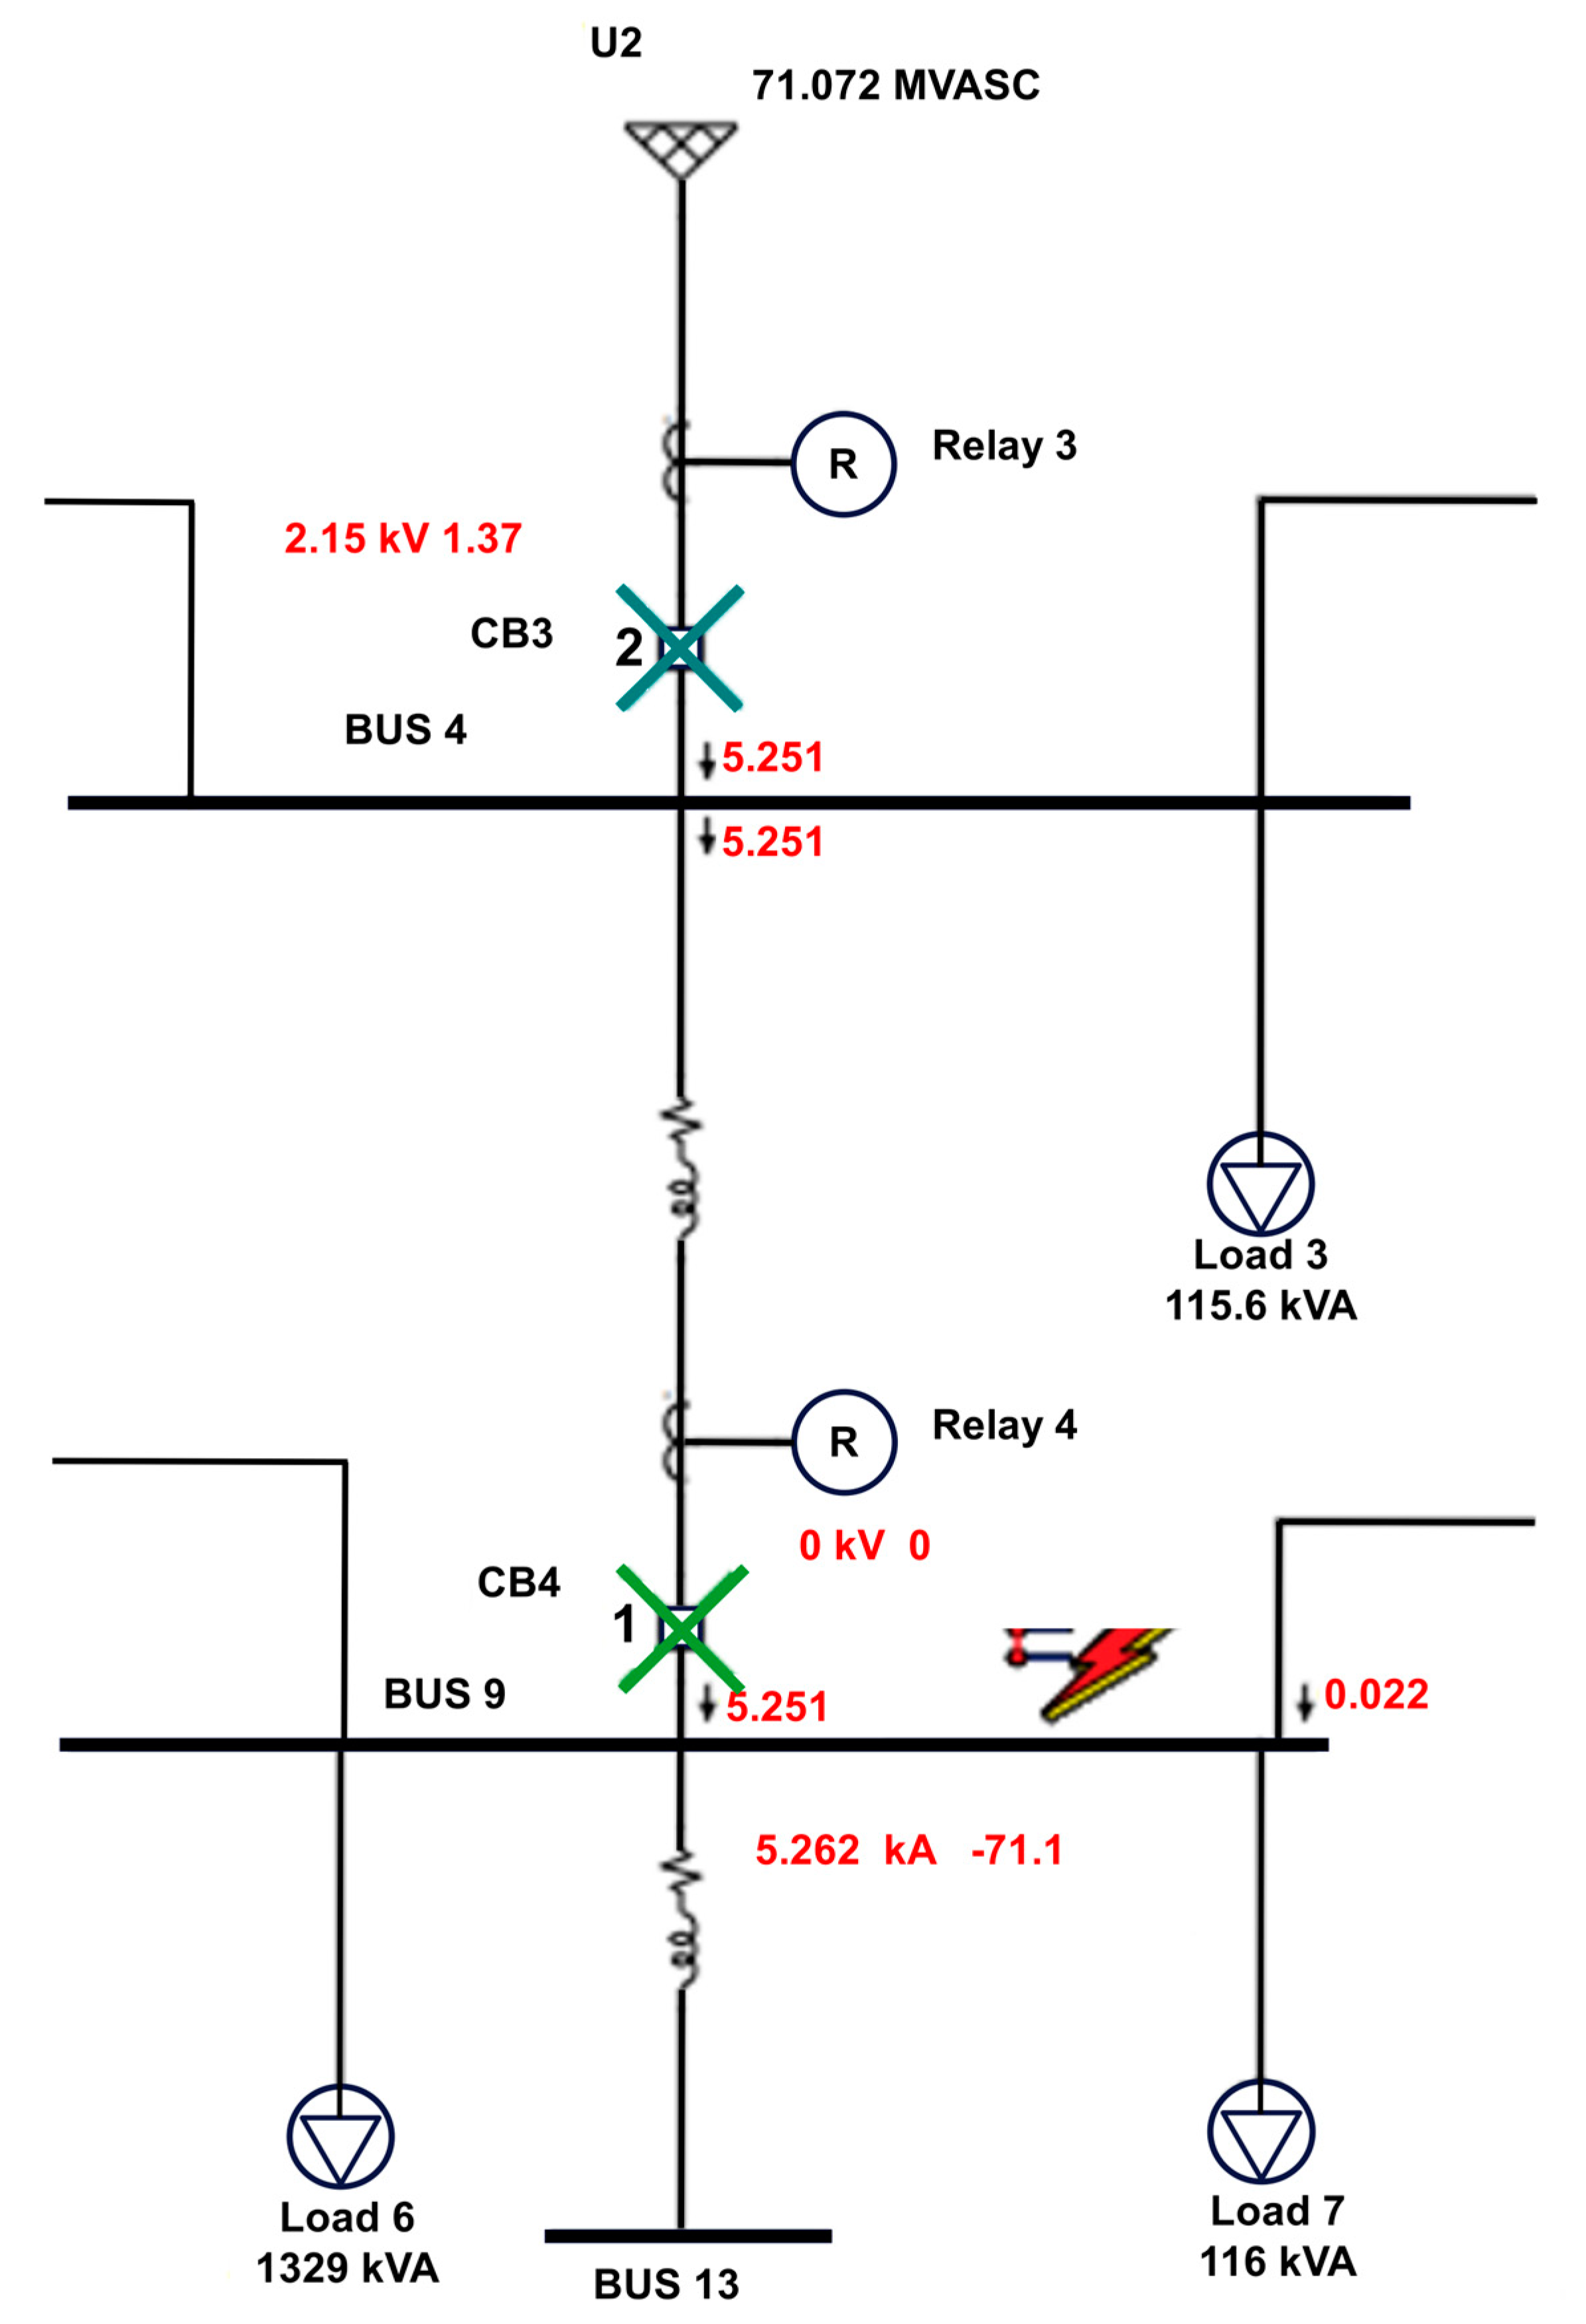
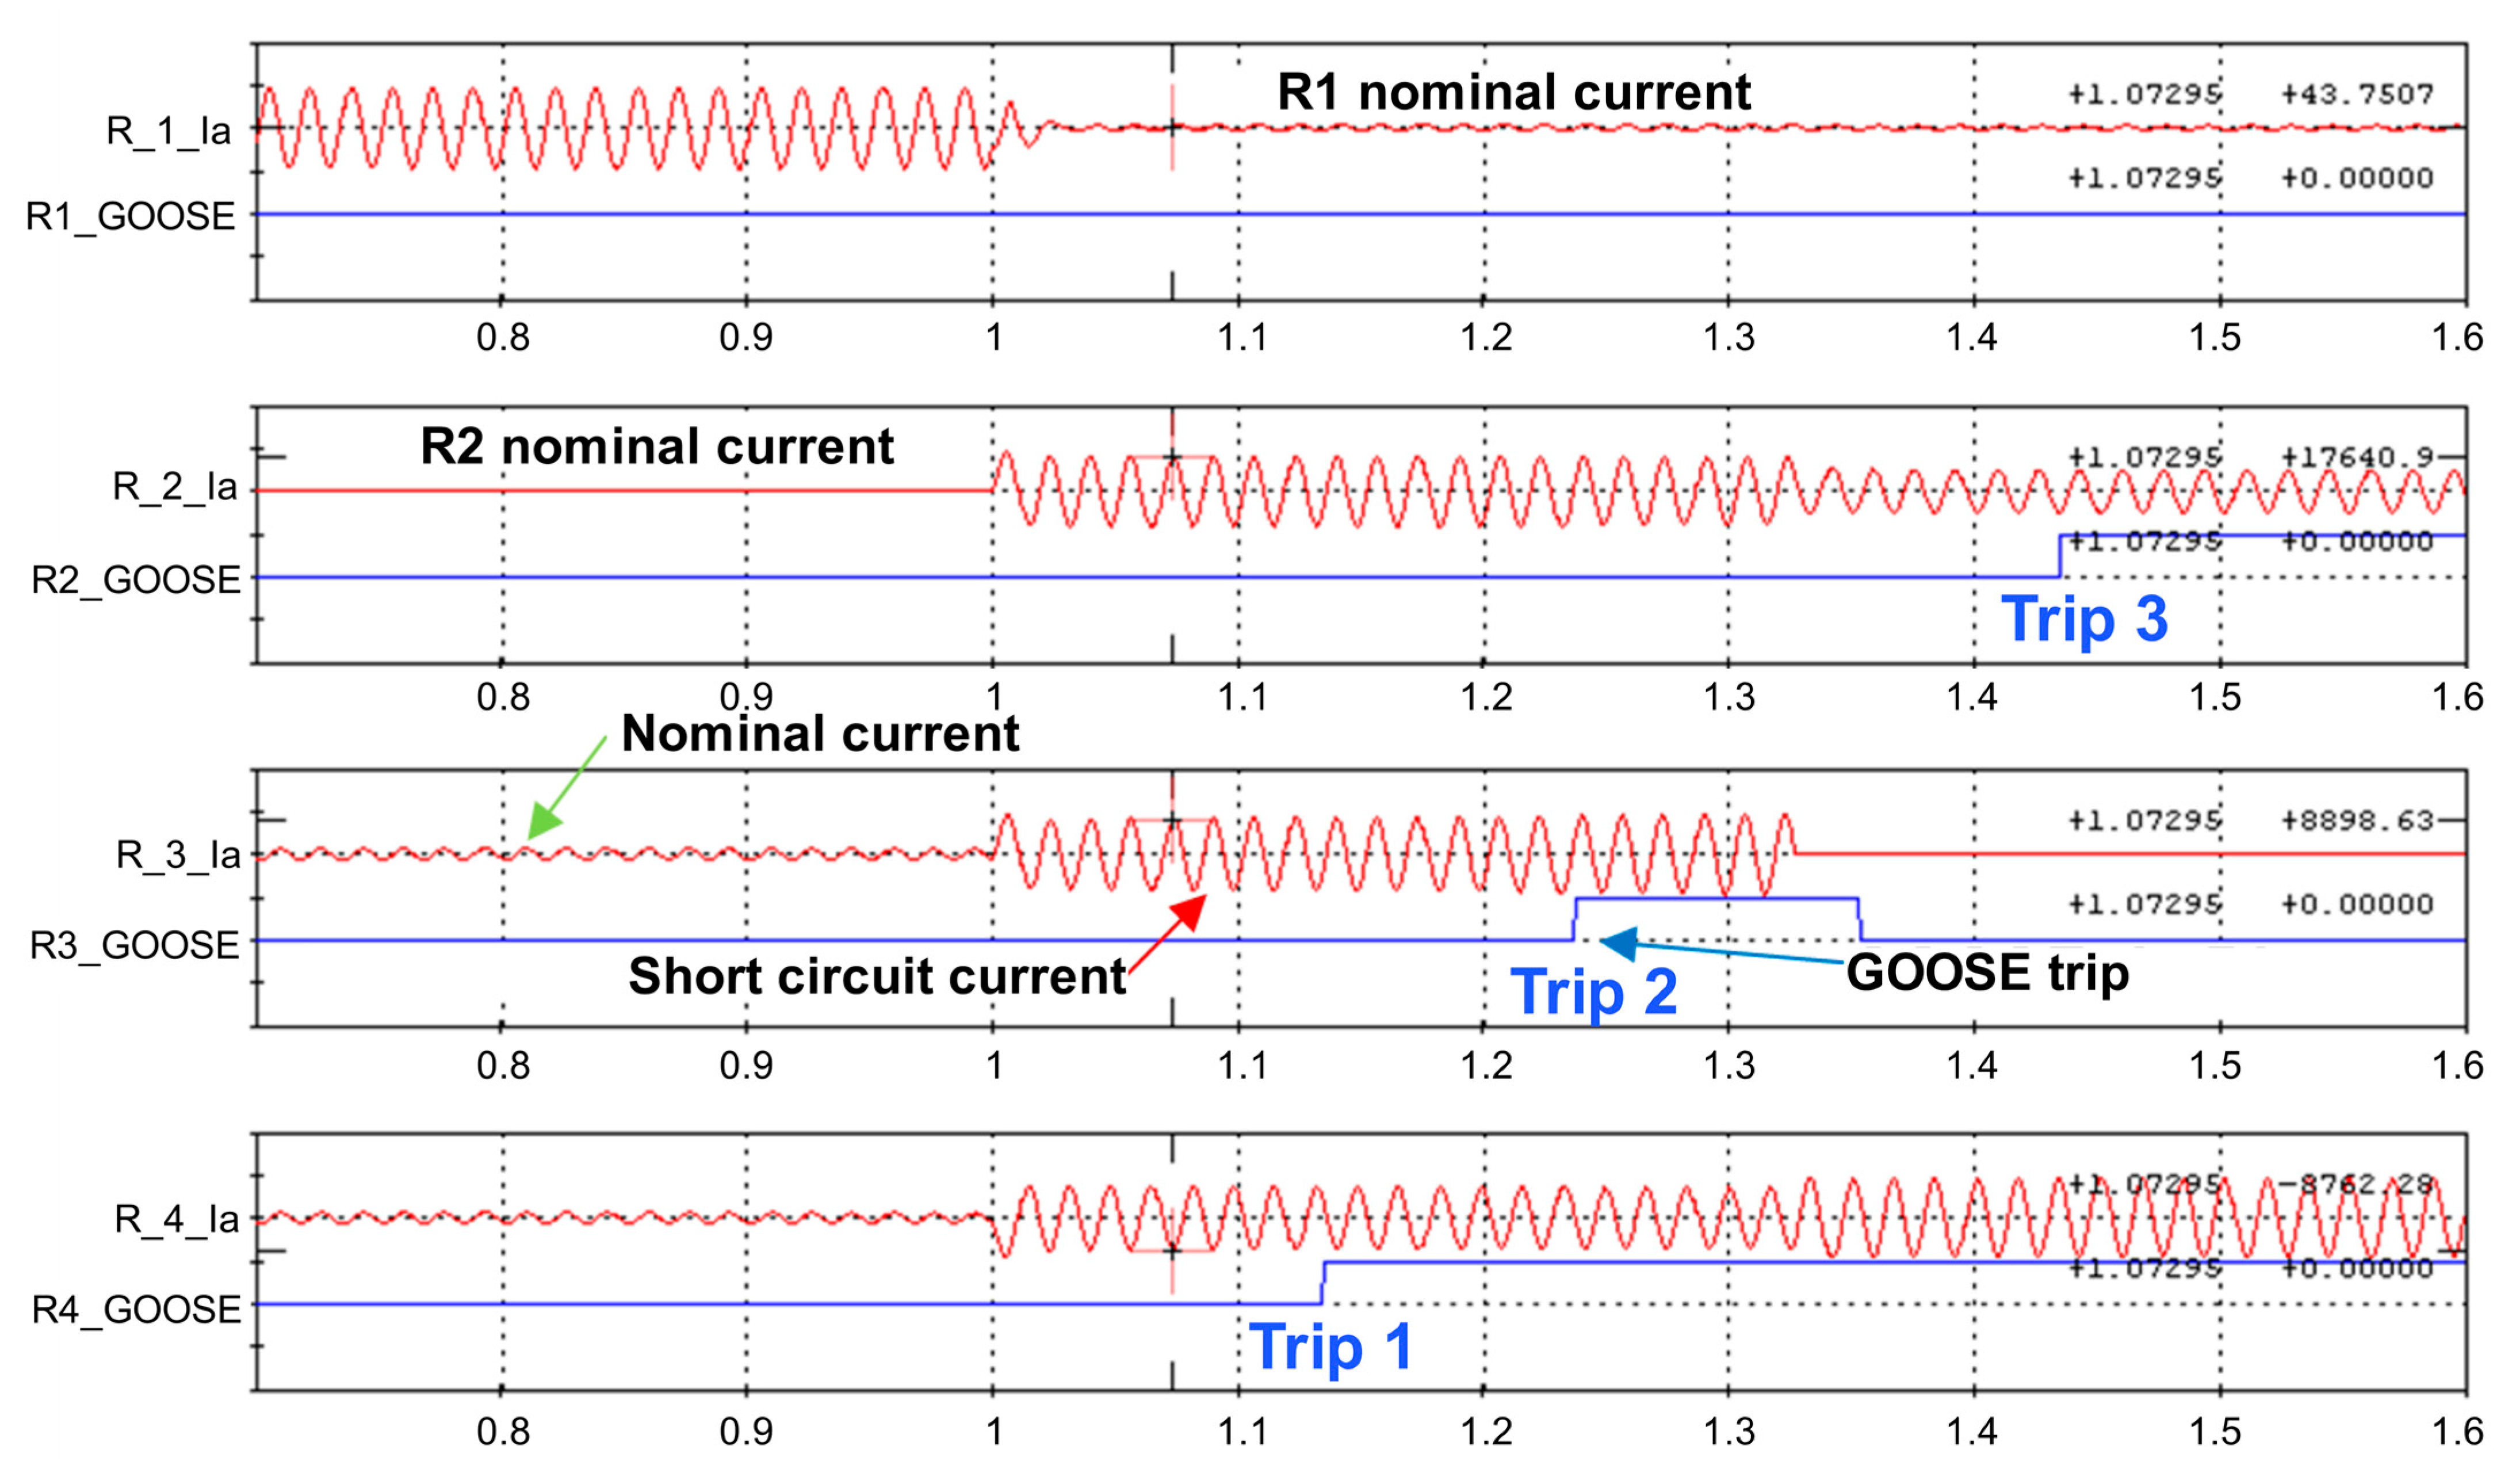
4.1.2. Three-Phase Short Circuit in Bus 9 (Fault 2)
With fault 2, the coordination of relays 3 and 4 that protect the main circuit is verified. For the fault at bus 9, a simulation scenario is proposed with the distribution network connected to the power grid and with low integration of DER, coupling only the PV and the BES systems.
Figure 11 shows the short-circuit currents in the event of a 2 s fault that starts in second 1. The oscillographs show the change from the nominal current to the short-circuit current. In addition, the results of the GOOSE messages of relay trips 3 and 4 are presented. In conclusion, for this test case, the changes in short-circuit currents are minimal as the contribution of this DER is limited.
When comparing the operation sequence presented in
Figure 10 with the operation sequence of
Figure 12 (distribution network without DER), it is seen that the operation sequence is maintained. Based on protection scheme coordination, relay 4 can clear faults quickly, as expected. Then, relay 3 is as a backup to relay 4, as indicated by the IEEE Std 242-2001 operation and backup selectivity criteria [
30]. Relays 1 and 2 do not operate because the fault does not affect the buses that these relays protect.
Figure 12 shows that the current that the relays are sensing is the nominal load current.
When evaluating the performance of the real overcurrent relays with the PHIL scheme,
Table 9 presents the characteristics of each relay for fault clearing. A comparison is made between the operating times, taking as reference the theoretical value calculated with the trip curve of relays 3 and 4 in off-line simulation software and the times obtained from the digital twin. The comparison is made with the short-circuit current (Isc) registered by the relays.
The absolute errors of
Table 9, where the difference of 198 ms in operation in relay 3 and the difference in 11 ms of relay 4, do not exceed the offset criteria for static and electronic relays according to the IEEE Std 242-2001 [
30]. This indicates that relays 3 and 4 are operating correctly.
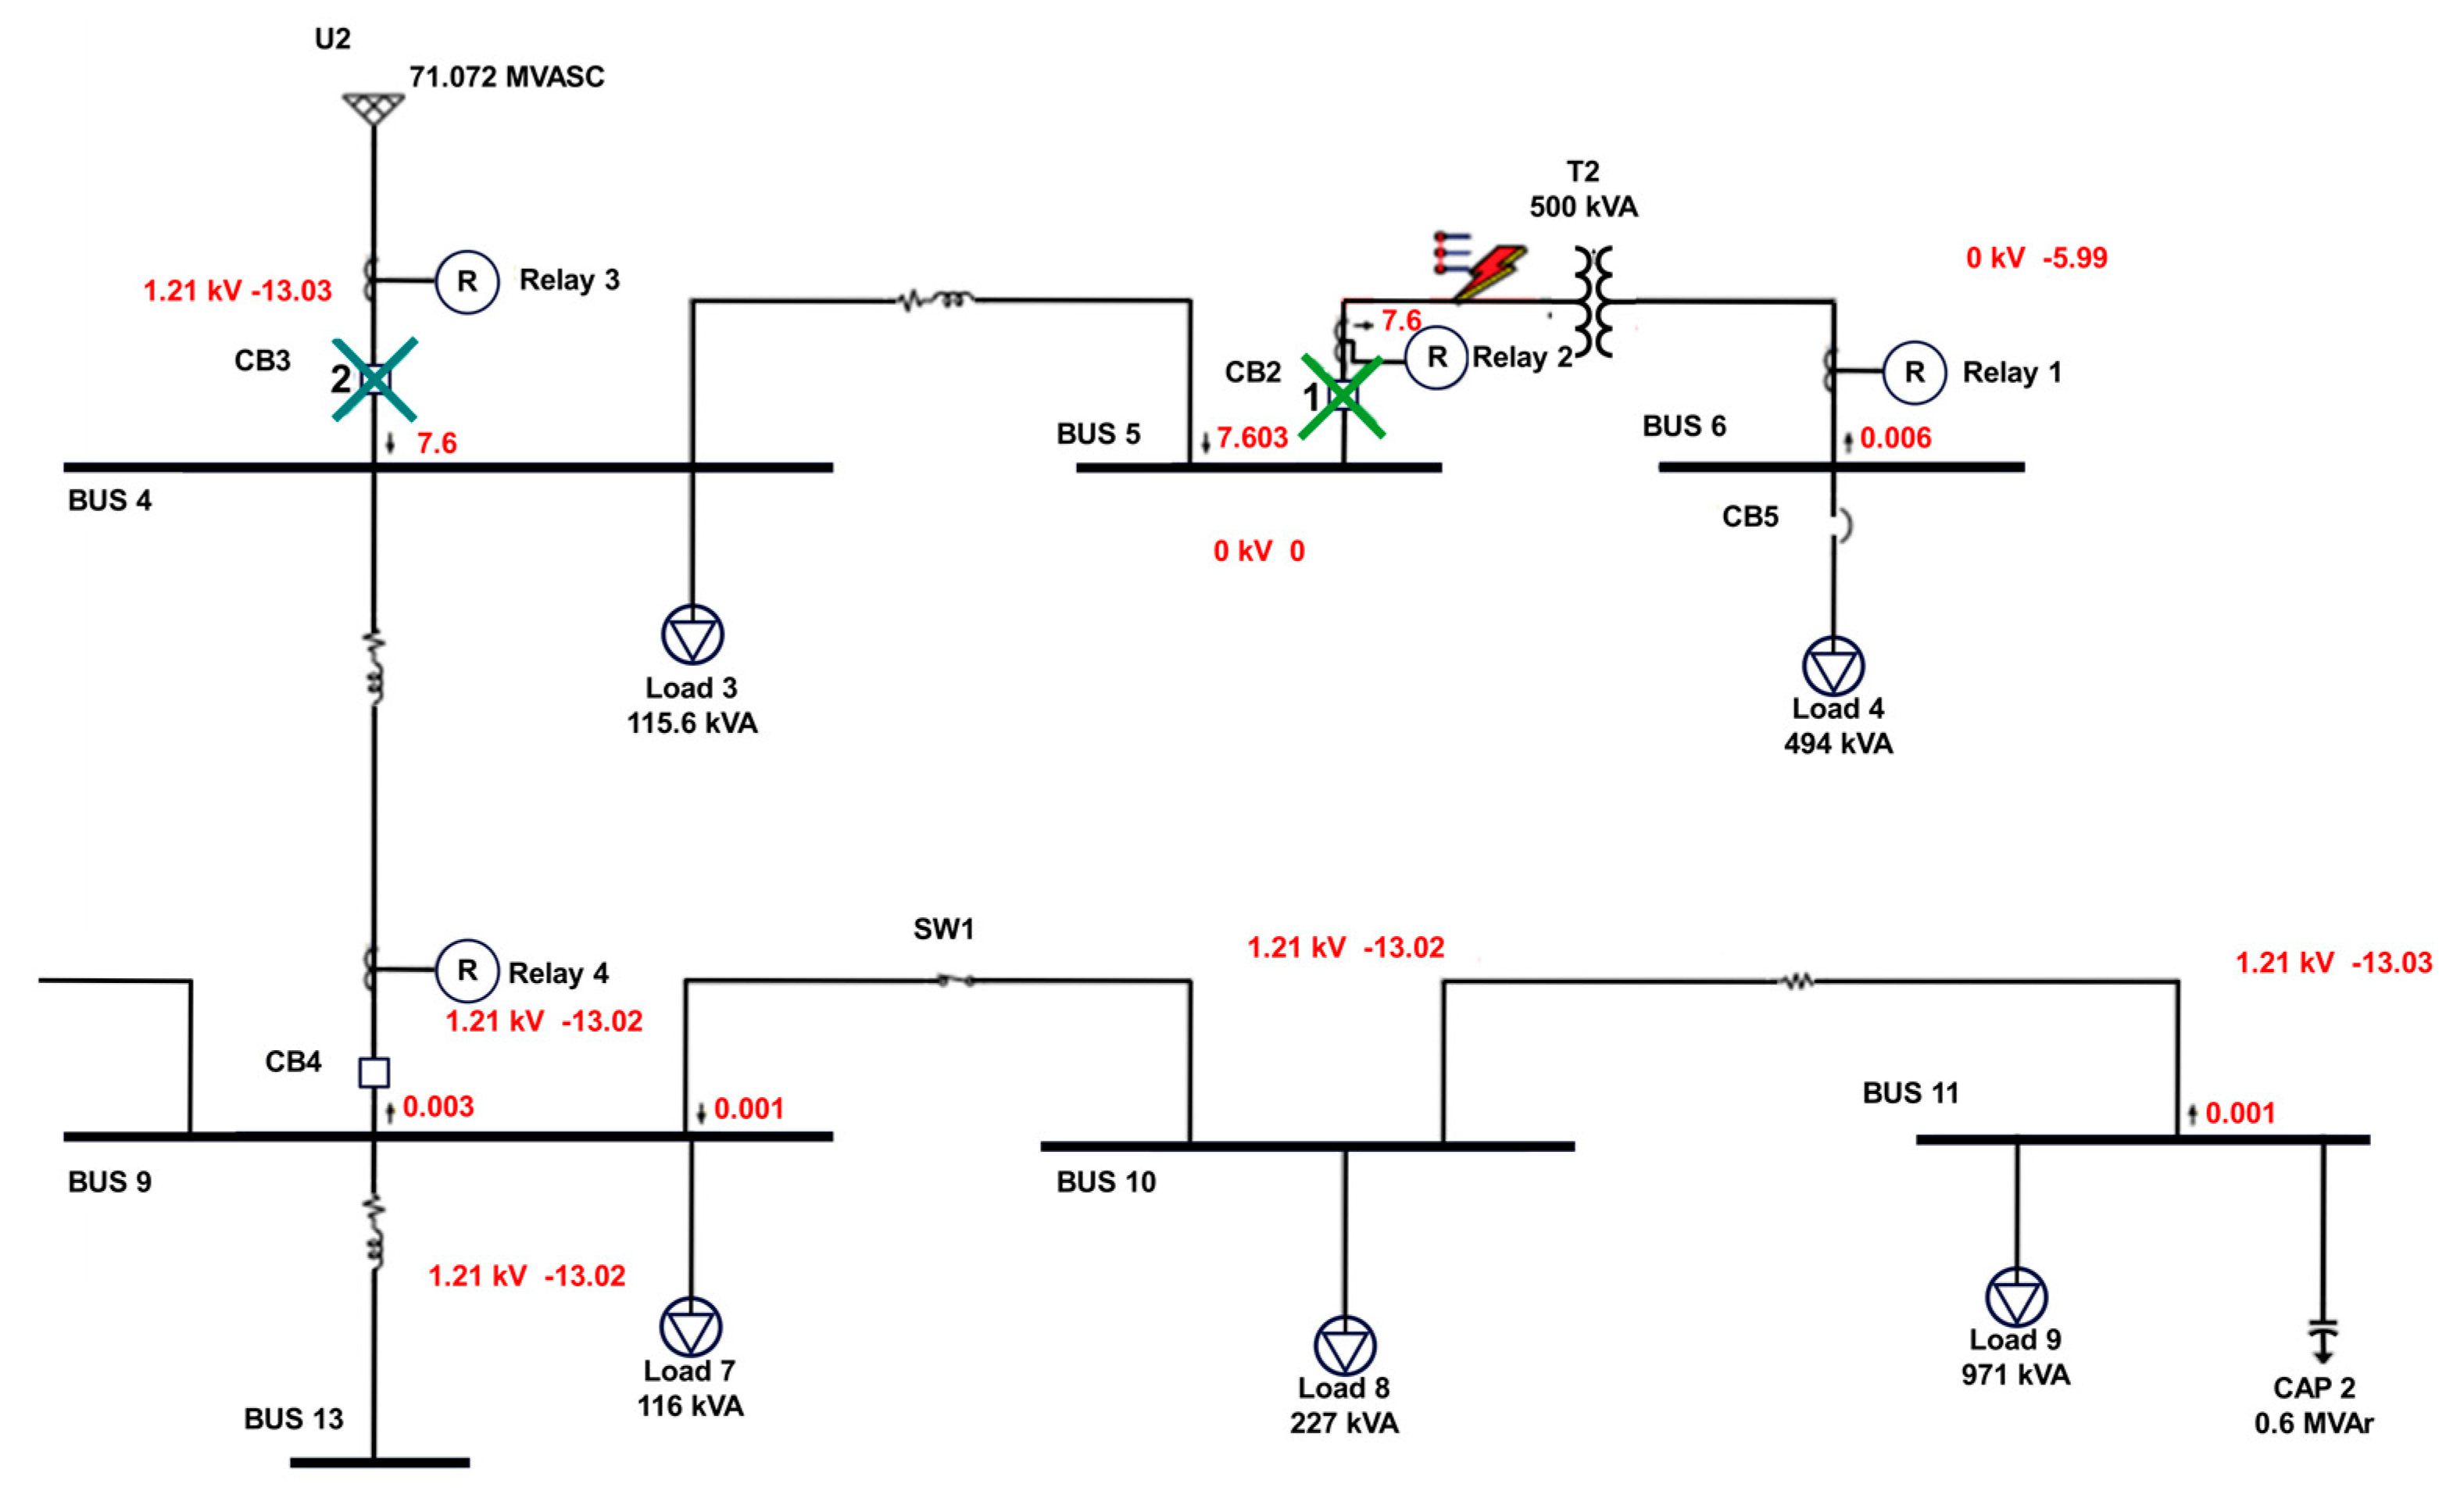
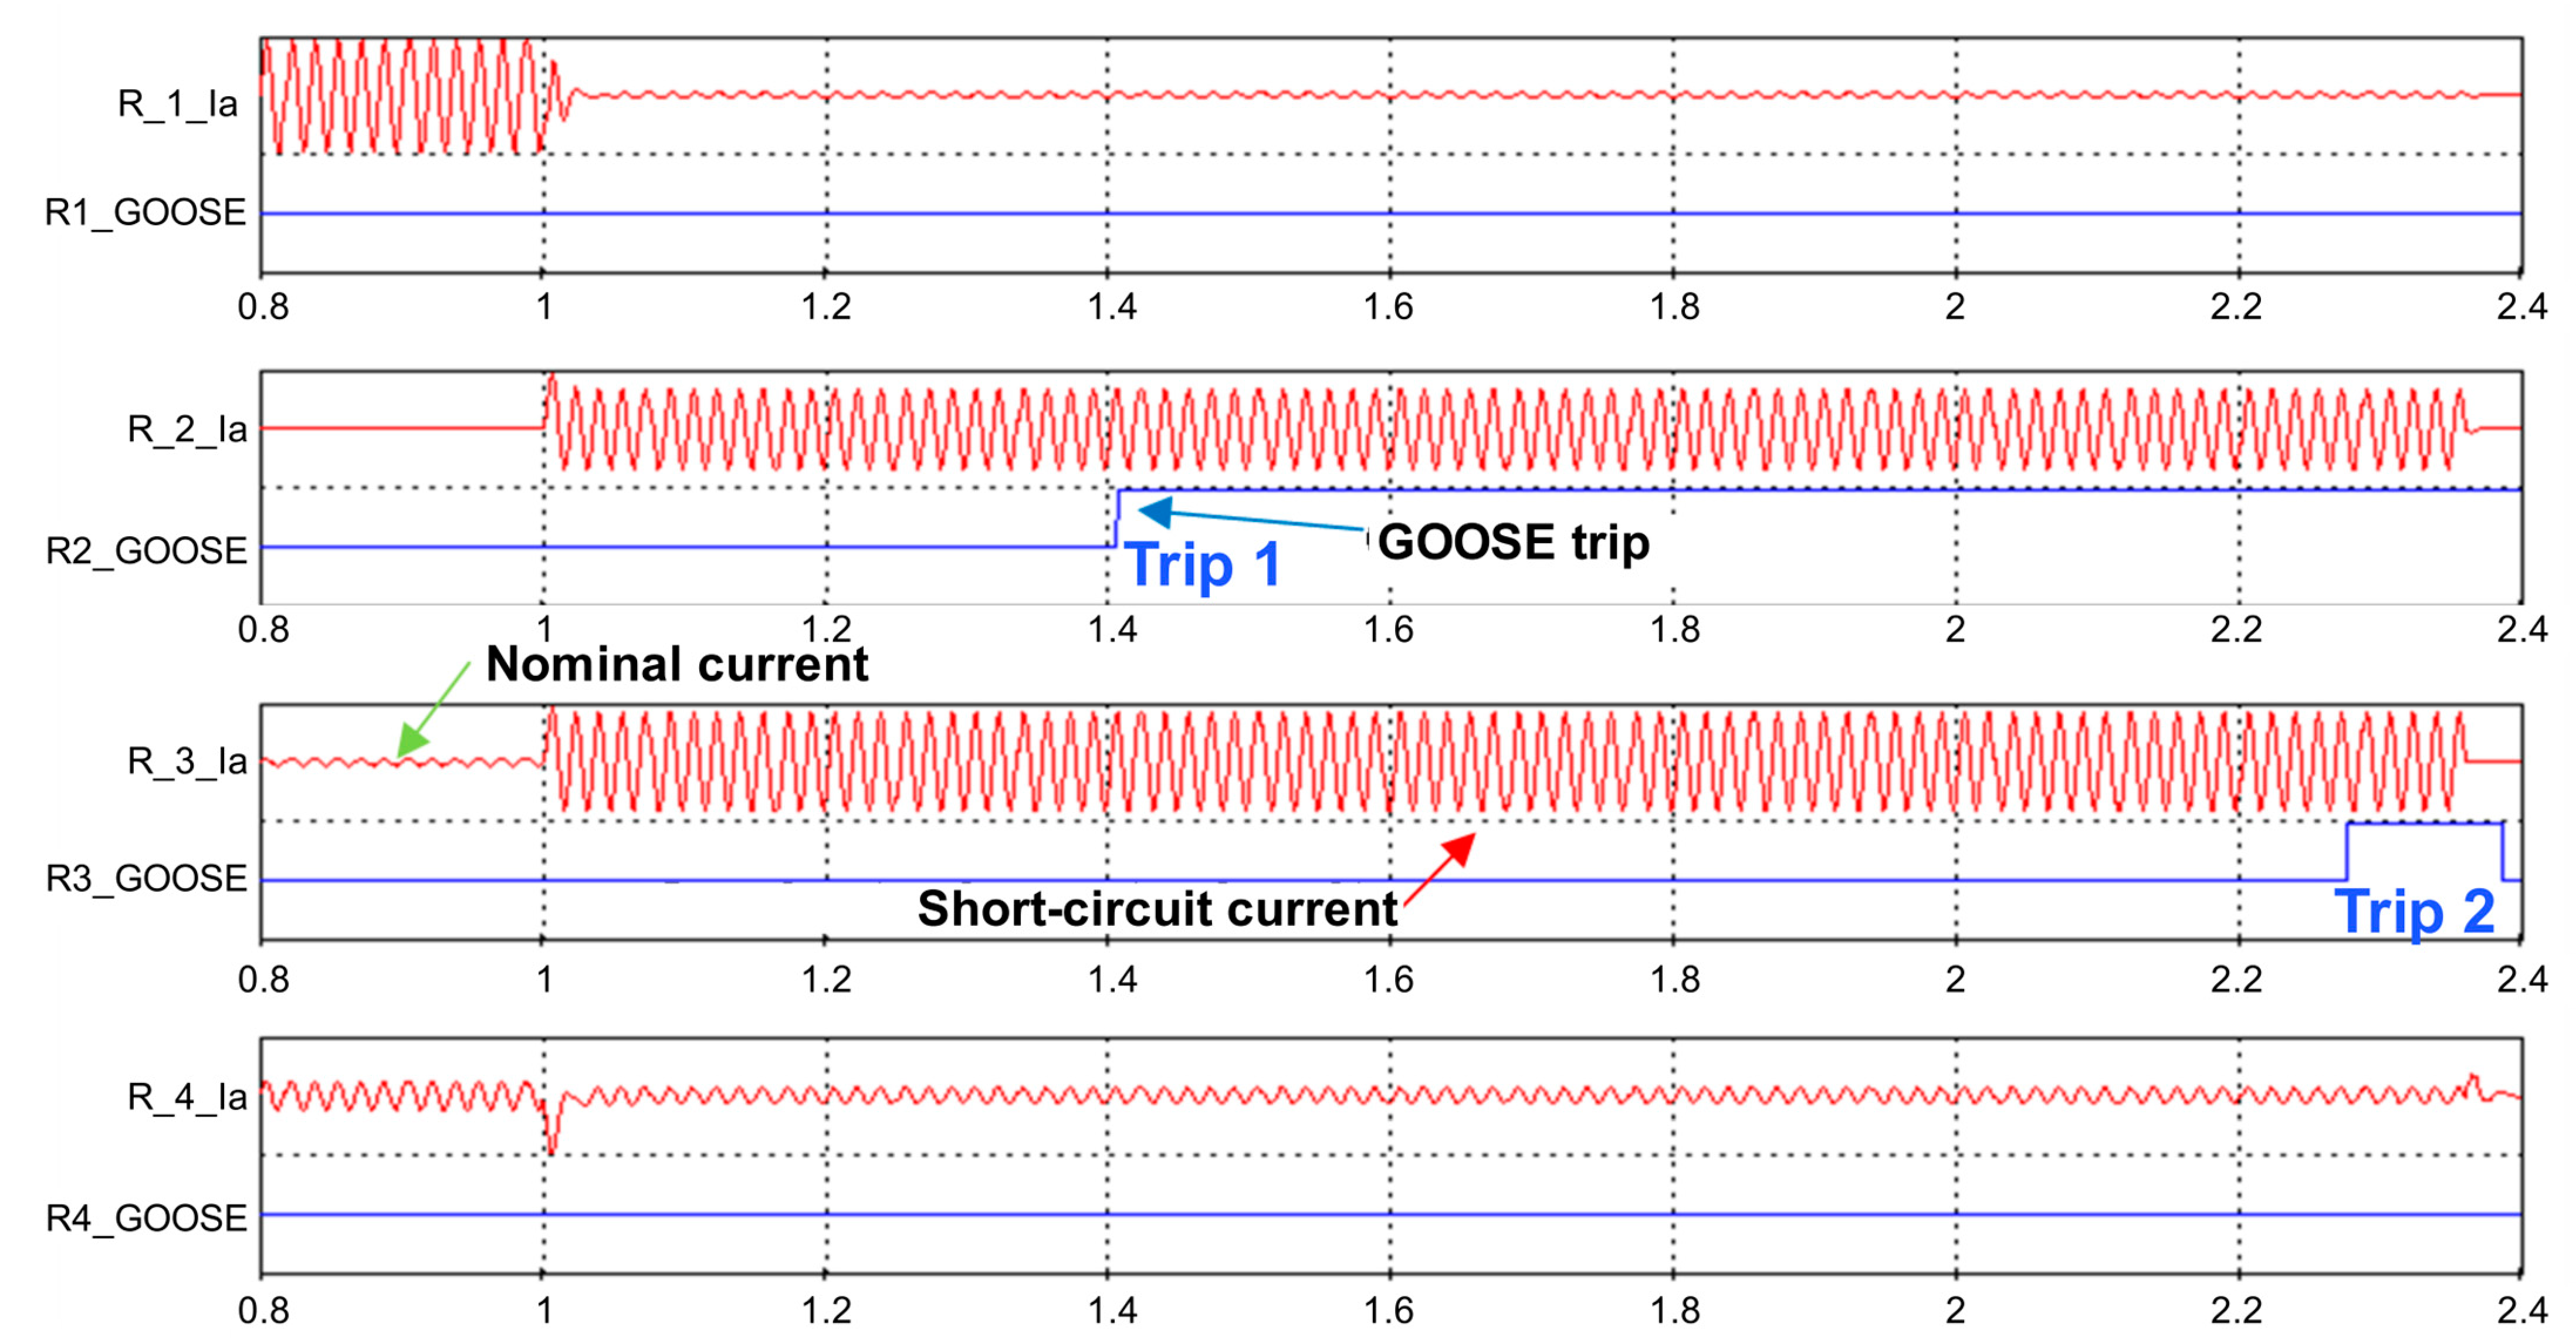
4.1.3. Three-Phase Short Circuit between Bus 5 and the High Side of the Transformer (Fault 3)
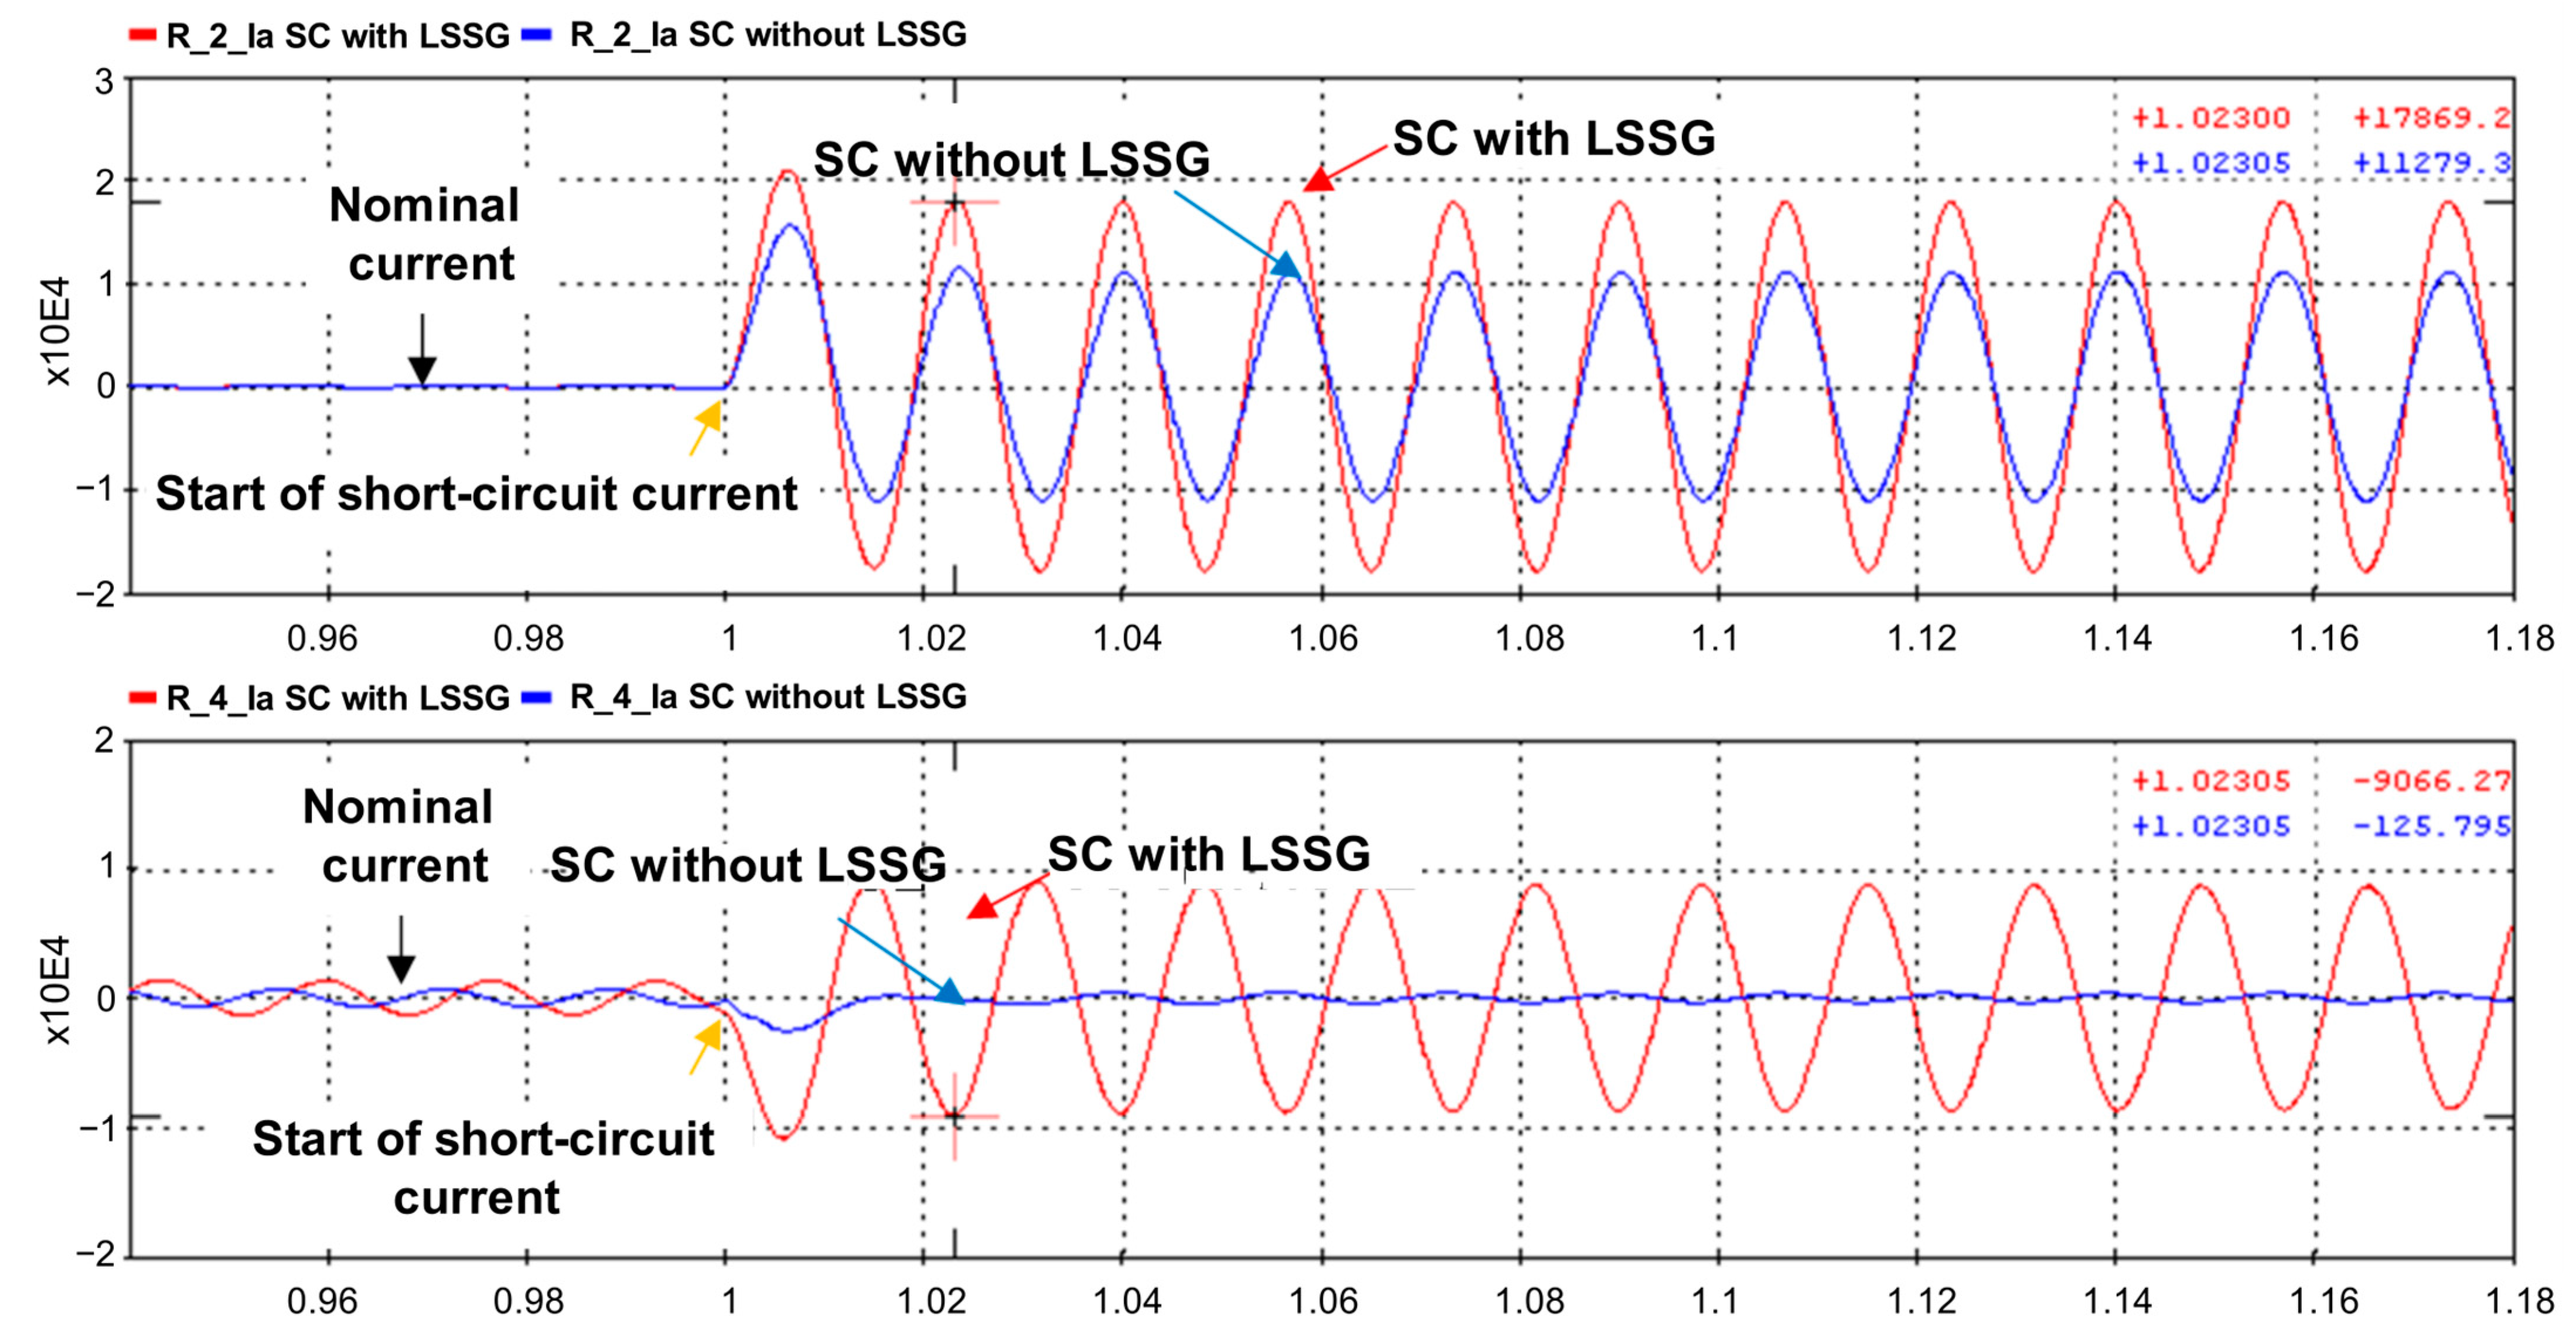
Finally, with fault 3, a case of “false trip” occurs, and a loss of selectivity of the protection scheme is presented. For the fault between bus 5 and the high side of the transformer, a simulation scenario is proposed where the distribution network operates with the maximum integration of DER. The LSSG is represented by the 10 MW SHP and CHP of 5 MW. The SSSG is represented by 100-kW PV and 1-MW BES systems. The distribution network operates connected to the power grid.
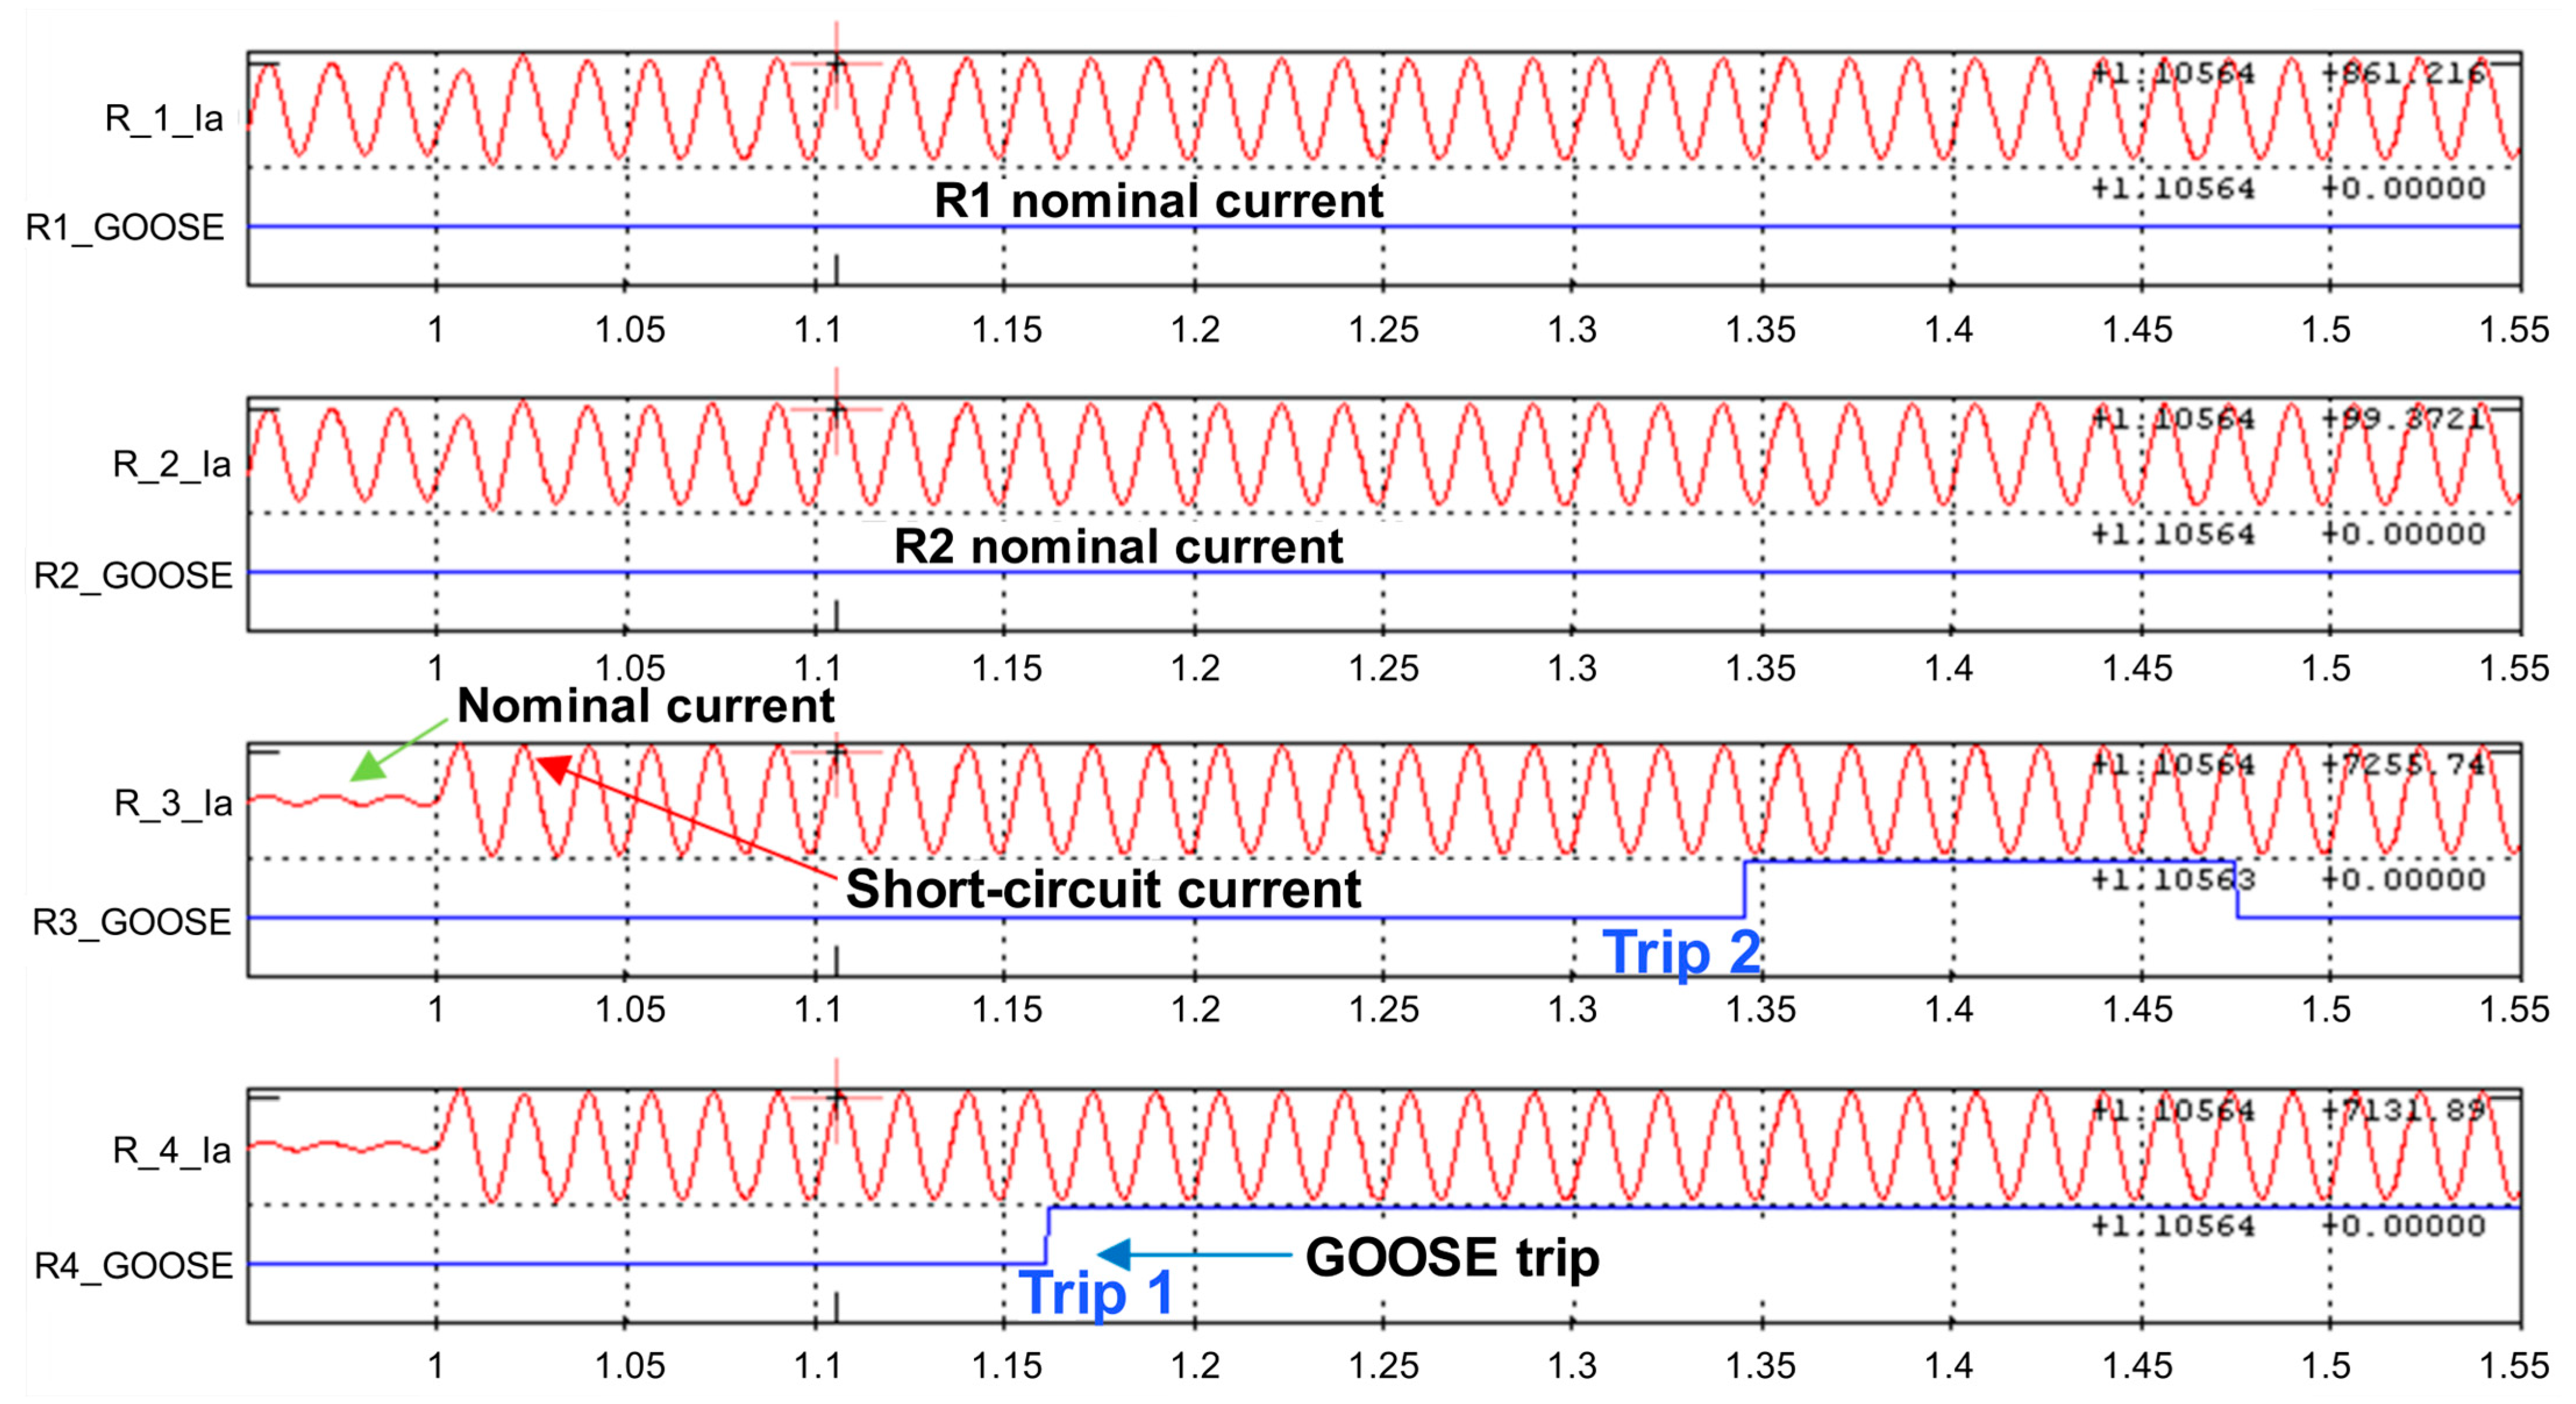
Figure 13 shows the short-circuit currents in the event of a 2 s fault that starts in second 1. The oscillographs show the change from the nominal current to the short-circuit current. In addition, the GOOSE messages of relays 2, 3, and 4 are presented. Relay 1 does not sense fault currents and shows that the nominal current falls just after the fault starts because of the dynamics of the DER models. The fault occurs in the operation zone of relay 2, and this protection relay must clear the fault with its function 50 due to the magnitude of the short-circuit current. However, the operation sequence obtained from the digital twin shows that the first relay to operate is 4, disconnecting a large part of the IEEE 13-node test feeder and resulting in a loss of selectivity of the protection scheme.
IEEE Std 242-2001 indicates that faults must be cleared in the shortest possible time [
30], isolating the smallest part of the system that contains the fault condition. In case of a false trip [
36], the loss of selectivity occurs due to the unnecessary operation of relay 4 for faults outside of the operating zone. Unexpected contributions from the DER can lead to a situation where one relay operates with another relay meant to detect the fault, resulting in a malfunction of the protection scheme.
Figure 14 shows that the operation sequence changes. Relay 4, in the network without DER, does not operate as it does not see significant contributions to the short-circuit current. The first protection to clear the fault is relay 2, isolated from the lower part of the distribution network. This action disconnects only Lump1 without causing significant effects on the network.
When evaluating the performance of the real overcurrent relays with the PHIL scheme,
Table 10 presents the characteristics of each relay for fault clearing. A comparison is made between the operating times, taking as reference the theoretical value calculated with the trip curve of the relays 2, 3, and 4 in off-line simulation software and the times obtained from the digital twin. The comparison is made with the short-circuit current (Isc) registered in the relays.
The absolute errors calculated in
Table 10 show the difference in its operation of 127 ms for relay 2, 60 ms for relay 3, and 3 ms for relay 4. These differences do not exceed the offset criteria for static and electronic relays defined by IEEE Std 242-2001 [
30]. This indicates that relays 1, 2, and 4 are operating correctly.
4.2. Sensitivity Analysis of Coordination after Integrating DER
To validate how the integration of DER in the distribution network can affect the selectivity of the overcurrent protection scheme with fault 3, another simulation scenario of the IEEE 13-node test feeder is proposed. This scenario consists of disconnecting the 10-MW SHP. Other power sources, such as PV, BES, and CHP, maintain the connection in the network.
Figure 15 shows the behavior of the currents in the network registered by the relays when fault 3 is presented. The result indicates that the selectivity of the protection scheme is not lost, and relay 2 is the first to operate, isolating the faulty section of the network as shown in IEEE Std 242-2001 [
30].
If the short-circuit fault, oscillographs registered by relays 2 and 4 are compared in the two proposed scenarios (with coupling and without coupling of the 10 MW SHP).
Figure 16 shows the increases in the short-circuit current experienced by the protection relays. Relay 4 experienced a considerable increase in short-circuit current due to the contribution of the SHP, which makes this relay operate faster than relay 2, causing the loss of selectivity of the protection scheme.
4.3. Selectivity Curves
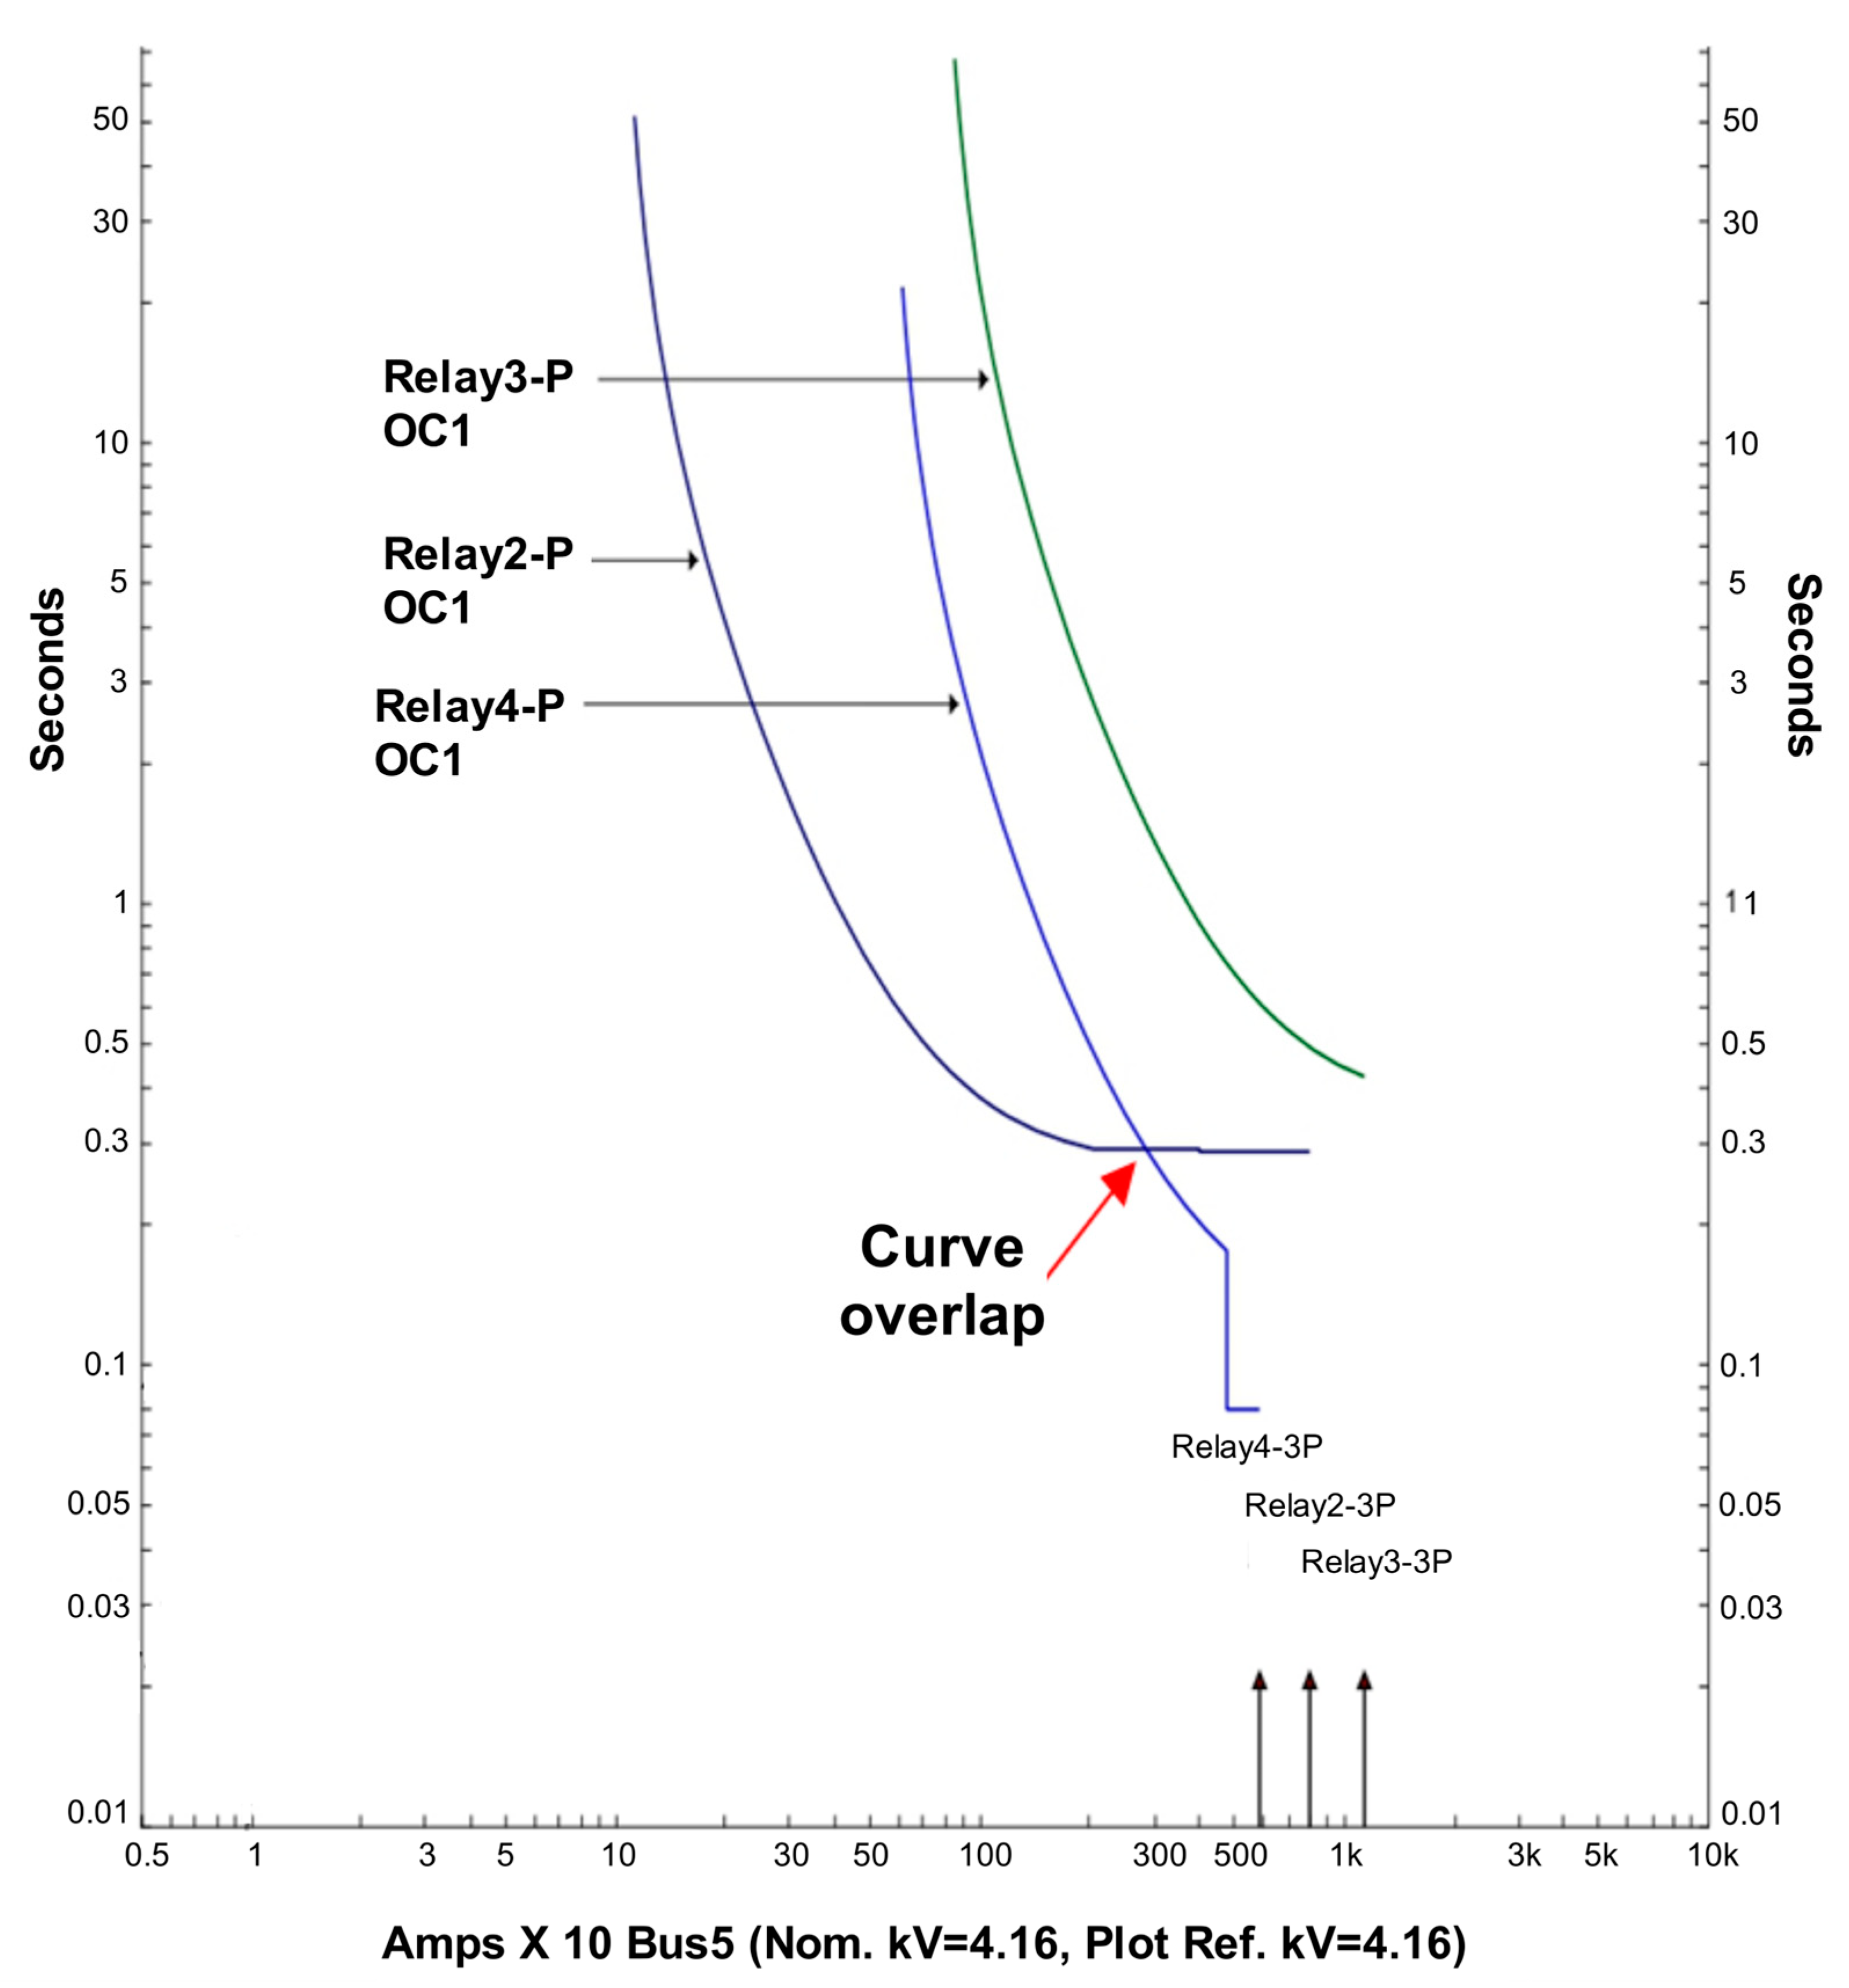
Figure 17 shows the selectivity curve for the false trip due to an overlap between the curves of relays 2 and 4. For a current range greater than 3 kA, the selectivity of the proposed protection scheme is lost.
According to the results shown in
Figure 17, this overlap occurs because DERs are not considered when coordinating protections in the distribution network. In addition, when the DERs are operating in the distribution network, there is a lack of coordination between relays 2 and 4. Therefore, the use of digital twins makes it possible to quickly demonstrate this lag in around the order of milliseconds. In the same way, several alternatives can be validated to solve this situation and improve the protection equipment to avoid this overlap between the curves.
As evidenced in this
Figure 17, one of the main contributions of this work is to be able to make decisions through the digital twin and thus determine the new adjustment and coordination of the relays through a hardware-in-the-loop test, moving the curve in real time until no overlap is presented. For this reason, the fact of designing the digital twins for each power system and updating data continually to consider many distributed resources integrated into the network allows for rapid availability in protection settings and coordination compared to traditional planning.
5. Conclusions
The paper presents a new methodology to design an overcurrent protection scheme for a distribution network with DER based on digital twins. A new protection coordination method was performed in a distribution network with DER. The results showed the selection and modeling of the distribution network based on an IEEE test feeder allowed for an adequate model for verifying the overcurrent protection scheme. It was possible to determine the impact on the protection scheme due to the variation of the short-circuit current, thanks to the contribution of DERs.
In addition, the PHIL scheme for real-time simulation was designed to monitor short-circuit currents. The designed PHIL scheme for real-time simulation allows for a better vision of the behavior of the short-circuit currents, giving results attached to the reality of the phenomena that occur during faults. With this PHIL scheme, a short-circuit fault in bus 11 with the capacitor banks; the fault current in this bus has a different behavior, as the load responds by injecting a high current. The results showed that changes in short-circuit current can affect the operation speed and the sensitivity of the protection scheme; however, this does not necessarily imply affectations in the selectivity of the protection scheme. With the tests carried out, in the event of a short-circuit fault, the protection relays experience different levels of short-circuit current at the same moment, probably losing the selectivity of the overcurrent protection scheme.
Furthermore, digital twins were designed as a new protection coordination scheme for a distribution network with DER using a real-time simulation software. It was possible to identify a case where the selectivity of the overcurrent protection scheme is lost when inserting different DER in the distribution network. With the integration of DER, there are other operating conditions, for example, different currents, either load or fault, which cause the pre-established requirements of the protection devices to stop being adequate and thus lose coordination. However, DER connection scenarios in the distribution network are presented where the impact on protection schemes is less and may even be zero. These scenarios depend on three fundamental factors: the capacity of the units, their location in the network, and the number of units connected. The impact of DER on electrical protections may vary depending on the connection and operating conditions of the DER. However, the impact of the generation sources on the coordination of the protection devices can be minimized, but not eliminated, if generation is considered in the adjustment of the protection devices. With distributed generation (DG), small-scale self-generation (SSSG), and two large-scale self-generation sources (5 MW and 10 MW), the loss of selectivity of the protection scheme was observed.
Future work should consider validating overcurrent protections in a ring network topology with real-time simulation. In addition, directional overcurrent relays can be evaluated in the distribution network using digital twins.


