Article

A Peer-to-Peer Energy Trading Model for Optimizing Both Efficiency and Fairness

by
Eiichi Kusatake
,
Mitsue Imahori
and
Norihiko Shinomiya
*
Graduate School of Science and Engineering, Soka University, 1-236 Tangi-machi, Hachioji-shi 192-8577, Japan
*
Author to whom correspondence should be addressed.
These authors contributed equally to this work.
Energies 2023, 16(14), 5501; https://doi.org/10.3390/en16145501
Submission received: 22 June 2023 / Revised: 14 July 2023 / Accepted: 17 July 2023 / Published: 20 July 2023
(This article belongs to the Special Issue Control and Optimization of Microgrids and Renewable Energy Systems)

Abstract

:
In recent years, there has been a growing global trend towards transitioning from centralized energy systems to distributed or decentralized models, with the aim of promoting the widespread utilization of renewable energy sources. As a result, the concept of direct energy trading among consumers has garnered considerable attention as a means to effectively harness the potential of distributed energy systems. However, in this decentralized trading scenario, certain consumers may encounter challenges in receiving electricity from their preferred suppliers due to limited supply capacities. As a result of this constraint, there is a reduction in the advantages enjoyed by consumers. While previous studies have predominantly focused on optimizing resource allocation efficiency, the issue of equitable consumer benefits has often been overlooked. Therefore, it is crucial to develop a trading mechanism that considers the preferences of market participants, in addition to balancing supply and demand. Such a mechanism aims to enhance both fairness and efficiency in the market. This paper introduces the formulation of a single-objective optimization and multi-objective optimization problem for an electricity market trading mechanism. To address this challenge, two single-objective algorithms and six evolutionary algorithms (EAs) are employed to solve the optimization problem. By analyzing the simulation results, this study demonstrates the efficacy of the chosen evolutionary algorithms (EAs) and a single-objective optimization approach in effectively optimizing both the utilization of resources and the equitable distribution of consumer benefits.

1. Introduction

1.1. Research Background

In recent years, there has been a global push towards decentralization in energy systems, with many countries actively promoting the transition from centralized to distributed systems. This transition is driven by the goal of harnessing clean energy sources more effectively. Traditional energy systems have heavily relied on depletable energy resources due to their capacity to provide stable electricity to many consumers [1]. However, these decentralized energy systems still pose a challenge in terms of greenhouse gas emissions, which contribute significantly to the issue of global warming. As a result, numerous countries have implemented various policies and measures to promote the widespread adoption of renewable energy sources. As outlined in the “Zero Emissions” document, the Japanese government has set a clear target of reducing greenhouse gas emissions by 26% below the 2013 levels by the year 2030 [2]. Furthermore, Japan aspires to achieve a state of “Beyond Zero” by 2050, making a significant contribution to the worldwide reduction in accumulated atmospheric CO2. To promote the widespread use of renewable energy among households, one of the measures implemented by governments globally is the established Feed-In Tariff (FIT) programs. Individuals who generate their own electricity are referred to as prosumers [3], since they both consume and produce electricity. Under FIT, public utilities are obligated to purchase surplus electricity from prosumers at a predetermined rate over a specified period. This mechanism enables prosumers to calculate the return on their investment in renewable energy systems. Moreover, in Japan, the Feed-In Premium (FIP) system was introduced in April 2022 [4]. Unlike the fixed-rate purchasing approach of FIT, the FIP system incentivizes the adoption of renewable energy by offering a premium or subsidy to prosumers when they sell their electricity on the wholesale market. Consequently, these programs have generated considerable interest among the general public. Governments in numerous countries have also implemented energy market frameworks to ensure efficient electricity utilization. As an example, Japan has introduced the concept of a virtual power plant (VPP), which aims to consolidate the capacities of various distributed energy resources into a unified system. Another illustration is the implementation of demand response (DR), which involves modifying consumers’ electricity consumption patterns to better match supply and demand conditions. In VPP and DR systems, third-party aggregators participate in local energy markets, acting as intermediaries for managing prosumers’ energy resources. However, these methods suffer from issues such as limited transparency and commissions incurred by aggregators for trading [5]. This study presents a novel energy trading model that aims to achieve two objectives: ensuring equitable distribution of benefits among prosumers and optimizing the efficient allocation of resources. The objective is to ensure fair benefits within the market, preventing monopolization by any particular prosumer and eliminating wasteful power trading to maximize overall market benefits. The evaluation metric for fairness, described in detail in Section 4.4 later, aims to minimize the standard deviation, to maximize the minimum benefit, and to suppress variability.

1.2. Peer-to-Peer Energy Trading

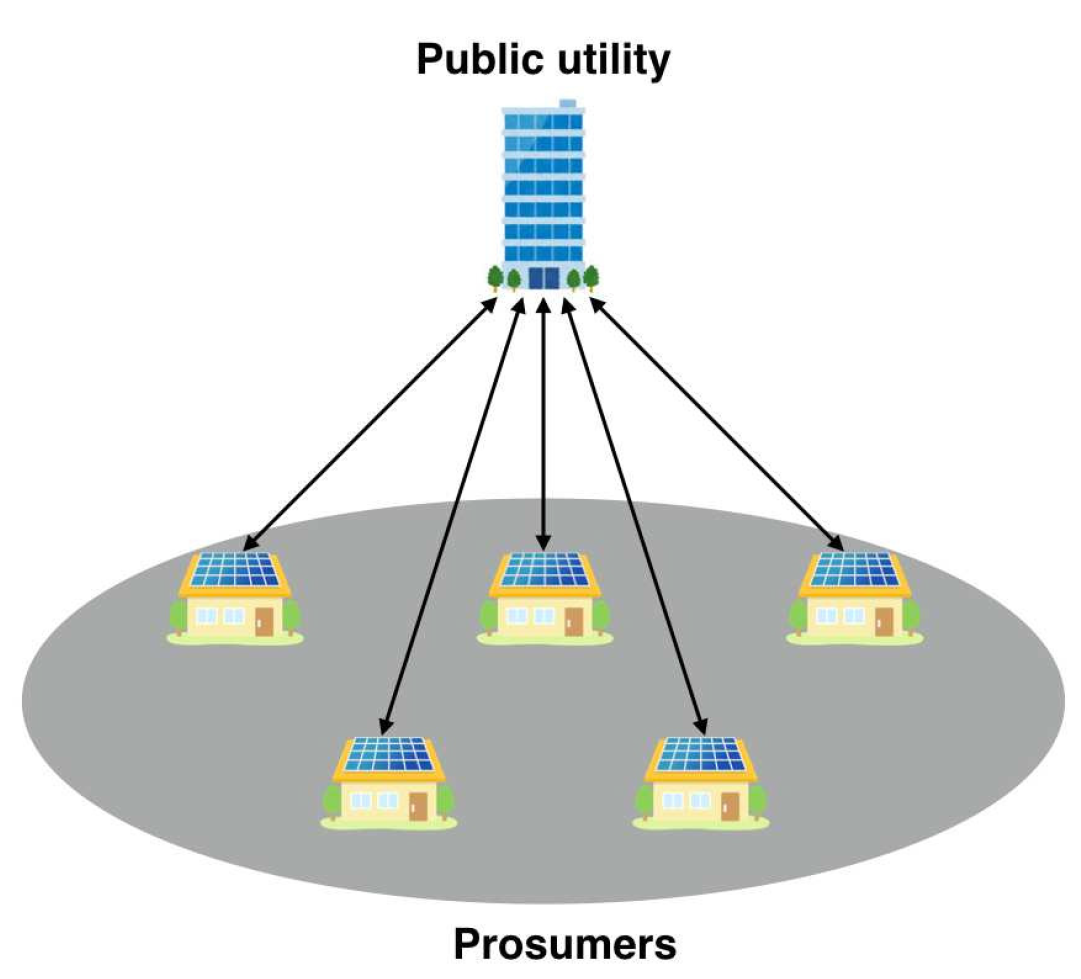
P2P energy trading, also known as direct energy trading among prosumers, has gained considerable attention as a way to address current issues. Instead of relying solely on a single public utility, prosumers now have the opportunity to engage in direct electricity trading with both utility and other prosumers, as depicted in Figure 1. This shift from the traditional energy trading system portrayed in Figure 2, where prosumers can only trade electricity with a central utility, brings several advantages. By eliminating the need for intermediaries, P2P energy trading enhances transparency and has the potential to reduce electricity rates [6]. This increased transparency and lower cost can incentivize prosumers to actively participate in energy exchange, fostering efficient electricity usage within local energy markets. The feasibility of P2P energy trading has been significantly bolstered by the emergence of blockchain technology [6]. This technology provides a secure and decentralized platform for recording transactions, ensuring trust and reliability in the P2P energy trading process.
Nevertheless, the practical implementation of P2P energy trading encounters various challenges due to the inherent constraints of the market. One significant challenge arises from the increased diversity of potential trading partners for prosumers, each with their own specific preferences regarding other participants in the market. Prosumers will make informed decisions regarding their trading partners by considering a range of factors, such as pricing structures, trading terms, reliability, and specific requirements. However, ensuring equilibrium between the availability and consumption of electricity is a critical constraint in energy markets. If every participant in the market solely prioritizes maximizing their individual benefits when selecting trading partners, it can disrupt the delicate equilibrium between supply and demand, thereby violating market constraints. Managing this supply–demand balance becomes challenging in P2P energy trading [7]. If a prosumer strives to maximize their personal gain without considering the impact on others in the market, it can easily disrupt the balance and lead to market instability. Furthermore, if participants strictly adhere to market constraints when choosing their trading partners, certain prosumers may face challenges in engaging in electricity trading with their desired counterparts, particularly when their electricity generation capacity is constrained. Consequently, this situation can diminish the overall benefits for prosumers. Hence, it is crucial to develop a strategy that not only harmonizes the availability and demand of energy resources but also accommodates the varying preferences and needs of market participants. Such a mechanism should ensure that prosumers can trade electricity with their preferred partners while simultaneously upholding market stability and the overall supply–demand equilibrium.

1.3. Related Work

The P2P market has become a hot market, and various studies are currently being conducted. N. Argyris et al. focused on workload allocation problems and healthcare delivery issues, conducting research using the P2P model, particularly the multi-level optimization model, to achieve fairness and efficiency [8]. The use of ordered weighted averaging was employed as a constraint for resource allocation decisions. This demonstrates that the P2P model can be applied beyond the realm of the electricity sector. M.Tan et al. proposed a cooperative trading model in their research, with the objective of maximizing the collective and individual gains of microgrids involved in energy trading [9]. Instead of a single microgrid market, multiple microgrids were established, and profit optimization was pursued within that framework. As in the aforementioned literature, there are many approaches that utilize game theory to understand the behavior of prosumers and incorporate it into the objective function. R. Jing et al. conducted research on a method to achieve fairness in the profits of residential and commercial prosumers using the Nash-type non-cooperative game model [10]. V. Regener et al. conducted a study on a method to optimize fairness and efficiency in the energy trading market [11]. They developed an agent-based framework and evaluated user acceptance, economic performance, practicability, and the ability to relieve grid congestion as criteria. That study also considered community revenue and welfare distribution as key performance indicators (KPIs). C. Liu et al. set up a three-layered optimal model [12]. The first layer involves capacity allocation and scheduling for buildings. The second layer focuses on cost-sharing, and the third layer incorporates a dynamic pricing mechanism. This model configuration contributes to carbon reduction and cost savings. K. G. H. Kong et al. utilized two single-objective optimization methods and a Fuzzy method to optimize market trading [13]. The two single-objective optimization methods aimed to minimize electricity costs and carbon emissions. In practice, the single-objective optimization methods achieved a reduction of USD 20,185.99/month in electricity costs and an 82.55% reduction in carbon emissions. Additionally, the Fuzzy inference method also achieved a reduction of USD 20,185.99/month in electricity costs and a 61% reduction in carbon emissions.
As mentioned in the previous related studies, research on P2P energy markets is being conducted through various methods and approaches. However, in this study, our objective is to optimize fairness and efficiency from both perspectives while considering both single-objective and multi-objective approaches. We aim to select the most suitable method for achieving fairness and efficiency within the microgrid, with a particular focus on individual prosumers. Therefore, our study differs from others by placing a greater emphasis on individual prosumers and aiming to achieve the most optimal market conditions.
Moreover, a market mechanism is formulated as a multi-objective optimization problem to evaluate the benefits of individual prosumers. Given that P2P energy trading is still in the experimental phase and has not been widely implemented in real-world markets, it necessitates thorough investigation and analysis.

1.4. Contribution

This paper designs a system that optimizes the efficiency of resource allocation and the fairness of prosumer benefits using a P2P energy trading model within a distributed system. This system has the following features:
  • It envisions a decline in the economic strain exerted upon standard households that necessitate electricity. FIT and FIP, which are invariably shouldered by these households, are encompassed within the realm of renewable energy surcharges. The number of prosumers is undeniably escalating. Consequently, it is indisputable that the quantity of surplus electricity, which public utilities are obliged to procure, is consistently on the rise. However, if this surplus electricity is judiciously employed within a localized energy network, the need for public utilities to purchase it diminishes, thereby stimulating transactions amongst prosumers. As a result, this precipitates a decline in the renewable energy surcharges that typical households are burdened with.
  • Secondly, the proposed method lends assistance to typical households in their pursuit of identifying suitable trading partners. Each prosumer is confronted with the decision to elect a supplier or purchaser during every transaction within the peer-to-peer energy trading domain. Given the overwhelming myriad of options, this process is often complex for individuals. However, the proposed method, when implemented in distributed power apparatuses such as smart meters, facilitates the automatic determination of trading partners.
This study thereby aims to actualize efficacious electricity utilization and to augment the benefits of each prosumer.

1.5. Paper Structure

This paper is structured as follows. In Section 2, we provide an explanation of the energy trading model used in this study, including the relevant definitions. Section 3 formulates several optimization problems to analyze prosumers’ benefits within the energy trading model. Section 4 presents the simulation results and provides a detailed discussion. Finally, in Section 5, we conclude the paper and outline future directions for research.

2. Definitions

2.1. Model Illustration

The electricity market model employed in this study comprises two main categories of participants: a public utility and prosumers, as illustrated in Figure 1. The collection of all participants is represented as V. The public utility, such as Tokyo Electric Power Company (TEPCO), which held a monopoly in previous markets, is represented by v p V . To fulfill the electricity demand, our model incorporates the presence of a public utility to compensate for any deficits or surpluses of electricity. The trading volume of TEPCO is used as a parameter in this study. Each prosumer, denoted as v i V ( i = 1 , 2 , , N ) , can act as either a seller or a buyer in individual transactions, showcasing diverse behaviors. Their participation is essential in enabling energy trading among the market participants.
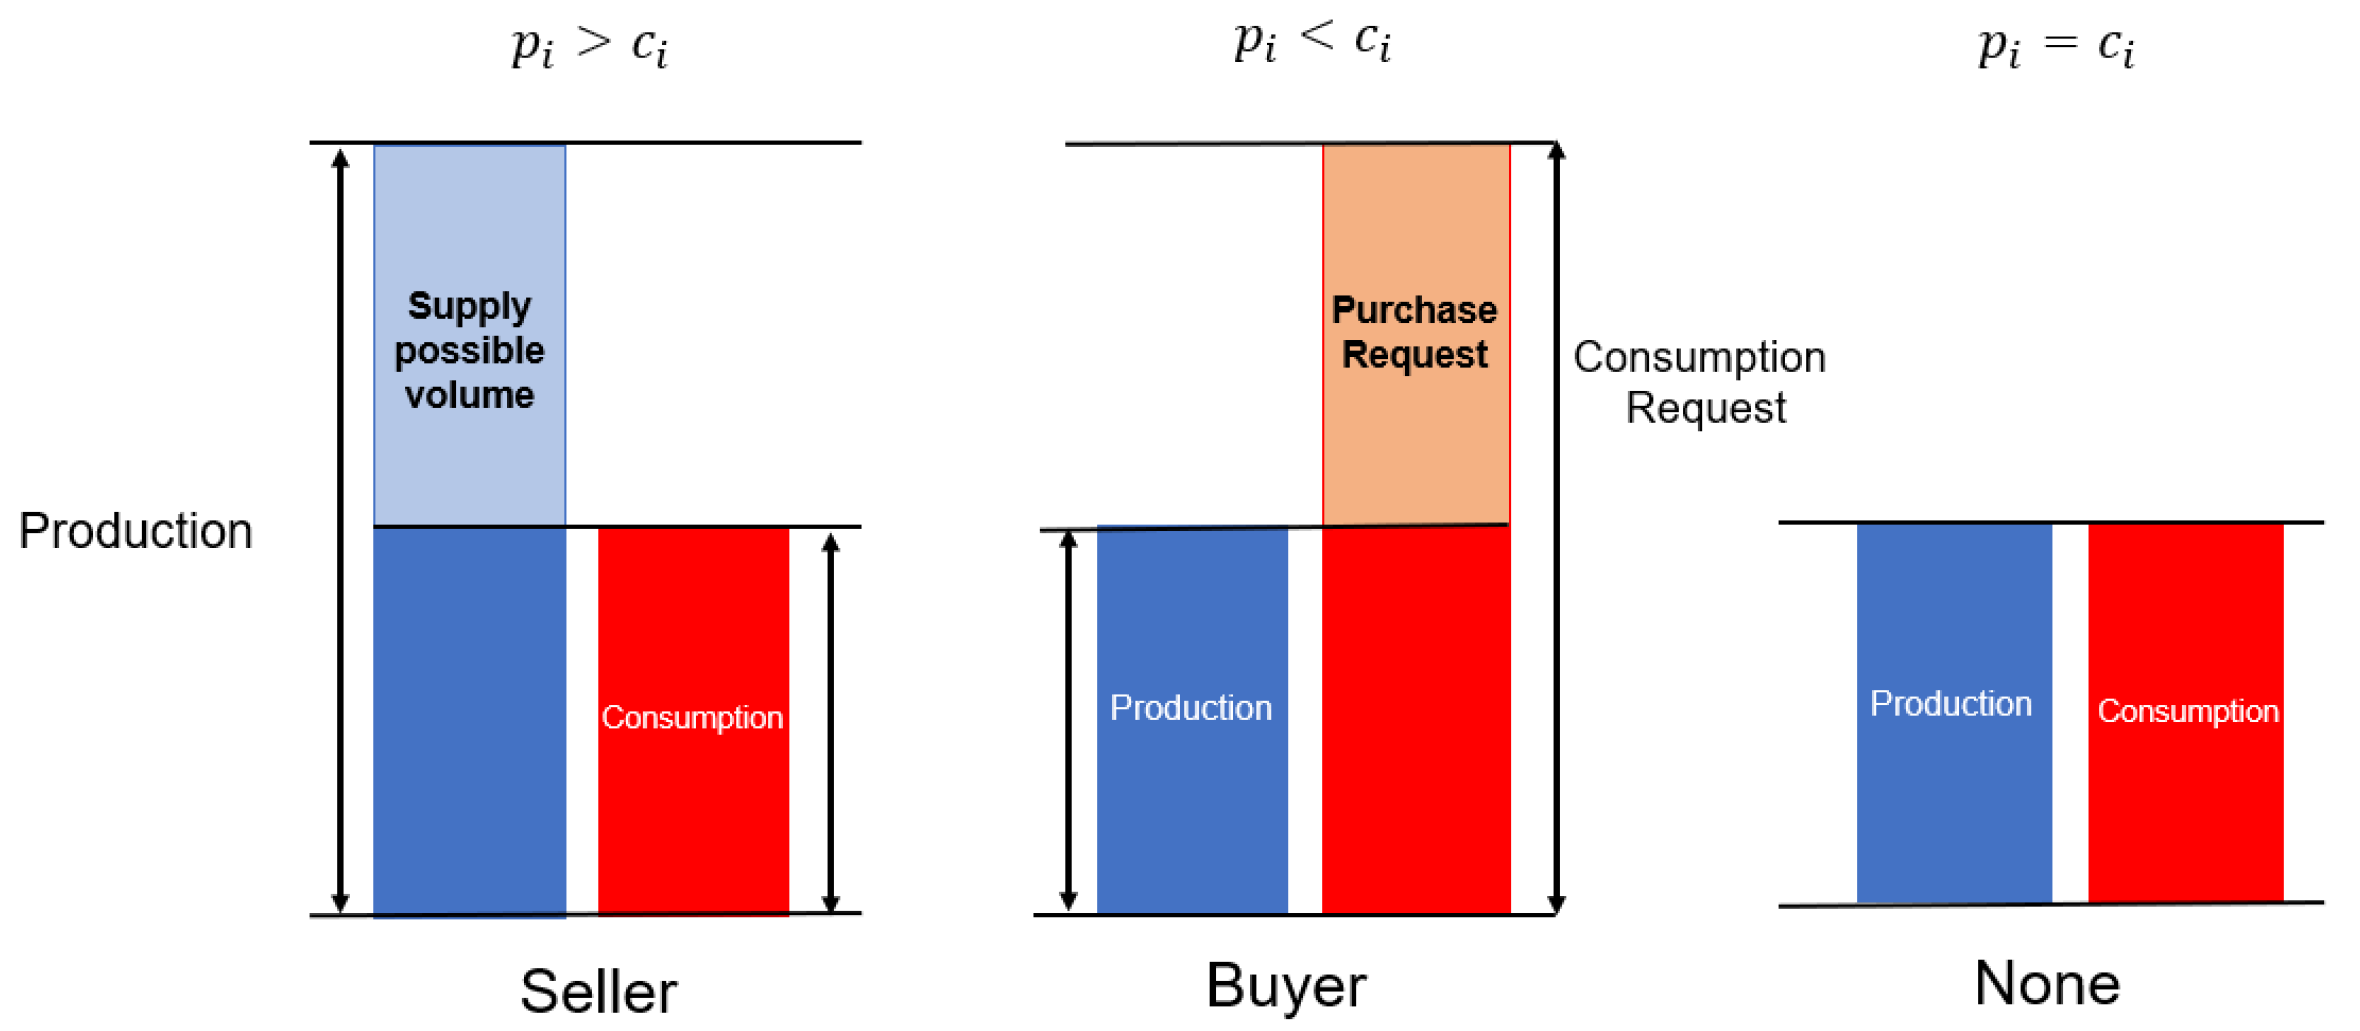
In the P2P trading market, depicted in Figure 3, prosumers have the flexibility to switch between the roles of sellers and buyers based on their electricity production and consumption levels. When a prosumer generates excess electricity from their own energy sources, they can participate as sellers, offering their surplus energy to other participants. On the other hand, if a prosumer’s electricity generation falls short of their consumption, they can act as buyers, acquiring additional electricity from available sellers. It is important to note that not all prosumers possess their own energy generation capabilities. In such cases, these prosumers exclusively play the role of buyers, relying on other participants for their electricity needs. Furthermore, prosumers who are temporarily absent or experience a lack of demand may not actively engage in the market during those periods. We denote the set of prosumers acting as sellers as V S V , and the set of prosumers acting as buyers as V B V . The behavior of a specific prosumer, denoted as v i , is determined by their electricity production and consumption dynamics within the P2P trading market. The prosumer’s power production is indicated by p i R , while their power consumption is represented by c i R . When p i > c i , the prosumer v i assumes the role of a seller, capable of supplying electricity to other participants in the market. Alternatively, when p i < c i , the prosumer v i assumes the role of a buyer and has the ability to acquire electricity from other participants. In the case where p i = c i , the prosumer v i does not function as either a seller or a buyer and remains inactive in the market.

2.2. Restrictions on the Volume of Trades

Each prosumer has the ability to both supply and purchase electricity based on their electricity generation and consumption levels. The volume of electricity traded between v i and v j is represented by x : ( V S v p ) × ( V B v p ) R , where x denotes the trading volume. For every connection ( v i , v j ) A , there exists a limit that determines the maximum amount of electricity that can be transmitted from v i to v j . The capacity associated with ( v i , v j ) A is calculated using the function c a p : ( V S v p ) × ( V B v p ) R . It is important to ensure that the trading volume on each arc satisfies certain constraints:
0 x v i , v j c a p v i , v j v i V S , v j V B ,
0 x v i , v p c a p v i , v p v i V S ,
0 x v p , v j c a p v p , v j v j V B .
The capacity, denoted as c a p , of the arc ( v i , v j ) is determined using various formulas depending on the specific trading pairs involved. In the case of prosumers, the trading capacity is defined as a percentage of their total electricity production or consumption. This percentage can be set based on various factors such as market regulations, prosumer preferences, or system constraints. By specifying a maximum percentage, the trading volume is limited to a certain portion of the prosumer’s total electricity generation or consumption.
c a p v i , v j = min ( p i c i ) , ( c j p j ) .
As the public utility is responsible for supplying electricity to prosumers in order to cover their deficits, it is assumed to have the capacity to meet their electricity needs. Therefore, the capacity of the arc ( v p , v j ) is defined as follows:
c a p v p , v j = c j p j .
Moreover, recognizing that the public utility plays a role in absorbing the surplus electricity generated by prosumers, it is assumed to have the capability to procure electricity from them. Hence, the capacity of the connection between v i and v p is determined as follows:
c a p v i , v p = p i c i .
Sellers are obligated to supply the same quantity of electricity as their own surplus to other participants. Likewise, buyers are required to acquire electricity equal to their own electricity shortfall from other participants. These conditions can be formulated in the following manner:
v j V B v p x ( v i , v j ) = p i c i v i V S ,
v i V S v p x ( v i , v j ) = c j p j v j V B .

2.3. Rate

The exchange rate for electricity trading between prosumers and the public utility is determined based on market conditions and regulatory policies. A seller, denoted as v i V S , proposes to sell electricity to buyers, represented by v j V B , at a specific unit rate of r i R . If v i provides electricity x ( v i , v j ) to v j , then v j is obligated to buy electricity from v i at a price of x ( v i , v j ) · r i . The public utility, represented by v p , offers electricity to buyers at a fixed rate of r s R per unit, under the condition that r s r i . If the public utility, denoted as v p , supplies electricity x ( v p , v j ) to prosumer v j , prosumer v j is obligated to procure the electricity from v p at a price of x ( v p , v j ) · r s . The public utility v p acquires electrical energy from suppliers at a fixed rate of r b R , with the requirement that r i r b . When v i provides electricity x ( v i , v p ) to the public utility v p , v p is obligated to procure electricity from v i at a price of x ( v i , v p ) · r b . Figure 4 indicates the relationship of electricity rate between each prosumer and public utility. The transaction rate r i among prosumers is set lower than the sales rate r s of the public utility and higher than the purchase rate r b of the public utility so that prosumers can obtain higher benefits when trading among prosumers than with the public utility. Figure 4 indicates that the benefit margin is highest in the following order: pink, followed by turquoise, and then yellow-green.

2.4. Reservation Price

In the realm of energy trading, every participant establishes a pricing threshold that represents the maximum amount buyers are willing to pay and the minimum amount sellers are willing to accept. The prosumers’ reservation prices are represented by the function ω : V R . The calculation of ω differs based on the prosumer’s role. Therefore, the reservation prices can be expressed using the following formulas:
ω v i = p i c i · r b p i > c i , c i p i · r s p i < c i .
In the context of traditional electricity trading, where prosumers have limited options and can only engage with the public utility, the reservation price ω ( v i ) is determined based on the charge set by the public utility.

2.5. Prosumer’s Benefit

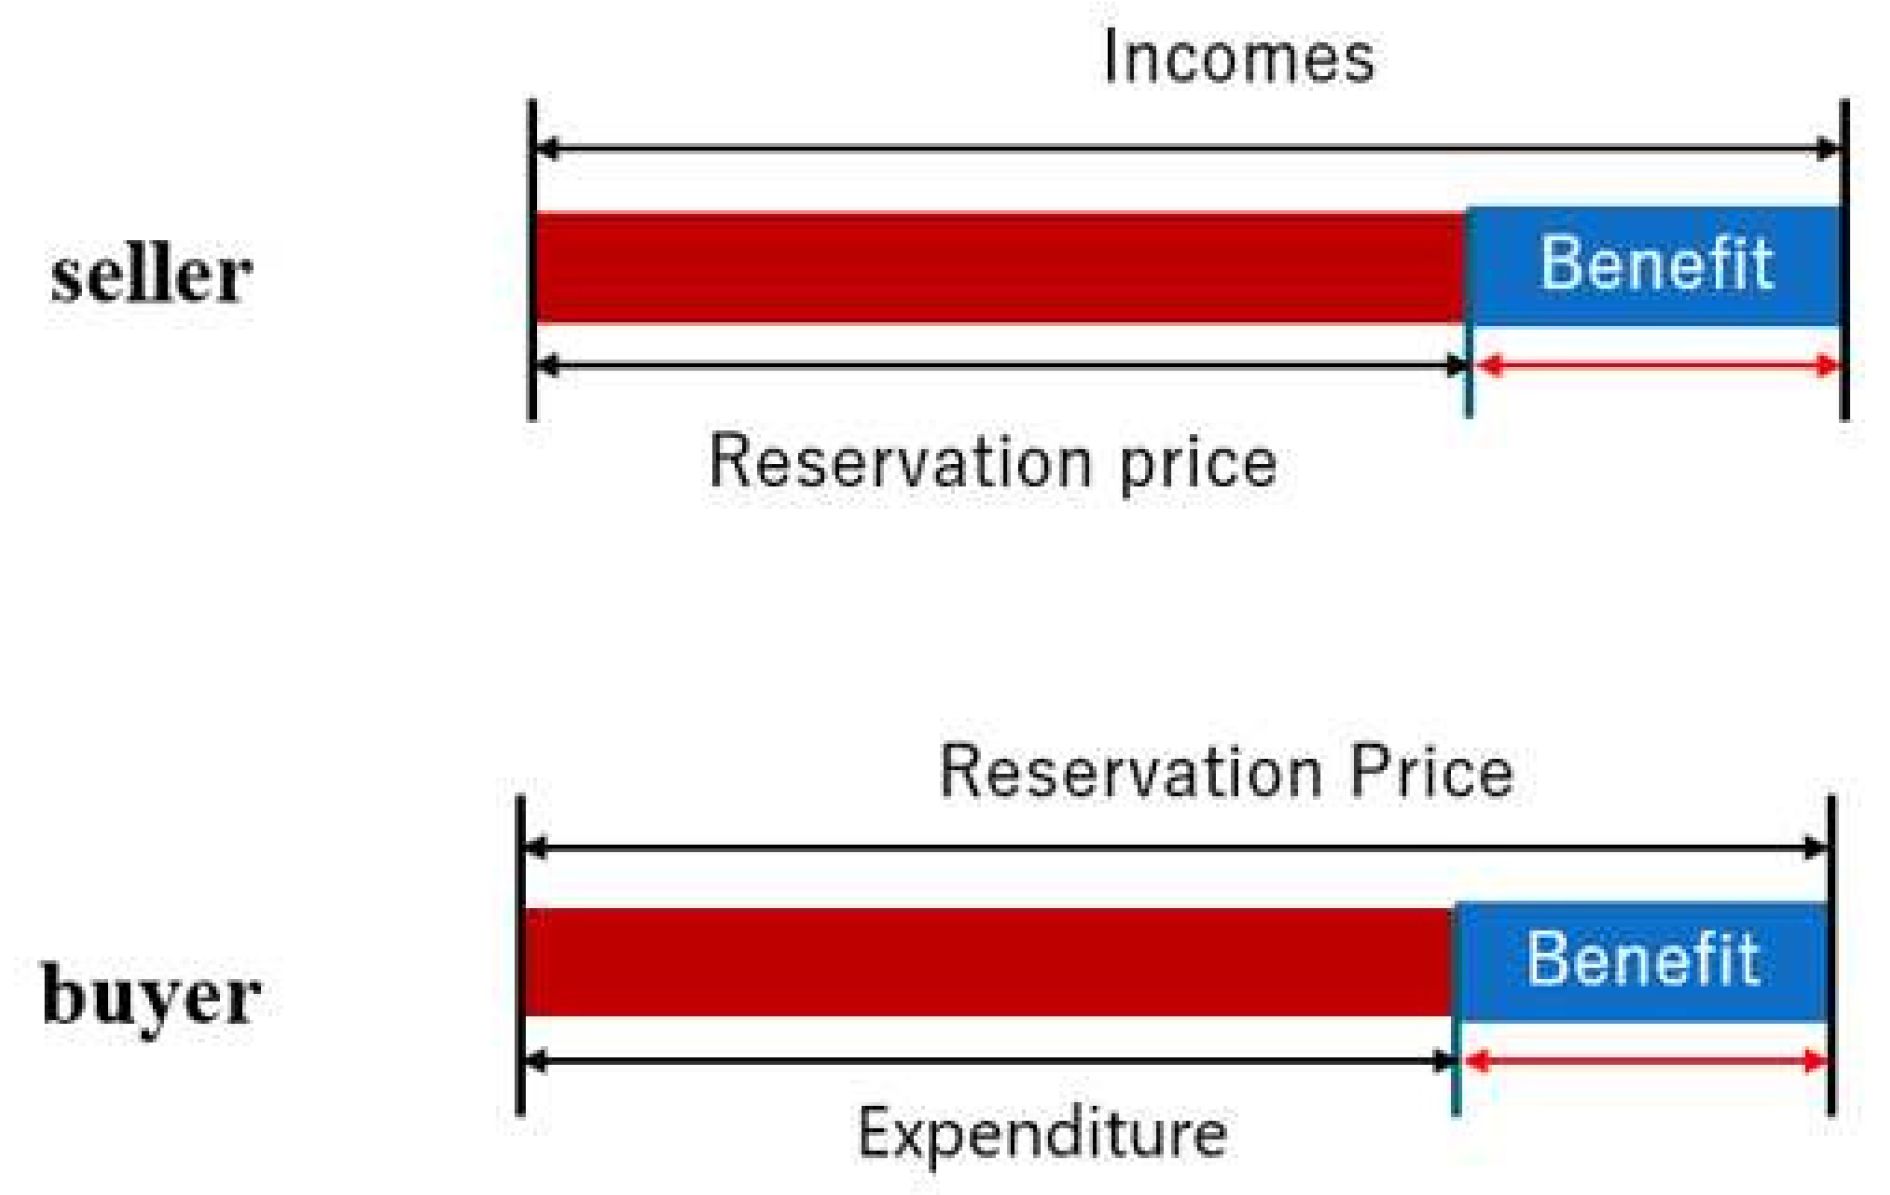
When prosumers participate in electricity trading, they have the potential to gain advantages by engaging with partners who offer more advantageous conditions than their current ones. The function π : V R captures the advantage or benefit obtained by the prosumer. The calculation of π varies depending on the prosumer’s behavior. For sellers, their benefit is determined by the difference between their total revenue and the reservation price. The function ζ : V S R represents the earnings or income of each seller. The collective income of all sellers is determined by summing up the individual incomes of each seller.
ζ v i = v j V B x v i , v j · r i + x v i , v p · r b .
When a prosumer assumes the role of a seller, their benefit is determined as follows:
π v i = ζ v i ω v i .
The diagram in Figure 5 depicts the structure of the buyer’s benefit. The benefit of a seller is determined by subtracting their reservation price from their total income. The monetary return of a prosumer is determined by mapping ζ : V S R . The total revenue generated by each seller is calculated using the following formula:
η v j = v i V S x v i , v j · r i + x v p , v j · r s .
When a prosumer assumes the role of a buyer, their benefit is determined as follows:
π v j = ω v j η v j .
The buyer’s benefit structure is depicted in Figure 5.
To ensure that prosumers do not experience financial losses in electricity trading, we assume that the benefit of each prosumer, denoted as π ( v i ) and π ( v j ) , is non-negative. In the context of a localized energy market, this study specifically examines P2P energy trading, emphasizing its implications and outcomes. Therefore, the benefit of the public utility is not taken into consideration.
Figure 5. Benefit.
Figure 5. Benefit.
Energies 16 05501 g005

3. Problem Formulation

In this section, we discuss the analysis of the prosumer’s benefit in P2P trading markets through two single-objective optimization problems and a multi-objective optimization problem.

3.1. Prosumer’s Benefit Maximization

In order to optimize the overall benefit of prosumers in a distributed energy system, we introduce the prosumer’s benefit maximization problem (PBMP). PBMP aims to maximize the total benefit obtained by individual prosumers, thereby enhancing their respective benefits. This problem can be formulated as follows, aiming to find the optimal solution that maximizes the advantage or gain for each prosumer involved:
maximize v i V S V B π ( v i ) .
subject to ( 1 ) - ( 3 ) , ( 7 ) and ( 8 ) ,
where the objective function is optimized for each time step.
Constraints (1)–(3) enforce the capacity limits of the trading arcs, ensuring that the traded electricity does not exceed the maximum capacity and remains non-negative. Furthermore, constraint (7) ensures that the total trading volume of sellers is equal to their excess electricity, while constraint (8) ensures that the total trading volume of buyers matches their electricity deficit.

3.2. Minimum Prosumer’s Benefit Maximization

To address the variability in prosumers’ benefits and to enhance fairness, we formulated the minimum prosumer’s benefit maximization problem (MPMP). The MPMP aims to maximize the minimum benefit among all prosumers, thereby ensuring that no prosumer receives a disproportionately low benefit. An alternative approach could be to minimize the variance in benefits, but this may result in scenarios where the variance reaches zero. While such an outcome satisfies the fairness objective, it may not effectively optimize resource allocation. In this study, the decision is made to prioritize the maximization of the minimum benefit, as it helps elevate the overall level of profit for prosumers. The objective of the MPMP is achieved by formulating and addressing the following optimization problem:
maximize min v i V S V B π v i .
subject to ( 1 ) - ( 3 ) , ( 7 ) and ( 8 ) .
The primary goal of the MPMP is to optimize the objective function while ensuring the maximization of the minimum prosumer’s benefit, in accordance with the constraints outlined in the previous Section 3.1.

3.3. Multi-Objective Optimization

To accomplish both the goals of maximizing the total prosumer’s benefit and minimizing the standard deviation of the prosumer’s benefit, a multi-objective optimization problem (MOP) is introduced. The MOP seeks to identify solutions that optimize resource allocation efficiency while ensuring fairness for the prosumer’s benefit. The formulation of the MOP is as follows:
maximize v i V S V B π ( v i ) .
minimize v i V S V B ( π ( v i ) π ¯ ) 2 N .
subject to ( 1 ) - ( 3 ) , ( 7 ) and ( 8 ) ,
The given problem formulation focuses on optimizing the objective functions. The constraints remain consistent with those described in Section 3.1.

4. Simulation Results

To examine the solutions derived from the proposed problems, simulations are executed utilizing specially designed simulators.

4.1. Conditions

In this particular simulation, the parameters were meticulously chosen, considering the specific characteristics of the Japanese electricity market. However, certain modifications were made to align them with the specific context of the study. The simulation utilized the parameter settings shown in Table 1.
The production level of sellers, represented by p i , is randomly generated within the range of 349 Wh to 749 Wh, taking into account the average household production of 549 Wh in Japan [14]. Likewise, the consumption level of buyers, denoted by c i , is randomly determined between 302 Wh and 702 Wh, considering the average household consumption of 502 Wh in Japan [14]. By introducing this random variation in the values of p i and c i , the total tradable energy volume within the market fluctuates across simulations, contributing to the dynamics of the system Therefore, maximizing benefits will be changed since the constraints of trading volume and reservation price are changed. Simulations are also performed using fixed values within a similar supply and demand range, and the gap between the fixed and random values is compared. Additionally, since the objective function, i.e., benefit, changes, the actual trading volume, which is the variable of the objective function, also i.e., In this study, p i and c i are set randomly because this approach brings the trading closer to actual trading with a wide variety of prosumers. The rates r s and r b are determined by considering the prevailing market rates and pricing models used by major electricity providers, such as TEPCO (Tokyo Electric Power Company), to ensure consistency and relevance in the simulation. Rate r i is set to 18.55, and it comes from the average between r s and r b . In a true market, the transaction price changes dynamically within the range of the transaction price of the market. However, in this study, r i is treated as a fixed rate to confirm how transactions are structured in the market using the problem formulated in this study. Even if the transaction rate is a fixed rate, we do not believe that the impact of the demand and capacity balance is significant. This transaction is only available at one point in time, and the volume of transactions is limited. Since it is a fixed value, it does not belong to either the multi-price or single-price types, but the single-price form is used as the format. The single-price system is set so that the trading rate is the intersection of the buy order starting from a high price and the sell order starting from a low price [15]. Following this system, this study used the average value as the role of intersection. Therefore, the average is used as a fixed rate.
T represents the total number of iterations conducted.

4.2. Simulators

Two kinds of simulators were developed to acquire solutions by solving the formulated single-objective optimization problems and the MOP. A machine with CPU Intel Core i7-7700K and a memory of 16GB were used.

4.2.1. For Single-Objective Optimization

A simulation tool was developed in Java using the JUNG library [16] and the lp_solve solver [17] for solving mixed integer linear programming problems. The tool employs a combination of the branch-and-bound algorithm and the cutting plane algorithm to find optimized solutions for the single-objective optimization problem.

4.2.2. For Multi-Objective Optimization

To achieve optimized solutions for the multi-objective optimization problem (MOP), we utilized a dedicated simulator developed using Platypus [18], a Python framework specifically designed for evolutionary computing. Platypus offers a range of evolutionary algorithms (EAs) that can be applied to find solutions in the MOP. In our simulation, we employed six meta-heuristic algorithms as follows:
  • Non-dominated sorting genetic algorithms-II (NSGA-II)
  • Generalized differential evolution-III (GDE3)
  • Optimized multi-objective particle swarm optimization (OMOPSO)
  • Speed-constrained multi-objective particle swarm optimization (SMPSO)
  • Strength Pareto evolutionary algorithm-II (SPEA2)
  • ϵ -multi-objective evolutionary algorithm ( ϵ -MOEA)
We chose to utilize metaheuristic algorithms because they are well suited for addressing the challenges of scaling up markets that involve a substantial number of participants. For our simulation, we set the sampling size to 10,000 and the population size to 10. For algorithms such as OMOPSO and ϵ -MOEA, we set the value of ϵ to 0.05.

4.3. Evolutionary Algorithms

The EAs used in the experiments are described below.

4.3.1. NSGA-II

The NSGA-II algorithm, introduced by K. Deb et al. in 2002 [19], employs a specific type of crossover and mutation operations to generate offspring. The algorithm then selects the next generation by applying non-dominated sorting and crowding distance comparison techniques.

4.3.2. GDE3

GDE3, which stands for generalized differential evolution 3, was introduced by S. Kukkonen et al. in 2005 [20]. This algorithm is an extension of the differential evolution method and is specifically designed for solving global optimization problems with multiple objectives and constraints. GDE3 offers the flexibility to handle an arbitrary number of objectives and constraints, making it well suited for a wide range of optimization tasks.

4.3.3. OMOPSO

OMOPSO, which stands for multi-objective particle swarm optimization, was proposed by M. R. Sierra et al. in 2005 [21]. This algorithm falls under the category of multi-objective optimization methods and is based on the principles of Pareto dominance and a crowding factor. By leveraging these concepts, OMOPSO effectively maintains a diverse set of non-dominated solutions, facilitating a comprehensive exploration of the solution space. The integration of particle swarm optimization enhances the algorithm’s search capabilities, enabling it to converge toward optimal solutions for multi-objective optimization problems.

4.3.4. SMPSO

SMPSO, proposed by A. J. Nebro et al. in 2009, is a popular algorithm for multi-objective optimization [22]. It incorporates a velocity limitation strategy to strike a balance between exploration and exploitation. By constraining particle movement within a predetermined range, SMPSO efficiently explores the solution space while avoiding premature convergence. This approach enhances its effectiveness in finding high-quality solutions for multi-objective optimization problems.

4.3.5. SPEA2

SPEA2, proposed by E. Zitzler et al. in 2001, is a multi-objective optimization algorithm [23]. It employs a sophisticated fitness assignment strategy that considers both dominance and solution density. By maintaining a diverse archive of non-dominated solutions, SPEA2 effectively guides the search toward the Pareto front. Furthermore, it incorporates an advanced archive truncation technique to control the size of the archive and to maintain a well-distributed set of solutions.

4.3.6. ϵ -MOEA

ϵ -MOEA, introduced by K. Deb et al. in 2003 [24], is a steady-state multi-objective evolutionary algorithm. It incorporates the concept of ϵ -dominance, which allows for a more efficient comparison and selection of solutions. Additionally, ϵ -MOEA utilizes effective parent and archive update strategies to promote diversity and convergence. The primary goal of ϵ -MOEA is to rapidly generate a well-distributed set of solutions that approximate the Pareto front, providing a comprehensive representation of the trade-offs between conflicting objectives.

4.4. Evaluation Metrics

To evaluate the solutions obtained from the proposed problems, two metrics are utilized. The primary metric, labeled as F1, quantifies the cumulative benefit obtained by prosumers in each transaction. It quantifies the overall efficiency of the system, where a higher value of F1 indicates a greater total prosumer’s benefit. The second metric, denoted as F2, assesses the fairness of the prosumer’s benefit distribution by calculating the standard deviation. A lower value of F2 suggests a more equitable distribution of benefits among the prosumers. Mathematically, F1 is calculated as the summation of individual prosumer benefits across all transactions, whereas F2 represents the standard deviation of prosumer benefits.
F 1 v i V S V B π ( v i ) .
F 2 v i V S V B ( π ( v i ) π ¯ ) 2 N .
To demonstrate the effectiveness of the PBMP, another evaluation indicator is to show whether the minimum profit is maximized and the results are based on the supply and demand volume of each prosumer. By maximizing the minimum value, it is believed that variability is suppressed.

4.5. Results and Discussion

In Figure 6 and Figure 7, the x-axis represents the total benefit of the prosumers, while the y-axis represents the standard deviation of the prosumers’ benefits. Table 2 and Table 3 express the minimum benefit for each prosumer and verify whether the objective of maximizing minimum benefit is achieved. For example, the p1 capacity is 804.8463 and p1 demand is 562.647 in Table 3. In this case, this prosumer is the role of the seller in microgrids. The table then posts the minimum benefit for each method at p1.

4.5.1. Prosumer’s Benefit Maximization Results

As shown in Figure 6, the more PBMP focuses on benefit enhancement, the more it shows that it fails to consider fairness. The value of F1 is JPY 11.3k, and the value of F2 is approximately 1.09. Figure 7 also shows that, as in Figure 6, the emphasis is on maximizing benefits, and fairness is not taken into account. The value of F1 is JPY 10.5k, and the value of F2 is approximately 1.17. Table 2 shows what the minimum benefit at random values would be for each method. The more PBMP focuses on the benefit maximization, the more it shows that there are prosumers who do not benefit from minimum benefit. Table 3 shows that there are prosumers who are able to earn benefits when compared with random values, but there are also prosumers who are not able to earn benefits in the aggregate.

4.5.2. Minimum Prosumer’s Benefit Maximization Results

As shown in Figure 6, MPMP should have focused on and been formulated based on the fairness of benefits; however, the results show that it does not maximize fairness. However, MPMP is a valid method compared with PBMP. The value of F1 is JPY 10.9k, and the value of F2 is approximately 0.92. As shown in Figure 7, the F2 of MPMP shows no effect on fairness of resource allocation compared with MOP. The value of F1 is JPY 10.5k, and the value of F2 is approximately 0.88. In Table 2 and Table 3, it can be seen that the minimum benefit of each prosumer, though not all, is maximized compared with other methods.

4.5.3. Multi-Objective Optimization Results

As shown in Figure 6, the six evolutionary algorithms and multi-objective optimization methods are concentrated at one point. The value of F1 is approximately JPY 7.3k, and the value of F2 is approximately 0.55. On the other hand, in Figure 7, the F1 of GDE3 characteristically increased, but F2 also increased. Overall, the F1 and F2 values also tend to increase, but the lower right is more optimal, so there is no optimization. In Table 2 and Table 3, GDE3, OMOPSO, and SMPSO’s minimum benefits are 0. Other MOPs have gained a small amount of benefit, but it is a small value compared with that of MPMP.

4.5.4. Discussions

Since lp_solve found the solutions in ascending order in the vertex’s number, prosumers with lower numbers can preferentially trade with their preferred partners in the PBMP. Therefore, the PBMP obtained solutions with a larger variation in prosumer’s benefit than other proposed problems. Furthermore, the MPMP would obtain solutions with less variation in demand benefit than PBMP by maximizing the minimum prosumer’s benefit, which is closer to PBMP. As the MPMP selected trading partners for each prosumer based on the minimum prosumer’s benefit, its focus was more on achieving equity in prosumers’ benefits rather than optimizing the efficiency of resource allocation. However, the effectiveness of fairness is more invalid than expected. Multi-objective optimization results are flat except for GDE3 when simulating with fixed value; however, the original objective, to find a solution that equally achieves the efficiency of resource allocation and the equity of the prosumer’s benefit, has been achieved. However, we believe that the small number of prosumers did not make it more noticeable when using multi-objective optimization methods. In addition, if we consider running this system in real time, it would involve using machine learning or similar techniques to make predictions based on certain past values from a fixed time window. These predictions would then be used to derive optimal solutions. This study utilizes a multi-objective optimization approach instead of a bi-level model due to the trade-off relationship between fairness and efficiency. As a future direction, it is possible to explore how the research would be conducted using a bi-level approach.

4.5.5. Computational Time

Table 4 shows the results of computational time on the simulation experiments. This table shows the time for random values, since there is little deviation between the random and fixed values. As shown from the results, the EAs need more calculation time to solve the proposed problem than the solver. The results also show that the EAs can determine trading at each time within one hour. Since it is assumed that trading is decided by solving the optimization problems every hour in this paper, the EAs can determine trading in a realistic time in our market models. Each trade for the time required for 1000 trades, and EAs are completed in 2–3 s on average.

5. Conclusions and Future Works

5.1. Conclusions

This paper presents an optimized approach to enhance both the efficiency of resource allocation and the fairness of the prosumer’s benefit in P2P energy trading. The method involves formulating single-objective and multi-objective optimization problems to determine trading partners for each prosumer. By conducting numerical experiments, we assess the prosumers’ gains during a designated trading period, with a particular focus on the impact of electricity prices on partner selection.
In Figure 6 and Figure 7, the results are presented based on the evaluation metrics F1 (total prosumer’s benefit) and F2 (standard deviation of prosumer’s benefit). The bottom-right corner of the figures represents the optimized values for fairness and efficiency, with higher values indicating better optimization. It can be observed that both the single-objective optimization method, MPMP, and the multi-objective optimization method are effective in achieving optimized values.
Furthermore, Table 2 and Table 3 provide the results on the suppression of variability, which indicates the presentation of fairness when maximizing the minimum benefit. Some methods fail to maintain the minimum benefit within the microgrid. However, particularly, MPMP demonstrates the ability to secure the minimum benefit and to maintain fairness.
Consequently, Figure 6 demonstrates that EAs and MPMP offer optimal solutions. Notably, the EAs efficiently solve the proposed problem within realistic timeframes in our market models.

5.2. Future Work

For future work, there are three points to be considered in our models.
  • Considering the environmental impact of prosumers
    Renewable energy generation is inherently variable due to factors such as seasonal changes and weather conditions. Moreover, prosumers’ consumption patterns fluctuate based on their individual lifestyles. However, this paper does not consider the specific dynamics of prosumer’s production and consumption. We believe that one approach to consider to take lifestyle into account is using a weighted multi-objective method [25]. This approach allows for considering multiple factors and assigning different weights based on their importance. Furthermore, forecasting the real-time production and consumption of prosumers based on predefined measured values can be a direction to consider.
  • Considering the introduction of fluctuating electricity prices
    The electricity rate is fixed in this paper; however, prices fluctuate in a realistic trading system due to different demand levels during peak and off-peak periods. Therefore, by setting electricity rates that fluctuate based on demand, we can make the trading system more realistic.
  • Considering other factors of prosumer’s benefit in addition to price
    The EAs are used as meta-heuristics methods in this paper. Since our definitions of prosumer’s benefit considered only monetary gain, other factors of prosumer’s benefit should be considered to explain more real behavior of prosumers.
  • Considering the security aspect
    Although we have not considered security aspects at this stage, we believe it would be appropriate to incorporate the STRIDE methodology, a vulnerability assessment method, into the process for conducting a comparison between the conventional transaction model and the new approach [26].
  • Considering the pursuit of speed for optimization
    This paper can be led to an optimized solution; however, it is taking too long to reach a solution. We need to revise these codes and, at this stage, should consider implementing machine learning.

Author Contributions

Methodology, M.I.; data curation, E.K.; formal analysis, M.I.; investigation, E.K.; writing—original draft preparation, E.K.; resources, N.S.; supervision, N.S. All authors have read and agreed to the published version of the manuscript.

Funding

This research received no external funding.

Conflicts of Interest

The authors declare no conflict of interest.

Abbreviations

The following abbreviations are used in this manuscript:
EAEvolutionary Algorithm
TEPCOTokyo Electric Power Company
PBMPProsumer’s Benefit Maximization Problem
MPMPMinimum Prosumer’s Benefit Maximization Problem
MOPMulti-objective Optimization Problem

References

  1. Koyama, K. The Role and Future of Fossil Fuel. IEEJ Energy J. Spec. Issue 2017, 3, 80–84. [Google Scholar]
  2. Japan’s Roadmap to ’Beyond-Zero’ Carbon. Available online: https://www.meti.go.jp/english/policy/energy_environment/global_warming/roadmap/ (accessed on 15 December 2021).
  3. Toffler, A.; Toffler, H. Revolutionary Wealth; Knopf: New York, NY, USA, 2006. [Google Scholar]
  4. Japan’s FiP Renewables System Likely to Exclude Biomass. Available online: https://www.argusmedia.com/en/news/2112632-japans-fip-renewables-system-likely-to-exclude-biomass (accessed on 20 December 2021).
  5. Lampropoulos, I.; van den Broek, M.; van der Hoofd, E.; Hommes, K.; van Sark, W. A system perspective to the deployment of flexibility through aggregator companies in the Netherlands. Energy Policy 2018, 118, 534–551. [Google Scholar] [CrossRef]
  6. Suthar, S.; Cherukuri, S.; Pindoriya, N. Peer-to-peer energy trading in smart grid: Frameworks, implementation methodologies, and demonstration projects. Electr. Power Syst. Res. 2023, 214 Pt A, 1–20. [Google Scholar] [CrossRef]
  7. Park, C.; Yong, T. Comparative review and discussion on P2P electricity trading. Energy Procedia 2017, 128, 3–9. [Google Scholar] [CrossRef]
  8. Argyris, N.; Karsu, O.; Yavuz, M. Fair resource allocation: Using welfare-based dominance constraints. Eur. J. Oper. Res. 2022, 297, 560–578. [Google Scholar] [CrossRef]
  9. Tan, M.; Zhou, Y.; Wang, L.; Su, Y.; Duan, B.; Wang, R. Fair-efficient energy trading for microgrid cluster in an active distribution network. Sustain. Energy Grids Netw. 2021, 26, 100453–100461. [Google Scholar] [CrossRef]
  10. Jing, R.; Xie, M.N.; Wang, F.X.; Chen, L.X. Fair P2P energy trading between residential and commercial multi-energy systems enabling integrated demand-side management. Appl. Energy 2020, 262, 114551–114567. [Google Scholar] [CrossRef]
  11. Regener, V.; Rommelt, G.; Zeiselmair, A.; Wasmeier, L.; Bogensperger, A. Design choices in peer-to-peer energy markets with active network management. IET Smart Grid. Spec. Issue Peak Load Forecast. Appl. 2022, 5, 281–296. [Google Scholar] [CrossRef]
  12. Liu, C.; Wang, Z.; Yu, M.; Gao, H.; Wang, W. Optimal peer-to-peer energy trading for building based on data envelopment analysis. Energy Rep. 2023, 9, 4604–4616. [Google Scholar] [CrossRef]
  13. Kong, K.G.H.; Lim, J.Y.; Leong, W.D.; Ng, W.P.Q.; Teng, S.Y.; Sunarso, J.; How, B.S. Fuzzy optimization for peer-to-peer (P2P) multi-period renewable energy trading planning. J. Clean. Prod. 2022, 368, 133122. [Google Scholar] [CrossRef]
  14. Renewable Energy Purchase Prices, Surcharge Rate, and Other Details Related to FIT and FIP Schemes from FY2022 Onward to Be Determined. Available online: https://www.meti.go.jp/english/press/2022/0325_004.html (accessed on 25 December 2021).
  15. Saunders, A.; Cornett, M.M. Financial Markets and Institutions, 8th ed.; McGraw Hill: New York, NY, USA, 2022; Chapter 5 Appendix 5A. [Google Scholar]
  16. JUNG. Available online: http://jung.sourceforge.net (accessed on 18 December 2021).
  17. Introduction to lp_solve 5.5.2.11. Available online: https://lpsolve.sourceforge.net/5.5/ (accessed on 15 June 2021).
  18. Platypus—Multiobjective Optimization in Python. Available online: https://platypus.readthedocs.io/en/latest/ (accessed on 10 December 2021).
  19. Deb, K.; Pratap, A.; Agarwal, S.; Meyarivan, T.A.M.T. A fast and elitist non-dominated sorting genetic algorithm: NSGA-II. IEEE Trans. Evol. Comput. 2002, 6, 182–197. [Google Scholar] [CrossRef] [Green Version]
  20. Kukkonen, S.; Lampinen, J. GDE3: The third evolution step of generalized differential evolution. In Proceedings of the 2005 IEEE Congress on Evolutionary Computation, Edinburgh, UK, 2–5 September 2005; Volume 1, pp. 443–450. [Google Scholar]
  21. Sierra, M.R.; Coello, C.A.C. Improving PSO-Based multi-objective optimization using crowding, mutation and ϵ-dominance. In Proceedings of the International Conference on Evolutionary Multi-Criterion Optimization, Guanajuato, Mexico, 9–11 March 2005; pp. 505–519. [Google Scholar]
  22. Nebro, A.J.; Durillo, J.J.; Garcia-Nieto, J.; Coello, C.C.; Luna, F.; Alba, E. SMPSO: A new pso-based metaheuristic for multi-objective optimization. In Proceedings of the 2009 IEEE Symposium on Computational Intelligence in Multi-Criteria Decision-Making (MCDM), Nashville, TN, USA, 30 March–2 April 2009; pp. 66–73. [Google Scholar]
  23. Zitzler, E.; Laumanns, M.; Thiele, L. SPEA2: Improving the strength pareto evolutionary algorithm. TIK Rep. 2001, 103, 1–21. [Google Scholar]
  24. Deb, K.; Mohan, M.; Mishra, S. A Fast Multi-Objective Evolutionary Algorithm for Finding Well-Spread Pareto-Optimal Solutions; Technical Report 2003002; Indian Institute of Technology, (KanGAL): Kanpur City, India, 2003. [Google Scholar]
  25. Qu, H.; Ye, Z. Multi-objective optimization operation of micro energy network with energy storage system based on improved weighted fuzzy method. In Proceedings of the International Conference on Frontiers of Energy and Environment Engineering (CFEEE), Beihai, China, 16–18 December 2022; Energy Reports. Volume 9, pp. 1995–2003. [Google Scholar]
  26. Sahay, R.; Estay, D.S.; Meng, W.; Jensen, C.D.; Barfod, M.B. A comparative risk analysis on CyberShip system with STPA-Sec, STRIDE and CORAS. Comput. Secur. 2023, 128, 103179. [Google Scholar] [CrossRef]
Figure 1. Peer-to-peer trading.
Energies 16 05501 g001
Figure 2. Current trading.
Energies 16 05501 g002
Figure 3. The role of seller and buyer.
Energies 16 05501 g003
Figure 4. Electricity rate.
Energies 16 05501 g004
Figure 6. Result efficiency and fairness (random value).
Energies 16 05501 g006
Figure 7. Result efficiency and fairness (fixed value).
Energies 16 05501 g007
Table 1. Parameters set in simulations.
ParameterValue
# of prosumers10
p i [Wh]Randomly decided between 349 Wh and 749 Wh
c i [Wh]Randomly decided between 302 Wh and 702 Wh
r s [yen/kWh]29.05
r b [yen/kWh]8.05
r i [yen/kWh]18.55
T 1000
Table 2. Maximizing the minimum benefit (random value).
p1p2p3p4p5p6p7p8p9p10
PBMP0.0021000000000
MPMP 7.35 × 10 4 7.35 × 10 4 7.35 × 10 4 7.35 × 10 4 7.35 × 10 4 9.45 × 10 4 7.35 × 10 4 7.35 × 10 4 7.35 × 10 4 0.001155
EPsMOEA 3.76 × 10 17 5.53 × 10 17 2.06 × 10 15 8.41 × 10 15 3.11 × 10 15 2.87 × 10 16 2.01 × 10 194 7.98 × 10 17 3.98 × 10 17 1.3 × 10 17
GDE30000000000
NSGAII 3.72 × 10 12 2.63 × 10 16 1.29 × 10 11 2.21 × 10 16 6.46 × 10 12 1.45 × 10 13 1.25 × 10 14 2.0 × 10 16 2.44 × 10 12 1.72 × 10 14
OMOPSO0000000000
SMPSO0000000000
SPEA2 2.39 × 10 8 1.70 × 10 6 1.63 × 10 6 9.70 × 10 8 1.33 × 10 7 1.13 × 10 7 2.44 × 10 7 3.04 × 10 7 2.28 × 10 7 8.26 × 10 7
Table 3. Maximizing the minimum benefit (fixed value).
p1p2p3p4p5p6p7p8p9p10
capacity804.8463792.5969527.1893739.5148506.7915694.2612653.2675749.6945635.1398690.4667
demand562.647607.578696.4479753.1572844.3062665.5017886.1528704.568676.5624785.0377
PBMP2.54311.942711.777230.1433253.3409950.3019800.4737600
MPMP2.54311.942710.1433250.1433251.1017650.301982.445240.473760.434910.992985
EPsMOEA0.4453650.3900730.0669810.0114760.0945380.1153920.0804780.1543430.0226290.042448
GDE31.711811.1544140.00377900.5790170.1148010.2758690.15503200.005253
NSGAII0.4560260.5091090.0688360.0160350.1088890.0811640.0551530.172690.0296280.053791
OMOPSO0.0085540.024892 2.18 × 10 4 2.27 × 10 5 9.16 × 10 5 0.003203 5.46 × 10 4 0.007332 1.99 × 10 5 4.67 × 10 4
SMPSO 3.03 × 10 7 000000 1.39 × 10 6 6.88 × 10 6 0
SPEA20.5993430.8951410.1377310.0157240.2428960.1077250.1278370.1892320.0537230.117297
Table 4. Results of computational time.
Problem (Algorithm)Time [s]
PBMP5.401
MPMP4.956
Weighted (average)4.263
MOP(NSGA-II)3519
MOP(GDE3)2972
MOP(OMOPSO)3036
MOP(SMPSO)2883
MOP(SPEA2)4065
MOP( ϵ -MOEA)3508
Disclaimer/Publisher’s Note: The statements, opinions and data contained in all publications are solely those of the individual author(s) and contributor(s) and not of MDPI and/or the editor(s). MDPI and/or the editor(s) disclaim responsibility for any injury to people or property resulting from any ideas, methods, instructions or products referred to in the content.