Article

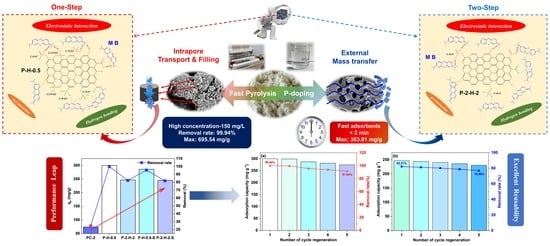
Comparative Study on the Performance and Mechanism of Adsorption–Oriented Phosphorus–Modified High–Efficiency and Durable Activated Biochar from Fast Pyrolysis

State Key Laboratory of Clean Energy Utilization, Zhejiang University, Zheda Road 38#, Hangzhou 310027, China
*
Author to whom correspondence should be addressed.
Energies 2023, 16(14), 5363; https://doi.org/10.3390/en16145363
Submission received: 18 June 2023 / Revised: 9 July 2023 / Accepted: 12 July 2023 / Published: 14 July 2023
(This article belongs to the Section A4: Bio-Energy)

Abstract

:
Extensive research has demonstrated the advantageous utilization of medium–low temperature fast pyrolysis (FP) for biomass, yielding high–grade liquid–phase chemicals or fuels. However, the field of FP–based high–performance solid biochar research still presents several gaps. Herein, a one–step versus two–step method for biomass H3PO4 activation under FP was comparatively analyzed for the first time, and efficiently activated carbons (ACs) for dye removal were successfully synthesized at a low temperature (723 K). Investigation of methylene blue (MB) adsorption revealed that the one–step sample P–H–0.5, possessing a specific surface area of 1004 m2·g−1, exhibited a remarkable adsorption capacity of 695.54 mg·g−1 with an ultra–high removal rate (99.94%, C0 = 150 mg·L−1). The two–step sample P–2–H–2, a modified byproduct of FP, achieved efficient dye adsorption in the shortest time (2 min, 383.91 mg·g−1). This originated from the well–developed surface macropores and elevated group content derived from phosphorus (P)—modification. Both adsorption data were well–fitted with pseudo–second–order kinetics and the Langmuir model, revealing the presence of chemical effects and the dominance of monolayer adsorption. A more detailed kinetic study suggested intrapore transport primarily governed the adsorption process on P–H–0.5, whereas P–2–H–2 relied on surface diffusion. FTIR and XPS revealed notable differences in the active sites between the two methods. Aside from –OH, –COOH with C–O–P, the P elements of P–H–0.5 were classified as C–P–O3 and C2–O–P2, demonstrating the ability of one–step FP to introduce heteroatoms into carbon defects. The basic interactions of ACs with MB were π–π stacking and hydrogen bonding established by –OH–containing groups. At a suitable pH (>5), most H+ was removed from the surface, and the electrostatic attraction became the strongest linking force. Both ACs exhibited exceptional reusability, with removal rates surpassing 90% of the initial rate after four cycles of regeneration.

Graphical Abstract

1. Introduction

The global population explosion and the limitation of freshwater resources have placed wastewater treatment at the forefront of environmental management. It is projected that, if current water consumption patterns continue, over two–thirds of the world’s population will face significant water availability challenges by 2050 [1]. Undoubtedly, dye pollution is a major contributor to wastewater generation. At present, the annual output of dyes in the world has exceeded 1,000,000 tons and over 10,000 kinds of dyes have been produced. Approximately 17.5% of these dyes are directly discharged into the environment, causing adverse effects [2,3]. Prolonged contact with synthetic dyes can cause nausea, abdominal pain, dizziness, and even hypertension in humans [4]. The need for efficient dye wastewater treatment is evident. Among many liquid–phase dye–removal methods, adsorption is recognized as an effective means due to the simple operation and easy recovery it offers [5,6]. Unfortunately, the availability of adsorption is limited by the high cost of traditional commercial adsorbents, particularly for large factories [7]. More importantly, the optimal adsorption time of most materials for dyes is long (up to several hours (h)), leading to lower utilization efficiency [8,9,10]. Nevertheless, some noteworthy advancements have been made in developing fast dye adsorbents. The calcium–rich crab–shell–based adsorbent prepared by Dai et al. was reported to achieve sufficient adsorption of highly concentrated Congo red dye within 2 minutes (min) [11]. Zazycki et al. performed direct 1073 K pyrolysis of chitin and the equilibrium time for the adsorption of methyl violet dye by the resulting material was only 10 min [12]. These achievements demonstrate the accessibility and powerful functionality of fast dye adsorbents. Yet, still very little has been reported about fast adsorbents (<10 min) currently. Consequently, there is a critical need to develop new inexpensive fast adsorbents for dye removal.
Biomass waste, readily available from natural sources, offers a cost–effective solution as an industrial raw material. The thermochemical conversion of biomass under oxygen–free conditions will inevitably produce a partially carbon–based solid product, known as biochar. Lately, biochar, owing to its developed pore structure and abundant functional groups, has gained significant attention in the treatment of dye pollution [13,14,15,16]. Dye molecules can be accommodated into these pores and anchored on the sites provided by the active functional groups. Pyrolysis, a promising technology for biomass conversion, can be categorized into two main types: conventional slow pyrolysis (SP) and fast pyrolysis (FP). Generally, SP is used to obtain carbon materials [17], while FP is employed for the efficient production of liquid fuels or chemicals [18]. However, through fast pyrolysis and activation, some scholars have recently produced high–quality activated carbons (ACs), carbon materials that have been physically or chemically modified. Wang et al. used physical and chemical activation methods to rapidly activate corn straw char in a fluidized bed reactor, resulting in ACs with a specific surface area (SSA) of 880 m2·g−1 and a pore volume of 0.599 cm3·g−1 [19]. Zhou et al. utilized H3PO4 as the activator to prepare furfural residue ACs with a high mesoporous ratio by 90 min catalytic FP, and the mesoporous ratio was over 90% [20]. Therefore, with the increase in heating rates, volatile matter (VM) release is accelerated, which is conducive to the formation of porous carbons. In addition, FP allows the equipment to quickly reach the target temperature when ensuring safety and stability, and improves production efficiency by reducing equipment startup and shutdown cycles. As detailed cases are still insufficient, there is much room for research on the production of activated biochar by FP.
As mentioned earlier, the performance of ACs for adsorption applications is mainly affected by the pore structure and functional groups, and their modulation can be achieved through coupling pyrolysis and activation. The co-pyrolysis of the biomass and activator is called one–step pyrolysis (i.e., in situ activation), while the corresponding two–step method refers to the modification of biomass pyrolytic carbon (PC) by the activator (i.e., ex situ activation). Between them, two–step pyrolysis is generally more beneficial for pore enlargement and the introduction of target atoms or groups into carbon precursors, resulting in a leap in overall performance [15]. However, previous studies have often focused solely on the advantages or results of a single method. A comprehensive comparison between the two methods and the exploitation of their respective advantages is lacking, especially for FP [21]. And the two–step method is equivalent to re-modifying the by-product PC, having positive implications for the full–component utilization of the pyrolysis process. Furthermore, the choice of activation method is particularly significant, whether it is a one– or two–step pyrolysis.
Chemical activation, as opposed to physical activation, offers advantages in terms of facile functional group loading and regulation, as well as mild reaction conditions [10]. As a kind of chemical activation, the H3PO4 method has been applied to the preparation of ACs by some researchers for its resulting high solid yield and tar suppression [14,22]. More importantly, this type of activation realizes the most convenient phosphorus (P) doping and is often conducive to the formation of mesopores [20]. Inguanzo and El Rub et al. pointed out that higher heating rates are desirable for biochar preparation, while this effect will disappear at high temperatures [23,24]. H3PO4 modification is one of the few methods with no need for high temperatures [14]. Given this, FP with H3PO4 activation would be a wonderful combination for AC preparation and is expected to achieve high–quality batch production under mild conditions. Compared with the common nitrogen (N), oxygen (O), and sulfur (S) doping, the research on P–doped carbon is seriously inadequate [20], which limits the application and optimization of P–modified ACs.
In this work, P–modified biochar obtained by one– and two–step fast activation was comparatively investigated for the first time, using poplar sawdust (PS) as the main feedstock. It is understood that reports on PS–based carbon materials for dye removal started in 2019, and there are few related studies [25]. Both PS–ACs prepared under a mild temperature exhibited high removal rates and great reusability for the cationic dye methylene blue (MB). System pH, contact time, initial dye concentration, and temperatures were discussed in detail and suitable application routes for both were proposed. The differences in the micro–characteristics of materials and adsorption active sites between in situ and ex situ activation under FP were emphatically analyzed. This study provides valuable guidance for the future preparation and application of FP–ACs.

2. Materials and Methods

2.1. Feedstocks and Reagents

PS powder (60–80 mesh) was supplied by Hui Feng Straw Co., Ltd. (Lin Kou County, Mudanjiang City, China). Before each experiment, PS powder was cleaned and dried overnight (378 K). MB solid powder was purchased from Shanghai Ron Reagent Company. Other reagents such as NaOH (flake, 96%), H3PO4 (85%), HCl (36–38%), NaCl (99.5%), and anhydrous ethanol were of analytical purity (AR), and were purchased from Sinopharm Chemical Reagent Co., Ltd. (Shanghai, China). Deionized water was used for all subsequent experiments.

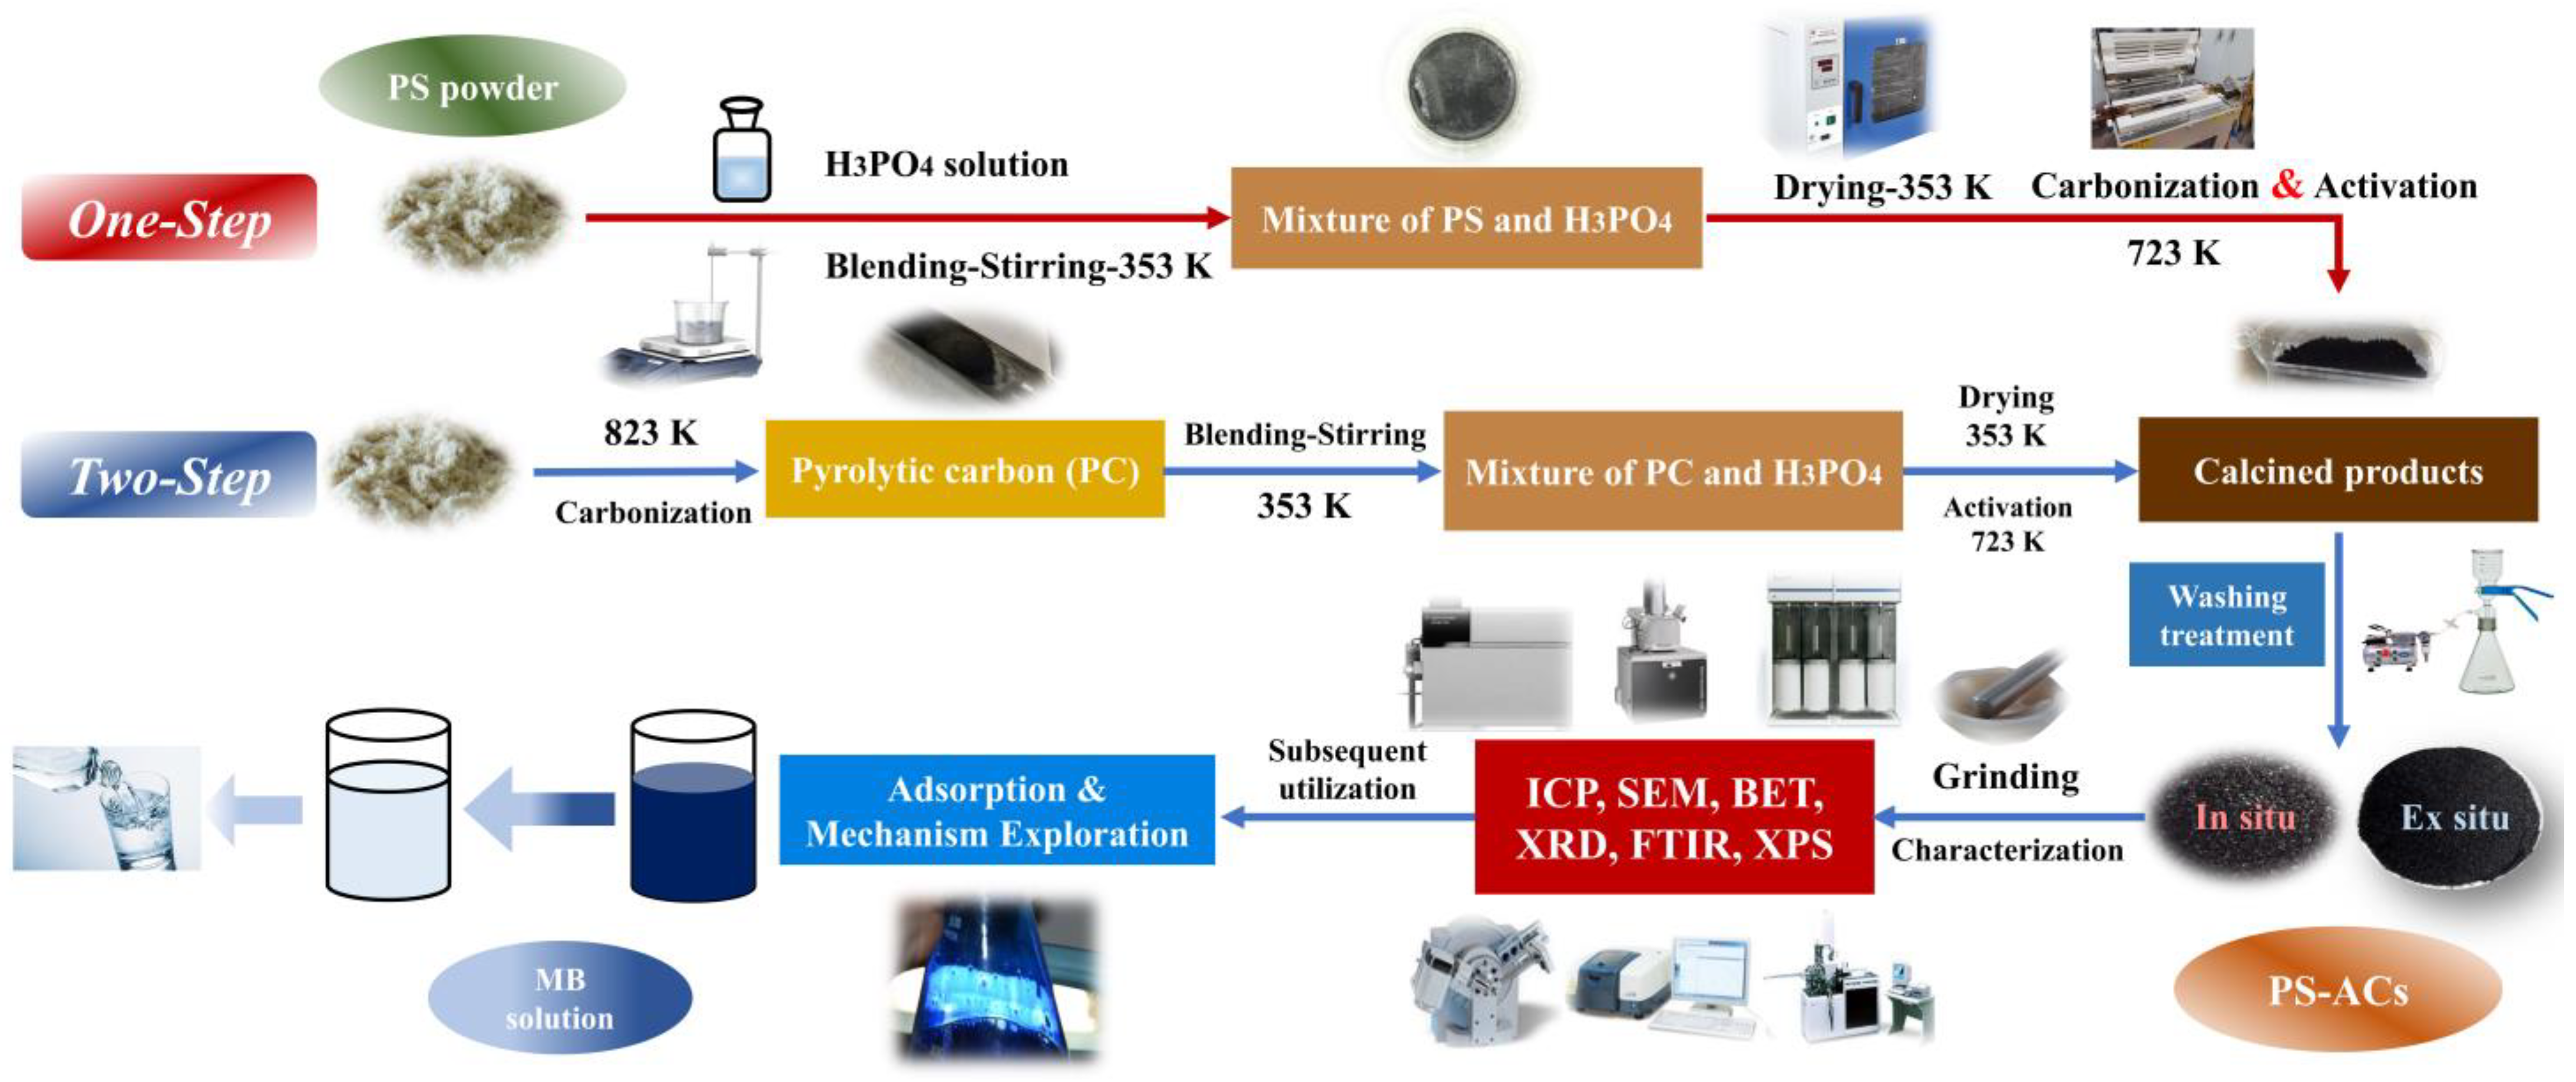
2.2. Synthesis of Modified Biochar (PS–ACs)

The material preparation and subsequent research scheme are illustrated in Figure 1. The AC exhibits optimal adsorption performance when the activator-to-raw-material mass ratio is 2.5 in view of the pre-experiment results (Table S1, Supplementary Material). At dye concentrations of 20 mg·L−1 or lower, the removal ratio can reach 100%. An excessive impregnation ratio is unfavorable to the adsorption of organic dyes [14,26]. The experimental equipment is demonstrated in Figure S1 (Supplementary Material) and detailed production processes are provided below:
One–step method: the PS powder (2 g) and H3PO4 were mixed with deionized water in a mass ratio of 1:2.5:12.5. The solid–liquid mixture was uniformly stirred on a magnetic stirrer at 353 K for 3 h. The resulting slimy sample was dried at 353 K over 12 h. After N2 atmosphere was maintained in the quartz tube, the constant temperature section was heated to 723 K, and then the dried mixture was immediately pushed in and kept for 0.5–2 h. N2 flow is constant and less than 200 mL·min−1 to obtain a higher solid yield [27]. The calcined product was washed to neutral with deionized water and NaOH solution (1 mol·L−1) followed by overnight drying in an oven at 378 K. The obtained sample was labeled as P–H–x (where ‘x’ represents the activation time (h)).
Two–step method: the N2 flow during the heating process conformed to the same conditions as before. Once the constant temperature section reached 823 K [28,29], the feedstocks were quickly pushed in and held. The PC obtained was labeled as PC–y (where ‘y’ represents residence time (h) at 823 K). The activation process and parameters were the same as before. It should be noted that the mass of H3PO4 and deionized water was selected based on PC instead of the feedstocks. The calcined product was washed many times and dried, and the final sample was marked as P–y–H–z (where ‘z’ represents the activation time (h) of PC).
For comparison, the same type of PS–ACs were prepared at the same final temperature with a heating rate of 10 K/min with the corresponding sample number plus the suffix “S”.

2.3. Characterization of the Samples

The proximate analysis was performed using an industrial analyzer (5E–MAG6700, Kaiyuan Instrument, Changsha, China). The organic element analyzer (EA, Vario EL cube, Elementar, Frankfurt, Germany) was selected for ultimate analysis. The principle of the high–temperature combustion method was utilized to detect the content of elements. The P content was determined by inductively coupled plasma mass spectrometer (ICP–OES, Agilent 5110, Santa Clara, CA, USA). The hydrophilicity of samples was measured by the seat drop method with a contact angle/surface tension meter (JY–82C, Chengde Dingsheng Technology, Chengdu, China). The surface morphology of PS–ACs was characterized by a scanning electron microscope (SEM, Sigma 300, ZEISS, Oberkochen, Germany). The crystal structure was analyzed by X-ray diffraction (XRD, SmartLab SE, Rigaku, Tokyo, Japan), with Cu/Kα as the emission source, the test wavelength λ = 1.5406 Å, and scanning speed as low as 2 °/min. At 77 K, the N2 adsorption–desorption experiment was performed by an automatic SSA analyzer (APSP 2460, Micromeritics, Norcross, GA, USA). The SSA and pore distribution were calculated by the Brunauer–Emmett–Teller (BET) and Barrett–Joyner–Halenda (BJH) methods. FTIR (Scientific Nicolet iS20, Thermo, Waltham, MA, USA) was used for functional group detection. The composition and semi–quantitative information of elements on the PS–AC surfaces were analyzed by X-ray photoelectron spectroscopy (XPS, Scientific K–Alpha, Thermo, Waltham, MA, USA), with Al/Kα as the emission source. Energy–dispersive X-ray analysis (SEM–EDS mapping) was used to complement the detection of elemental homogeneity. The pH drift method was chosen to measure the zero–charge point (pHPZC) of PS–ACs, and the detailed method is provided in Supplementary Material [30].

2.4. Batch Adsorption Experiments

MB solutions of certain concentrations were prepared in advance as reserves and diluted according to the requirements. AC powder was dried before each experiment. A total of 50 mg (±0.0001 g) of AC was loaded into a conical flask with MB solution (100 mL). The samples of each group were stirred at 200 rpm for 24 h. The initial optimal adsorption capacity of all ACs was determined using 20 mg·L−1 or 150 mg·L−1 MB solutions. Afterward, the solution of 150 mg·L−1 was checked as the standard to research the effects of pH (1–11), contact time (20 s–80 h), and temperature (298–318 K). Different MB concentrations (100–390 mg·L−1) were prepared to explore the relevant effect. After each adsorption, the mixture was smoothly filtered and the remaining MB concentration was detected with a UV–Vis spectrophotometer (UV–2600, Shimadzu company, Kyoto, Japan) at 665 nm. The corresponding standard curve for MB concentration determination was presented in Figure S2. The equilibrium adsorption capacity (qe) and the adsorption capacity at any time (qt) were calculated by Equations (1) and (2)
q e = C 0 C e M V
q t = C 0 C t M V
where qe and qt (mg·g−1) were the adsorption capacities of the samples at equilibrium or saturation and at time t; C0, Ce, and Ct (mg·L−1) were MB concentrations at initial, equilibrium, and time t; V (L) is the solution volume; and M (g) represents the mass of AC added each time.

3. Results and Discussion

3.1. Yield Analysis and Initial Screening of PS–ACs

The mass variation of each step in the preparation is recorded in detail (Table S2). The yields of PC hardly vary with residence time during FP. The activation yields of both methods are high while the final yield of the two–step method is low because of pure FP resulting in the escape of most mass in gas and liquid form [18]. Moreover, the one–step method involves direct contact of H3PO4 with intact cellulose, hemicellulose, and lignin in the feedstocks. At lower temperatures (150–450 °C), the cross–linking reaction dominates in that it can be promoted by H3PO4 activation [31]. Hence, solid products are retained more due to the high incidence of structural cross–linking. The slight rise in all final yields with increasing activation time suggests that pore enlarging allows some of the phosphate derivatives to be doped or trapped in the interlaced structure. And some derivatives may not be completely removed, as indicated by the gradually ascending washing yields. Furthermore, compared with other investigations (Table S3) [14,32,33,34,35,36], the one–step method in this paper achieved a higher yield of AC under mild conditions, signifying this one–step method is of positive significance for large–scale industrial production.
At an initial MB concentration (C0) of 20 mg·L−1, each removal ratio reaches 100%. Then, the standard was selected at the concentration of 150 mg·L−1. The performance of one–step ACs remains almost constant as time increases, with the 0.5 h AC derived from the mildest reaction demonstrating the best adsorption effect. With the co–increase in pyrolysis and activation time, more target groups are loaded, resulting in the increasing adsorption capacity of two–step ACs. For the slow activation, the final yields of both P–H–0.5–S and P–2–H–2–S are higher than the corresponding FP–ACs. However, the adsorption performance is slightly inferior, which also reflects to some extent that FP facilitates the full release of VM. P–H–0.5 and P–2–H–2, the two best samples, were selected for subsequent specific analysis.

3.2. Comparative Characterization of the Samples

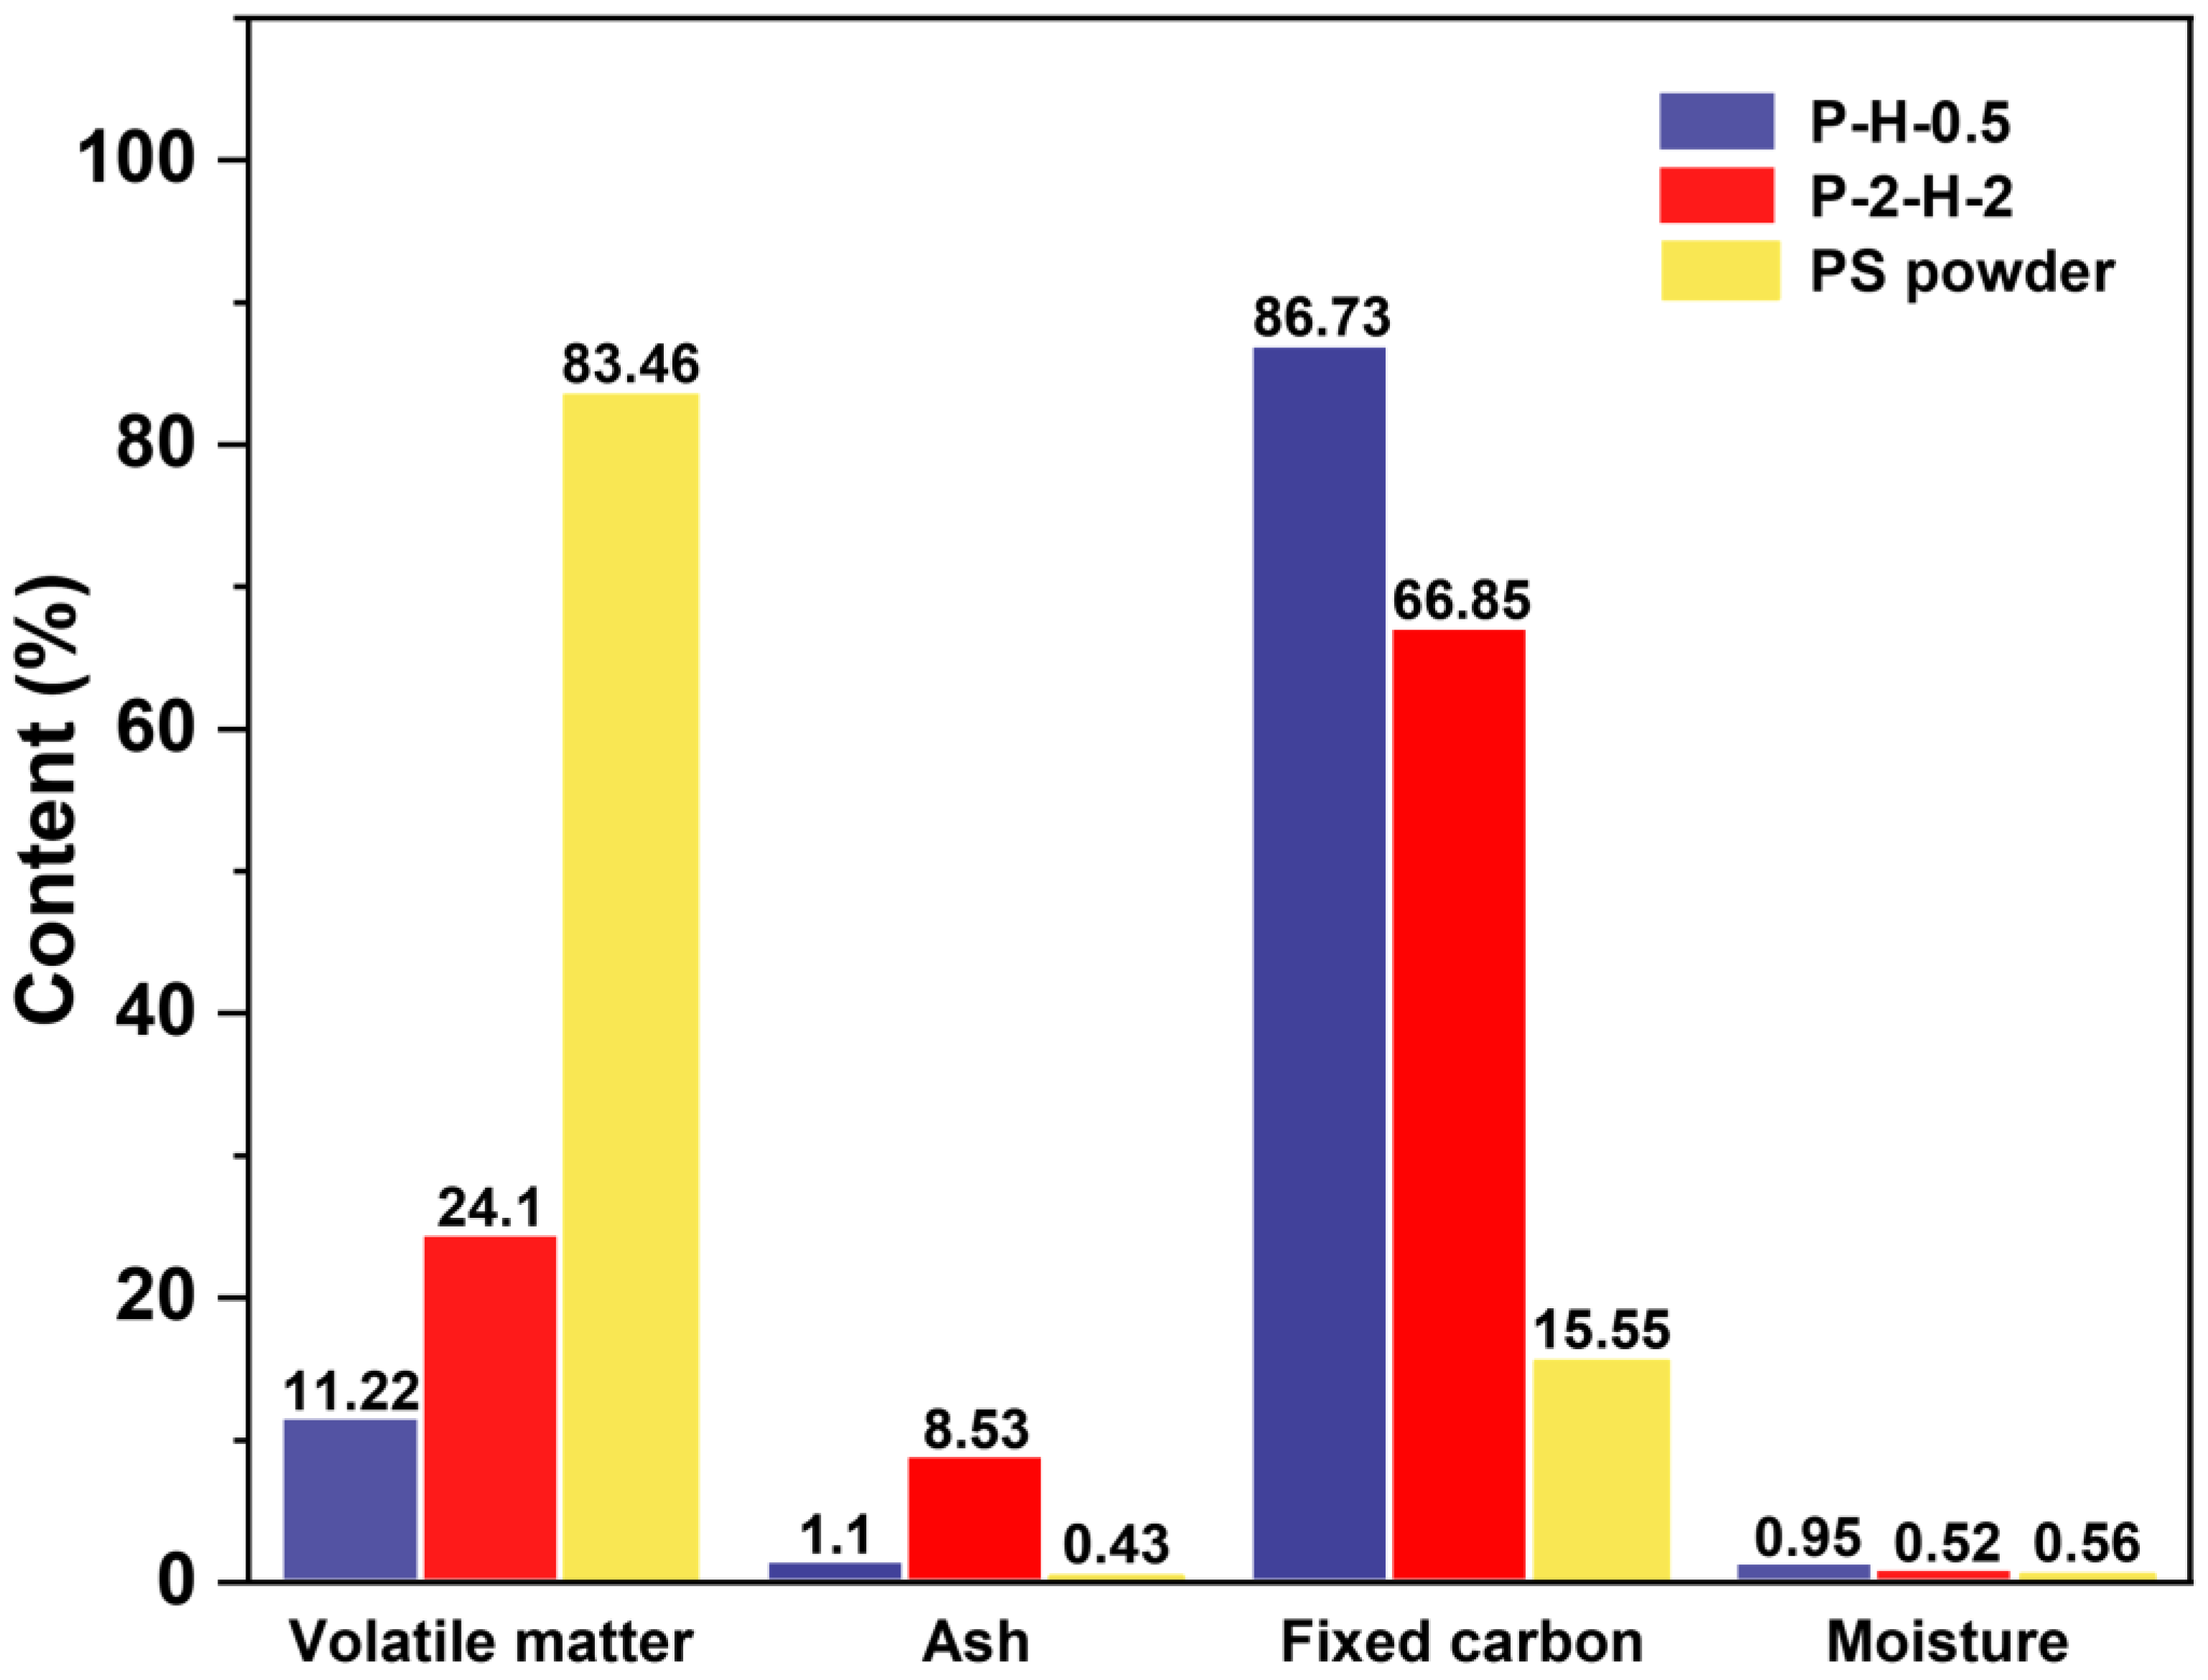
3.2.1. Analysis of Modified Biochar’s Chemical Composition and Stability

The proximate analysis results highlight the most significant changes in VM and fixed carbon (FC) content (Figure 2). The formation of initial pores in carbon materials can be greatly affected by the release of VM and the retention of the carbon skeleton. H3PO4 activation under FP facilitates VM release and FC retention at lower temperatures, offering an initial guarantee of high yields and outstanding performance [37]. P–H–0.5 is superior to P–2–H–2 in this regard. In general, a smaller contact angle represents stronger hydrophilicity. Oxyacid modification enhances the hydrophilicity of PS–ACs and greatly reduces the resistance of liquid–phase MB molecules to enter the interior of the materials (Figure S3) [14]. The ultimate analysis results (Table S4) reveal a high carbon content in both ACs, accompanied by a significant drop in H/C and (O+N)/C, indicating enhanced aromaticity and weakened polarity [17,37], which are conducive to MB adsorption. An O/C ratio below 0.2 represents an extremely high structural stability of P–H–0.5 [38]. The ICP results (Table S5) confirm that the two–step method is more favorable for the doping of target atoms, with negligible influence from heating rates. These things considered, P–2–H–2 has a higher ash content since it is difficult for H3PO4 impregnation corrosion to remove the ash from deep inside the PC that has been generated. The ash occupies part of the mass of P–2–H–2, and may adversely affect the dye adsorption [14].

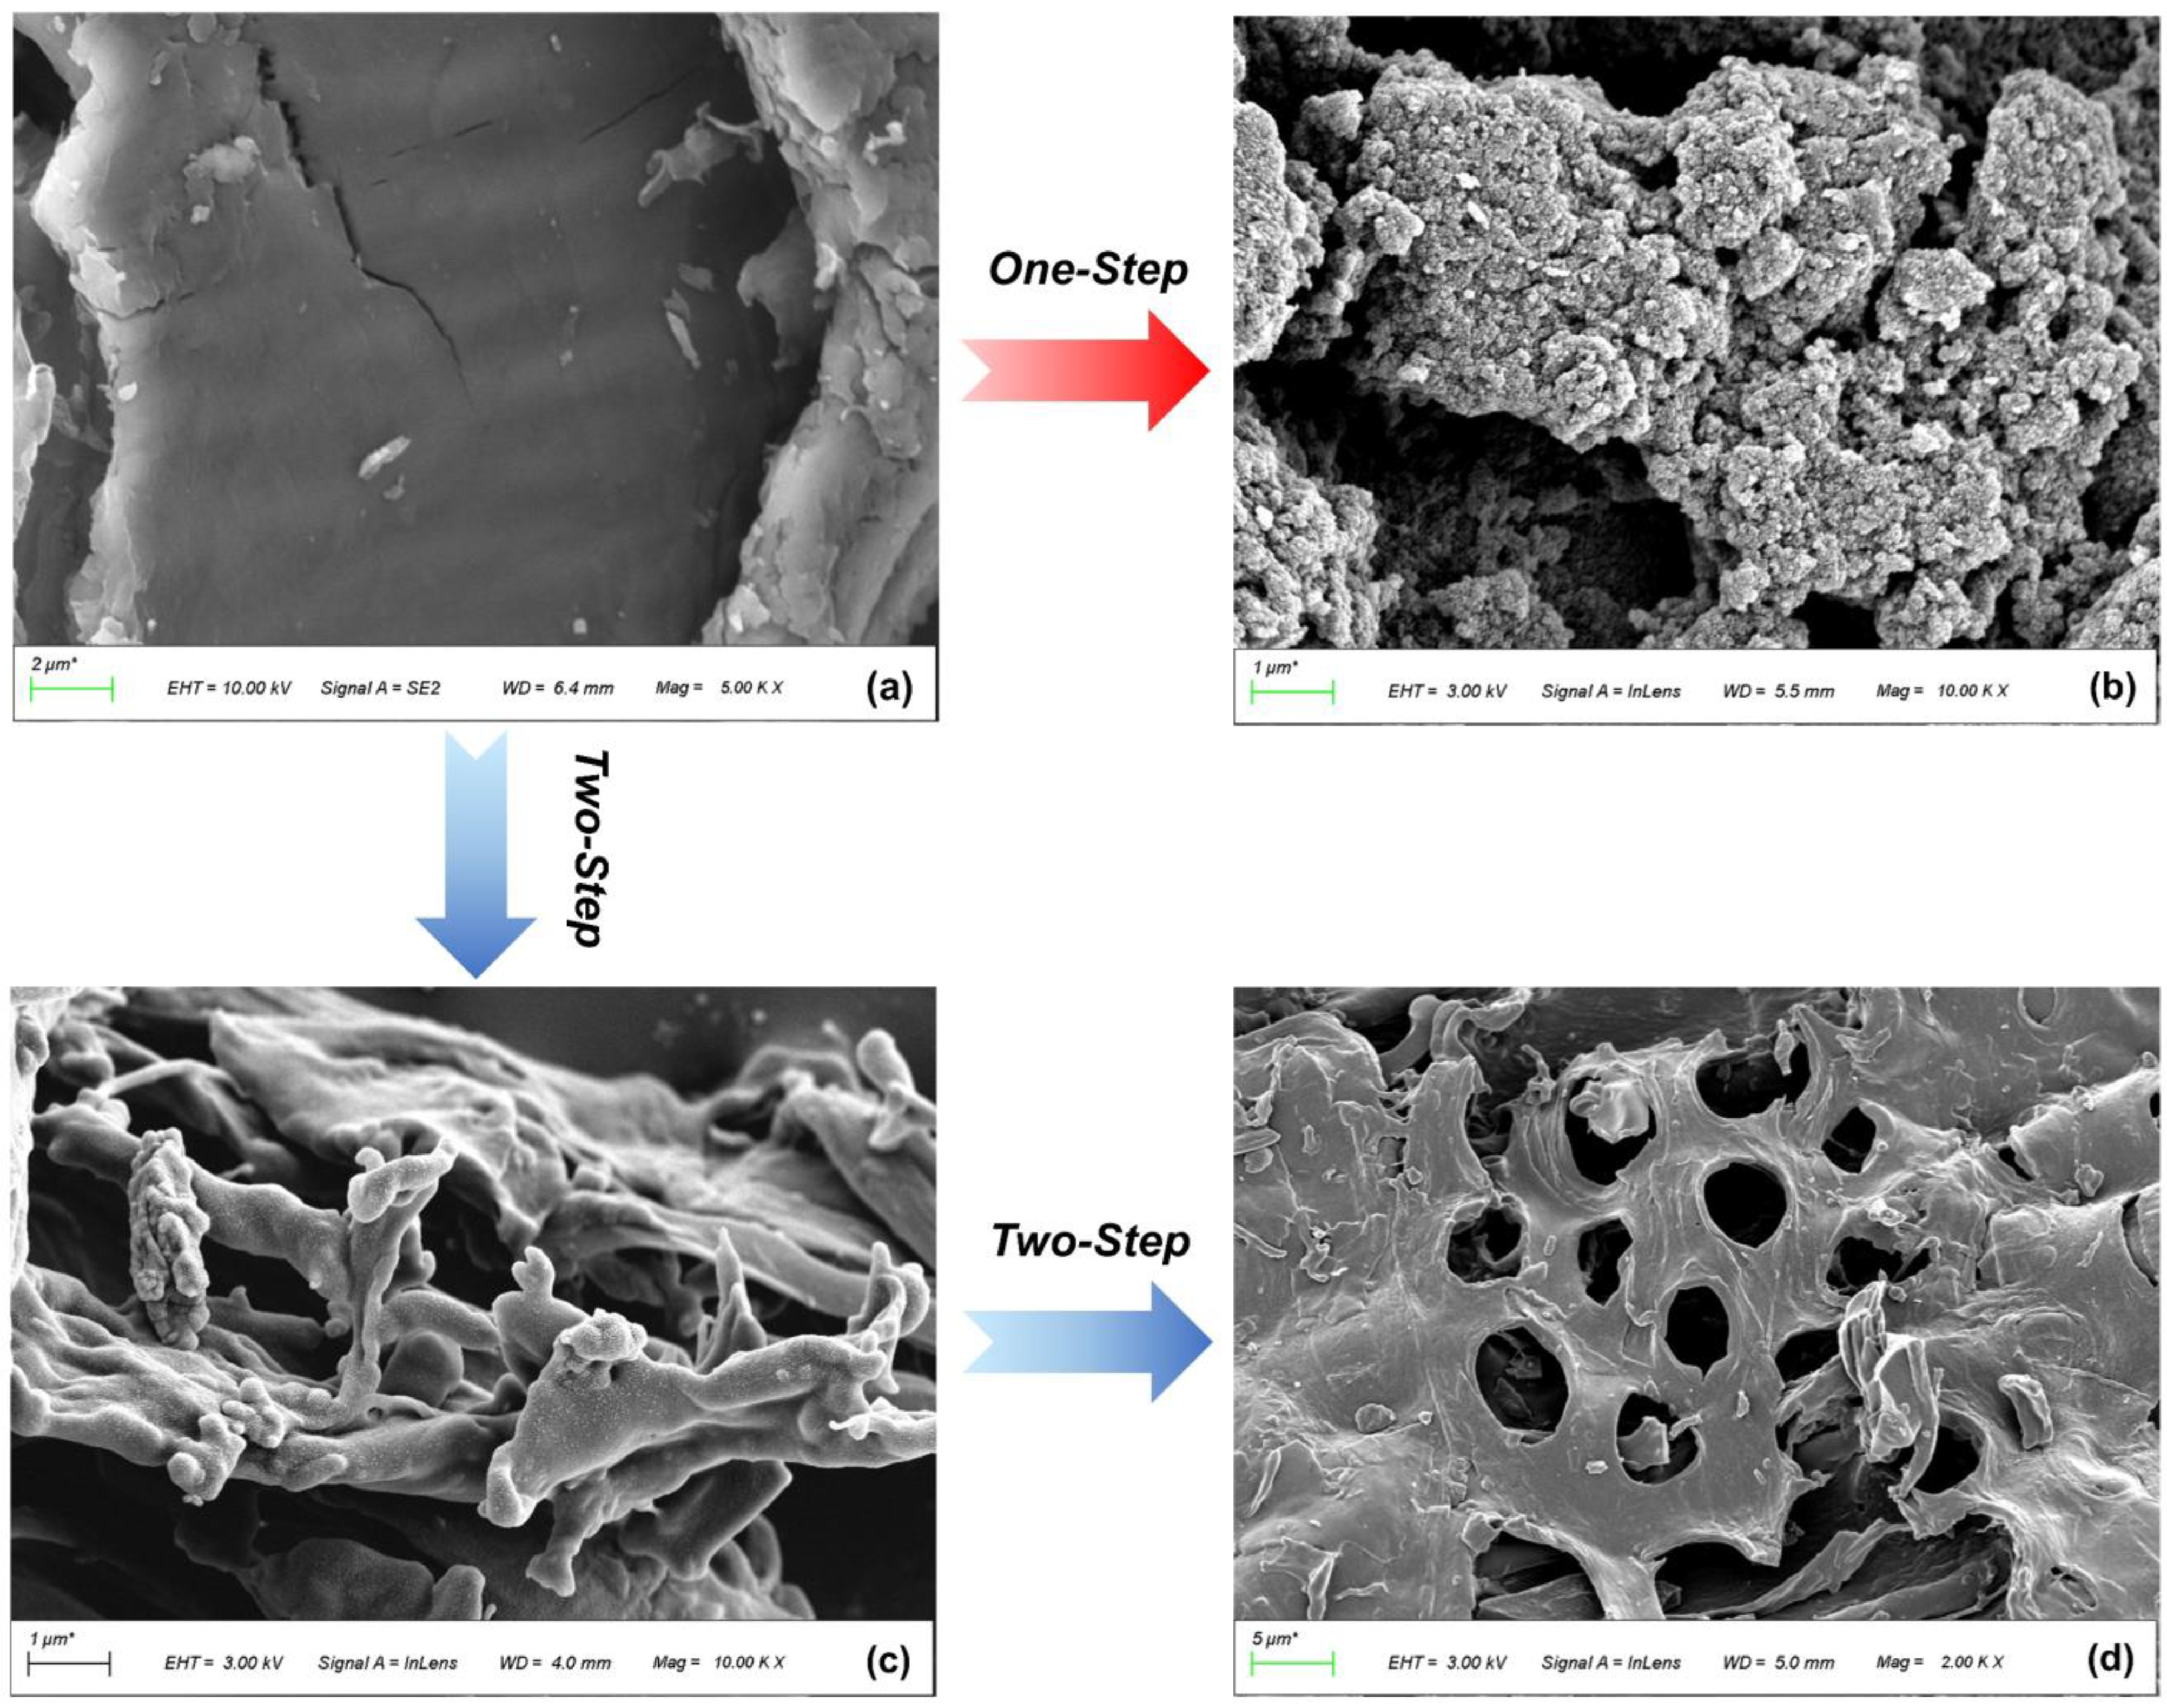
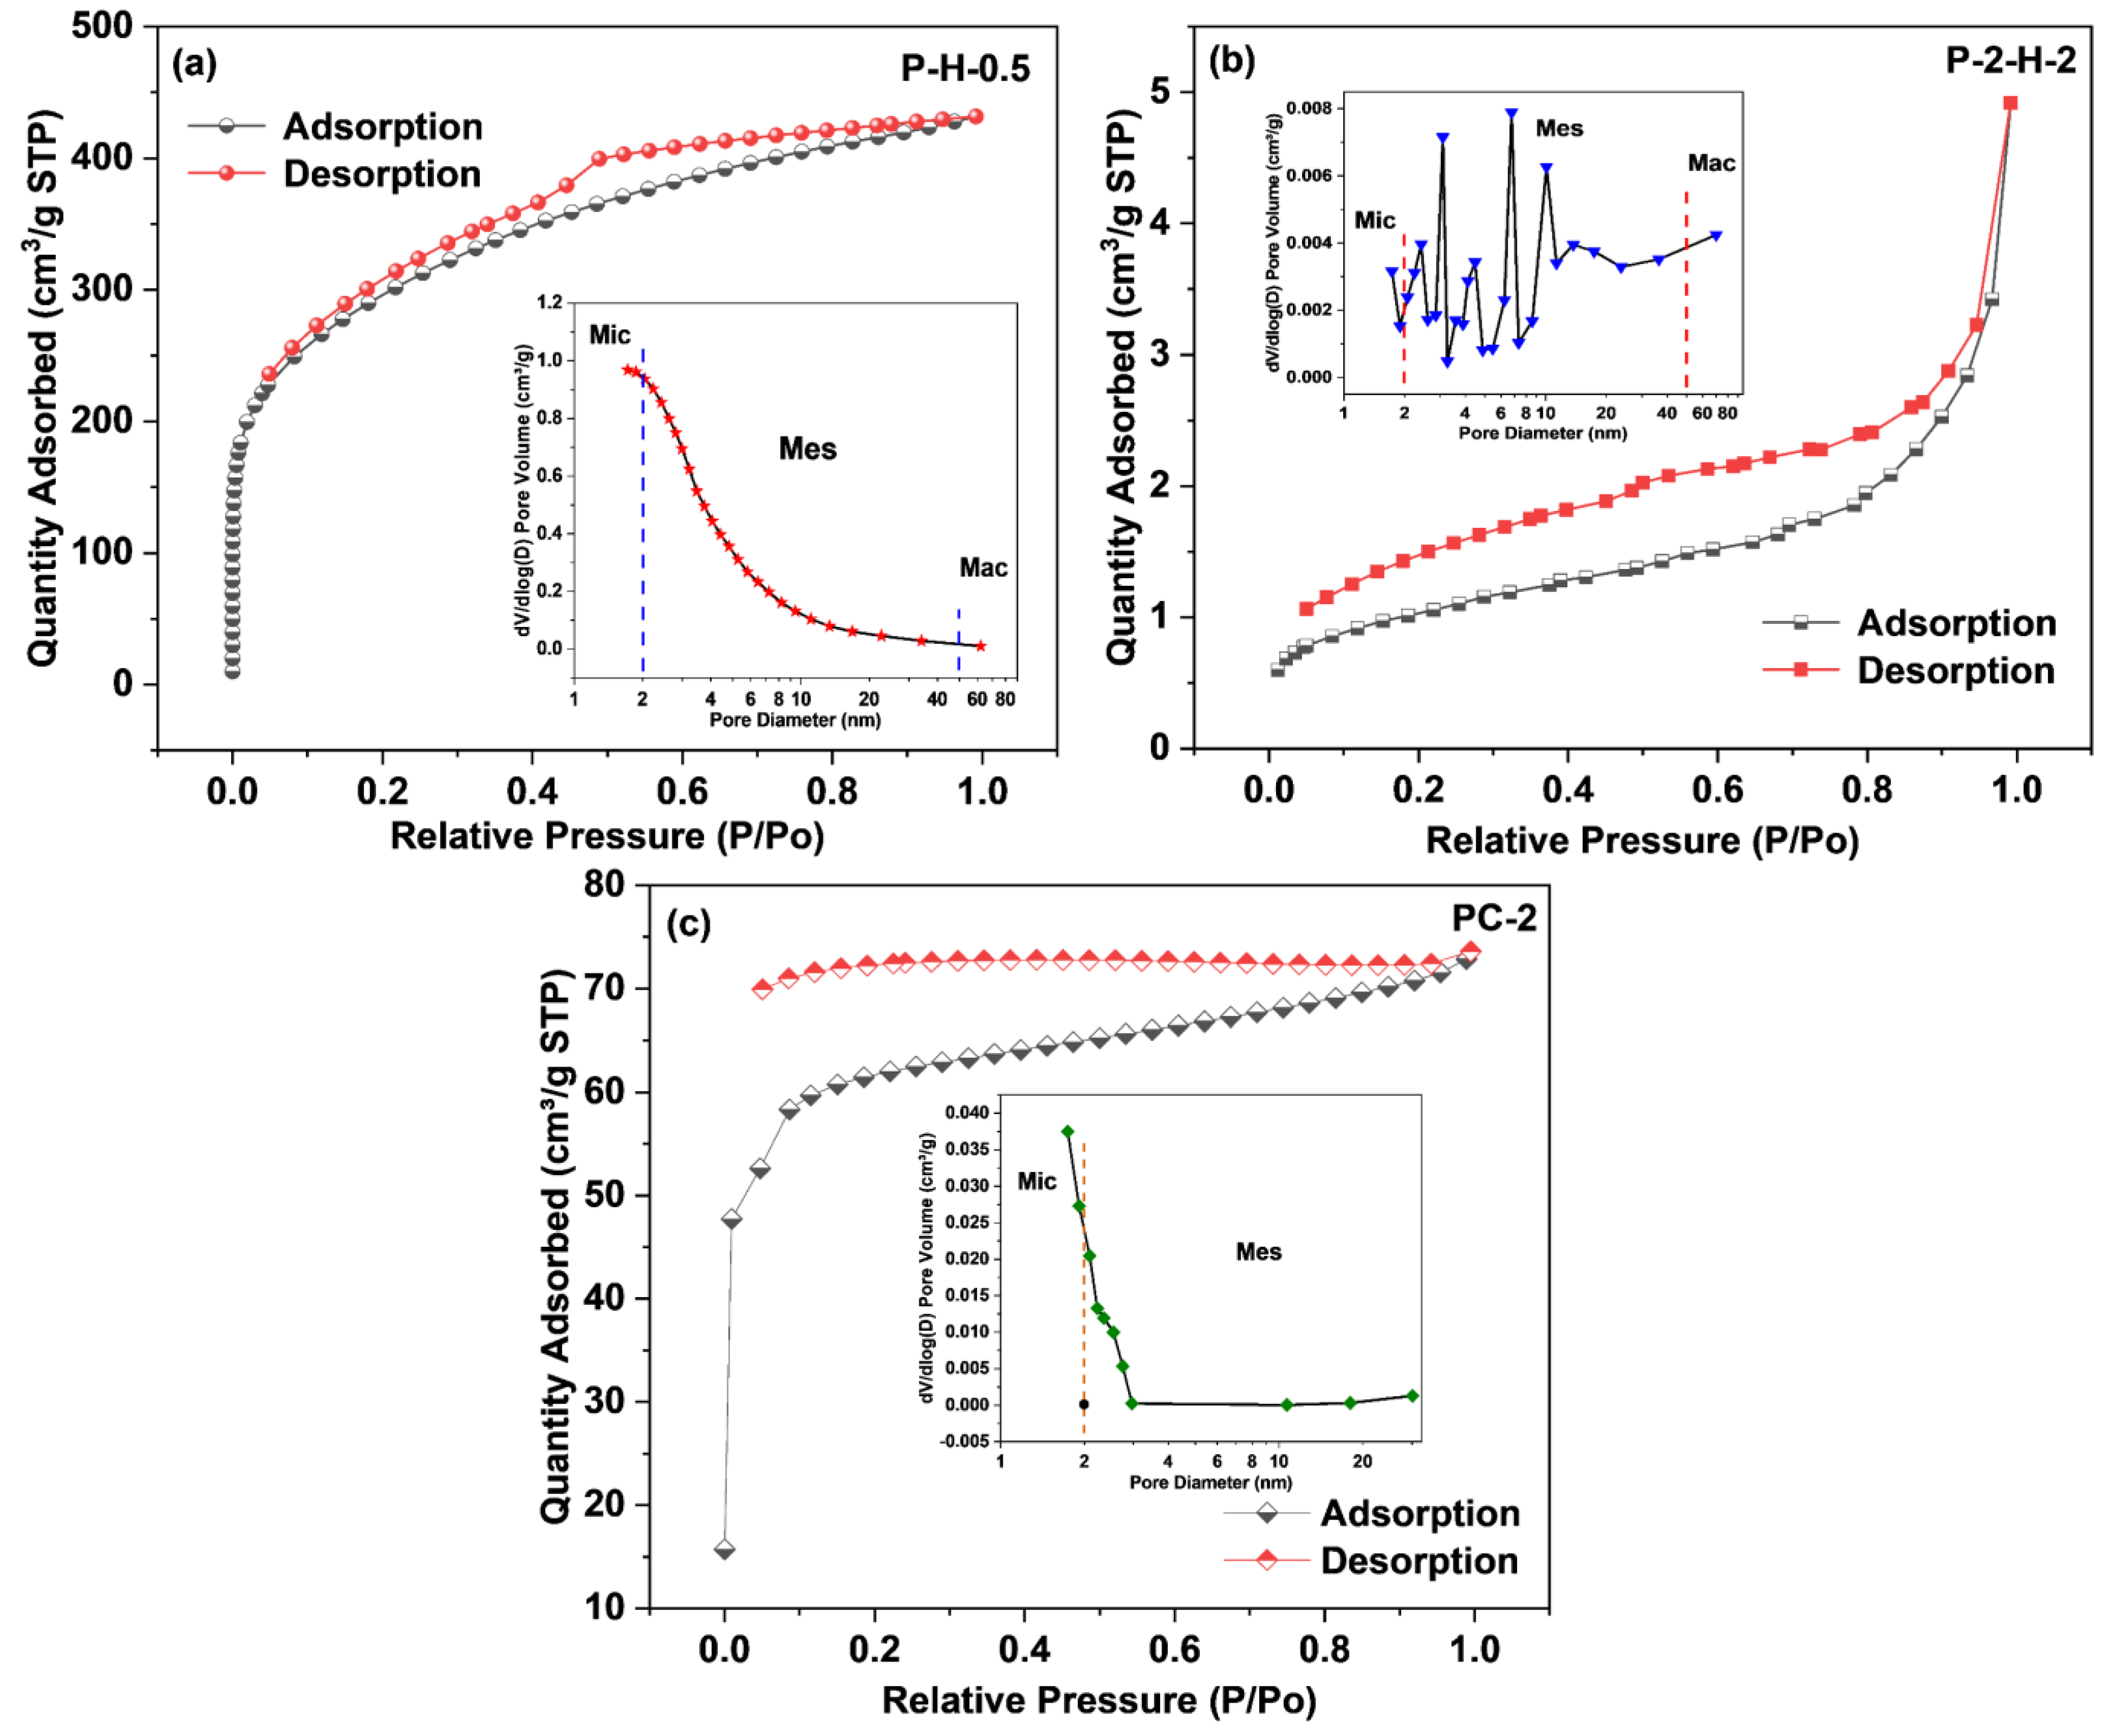
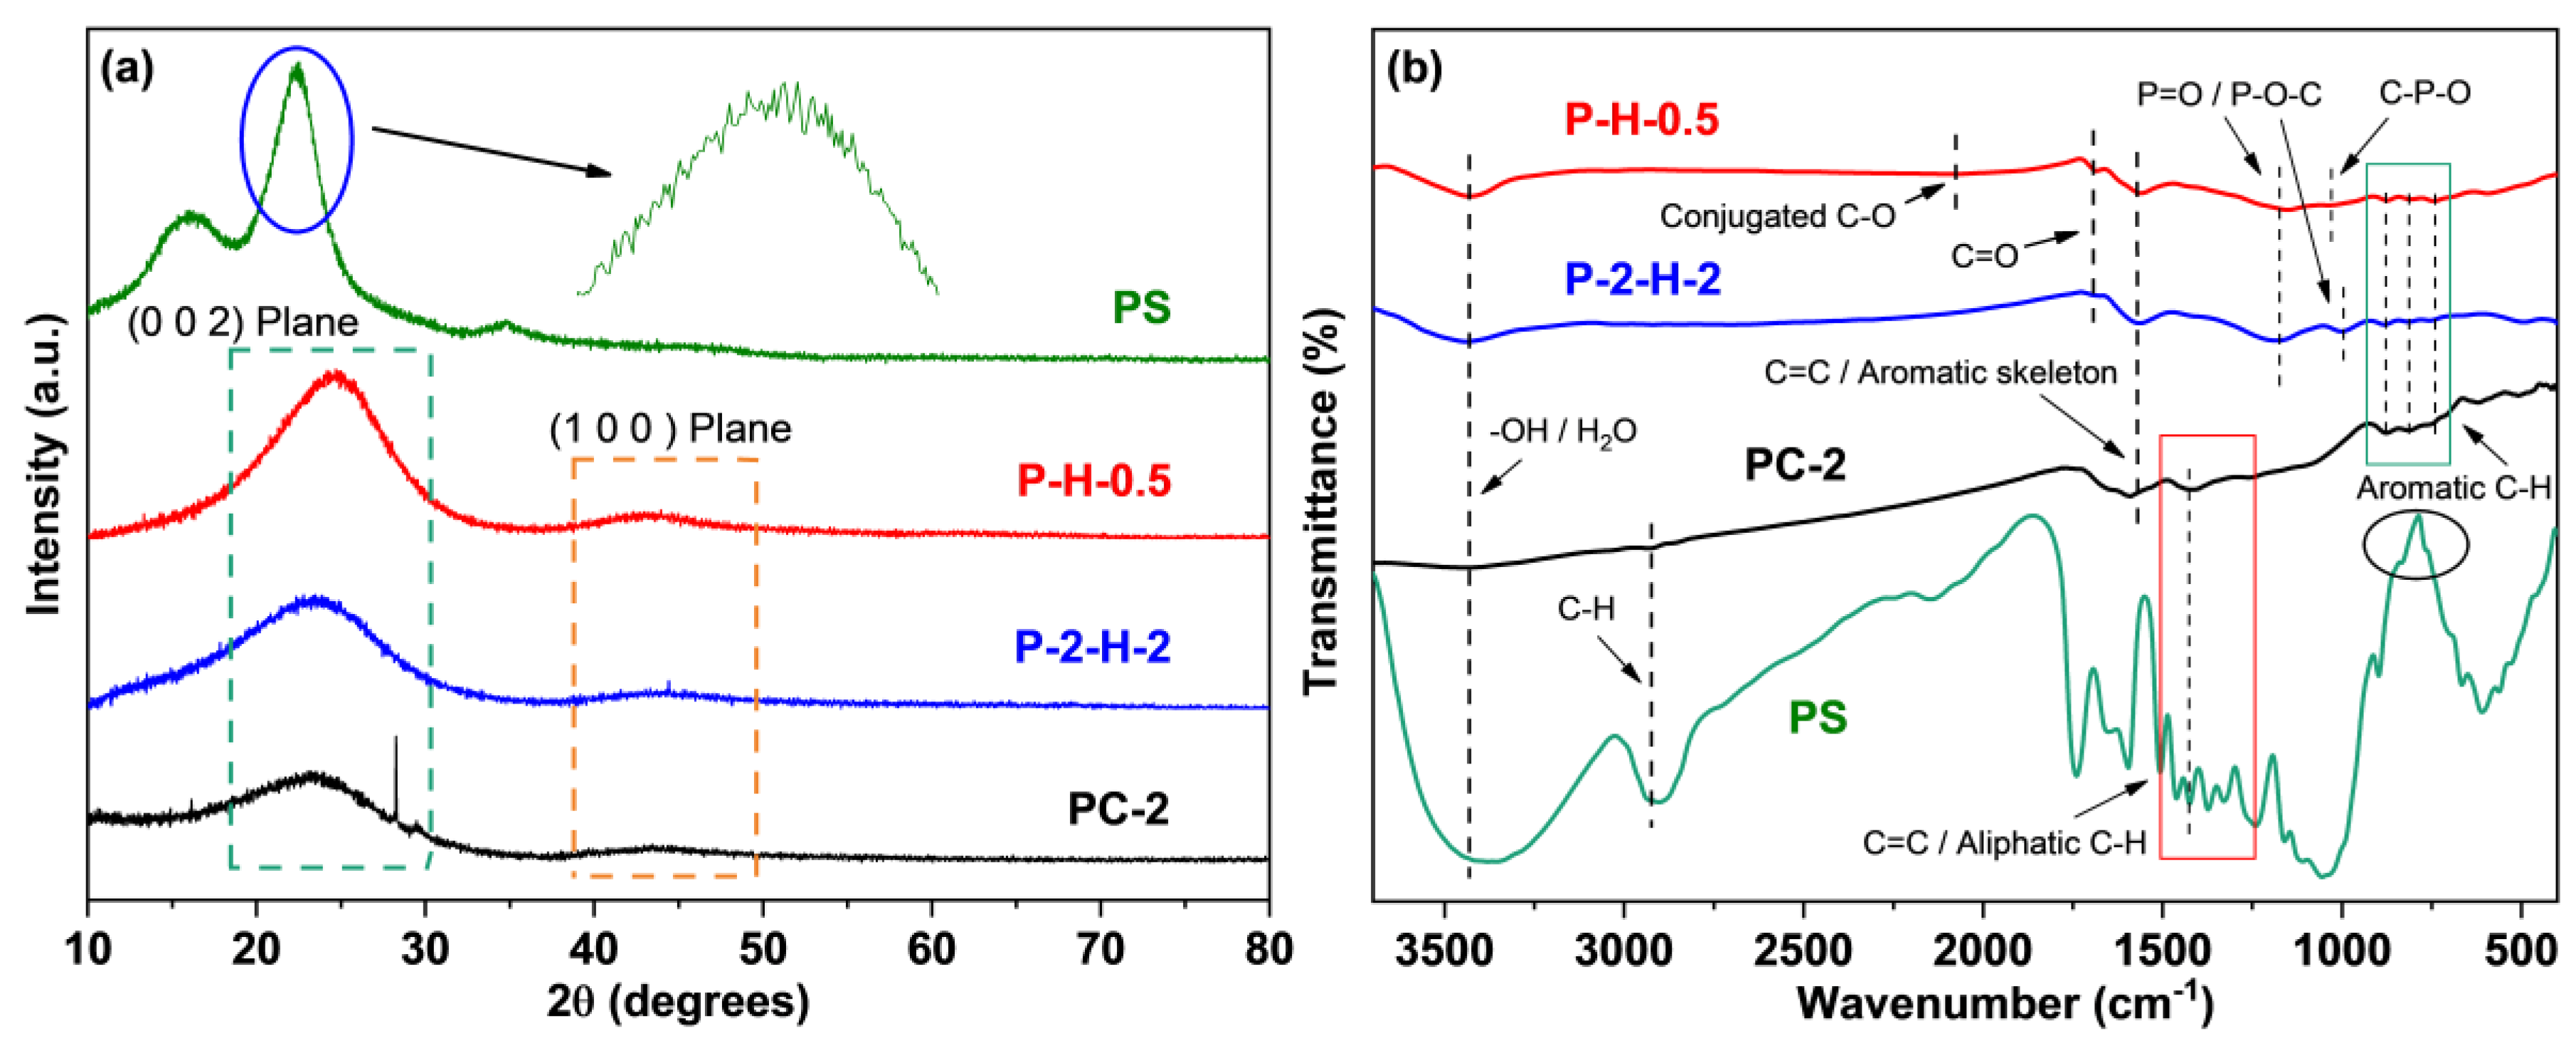
3.2.2. Analysis of Surface Morphology, Pore Structure, and Crystallinity

The SEM images (Figure 3) illustrate the morphological changes from the raw material to the modified biochar. The PS surface is very flat, which provides a suitable place for H3PO4 to uniformly contact raw materials. Pyrolysis gradually makes the microscopic cross–linked structure unravel (Figure 3c), and pores are initially formed. Due to the fast release of VM during FP, the pore structure is relatively irregular. The regular pore structure is obtained after one–step activation, with numerous micropores evenly distributed on the surface of P–H–0.5 (Figure 3b). The pore development of P–2–H–2 (Figure 3d) is based on the microscopic morphology of PC–2. As a medium–strong acid, H3PO4 has a pore-enlarging effect on PC during activation [31], thus clear macropores can be captured on the AC surface. These macropores facilitate the exposure of other pores and accelerate the transport of MB molecules to the interior. The pores of H3PO4–ACs originate from different cavities left after washing phosphate compounds [39], providing further insight into this pore formation trend.
The results of N2 adsorption–desorption experiments are presented in Table 1 and Figure 4. The adsorption isotherm of P–H–0.5 is a typical type I isotherm, reflecting the presence of well–developed micropores. With increasing relative pressure (P/Po), the quantity absorbed rises rapidly, revealing a strong interaction between the adsorbate and the material surface [10]. Subsequently, multilayer adsorption forms and the curve shows a plateau phase, resulting from pore volume filling. The H4–hysteresis loop combination of adsorption–desorption isotherms indicates the existence of narrow mesopores. By comparison, P–2–H–2 demonstrates a type II adsorption isotherm, indicating the presence of noticeable macropores. These macropores facilitate the fast transport of liquid molecules [15,40]. The corresponding isotherms demonstrate an H3–type hysteresis loop, suggesting the irregularity of the pore structure, which is consistent with the pore distribution (insets). PC–2 exhibits high microporosity and narrow pore size distribution (Figure 4c), providing sufficient space for subsequent activators. The SSA of P–H–0.5 exceeds 1000 m2·g−1 whereas that of P–2–H–2 is significantly lower as a result of pore collapse, fewer micropores, and the partial occupation of pore channels by residual phosphate derivatives [41]. Similar experimental results with low SSA and high adsorption capacity were obtained by Zheng et al. using pine sawdust as raw material [15]. Therefore, the subsequent adsorption would depend mainly on the surface group content of P–2–H–2. Moreover, the pore size of P–2–H–2 is much larger than that of the other two samples, revealing that the essence of the two–step H3PO4 activation is pore enlargement and loading of target functional groups. The BET results agree with the pore formation trend observed in SEM. It is worth noting that the slow activation instead leads to a decrease in SSA and pore volume (Table 1), yet has little effect on the shape of both adsorption–desorption isotherms and pore size distribution (Figure S4). The phenomenon concerning slow activation partly responds to the reduced final yield and enhanced adsorption performance of FP–ACs (Table S2).
The XRD spectra are presented in Figure 5a. The XRD pattern of PS appears powdery with numerous burrs, resembling the patterns of various types of lignocellulosic biomass [7,42,43], making it challenging to discern specific crystal structures. The lower crystallinity allows for the rapid penetration of the activator into the internal structure of the raw material, facilitating the formation of porous structures [42]. The three samples after pyrolysis all show relatively flat characteristic peaks at 24° and 42°, corresponding to the (0 0 2) and (1 0 0) planes of the graphite structure [26,30], which reflects a regular arrangement of crystal structures resulting from carbonization and activation processes [43]. The microstructure of P–H–0.5 exhibits a higher order degree compared to P–2–H–2, which corresponds to the BET analysis.

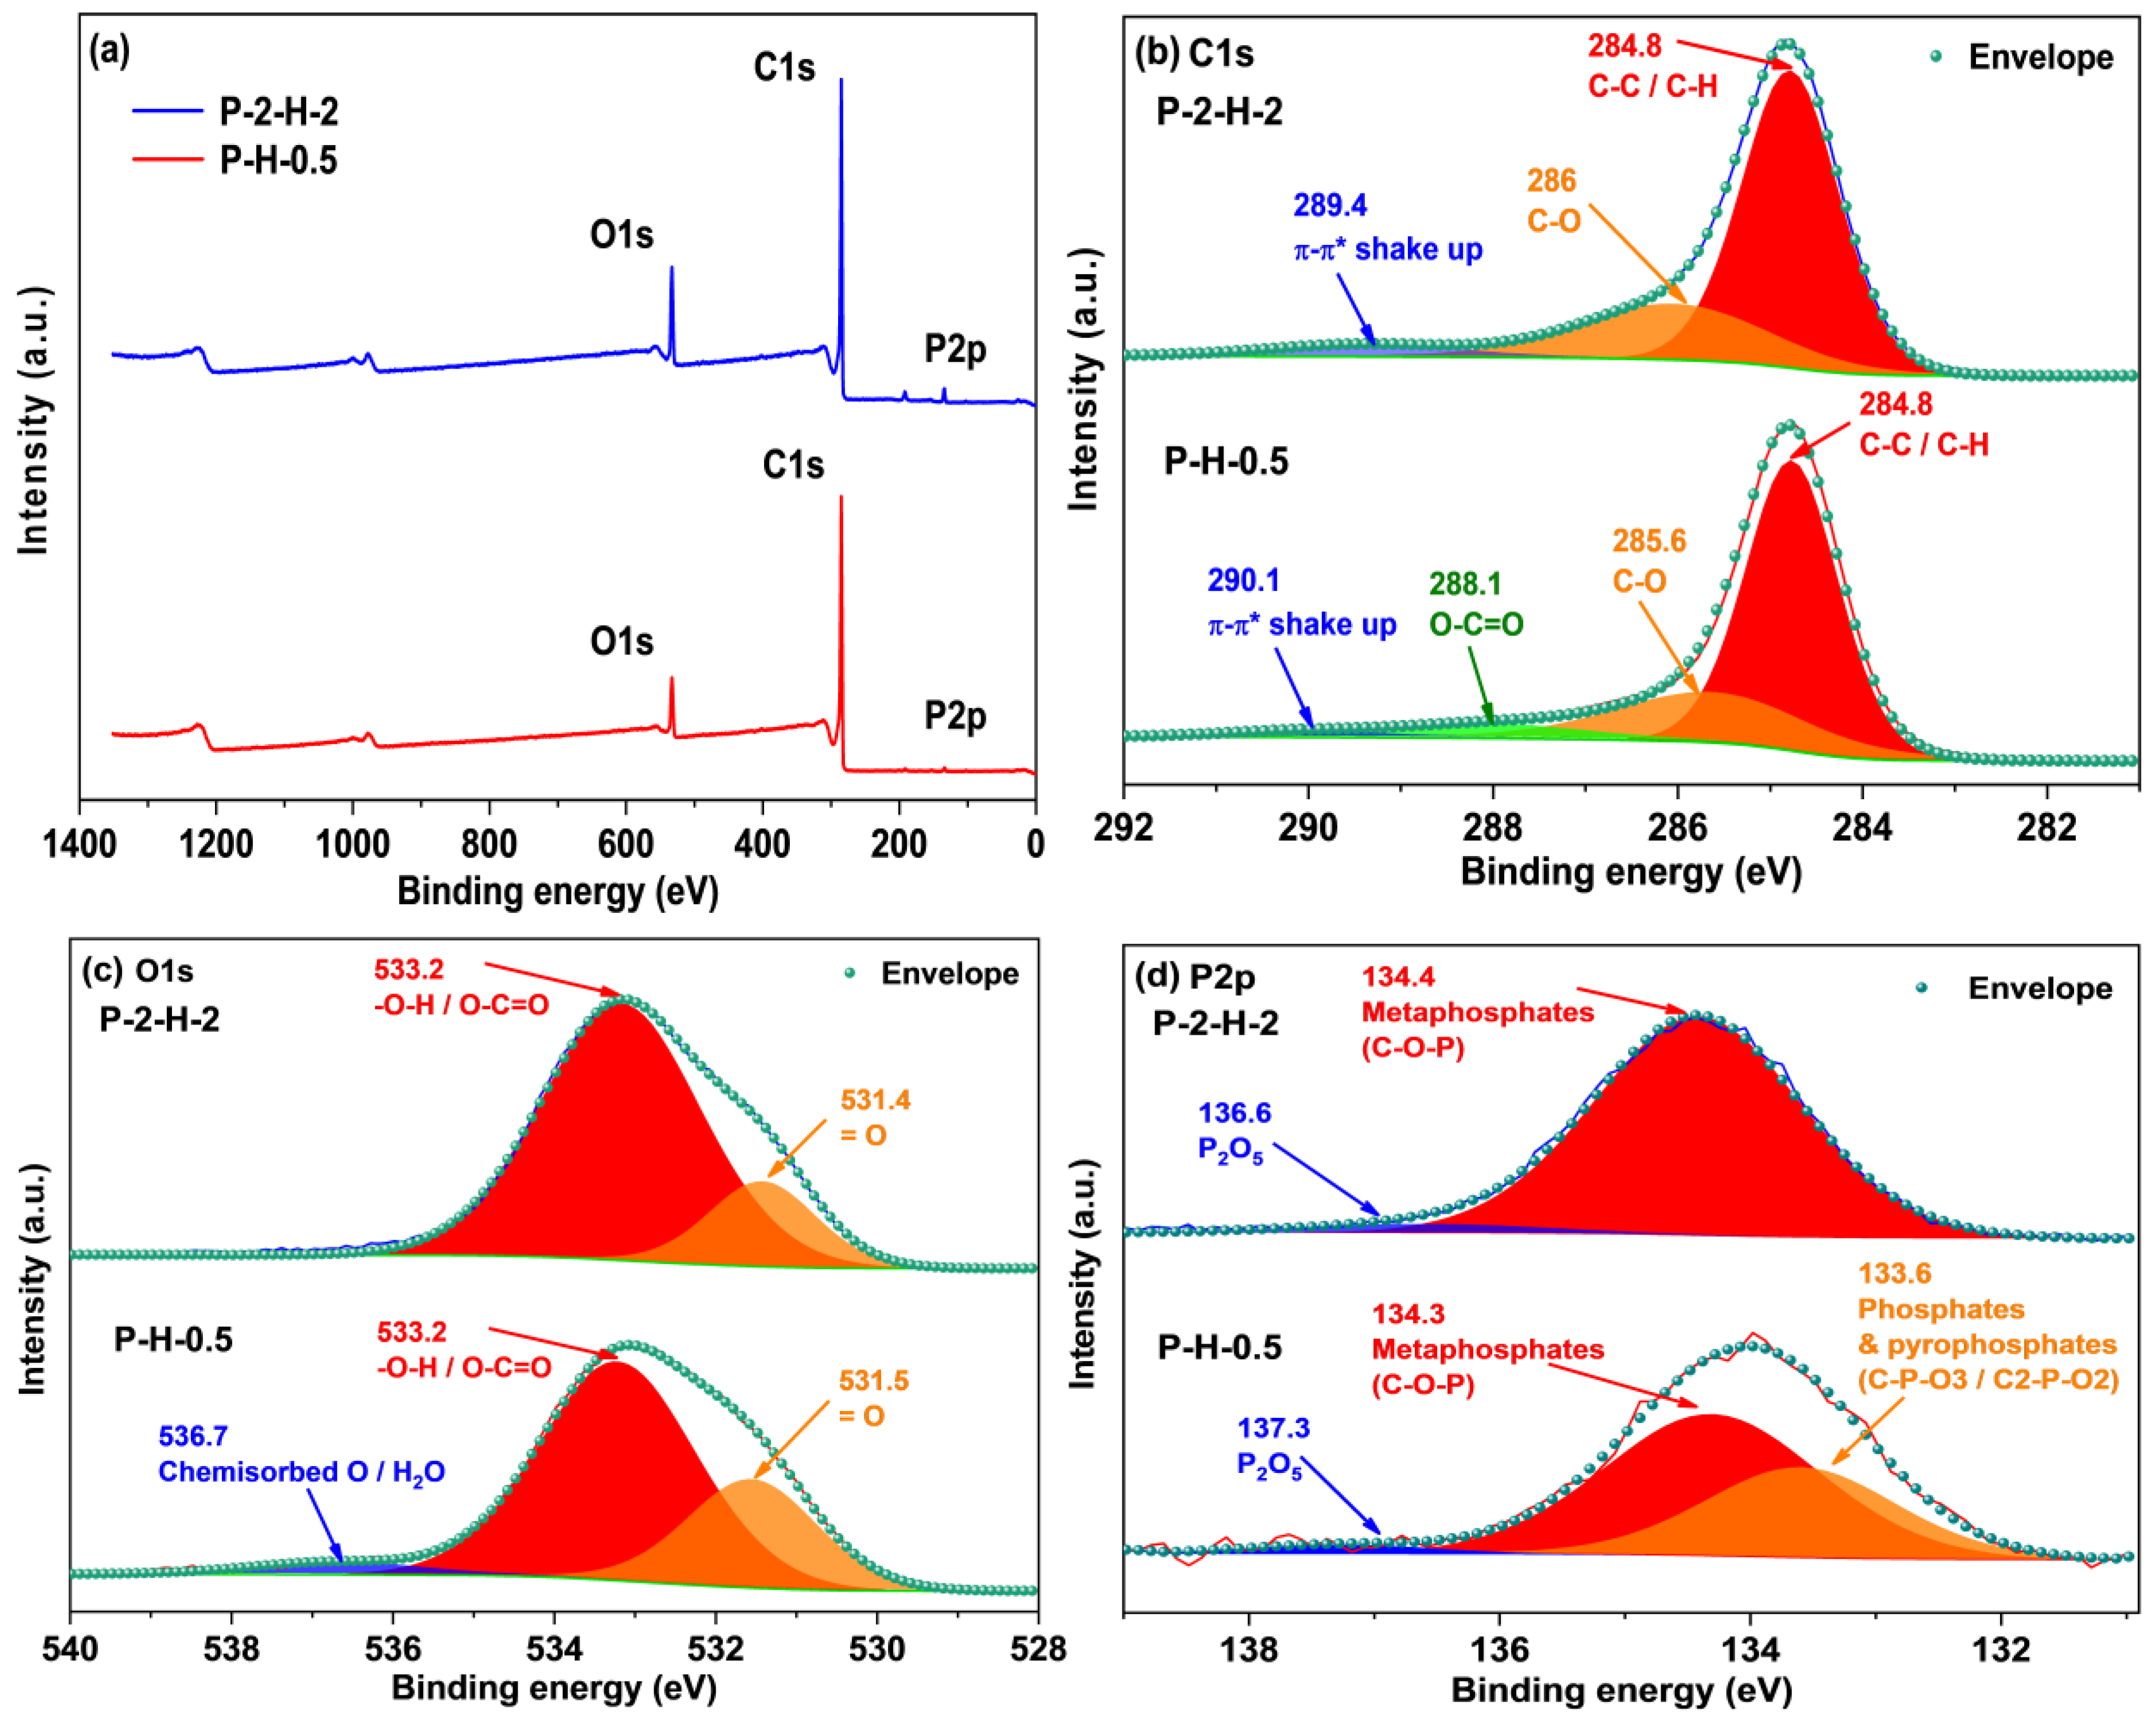
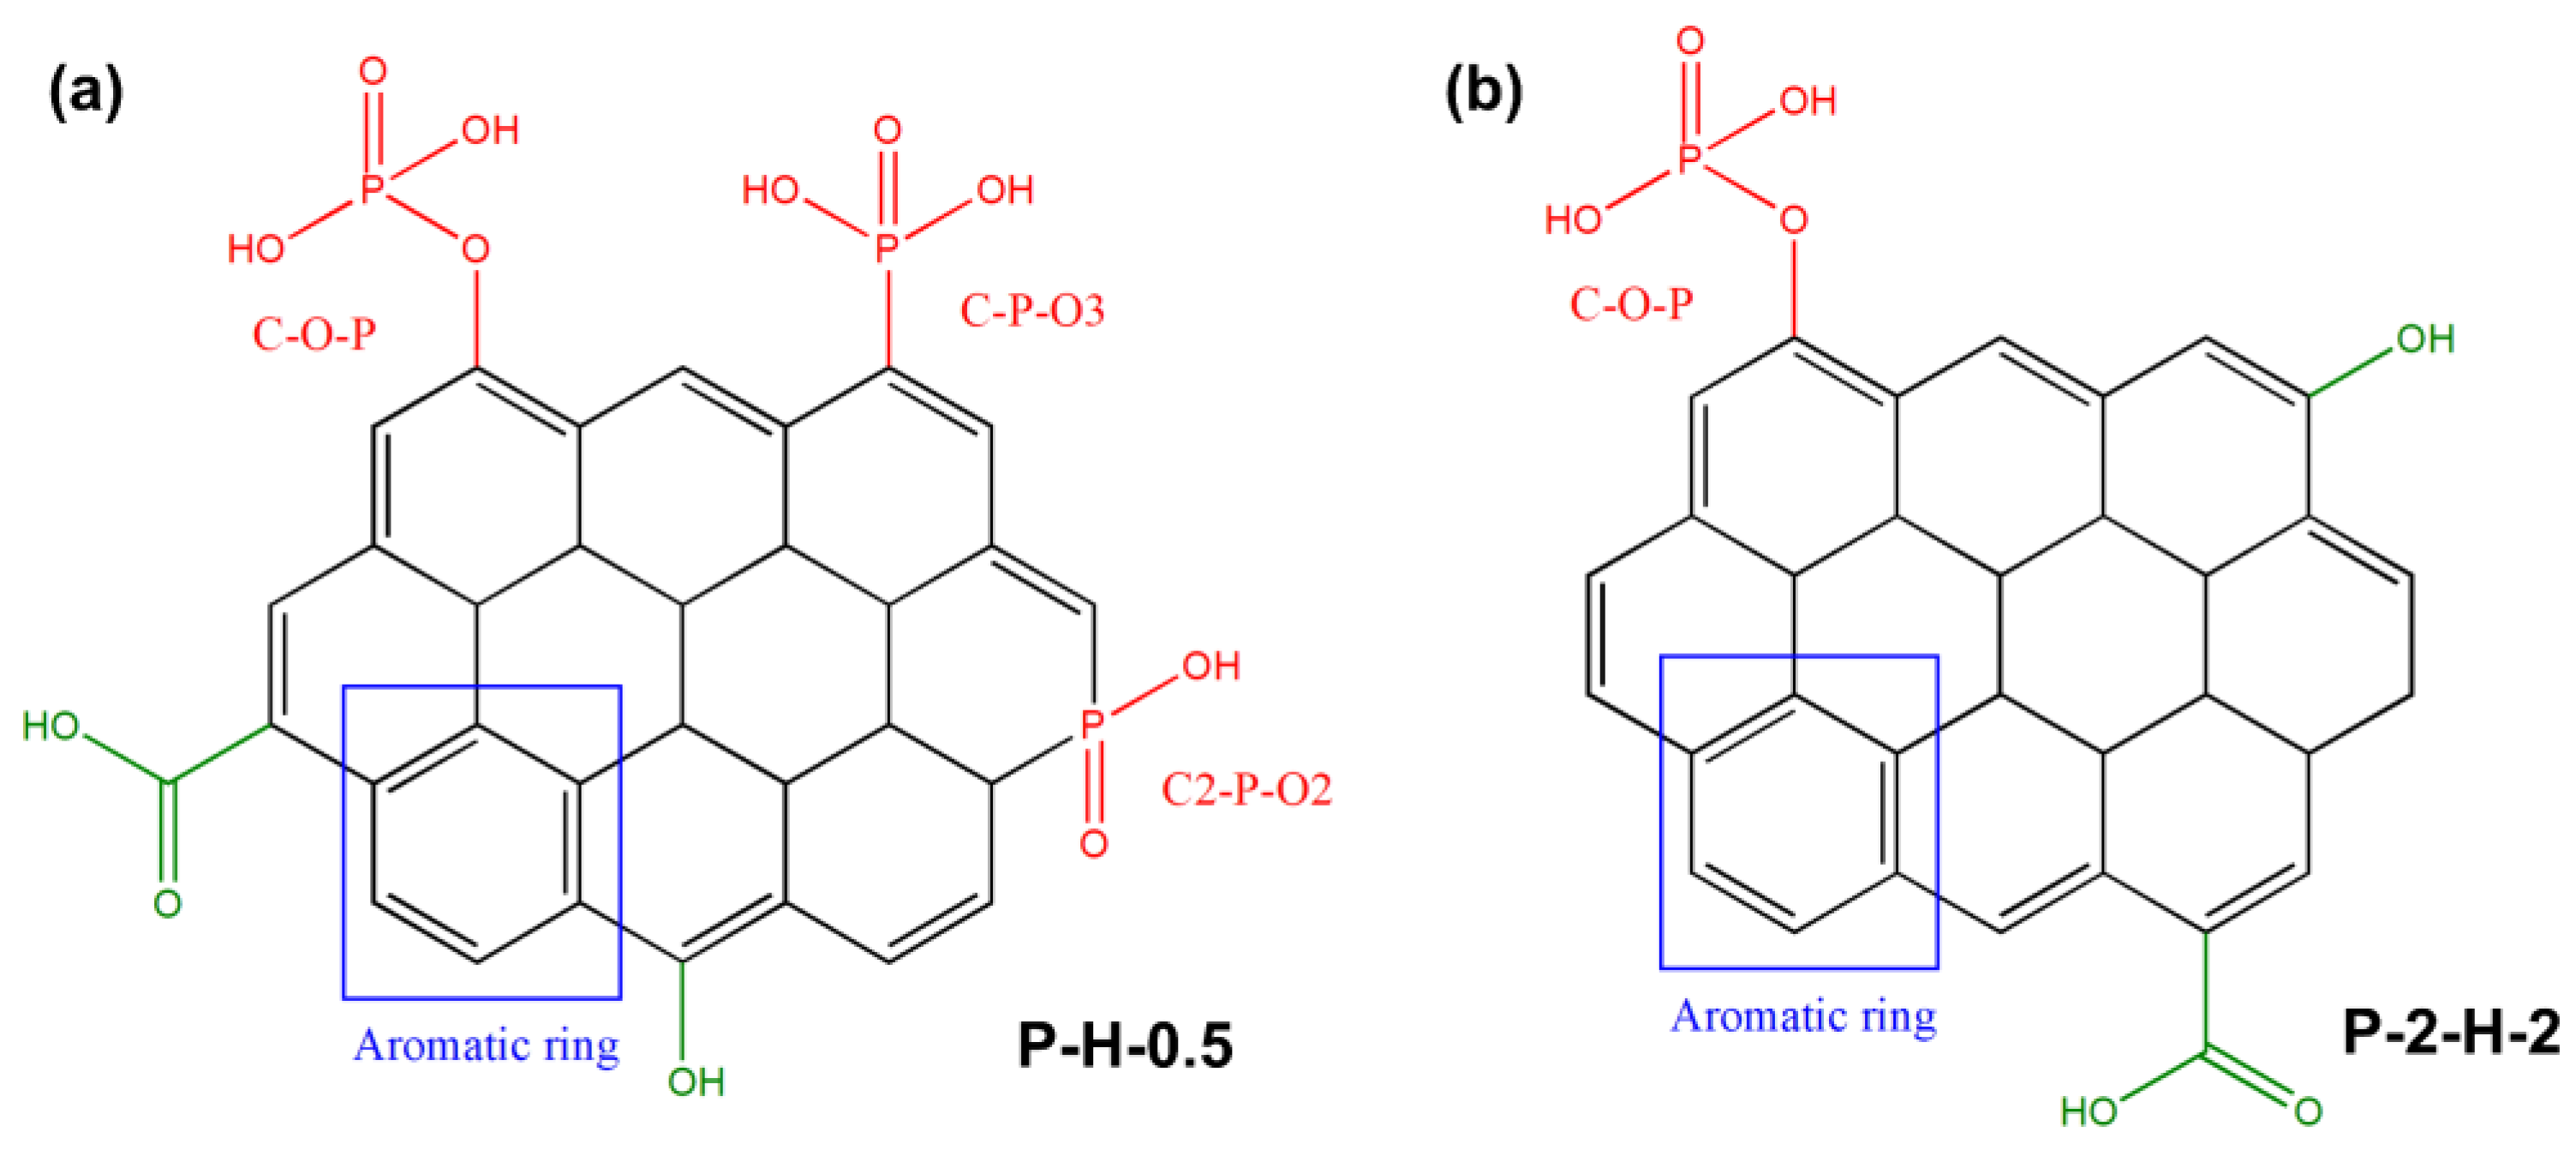
3.2.3. Analysis of Functional Groups and Surface Element

The FTIR analysis reveals more characteristic peaks in PS (Figure 5b), indicating the loss of certain functional groups during carbonization [44]. The –OH or absorbed water and vibration of C=O are detected around 3430 cm−1 and 1682 cm−1, respectively, revealing the presence of hydroxyl and carboxyl groups in all samples [45]. The activation of the oxyacid increases their proportion. The 1561 cm−1 and 740–885 cm−1 peaks correspond to aromatic C=C and C–H deformation [46], which suggests that the strong aromaticity of carbonization products. The adsorptions around 1186 cm−1 and 995 cm−1 are classified as P=O (hydrogen bond) or C–O vibration and O–P in C–O–P [47]. For P–H–0.5, this peak shifts to 1152 cm−1 with slightly reduced intensity [14]. Meanwhile, the stretching of P–O in C–P–O is observed near 1034 cm−1, which tentatively reveals a more diverse P–functional group species for the one–step sample. These denote the successful loading of P and the existence of PO43− ions [10]. The conjugated C–O is observed at 2078 cm−1 in P–H–0.5 [48], which may also serve as the anchor point for dye adsorption. It can be concluded that the peak intensity of P–2–H–2 is higher, while the types of groups observed are less than P–H–0.5. Moreover, H3PO4 activation causes the loss of –CH2– stretch at 2900–2925 cm−1 [46], with a further reduction in aliphatic compounds.
XPS analysis of surface elements confirms that the loading of target elements is more pronounced in P–2–H–2 (Figure 6). The “Envelope” in each high–resolution spectrum reveals a good fit. The C1s signal of P–2–H–2 is allocated to C–C/C–H [49], C–O in phenol, alcohol, or ether [41], and π–π* shake–up [50]. The presence of π–π* shake–up indicates the high level of aromatization in the modified biochar. Meanwhile, for P–H–0.5, the fitting peak at 288.1 eV corresponds to O–C=O related to carboxyl or ester groups [44,50]. The low intensity of the carboxyl peak in the FTIR spectrum of P–2–H–2 (1682 cm−1) is consistent with the peak splitting observed in XPS analysis. The O1s peaks can be fitted with =O in carboxyl, carbonyl, or phosphate [50] and –O–H/O–C=O [10,41]. Also, the O1s peak of P–H–0.5 is assigned to chemisorbed O or H2O (536.7 eV) [49]. The presence of H3PO4 and the two–step method would aggravate dehydration. For P2p, the peak at 134.4 eV represents the metaphosphates, which typically correspond to C–O–P [10]. Moreover, the presence of phosphate or pyrophosphate is detected in P–H–0.5 [50]. This is due to the lower water content and more pores of PC–2 compared to PS, which is beneficial for phosphate derivatives to access the interior. The phosphate compounds further promote the dehydration of the intermediate products [51]; thus, orthophosphates or pyrophosphates are further dehydrated and converted to metaphosphates. Peaks near 136.6 eV usually represent the presence of C–P–O3 or C2–P–O2 structures [20]. Furthermore, FP accelerates the sublimation of P2O5 (>360 °C), making its signal weak. H3PO4 can be chosen as a catalyst for the pyrolysis reaction [51], promoting bond fracture and cross–linking formation. These reactions may start at the impregnation stage [31], eventually leading to the retention of more other substances in P–H–0.5. The detailed deconvolution results of XPS spectra are summarized in Table S6. In short, the AC obtained by co–pyrolysis of PS and H3PO4 under FP contains a wider range of target substances and lower elemental or group content, which tallies with the ICP and FTIR results. The corresponding adsorption active sites of P–H–0.5 and P–2–H–2 are demonstrated in Figure 7.
Since XPS is a surface analysis and the test range is limited, it cannot indicate the overall properties of the sample. The relative P content of P–H–0.5 detected is considerably low (0.96% vs. 2.76% in P–2–H–2) responding to the ICP results. To minimize errors caused by inhomogeneity, the EDS–element mapping test was performed (Figure S5). The results show relatively uniform distribution of P elements in P–H–0.5, except for noticeable pores. The low P content reflects the difficulty of P–doping. Despite the addition of P compared to other high–performance MB adsorbents [44], the relative P content remains relatively small. Therefore, improving the P–doping efficiency of the one–step method, especially at low temperatures, should be a key consideration for future related research.

3.3. Adsorption Properties and Potential Application Strategies

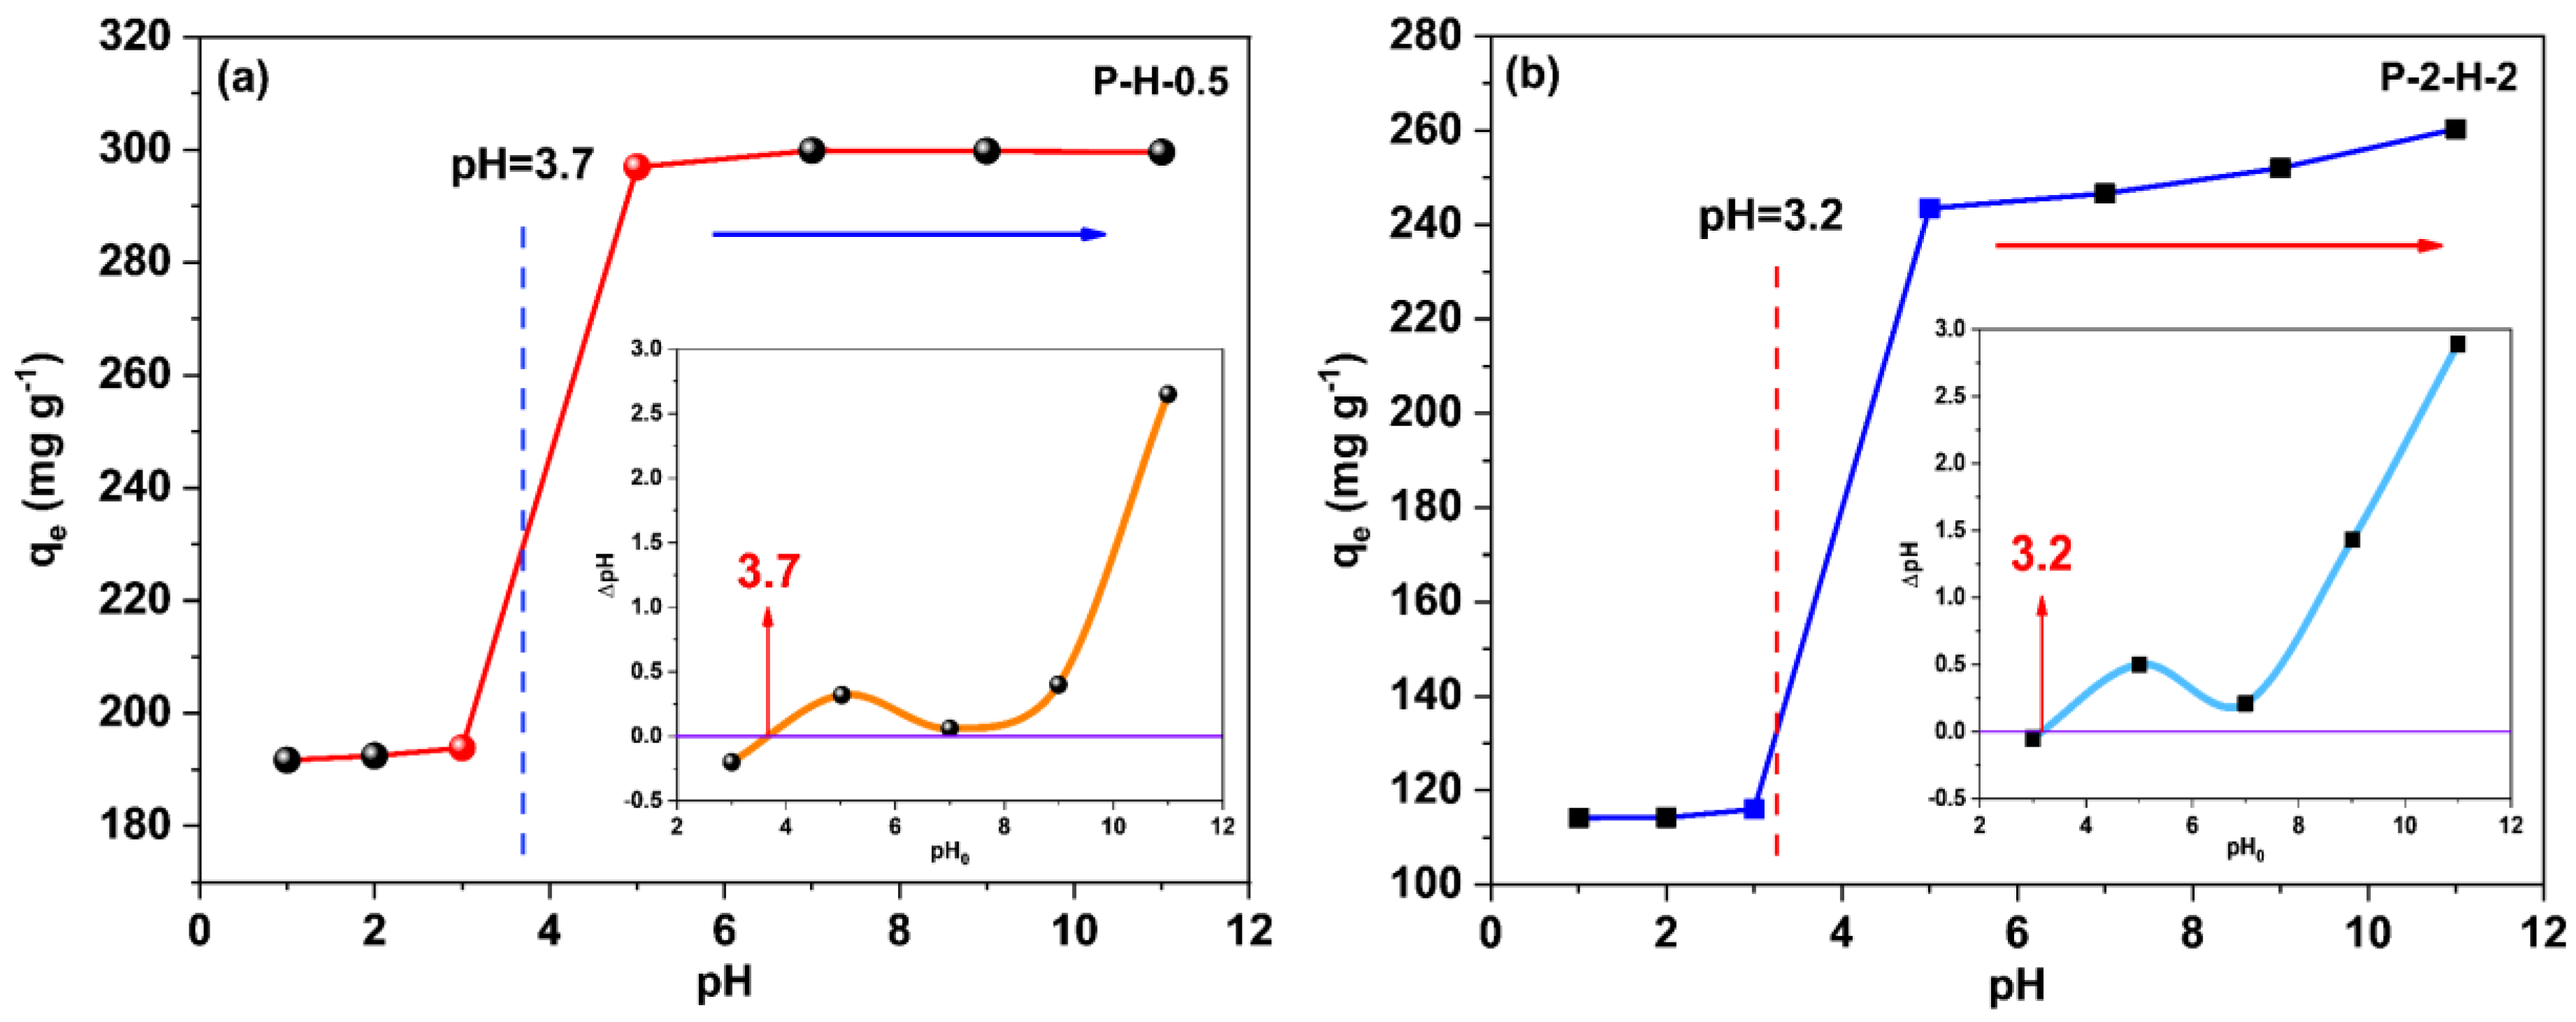
3.3.1. System pH Effect on Adsorption

The pH variation can affect the existing way of target adsorbates in the system, the dissociation of surface charge, and the functional groups of the adsorbents [52]. Figure 8 corresponds to the variation in the adsorption capacity of the two samples concerning pH. Since both samples are H3PO4–modified adsorbents, the change trends are similar. The adsorption capacity of P–H–0.5 tends to be stable when pH > 5, while P–2–H–2 still slightly increases, indicating that the two–step sample is more acidic and more sensitive to pH [14,53]. The surfaces of both samples are negatively charged when pH > pHPZC (insets), whereas in the relatively acidic (pH < pHPZC) system, MB molecules mainly undergo protonation [54]. Thereafter, with increasing pH, deprotonation dominates and the proportion of cation in the dye molecule gradually rises. A strong electrostatic interaction between the cations of the adsorbate and the negative charges on the sample is revealed when pH > pHPZC, leading to a rapid rise in qe. Subsequent adsorption kinetics, isotherm, and thermodynamic experiments were conducted at pH 7 to ensure the accuracy of the experiments and the adequate adsorption of MB on the AC.

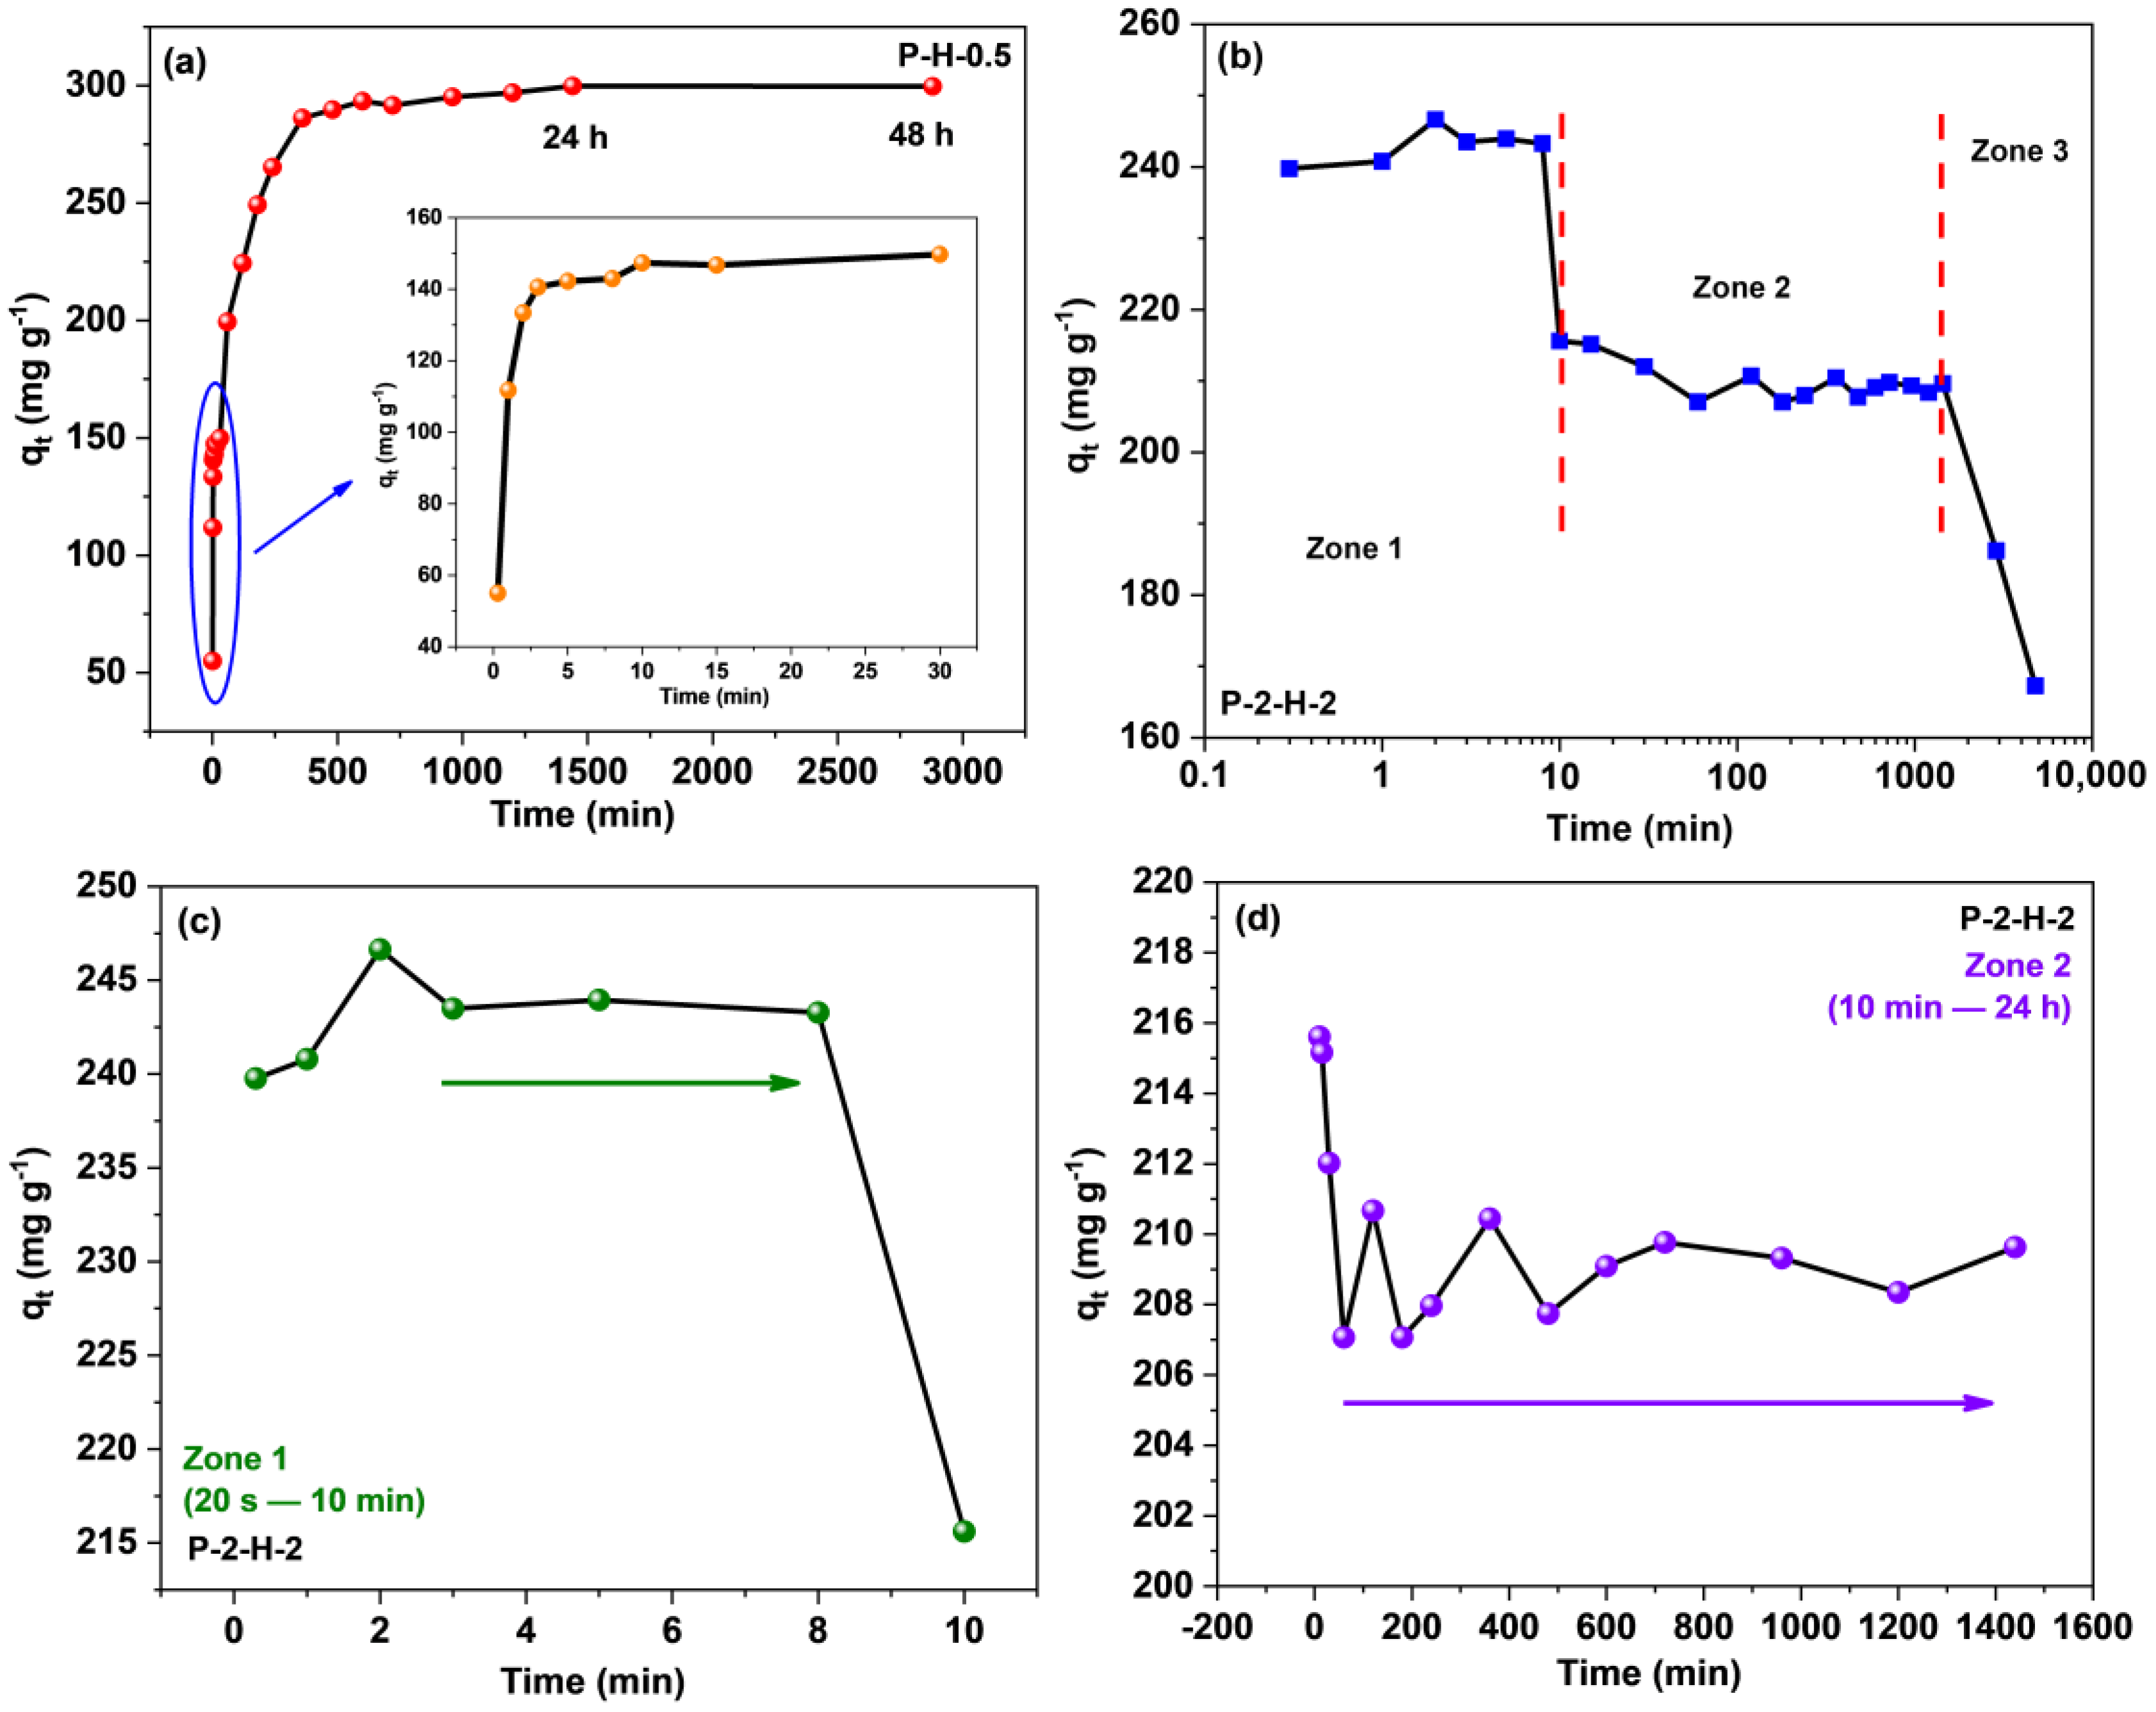
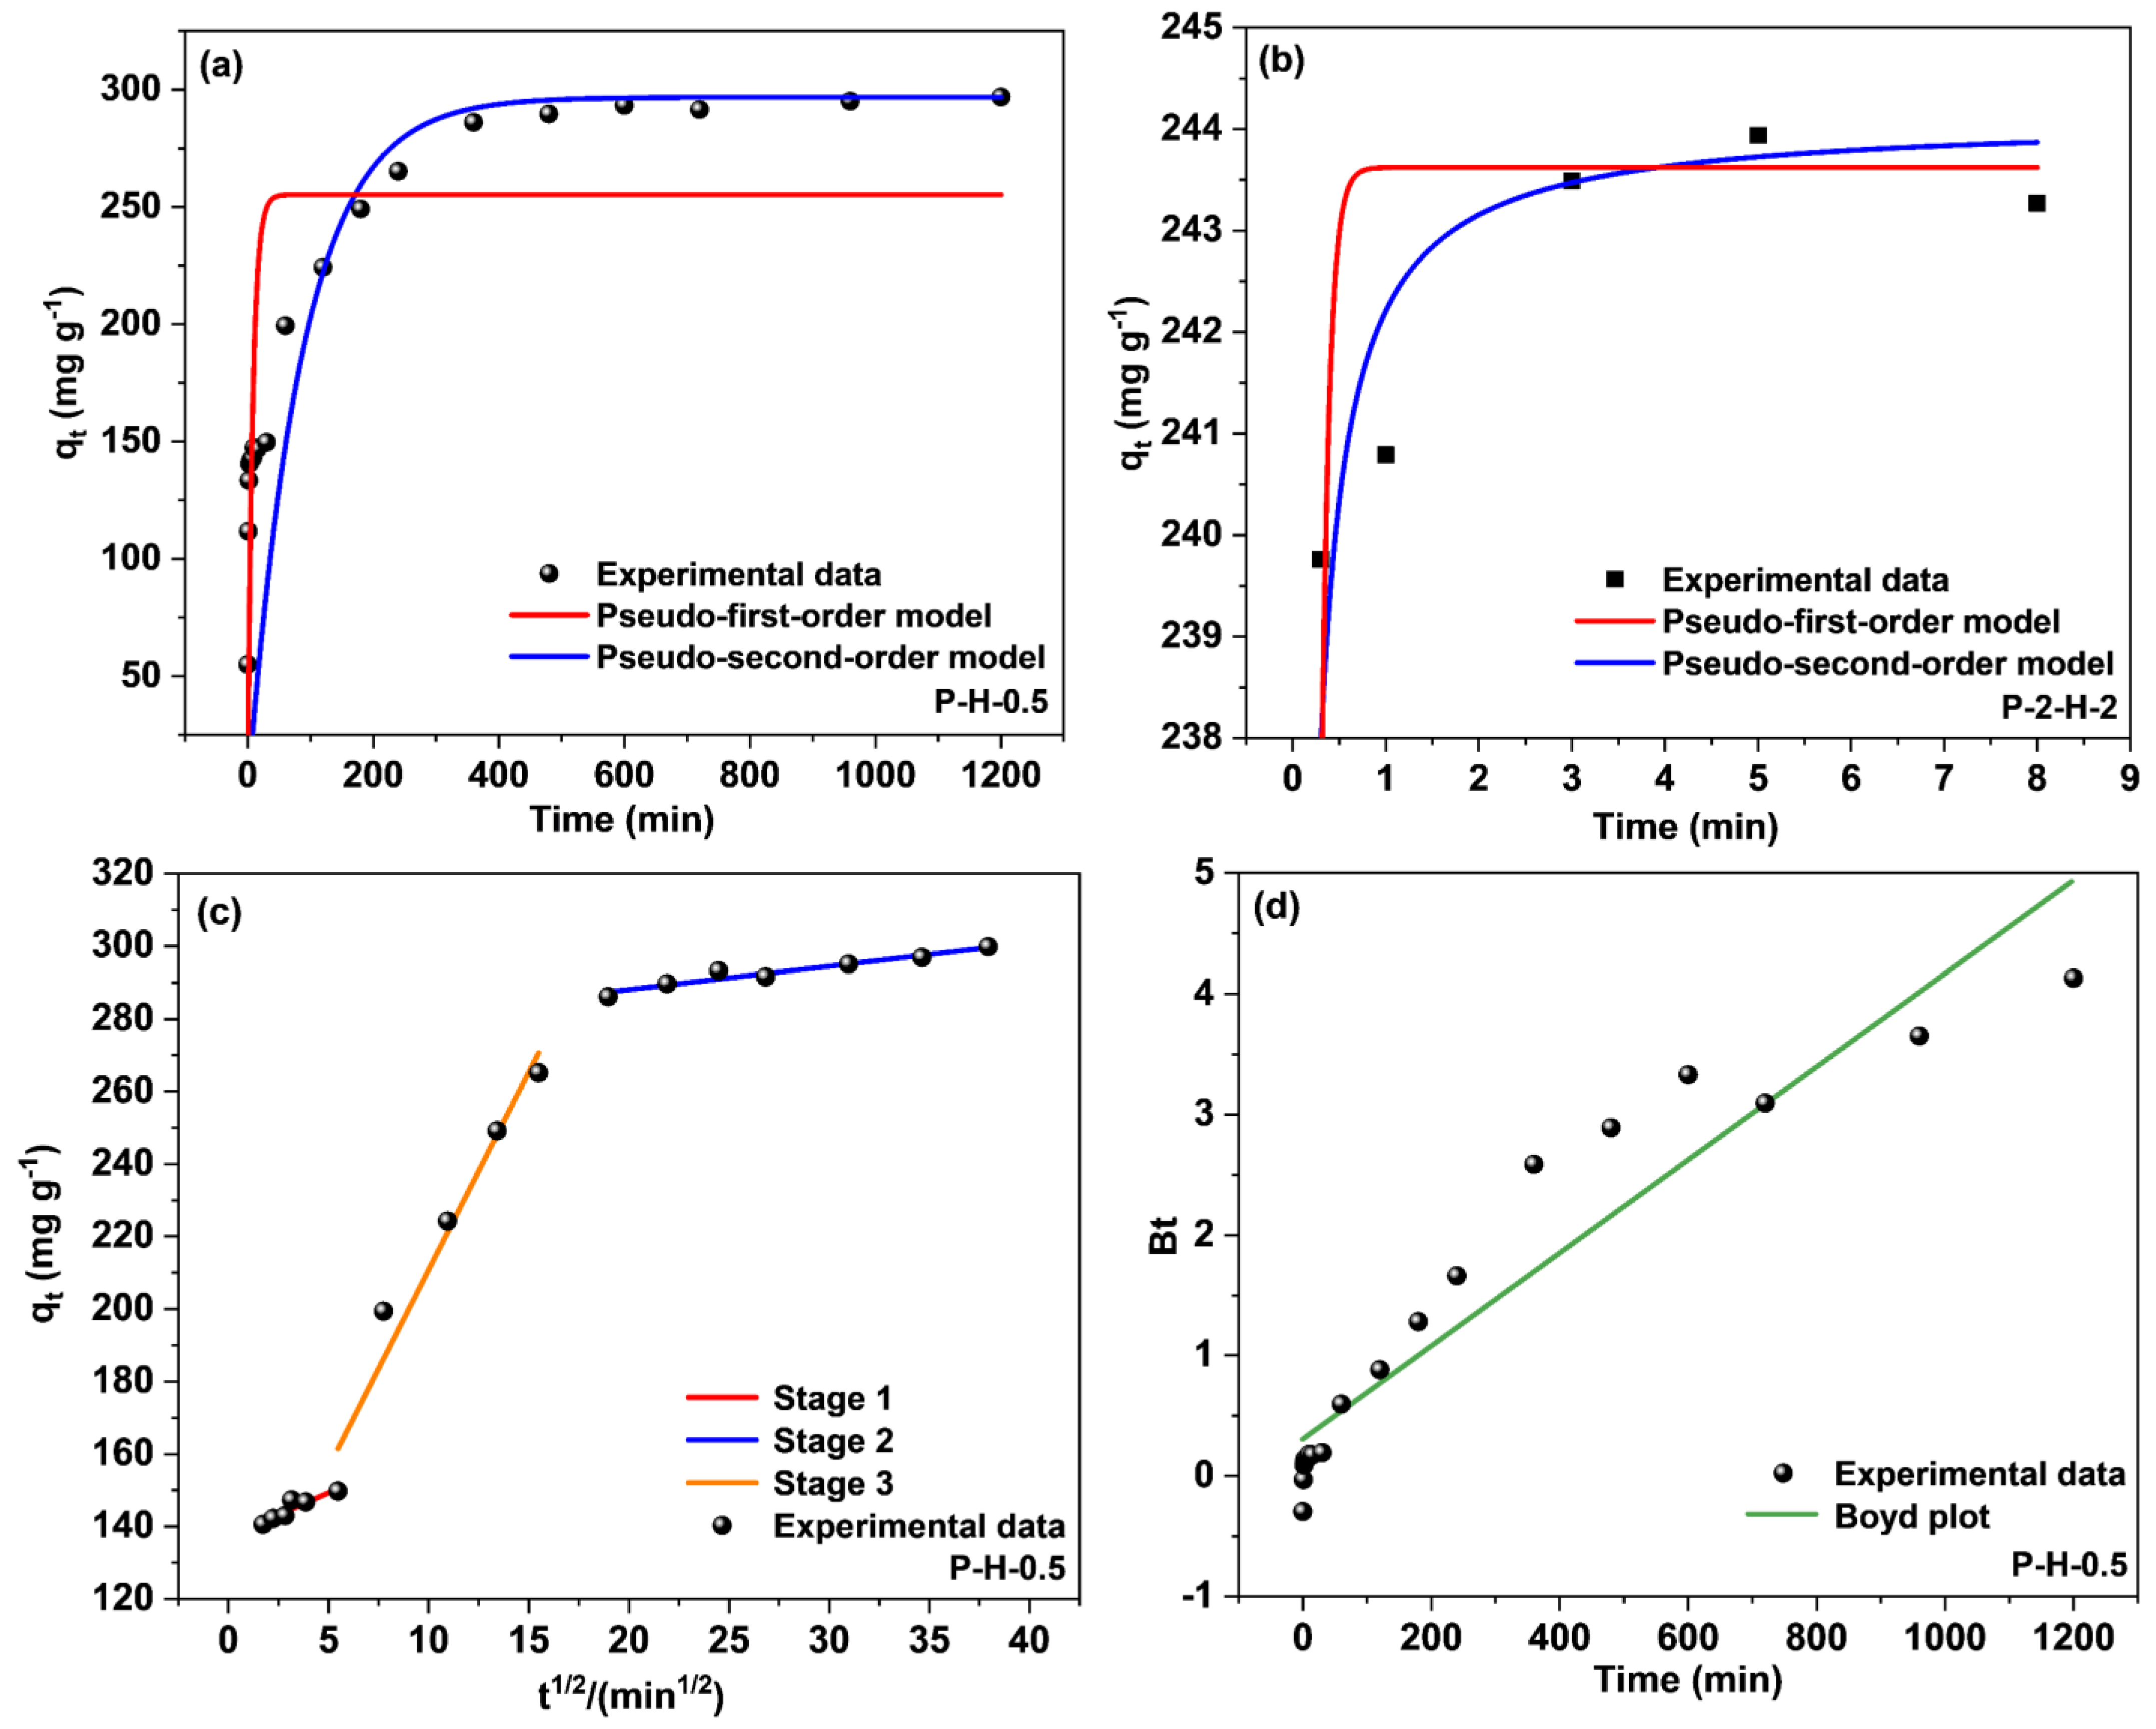
3.3.2. Contact Time Effect and Adsorption Kinetics Analysis

Time is a critical factor in assessing adsorption efficiency, as it reflects the removal performance (Figure 9). The curves for the two materials differ significantly, and the adsorption capacity of P–2–H–2 for MB corresponds to a phased descent after a rapid increase (Figure 9b–d). For P–H–0.5, a short equilibrium at 3–30 min can be seen, revealing the surface adsorption sites are occupied during this stage. However, the well–developed pores of P–H–0.5 are not completely filled, leading to a subsequent rise in adsorption [14]. This phenomenon further demonstrates that P–H–0.5 is a micro–mesoporous composite. After a period of disturbance, the sorption of the two–step sample transformed into a desorption trend, resulting in a decrease in adsorption capacity from a maximum of 246.64 mg·g−1 (2 min) to 209.63 mg·g−1 (24 h). To avoid the effect of the late arrival of adsorption saturation which may be neglected, the experimental time was extended to 48 h and 80 h, and qt both declined (Figure 9b). Initially, the adsorbate rapidly took over the active sites on the surface and reached saturation within 2 min, primarily attributed to the wide pore channels. After 10 min, the adsorption amount started to decrease slowly. Over the next 24 h, the adsorption capacity stabilized again, indicating temporary attachment facilitated by the attractive surface groups. Furthermore, characterization results suggest that P–2–H–2 is less stable due to more depletion of the C skeleton, and has fewer active sites and lack of pore filling, thus demonstrating desorption under prolonged perturbation. Hence, time control is crucial when utilizing fast adsorbents like P–2–H–2 (<24 h).
To further investigate the time effect, the performance of the samples was analyzed using the pseudo–first–order (PFO) and pseudo–second–order (PSO) kinetic models, and the intra–particle diffusion model (Webber–Morris) (Figure 10). The Webber–Morris (W–M) model is not applicable to P–2–H–2, as shown by the irregularity of the data points in Figure S6. P–2–H–2 possesses more surface macropores, exposing the internal pores and accelerating MB transport. Expressions describing the PFO and PSO kinetic models can be found in Equations (S1)–(S3) (Supplementary Material).
Table 2 reveals that the data for both samples tally better with the PSO kinetic model, which suggests that the adsorption of MB by both samples contains chemical effects [10]. The adsorption equilibrium under chemisorption corresponds to adsorption saturation; thus the adsorption on P–2–H–2 reaches saturation in the first 8 min (Figure 10b). Subsequently, desorption of MB on P–2–H–2 is observed and the antilogarithm values of “qeqt” are negative (Supplementary Material), indicating that the sorption does not match relevant kinetic models. Physisorption subsequently dominates, which is the root cause of desorption. Due to the slow desorption rate, the adsorption amount remains high at 24 h. Moreover, the absolute values of k1 and k2 for P–2–H–2 are significantly larger than those of P–H–0.5, corresponding to the fast adsorption of the two–step sample. No significant deviation is observed between the calculated and experimental adsorption amounts of the samples, demonstrating the accuracy of the PSO fit.
The adsorption on P–H–0.5 was divided into three segments (Figure 10c, Table 2) by the intra–particle diffusion model (Equation (S4) in Supplementary Material). Stage 1 stands for the initial phase of adsorption when the adsorbate binds to the biochar surface. The moderate levels of both kp and C indicate limited surface active sites on the material, suggesting that the major part of adsorption may occur in the pores. The second linear part represents the intrapore diffusion, where the dye molecules penetrate the pores and fill the pore space. The highest kp and lowest C values signify the minimum mass–transfer resistance. The final stage denotes the imminent completion of the adsorption as the adsorption rate declines severely owing to the reduction of active sites, the descent of contaminant concentration, and the repulsive effect present on the material surface [55]. Non–zero C values indicate that both surface mass transfer and intrapore diffusion influence the adsorption of MB.
To further clarify the primary and secondary relationship between intra–particle and surface diffusion, the Boyd kinetic model was chosen to analyze the adsorption results (Figure 10d). The equation of the Boyd model [56] can be expressed as Equations (S5) and (S6) (Supplementary Material). The fitting result reveals that the straight line intersects the origin, meaning that intrapore transport is the main mechanism concerning the adsorption of MB by the one–step sample. This finding aligns with the analysis presented in the previous paragraph.

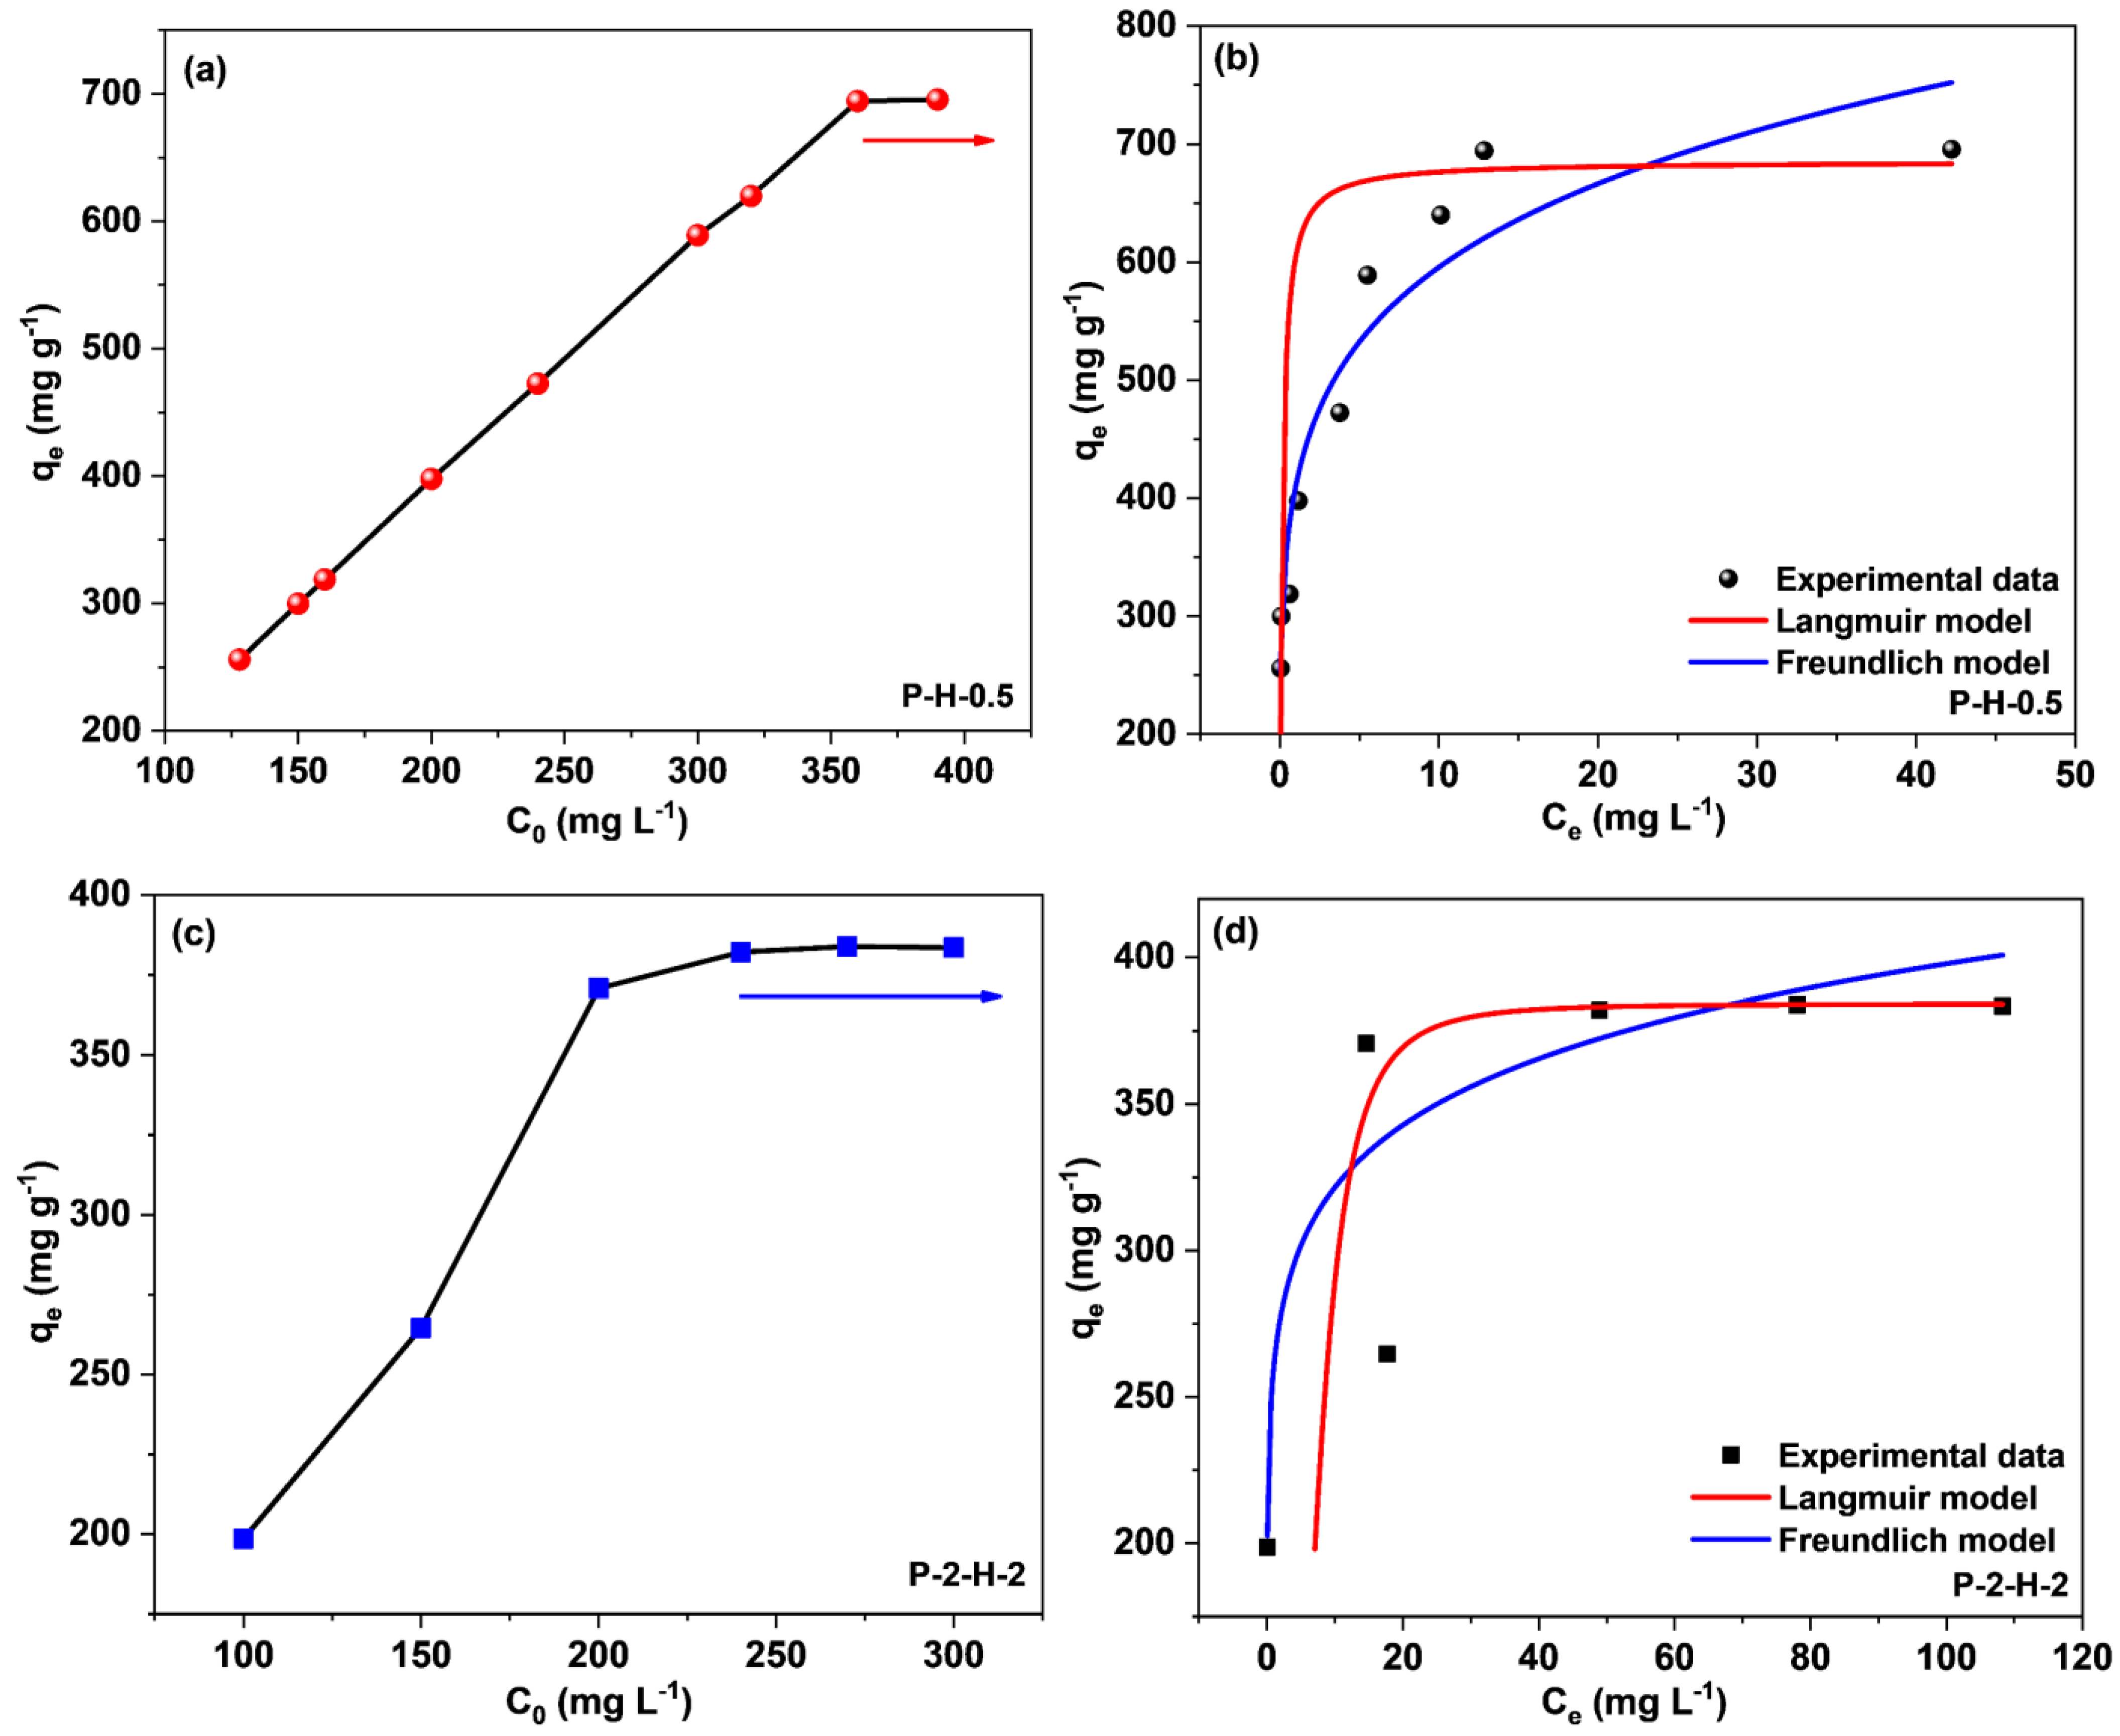
3.3.3. Initial Concentration Effect and Adsorption Isotherms Analysis

The concentration effect on sorption capacity is depicted in Figure 11a,c. When C0 rises to a certain value, qe reaches a plateau as a result of the limited active centers on the biochar surfaces and the strong competition between MB molecules in the system. For P–H–0.5 and P–2–H–2, the corresponding C0 values are 360 mg·L−1 and 200 mg·L−1, respectively, implying a broad range of concentration adaptation for both. The Langmuir (Equations (S7) and (S8)) and Freundlich (Equation (S9)) adsorption isotherm models were utilized to study the subsequent adsorption properties (Supplementary Material).
Both the Langmuir and Freundlich isotherm models match with the sorption data, yet the former fit is obviously better (Figure 11b,d, and Table 3). This means the adsorption by the two samples is relatively uniform and monolayer [54]. The calculated RL values (Supplementary Material) range from 0.00034–0.001 and 0.11–0.26 depending on b and different C0, confirming that both samples are favorable for MB adsorption. For P–H–0.5, the RL approaches 0 with increasing C0, presenting the irreversibility of MB adsorption by the one–step sample [46]. As a comparison, P–2–H–2 has large RL values, which partially explains the desorption behavior. The calculated qmax values for both conform to the experimental results. The fit of the Freundlich isotherm suggests the presence of some non–uniformity in the ACs derived from FP, including the pore structure and surface chemical properties [15]. The non–uniformity of the microstructure may arise from the rapid release of VM and inadequate loading of heteroatoms. The n values are much higher than the results from the literature [7,10,15], showing strong interactions (chemical effects) between both PS–ACs and MB [7]. The kF value of P–H–0.5 is significantly higher, matching its extremely high adsorption capacity [15]. Moreover, the adsorption properties of P–H–0.5 and P–2–H–2, including the preparation conditions, were comprehensively compared with the results in other papers (Table 4). It can be seen that P–2–H–2 exhibits comparable or higher capacity than other investigations while demonstrating the fastest adsorption time (2 min). Briefly, both P–H–0.5 and P–2–H–2 can be considered cost–effective and efficient adsorbents for the treatment of cationic dyes.

3.3.4. Adsorption Thermodynamics

Adsorption thermodynamic studies were performed on two samples at different temperatures (Table 5). With the temperature rise, the adsorption capacities of both samples descend slightly (Figure S7a), reflecting a smaller effect from temperature. Gibbs free energy (ΔG0, kJ·mol−1), enthalpy change (ΔH0, kJ·mol−1), and entropy change (ΔS0, kJ·mol−1·K−1) were provided by Equations (S10)–(S12) [14].
Thermodynamic results are summarized in Table 5 and shown in Figure S7b,c. The values of ΔH0 and ΔS0 are negative for both samples, proving that the adsorption of MB by the samples is exothermic and the orderliness of the system is enhanced. ΔG0 < 0 stands for the spontaneity of adsorption. Meanwhile, for P–2–H–2, the initial adsorption requires more external forces to maintain. It is noted that the absolute value of ΔH0 is bounded by 40 kJ·mol−1, reflecting the fact that MB adsorption by P–H–0.5 and P–2–H–2 is primarily driven by chemisorption and physisorption, respectively [62]. This finding aligns with the previous analysis on sorption reversibility.

3.3.5. Practical Application Strategies of PS–ACs

To ensure the rational use of both types of AC, practical application routes are summarized and improved according to their characteristics (Figure 12). In terms of commonalities, both ACs are suitable for treating weakly acidic or alkaline water (pH > 5) at temperatures that are not excessively high. P–H–0.5, with its high yield, is recommended as the main product for the removal of high dye concentrations (<360 mg·L−1), while P–2–H–2 serves as a by–product of FP and is better suited for medium dye concentrations (<200 mg·L−1). There is a significant disparity in the duration of use between the two. For P–H–0.5, an adsorption time exceeding 4 h ensures optimal product utilization. In contrast, P–2–H–2 can achieve efficient dye removal in a short time of 2 min; yet, the adsorption time should be controlled within 24 h to prevent excessive desorption after prolonged perturbations. Notably, P–2–H–2 shows promise for emergency decontamination scenarios. For fast adsorbents, careful consideration should be given to rationalize the adsorption time. Additionally, it is recommended to pre–position P–2–H–2 in sewage with relatively stronger external perturbation.

3.4. Summary of the Relevant Mechanism

From the material’s structural properties, P–H–0.5 exhibits a high SSA, providing abundant active sites for effective adsorption of MB. It possesses well–developed micro– and mesopores, which effectively accommodate MB molecules, leading to a longer adsorption time primarily driven by internal diffusion and pore filling. Contrastingly, P–2–H–2 offers convenient transport channels for MB by virtue of the wider pores. Therefore, optimal adsorption can be achieved in only 2 min, and the adsorption process can be regarded as dominated by external diffusion. In conclusion, porous adsorbents with small surface pore sizes and developed internal pores tend to irreversibly sequester pollutants, while those with wide pore channels and high functional group content enable rapid adsorption. The two types of products should be used depending on the specific situation.
FTIR and XPS analyses suggest distinct adsorption sites for the two materials. The surface adsorption sites of P–2–H–2 mainly consist of –OH, –COOH, and C–O–P, where acidic P–OH is required for C–O–P [20]. In contrast, P–H–0.5 exhibits a greater variety of P group types, including C–P–O3 and C2–P–O2, suggesting the presence of C defects and P substitution sites. These groups have the capability to form hydrogen bonds with S and N in MB [15]. However, when pH > pHPZC, most –OH tends to deprotonate and convert to –O [10], leading to electrostatic binding with the N center of MB. This shift results in enhanced adsorption, highlighting the dominance of electrostatic attraction. Furthermore, owing to the strong aromaticity of PS–ACs, the benzene ring of MB can also can also undergo π–π stacking with the biochar [7]. Meanwhile, the PS–ACs after adsorption were also analyzed by FTIR and XPS (Figures S8 and S9). The results demonstrate the significance of C–O–P in the adsorption site, partially converting to C3–P–O. In contrast, the change in P functional groups is less noticeable in P–2–H–2. The characteristic peaks near 1398 cm−1 in the FTIR spectra correspond to the C–N bending, revealing the binding of MB to the C skeleton [63]. The XPS deconvolution data after adsorption can be found in Table S7.
Combined with the Langmuir model analysis, unlike P–H–0.5, the adsorption process of MB on P–2–H–2 is relatively reversible (0.11 < RL < 0.26). The PSO kinetic calculation reveals that the adsorption of MB on the two–step sample presents chemisorption in the initial 8–10 min. Moreover, the acid etching based on PC–2 (strong pore–enlarging effect) leads to a reduction in the strength of the C skeleton. This, combined with the irregular pore structure of P–2–H–2 as indicated by ultimate analysis and N2 isotherms, contributes to its higher instability compared to P–H–0.5. These factors collectively explain the slow desorption of MB. The corresponding mechanism of MB on P–H–0.5 and P–2–H–2 is provided in Figure 13.

3.5. Reusability

The spent ACs obtained after adsorption were washed multiple times with anhydrous ethanol and deionized water until complete desorption of MB. The regeneration results of the PS–ACs subjected to four cycles of adsorption and desorption experiments were presented in Figure 14. Both ACs exhibit great regenerative potential, with the removal rate of liquid–phase MB by P–2–H–2 decreasing from 82.21% to 76.99%, indicating superior durability. This might be attributed to the retention of target functional groups and the sorption reversibility of P–2–H–2.

4. Conclusions

In this study, two PS–ACs with excellent MB adsorption performance were prepared by one– and two–step FP with H3PO4 activation. P–H–0.5, obtained in a single step, showed a high yield of 41.83% due to extensive structural cross–linking. Both ACs exhibited multistage pore structures, primarily composed of mesopores. P–H–0.5 had impressive SSA (1004 m2·g−1) and pore volume (0.659 cm3·g−1). P–2–H–2, with larger pore sizes (4.95 nm) and more macropores due to H3PO4′s pore–enlarging effect, facilitated fast contaminant transport. P–H–0.5 demonstrated a high MB adsorption capacity of 695.54 mg·g−1 with a removal rate of 99.94% (C0 = 150 mg·L−1), while P–2–H–2 achieved a rapid saturation adsorption capacity of 383.91 mg·g−1 in only 2 min, the fastest among the adsorbents. Adsorption of MB on both ACs followed PSO kinetics and the Langmuir isotherm model. The W–M model suggested that the adsorption by the two depended mainly on intrapore transport and surface mass transfer, respectively. The adsorption sites differed between in situ and ex situ activated PS–ACs. In addition to –OH, –COOH, and C–O–P, C–P–O3 with C2–P–O2 was detected on the surface of P–H–0.5, which were not observed on P–2–H–2. The basic interactions between PS–ACs and MB were π–π stacking and hydrogen bonding. The adsorption capacities significantly increased at pH > 5, highlighting the dominant role of electrostatic attraction. Both PS–ACs exhibited excellent durability, with removal rates remaining high (>90% of the original) after four adsorption–desorption cycles. The above work is expected to guide the design and application of high–performance activated biochar from FP in the future.

Supplementary Materials

The following supporting information can be downloaded at: https://www.mdpi.com/article/10.3390/en16145363/s1, Figure S1. The experimental setup used for pyrolysis and activation of the Acs; Figure S2. The relationship between MB concentration and absorbance under 665 nm; Figure S3. Contact angles of (a) P–H–0.5 and (b) P–2–H–2; Figure S4. The N2 adsorption–desorption isotherms and pore size distribution (insets) of (a) P–H–0.5–S and (b) P–2–H–2–S; Figure S5. EDS–mapping image of P–H–0.5; Figure S6. (a) The scatter plot of the W–M model and (b) Boyd curve, corresponding to P–2–H–2; Figure S7. (a) Effect of temperature on adsorption capacity, and (b), (c) the fitting results of thermodynamic data; Figure S8. FTIR spectra of PS–ACs after MB adsorption; Figure S9. XPS spectra of (a) C1s, (b) O1s, and (c) P2p of P–2–H–2–MB and P–H–0.5–MB; Table S1. The adsorption capacity of AC under different H3PO4 impregnation ratios and activation temperatures; Table S2. The yield of each step during sample preparation and the adsorption capacity of each AC at the initial MB concentration of 150 mg·L−1; Table S3. Comparison of yields of ACs obtained by different methods; Table S4. The results of ultimate analysis; Table S5. The P content detected by ICP–OES in each sample; Table S6. Deconvolution results of XPS spectra of P–H–0.5 and P–2–H–2; Table S7. Deconvolution results of XPS spectra of P–H–0.5–MB and P–2–H–2–MB.

Author Contributions

C.S.: conceptualization, methodology, investigation, data curation, formal analysis, writing—original draft. Z.L.: funding acquisition, supervision, validation, resources. P.Y.: methodology, investigation, writing—review and editing. Q.W.: funding acquisition, resources. All authors have read and agreed to the published version of the manuscript.

Funding

This work was supported by the Fundamental Research Funds for the Central Universities [2022ZFJH004].

Data Availability Statement

All of the data are included in the text and supplementary material.

Acknowledgments

The authors gratefully acknowledge financial support from the Fundamental Research Funds for the Central Universities [2022ZFJH004].

Conflicts of Interest

There is no competing interest that might influence this work.

References

  1. Hekmatnia, M.; Ardakani, A.F.; Isanezhad, A.; Monibi, H. A Novel Classification of Virtual Water Trade for the Sustainability of Global Freshwater Resources; Springer: Dordrecht, The Netherlands, 2023; ISBN 0123456789. [Google Scholar]
  2. Tkaczyk, A.; Mitrowska, K.; Posyniak, A. Synthetic Organic Dyes as Contaminants of the Aquatic Environment and Their Implications for Ecosystems: A Review. Sci. Total Environ. 2020, 717, 137222. [Google Scholar] [CrossRef] [PubMed]
  3. Rao, H.; Qi, W.; Su, R.; He, Z.; Peng, X. Mechanistic and Conformational Studies on the Interaction of Human Serum Albumin with Rhodamine B by NMR, Spectroscopic and Molecular Modeling Methods. J. Mol. Liq. 2020, 316, 113889. [Google Scholar] [CrossRef]
  4. Tran, T.H.; Le, A.H.; Pham, T.H.; Nguyen, D.T.; Chang, S.W.; Chung, W.J.; Nguyen, D.D. Adsorption Isotherms and Kinetic Modeling of Methylene Blue Dye onto a Carbonaceous Hydrochar Adsorbent Derived from Coffee Husk Waste. Sci. Total Environ. 2020, 725, 138325. [Google Scholar] [CrossRef] [PubMed]
  5. Caicedo, D.F.; Dos Reis, G.S.; Lima, E.C.; De Brum, I.A.S.; Thue, P.S.; Cazacliu, B.G.; Lima, D.R.; Dos Santos, A.H.; Dotto, G.L. Efficient Adsorbent Based on Construction and Demolition Wastes Functionalized with 3-Aminopropyltriethoxysilane (APTES) for the Removal Ciprofloxacin from Hospital Synthetic Effluents. J. Environ. Chem. Eng. 2020, 8, 103875. [Google Scholar] [CrossRef]
  6. Cheng, L.; Ji, Y.; Liu, X.; Mu, L.; Zhu, J. Sorption Mechanism of Organic Dyes on a Novel Self–Nitrogen–Doped Porous Graphite Biochar: Coupling DFT Calculations with Experiments. Chem. Eng. Sci. 2021, 242, 116739. [Google Scholar] [CrossRef]
  7. Sahu, S.; Pahi, S.; Tripathy, S.; Singh, S.K.; Behera, A.; Sahu, U.K.; Patel, R.K. Adsorption of Methylene Blue on Chemically Modified Lychee Seed Biochar: Dynamic, Equilibrium, and Thermodynamic Study. J. Mol. Liq. 2020, 315, 113743. [Google Scholar] [CrossRef]
  8. Wang, X.; Bayan, M.R.; Yu, M.; Ludlow, D.K.; Liang, X. Atomic Layer Deposition Surface Functionalized Biochar for Adsorption of Organic Pollutants: Improved Hydrophilia and Adsorption Capacity. Int. J. Environ. Sci. Technol. 2017, 14, 1825–1834. [Google Scholar] [CrossRef]
  9. Xiang, J.; Luo, B.X.; Li, J.M.; Mi, Y.; Tian, B.; Gong, S.J.; Zhou, Y.R.; Ma, T.W. Development of KOH and H3PO4–Modified Composite Biochar from Corn Straw and Activated Sludge for Removing Methylene Blue. Int. J. Environ. Sci. Technol. 2022, 20, 1673–1688. [Google Scholar] [CrossRef]
  10. Liu, X.; He, C.; Yu, X.; Bai, Y.; Ye, L.; Wang, B.; Zhang, L. Net–like Porous Activated Carbon Materials from Shrimp Shell by Solution–Processed Carbonization and H3PO4 Activation for Methylene Blue Adsorption. Powder Technol. 2018, 326, 181–189. [Google Scholar] [CrossRef]
  11. Dai, L.; Zhu, W.; He, L.; Tan, F.; Zhu, N.; Zhou, Q.; He, M.; Hu, G. Calcium–Rich Biochar from Crab Shell: An Unexpected Super Adsorbent for Dye Removal. Bioresour. Technol. 2018, 267, 510–516. [Google Scholar] [CrossRef]
  12. Zazycki, M.A.; Borba, P.A.; Silva, R.N.F.; Peres, E.C.; Perondi, D.; Collazzo, G.C.; Dotto, G.L. Chitin Derived Biochar as an Alternative Adsorbent to Treat Colored Effluents Containing Methyl Violet Dye. Adv. Powder Technol. 2019, 30, 1494–1503. [Google Scholar] [CrossRef]
  13. Mahdi, Z.; El Hanandeh, A.; Yu, Q. Influence of Pyrolysis Conditions on Surface Characteristics and Methylene Blue Adsorption of Biochar Derived from Date Seed Biomass. Waste Biomass Valorization 2017, 8, 2061–2073. [Google Scholar] [CrossRef]
  14. Han, Q.; Wang, J.; Goodman, B.A.; Xie, J.; Liu, Z. High Adsorption of Methylene Blue by Activated Carbon Prepared from Phosphoric Acid Treated Eucalyptus Residue. Powder Technol. 2020, 366, 239–248. [Google Scholar] [CrossRef]
  15. Zheng, Y.; Wang, J.; Li, D.; Liu, C.; Lu, Y.; Lin, X.; Zheng, Z. Insight into the KOH/KMnO4 Activation Mechanism of Oxygen–Enriched Hierarchical Porous Biochar Derived from Biomass Waste by in–Situ Pyrolysis for Methylene Blue Enhanced Adsorption. J. Anal. Appl. Pyrolysis 2021, 158, 105269. [Google Scholar] [CrossRef]
  16. Viswanathan, S.P.; Njazhakunnathu, G.V.; Neelamury, S.P.; Padmakumar, B.; Ambatt, T.P. The Efficiency of Aquatic Weed–Derived Biochar in Enhanced Removal of Cationic Dyes from Aqueous Medium. Biomass Convers. Biorefinery 2022. [Google Scholar] [CrossRef]
  17. Hmid, A.; Mondelli, D.; Fiore, S.; Fanizzi, F.P.; Al Chami, Z.; Dumontet, S. Production and Characterization of Biochar from Three–Phase Olive Mill Waste through Slow Pyrolysis. Biomass Bioenergy 2014, 71, 330–339. [Google Scholar] [CrossRef]
  18. Bridgwater, A.V. Review of Fast Pyrolysis of Biomass and Product Upgrading. Biomass Bioenergy 2012, 38, 68–94. [Google Scholar] [CrossRef]
  19. Wang, Z.; Wu, J.; He, T.; Wu, J. Corn Stalks Char from Fast Pyrolysis as Precursor Material for Preparation of Activated Carbon in Fluidized Bed Reactor. Bioresour. Technol. 2014, 167, 551–554. [Google Scholar] [CrossRef]
  20. Zhou, X.; Liu, X.; Qi, F.; Shi, H.; Zhang, Y.; Ma, P. Efficient Preparation of P–doped Carbon with Ultra–High Mesoporous Ratio from Furfural Residue for Dye Removal. Sep. Purif. Technol. 2022, 292, 120954. [Google Scholar] [CrossRef]
  21. Fu, Y.; Shen, Y.; Zhang, Z.; Ge, X.; Chen, M. Activated Bio–Chars Derived from Rice Husk via One– and Two–Step KOH–Catalyzed Pyrolysis for Phenol Adsorption. Sci. Total Environ. 2019, 646, 1567–1577. [Google Scholar] [CrossRef]
  22. Gupta, V.K.; Pathania, D.; Sharma, S.; Singh, P. Preparation of Bio–Based Porous Carbon by Microwave Assisted Phosphoric Acid Activation and Its Use for Adsorption of Cr(VI). J. Colloid Interface Sci. 2013, 401, 125–132. [Google Scholar] [CrossRef]
  23. Abu El-Rub, Z.; Bramer, E.A.; Brem, G. Experimental Comparison of Biomass Chars with Other Catalysts for Tar Reduction. Fuel 2008, 87, 2243–2252. [Google Scholar] [CrossRef]
  24. Inguanzo, M.; Menéndez, J.A.; Fuente, E.; Pis, J.J. Reactivity of Pyrolyzed Sewage Sludge in Air and CO2. J. Anal. Appl. Pyrolysis 2001, 58–59, 943–954. [Google Scholar] [CrossRef]
  25. Tezcan Un, U.; Ates, F. Low-Cost Adsorbent Prepared from Poplar Sawdust for Removal of Disperse Orange 30 Dye from Aqueous Solutions. Int. J. Environ. Sci. Technol. 2019, 16, 899–908. [Google Scholar] [CrossRef]
  26. Li, Y.; Zhang, X.; Yang, R.; Li, G.; Hu, C. The Role of H3PO4 in the Preparation of Activated Carbon from NaOH–Treated Rice Husk Residue. RSC Adv. 2015, 5, 32626–32636. [Google Scholar] [CrossRef]
  27. Crombie, K.; Mašek, O. Pyrolysis Biochar Systems, Balance between Bioenergy and Carbon Sequestration. GCB Bioenergy 2015, 7, 349–361. [Google Scholar] [CrossRef] [Green Version]
  28. Chen, D.; Li, Y.; Cen, K.; Luo, M.; Li, H.; Lu, B. Pyrolysis Polygeneration of Poplar Wood: Effect of Heating Rate and Pyrolysis Temperature. Bioresour. Technol. 2016, 218, 780–788. [Google Scholar] [CrossRef] [PubMed]
  29. Kim, K.H.; Eom, I.Y.; Lee, S.M.; Choi, D.; Yeo, H.; Choi, I.G.; Choi, J.W. Investigation of Physicochemical Properties of Biooils Produced from Yellow Poplar Wood (Liriodendron tulipifera) at Various Temperatures and Residence Times. J. Anal. Appl. Pyrolysis 2011, 92, 2–9. [Google Scholar] [CrossRef]
  30. Prahas, D.; Kartika, Y.; Indraswati, N.; Ismadji, S. Activated Carbon from Jackfruit Peel Waste by H3PO4 Chemical Activation: Pore Structure and Surface Chemistry Characterization. Chem. Eng. J. 2008, 140, 32–42. [Google Scholar] [CrossRef]
  31. Jagtoyen, M.; Derbyshire, F. Activated Carbons from Yellow Poplar and White Oak by H3PO4 Activation. Carbon 1998, 36, 1085–1097. [Google Scholar] [CrossRef]
  32. Ahmed, M.J.; Theydan, S.K. Optimization of Microwave Preparation Conditions for Activated Carbon from Albizia Lebbeck Seed Pods for Methylene Blue Dye Adsorption. J. Anal. Appl. Pyrolysis 2014, 105, 199–208. [Google Scholar] [CrossRef]
  33. Deng, H.; Yang, L.; Tao, G.; Dai, J. Preparation and Characterization of Activated Carbon from Cotton Stalk by Microwave Assisted Chemical Activation−Application in Methylene Blue Adsorption from Aqueous Solution. J. Hazard. Mater. 2009, 166, 1514–1521. [Google Scholar] [CrossRef]
  34. Dural, M.U.; Cavas, L.; Papageorgiou, S.K.; Katsaros, F.K. Methylene Blue Adsorption on Activated Carbon Prepared from Posidonia oceanica (L.) Dead Leaves: Kinetics and Equilibrium Studies. Chem. Eng. J. 2011, 168, 77–85. [Google Scholar] [CrossRef]
  35. Pezoti, O.; Cazetta, A.L.; Souza, I.P.A.F.; Bedin, K.C.; Martins, A.C.; Silva, T.L.; Almeida, V.C. Adsorption Studies of Methylene Blue onto ZnCl2–Activated Carbon Produced from Buriti Shells (Mauritia flexuosa L.). J. Ind. Eng. Chem. 2014, 20, 4401–4407. [Google Scholar] [CrossRef]
  36. Wu, M.; Guo, Q.; Fu, G. Preparation and Characteristics of Medicinal Activated Carbon Powders by CO2 Activation of Peanut Shells. Powder Technol. 2013, 247, 188–196. [Google Scholar] [CrossRef]
  37. Zhang, H.; Liao, W.; Zhou, X.; Shao, J.; Chen, Y.; Zhang, S.; Chen, H. Coeffect of Pyrolysis Temperature and Potassium Phosphate Impregnation on Characteristics, Stability, and Adsorption Mechanism of Phosphorus–Enriched Biochar. Bioresour. Technol. 2022, 344, 126273. [Google Scholar] [CrossRef]
  38. Spokas, K.A. Review of the Stability of Biochar in Soils: Predictability of O:C Molar Ratios. Carbon Manag. 2010, 1, 289–303. [Google Scholar] [CrossRef] [Green Version]
  39. Kaouah, F.; Boumaza, S.; Berrama, T.; Trari, M.; Bendjama, Z. Preparation and Characterization of Activated Carbon from Wild Olive Cores (Oleaster) by H3PO4 for the Removal of Basic Red 46. J. Clean. Prod. 2013, 54, 296–306. [Google Scholar] [CrossRef]
  40. Qin, Q.; Xu, Y. Enhanced Nitrobenzene Adsorption in Aqueous Solution by Surface Silylated MCM-41. Microporous Mesoporous Mater. 2016, 232, 143–150. [Google Scholar] [CrossRef]
  41. Li, H.Z.; Zhang, Y.N.; Guo, J.Z.; Lv, J.Q.; Huan, W.W.; Li, B. Preparation of Hydrochar with High Adsorption Performance for Methylene Blue by Co-Hydrothermal Carbonization of Polyvinyl Chloride and Bamboo. Bioresour. Technol. 2021, 337, 125442. [Google Scholar] [CrossRef]
  42. Zuo, S.; Liu, J.; Yang, J.; Cai, X. Effects of the Crystallinity of Lignocellulosic Material on the Porosity of Phosphoric Acid–Activated Carbon. Carbon 2009, 47, 3578–3580. [Google Scholar] [CrossRef]
  43. Yang, T.; Lua, A.C. Textural and Chemical Properties of Zinc Chloride Activated Carbons Prepared from Pistachio–Nut Shells. Mater. Chem. Phys. 2006, 100, 438–444. [Google Scholar] [CrossRef]
  44. Yang, Z.; Gleisner, R.; Mann, D.H.; Xu, J.; Jiang, J.; Zhu, J.Y. Lignin Based Activated Carbon Using H3PO4 Activation. Polymers 2020, 12, 2829. [Google Scholar] [CrossRef]
  45. Zulfiqar, M.; Rabat, N.E.; Bahadar, A.; Lashari, N.; Mahnashi, M.H.; Alqarni, A.O. Development of Elaeis Guineensis/Polyvinyl Alcohol/Carbon Nanotube Composites for Efficient Adsorption of Dye: Experimental and Theoretical Approach. Int. J. Environ. Sci. Technol. 2022, 19, 6499–6520. [Google Scholar] [CrossRef]
  46. Bernardino, C.A.R.; Mahler, C.F.; Veloso, M.C.C.; Romeiro, G.A. Preparation of Biochar from Sugarcane By-Product Filter Mud by Slow Pyrolysis and Its Use Like Adsorbent. Waste Biomass Valorization 2017, 8, 2511–2521. [Google Scholar] [CrossRef]
  47. Puziy, A.M.; Poddubnaya, O.I.; Martínez-Alonso, A.; Suárez-García, F.; Tascón, J.M.D. Surface Chemistry of Phosphorus–Containing Carbons of Lignocellulosic Origin. Carbon 2005, 43, 2857–2868. [Google Scholar] [CrossRef]
  48. Tran, T.H.; Le, H.H.; Pham, T.H.; Nguyen, D.T.; La, D.D.; Chang, S.W.; Lee, S.M.; Chung, W.J.; Nguyen, D.D. Comparative Study on Methylene Blue Adsorption Behavior of Coffee Husk–Derived Activated Carbon Materials Prepared Using Hydrothermal and Soaking Methods. J. Environ. Chem. Eng. 2021, 9, 105362. [Google Scholar] [CrossRef]
  49. Guo, Z.; Zhang, J.; Liu, H. Ultra–High Rhodamine B Adsorption Capacities from an Aqueous Solution by Activated Carbon Derived from: Phragmites Australis Doped with Organic Acid by Phosphoric Acid Activation. RSC Adv. 2016, 6, 40818–40827. [Google Scholar] [CrossRef]
  50. Puziy, A.M.; Poddubnaya, O.I.; Socha, R.P.; Gurgul, J.; Wisniewski, M. XPS and NMR Studies of Phosphoric Acid Activated Carbons. Carbon 2008, 46, 2113–2123. [Google Scholar] [CrossRef]
  51. Ye, X.N.; Lu, Q.; Wang, X.; Guo, H.Q.; Cui, M.S.; Dong, C.Q.; Yang, Y.P. Catalytic Fast Pyrolysis of Cellulose and Biomass to Selectively Produce Levoglucosenone Using Activated Carbon Catalyst. ACS Sustain. Chem. Eng. 2017, 5, 10815–10825. [Google Scholar] [CrossRef]
  52. Ma, J.; Shen, Y.; Shen, C.; Wen, Y.; Liu, W. Al–Doping Chitosan–Fe(III) Hydrogel for the Removal of Fluoride from Aqueous Solutions. Chem. Eng. J. 2014, 248, 98–106. [Google Scholar] [CrossRef]
  53. Zhou, Y.; Sun, L.; Wang, H.; Liang, W.; Yang, J.; Wang, L.; Shuang, S. Investigation on the Uptake and Release Ability of β–Cyclodextrin Functionalized Fe3O4 Magnetic Nanoparticles by Methylene Blue. Mater. Chem. Phys. 2016, 170, 83–89. [Google Scholar] [CrossRef]
  54. Lomenech, C.; Hurel, C.; Messina, L.; Schembri, M.; Tosi, P.; Orange, F.; Georgi, F.; Mija, A.; Kuzhir, P. A Humins–Derived Magnetic Biochar for Water Purification by Adsorption and Magnetic Separation. Waste Biomass Valorization 2021, 12, 6497–6512. [Google Scholar] [CrossRef]
  55. Basha, S.; Murthy, Z.V.P.; Jha, B. Sorption of Hg(II) onto Carica Papaya: Experimental Studies and Design of Batch Sorber. Chem. Eng. J. 2009, 147, 226–234. [Google Scholar] [CrossRef]
  56. Kumar, K.V.; Ramamurthi, V.; Sivanesan, S. Modeling the Mechanism Involved during the Sorption of Methylene Blue onto Fly Ash. J. Colloid Interface Sci. 2005, 284, 14–21. [Google Scholar] [CrossRef]
  57. Wang, Y.; Zhang, Y.; Li, S.; Zhong, W.; Wei, W. Enhanced Methylene Blue Adsorption onto Activated Reed–Derived Biochar by Tannic Acid. J. Mol. Liq. 2018, 268, 658–666. [Google Scholar] [CrossRef]
  58. Rashid, J.; Tehreem, F.; Rehman, A.; Kumar, R. Synthesis Using Natural Functionalization of Activated Carbon from Pumpkin Peels for Decolourization of Aqueous Methylene Blue. Sci. Total Environ. 2019, 671, 369–376. [Google Scholar] [CrossRef]
  59. Boukhemkhem, A.; Rida, K. Improvement Adsorption Capacity of Methylene Blue onto Modified Tamazert Kaolin. Adsorpt. Sci. Technol. 2017, 35, 753–773. [Google Scholar] [CrossRef] [Green Version]
  60. Koyuncu, H.; Kul, A.R. Biosorption Study for Removal of Methylene Blue Dye from Aqueous Solution Using a Novel Activated Carbon Obtained from Nonliving Lichen (Pseudevernia furfuracea (L.) Zopf.). Surf. Interfaces 2020, 19, 100527. [Google Scholar] [CrossRef]
  61. Lian, F.; Cui, G.; Liu, Z.; Duo, L.; Zhang, G.; Xing, B. One–Step Synthesis of a Novel N–Doped Microporous Biochar Derived from Crop Straws with High Dye Adsorption Capacity. J. Environ. Manag. 2016, 176, 61–68. [Google Scholar] [CrossRef] [Green Version]
  62. Doǧan, M.; Alkan, M.; Demirbaş, Ö.; Özdemir, Y.; Özmetin, C. Adsorption Kinetics of Maxilon Blue GRL onto Sepiolite from Aqueous Solutions. Chem. Eng. J. 2006, 124, 89–101. [Google Scholar] [CrossRef]
  63. Yu, P.; Luo, Z.; Wang, Q.; Fang, M.; Zhou, J.; Wang, W.; Liang, X.; Cai, W. Activated Carbon–Based CO2uptake Evaluation at Different Temperatures: The Correlation Analysis and Coupling Effects of the Preparation Conditions. J. CO2 Util. 2020, 40, 101214. [Google Scholar] [CrossRef]
Figure 1. Research routes and comparison of preparation processes for PS–ACs.
Energies 16 05363 g001
Figure 2. The results of proximate analysis.
Energies 16 05363 g002
Figure 3. SEM images of (a) PS, (b) P–H–0.5, (c) PC–2, and (d) P–2–H–2.
Energies 16 05363 g003
Figure 4. The N2 adsorption–desorption isotherms and pore size distribution (insets) of (a) P–H–0.5, (b) P–2–H–2, and (c) PC–2.
Energies 16 05363 g004
Figure 5. Spectra of (a) XRD and (b) FTIR.
Energies 16 05363 g005
Figure 6. (a) XPS spectra of two samples and high–resolution spectra of their (b) C1s, (c) O1s, and (d) P2p regions.
Energies 16 05363 g006
Figure 7. Adsorption active sites of (a) P–H–0.5 and (b) P–2–H–2.
Energies 16 05363 g007
Figure 8. The point of zero charge (pHpzc) (insets) of (a) P–H–0.5 and (b) P–2–H–2; the effect of pH on adsorption amount.
Energies 16 05363 g008
Figure 9. Contact time effect on the adsorption of MB for (a) P–H–0.5 and (bd) P–2–H–2.
Energies 16 05363 g009
Figure 10. Fitting curves of PFO kinetic and PSO kinetic models for (a) P–H–0.5 and (b) P–2–H–2; (c) intra–particle diffusion and (d) Boyd model for P–H–0.5.
Energies 16 05363 g010
Figure 11. (a,c) Effect of initial MB concentration and fitting curves of Langmuir and Freundlich models for (b) P–H–0.5 and (d) P–2–H–2.
Energies 16 05363 g011
Figure 12. Potential practical application strategies for PS–ACs.
Energies 16 05363 g012
Figure 13. Mechanism of MB–related behavior on P–H–0.5 and P–2–H–2.
Energies 16 05363 g013
Figure 14. The adsorption/desorption cycles for MB on (a) P–H–0.5 and (b) P–2–H–2.
Energies 16 05363 g014
Table 1. The pore structure characterization results of 5 samples.
SampleSSA a (m2·g−1)VTotal b (cm3·g−1)VMicro c (cm3·g−1)D1 d (nm)D2 e (nm)
P–H–0.51004.150.660.112.633.04
P–2–H–23.654.5 × 10−31.6 × 10−44.9510.29
P–H–0.5–S927.750.620.122.683.42
P–2–H–2–S2.442.5 × 10−39.1 × 10−44.1423.93
PC–2194.460.117.3 × 10−22.343.75
a BET surface area. b Total pore volume. c Micropore volume. d Average pore diameter. e Average pore diameter of mesopores.
Table 2. PFO and PSO kinetics and intra–particle diffusion parameters and results.
SampleParametersPFOPSOParametersIntra–Particle Diffusion
Stage 1Stage 2Stage 3
P–H–0.5qe, cal (mg g−1) a254.09298.81C (mg g−1)137.04101.75275.23
k1 (min−1) or k2 (g mg−1 min−1)0.131.61 × 10−3kp (mg g−1 min−1/2)2.4610.910.64
R20.56980.9698R20.8230.94310.9192
P–2–H–2qe, cal (mg g−1)243.63243.75
k1 (min−1) or k2 (g mg−1 min−1)13.810.69
R20.41760.9391
a Calculated value of qe.
Table 3. Adsorption isotherm parameters and results.
SampleParametersLangmuirParametersFreundlich
P–H–0.5qm (mg g−1) a685.43n6.18
b (L mg−1)7.47kF (L g−1)410.29
R20.9087R20.8368
P–2–H–2qm (mg g−1)384.25n10.76
b (L mg−1)0.028kF (L g−1)252.75
R20.9569R20.7758
a qmax: Maximum monolayer adsorption capacity.
Table 4. Comprehensive comparison of MB adsorption performance of the adsorbents prepared under various conditions.
FeedstockPreparation MethodActivating ReagentPyrolysis/Activation Temperature (K)Residence Time (min)Adsorption Capacity (mg·g–1)Adsorption Time (min)Reference
PSOne–stepH3PO472330695.54240This study
PSTwo–stepH3PO4823 + 723120 + 120383.912This study
ReedsTwo–stepHNO3773 + 298120 + 72048.8720[57]
Pumpkin peelsOne–step5236080.830[58]
Tamazert kaolinThree–stepAir + HCl + NaOH1073 + 353 + 353300 + 420 + 4201115[59]
Lychee seedTwo–stepKOH973 + Microwave activation (600 W)10124.5120[7]
Cotton stalkOne–stepZnCl2Microwave activation (560 W)9193.5120[33]
Peanut shellTwo–stepCO2773 + 117360 + 300225.8180[36]
LichenOne–stepZnCl2104160243.9<70[60]
Buriti fruitsTwo–stepZnCl2 + CO2773 + 973120 + 90274.680[35]
Posidonia oceanicaOne–stepZnCl2773120285.760[34]
Albizia lebbeck seed podsOne–stepKOHMicrowave activation (620 W)8381.2270[32]
Corn strawOne–stepNH31073180436720[61]
Table 5. Adsorption thermodynamic parameters and results.
SampleT (K)ΔG0 (kJ mol−1)ΔH0 (kJ mol−1)ΔS0 (kJ mol−1 K−1)R2
P–H–0.5298−20.24−137.67−0.4020.8952
308−10.13
318−9.06
P–2–H–2298−5.51−15.24−3.3 × 10−20.9696
308−4.89
318−4.39
Disclaimer/Publisher’s Note: The statements, opinions and data contained in all publications are solely those of the individual author(s) and contributor(s) and not of MDPI and/or the editor(s). MDPI and/or the editor(s) disclaim responsibility for any injury to people or property resulting from any ideas, methods, instructions or products referred to in the content.

