Article

The Modeling of Fuel Auto-Ignition Delay and Its Verification Using Diesel Engines Fueled with Oils with Standard or Increased Cetane Numbers

Mechanical Department, Cracow University of Technology, 31-864 Cracow, Poland
*
Author to whom correspondence should be addressed.
Energies 2023, 16(14), 5273; https://doi.org/10.3390/en16145273
Submission received: 8 May 2023 / Revised: 7 June 2023 / Accepted: 20 June 2023 / Published: 10 July 2023

Abstract

:
This article contains the results of mathematical modeling of the self-ignition delay (τc sum) of a single droplet for various fuels, and the results of measurement verification (τc) of this modeling in diesel engines. The result of modeling the τc sum (as a function of the diameter and ambient temperature of the fuel droplet) revealed two physical and two chemical stages that had different values of the weighting factor (WFi) in relation to the total delay of self-ignition. It was also found that the WFi values of individual phases of the self-ignition delay differed for different fuels (conventional and alternative), and in the total value of τc sum. The measured value of the self-ignition delay (τc) was determined in tests using two diesel engines (older—up to EURO II and newer generation—from EURO IV). The percentage difference in the Δτc sum value obtained from modeling two fuels with different cetane number values was compared with the percentage difference in the Δτc value for the same fuels obtained during the engine measurements. Based on this analysis, it was found that the applied calculation model of the self-ignition delay for a single fuel droplet can be used for a comparative analysis of the suitability of different fuels in the real conditions of the cylinder of a diesel engine. This publication relates to the field of mechanical engineering.

1. Introduction

From the ecological point of view, it seems reasonable to plan to stop the production of internal combustion engines for passenger cars in all developed countries of the world after 2035 [1,2,3,4,5,6,7,8,9]. While in the case of light duty vehicles (LDVs) this is a realistic proposal, for trucks, heavy diesel locomotives and ships, the final production of large diesel engines is currently postponed to an even later date. In the case of the LDV class of vehicles, there are already technical solutions in place that allow the accumulation of electricity and its relatively quick replenishment in a way sufficient to make the use of this type of vehicle with an internal combustion engine comparable to that of a passenger car with an electric engine. Unfortunately, in the case of large heavy duty vehicles (HDV) units, in particular diesel locomotives and ships, the problem of storing and replenishing energy for electric propulsion has not yet been solved. This has to do with the required long range of these vehicles, the time needed to replenish the large amounts of electricity consumed, and the difficulties in ensuring the availability of charging stations. Consequently, the long-term use of diesel engines in this type of unit seems to be much less under threat than for passenger cars. This is also reflected in the way the attention of researchers and designers of diesel engines is currently focused on reducing their most environmentally harmful characteristic, namely, the emission of nitrogen oxides (NOx) and particulate matter (PM). Since nitrogen oxides are the most toxic components of exhaust gases, the authors of this publication focused their attention on the analysis of fuel self-ignition delay (τc), which has a very strong impact on NOx concentration in diesel engine exhaust. As shown in Figure 1, one of the reasons for the formation of nitrogen oxides in the engine cylinder is the high temperature (above 1000 K [10]) in the first, kinetic phase of combustion, where there is a large amount of oxygen present (which is not yet being used for fuel oxidation).
Reducing the delay in fuel self-ignition (the time between the start of fuel injection (αsi) and its self-ignition (αsc)) can be achieved by changing the design and/or regulation of the engine, and/or changing the properties of the fuel used [11,12,13,14,15,16,17,18,19,20,21,22,23,24,25,26,27,28,29,30]. From the point of view of diesel engine manufacturers, the least troublesome option is using a fuel that has, for example, a higher cetane number (CN), and will thus shorten the self-ignition delay. In the shorter time (τc) that is involved between the start of fuel injection and self-ignition when using a fuel with a higher cetane number, a smaller amount of the entire injected fuel dose accumulates in the combustion chamber prior to the self-ignition time (the red field in Figure 2), in comparison with the case where there is a longer self-ignition delay (τc) (the blue field in the diagram).
Self-ignition of a smaller mass of fuel (for the shorter τc, which is characteristic of fuel with a higher cetane number) leads to a less dynamic self-ignition of the fuel, with a lower rate of pressure increase and a lower temperature in the kinetic (initial) phase of combustion. This results, despite the still high oxygen concentration, in a smaller amount of NOx particles being produced in the engine cylinder than for a fuel with a lower cetane number.
The purpose of this publication is to examine the extent to which the mathematical and physical modeling of self-ignition delay is consistent with the real results of self-ignition delay measurements obtained in laboratory tests of a diesel engine fueled using fuels with different cetane numbers.

2. Modeling of Auto-Ignition Delay

It is very difficult to model the fuel self-ignition delay for diesel engines due to the fact that each type of engine and fuel supply system is characterized by differences in fuel injection pressure, fuel injection time, the construction of the injectors (fuel atomizers), and so on. This results in differences in the fuel atomization spectrum, which is also dependent on the operating point of the engine. This leads to mathematical equations describing physical phenomena (related to fuel injection and spraying), which are only the initial conditions for equations describing chemical phenomena (related to cold and hot fuel self-ignition). Consequently, the literature on the subject contains many different computational models of fuel self-ignition delay [10,31,32,33,34]. For this reason, when it comes to modeling the combustion process in a diesel engine for different types of fuel under different conditions, a qualitative comparison using only a single, representative drop of fuel (and not a real fuel stream) is often employed. The aim of the authors’ research was to provide a quantitative verification of the percentage difference in self-ignition delay obtained by modeling τc sum and the τc value, using data obtained from laboratory tests of real diesel engines. This verification was carried out for two fuels with different cetane numbers in two types of diesel engines from different generations (an SB 3.1 engine equipped with an injection pump, and a VW 1.9 TDI (type AJM) engine equipped with a modern injection system—electromagnetic unit injectors, max. fuel injection pressure: 200 MPa), in order to determine whether the results of the modeling were sufficiently consistent with the results of the measurements in real engines.

2.1. Modeling of Single Droplet Auto-Ignition Delay

To model the self-ignition delay (τc) of a single drop of fuel, a computational model [35] was applied. This had been successfully employed previously to model τc for vegetable and animal oils burned in power furnaces (diameter of fuel droplets d = 1–3 mm, and temperature t = 500–650 °C). In this connection, an additional task of the authors of this publication was to determine whether this model can be used for the conditions that occur in diesel engines, which differ from those described in the article [35] in terms of the range of both the fuel droplet diameters (d = 0.01–0.02 mm) and the temperature at the end of the compression stroke in the engine cylinder (t = 477–977 °C), as well as in the physical and chemical properties of the fuels involved.
According to publication [35], the auto-ignition delay (τc) of a drop of fuel, defined as the time from the insertion of the drop into the analyzed gaseous environment to the moment of its self-ignition, can be analyzed as the sum of four phases (periods):
τcsum = τcph1 + τcph2 + τcch1 + τcch2
where:
τcph1 = fuel droplet heating time (increase in droplet temperature from the original temperature (tf) to the boiling point (tv)), [s];
τcph2 = time from the boiling point to the appearance of a low-temperature flame (this is a shorter time than the evaporation time of the entire droplet mass), [s];
τcch1 = time for the formation of a low-temperature flame, [s];
τcch2 = time for the formation of an explosive flame, [s].
The first two phases (components) of the auto-ignition delay—τcph1 and τcph2—make up the so-called physical part of the auto-ignition delay (i.e., the period needed for the physical processes relating to the preparation of the fuel for auto-ignition to take place). The sum τc of the last two terms—τcch1 and τcch2—is the chemical part of the auto-ignition delay (i.e., the time needed for the chemical reactions leading to the self-ignition of the fuel droplet to take place).
In analyzing the physical part of the auto-ignition delay, the amount of heat (Q1) delivered to the surface of the fuel droplet must be taken into consideration:
Q1 = Qtk + Qp [J]
where:
Qtk = heat used to raise the temperature of the droplet, [J];
Qp = heat needed to vaporize the fuel, [J].
Therefore:
π d 2 α ( t t ) d τ = π 6 d 3 ρ f c f d t + L m f d τ   [ J ]
where:
τ = time, [s];
t = drop temperature, [°C];
t = ambient temperature of the drop, [°C];
α = thermal conductivity of the droplet, [W/m2·°C];
L = latent heat of vaporization, [J/kg];
m f = evaporation rate, [kg/s];
ρf = fuel density, [kg/m3];
cf = specific heat of the fuel, [J/kg·°C];
d = drop diameter, [m].
Rearranging this equation, and integrating it within the limits of the original temperature of the drop (tf) to the boiling point of the fuel (tv) gives:
0 τ c p h 1 d π π d 3 ρ f c f = t f t v d t 6 π d 2 α ( t t ) 6 L m f
τ c p h 1 = d ρ f c f 6 α ln [ π d 2 α ( t t f ) L m f π d 2 α ( t t v ) L m f ]
Thermal conductivity (λ m), assuming natural lift, is defined by the following equation, according to publication [36]:
α = λ m 2 [ 2 + 0.43 ( G r Pr ) 1 4 ]   ( 1 < Gr < 10 5 )
where:
λm = thermal conductivity of the mixture, [W/m · °C].
G r = Grashof   number = d 3 g β m [ t t f + t v 2 ] v m 2
where:
tv = fuel boiling point, [°C];
g = gravitational acceleration, [m/s2];
βm = coefficient of volumetric expansion of the mixture, [1/°C];
νm = coefficient of kinematic expansion of the mixture, [m2/s].
Pr
P r = Prandtl   number = c m μ m λ m ,   [ - ]  
where:
μm = viscosity coefficient of the mixture, [Pa · s].
The evaporation rate ( m f ), assuming natural lifting, is given by the following equation, according to publication [35]:
m f = π d ρ m D ( ω w ω ) [ 2 + 0.43 ( G r S c ) 1 4 ]
where:
ρm = mixture density, [kg/m3];
D = diffusion coefficient, [m2/s];
ωw = vapor concentration on the surface of the drop, [kg/kg];
ω = vapor concentration around the droplet, [kg/kg].
Sc = Schmidt number = νm/D
Therefore, the evaporation time (τcph2) is the time it takes for the temperature of the mixture to reach the auto-ignition temperature (tb). Taking into account the heat received and supplied to the mixture:
Q2 = Qtm + Qp + Qd [J]
where:
Q2 = heat absorbed by the air mixture, [J];
Qtm = heat needed to raise the temperature of the mixture, [J];
Qp = heat needed to vaporize the fuel, [J];
Qd = heat received from the mixture due to mass transfer (diffusion), [J].
Therefore:
π d m 2 α m ( t t ) d τ = π 6 d m 3 ρ m c m d t L m f d τ + m f c m ( t t v ) d τ
where:
dm = diameter of the mixture area, [m];
αm = heat conductivity coefficient of the mixture, [W/m2·°C];
ρm = mixture density, [kg/m3];
cm = specific heat of the mixture at constant pressure, [J/kg·°C].
Rearranging Equation (12), and integrating it from the boiling point (tv) to the auto-ignition temperature (tb) gives:
0 τ c p h 2 d τ π d m 2 ρ m c m = t v t b d t 6 π d m 2 α m ( t t ) 6 L m f 6 m f c m ( t t v )
τ c p h 2 = π d m 2 ρ m c m 6 π d m 2 α m + 6 m f c m ln [ π d m 2 α m ( t t v ) L m f π d m 2 α m ( t t b ) L m f m f c m ( t b t v ) ]
The mixture and the surrounding air are assumed to be stationary. The thermal conductivity of the mixture (αm) is defined by the following equation, according to publication [36]:
α m = 2 λ m d m
The time of actual evaporation occurs after the heating period, and the mixture zone gradually forms as the mixture is heated. However, it is assumed that the physical retardation of auto-ignition (τcph) is approximately the sum of Equations (5) and (14):
τcph = τcph1 + τcph2
The chemical retardation of auto-ignition can be calculated using publication [33] and publication [34], based on dependencies:
τ c c h 1 = 4.05 × 10 7 e E R T p 0.7
τ c c h 2 = 4.8 × 10 2 e E R T p 0.7
where:
p = pressure, [Pa];
E = activation energy (minimum energy required for a chemical reaction), [J/kmol];
R = gas constant = 6.28, [J/kmol];
T = ambient temperature of the drop, [°C, K].
Based on the model of the four phases of self-ignition delay presented above, calculations of the total value of τc were carried out for the conditions of a diesel engine fueled using both conventional fuel and fuel with a cetane number increased by as much as 6 units. The obtained τc values were then validated using laboratory tests of two diesel engines powered by both of the tested fuels. This made it possible to determine the correctness of the results for self-ignition delay obtained from the physical and mathematical modeling using real conditions occurring in the combustion process in diesel engines.

2.2. Results of Auto-Ignition Delay Modeling for Fuels with Different Cetane Number

Table 1 contains the values of the physical and chemical parameters needed (data from the fuel manufacturer before and after modification of the cetane number) in order to calculate the self-ignition delay for the conventional fuel, DFB (CN = 52), and the modified fuel, DFKA (CN = 58). Calculations were made based on the adopted ranges of temperature and the diameter of the fuel droplets characteristic of diesel engine operation (different than in publication [35]), and the functions of the individual components, the total self-ignition delay for the tested fuels, and the percentage difference (Δτc) between the values of τc were obtained, as shown in the graphs in Figure 3, Figure 4, Figure 5, Figure 6, Figure 7, Figure 8, Figure 9, Figure 10 and Figure 11.
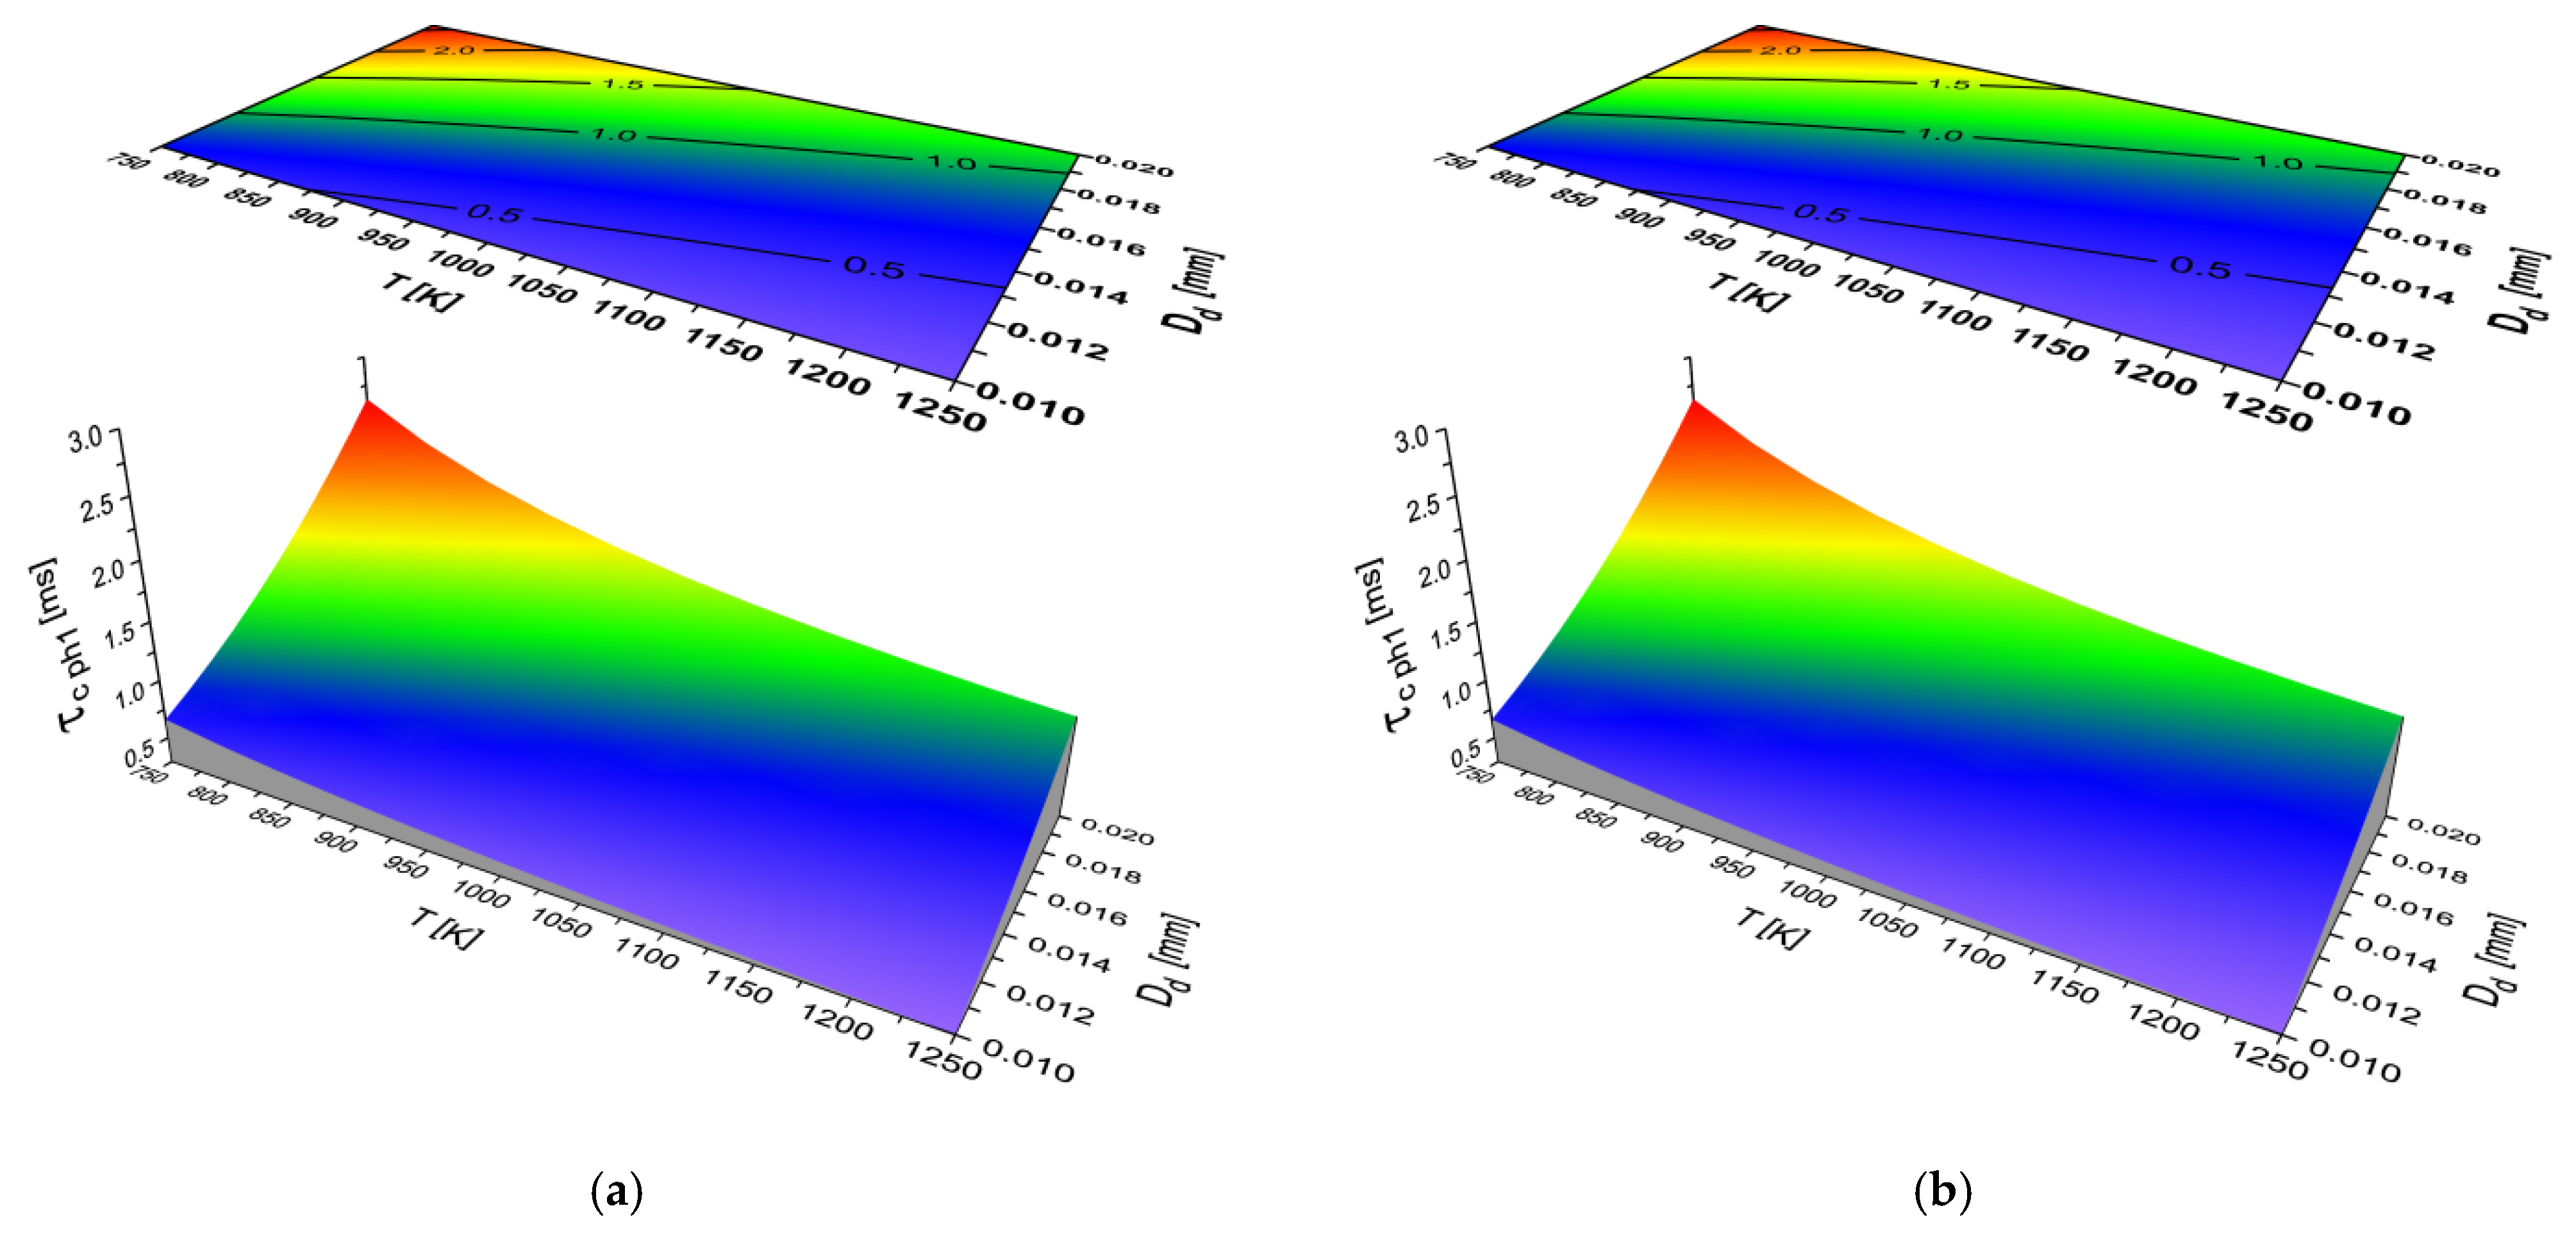
Figure 3a shows the result of modeling the influence of the temperature (T) of the working gas and the equivalent diameter (Dd) of the fuel droplet on the value of the first physical (τcph1) part of the auto-ignition delay for the base fuel (DFB). According to the description of the calculation model in Section 2.1, τcph1 determines the time needed to heat a drop of fuel from the assumed initial temperature to the boiling point. Since the fuel additive (2-ethylhexyl nitrate—2EHN) used to increase the cetane number of DFKA fuel did not affect the boiling point of this fuel (relative to DFB fuel), the values of τcph1 obtained as a result of the modeling are the same for both tested fuels, as a function of both the temperature and the equivalent fuel droplet diameter, as shown in Figure 3a,b.
The process of fuel droplet evaporation, under pressure and temperature conditions occurring in the combustion engine cylinder before self-ignition, takes place only on the surface of the drop (not the entire volume of the liquid) [37]. Therefore, the time taken to heat a drop of fuel to the boiling point, which determines the value of the first physical (τcph1) part of the self-ignition delay, depends, among other things, on the surface area (Sd) of the drop (simplified: the fuel ball), and is therefore inversely proportional to the square of the diameter (Dd) of the drop, because Sd = π(Dd)2. Figure 3a,b shows that the value of the first physical (τcph1) part of self-ignition delay is just a square function (2-degree polynomial) with respect to the equivalent droplet diameter for both fuels. Since the kinematic viscosity of both fuels (DFB and DFKA) is the same, the equivalent droplet diameter of the DFB atomized fuel is the same for a particular engine as that of the DFKA fuel. This applies to both the primary and secondary disintegration of the fuel droplets [38].
Table 1. Fuel characteristics [39,40,41,42,43].
FuelDFBDFKARapeseed
Oil
Ethanol
Parameter
Diesel fuelsAlternative fuels
cetane numer CN [–]52585025
fuel boiling point [°C]15015020078
temperature of auto-ignition [°C]330300357425
original droplet temperature [°C]20202020
fuel density [kg/m3]833833930798
mixture density [kg/m3]0.4620.4620.4620.462
kinematic viscosity (20 °C) [mm2/s]44701.5
surface tension (20 °C) [N/m]2.4 × 10−22.4 × 10−23.5 × 10−22.3 × 10−2
specific heat of the fuel [J/kg·°C]1930193023901125
specific heat of the mixture [J/kg·°C]1030103010301030
thermal conductivity of the fuel [W/m·°C]0.1160.1160.1100.167
thermal conductivity in the mixture [W/m·°C]0.04160.04160.4000.0416
latent heat of vaporization [J/kg]2.51 × 1052.51 × 1058.37 × 1058.54 × 105
diffusion coefficient [m2/s]2.14 × 1052.14 × 1052.14 × 1052.14 × 105
coefficient of volumetric expansion of the mixture (air, 250 °C) [1/°C]3.66 × 10−33.66 × 10−33.66 × 10−33.66 × 10−3
coefficient of kinematic expansion of the mixture (air, 250 °C) [m2/s]4.26 × 10−54.26 × 10−54.26 × 10−54.26 × 10−5
the Prandtl number of the mixture [–]0.6880.6880.6880.688
activation energy [J/kmol]2.09 × 1041.95 × 1042.26 × 1045.76 × 104
The situation would be completely different if modeling, for example, the first physical part of self-ignition delay for unprocessed vegetable oil used as an additive to diesel fuel (e.g., in agricultural tractors). Since the boiling point of vegetable oils is about 200–240 °C, compared with 150 °C for the boiling point of diesel fuel, the first physical part of the self-ignition delay (τcph1) would be much higher for this vegetable fuel than for diesel fuel.
The opposite is true for diesel fuel mixed with ethyl alcohol (Oxydiesel) because the boiling point for C2H5OH is significantly lower than that of diesel fuel, at only 78 °C (Table 1). Therefore, modeling the value of τcph1 would show, as follows from the equation in Section 2.1, that the time needed to reach the boiling point of ethyl alcohol (τcph1) would be much shorter than the value (τcph1) for diesel fuel.
For the purposes of information, the authors of this publication modeled the self-ignition delay for various liquid fuels that can be used as independent fuels or as additives to diesel fuel, and in all cases the duration of the first physical phase of the self-ignition delay was relatively small in relation to the total self-ignition delay (τc). Thus, regardless of whether fuels with a matching, higher or lower boiling point are analyzed, there is no significant impact on the total value of the self-ignition delay (τc).
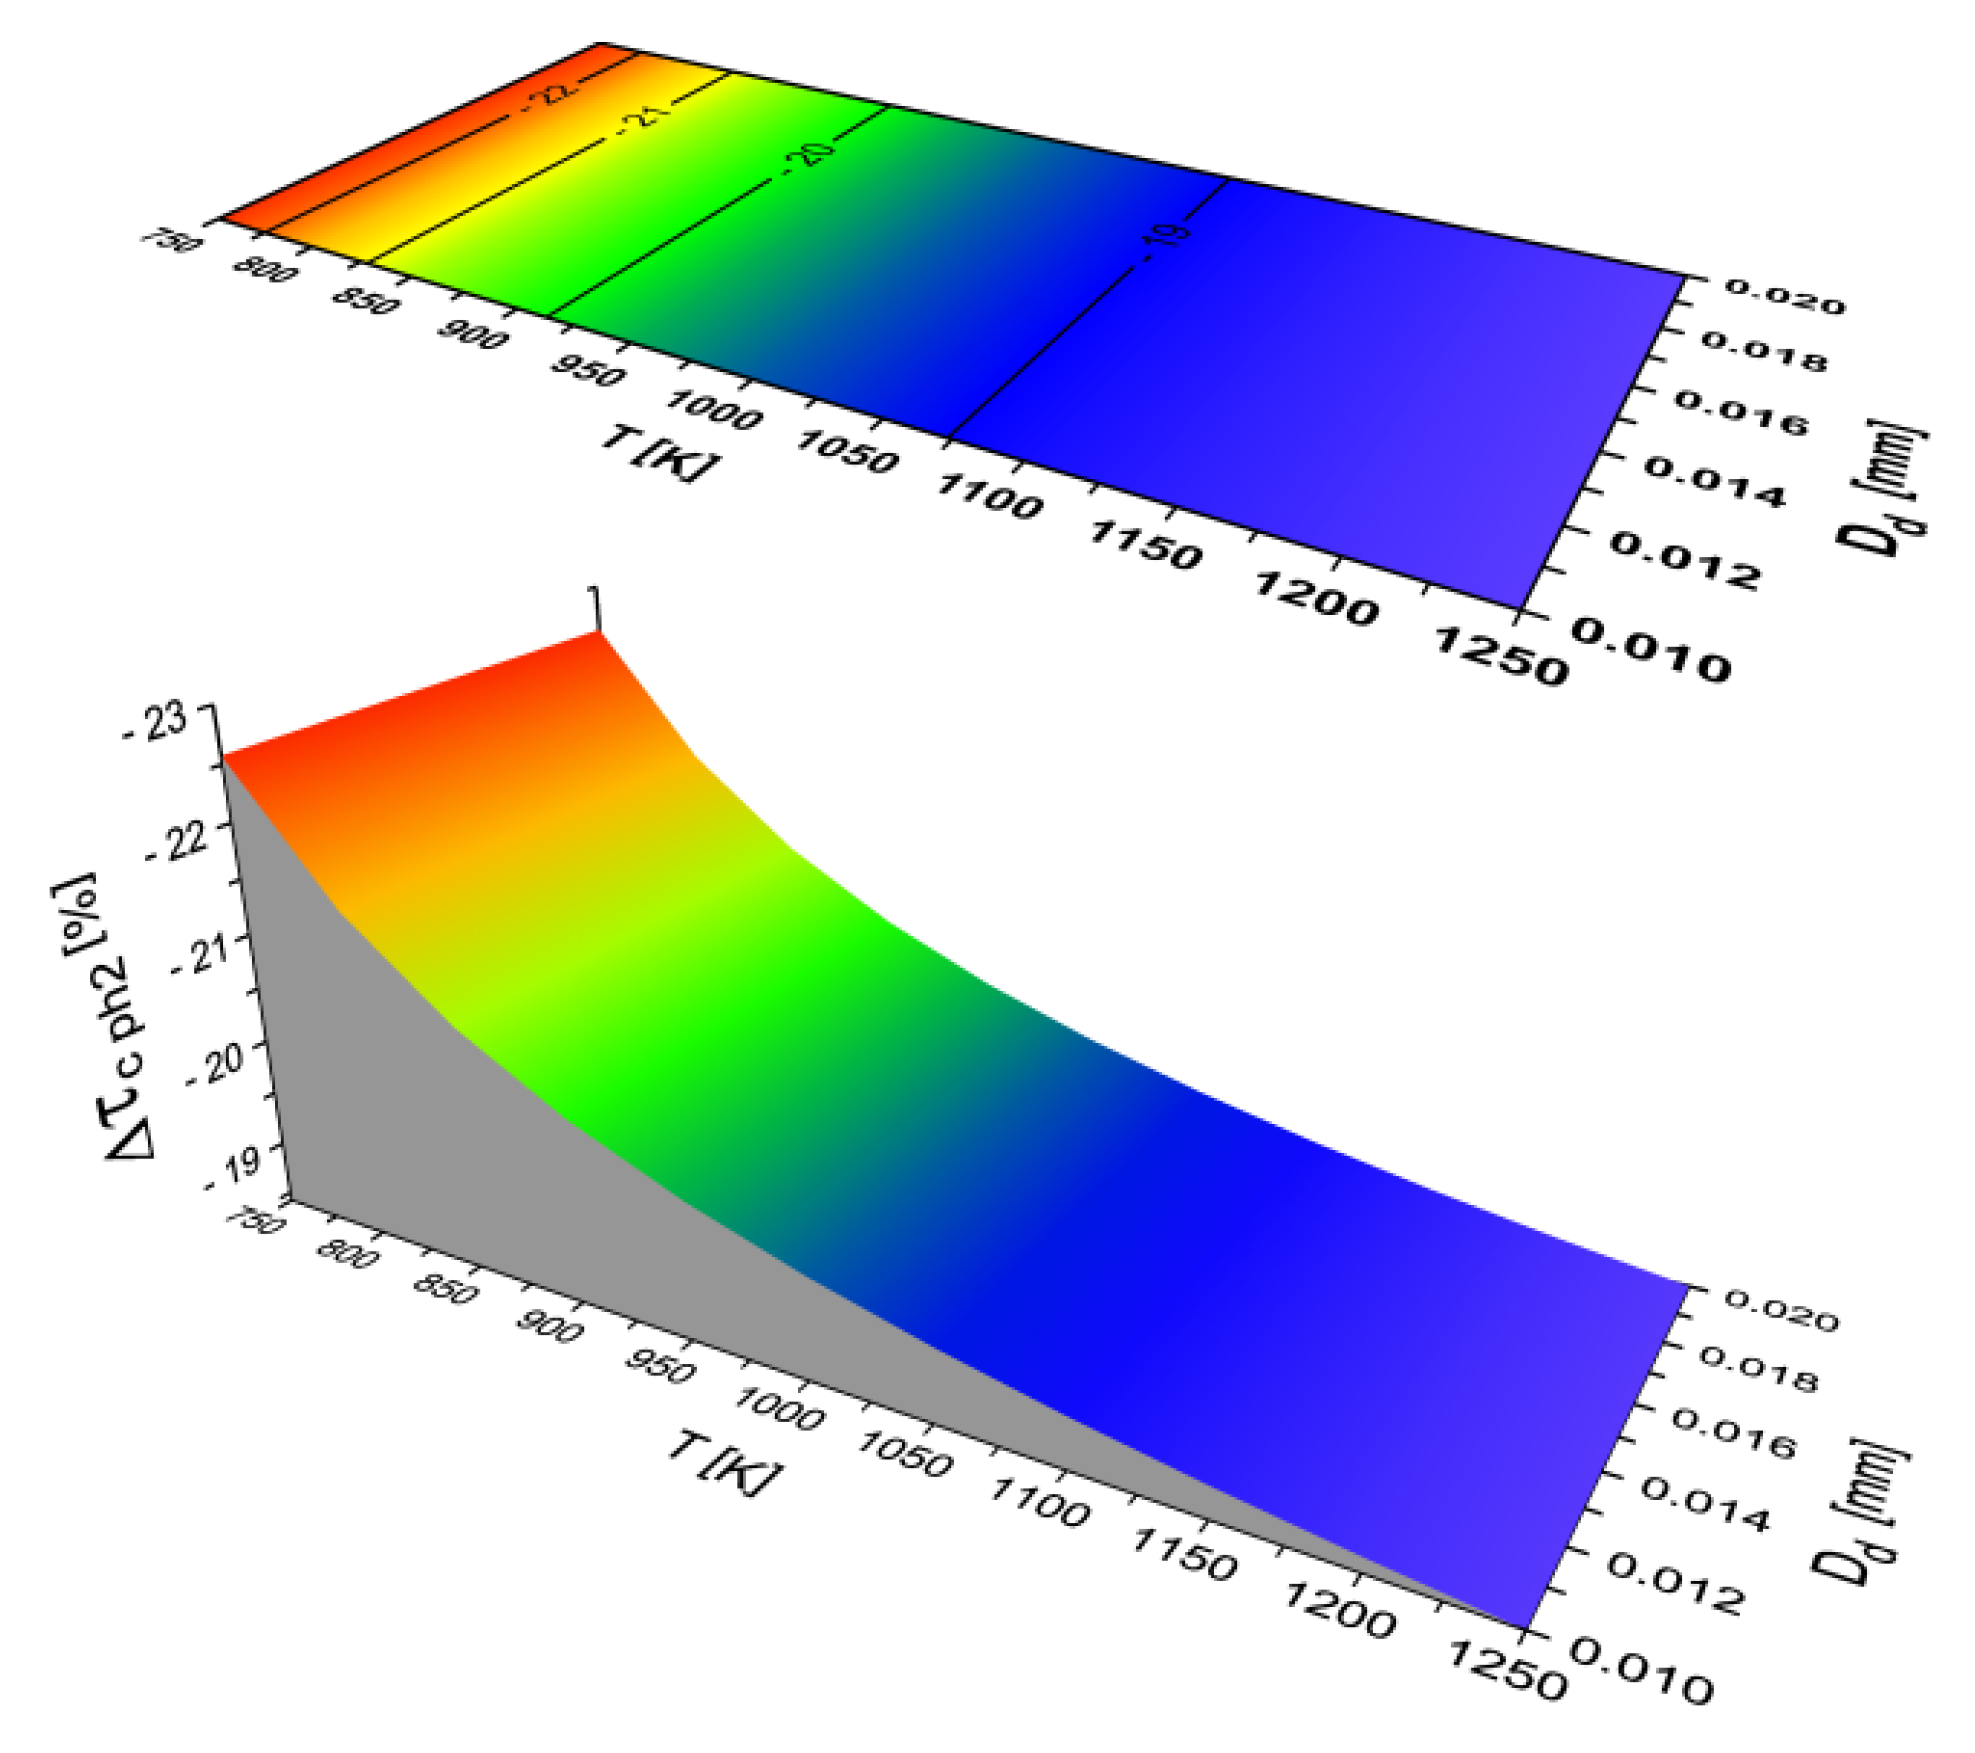
The calculations carried out by the authors for different fuels showed that the second physical part of self-ignition delay (τcph2) makes up a very large proportion of the total self-ignition delay time for fuels characterized by a high tendency to self-ignition. (The situation is completely different with the “lighter” fuels typically used in spark-ignition engines, e.g., petrol and ethyl alcohol.) This part of the self-ignition delay (τcph2) process determines the time needed for the fuel droplet to evaporate, because only fuel vapor (mixed with air) can ignite, not liquid fuel. Therefore, the value of τcph2 is affected by the fuel temperature, the working gas temperature, the diameter and mass of the fuel drop, the thermal conductivity of the droplet, and, of course, the latent heat of vaporization. From here, it might seem to follow that, since all the values of these parameters are the same for both DFB and DFKA, the duration (τcph2) would also be the same. However, τcph2 determines not only the time needed for complete evaporation of a liquid droplet of fuel, but also the time after which the self-ignition of the partially evaporated fuel begins. Since the activation energy (and hence also the self-ignition temperature) is much lower for DFKA fuel with a higher cetane number than for DFB fuel (Table 1), self-ignition will occur earlier for DFKA fuel, and therefore the time determining τcph2 will be shorter for this fuel. This is shown in Figure 4a,b. It can be clearly seen that the DFKA fuel is characterized by a much shorter time (τcph2) than the DFB fuel, both as a function of the temperature of the gas surrounding the fuel droplet, and as a function of the equivalent diameter of the droplet.
However, it should be noted that the relative difference in the values of the second physical part of self-ignition delay as calculated for the DFB and DFKA fuels (Figure 5) depends only on the temperature of the gas surrounding the droplet (it does not depend on the diameter of the droplet).
This is due to the fact that τcph2 determines the time from the beginning of the fuel evaporation process to the moment when the first low-temperature flames appear. The beginning of the droplet evaporation process (which is the beginning of the τcph2 period) is the same for both analyzed fuels. On the other hand, the end of the τcph2 period—low-temperature self-ignition (which is also the beginning of the τcch1 period)—occurs earlier for DFKA fuel than for DFB fuel, because the former is characterized by a lower activation energy. Earlier termination of the τcph2 process for DFKA fuel leads to a shorter duration for this element (τcph2) of self-ignition delay than in DFB fuel.
As with the first physical part of self-ignition delay, a qualitative analysis of the influence of the significant parameters on the second part of the process (τcph2) was conducted for alternative fuels with extremely different properties to the DFB base fuel. Raw vegetable oil (such as ethanol) can only be used as an additive to diesel fuel, because of its very large differences in atomization, evaporation, self-ignition, and combustion in relation to conventional diesel oil. The two fuels have diametrically opposed physical and chemical properties.
Crude rapeseed oil is a much “heavier” fuel than diesel fuel, with a much higher molecular weight (approximately 850 for vegetable oil, compared with roughly 280 for DFB) [35,38]. This also involves, for example, high values for density, kinematic viscosity, surface tension, boiling point, heat of vaporization, and activation energy, in comparison to diesel fuel. On the one hand, this gives the vegetable fuel a longer duration for the evaporation process compared with DFB, as it has, for example, a droplet with a greater substitute diameter (due to its high viscosity) and a higher boiling point (due to its chemical composition). On the other hand, because the end of the τcph2 phase is also the beginning of the appearance of a low-temperature flame (τcch1), vegetable oil (with a higher degree of activation energy than conventional fuel) is characterized by a later start for τcch1, which also means a later end of the second physical stage of self-ignition delay. The described phenomena indicate that the duration of the second physical part of self-ignition delay for rapeseed oil may be longer than for diesel oil (it depends on the assumed conditions: the diameter and the ambient temperature of the drop).
Ethanol, like crude vegetable oil, also has a longer self-ignition delay time (τcph2) than the DFB base fuel, but for completely different reasons. From the point of view of the equation describing the second physical delay of self-ignition, the beginning of this period (τcph2) for ethanol would be earlier than for conventional diesel (among other reasons, due to the significantly lower boiling point of this fuel in relation to the boiling point of DFB). In contrast, the end of the τcph2 period, which is identical with the appearance of a cold flame, will come much later for ethanol than for DFB fuel, due to its very high activation energy (almost three times higher than for DFB). Therefore, the second phase of the physical delay of self-ignition for ethanol, calculated using the model, is incomparably longer than for the previously analyzed fuels.
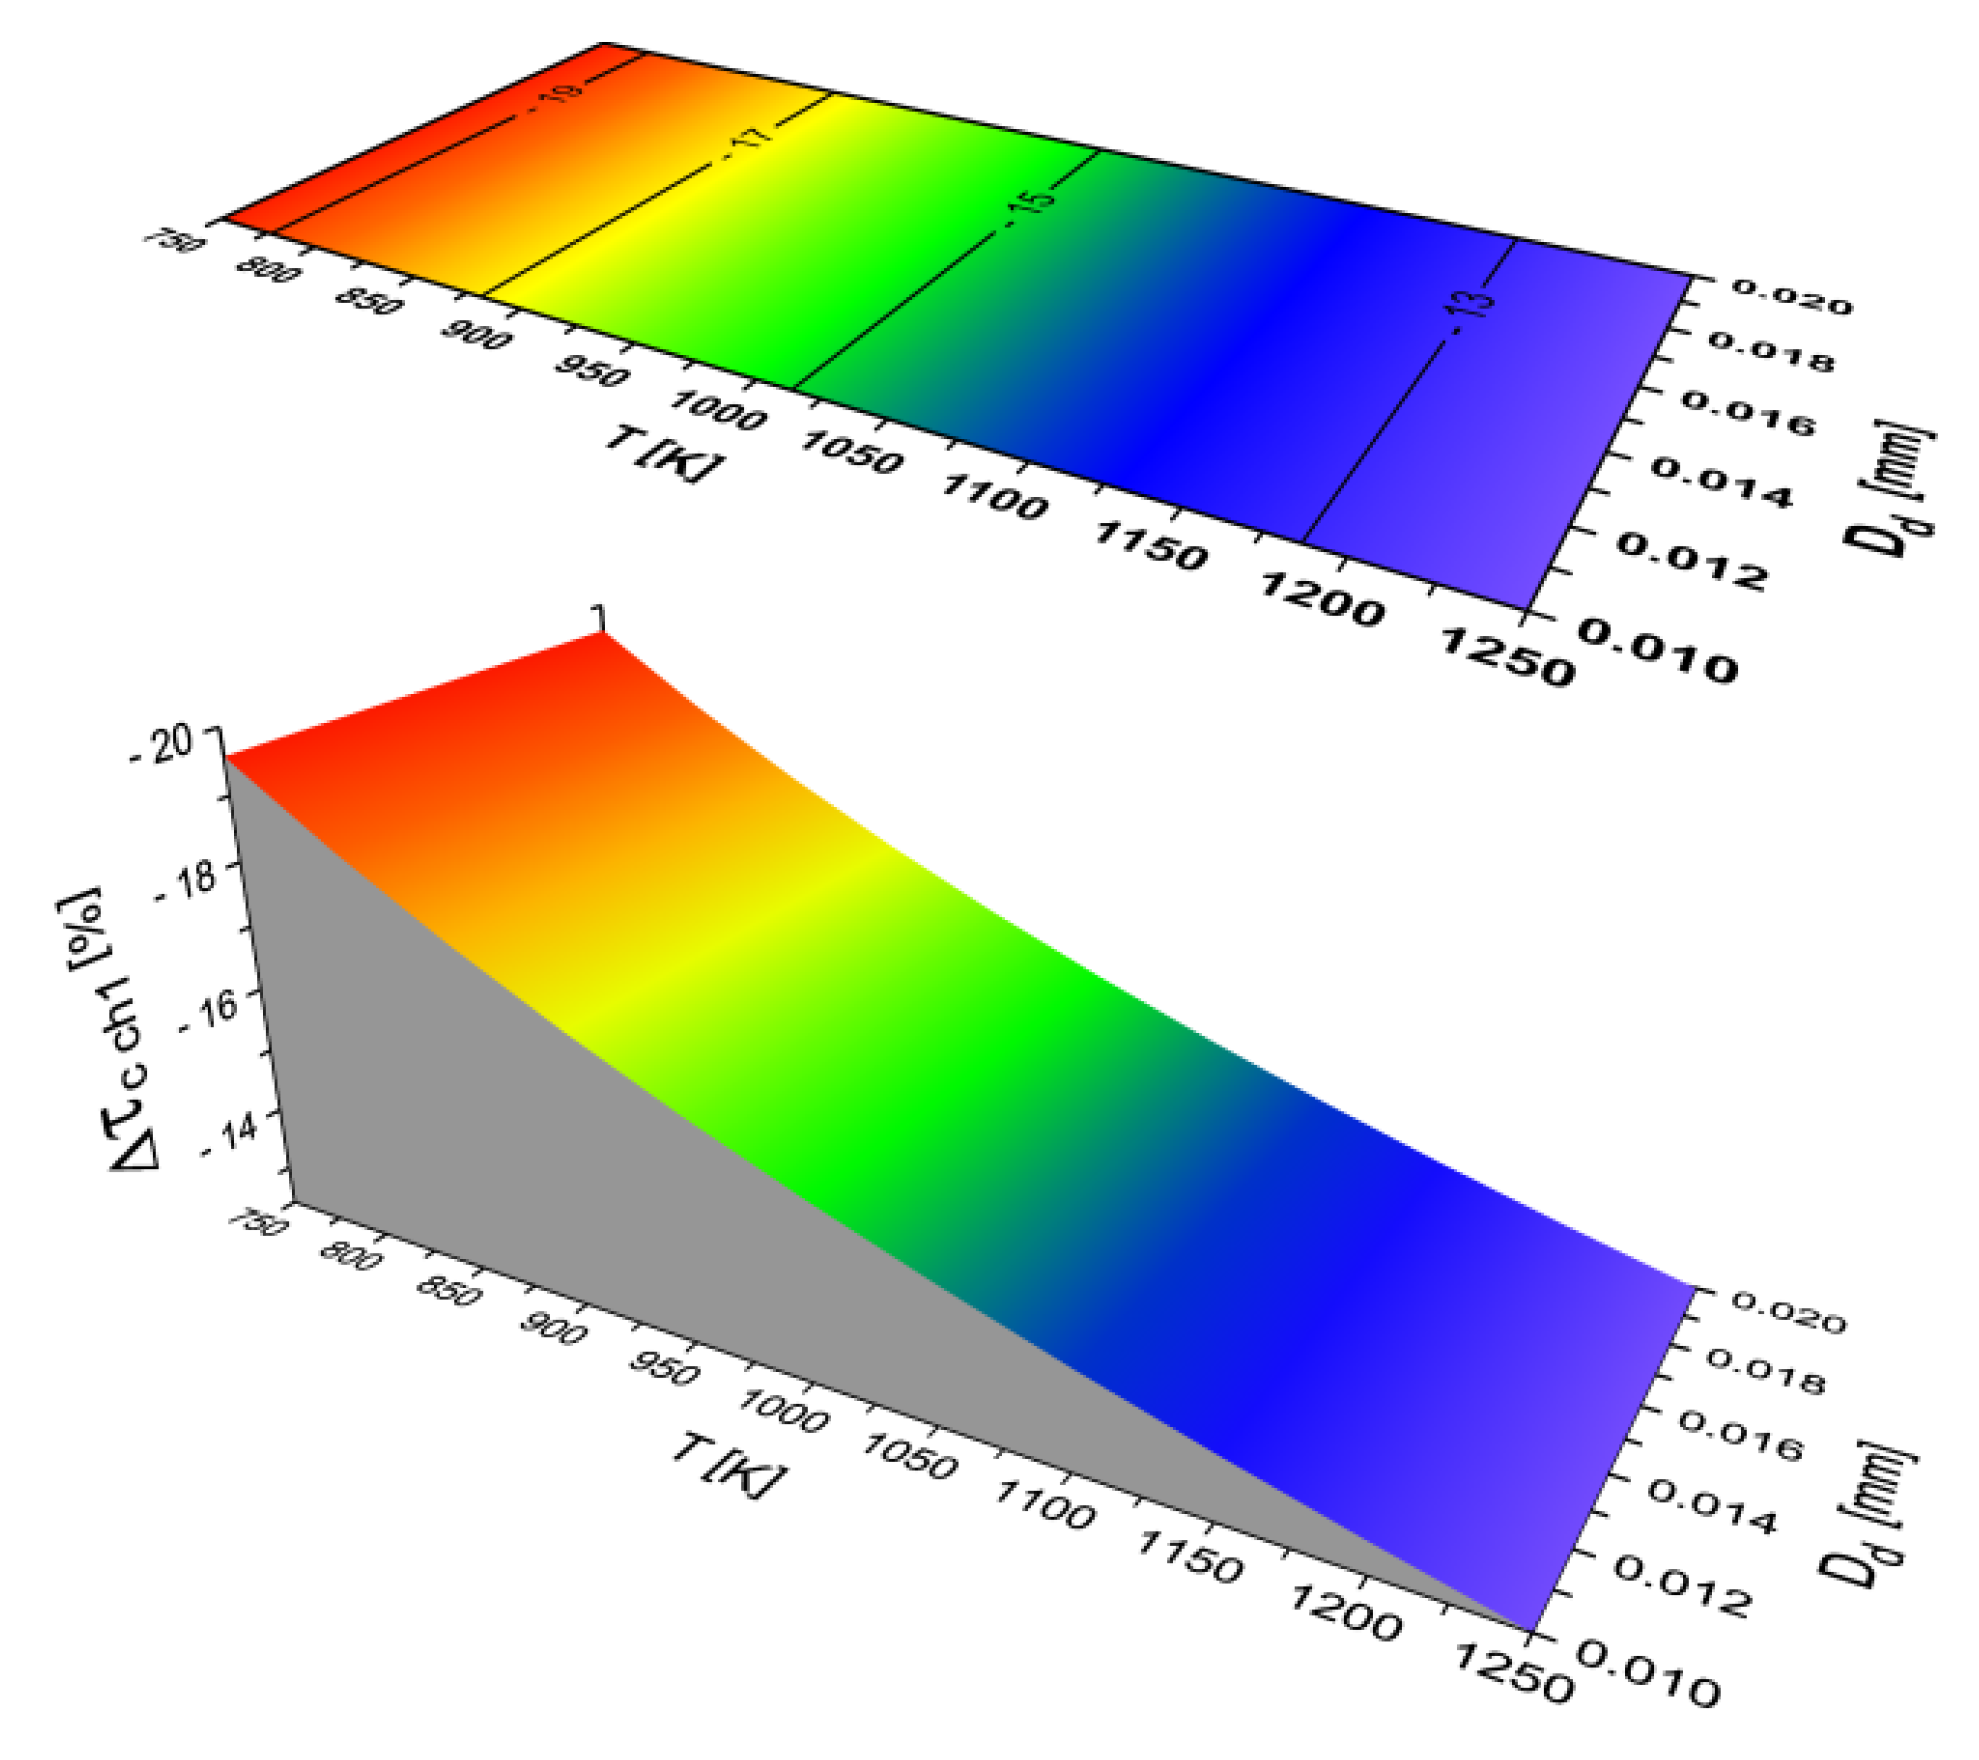
The influence of the equivalent diameter and ambient temperature of the DFB and DFKA fuel droplets on the calculated first chemical self-ignition delay (τcch1) is shown in Figure 6a,b.
These graphs clearly show that, for both fuels, τcch1 depends only on the temperature of the gas in which the fuel drop is located. This means that, unlike both the physical parts of self-ignition delay (τcph1 and τcph2), τcch1 does not depend on the substitute diameter drops. This is due to the fact that τcch1 determines the time needed for the appearance and duration of a low-temperature flame, and this, in turn, relate only to the chemical properties of the fuel, and not to the substitute droplet diameter resulting from the physical parameters of the fuel. However, it is important to note that, as a result of the modeling, significantly different values of τcch1 (as a function of the ambient temperature of the droplet) were obtained for the compared fuels. The DFKA fuel, with a lower value of activation energy, was characterized by a shorter time in defining the first chemical phase of self-ignition delay compared with the DFB base fuel. As shown in Figure 7, the described relative difference in the value of Δτcch1 for the analyzed fuels was at its highest for low ambient temperatures of the droplet (above 19%), and decreased with the increase in the temperature of the gas surrounding the fuel droplet. This is due, of course, to the fact that, with the increase in the ambient temperature of the drop, the process of the formation of the explosive flame, which is the end of the τcch1 period, is facilitated.
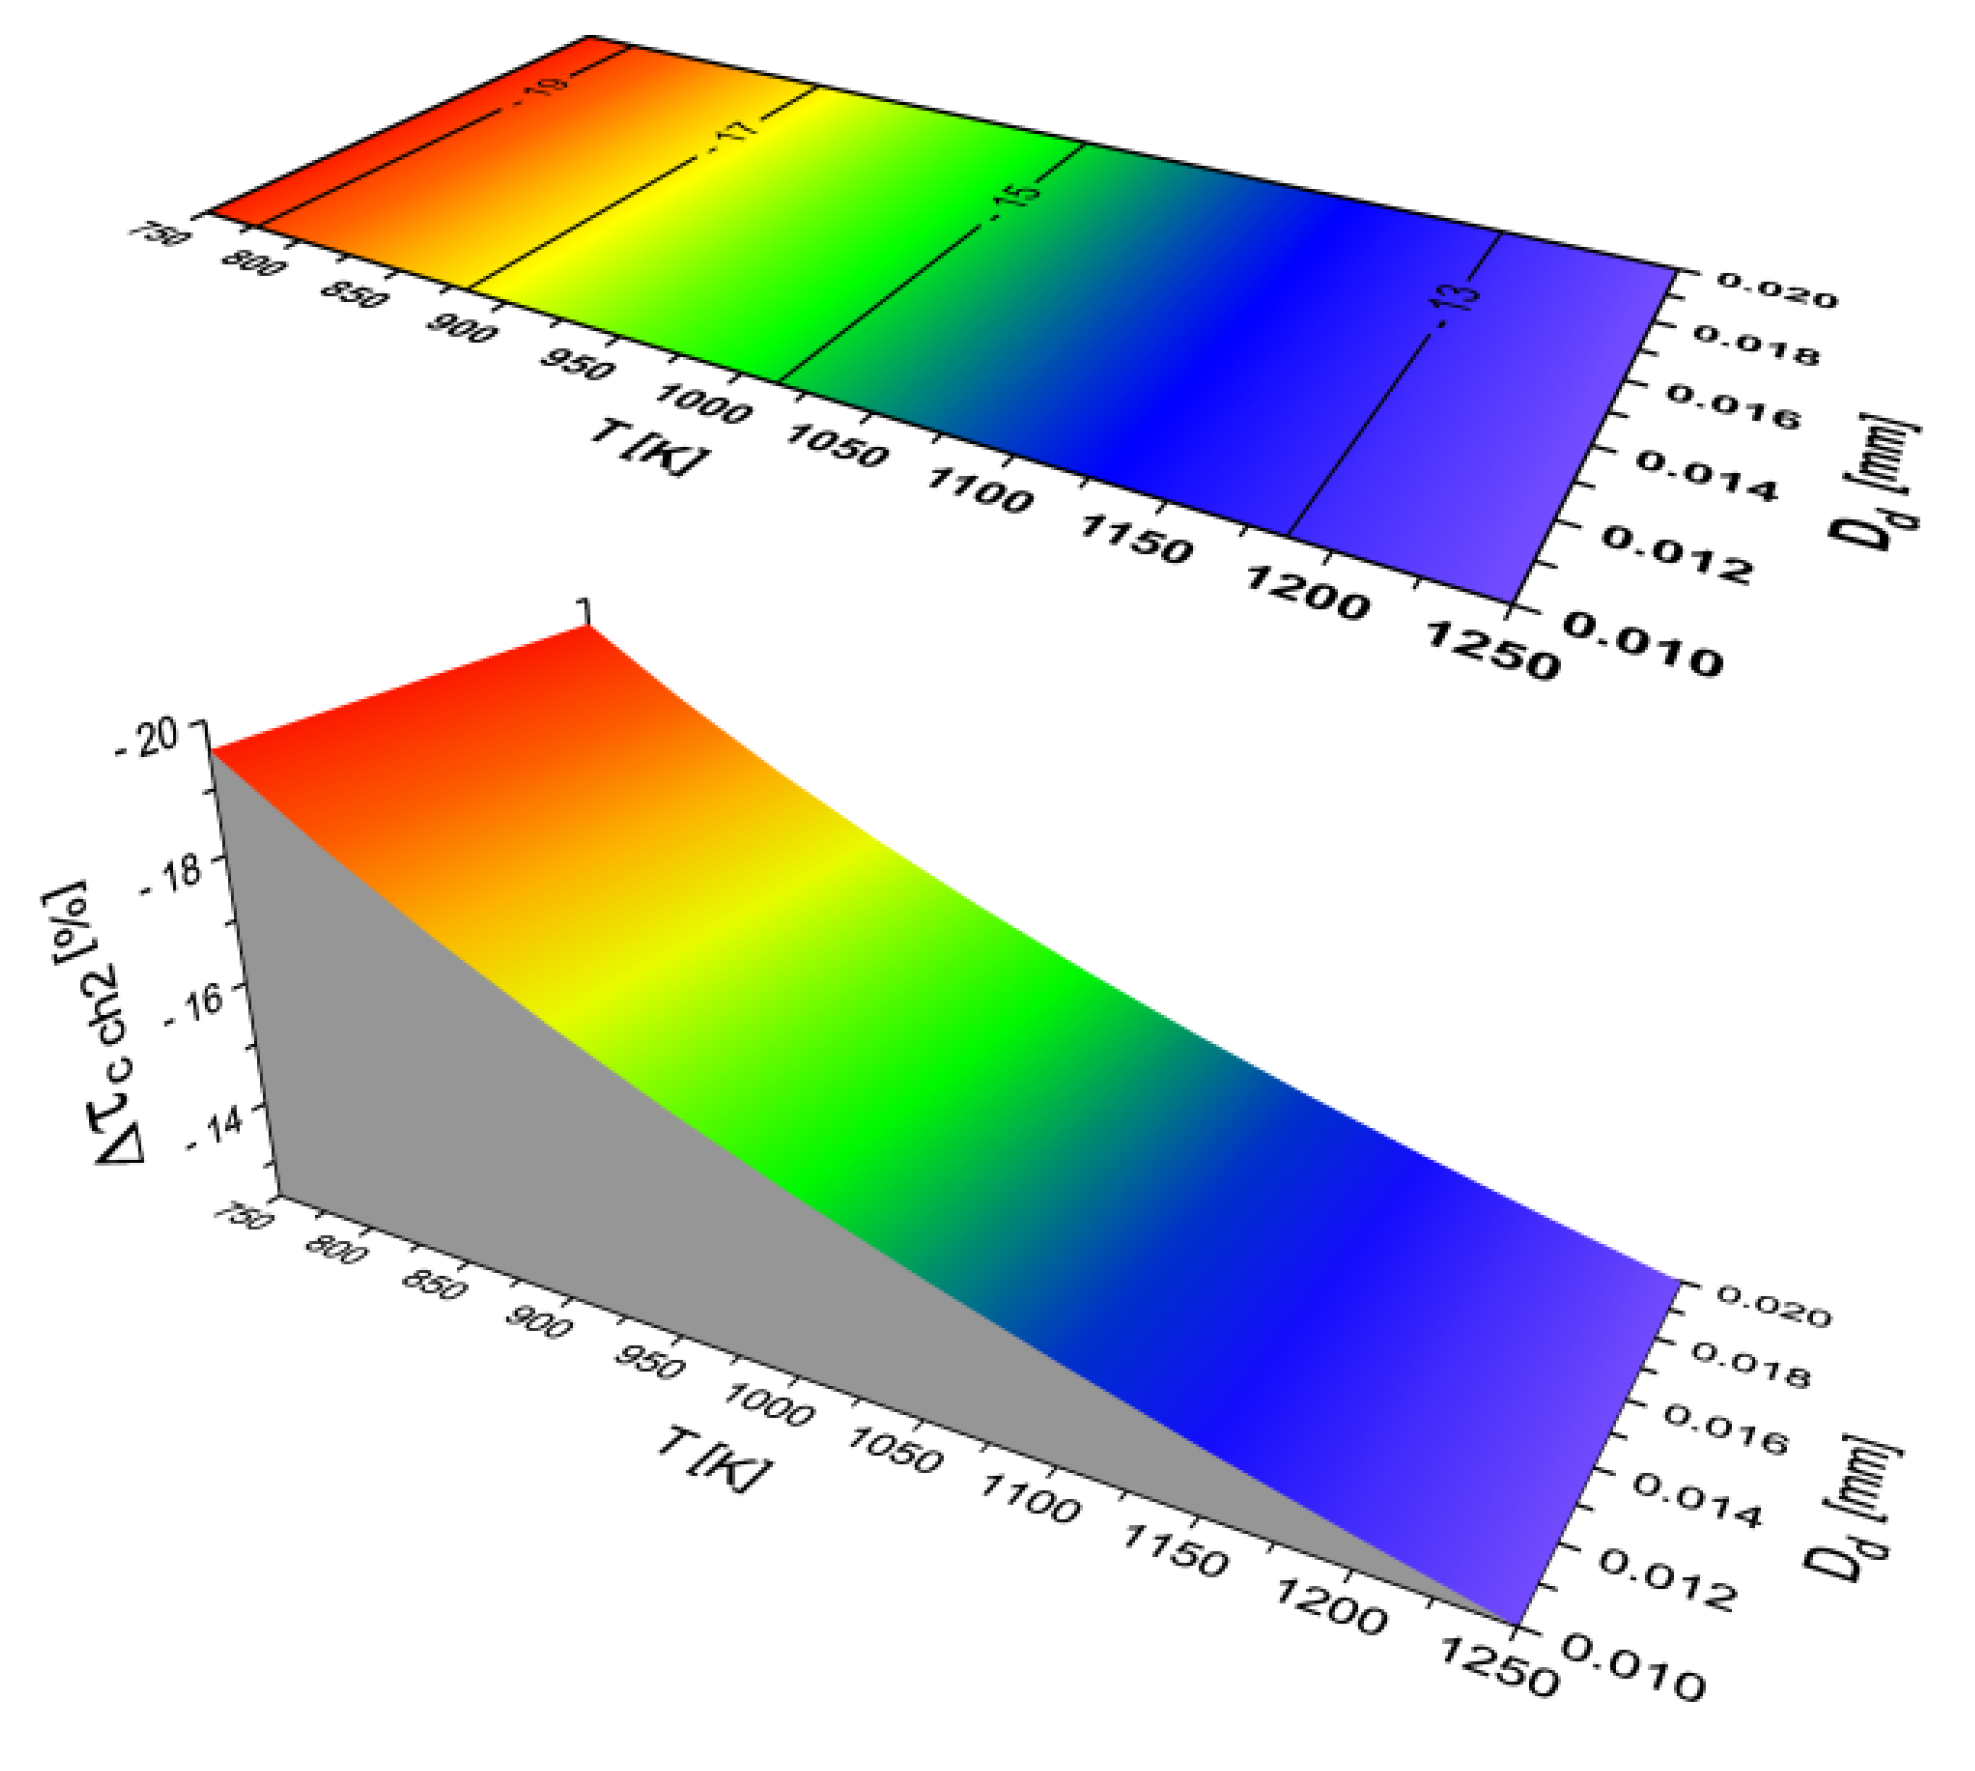
The second phase of the chemical self-ignition delay (τcch2) defines the length of time to the formation of an explosive flame. Similarly to τcch1, this part of the fuel droplet self-ignition delay is a period that only involves chemical reactions, and therefore does not depend on the substitute diameter of the fuel droplet. From Equations (17) and (18) in Section 2.1, it follows that the second chemical phase of the fuel droplet self-ignition delay is many times longer than the first chemical phase. This is shown in the data presented in Figure 8a,b.
From the figures given above, it is clear that the second chemical phase of the self-ignition delay for the base fuel (DFB) was several percentage points longer than for the modified DFKA fuel (Figure 9). The duration of both the first and the second part of the chemical self-ignition delay (relative to one operating point of a specific diesel engine) depends on the activation energy of the fuel. Since the modified fuel (DFKA) has a lower value of activation energy (as a result of the addition of 2-ethylhexyl nitrate), it follows that much lower values for the delay for this part of the self-ignition process were obtained from the modeling than for the base fuel (DFB).
In the case of the previously mentioned crude vegetable oil, both the first and the second stages of the chemical delay of the self-ignition of a droplet of this fuel, calculated using the equation contained in the model, were slightly longer than for conventional diesel oil. This is due to the fact that crude vegetable oil has a slightly higher activation energy. However, the values of τcch1 and τcch2 in the case of ethyl alcohol were many times higher in relation to diesel oil, because the activation energy for this fuel is more than twice as high as the figure for diesel. In a real diesel engine fueled only with ethanol, self-ignition of the fuel would most likely not occur (due to too long a self-ignition delay). In diesel engines fueled with a mixture of diesel oil and ethanol, a different model of the self-ignition process takes place—in the first stage, after the delay of self-ignition characteristic for diesel fuel c,DF), drops of diesel oil self-ignite, and then, from these flames, the ethanol begins to ignite (after the period of ignition delay characteristic of ethanol). There is also another way of using ethyl alcohol in a diesel engine [44]. Here, the air in the intake manifold (during the filling stroke) is supplied with sprayed ethyl alcohol, which in the final stage of the compression stroke is ignited by the flame formed after the self-ignition of the main dose of diesel fuel. In the case of the described method of ethanol combustion in a diesel engine, the main fuel dose (in terms of energy) is still diesel oil, which also serves as the ignition dose, while ethyl alcohol, injected into the air in the intake manifold in a significantly smaller dose than the diesel fuel, is used to change the course of the combustion process (by lowering the combustion temperature, and thus reducing NOx emissions in the exhaust gases).
However, this is not a form of dual-fuel engine, because in such an engine a very low amount of only diesel oil is used to ignite the large, main doses of the secondary fuel (the combustion of which provides the necessary energy and power).
In both the described examples of possible ways of using ethyl alcohol as a fuel for a diesel engine, the ethanol drops are ignited only after the self-ignition of the diesel oil droplets, and this is due to the significantly longer delay of ethanol self-ignition compared with that for diesel oil. Thus the self-ignition delay of a mixture of two fuels need not be the arithmetic mean of the delay of each of these fuels.
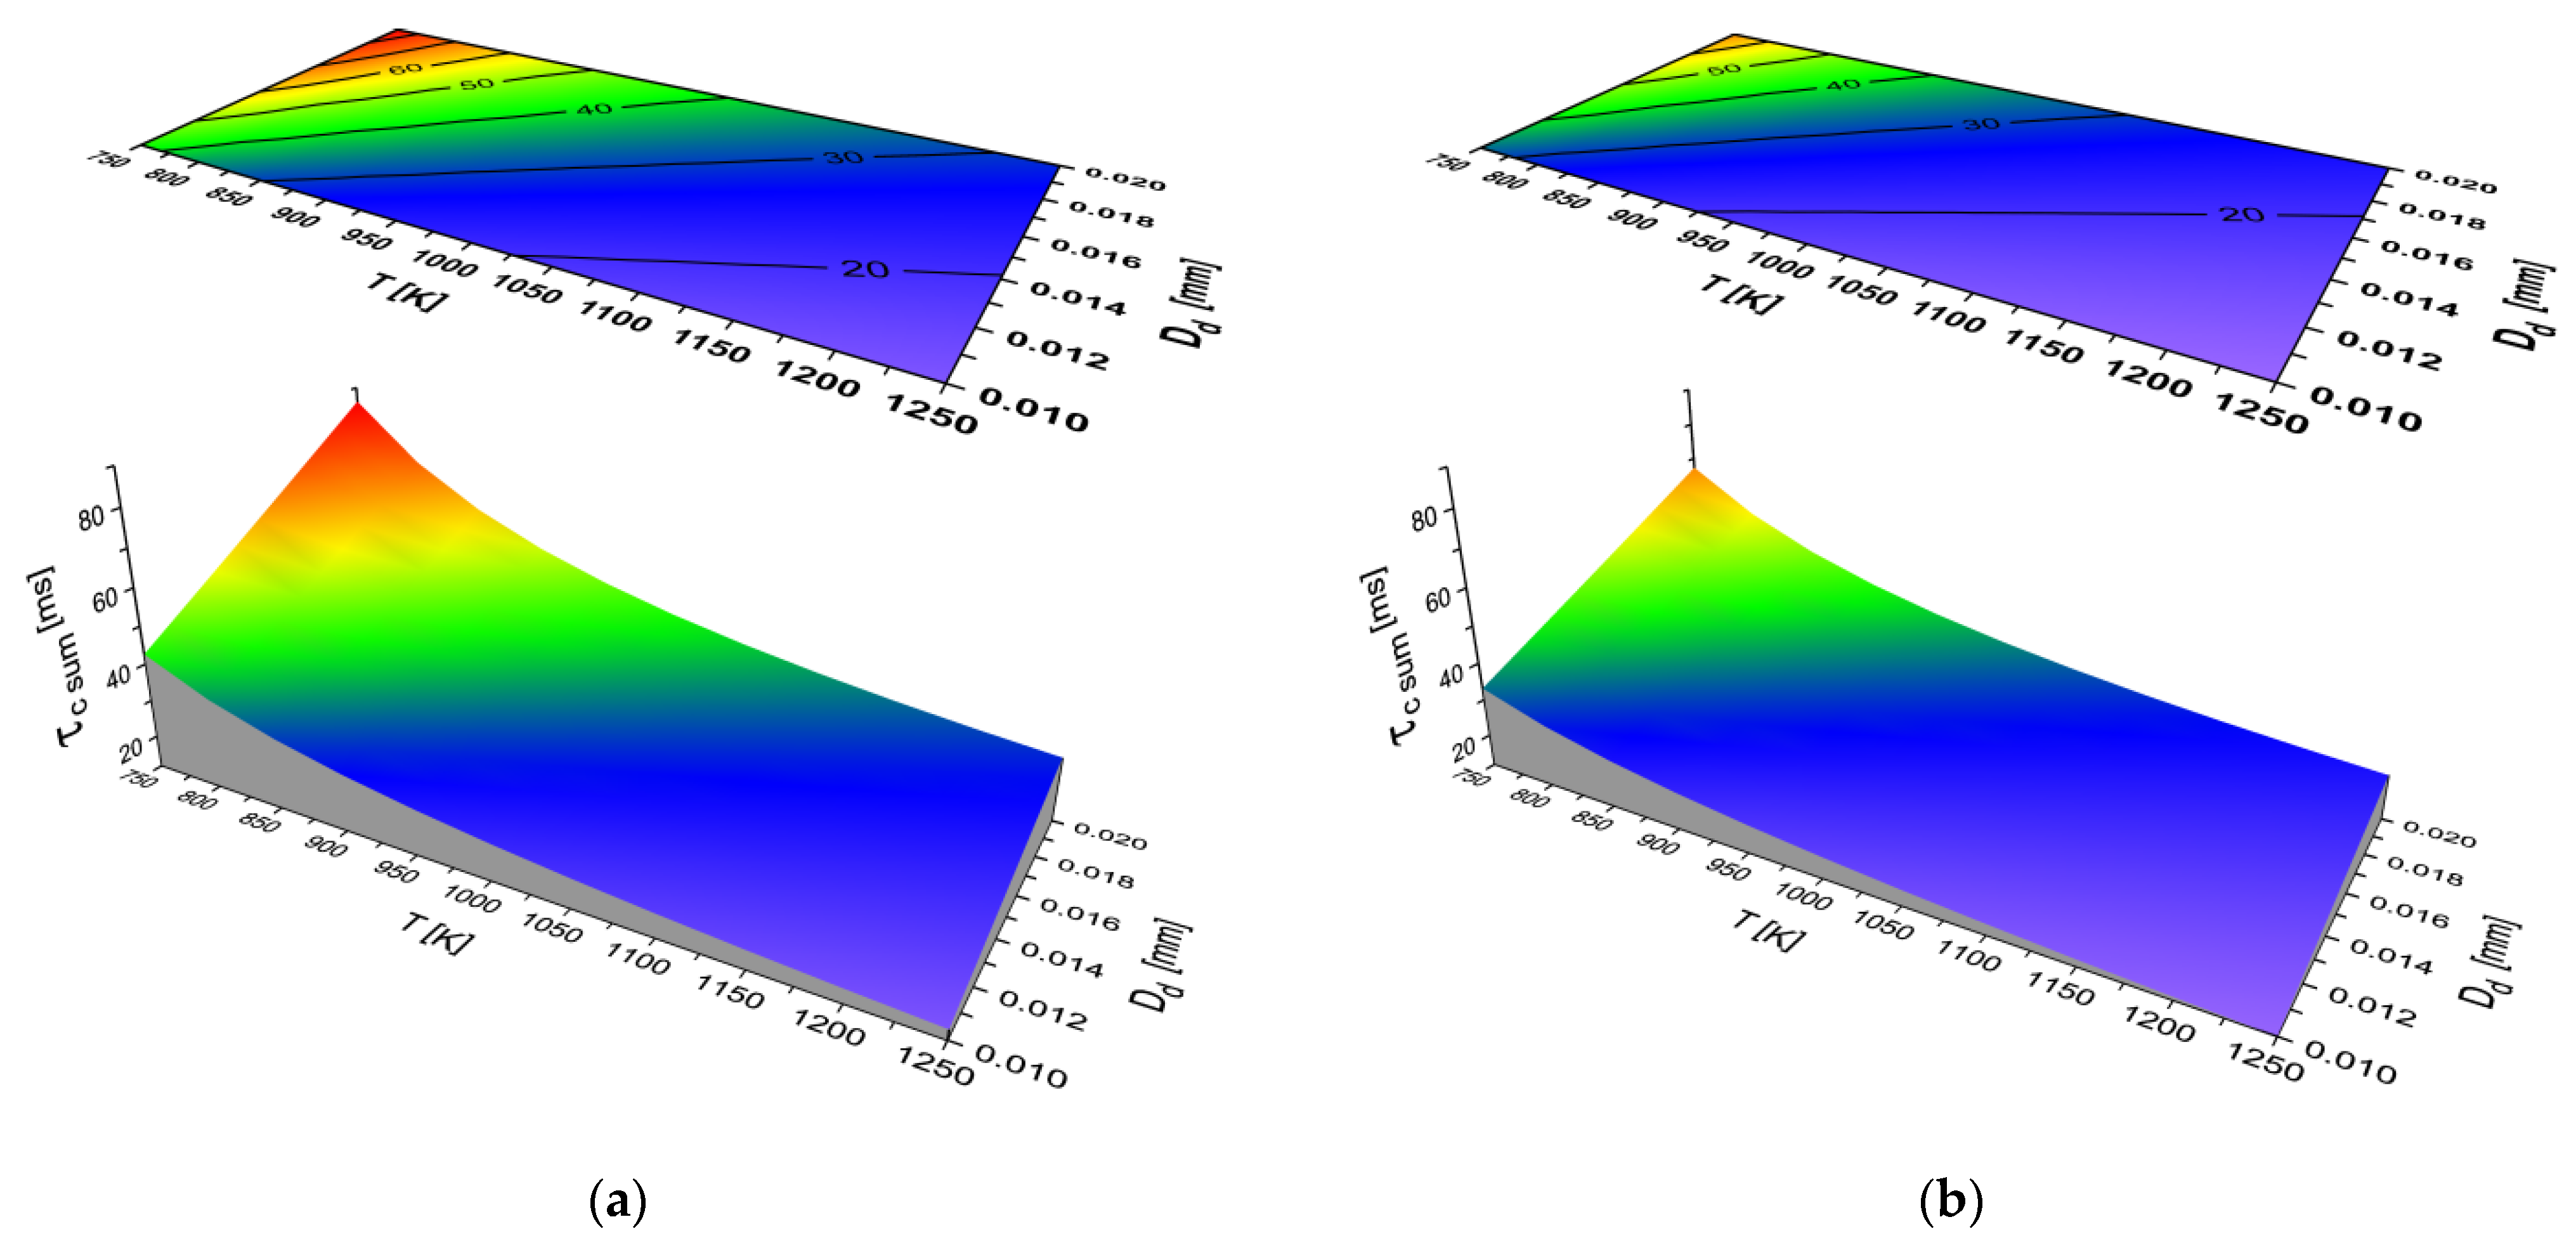
According to the modeling presented in Section 2.1, the total self-ignition delay (τc) of a droplet of fuel is the sum of the two physical and the two chemical components of this process. The values of τc as a function of gas temperature and equivalent droplet diameter for DFB and DFKA fuels are shown in Figure 10a,b.
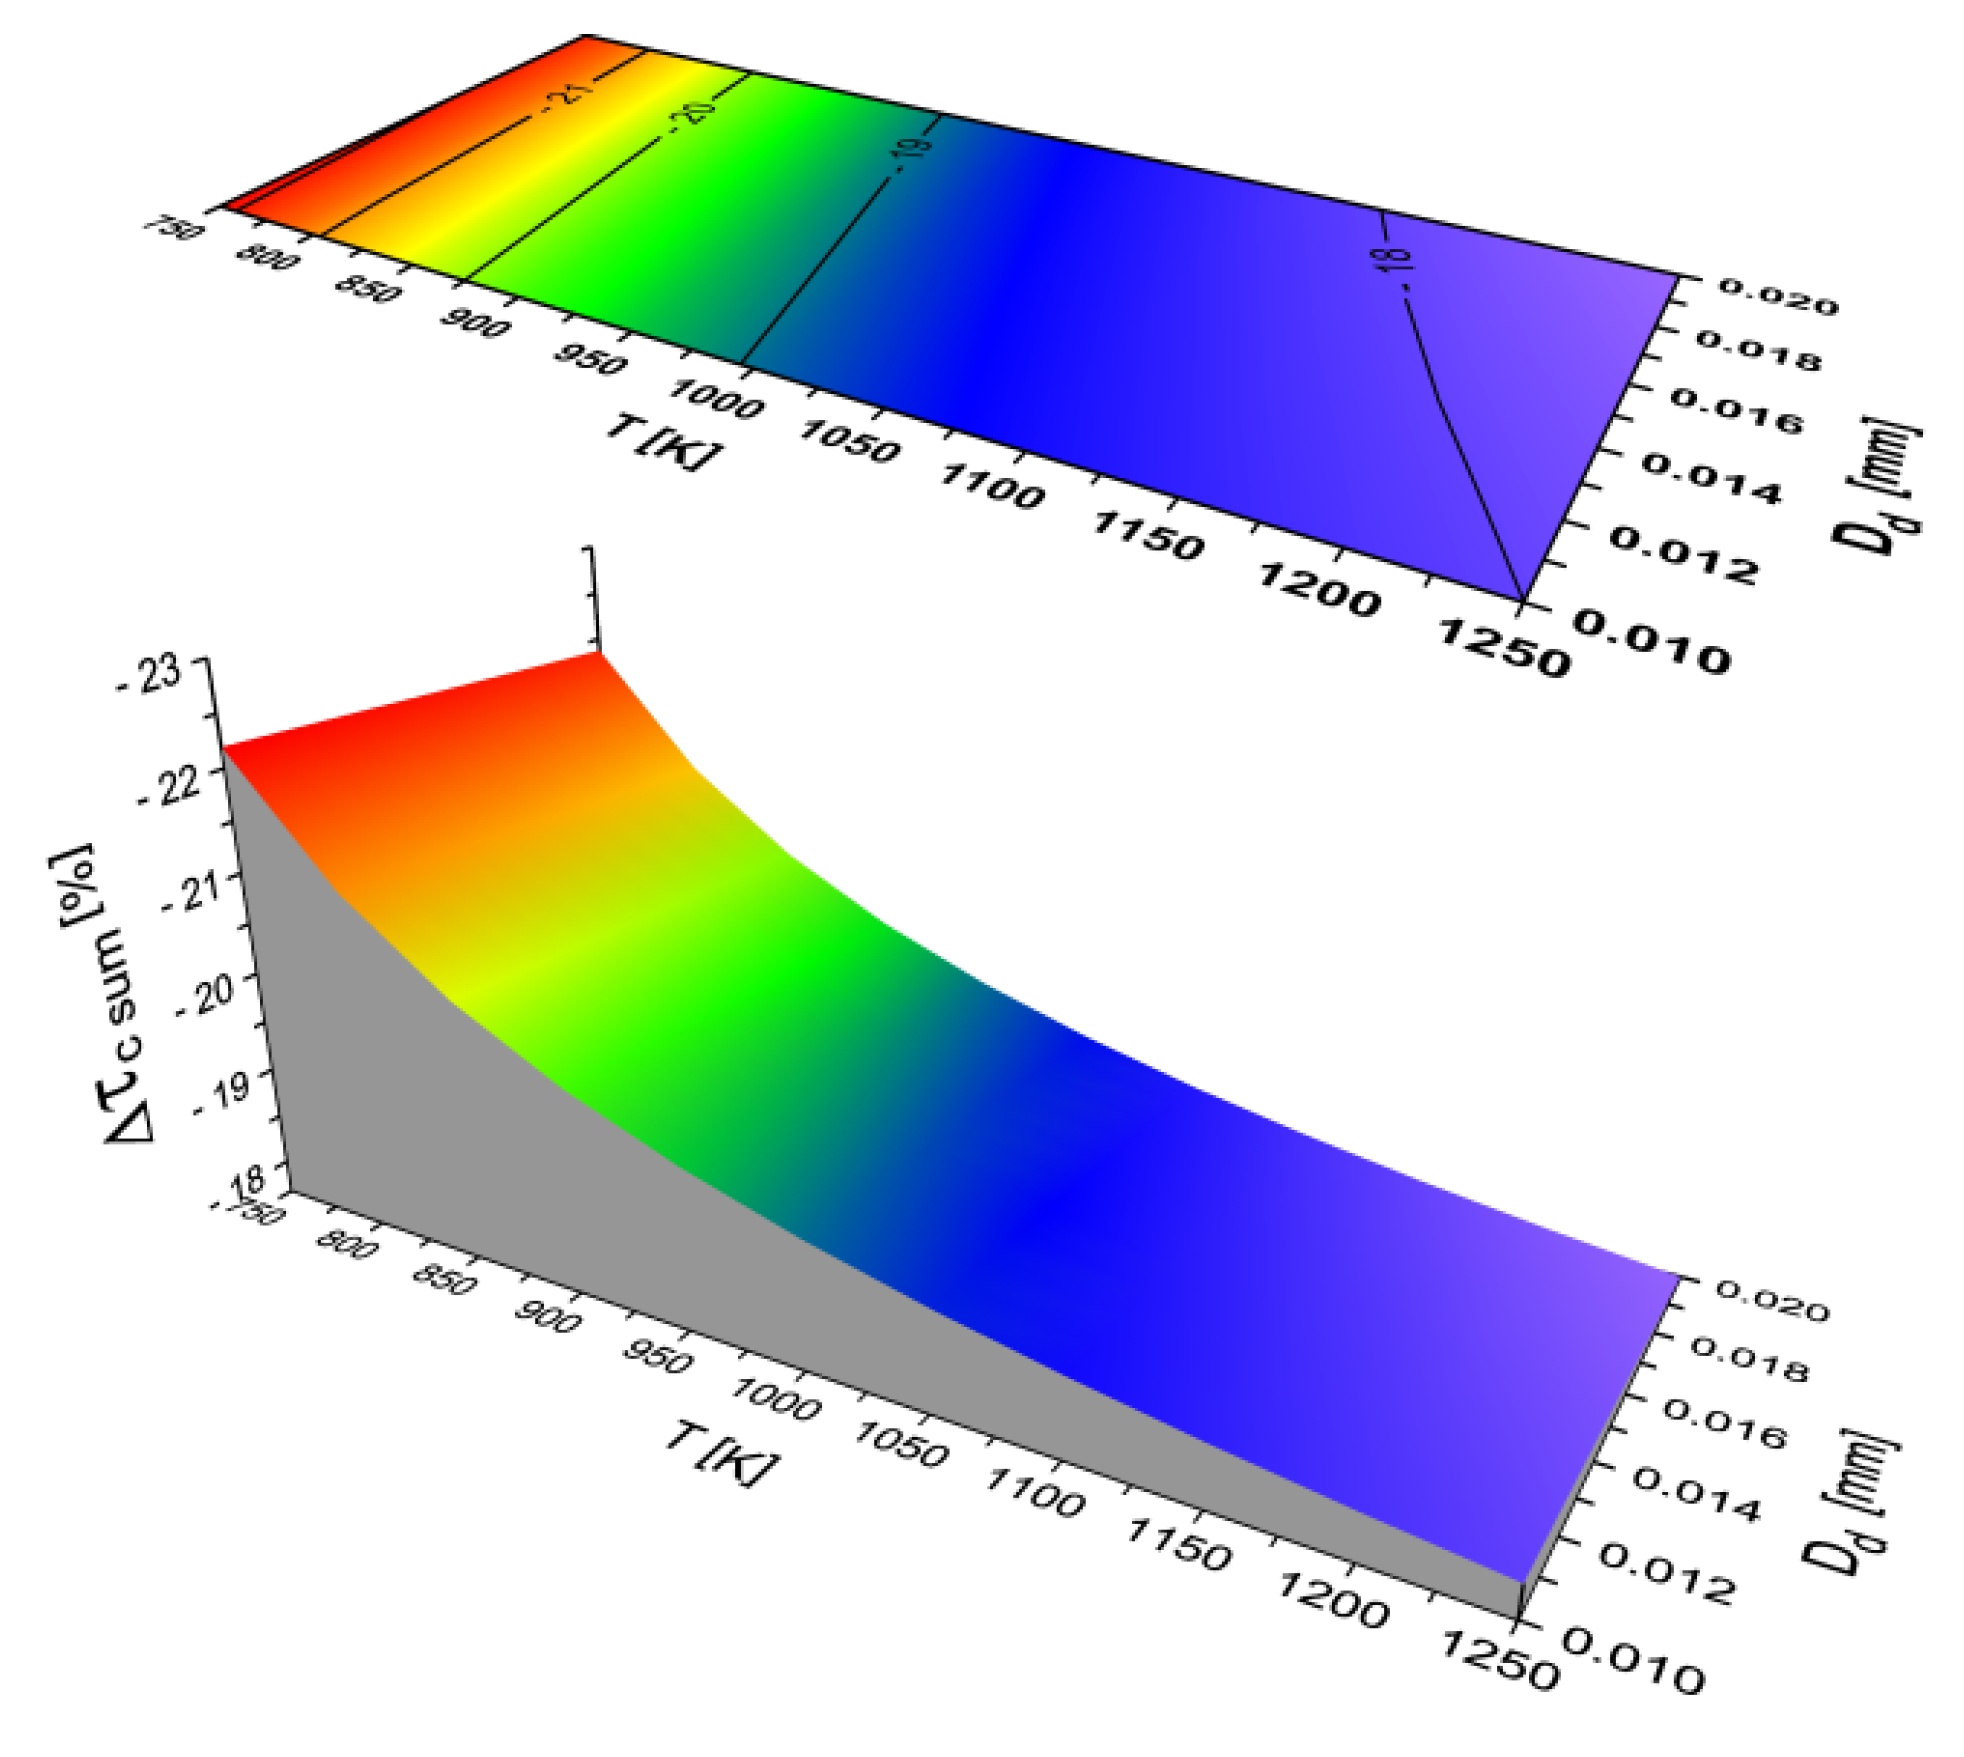
These figures show that the total self-ignition delay (τc) for the modified DFKA fuel is shorter by 18 ÷ 20% (depending on the gas temperature and equivalent droplet diameter) than for the DFB base fuel (Figure 11).
It should be remembered, however, that the individual phases of the fuel droplet self-ignition delay (two physical and two chemical) do not affect the duration of the total self-ignition delay in the same way. The results for the two hydrocarbon fuels (DFB and DFKA) and the two alternative fuels that can be used as additives to diesel fuel are presented in Figure 12.
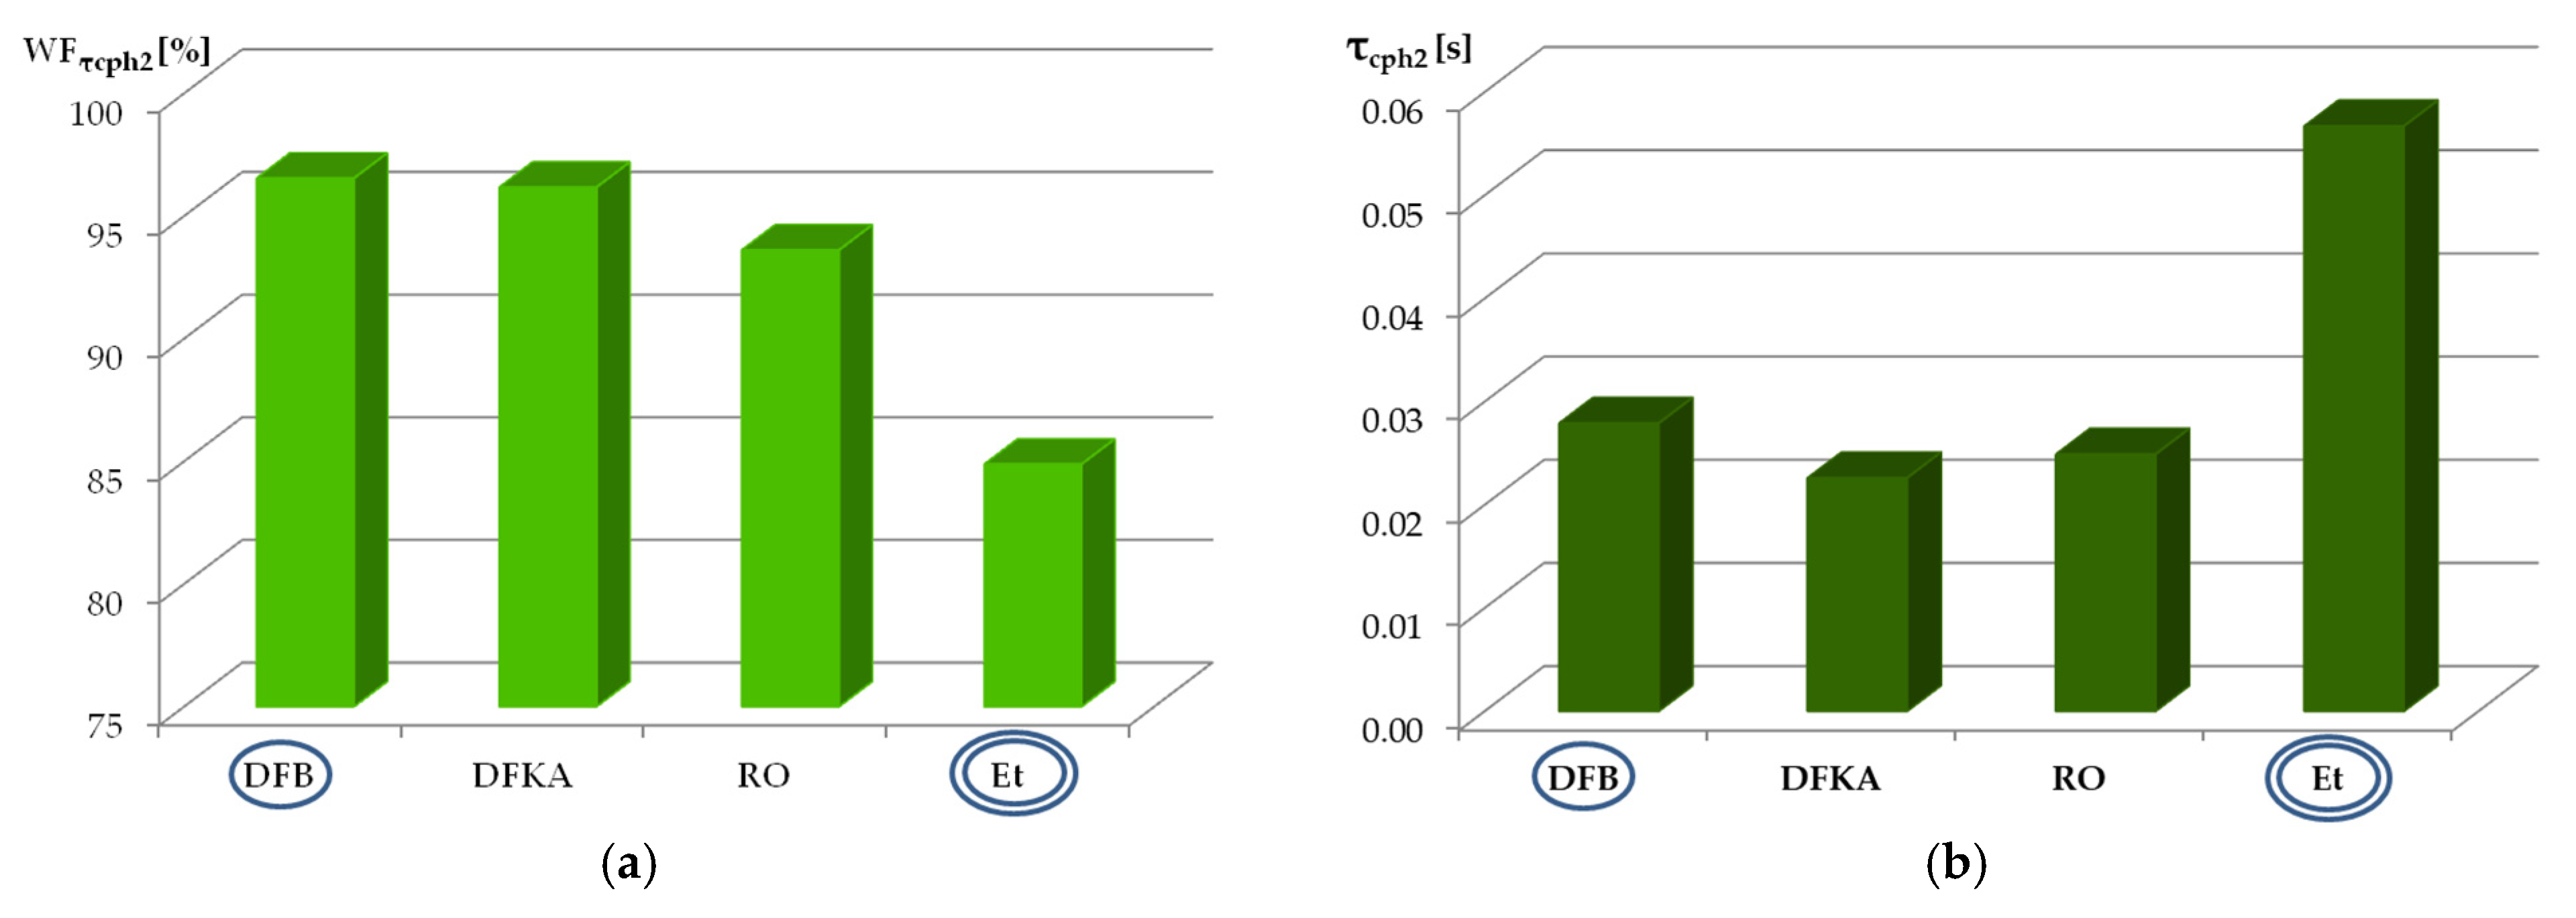
It can be clearly seen that the largest share of the total delay of self-ignition for diesel oil (DFB and DFKA) is taken up by the second physical part (τcph2), which involves fuel evaporation—about 96% of the entire τc time. In comparison to the time taken for τcph2, the time needed to bring a drop of fuel to the boiling point is much shorter—about 2.8% of the total for DFB fuel. On the other hand, the second chemical phase of self-ignition delay for this fuel takes about 0.5% of the total (τc), while the duration for τcch1 represents less than 0.1%. The proportions for the individual phases of self-ignition delay would be different in the cases of other fuels, e.g., the alternative fuels mentioned earlier: crude vegetable oil and ethyl alcohol.
For example, for crude vegetable oil, the relative length of the first physical phase of self-ignition delay (τcph1) would be extended due to the higher boiling point of this fuel compared with diesel fuel. The second physical phase of self-ignition delay (τcph2), which starts from the moment the fuel drop reaches boiling point and ends when the first indications of a cold flame appear, may be longer or shorter for crude vegetable oil compared with conventional diesel oil, depending on the adopted diameter and ambient temperature of the drops of these fuels. Both the first and second chemical parts of self-ignition delay (τcch1 and τcch2) for rapeseed oil, sunflower oil, and so on, will also be longer than for DFB, due to the higher activation energy and latent heat of vaporization of these fuels. In the case of ethanol, a fuel with a negligible CN value, the share of the four analyzed components of the self-ignition delay will be different than for fuels intended for diesel engines, as shown in Figure 12.
The first physical part of self-ignition delay would be slightly shorter than in the case of diesel fuel, due to the much lower boiling point of ethanol. This would also lead to a smaller contribution of this phase to the total self-ignition delay (compared with diesel fuel). The second physical part of self-ignition delay for ethyl alcohol would be significantly longer (more than twice as long) compared with the τcph2 for diesel fuel, due to its higher heat of vaporization, higher self-ignition temperature, and higher activation energy. However, despite the fact that the duration of this phase (τcph2) would be greater in the case of ethanol, its share in the total self-ignition delay would be lower than for the compared fuels (only about 85%). The first chemical phase of self-ignition delay for ethyl alcohol would also be significantly longer than in the case of diesel oil, which can also be explained by the much higher activation energy for this fuel, but the proportion it takes up of the total self-ignition delay time remains marginal. The second chemical part of self-ignition delay would be many times longer in the case of ethanol (compared with fuels typical for diesel engines), due again to the significantly higher activation energy of this fuel, which means that its relative length in the total self-ignition delay would be significant, at approximately 14.5%.
However, it should be clearly emphasized that a decrease in the proportion of any of the phases of self-ignition delay (WFτi) between fuels (e.g., the second physical part of τc time when comparing diesel fuel and ethanol) does not mean that the duration of the phase itself is shorter. Confirmation of this is given in Figure 13a,b.

3. Experimental Studies Verifying the Results of the Fuel Auto-Ignition Delay Modelling

3.1. Methodology and Measuring Stand

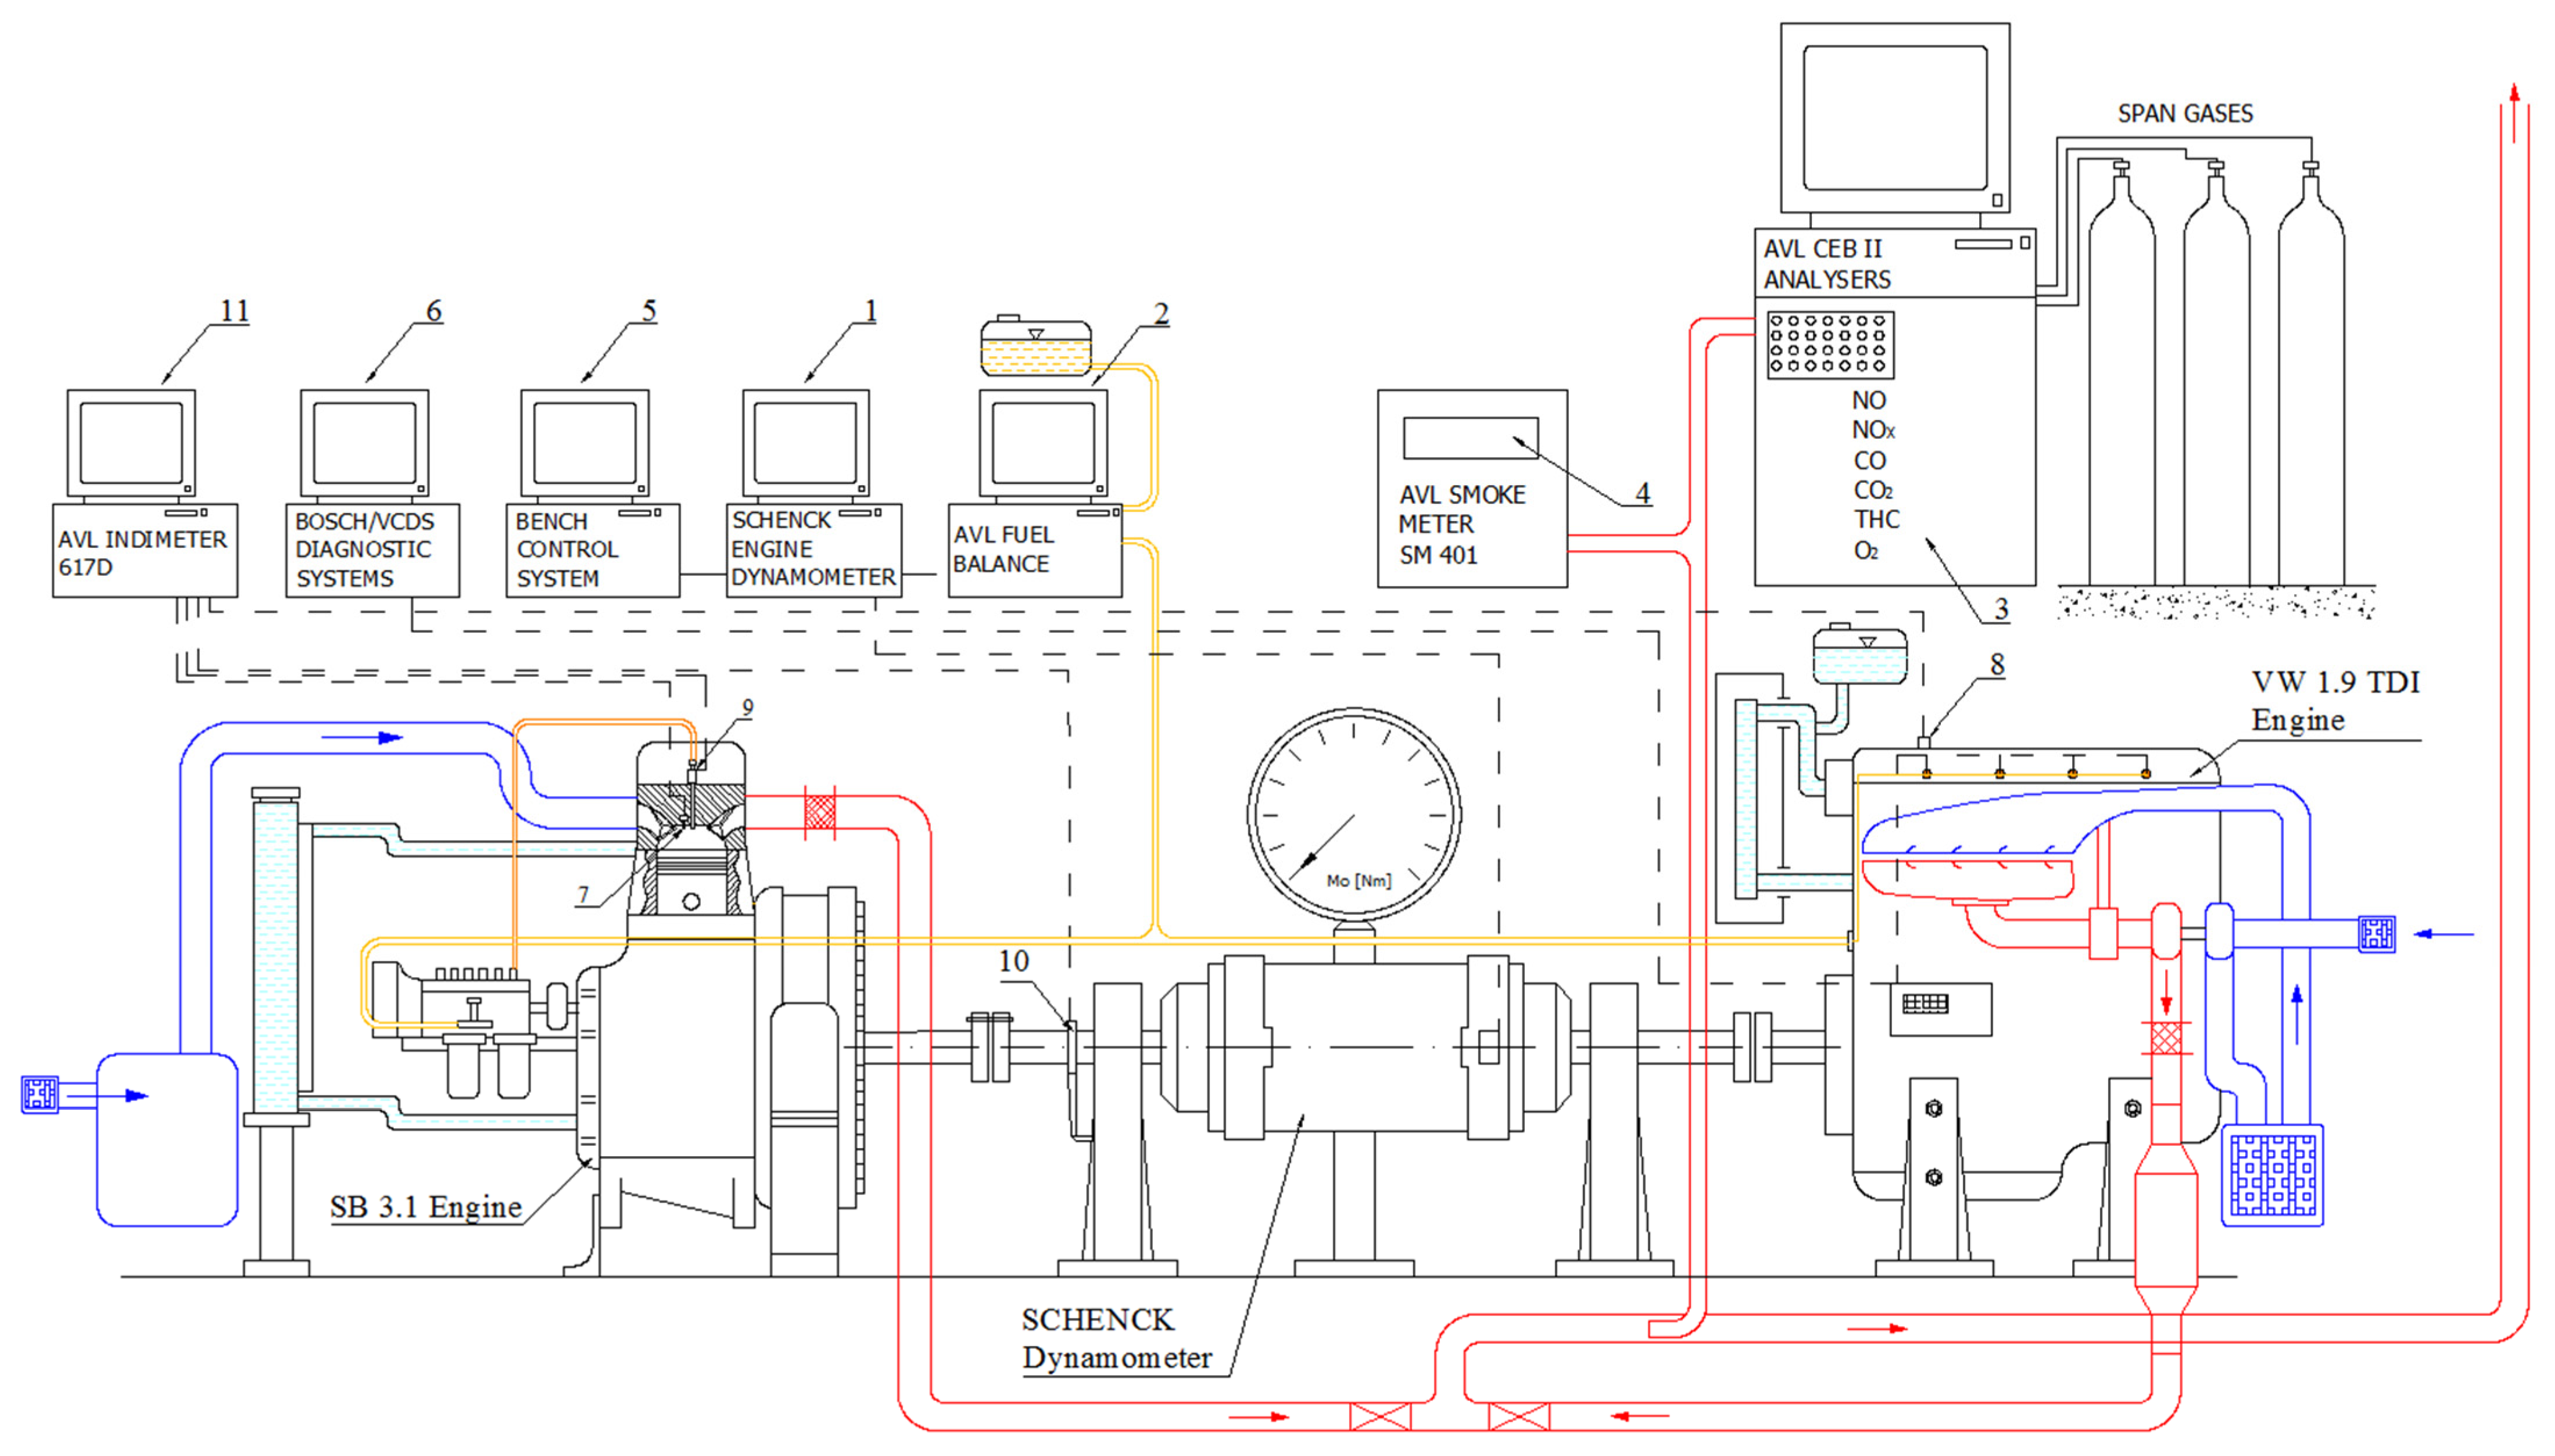
The experimental part of the research was carried out in one of the internal combustion engine laboratories of the Cracow University of Technology. A diagram of the measuring stand used is shown in Figure 14. A detailed description of the measurement modules has been included in the authors’ earlier articles [45,46]. The essential elements of this stand are, of course, the two diesel engines used in the tests: a research, single-cylinder, undercharged SB 3.1 engine equipped with an injection pump (intentionally an older generation engine); and a serial, four-cylinder, turbocharged VW 1.9 TDI engine with high-pressure fuel injection and the fuel dose split into parts. The technical characteristics of these engines are listed in Table 2.
These two engines were connected interchangeably to a Schenck eddy current engine dynamometer (see Figure 14), regulated by a controller (1), with an AVL fuel balance for measuring the dynamic fuel consumption (2). The exhaust outlet of both engines was connected to an AVL bench emission system (3) for measuring the gaseous components of the exhaust gases, and an AVL Smoke Meter SM 401 (4). The control parameters of both engines (air temperature before/after: compressor, intercooler, EGR, exhaust gas temperature before/after: turbine, OXY CAT, DPF, etc.) were measured using the bench control system (5). The diagnostic parameters of the VW 1.9 TDI engine were measured using Bosch/VCDS systems (6). Both engines were equipped with a measurement system from AVL, which allowed for the measurement and analysis of fast-changing pressure courses in the cylinder as a function of the angle of rotation of the crankshaft. The measurement system consisted of piezoelectric sensors (7, 8) for the working medium pressure, an inductive sensor (9) for the injector needle displacement (research engine SB 3.1), a crank angle encoder (10), and an AVL Indimeter 617D measuring system (11). This measurement path allowed for the analysis of open indicator diagrams (the course of the pressure of the working medium in the engine cylinder as a function of the angle of rotation of the crankshaft), enriched with a diagram of the displacement of the injector needle.
In the case of the test SB 3.1 engine, it was assumed that the start of fuel injection (αsi) was the same as the beginning of the injector needle lift (for any given operating point of this engine). This was all the more justified because both the tested fuels (DFB and DFKA) had the same kinematic viscosity, and thus the adopted method of determining the start of the injection for both fuels was subject to the same error. The beginning of the self-ignition (αsc) of the fuel was determined, on the basis of an open indicator diagram, as the angular position of the engine crankshaft in relation to the TDC of the piston at which a rapid increase in the pressure of the working medium occurs (the effect of fuel self-ignition). Since each internal combustion piston engine is characterized by a certain natural uniqueness in its subsequent work cycles (at the same engine speed and load), in order to obtain and analyze a statistically representative pc(α) run, one hundred engine work cycles were averaged, and an open indicator graph only was used to determine the beginning of self-ignition for each of the tested fuels. The measured self-ignition delay (τc) was defined as the angular distance between the start of injection and the start of self-ignition of the tested fuel. In the case of the serial VW 1.9 TDI engine, it was not possible to use exactly the same methodology for measuring the self-ignition delay, because in this engine it is not easy to mount an inductive transducer for the fuel atomizer needle displacement (among other things, due to the construction of the unit injectors). For this reason, it was assumed that the start of fuel injection was the same as the beginning of the increase in value of the signal controlling this unit injector. Since the main goal of the authors was not to determine the absolute value of the fuel injection start point (and self-ignition delay), but rather to determine the relative (percentage) difference between the self-ignition delay of the tested fuels, the error involved in the method of determining αsi did not affect the relative percentage difference of τc for both the tested fuels. The start of the rise in the signal controlling the opening of the unit injector (taken as the start of fuel injection) was measured and read using the VCDS diagnostic measurement system (6) connected to the OBD diagnostic socket of the VW 1.9 TDI engine.

3.2. Results of the Engine Tests of Auto-Ignition Delay for the Used Fuels

In line with the method described in Section 3.1, the self-ignition delay (τc) for the base fuel (DFB) and the fuel with the increased cetane number (DFKA) was measured using two engines: the research single-cylinder SB 3.1 engine and the serial VW 1.9 TDI engine. For both engines, τc was determined at the rotational speed of the maximum engine torque (1600 rpm for the SB 3.1 engine and 2000 rpm for the VW 1.9 TDI engine), with a load torque at 60% of maximum. The results of these tests for DFB and DFKA fuels for the single-cylinder SB 3.1 engine (older generation) are shown in Figure 15a, while the self-ignition delay for these fuels when supplying the VW 1.9 TDI engine is shown in Figure 15b.
The data in Figure 15a,b show that the DFKA fuel (with an increased cetane number) was obviously characterized by a shorter self-ignition delay than the base fuel (DFB), in both the engines used. Moreover, it can be seen that the self-ignition delay for both fuels is significantly shorter in the case of the more modern engine design. This relates to the observable tendency in the world for several decades now for newer generation diesel engines to be characterized by an increasingly shorter fuel self-ignition delay, as this leads to a reduction in the emission of nitrogen oxides in exhaust gases. This is achieved by design, engine regulation and, of course, fuel methods.
As mentioned earlier, the self-ignition delay (τc sum) resulting from the modeling calculations is expressed as a unit of time, i.e., in milliseconds, whereas the self-ignition delay determined in the engine tests is obviously expressed in terms of degrees of rotation of the engine crankshaft. Due to the variability of the angular velocity (ω) of the engine crankshaft as a function of the rotation angle (α) of this shaft (e.g., the difference between the instantaneous value of ω for the compression stroke and the instantaneous value of ω for the expansion stroke), it is not possible to convert τc (deg) accurately from the motor measurements to τc sum (ms) from the modeling. For this reason, the τc value from the engine measurements for DFB and DFKA fuels was used to calculate the percentage difference (Δτc) in self-ignition delay for these fuels for both of the engines used in the tests. This is shown in Figure 16.
The data contained in the above figure show that the differences in the values of the self-ignition delay (obtained from the measurements) for the DFB and DFKA fuels for both engines are similar, amounting to 20.9% for the SB 3.1 engine (older generation) and 18.8% for the VW 1.9 TDI engine.
To determine the compliance of the calculations with the engine measurements, the percentage difference (Δτc) of the values for the DFB and DFKA fuels calculated from the model, along with the percentage difference (Δτc) between these fuels from the engine measurements, were used, as shown in Figure 17.
It can be assumed that, in the case of using such a simplified computational model (modeling the self-ignition delay of a single, representative drop of fuel, and not the atomization spectrum itself), the obtained comparison from the engine (experimental) tests is satisfactory. In connection with this, the final statement of this publication is the conclusion that the adopted method of modeling the self-ignition delay can be used in the initial considerations for the selection of a new type of fuel or fuel additives, in order to determine their impact on the self-ignition delay in the real conditions that prevail in the cylinder of a diesel engine.

4. Summary and Conclusions

The modeling of the self-ignition delay of single droplets of the various fuels and the laboratory tests carried out allow the following conclusions to be drawn.
  • The modeling of the difference in self-ignition delay (Δτc sum) of single drops of two hydrocarbon fuels (with different cetane numbers) is consistent with actual engine measurements, in a way sufficient for practical analysis of the τc of different fuels.
  • DFKA fuel with an increased cetane number shortens the second physical and the first and second chemical stages relative to DFB fuel, leading to a significant, beneficial shortening of the total delay of self-ignition.
  • The character of the function τc (T, Dd) is the same for all the analyzed fuels.
  • The total self-ignition delay (τc sum) decreases for all the analyzed liquid fuels with an increase in the ambient temperature of the droplet and a decrease in the equivalent diameter of the fuel droplet.
  • The largest share in the total delay of self-ignition (τc) for all the modeled liquid fuels is taken by the second physical phase (τcph2)—the process of fuel evaporation.
  • Both the physical parts of self-ignition delay (τcphi) depend on both the diameter and the ambient temperature of the fuel droplet. As the temperature increases and the diameter of the fuel droplet decreases, the time (τcphi) decreases.
  • Both the chemical parts of self-ignition delay (τcchi) depend only on the ambient temperature of the fuel droplet (they do not depend on the diameter of the droplet). As the temperature increases, the time (τcchi) also decreases,
  • In the case of using two different fuels, a decrease in the percentage share of any phase of the self-ignition delay (WFτi) does not necessarily mean that the time (τci) of this phase is shortened. An example is the WFτcph2 and τcph2 values for diesel fuel and ethanol.
  • The self-ignition delay for a mixture of two fuels does not have to be the arithmetic mean of the delay of each of these fuels (an example is a mixture of diesel oil and ethanol).
  • The difference in self-ignition delay (τc sum) for two different fuels need not be a constant value. Under some conditions of temperature and fuel droplet diameter, τc sum may be longer for the base fuel, whereas under other conditions τc sum will be shorter for this fuel compared with the second analyzed fuel. A typical example of this is the comparison of the total self-ignition delay for diesel oil and crude vegetable oil: with low ambient temperatures and large droplets, crude rapeseed oil shows a greater self-ignition delay than diesel oil, but at higher ambient temperatures (occurring at medium and high engine speeds and loads), rapeseed oil drops have a lower self-ignition delay compared with diesel oil.

Author Contributions

Conceptualization, J.C. and S.L.; data curation, J.C.; formal analysis, J.C. and S.L.; funding acquisition, J.C.; investigation, J.C. and S.L.; methodology, J.C.; project administration, J.C.; Resources, J.C; supervision, J.C. and S.L.; validation, J.C.; writing—original draft, J.C. and S.L.; writing—review & editing, J.C. and S.L. All authors have read and agreed to the published version of the manuscript.

Funding

This research received no external funding.

Institutional Review Board Statement

Not applicable.

Informed Consent Statement

Not applicable.

Data Availability Statement

Research data is available at the Cracow University of Technology.

Conflicts of Interest

The authors declare no conflict of interest.

Nomenclature

τcself-ignition delay (engine test), [s]
αsistart of fuel injection, [deg a. TDC]
αscstart of fuel combustion, [deg a. TDC]
τcphthe physical part of the self-ignition delay (modeling), [s]
τcchthe chemical part of the self-ignition delay (modeling), [s]
τc sumself-ignition delay (modeling), [s]
τcph1fuel droplet heating time, [s]
τcph2evaporation time, [s]
τcch1time to the appearance of a low-temperature flame, [s]
τcch2time to the formation of an explosive flame, [s]
tforiginal temperature of droplet, [°C]
tvboiling point, [°C]
Q1amount of heat delivered to the surface of the fuel droplet, [J]
Qtkheat used to raise the temperature of the droplet, [J]
Qpheat needed to vaporize the fuel, [J]
τtime, [s]
tdrop temperature, [°C]
tambient temperature of the drop, [°C]
αthermal conductivity of the droplet, [W/m2.°C]
Llatent heat of vaporization, [J/kg]
m f evaporation rate, [kg/s]
ρffuel density, [kg/m3]
cfspecific heat of the fuel, [J/kg · °C]
ddroplet diameter, [m]
λmthermal conductivity in the mixture, [W/m · °C]
GrGrashof number, [-]
ggravitational acceleration, [m/s2]
βmcoefficient of volumetric expansion of the mixture, [1/°C]
νmcoefficient of kinematic expansion of the mixture, [m2/s]
PrPrandtl number, [-]
μmviscosity coefficient of the mixture, [Pa · s]
ρmmixture density, [kg/m3]
Ddiffusion coefficient, [m2/s]
ωwvapor concentration on the surface of the drop, [kg/kg]
ωvapor concentration around the droplet, [kg/kg]
ScSchmidt number = νm/D, [-]
Q2heat absorbed by the air mixture, [J]
Qtmheat needed to raise the temperature of the mixture, [J]
Qdheat received from the mixture due to mass transfer (diffusion), [J]
dmdiameter of the mixture area, [m]
αmheat conductivity coefficient of the mixture, [W/m2.°C]
cmspecific heat of the mixture at constant pressure, [J/kg · °C]
τcphphysical delay of auto-ignition, [s]
ppressure, [Pa]
Eactivation energy (minimum energy required for a chemical reaction), [J/kmol]
Rgas constant = 6.28, [J/kmol]
Tambient temperature of the drop, [°C, K]
DFBdiesel fuel (base)
DFKAdiesel fuel with kinetic additive
ROrapeseed oil
Etethyl alcohol (ethanol)
CNcetane number, [-]
WFτweighting factor for auto-ignition delay, [%]
TDCtop dead center of a piston
LDVlight duty vehicles
HDVheavy duty vehicles

References

  1. Hill, L. Global trends in emissions legislation. In Proceedings of the VIII PTNSS International Congress on Combustion Engines, Krakow, Poland, 17–19 June 2019. [Google Scholar]
  2. Bielaczyc, P. Global trends in vehicular emissions regulations, current “hot topics” and their impact on powertrain technology—Introduction to the subject. In Proceedings of the VIII International PTNSS Congress on Combustion Engines, Krakow, Poland, 17–19 June 2019. [Google Scholar]
  3. Joshi, A. Overview of technologies for near-zero tailpipe emissions from light- and heavy-duty vehicles. In Proceedings of the VIII PTNSS International Congress on Combustion Engines, Krakow, Poland, 17–19 June 2019. [Google Scholar]
  4. Merkisz, J. Development trends in road transport powertrains. In Proceedings of the VIII PTNSS International Congress on Combustion Engines, Krakow, Poland, 17–19 June 2019. [Google Scholar]
  5. Engeljehringer, K. LD vehicle emission challenge from legislation to testbed. In Proceedings of the VIII PTNSS International Congress on Combustion Engines, Krakow, Poland, 17–19 June 2019. [Google Scholar]
  6. Bielaczyc, P.; Woodburn, J. Global trends in vehicular emissions legislation with a special focus on further stages (EU 7/VII and China 7/VII)—Associated development of ICE/hybrid/EV powertrain technologies and testing methodologies for LD, HD and NRMM sectors. In Proceedings of the IX International PTNSS Congress on Combustion Engines, Lublin, Poland, 27–28 June 2021. [Google Scholar]
  7. Neugebauer, S. Technological scenarios for the decarbonization of road transport. In Proceedings of the 30th International AVL Conference “Engine & Environment”, Graz, Austria, 7–8 June 2018. [Google Scholar]
  8. Winkler, S.L.; Anderson, J.E.; Garza, L. Vehicle criteria pollutant (PM, NOx, CO, HCs) emissions: How low should we go? npj Clim. Atmos Sci. 2018, 1, 26. [Google Scholar] [CrossRef] [Green Version]
  9. Bielaczyc, P. Global development of emissions reduction strategies from light duty vehicles. IOP Conf. Ser. Earth Environ. Sci. 2019, 214, 12139. [Google Scholar] [CrossRef]
  10. Heywood, J.B. Internal Combustion Engines Fundamentals; McCraw-Hill Book Co.: New York, NY, USA, 1988. [Google Scholar]
  11. Kolakoti, A.; Rao, B. A Comprehensive Review of Biodiesel Application in IDI Engines with Property Improving Additives. i-manager’s J. Mech. Eng. 2015, 5, 35–45. [Google Scholar] [CrossRef]
  12. Datta, A.; Mandal, B. A comprehensive review of biodiesel as an alternative fuel for compression ignition engine. Renew. Sustain. Energy Rev. 2016, 57, 799–821. [Google Scholar] [CrossRef]
  13. Damanik, N.; Ong, H.C.; Tong, C.W.; Mahlia, T.M.I.; Silitonga, A.S. A review on the engine performance and exhaust emission characteristics of diesel engines fueled with biodiesel blends. Environ. Sci. Pollut. Res. 2018, 25, 15307–15325. [Google Scholar] [CrossRef] [PubMed]
  14. Ashok, B.; Nanthagopal, K.; Jeevanantham, A.; Bhowmick, P.; Malhotra, D.; Agarwal, P. An assessment of calophyllum inophyllum biodiesel fuelled diesel engine characteristics using novel antioxidant additives. Energy Convers. Manag. 2017, 148, 935–943. [Google Scholar] [CrossRef]
  15. Ashok, B.; Nanthagopal, K.; Subbarao, R.; Johny, A.; Mohan, A.; Tamilarasu, A. Experimental studies on the effect of metal oxide and antioxidant additives with Calophyllum Inophyllum Methyl ester in compression ignition engine. J. Clean. Prod. 2017, 166, 474–484. [Google Scholar] [CrossRef]
  16. Pisac, C. An Experimental Study of Combustion Characteristics of Fatty Acid Methyl Ester Biodiesel. Ph.D. Dissertation, University of Hertfordshire, Hertfordshire, UK, 2014. [Google Scholar]
  17. Kale, P.; Ragit, S. An Overview of Ignition Delay and Combustion of Biodiesel Fuelled in CI Engine. In Proceedings of the International Conference On Emanations in Modern Technology and Engineering (ICEMTE-2017), Mumbai, India, 4–5 March 2017. [Google Scholar]
  18. Subramaniam, D.; Murugesan, A.; Avinash, A.; Kumaravel, A. Bio-diesel production and its engine characteristics—An expatiate view. Renew. Sustain. Energy Rev. 2013, 22, 361–370. [Google Scholar] [CrossRef]
  19. Yasin, M.M.; Yusaf, T.; Mamat, R.; Yusop, A.F. Characterization of a diesel engine operating with a small proportion of methanol as a fuel additive in biodiesel blend. Appl. Energy 2014, 114, 865–873. [Google Scholar] [CrossRef]
  20. Ong, H.; Mahlia, T.; Masjuki, H.; Norhasyima, R. Comparison of palm oil, Jatropha curcas and Calophyllum inophyllum for biodiesel: A review. Renew. Sustain. Energy Rev. 2011, 15, 3501–3515. [Google Scholar] [CrossRef]
  21. Ong, H.C.; Masjuki, H.; Mahlia, T.; Silitonga, A.; Chong, W.; Leong, K. Optimization of biodiesel production and engine performance from high free fatty acid Calophyllum inophyllum oil in CI diesel engine. Energy Convers. Manag. 2014, 81, 30–40. [Google Scholar] [CrossRef]
  22. Pirouzfar, V.; Fayyazbakhsh, A. Diesel Fuel Additives; ECOpoint Inc.: St. Rifle, CO, USA, 2016. [Google Scholar]
  23. Li, H.; Lea-Langton, A.; Biller, P.; Andrews, G.E.; Hadavi, S.; Charlton, A.; Richards, P. Effect of Multifunctional Fuel Additive Package on Fuel Injector Deposit, Combustion and Emissions using Pure Rape Seed Oil for a DI Diesel. SAE Int. J. Fuels Lubr. 2009, 2, 54–65. [Google Scholar] [CrossRef]
  24. Imtenan, S.; Varman, M.; Masjuki, H.; Kalam, M.; Sajjad, H.; Arbab, M.; Fattah, I.R. Impact of low temperature combustion attaining strategies on diesel engine emissions for diesel and biodiesels: A review. Energy Convers. Manag. 2014, 80, 329–356. [Google Scholar] [CrossRef]
  25. Imtenan, S.; Masjuki, H.; Varman, M.; Fattah, I.R.; Sajjad, H.; Arbab, M. Effect of n-butanol and diethyl ether as oxygenated additives on combustion–emission-performance characteristics of a multiple cylinder diesel engine fuelled with diesel–jatropha biodiesel blend. Energy Convers. Manag. 2015, 94, 84–94. [Google Scholar] [CrossRef] [Green Version]
  26. Atabani, A.; Silitonga, A.; Ong, H.; Mahlia, T.; Masjuki, H.; Badruddin, I.A.; Fayaz, H. Non-edible vegetable oils: A critical evaluation of oil extraction, fatty acid compositions, biodiesel production, characteristics, engine performance and emissions production. Renew. Sustain. Energy Rev. 2013, 18, 211–245. [Google Scholar] [CrossRef]
  27. Kawre, P.; Chaudhary, R.; Badholiya, S. Optimization of pme biodiesel and ethanol blended fuel to reduce co emission in diesel engine. Int. J. Eng. Sci. Res. Technol. 2018, 7, 155–173. [Google Scholar]
  28. Hoseini, S.S.; Najafi, G.; Ghobadian, B.; Mamat, R.; Sidik, N.A.C.; Azmi, W.H. The effect of combustion management on diesel engine emissions fueled with biodiesel-diesel blends. Renew. Sustain. Energy Rev. 2017, 73, 307–331. [Google Scholar] [CrossRef] [Green Version]
  29. Kumar, M.V.; Babu, A.V.; Kumar, P.R. The impacts on combustion, performance and emissions of biodiesel by using additives in direct injection diesel engine. Alex. Eng. J. 2017, 57, 509–516. [Google Scholar] [CrossRef]
  30. Raman, R.; Kumar, N. The utilization of n-butanol/diesel blends in Acetylene Dual Fuel Engine. Energy Rep. 2019, 5, 1030–1040. [Google Scholar] [CrossRef]
  31. Araya, K.; Yoshida, T. Analysis of ignitability under Low Temperature of Diesel Engines Using Sunflower Oil as a Renewable Fuel (Part 2). Ignition Lag of Injected Fuel Particles. J. Jpn. Soc. Agric. Mach. 1985, 47, 429–434. [Google Scholar]
  32. Tanazawa, S. Diesel Engines I; Sankaido Co.: Tokyo, Japan, 1956. [Google Scholar]
  33. Sitokei, G. Kraft Stoffaufbereitung und Verbrennung bei Dieselmotoren; Springer: Berlin, German, 1964. [Google Scholar]
  34. Obata, T. Fuels for Internal Combustion Engines; Yokendo Co.: Tokyo, Japan, 1966. [Google Scholar]
  35. Araya, K.; Tsunematsu, S. Single Droplet Combustion of Sunflower Oil; SAE-Papar 870590; SAE International: Warrendale, PA, USA, 1987. [Google Scholar]
  36. Koto, Y. Theory of Heat Transfer; Yokendo Co.: Tokyo, Japan, 1964. [Google Scholar]
  37. Kowalewicz, A. Podstawy Procesów Spalania; Wydawnictwa Naukowo-Techniczne: Warszawa, Poland, 2000. [Google Scholar]
  38. Cisek, J. Wpływ Oleju Rzepakowego i Jego Mieszanin z Olejem Napędowym na Własności Silnika Wysokoprężnego. Ph.D. Thesis, Politechnika Krakowska, Kraków Polska, 1998. [Google Scholar]
  39. Lu, G.-B.; Yang, T.; Chen, L.-P.; Zhou, Y.-S.; Chen, W.-H. Thermal decomposition kinetics of 2-ethylhexyl nitrate under non-isothermal and isothermal conditions. J. Therm. Anal. Calorim. 2016, 124, 471–478. [Google Scholar] [CrossRef]
  40. Bornemann, H.; Scheidt, F.; Sander, W. Thermal decomposition of 2-ethylhexyl nitrate (2-EHN). Int. J. Chem. Kinet. 2002, 34, 34–38. [Google Scholar] [CrossRef]
  41. Almodovar, C.A.; Goldsmith, C.F. Laser schlieren study of the thermal decomposition of 2-ethylhexyl-nitrate. Proc. Combust. Inst. 2021, 38, 997–1005. [Google Scholar] [CrossRef]
  42. Kusy, P. Transestryfication of Vegetable Oils for Fuels. In Proceedings of the ASAE International Conference, Fargo, North Dakota, 2–4 August 1982. [Google Scholar]
  43. Tahir, A.R. Sunflower Oil as a Fuel for Compression Ignition Engines. Master’s Thesis, University of Manitoba, Winnipeg, MB, Canada, 1982. [Google Scholar]
  44. Cisek, J.; Borowski, A. Sposób Zmniejszania Stężenia I Emisji Tlenków Azotu w Spalinach Silnika o Zapłonie Samoczynnym; Zgłoszenie nr. P.443866; Urząd Patentowy Rzeczpospolitej Polskiej: Warszawa, Polska, 2023. [Google Scholar]
  45. Cisek, J.; Lesniak, S.; Stanik, W.; Przybylski, W. The Synergy of Two Biofuel Additives on Combustion Process to Simultaneously Reduce NOx and PM Emissions. Energies 2021, 14, 2784. [Google Scholar] [CrossRef]
  46. Cisek, J.; Leśniak, S.; Borowski, A.; Przybylski, W.; Mokretskyy, V. Visualisation and Thermovision of Fuel Combustion Affecting Heat Release to Reduce NOx and PM Diesel Engine Emissions. Energies 2022, 15, 4882. [Google Scholar] [CrossRef]
Figure 1. Scheme of the causes of NOx formation in the cylinder of a diesel engine.
Energies 16 05273 g001
Figure 2. Scheme of influence of the fuel cetane number on the course of processes in the diesel engine cylinder.
Energies 16 05273 g002
Figure 3. (a) Physical self-ignition delay (τcph1) for DFB fuel. (b). Physical self-ignition delay (τcph1) for DFKA fuel.
Energies 16 05273 g003
Figure 4. (a). Physical self-ignition delay (τcph2) for DFB fuel. (b). Physical self-ignition delay (τcph2) for DFKA fuel.
Energies 16 05273 g004
Figure 5. Difference in the physical delay (Δτcph2) of auto-ignition between DFB and DFKA fuel.
Energies 16 05273 g005
Figure 6. (a). Chemical self-ignition delay (τcch1) for DFB fuel. (b). Chemical self-ignition delay (τcch1) for DFKA fuel.
Energies 16 05273 g006
Figure 7. Difference in chemical delay (Δτcch1) of self-ignition between DFB and DFKA fuel.
Energies 16 05273 g007
Figure 8. (a). Chemical self-ignition delay (τcch2) for DFB fuel. (b). Chemical self-ignition delay (τcch2) for DFKA fuel.
Energies 16 05273 g008
Figure 9. Difference in chemical delay (Δτcch2) of self-ignition between DFB and DFKA fuel.
Energies 16 05273 g009
Figure 10. (a). Total self-ignition delay (τc sum) for DFB fuel. (b). Total self-ignition delay (τc sum) for DFKA fuel.
Energies 16 05273 g010
Figure 11. Difference in total self-ignition delay (Δτc sum) between DFB and DFKA fuel.
Energies 16 05273 g011
Figure 12. Calculated phases of self-ignition delay (τc sum) for the analyzed fuels.
Energies 16 05273 g012
Figure 13. (a). Weighting factor for the second physical phase of self-ignition delay (WFτcph2) for the analyzed fuels. (b). Calculated duration of the second physical phase of self-ignition delay (τcph2) for the analyzed fuels.
Energies 16 05273 g013
Figure 14. Scheme of the measuring stand.
Energies 16 05273 g014
Figure 15. (a). Measured self-ignition delay (τc) for DFB and DFKA fuels (SB 3.1 engine). (b). Measured self-ignition delay (τc) for DFB and DFKA fuels (VW 1.9 TDI engine).
Energies 16 05273 g015
Figure 16. Percentage difference in τc between tested fuels for the SB 3.1 and VW 1.9 TDI engines.
Energies 16 05273 g016
Figure 17. Percentage difference in self-ignition delay between DFB and DFKA fuels for calculations (Δτc sum) with Δτc values from engine measurements (purple lines).
Energies 16 05273 g017
Table 2. Technical parameters of diesel engines used.
Engine TypeSB 3.1 (Research Engine)VW 1.9 TDI (Serial Engine)
Parameter
combustion systemdirect fuel injection to open combustion chamber in pistondirect fuel injection to open combustion chamber in piston
fuel supply systempiston injection pumpunit injectors
injectorhydraulicelectromagnetic
sprayer4-hole, φ = 0.35 mm5-hole, φ = 0.20 mm
max. fuel injection pressure95 MPa200 Mpa
air supply systemundercharged turbocharged with intercooler
displacement1850 cm31896 cm3
number of cylinders14
piston diameter127.0 mm79.5 mm
piston stroke146.0 mm95.5 mm
compression ratio15.7518.00
rated power23 kW85 kW
engine speed at max. power2200 rpm4000 rpm
maximum engine torque110 Nm285 Nm
engine speed at max. torque1600 rpm1900 rpm
Disclaimer/Publisher’s Note: The statements, opinions and data contained in all publications are solely those of the individual author(s) and contributor(s) and not of MDPI and/or the editor(s). MDPI and/or the editor(s) disclaim responsibility for any injury to people or property resulting from any ideas, methods, instructions or products referred to in the content.