Article

Synergy between Photovoltaic Panels and Green Roofs

by
Fernando Alonso-Marroquin
* and
Ghulam Qadir
*
School of Civil Engineering, The University of Sydney, Sydney, NSW 2006, Australia
*
Authors to whom correspondence should be addressed.
Energies 2023, 16(13), 5184; https://doi.org/10.3390/en16135184
Submission received: 31 May 2023 / Revised: 27 June 2023 / Accepted: 3 July 2023 / Published: 5 July 2023
(This article belongs to the Special Issue Forecasting, Modeling, and Optimization of Photovoltaic Systems)

Abstract

:
To reduce the impact of climate change in the form of low-carbon developments, innovations in sustainable building strategies are imperative. In this regard, the performance of a double-roof house consisting of a photovoltaic panel roof (PV) and green roof (GR) was compared to traditional solar-roof buildings. The synergy between both the PV and GR systems was analysed by numerical simulations and physical modelling across the four seasons. The performance of the systems was assessed on three dimensions: indoor thermal comfort, photovoltaic temperature, and energy yield. The synergy of photovoltaic roofs with green roofs kept the indoor environment 6% more comfortable than solar roofs. The synergy also reduced the photovoltaic temperature by up to 8 °C, extending the PV life span and increasing the energy yield by 18%.

1. Introduction

The historic growth of solar-energy generation through photovoltaic (PV) panels from the start until today has been considerable. Solar-panel research and development has achieved many milestones, including installing PV panels on rooftops as an environmentally friendly alternative for energy production [1]. A building roof with PVs converting solar radiation into electricity is known as a PV roof. A PV roof has panels installed either alone or in the form of building-integrated photovoltaics (BIPV) [2]. PV roof panels can not only generate electricity but also serve as an envelope layer for construction [3]. Other multi-functions of PV roofs include thermal insulation, noise prevention, weatherproofing, and offsetting the system’s initial costs [4]. Along with many advantages, it has issues in operation, e.g., the continuous absorption of solar radiation raises the panel temperature. For better PV efficiency it is important to mitigate this temperature rise. With every 1 °C rise in temperature, the conversion efficiency can decrease by 0.4–0.65% [5,6]. This increase in the surface temperature of solar panels expands to the roof beneath the panels and it also causes an increase in the indoor temperature of the building [3]. There are different ways to mitigate this temperature; one way is through plantation beneath the panels in the form of a green roof (GR).
GR refers to a roof covered with a waterproof membrane, soil, and plants or trees suitable for the local climate [7]. In the literature, generally, the GR was categorized as either extensive or intensive [8]. An extensive GR is composed of a very thin layer of soil, requiring minimum maintenance, whereas an intensive GR usually has a 20 cm thick soil layer, supporting a variety of plants [9]. Generally, the three main components of a GR are the canopy/leaf cover, soil, and structural support/roof [10]. GR has many advantages: Urban temperature improvements in street canyons [11] and decreasing the urban heat island effect (UHI) [12] can be achieved through GR; GR can work as a passive cooler. In the case of high external temperatures, not only is the entering heat flux cancelled, but also a slight outgoing flux is produced due to the cooling effect of evapotranspiration [13]. Extensive GR has shown a high potential to decrease stormwater flow rate [14]. To create high urban resilience, a better understanding of GR retrofit is important [15]. However, GR retrofit potential in commercial buildings needs to be studied [16]. The combination of GR with other passive or renewable technologies can make the buildings more energy efficient, e.g., photovoltaic green roof (PV-GR).
This combination of a photovoltaic panel with plants on a rooftop below the panel makes a (PV-GR). This is a symbiosis between a green roof and renewable energy, also called a bio-solar roof [17]. Agrivoltaic systems on rooftops such as PV-GR are a good example to integrate crop production and PV power generation, offering a potential solution to the land economy problem. The GR vegetation increases evapotranspiration (ET) [18,19] and reduces the roof temperature in the surrounding area [19,20,21,22]. This results in the cooling of the PV surface and maximizes its power output because the increase in PV surface temperature adversely affects its performance efficiency [23,24]. Due to CO2 emission reductions, and the potential to increase energy and food production, the PV-GR is an encouraging alternative energy source in urban areas [25]. By reducing the impact of the direct radiative forcing due to the PV system on the building, the rooftop mitigates the urban heat island (UHI) effect in warm climate urban areas [25]. Therefore, PV-GR is an efficient strategy to produce green energy in urban developments. Many experimental and theoretical studies on PV-GR in the literature have endorsed these advantages. However, no comprehensive experimental research has been carried out to determine the synergy between PV and GR as two separate roof structures (equal in area). The synergy evaluation should consider three dimensions: (i) indoor comfort parameters (air temperature and relative humidity), (ii) the PV rear side surface temperature, and (iii) solar energy production. In this paper, two off-grid houses in the form of single-roof houses (SRH) and double-roof houses (DRH) are used for this performance evaluation; the SRH had a PV roof and the DRH had PV-GR.
This research study is organized into three sections. Section 2 formulates the synergy between PV and GR based on thermal analysis. Section 3 discusses the design and construction of off-grid houses. Section 4 presents the collection and process of experimental data and the validation of the numerical model. The final section discusses the benefits of the synergy effects, highlighting the main outcomes, the implications, and the limitations.

2. Synergy Analysis

In this section, we explain the synergetic mechanics between the Photovoltaic System (PV) and the Green Roof (GR) in the DRH. The mechanisms of thermal transfer in the DRH are convection (heat transport due to fluid motion), conduction (heat transfer due to molecular vibrations in solids), and solar radiation (energy transport by photons). In the PV panels, part of the solar radiation is converted into heat and a part is converted into electricity. A portion of the heat of the solar panel is transmitted to the air due to convection. Convection ranges from natural convection (no wind) to forced conditions (wind). Another portion of the PV panels’ heat is transmitted to its environment and supporting structure (typically by a frame attached to the roof) by conduction. A small amount of heat is transmitted to the top leaf of the GR by radiation. Between the GR and the PV, the sources of thermal energy are diffused solar radiation and the heat radiated by the PV. Part of this energy is lost by convection, plant evapotranspiration, and photosynthesis in the leaves. The remaining thermal energy is transferred to the building through the roof.
Part of the incoming solar radiation is converted into electrical energy by the PV system and the remaining solar radiation is converted into heat. The energy balance of this process reads
q r = q P V + q h = α q r + ( 1 α ) q r
where
  • q r is the incident solar radiation (ISR) in the PV panels,
  • q P V is the fraction of the solar radiation converted into electricity,
  • q h is the fraction of the solar radiation converted into heat,
  • α is the efficiency of the solar panels, 0 α 1 .
The efficiency of the PV panels α is the ratio of electrical power output (of a PV panel) to the amount of solar radiation it receives on the surface. The efficiency of solar panels depends on many factors, mainly on the type of PV material, the solar radiation intensity, the PV cell temperature, and the shading spots in the solar panels, mainly ranging from 0.1 to 0.2 [26].
The temperature of the PV panels can be calculated in terms of the ISR and the thermal transmittance (U value) of air above and below the solar panels. This U value (W/m2C) is calculated as the reciprocal of the sum of the resistance of each component of the structure, including the resistance of any air space or cavity and the inner and outer surfaces [27].
In a roof with a PV system, the energy balance leads to
q h = U 0 T 0 T o u t + U 1 T 0 T 1
where
  • T 0 is the temperature of the PV panel,
  • T o u t is the outdoor air temperature,
  • U 0 is the U-value due to the convection of the PV panels with the surrounding environment,
  • U 1 is the U-value due to the conduction of the PV panels with its environment and supporting structure, and
  • T 1 is the temperature of the boundary layer below the PV panels.
Equation (2) can be used to isolate the PV temperature
T 0 = q h + U 0 T o u t + U 1 T 1 U 0 + U 1 .
On the other hand, the energy balance in the GR assumes that the incoming radiation above the green roof is negligible, thus,
q i n = U 3 T 2 T i n ,
where
  • q i n is the incoming heat flow in the building,
  • T 2 is the temperature in the GR measured above the boundary layer,
  • T i n is the indoor temperature, measured below the boundary layer,
  • U 3 is the U-value of the roof, which is calculated in terms of the boundary layers, the thicknesses, and the materials of the various layers of the GR.
The DR should produce an interaction between both PV-GR systems. This interaction can be modelled by assuming that the temperature on the DR is governed by the steady-state heat equation
k x d 2 T d x 2 = Q ,
where k(x) is the thermal conductivity of the material at point (x). The term Q (W/m3) accounts for all heat sources around the foliage, including the heat lost by evapotranspiration, heat losses due to heat convection by the wind, and heat produced by photosynthesis. Solving this equation and applying the boundary condition is T x i = T i where i = 0 , 1 , 2 , 3 . (Note that T 3 = T i n ) leaves to temperature profile as shown in Figure 1.
T ( x ) = x 1 x x 1 x 0 T 0 + x x 1 x 1 x 0 T 1 , x 0 x x 1 x 2 x x 2 x 1 T 1 + x x 1 x 2 x 1 T 2 + Q 2 k 2 ( x x 1 ) ( x x 2 ) , x 1 x x 2 x x 2 x 3 x 2 T i n + x 3 x x 3 x 2 T 2 , x 2 x x 3
from where we can derive the flux profile in terms of U-values U i = k i / ( x i + 1 x i )
k d T d x = k 1 T 1 T 0 x 1 x 0 , x 0 x x 1 k 2 T 2 T 1 x 2 x 1 + Q x ( x 1 + x 2 ) 2 , x 1 x x 2 k 3 T i n T 2 x 3 x 2 . x 2 x x 3
The energy balance at x = x 0 , x 1 , x 2 reads
k d T d x x = x 0 = q h h o u t T o u t T 0 U 0 T 0 T o u t + U 1 ( T 0 T 1 ) = q h , k d T d x x = x 1 c o n t i n u o u s U 1 ( T 1 T 0 ) = U 2 ( T 2 T 1 ) + Q x 1 x 2 2 , k d T d x x = x 2 c o n t i n u o u s U 3 ( T i n T 2 ) = U 2 ( T 2 T 1 ) + Q x 2 x 1 2 ,
where U o = h o u t is the heat convection coefficient between the PV panels and air, and U 1 , U 2 ,   a n d   U e are the U-value of the PV panels, foliage, and roof. The matrix equation from Equation (5)
U 0 + U 1 U 1 0 U 1 U 1 + U 2 U 2 0 U 2 U 2 + U 3 T 0 T 1 T 2 = U o T o u t + q h q e t / 2 U 3 T i n q e t / 2
can be expressed as U T = q , where U , T ,   a n d   q are the U-matrix, the temperature vector, and the thermal load vector. It is assumed that the main source of heat loss in the GR is due to evapotranspiration; the quantity q e t = Q H (W/m2) is called here the heat flow due to evapotranspiration. The solution of this equation is T = R q , where R = U 1 . From this solution, the temperature of the PV panels becomes
T 0 = R 11 U 0 T o u t + R 13 U 3 T i n + R 11 q h ( R 12 + R 13 ) q e t / 2 ,
where,
  • T o u t , T i n are the outdoor and indoor temperatures,
  • R i j are the elements of the inverse of the U-matrix,
  • q h is the heat produced in the PV panels (W/m2), and
  • q e t is the heat flow due to evapotranspiration (W/m2).
The linear effect of the synergy between the GR and PV is expressed by Equation (6): The PV panels provide shade to the GR that drastically reduces the incoming solar radiation in the roof. The temperature of the PV panels increases linearly due to the heat produced in the solar panels q h and decreases linearly due to the evapotranspiration of the GR accounting by the quantity q e t (W/m2) in Equation (6). The thermal coupling between the PV and GR is given in terms of the height H of the GR and the coefficients R 12   a n d   R 13 that are calculated from the U-values of the materials.

3. Physical Model for the Double Roof

The structure of the experimental research is shown in Figure 2. Two off-grid houses, SRH and DRH, were designed and constructed. The houses were 1:3 models of timber frame houses following the Australian Standards AS1684. The stud frames were built from machine-grade pine MPG10 and were braced with marine plywood. The walls and roof were insulated with expanded polystyrene (EPS). Plywood was used to seal openings on the walls to emulate doors and windows. The houses were painted with a linseed oil timber finish to provide a waterproofing layer. Bolts and nuts were used to connect the modules of the houses. The prototypes were placed in a lab setting (glass house) at 33.87° S latitude and 151.21° E longitude, at The University of Sydney. The SRH had a photovoltaic sitting atop its roof, covering the whole roof area. Monocrystalline solar panel photovoltaic was used for two reasons. Firstly, they are commercially available, making it a practical and accessible choice. Secondly, monocrystalline panels have a high efficiency compared to other types of solar cells [28], such as polycrystalline or thin-film cells.
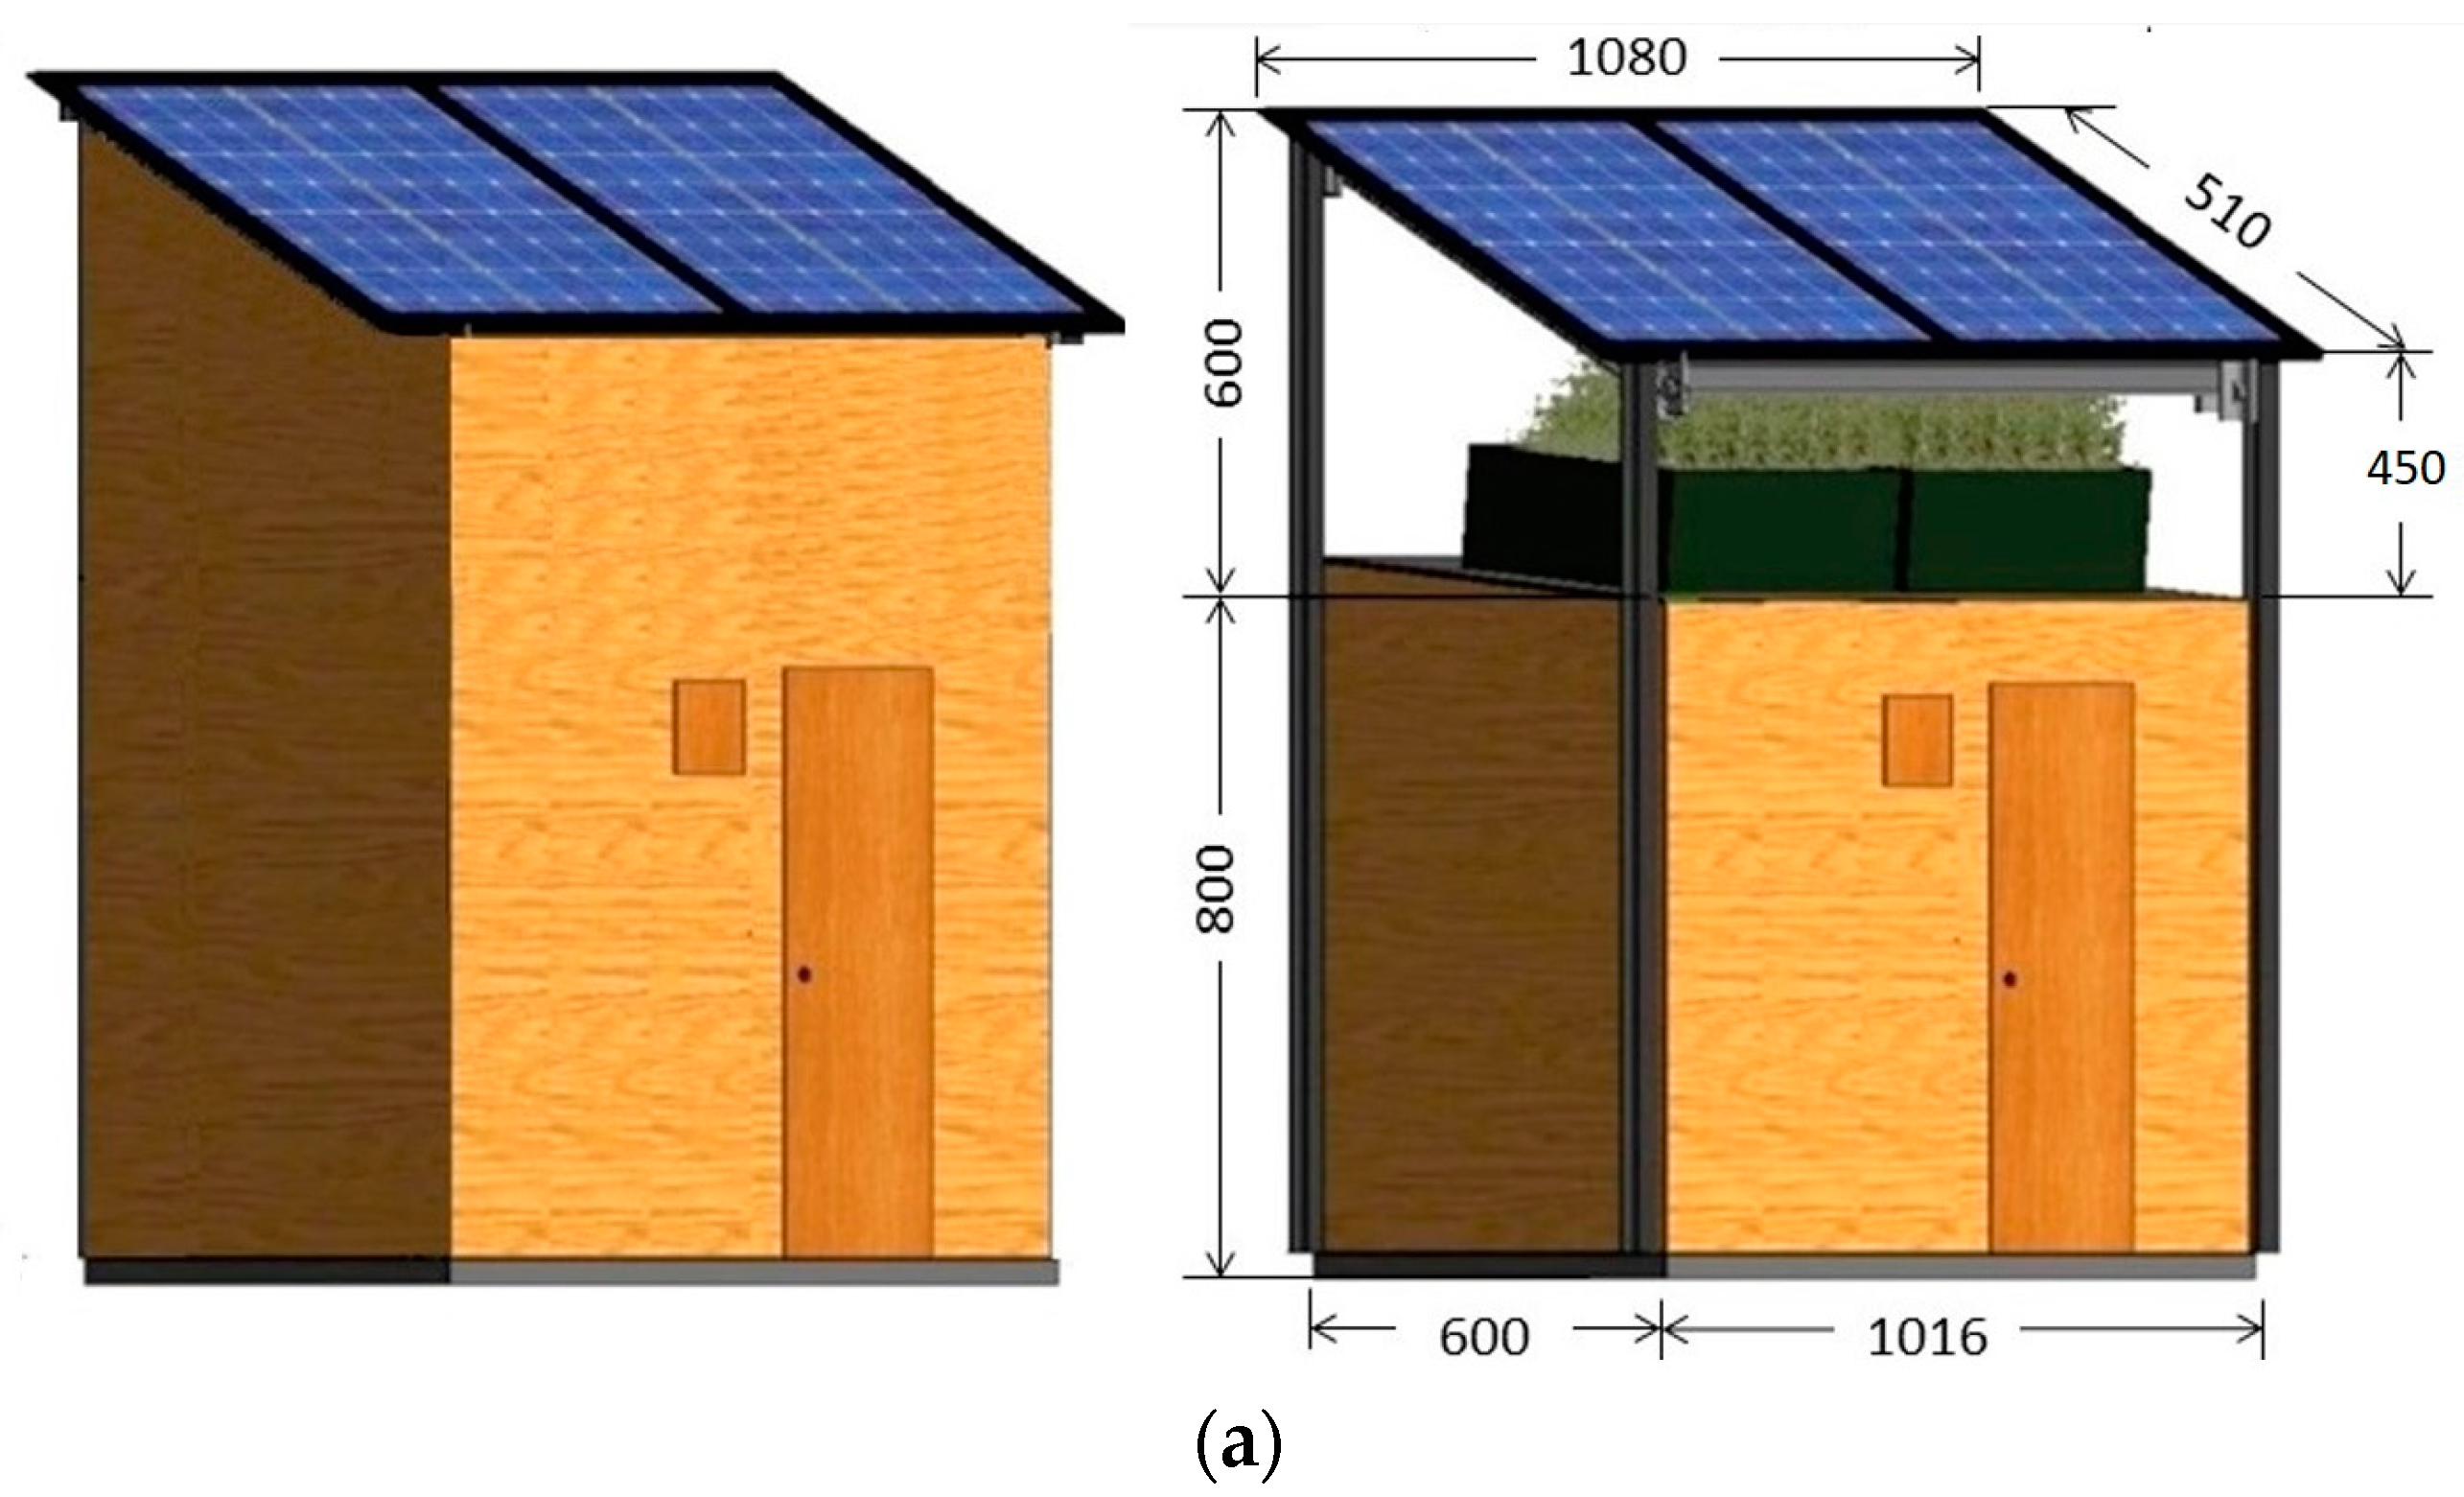
To install the photovoltaic-green roof system in DRH, a raised aluminium frame was built and screwed into the sides of the house to support a single solar PV panel. As displayed in Figure 3, the roof is 1000 mm above the ground surface. In the SRH, the PV panel were mounted to the roof using steel brackets. The green roof was constructed using rectangular modular extensive Elmich MEP trays, which are commercially available. The gap between the roof to the PV panels was 450–600 mm. The inclination of the PV panels was chosen for optimal performance. The height of the plant trays is 150 mm so the distance from the topsoil to the PV panels is 300–450 mm. This gap was large enough to allow space for the plants to grow, but not too large to avoid large edge effects. The average gap between the top of the foliage and the PV panels was 50 mm. Plants choose to avoid close contact with the PV panels due to the high temperatures near them. The plant trays had various plants. The selection of plants was conducted after an assessment of the performance of plants in Australian Outback climatic conditions: high temperatures and extreme rainfall conditions. In an early stage of experimentation, the extreme conditions were simulated in the form of a flood (10 min of watering every 1.5 h) and drought (no irrigation provided) on various plant species. Nine species were selected based on the literature and availability. Visual assessments of the plants were taken twice a week. The most suitable plant species found were Sedum, Succulents, and Mondo grass. After installing the plant trays on the DR house with these species, no irrigation systems were installed. Instead, the watering was performed manually, with 1.5 L of water each time for each plant tray, twice a week in all seasons. The reason for this irrigation schedule was to achieve full use of the water by plants in summer. This makes 0.85 L of water per week for the green roof area. Also, it is important to consider the latent heat of vaporization, which is 2.4 MJ/kg for ambient temperature between 15 °C and 30 °C [29]. Based on these values, the evapotranspiration rate in summer was 0.85 L/0.6 m2 = 1.4 mm/day and the power required to evaporate this water is approximately 24 Watts.
The structural analysis of the SRH was already performed previously [30], which showed that the full-scale house complies with the Australian Standards. The two off-grid houses (SRH and DRH) were placed parallel to each other as shown in Figure 3 and Figure 4. The glass house lab environment imitated external conditions but without wind and precipitation. The glasshouse was not equipped with any shading system, and thus the indoor temperatures were usually higher than the ones normally found outdoors. This way the houses were tested in a more challenging outdoor environment. The harsh environment will also present this study as a reference for extreme climate areas typically in the Australian Outback.
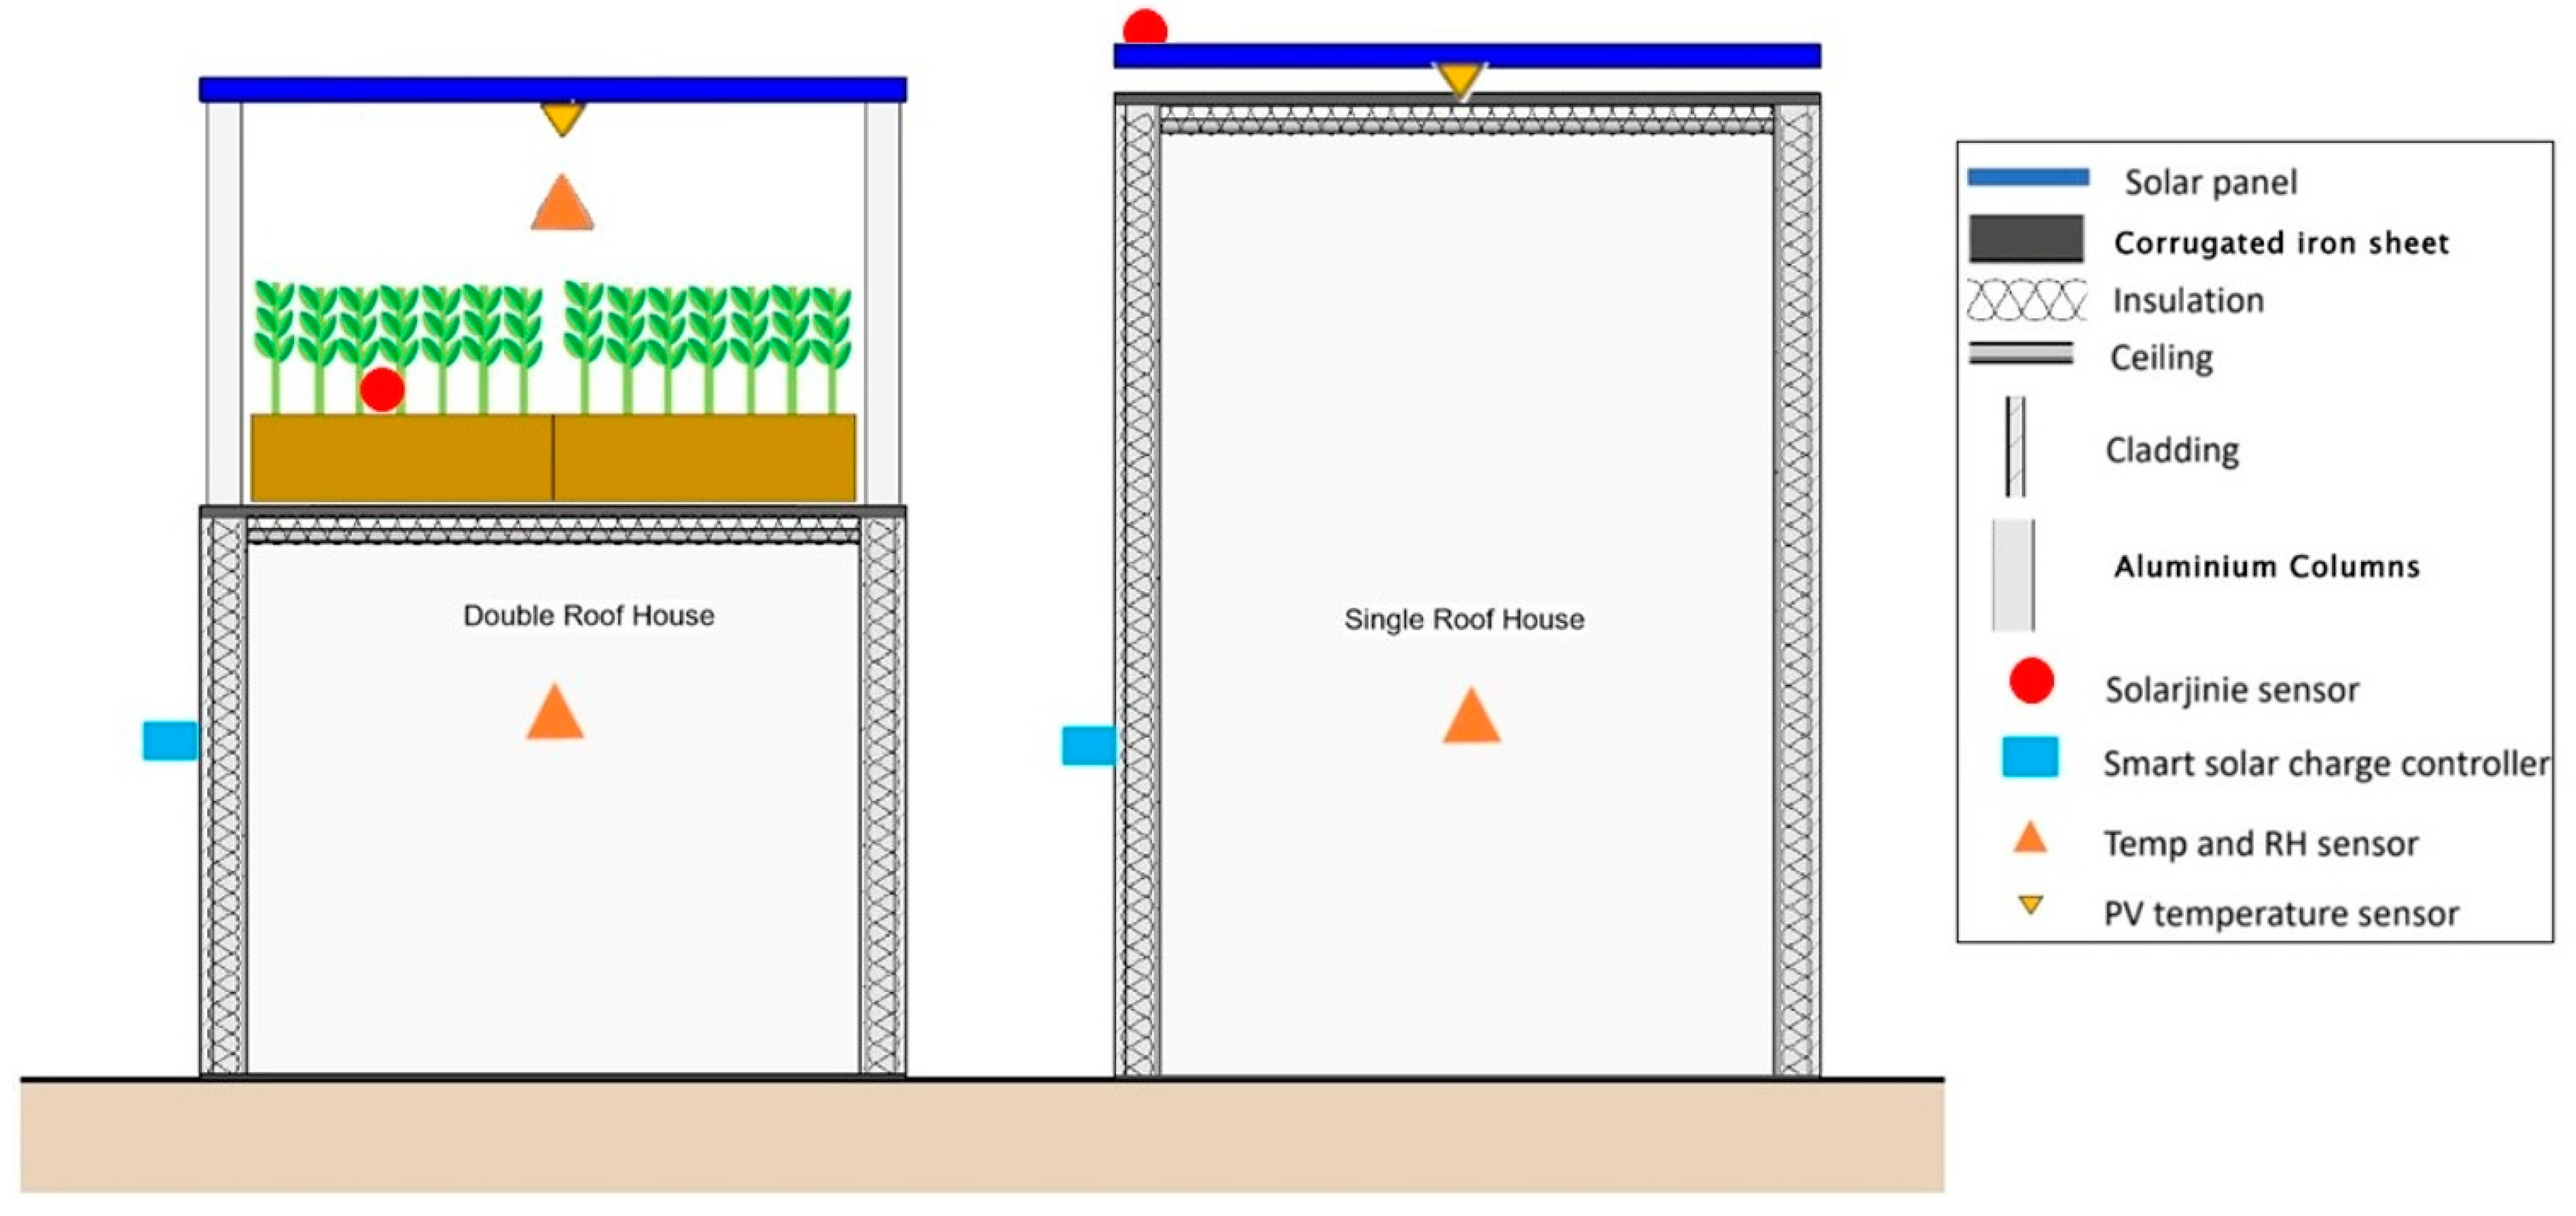
To compare the performance of the two houses on the three facets shown in Figure 2, three different sets of sensors were used; (i) ambient sensors for thermal performance (ii) surface temperature sensors for PV rear side, and (iii) electricity sensors for measuring the solar energy output.
The ambient sensors were connected to the weather station (WS2000), measuring dry bulb temperature and relative humidity. The WS2000 is a reliable and commercially available sensor system used in other research studies. Three ambient sensors were paired with the W-2000, one inside SRH and DRH, and one outside the houses to monitor the external environment around the houses. For measuring the PV surface temperature, a custom-built sensor named solarjinie was used. The solarjinies for PV temperature measurement were installed on the rear surface of the PV panels. In addition, a solarjinie sensor was customized to provide accurate measurements of the solar radiation intensity. These solarjinies were installed in the plants of DRH measuring the amount of solar radiation reaching the leaves and on the rooftop of SRH. The rooftop SRH solarjinie sensor was not placed directly on the PV cell area but behind the PV panel frame on the corner, to make sure it does not create shading effects, shown in Figure 4. The solarjinie sensor data were downloaded from the custom-built solarjinie website, see details in Table 1.
The electricity sensing equipment included a Vectron connect smart solar radiation datalogger, recording electrical power input in Watts (W) and average daily energy yield output in Watt-hours (Wh). This data logger was installed on the side walls of the houses. The data from Vectron Connect were retrieved through a smartphone application. The Vectron connect was connected to a standard solar charge controller that managed power input from the PV panels, power storage by lead-acid batteries, and USB outputs for powering the ambient and radiant sensors. The sensors, equipment, and their respective specifications are shown in Figure 4 and Table 1, respectively. The images and detailed specifications of each piece of equipment used in the experiment are shown in the Supplementary Material, Table S1.
The cross-section of both SRH and DRH are shown in Figure 4. The intensity of solar radiation on SRH and the PV roof of DRH is the same. However, the radiation on the green roof of DRH is very low compared to the rooftop because of the shade provided by the PV panels. This passive cooling strategy of using the shade of the PV panel [31] keeps the green roof cooler which affects the indoor ambient temperature in DRH. On the other hand, in SRH there is no gap between the PV panel and the roof structure, therefore through conduction and radiation, the heat flows into the roof structure and increases the indoor temperature. The reduced solar radiation the PV roof in DRH when reaches the plants is used for photosynthesis by leaves, as the plant grows by absorbing the photosynthetically active solar radiation only [32]. The remaining solar radiation is reflected [32,33] so that almost no radiation goes inside the roof. The percentage of solar radiation getting absorbed and reflected by the plants on the green roof depends upon many factors, e.g., plant type, leaf colour, leaf area index, etc. [34], and was not measured in this experiment. The evapotranspiration of the plants plays a major role, as it mitigates the increasing PV rear side temperature [35,36,37] in DRH.

4. Result and Analysis

The study commenced in December 2021 and concluded in February 2023. The observation period was 15 months and 8 days. The experiment was stretched out for more than 12 months because of missing data in some months. During the study period, the solar radiation hours ranged from 7 to 15 h. To assess the three facets of comparing the performance of the SRH with DRH shown in Figure 2, the results were divided into three sections (i) thermal comfort parameters, (ii) PV surface temperature, and (iii) energy yield.

4.1. Thermal Comfort Parameters (Air Temperature)

Figure 5 shows the mean hourly feel-like temperature for three months representing three seasons: July (winter), October (spring), and December (summer). The plots of all the months showing the mean hourly temperature are shown in the Supplementary Material, Figure S1. The highest recorded temperature value for DRH was 42.5 °C and 46.2 °C for SRH in summer. The lowest values recorded for DRH and SRH were 9.2 °C and 8.4 °C, respectively, in winter. It was noticed that during the peak solar radiation hours in all the months, the temperature inside DRH was always less than SRH by 1–3 °C. During mid to late summer this difference was 2–3 °C, showing the effect of PV-GR. The maximum mean hourly temperature inside the SRH was 36.1 ± 1.22 °C in February at 16:00 h, for which DRH was 34 ± 1 °C. The infiltration losses in the house envelope [38] caused a low temperature in winter for both houses. During all year, the DRH experienced more thermal comfort than the SRH. Tightening the residential envelope can improve thermal performance in winter by 12% [39]. The mean hourly relative humidity inside the houses for every month remained constant, as shown in the Supplementary Material, Figure S2.
The “feel-like” temperature was calculated according to the formula adapted by the Australian Bureau of Meteorology (BOM):
T A = T a + 0.33 ρ 4.00
where
  • T A , T a are the ambient (feels-like) temperature and the dry bulb temperature
  • ρ is the water vapor pressure, which is calculated in terms of the dry bulb temperature and the relative humidity by the equation [40]:
ρ = 6.105 RH 100 e 17.27 T a 237.7 + T a

4.2. PV Rear Side Temperature

Figure 6 shows the mean hourly PV temperature, indoor ambient temperatures, and outdoor (glass house) temperature for three months representing three seasons: July (winter), October (spring), and December (summer). The data for the rest of the months are shown in the Supplementary Material, Figure S4. Due to the evapotranspiration effect of plants on PV panels [41], the mean hourly temperature of the rear side of PV in DRH was cooler than SRH by 5 °C during the peak solar radiation hours (1000–1600 h). It was been proven in another study [42], that the PV-GR system proved to be 5–11 °C cooler than those above a conventional roof and also produced 4.3–8.3% more electricity. The maximum temperature achieved of PV in SRH was 80 °C (9 January 2023, at 13:36 h), whereas in DRH it was 68.3 °C (9 January 2023, at 15:00 h). In SRH the PV panel was attached right on top of the roof. As a result, there was no air circulation on the underside of the SRH PV panel, resulting in an increased panel temperature. The solar radiation intensity range increased to a greater extent from Winter (>200 W/m2) to Summer (>500 W/m2), contributing to the overall increase in the inside and outside temperatures, as shown in Figure 7. Throughout the experiment, the plants in trays beneath the solar panel in DRH received solar radiation and were observed to be in active healthy conditions. Due to the change in the solar angle from July to December, and the increase in the density of the plant leaves, the SRI value reaching the plants decreased. As in July, the maximum SRI received was 53 W/m2, compared to 15 W/m2 shown in Figure 7. The strong dependence of the PV panel temperature on solar radiation is consistent with Equations (3) for SRH and (6) for DRH. The cooling of PV panels in the DRH was mainly due to the evapotranspiration effect captured by the term qet in Equation (6). This cooling effect improves PV efficiency and can also increase the life period [43].
The seasonal climate change resulted in a dramatic increase in the PV temperature, from July (Winter) to December (Summer). In SRH, the mean PV temperature in peak solar radiation hours increased from 28 to 56 °C and similarly in DRH from 25 to 48 °C. This high percentage increase can also be related to low wind speed in the lab. It was anticipated that wind speed can play a fundamental role in cooling down the PV surface [44], and this effect was not accounted for in the controlled environment. It has been estimated that every 1 °C increase in the ambient temperature decreases the performance efficiency of the PV by 0.4–0.5% °C [45]. The synergy effects of the PV-GR again proved to be a successful design strategy.

4.3. Energy Yield

The solar energy yield was measured in watt hours (Wh). Due to different reasons, the regulations and consistency in the data collection were only possible for eight weeks (14 September–10 November 2022), shown in Figure 8. The main problems that caused irregularities were battery failures and a lack of efficient management of the solar energy harvested. The total number of non-zero-energy-yield recorded measurements due to batteries being 100% full in this period was 32. Out of that, on 17 days the DRH yield was greater than SRH, and only for 2 days was the SRH was greater than DRH. These numbers show the significance of the synergy between PV roofs and GR on energy yield. The mean yield for SRH and DRH was 27.8 ± 1.9 Wh and 32.8 ± 2 Wh, respectively, which correspond to 18% more energy harvested in the DRH. The maximum yield achieved by SRH was 50 Wh by both houses.
The consistent results with a regular pattern were possible when new batteries were installed. It was important to note that when the daily SRI was greater than 100 W/m2, then the DRH yield was always greater or equal to SRH. This means the increase in the SRI improves the solar energy production efficiency in DRH. The low performance on energy harvesting, when the SRI was low, could be attributed to the shaded spots created by the beams of the glasshouse roof. It is also noticeable that the increase in SRI produced an increase in the evapotranspiration rate [46] of the plant that mitigated the PV rear side temperature in DRH. This is because cooling the PV surface through the evapotranspiration effect of plants improves energy production.

4.4. Numerical Validation

Based on the experimental results of December, the numerical model proposed in Section 2 was validated. December was chosen as a representation of the summer season in Australia so the performance of the solar panels was critical due to high temperatures and high solar radiation. For the analysis, the U-values were calibrated by comparing numerical and experimental temperature profiles; the chosen values are presented in Table 2.
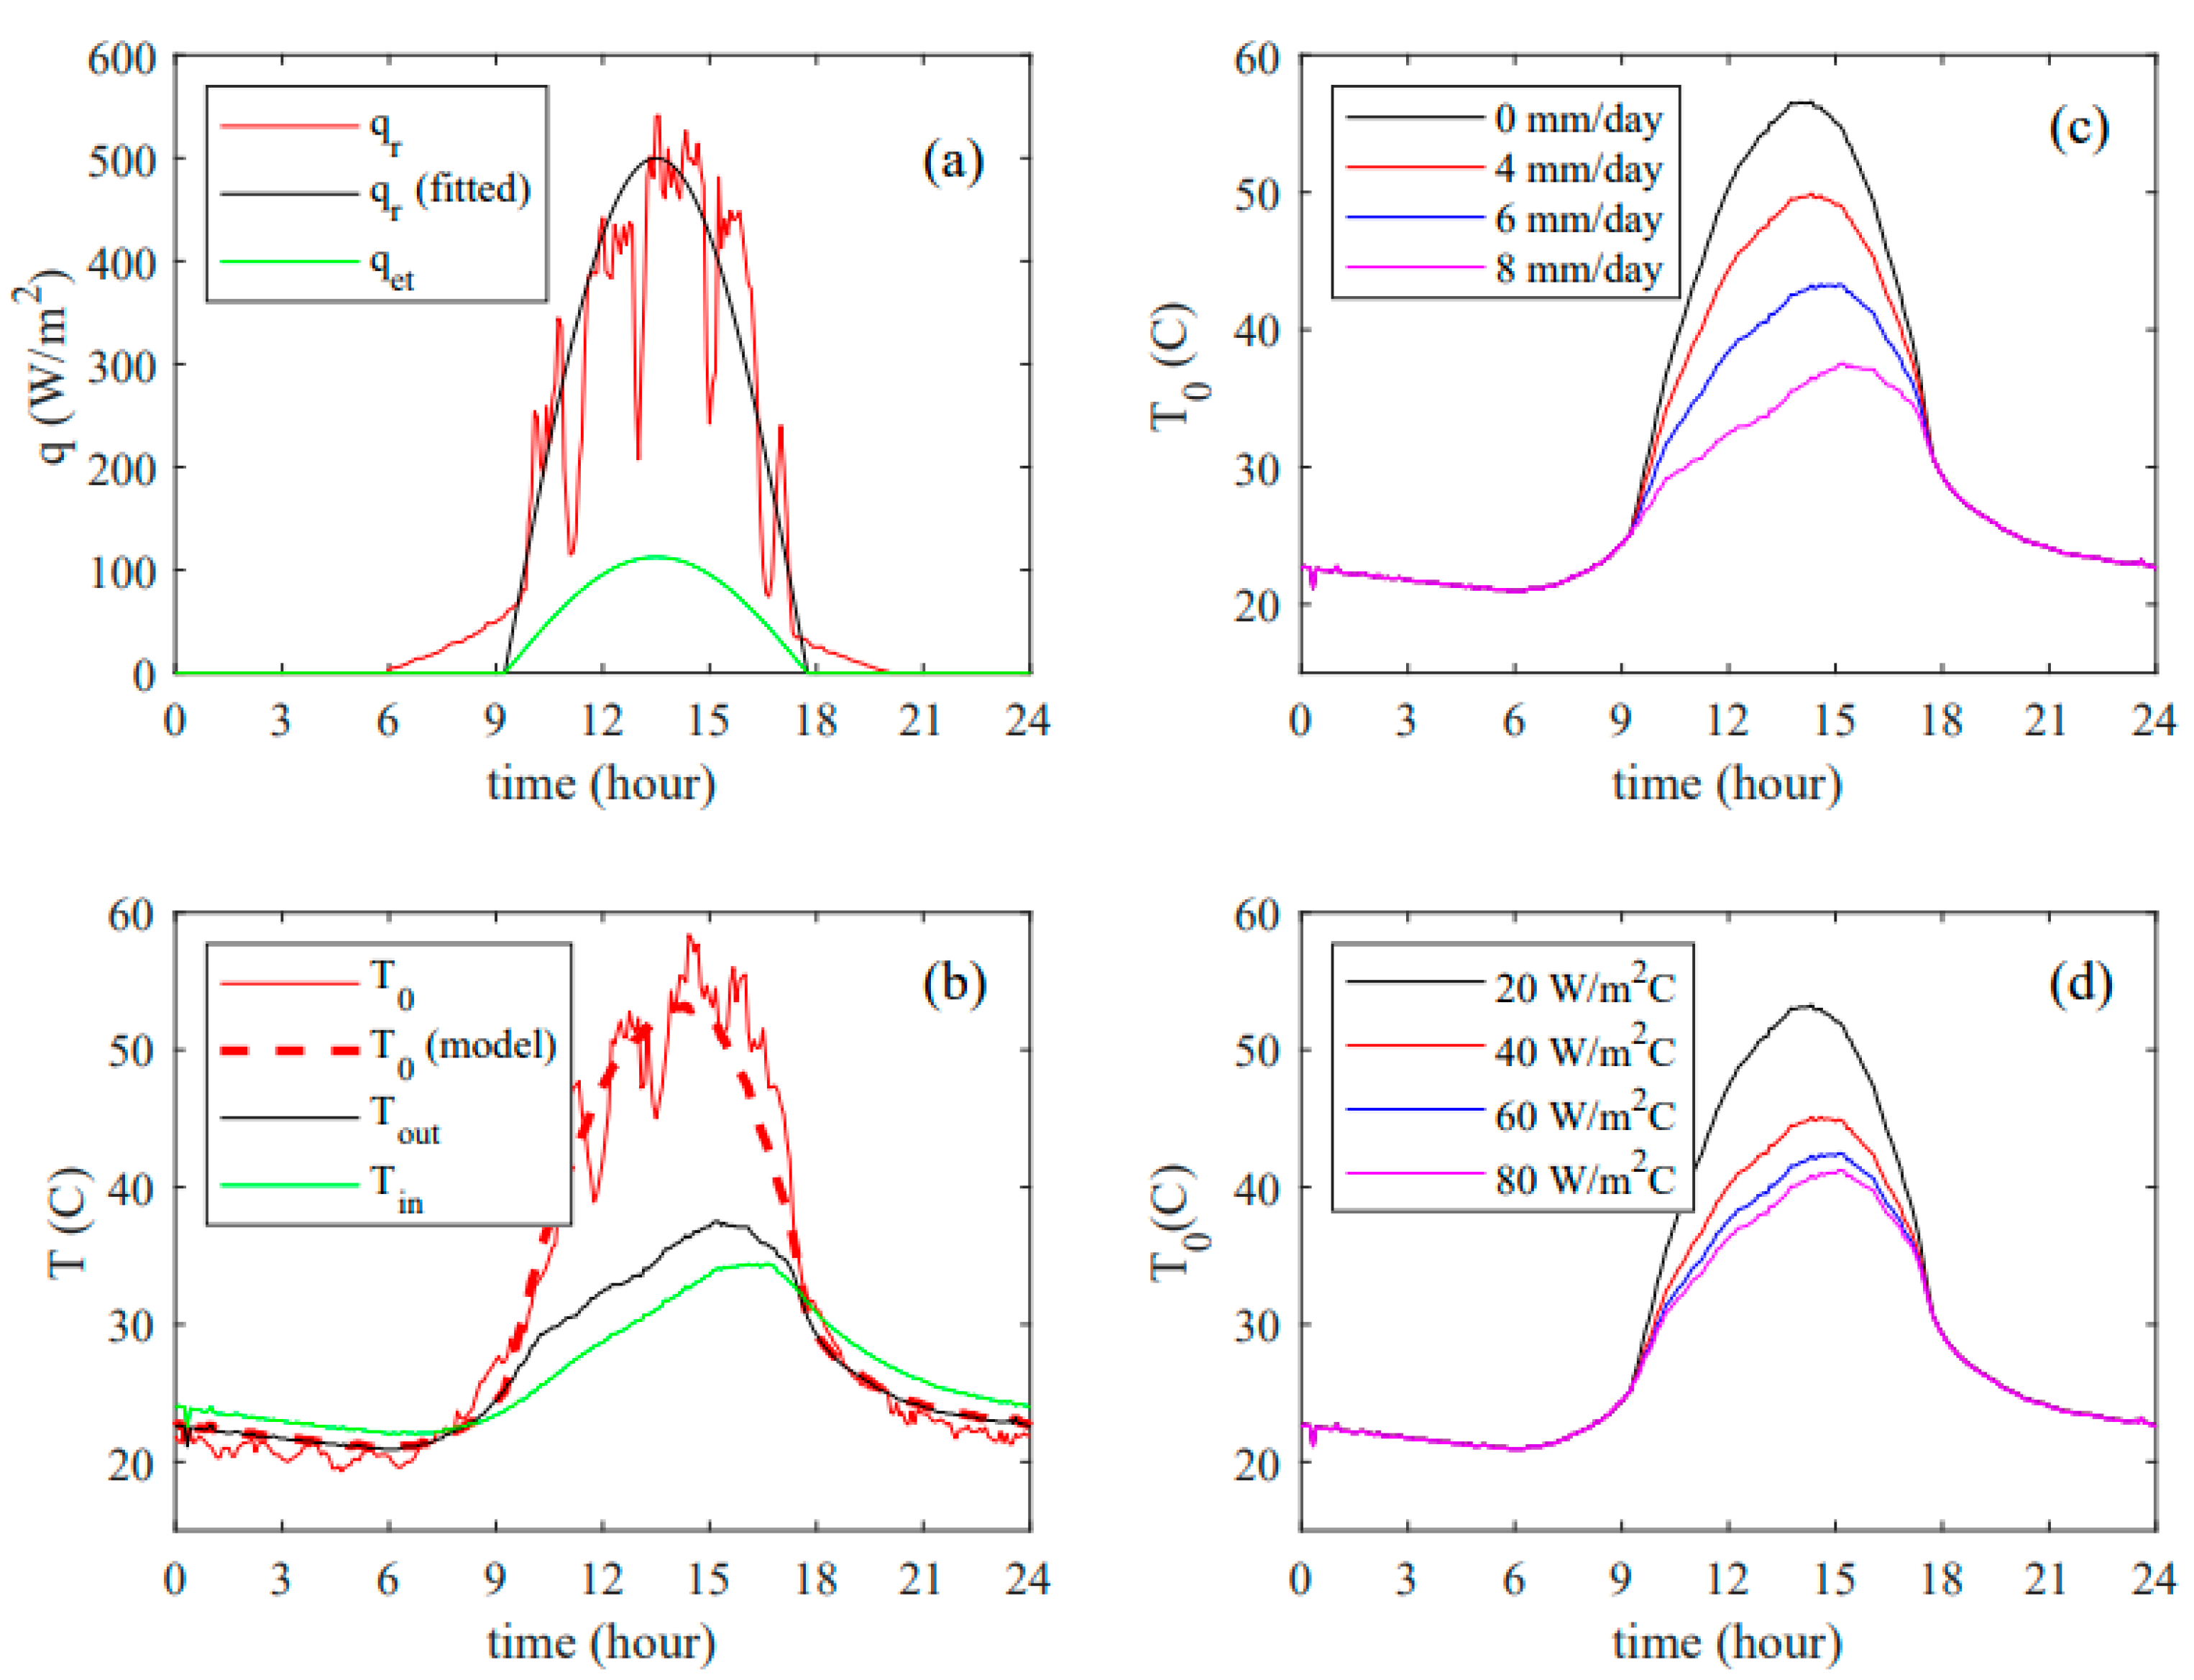
The experimental solar incoming radiation is shown in Figure 9a. The solar radiation can be fitted using the Lambert cosine law of illumination [29] q r = q r m a x c o s   Θ , where q r m a x = 500 W/m2, Θ < π / 2 , and Θ = 2 π ( h o u r p e a k ) / s p a n , where peak = 13.5 h is the peak hour of solar radiation, and span = 17 h is the number of daylight hours. The periodic drops of solar radiation in Figure 9a were due to the shade produced by the roof beams of the glasshouse where the models were located. The heat loss by plant evapotranspiration was assumed to be proportional to solar radiation. The diurnal routine of the plants is controlled by their stomata, small openings on leaves responsible for gas exchange. Stomata typically open during the day to allow for gas exchange and transpiration, while they are essentially closed during the night to conserve water [29]. This diurnal pattern influences the rate of transpiration and, subsequently, evapotranspiration. For this reason, it is assumed that the evapotranspiration is proportional to the solar radiation, q e t = q e t m a x c o s   Θ , as shown in Figure 9a. The peak of evapotranspiration was chosen as q r m a x = 108   W / m 2 , since it leads to heat loss by evapotranspiration on 24 W/day calculated in Section 3. The heat produced by the solar panels was roughly q h = 0.9 q r , which was experimentally obtained by measuring electricity power produced by the solar panels, noticing that the low performance was due to the shaded spots on the panels created by the roof beams.
Using the experimental data for indoor/indoor temperature, the heat produced by the solar panels, and evapotranspiration heat, the solar panel temperature was calculated using Equation (6). The numerical results are shown in Figure 9b. A reasonable agreement of the numerical model with the experiments was obtained from this comparison.
After this validation, different scenarios to evaluate the main control variables of the PV panel temperature were explored. Figure 9c shows the PV panel temperature for different irrigation schedules given in litres/m3/day = mm/day. This is the variable that mostly affects the temperature of the solar panels. No irrigation produces a peak temperature of 56 °C, while a high evapotranspiration of 8mm/day leads to a solar panel temperature of 38 °C which is slightly above the outdoor temperature. Plant evapotranspiration depends mostly on leaf area/volume [29]. The choice of succulent plants was suitable to the Australian outback climatic conditions and it lead to a relatively low evapotranspiration rate (1.4 mm/day). Using plants with large leaf areas for tropical climates can lead to higher evapotranspiration rates, and hence, lower solar panel temperatures on hot days.
The second variable that most affects the solar panel temperature is the U-value U0, which accounts for the convective heat exchange of the PV panels with their environment. The convective heat coefficient in the double roof was relatively low (5–20 W/m2C). Green roofs are a passive method for cooling the PV panels and they require less power compared to other cooling-down methods, based on the circulation of cooling water [30,31], forced air circulation, and spraying water [32]. Replacing natural convection to force convection will increase the coefficients, and replacing air with water as the media of heat removal will increase its order of magnitude. Figure 9d shows the effect of the convection heat coefficient on the solar panel temperature. Forced convection is an efficient cooling method that was not the choice in this paper, which focused on a passive, and biophilic alternative of using plant evapotranspiration as the method for cooling.
Finally, the numerical model was used to investigate how the height of the green roof would affect the synergy of the double-roof systems. We assumed that the amount of foliage was proportional to height and hence, the evapotranspiration was proportional to height. Notice that the U value of the GR was calculated as U2 = H/k2, where H is the height of the GR and k2 is the effective conductivity. According to numerical results (not shown here), the temperature of the solar panels is not affected much by the U value of the GR, and the main effect is due to the increased rate of evapotranspiration. In short, the higher the roof, the cooler the PV panel due to an increase in the amount of foliage and hence, the evapotranspiration.
It is noted that the model is one-dimensional so it was important to double-check the boundary effect due to the three-dimensionality of the problem. This was checked based on two-dimensional simulations, shown in Supplementary Material Figure S5. The lateral convection of heat as a boundary effect reduced the temperature a few centimetres near the periphery of the green roof. However, the reduction in the temperature around the boundaries of the GR did not affect the calculations in this paper since the evapotranspiration was calculated directly from the irrigation schedule and not from the GR temperature. Also, notice that the latent heat of evapotranspiration is not very sensitive to temperature [29]. Thus, the one-dimensional model can be considered accurate enough for a rough estimation of the synergy effects between the PV panels and the GR.

5. Conclusions

In this research, a comprehensive study on the synergy of PV-GR was presented. The effects of synergy on the indoor environment, the PV temperature, and solar energy production were all assessed in one experiment across four seasons and 12 months. The comprehensive analysis revealed that DRH performance was always better than that of SRH in all three synergy-performance dimensions: thermal comfort, PV temperature, and solar-energy production This performance could have been further improved if some other passive design strategies had been integrated, e.g., natural ventilation for the indoor environment and the use of plants with higher evapotranspiration rates.

6. Future Directions

Future research work should compare the houses in the form of two types of DRH with and without plants alongside a control house. The effect of the plants was investigated by numerical simulations but a validation would make a stronger case. The control house should have a conventional roof structure. This way, the different combinations of off-grid houses can be analysed and recommendations can be made about seasonal changing behaviours. Also, for a more real-world setting, a full-scale house prototype subjected to more random climatic conditions can be tested, e.g., the effect of precipitation and wind speed should be included.
The data collection process can be improved as the solar energy storage and usage results were not consistent for the whole length of the experiment. The main reason was the lack of coordination between the different electrical equipment, for example, on many occasions the batteries were full due to low electricity use by the sensors so solar energy was not harvested. Shaded spots in the PV panels reduced energy collection. The solar energy controller and the datalogger were from different brands; if all the equipment were from the same company brand more efficient energy harvesting and use would have been achieved. Our solar energy sensors did not distinguish wavelengths. More sophisticated equipment such as Pyrradiometers should be used to measure short/long wave radiation and incoming/reflected radiation. Similarly, arranging equipment to measure evapotranspiration and leaf area index was not possible. Collecting more information about the thermal flow between the Green Roof and the PV panels would require additional sensors installed in the plants at different points to measure the temperature and the evapotranspiration rate. For collecting this information, the sensor location methodology at different points is a useful strategy, as sensor locations affect the measurements [47]. Also, different types of photovoltaic arrangements can be studied to compare the effect of a certain arrangement on the behaviour of plant species. Similarly, new configurations can be tried for solar lighting and heating through spectral splitting [48] (a technique used to divide incoming light into different spectral components or wavelengths, which can be then used for the selective use or manipulation of specific spectral ranges [49]).
Using plants as a passive strategy was successful but the design can be further explored by trying different plant species under a solar roof. Other passive strategies, e.g., natural ventilation consideration, are necessary because the lack of ventilation through windows or doors affected the results. In the future, air circulation should be provided in the prototype houses to match real-world scenarios. Lastly, the different green roof designs consideration is also important because the green roof in the DRH was made from plant trays instead of an integrated green roof. The integration of the green roof layers in the roof structure is important for its comparison with the roof with plant trays.

Supplementary Materials

The following supporting information can be downloaded at: https://www.mdpi.com/article/10.3390/en16135184/s1, Figure S1: Mean hourly Feel-like temperature for every month inside SRH and DRH; Figure S2: Mean hourly Relative humidity for every month inside SRH and DRH; Figure S3: Mean hourly solar radiation intensity received on the green roof of DRH and the rooftop of SRH from May to December; Figure S4: Mean hourly rear side surface temperature of PV panel from July to December; Figure S5: (a) Temperature contour in the DR obtained from two-dimensional steady-state finite element analysis. The chosen material properties are in Table 2. The boundary conditions are outdoor/indoor temperature of 35 °C/20 °C; convective convection at the top of 20 W/m2 °C, and convective convection of 11 W/m2 °C at the bottom and the sides. (b) the temperature profile of the PV panels showed minor boundary effects. (c) the temperature profile of the green roof; Table S1: Detailed specifications of the equipment used in the experiment.

Author Contributions

Conceptualization, F.A.-M.; methodology, F.A.-M. and G.Q.; software, F.A.-M. and G.Q.; validation, F.A.-M.; formal analysis, F.A.-M. and G.Q.; data curation, G.Q.; writing—original draft preparation, G.Q. and F.A.-M.; writing—review and editing, F.A.-M. and G.Q.; supervision, F.A.-M.; project administration, F.A.-M. and G.Q. All authors have read and agreed to the published version of the manuscript.

Funding

This research received no external funding.

Data Availability Statement

The data is available on request.

Acknowledgments

The authors acknowledge the contribution of Howard Morrison, an off-grid advocate, who suggested the idea of changing the house roofing paradigm for Australian climatic conditions. The authors thank Elmich Australia for donating plant trays for these experiments. We also thank Weidong Xiao and Arianna Brambilla who provided critical advice but did not author this paper due to their busy schedules. Jennifer Feng and Gunjit Kaur contributed to the drafting of the prototype designs. Rhea Gurung, Haole Fu, Alexandra Louisa Kondos, and Shoaib Farooq participated in the building of the prototypes.

Conflicts of Interest

All authors have seen and approved the final version of the manuscript being submitted. They warrant that the article is the author’s original work, has not received prior publication, and is not under consideration for publication elsewhere.

References

  1. Ramírez-Márquez, C.; Martín, M. Chapter 10—Photovoltaic solar energy. In Sustainable Design for Renewable Processes; Martín, M., Ed.; Elsevier: Amsterdam, The Netherlands, 2022; pp. 397–439. [Google Scholar] [CrossRef]
  2. Asdrubali, F.; Desideri, U. (Eds.) Chapter 7—High Efficiency Plants and Building Integrated Renewable Energy Systems. In Handbook of Energy Efficiency in Buildings; Butterworth-Heinemann: Oxford, UK, 2019; pp. 441–595. [Google Scholar] [CrossRef]
  3. Wajs, J.; Golabek, A.; Bochniak, R.; Mikielewicz, D. Air-cooled photovoltaic roof tile as an example of the BIPVT system—An experimental study on the energy and exergy performance. Energy 2020, 197, 117255. [Google Scholar] [CrossRef]
  4. Zhang, T.; Wang, M.; Yang, H. A Review of the Energy Performance and Life-Cycle Assessment of Building-Integrated Photovoltaic (BIPV) Systems. Energies 2018, 11, 3157. [Google Scholar] [CrossRef] [Green Version]
  5. Rahman, D.M.; Hasanuzzaman, M.; Abd Rahim, N. Effects of various parameters on PV-module power and efficiency. Energy Convers. Manag. 2015, 103, 348–358. [Google Scholar] [CrossRef]
  6. Krauter, S.; Araújo, R.G.; Schroer, S.; Hanitsch, R.; Salhi, M.J.; Triebel, C.; Lemoine, R. Combined photovoltaic and solar thermal systems for facade integration and building insulation. Sol. Energy 1999, 67, 239–248. [Google Scholar] [CrossRef]
  7. Hossain, M.F. Chapter Five—Infrastructure and Transportation. In Sustainable Design and Build; Hossain, M.F., Ed.; Butterworth-Heinemann: Oxford, UK, 2019; pp. 231–300. [Google Scholar] [CrossRef]
  8. Kristin, L.G.; Rowe, D.B. The Role of Extensive Green Roofs in Sustainable Development. HortScience 2006, 41, 1276–1285. [Google Scholar] [CrossRef] [Green Version]
  9. Ganguly, A.; Chowdhury, D.; Neogi, S. Performance of Building Roofs on Energy Efficiency—A Review. Energy Procedia 2016, 90, 200–208. [Google Scholar] [CrossRef]
  10. Lazzarin, R.M.; Castellotti, F.; Busato, F. Experimental measurements and numerical modelling of a green roof. Energy Build. 2005, 37, 1260–1267. [Google Scholar] [CrossRef]
  11. Ouldboukhitine, S.-E.; Belarbi, R.; Sailor, D.J. Experimental and numerical investigation of urban street canyons to evaluate the impact of green roof inside and outside buildings. Appl. Energy 2014, 114, 273–282. [Google Scholar] [CrossRef]
  12. Bowler, D.E.; Buyung-Ali, L.; Knight, T.M.; Pullin, A.S. Urban greening to cool towns and cities: A systematic review of the empirical evidence. Landsc. Urban Plan. 2010, 97, 147–155. [Google Scholar] [CrossRef]
  13. Wilkinson, S.; Feitosa, R.C. Retrofitting Housing with Lightweight Green Roof Technology in Sydney, Australia, and Rio de Janeiro, Brazil. Sustainability 2015, 7, 1081–1098. [Google Scholar] [CrossRef] [Green Version]
  14. Castiglia Feitosa, R.; Wilkinson, S. Modelling green roof stormwater response for different soil depths. Landsc. Urban Plan. 2016, 153, 170–179. [Google Scholar] [CrossRef]
  15. Dixon, T.; Wilkinson, S. Building Resilience in Urban Settlements Through Green Roof Retrofit. In Green Roof Retrofit; John Wiley & Sons: Hoboken, NJ, USA, 2016; pp. 1–13. [Google Scholar] [CrossRef]
  16. Wilkinson, S.J.; Reed, R. Green roof retrofit potential in the central business district. Prop. Manag. 2009, 27, 284–301. [Google Scholar] [CrossRef] [Green Version]
  17. Catalano, C.; Baumann, N. Biosolar Roofs: A Symbiosis between Biodiverse Green Roofs and Renewable Energy. CityGreen 2017, 2017, 42–49. [Google Scholar]
  18. Permpituck, S.; Namprakai, P. The energy consumption performance of roof lawn gardens in Thailand. Renew. Energy 2012, 40, 98–103. [Google Scholar] [CrossRef]
  19. Shafique, M.; Kim, R.; Rafiq, M. Green roof benefits, opportunities and challenges—A review. Renew. Sustain. Energy Rev. 2018, 90, 757–773. [Google Scholar] [CrossRef]
  20. Coma, J.; Pérez, G.; Solé, C.; Castell, A.; Cabeza, L.F. Thermal assessment of extensive green roofs as passive tool for energy savings in buildings. Renew. Energy 2016, 85, 1106–1115. [Google Scholar] [CrossRef] [Green Version]
  21. Imran, H.M.; Kala, J.; Ng, A.W.M.; Muthukumaran, S. Effectiveness of green and cool roofs in mitigating urban heat island effects during a heatwave event in the city of Melbourne in southeast Australia. J. Clean. Prod. 2018, 197, 393–405. [Google Scholar] [CrossRef]
  22. Spala, A.; Bagiorgas, H.S.; Assimakopoulos, M.N.; Kalavrouziotis, J.; Matthopoulos, D.; Mihalakakou, G. On the green roof system. Selection, state of the art and energy potential investigation of a system installed in an office building in Athens, Greece. Renew. Energy 2008, 33, 173–177. [Google Scholar] [CrossRef]
  23. Hoffmann, S.; Koehl, M. Effect of humidity and temperature on the potential-induced degradation. Prog. Photovolt. Res. Appl. 2014, 22, 173–179. [Google Scholar] [CrossRef]
  24. Singh, P.; Singh, S.N.; Lal, M.; Husain, M. Temperature dependence of I–V characteristics and performance parameters of silicon solar cell. Sol. Energy Mater. Sol. Cells 2008, 92, 1611–1616. [Google Scholar] [CrossRef]
  25. Shafique, M.; Luo, X.; Zuo, J. Photovoltaic-green roofs: A review of benefits, limitations, and trends. Sol. Energy 2020, 202, 485–497. [Google Scholar] [CrossRef]
  26. Vidyanandan, K.V. An Overview of Factors Affecting the Performance of Solar PV Systems. Energy Scan 2017, 27, 2–8. [Google Scholar]
  27. Willoughby, J. 30—Insulation. In Plant Engineer’s Reference Book, 2nd ed.; Snow, D.A., Ed.; Butterworth-Heinemann: Oxford, UK, 2002; pp. 30-18–30-31. [Google Scholar] [CrossRef]
  28. Narayanan, R.; Parthkumar, P.; Pippia, R. Solar energy utilisation in Australian homes: A case study. Case Stud. Therm. Eng. 2021, 28, 101603. [Google Scholar] [CrossRef]
  29. Oke, T.R. Boundary Layer Climates; Routledge: Oxford, UK, 2002. [Google Scholar]
  30. Arias Calluari, K.; Alonso-Marroquín, F. Structural Analysis of an Off-Grid Tiny House; AIP Publishing: Melville, NY, USA, 2017; Volume 1856, p. 020001. [Google Scholar]
  31. Kapsalis, V.C.; Vardoulakis, E.; Karamanis, D. Simulation of the cooling effect of the roof-added photovoltaic panels. Adv. Build. Energy Res. 2014, 8, 41–54. [Google Scholar] [CrossRef]
  32. Szeicz, G. Solar radiation for plant growth. J. Appl. Ecol. 1974, 11, 617–636. [Google Scholar] [CrossRef]
  33. Amthor, J.S. From sunlight to phytomass: On the potential efficiency of converting solar radiation to phyto-energy. New Phytol. 2010, 188, 939–959. [Google Scholar] [CrossRef] [PubMed]
  34. Kume, A. Importance of the green color, absorption gradient, and spectral absorption of chloroplasts for the radiative energy balance of leaves. J. Plant Res. 2017, 130, 501–514. [Google Scholar] [CrossRef]
  35. Gupta, S.; Anand, P.; Kakkar, S.; Sagar, P.; Dubey, A. Effect of evapotranspiration on performance improvement of photovoltaic-green roof integrated system. J. Renew. Energy Smart Grid Technol. 2017, 12, 63–76. [Google Scholar]
  36. Jahanfar, A.; Drake, J.; Sleep, B.; Margolis, L. Shading effects of photovolatic panels on the evapotranspiration process in extensive green roofs. In Proceedings of the Novatech 2016-9ème Conférence Internationale sur les Techniques et Stratégies Pour la Gestion Durable de Leau dans la Ville/9th International Conference on Planning and Technologies for Sustainable Management of Water in the City, GRAIE, Lyon, France, 28 June–3 July 2016. [Google Scholar]
  37. Besir, A.B.; Cuce, E. Green roofs and facades: A comprehensive review. Renew. Sustain. Energy Rev. 2018, 82, 915–939. [Google Scholar] [CrossRef]
  38. Younes, C.; Abishdid, C.; Bitsuamlak, G. Air infiltration through building envelopes: A review. J. Build. Phys. 2012, 35, 267–302. [Google Scholar] [CrossRef]
  39. Georgiou, G.; Eftekhari, M.; Lupton, T. Investigating the effect of tightening residential envelopes in the Mediterranean region. In Proceedings of the 14th International Conference on Sustainable Energy Technologies (SET 2015), Singapore, 25–27 August 2015. [Google Scholar]
  40. Qiu, R.; Li, L.; Kang, S.; Liu, C.; Wang, Z.; Cajucom, E.P.; Zhang, B.; Agathokleous, E. An improved method to estimate actual vapor pressure without relative humidity data. Agric. For. Meteorol. 2021, 298, 108306. [Google Scholar] [CrossRef]
  41. Chemisana, D.; Lamnatou, C. Photovoltaic-green roofs: An experimental evaluation of system performance. Appl. Energy 2014, 119, 246–256. [Google Scholar] [CrossRef]
  42. Hui, S.C.; Chan, S.-C. Integration of green roof and solar photovoltaic systems. In Proceedings of the Joint Symposium 2011: Integrated Building Design in the New Era of Sustainability, Hong Kong, China, 22 November 2022; pp. 1–12. [Google Scholar]
  43. Royo, P.; Ferreira, V.J.; López-Sabirón, A.M.; Ferreira, G. Hybrid diagnosis to characterise the energy and environmental enhancement of photovoltaic modules using smart materials. Energy 2016, 101, 174–189. [Google Scholar] [CrossRef]
  44. Schwingshackl, C.; Petitta, M.; Wagner, J.E.; Belluardo, G.; Moser, D.; Castelli, M.; Zebisch, M.; Tetzlaff, A. Wind effect on PV module temperature: Analysis of different techniques for an accurate estimation. Energy Procedia 2013, 40, 77–86. [Google Scholar] [CrossRef] [Green Version]
  45. Sudhakar, P.; Santosh, R.; Asthalakshmi, B.; Kumaresan, G.; Velraj, R. Performance augmentation of solar photovoltaic panel through PCM integrated natural water circulation cooling technique. Renew. Energy 2021, 172, 1433–1448. [Google Scholar] [CrossRef]
  46. Heck, K.; Coltman, E.; Schneider, J.; Helmig, R. Influence of Radiation on Evaporation Rates: A Numerical Analysis. Water Resour. Res. 2020, 56, e2020WR027332. [Google Scholar] [CrossRef]
  47. Al Samman, S.; Eftekhari, M.P.; Coakley, D.P.; Angelopoulos, C.P.; Dimitriou, V.P. Sensor Location Methodology for Improved IEQ Monitoring in Working Environments; American Society of Heating, Refrigeration and Air Conditioning Engineers, Inc.: Atlanta, GA, USA, 2022; pp. 1–8. [Google Scholar]
  48. Shen, C.; Lv, G.; Zheng, K.; Ruan, C.; Zhang, C.; Dong, Y. Modeling and investigating the detailed characteristics of solar lighting/heating system based on spectrum split of nanofluids. Energy Built Environ. 2020, 3, 30–39. [Google Scholar] [CrossRef]
  49. Stanley, C.; Mojiri, A.; Rosengarten, G. Spectral light management for solar energy conversion systems. Nanophotonics 2016, 5, 161–179. [Google Scholar] [CrossRef]
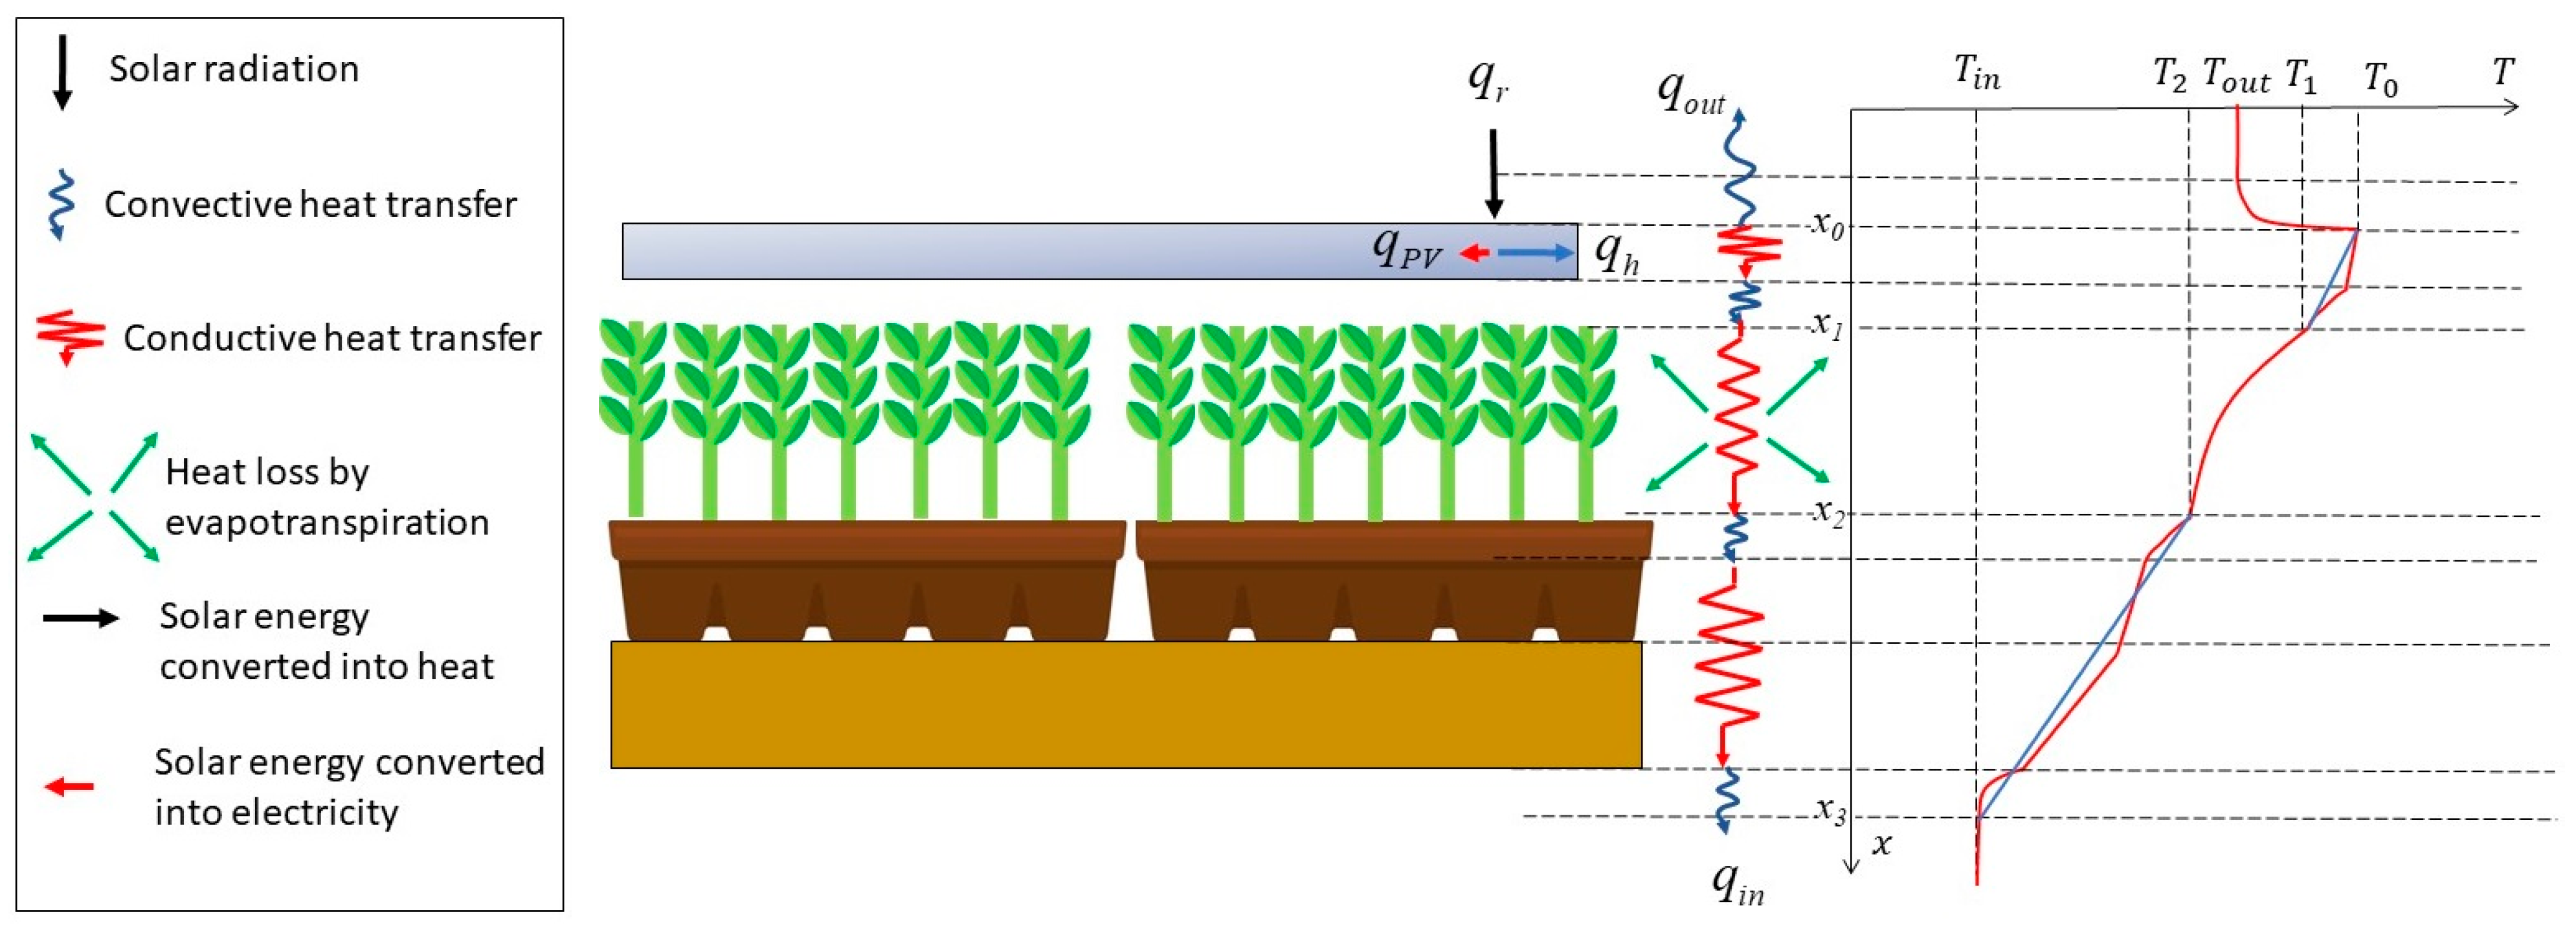
Figure 1. The mechanism of thermal transfer and heat absorption in the DR. The incoming solar radiation qr [W/m2] is absorbed by electricity qPV [W/m2] (black arrow) and heat qh [W/m2] (blue arrow). The interior heat flow qin [W/m2] and the exterior heat flow qout [W/m2] are related to the amount of heat loss by evapotranspiration (green arrow, wind, and the diffuse solar radiation converted into heat. The temperature profile is constructed assuming quasi-static equilibrium, and the temperature gradients shown in blue are calculated from the U-values of the PV and GR.
Energies 16 05184 g001
Figure 2. Methodology flow chart diagram of the experiment showing all the steps involved. The experiment started with the design and construction of the houses. A similar data arrangement set-up was installed in both SRH and DRH and their performances are compared to answer the questions mentioned in the rhombus shapes.
Energies 16 05184 g002
Figure 3. (a) The modelled DRH (left) and SRH (right) house in a 3D view drawn in Autodesk Revit. All the dimensions in this figure are in millimetres (mm). (b) The real images of the prototypes in isometric view show SRH (left) and DRH (right) placed in the glass house. The weather station was installed at the pole of the DRH and the Vectron connect and solar controller were installed at the right walls of the houses.
Energies 16 05184 g003aEnergies 16 05184 g003b
Figure 4. Cross-section of the house prototypes, the SRH (left) and DRH (right). The locations of the sensors are represented by circles (solarjinie radiation sensors), squares (electricity Vectron sensor), orange triangles (temperature/humidity sensors), and yellow triangles (solarjinie PV temperature sensors). The solarjinie radiation sensor (red circle) is installed behind the solar panels to avoid shading.
Energies 16 05184 g004
Figure 5. Mean hourly value of feel-like indoor temperature for July, October and December using Equation (7). The green and red circles corresponds to hours in DRH and SRH respectively.
Energies 16 05184 g005
Figure 6. The mean temperature of the PV rear surface, indoor and outside (in the glass house) recorded in July, October, and December. Data were recorded every five minutes. The mean value for a month was calculated by taking the average of the minute/hour for the whole month. These data were obtained through PV temperature sensors attached to the rear side of the solar panels and WS-2000. PV-SRH (PV rear-surface single-roof house), PV-DRH (PV rear-side-surface double-roof house), T-SRH (Temperature inside SRH), T-DRH (Temperature inside DRH), and OT (Outside temperature in a glass house).
Energies 16 05184 g006
Figure 7. Mean hourly solar radiation intensity on the rooftop of SRH (red) and the green roof of DRH (green) recorded in July, October, and December. Data were recorded every five minutes. The mean hourly value for a month was calculated by taking the average of an hour for the whole month. The shade produced by the PV panels and the plants resulted in almost zero solar radiation from September onwards (shown in Supplementary Material, Figure S3).
Energies 16 05184 g007
Figure 8. Daily solar energy yield during the consistent period. The mean value of SRH yield was 27.8 ± 1.1 and 32.8 ± 2 for DRH. These data were obtained through the Vectron Connect solar charge controller/datalogger.
Energies 16 05184 g008
Figure 9. (a) Incoming solar radiation (red), fitting using Lambert cosine illumination law (black), and evapotranspiration heat flow (green). (b) PV panel temperature (red), outdoor/indoor temperature (black/green), and solar panel temperature calculated from the numerical model (dashed). (c) Numerical PV panel temperature for different evapotranspiration rates, and (d) numerical PV panel temperature for different heat convection coefficients. The data are plotted against hour and correspond to December (Summer in Australia).
Energies 16 05184 g009
Table 1. Technical details of the measuring devices.
Measuring VariableMeasuring DeviceMeasuring RangeAccuracyWeblink
Air temperatureWS2000−10 °C to 60 °C±2 °Chttps://ambientweather.com/ws-2000-smart-weather-station, accessed on 12 November 2021
Relative humidity10 to 99%±5%
Solar radiation intensitySolarjinie0–1200 W/m2±20 W/m2https://www.enerjin.com, accessed on 5 December 2021
PV rear-surface temperatureSolarjinie−10 °C to 80 °C±2 °C
Solar energy productionVictron MPPT 100/50, and Solar charge controller−30 to 60 °C±10 Whhttps://www.victronenergy.com/solar-charge-controllers/smartsolar-100-30-100-50, accessed on 1 April 2022
−35 to 60 °C-https://tinyurl.com/y54r3t95, accessed on 1 April 2022
Table 2. Calculation of the U values and R values based on thermal conductivity k and height of the components.
ComponentSymbolk (W/m C)H (m)U (W/m2 C)R (m2 C/W)
Boundary layerU0 200.05
Solar panelU10.50.005100.00.01
FoliageU210.452.20.45
RoofU30.050.031.70.6
Disclaimer/Publisher’s Note: The statements, opinions and data contained in all publications are solely those of the individual author(s) and contributor(s) and not of MDPI and/or the editor(s). MDPI and/or the editor(s) disclaim responsibility for any injury to people or property resulting from any ideas, methods, instructions or products referred to in the content.