Abstract
The demand for microgrids and their applications in buildings, industries and for very specific applications is increasing over time. Most of these microgrids are dependent on renewable energy sources, which brings along problems of intermittent energy production. To maintain the balance of the grid, normally storage devices are used. Supercapacitors (SCs) are emerging as one of the potential solutions to solve the issue of intermittent energy production by renewable sources because of their high-power densities and rapid charge/discharge capability. In other terms, SCs can charge, and discharge rather quickly as compared to traditional lithium-batteries. This usage makes it interesting for optimizing decentralized energy generation-based PV systems operations. In this paper, the authors propose the supercapacitors fast ageing control in residential microgrid, including electric vehicle charging station based Photovoltaic-Fuel Cell system. Supercapacitors fast ageing control concept focuses on keeping the electrical parameters of the SCs around the optimal operation points by smoothing the power fluctuations in the system. The used SCs model is essentially based on the intermittent current waveforms along with variable temperature conditions. It enables us to describe the degradation of the supercapacitor’s parameters based on the effects of the temperature and the DC-current undulation. To maintain the electrical parameters of SCs around the optimal operation points, the authors propose a new control based on maintaining the SCs resistance at a minimal level and its capacitance at a maximal level by adjusting the SCs current control according to the optimal operating points tracking. The results validate the effectiveness of the approach, this is important because controlling the fast degradation of capacitance optimizes the lifetime of SCs system. Future research may explore scalability to large microgrids and integration with diverse renewable energy systems.
1. Introduction
We live in a world fighting with a major problem like climate change and with that the need for sustainable energy solutions has been increasing by the day. In this research, we try to solve one of the problems that occur in microgrids which hold an immense potential to revolutionize the energy generation and consumption, however the problem presented by these microgrids is the intermittent nature of renewable energy resources. And to maintain the balance of these microgrids, energy storage is of massive importance [1]. There are numerous energy storage devices which can be used as the potential solutions to the intermittency problem depending on the application, Li-Ion batteries are the preferred storage option in the Electrical Vehicle applications [2]. One of their advantage is that they can store electrical energy for longer periods of time because of their low self discharge and high energy density [3]. Supercapacitors on the other hand are quite similar electrochemical systems for energy storage but the difference is that they have high self discharge rate and high power density, which means they can charge and discharge rather quickly as compared to batteries [4]. With the advancement of microgrids technologies, there is a growing demand for SCs in the market as they have the capacity to store and supply energy much faster as compared to conventional batteries [5]. In our application which is microgrid, we often very quick charge discharge capabillites due to the intermittent nature of renewable energy resources, therefore we have decided to use supercapacitors in our system. Using supercapacitors comes with its challenges like the degradation of electrical parameters due to current ripple frequency and temperature changes which accelerates the cycling ageing within the SCs system [6]. There are two types of ageing mechanisms occuring within the supercapacitors systems (calandar and cycling) ageing. The calendar ageing happens with the passage of time and cannot be controlled due to chemical properties of the supercapacitors systems, whereas cycling ageing can be controlled [7]. The cycling ageing can be controlled by adapting the energy management algorithm to control the capacitance and resistance values of supercapacitors system be controlling the current ripple frequency of the system, therefore this article focuses on the desing of an energy management strategy which controls the fast ageing parameters of the supercapacitors system and can be used in many applications [8].
Energy management algorithms play a vital role for optimal operation of the microgrids. Researchers are currently proposing a lot of energy management strategies for the multi-source systems to optimize their performance and increase the lifetime of energy storage devices [9,10]. Techniques like Fuzzy logic control, Fourier transform, and PI control have been proposed in the past by many researchers for various applications [11,12]. Many microgrid configurations have been proposed in the literature for designing the energy management which have been reviewed on basis of resulting performances in [13]. The efficiency of an energy management strategy is estimated by looking at the control-technique used and then by dimensions and sizing of the system like photovoltaic panels (PV), energy storage devices and converters used in the system [14].
Combination of SCs either with batteries or fuel cells is a viable method to improve the performance of Residential Energy Generation including Electric Vehicle Charging Station (EVCS) systems in the presence of a renewable energy generation source [15].
In this work, the authors have considered a microgrid based a cumulative residential load including EVCS with PV as a renewable energy source and SCs along with FCs to consolidate the energetic autonomous and microgrid stability. The configuration of the microgrid is presented in Figure 1. SCs are considered as a power source, with a power density between 5 and 15 kW/kg [16]. Today, they cannot compete with batteries in terms of energy density. Indeed, the electric energy is directly stored in electrostatic form without energy conversion. Therefore, the stored electric energy can be rapidly supplied by SCs [17,18,19]. The highlight of the paper compared to the works in the literature is focused on supercapacitors fast ageing control based the SCs optimal operating points tracking through the three dimensional models of the SCs resistance and capacitance. Optimal operation points of the SCs are sited to the maximum efficiency (minimum series resistance) and to maximum capacitance for each scenario and for all operating situations. The control concept is developed through the SCs resistance and capacitance on-line estimation from the supercapacitor’s voltage and current measurements.
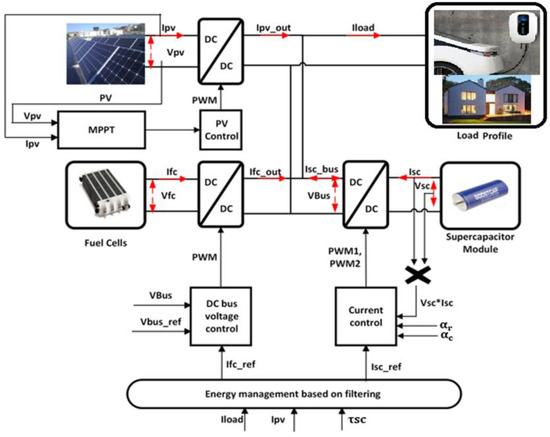
Figure 1.
Microgrid configuration including electric vehicle charging station (EVCS) system.
The paper is organized as follows: In Section 2, behavior models of the components used in the multi-source systems are discussed. Energy and power management strategies are explained in Section 3, where the test conditions and results are presented. In Section 4, the overall results and performance evaluation of the proposed control are presented with discussions. Conclusions of the work are presented in Section 5. A layout diagram is proposed in Figure 2 to guide through all the formulation involved in sections and their purposes.
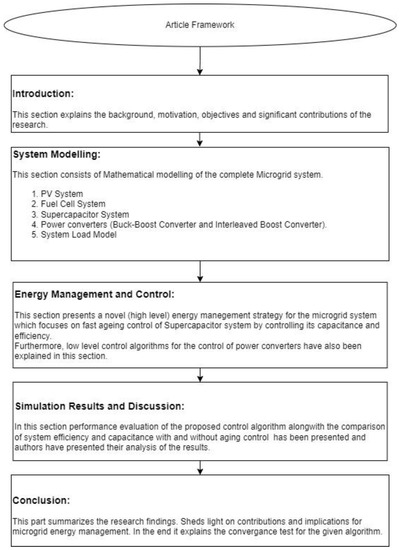
Figure 2.
Article Framework.
2. Microgrid Behavior Model
2.1. Supercapacitors Behavior Model Based Experimental Data
The supercapacitors (SCs) model has been obtained from the data collected in the previous work done in our laboratory [20]. Equation (1) shows the model of normalized resistance and capacitance which is obtained from the experimental data, where is the number for charge/discharge cycles and , , and are the fitting coefficients. The SCs model has been developed by performing ageing characterization tests on Maxwell Bootscap 3000 F/2.7 V supercapacitors cells at 25 °C with a fluctuating current profile with frequency range of 0 to 500 mHz.
Figure 3 presents the SC cell model which consists of a series resistance , a variable capacitance according to using conditions of (, and variable capacitance () according to the SC voltage level, where specific constant. This model works on DC current ripple rate which is calculated using Equation (2) while the relationship of the DC current ripple with the SC resistance and capacitance has been described in [21].
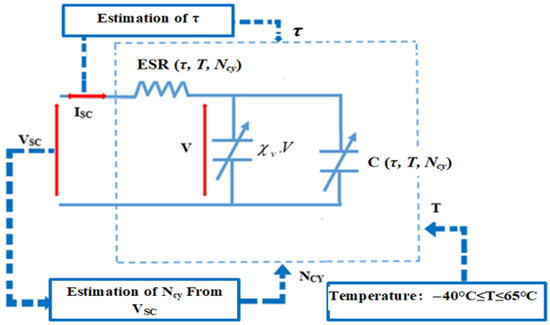
Figure 3.
Model of a single supercapacitor (SC) cell.
Figure 4 shows the estimation of in the MATLAB/Simulink software by using moving maximum, minimum and average functions.
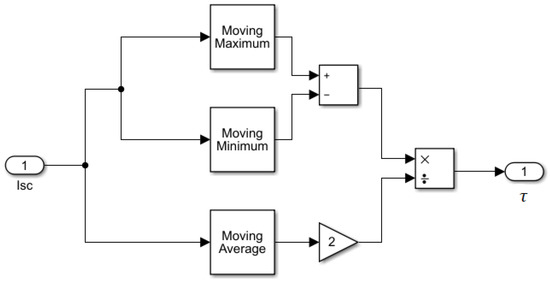
Figure 4.
Estimation of DC current ripple rate using MATLAB/Simulink software.
Equations (3) and (4) present the models of average resistance and capacitance based on the experimental data of 250 cycles, where is the temperature in [°C] which can be both positive and negative, shows the DC current ripple rate of the fluctuating current.
The coefficients of ESR(τ, T) and C(τ, T) obtained from the MATLAB/Simulink software curve fitting are given as following:
- = 0.0003792; = 5.621 × 10⁻⁵; = −2.404 × 10⁻⁵; = −8.543 × 10⁻⁵; = −4.027 × 10⁻⁶; = 1.806 × 10⁻⁶; = 3.121 × 10⁻⁵; = 5.061 × 10⁻⁶; = 2.195 × 10⁻⁷; = −5.729 × 10⁻⁸; = 4.126 × 10⁻⁷; = −2.358 × 10⁻⁷; = −2.053 × 10⁻⁹; = 8.262 × 10⁻¹⁰; = −3.794 × 10⁻⁹; = 2.454 × 10⁻⁹; = −4.921 × 10⁻¹²; = −4.368 × 10⁻¹²; = 0.0002545; = −4.52 × 10⁻⁵; = −4.99 × 10⁻⁶; = 0.0001134; = 2.515 × 10⁻⁶; = −2.011 × 10⁻⁷; = −0.0001405; = −1.408 × 10⁻⁶; = 9.691 × 10⁻⁸; = −2.756 × 10⁻⁹; = 6.51 × 10⁻⁵; = 9.86× 10⁻⁷; = −8.143 × 10⁻⁹; = 1.048 × 10⁻⁹
- = 2840; = −83.41; = −4.461; = −48.03; = 15.79; = 0.1995; = 56.97; = 2.843; = −1.01; = −0.004348; = −6.173; = 0.119; = 0.02064; = 2.579 × 10⁻⁵; = 0.1059; = −0.0032; = −0.0001268; = 2.078 × 10⁻⁸; = 3176; = −218.1; = 15.63; = 790.1; = −3.161; = 0.6165; = −931.8; = 4.677; = −0.09749; = 0.00804; = 371.1; = −2.306; = 0.04386; = −0.0006857
Evolution of the supercapacitor resistance and capacitance according to the temperature can be seen in Figure 5 and Figure 6. We can see that between −40 °C and 0 °C there is a decreasing trend in ESR whereas for temperatures between 0 °C and 65 °C it starts to increase. The reverse phenomenon is noticed for supercapacitor capacitance plotted in Figure 6, where between −40 °C and −5 °C the capacitance increases, and between −5 °C and 65 °C it decreases. These curves have a parabolic form with minimal resistance and maximal capacitance around −5 °C. Therefore, the temperature has a significant influence on the supercapacitors fast ageing. The resistance decreases and the capacitance increases when the temperatures are low [22,23]. On the other hand the resistance increases, and capacitance decreases when the temperatures reach high levels [19,20,24,25]. This phenomenon takes place because high temperatures cause side reactions at the electrode/electrolyte interface of the SCs between the electrolyte ions and the functional groups.
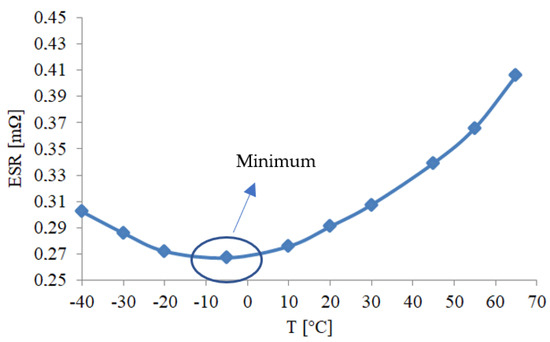
Figure 5.
Supercapacitor cell series resistance evolution with temperature.
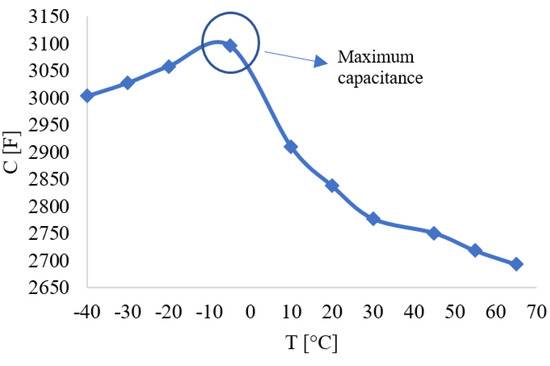
Figure 6.
Supercapacitor cell capacitance evolution with temperature.
Equations (5) and (6) present global resistance and capacitance of the supercapacitor cell including the SCs ageing factors ( and ) obtained from Equation (1).
The full electrical behavior model of the supercapacitors module is presented in Equation (7), where and show the number of supercapacitors cells connected in series and parallel respectively. is the initial voltage of the SC module while shows the resistance of electrical wiring for a single cell and is the specific coefficient.
Parameters of the supercapacitors module designed for our system are presented in Table 1. The model of the supercapacitors module used in our system is based on Maxwell Bootscap 3000 F/2.7 V cells.

Table 1.
Supercapacitors module parameters.
2.2. Fuel Cell Model
Fuel cells have high specific energy which means that more energy can be produced per unit area, however, they have low specific power. Fuel cells must operate under strict conditions because their life expectancy can be drastically affected if subjected to hostile conditions such as high DC current ripple. The fuel cell model used in our system is taken from [26] which is presented in Equation (8), where present the number of cells in series, is the thermodynamic potential for a single cell, is the voltage drop due to activation of anode and cathode, show the voltage drop caused by series resistance, is the voltage drop because of concentrations. In Equation (8), presents the temperature in [], and are the pressures of hydrogen and oxygen in [], is the fuel cell current, to are parametric coefficients, presents oxygen concentration, presents current density in [], is a constant parameter, is the resistance due to electrons flow, is the resistance due to protons flow, is the polymer membrane thickness in [], presents the active cell area in [], presents the specific resistivity due to hydrated protons in [] and γ presents membrane humidity ratio, and is the FC terminal voltage. Table 2 presents the used parameters by fuel cell model. The design is based on the assurance of DC-bus voltage control which has usually been set for up to 400 V dc for the industrial load and 330 Vdc for residential load [27].

Table 2.
Fuel cell parameters.
2.3. PV System Model
The PV model used in this work is obtained from the model proposed in [28]. Equation (9) gives us the output current of a single PV cell. This equation is implicit and nonlinear hence an analytical solution is difficult.
Here is the photogenerated current which is normally linear with the irradiance profile; is the saturation current due to recombination mechanism; is speed of light in vacuum, is solar cell terminal voltage; is solar cell terminal current; is the short circuit current; is the coefficient of temperature; is the solar irradiation which is show in Figure 7; is the cell resistance in series; is cell resistance in parallel; is diode quality factor; is Boltzmann’s constant; is the ambient cell temperature and is the measured cell temperature. For this study, 16 modules are connected in series which enable us to maintain a voltage level of 200 V at the DC bus side and 5 modules are connected in parallel which allow us to meet the load requirement when the irradiance is more than 1000 W/m2. The irradiance profile used in our system is obtained from the sensor data installed in our laboratory and is shown in Figure 7. The whole PV system contains 80 modules which can produce up to 30 kW under optimal working conditions. We have used 1 soltech 1 STH-350-AH module. The system relates to DC/DC converter which is controlled by an MPPT algorithm explained in the next section. Parameters of the designed PV system are presented in Table 3. More detailed information about the model can be found in [29].
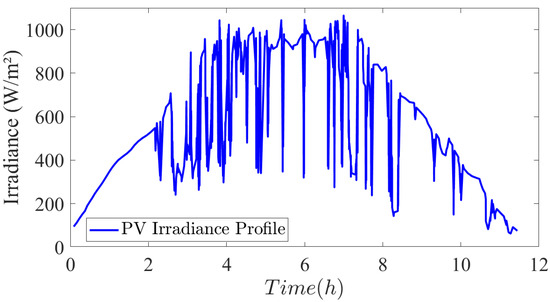
Figure 7.
PV Irradiance profile.

Table 3.
Solar PV panel parameters.
2.4. Model of the DC/DC Converters
Bidirectional buck-boost converter has been used for the control of charging and discharging operations of the SCs along with their protection and performance optimization. The mathematical model of the buck boost converter shown in Figure 8 is presented in Equation (10), where is the potential difference across the inductor connected with supercapacitors module, presents the buck or boost operation with values −1 and 1 respectively, is the power converter duty cycle and is the DC bus voltage.
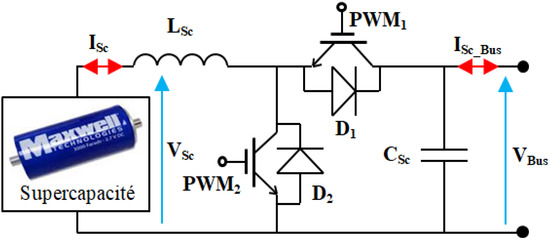
Figure 8.
Buck-boost converter connected with the supercapacitors.
The buck-boost converter shown in Figure 8 is controlled using polynomial based-control described in [30]. The interleaved boost controller used for DC-bus voltage control is presented in Figure 9. Behavior model of the interleaved boost converter is given in Equation (11). The control of interleaved boost converter is also focused on polynomial based-control discussed in [31].
where are the converter duty cycles, is the DC bus voltage, , and are the inductance and , , and are the change of current values across each inductor.
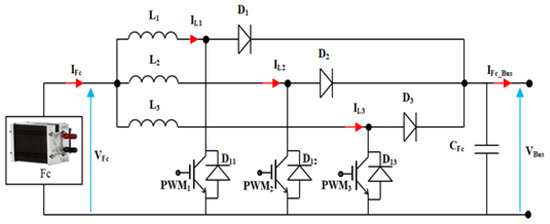
Figure 9.
Interleaved boost converter used to interface Fuel Cell.
3. Energy Management Based Supercapacitors Fast Ageing Control
The contribution of this work is that we have considered the electric ageing mechanism whivh cause the ESR and capacitance of the supercapacitors changing. In other terms, we propose an energy management based SCs fast ageing control by maximizing the capacitance and minimizing resistance of the SC module through adjusting the current control while maintaining a stable system operation around the optimal point. In this section, we will explain the energy management and control strategies used in our work. First, we will explain the high-level energy management technique based on filtering technique to extract high frequency current components of the system. Then, we will explain the capacitance and resistance control technique and how it affects the overall system operation. Secondly, an MPPT control is explained to extract the maximum power out of the Solar PV system. Lastly, DC-bus voltage control method will be explained using polynomial based-control technique for interleaved boost converters.
The following pseudo code shows the overall idea on the flow of the proposed energy management Algorithm 1:
| Algorithm 1. Pseudo code of the proposed energy management. |
| Initialize system parameters and variables While (simulation or real-time operation): Measure power output from PV system Measure power demand from the residential load Measure temperature and DC current ripple rate Calculate power fluctuation in the system Calculate aging rate of supercapacitors based on temperature and current ripple If (sufficient solar energy available): Supply power from PV system to meet the demand Else: Activate fuel cells to supply power to the system If (power fluctuation exceeds threshold): Adjust supercapacitors current control to mitigate power fluctuations Adjust supercapacitors resistance and capacitance based on aging rate Measure supercapacitors efficiency and capacitance If (aging control enabled): Compare measured efficiency and capacitance with target values If (efficiency or capacitance deviates significantly): Update supercapacitors resistance and capacitance to maintain optimal operation points Continue system operation End While |
3.1. Supercapacitors and Fuel Cell Reference Currents Generation Based Daptative Frequency Control
High-level energy management strategy has been used to calculate the reference currents for the low-level control loops. Figure 10 shows the reference currents calculation method used in energy management strategy. Here is the FC reference current in DC-bus which is multiplied by the voltage ratio to obtain the FC reference current input of the boost converter. is the DC-bus reference current for the supercapacitors, which is then multiplied by the voltage ratio to obtain the SCs reference current as illustrated in Figure 10.
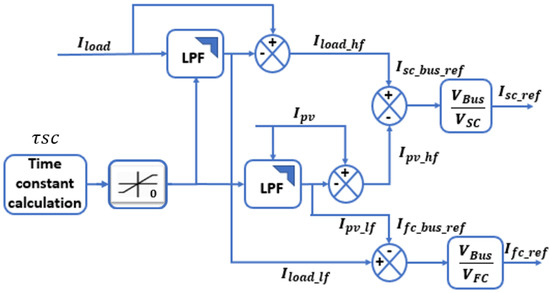
Figure 10.
Current reference calculation.
The configuration of the LPF with time constant access used in Figure 10 is presented in Figure 11. This configuration is necessary to do the time constant adjustment during the multi-source system operation. The time constant is calculated by the estimation of energy and power using the current and voltage measurements. This method is based on Equation (12), where is the estimated time constant based on energy and power of the SCs; Ts is the sapling period; is energy density of the SCs, is the power density of the SCs, Z is the variable of the discreet functions: , .
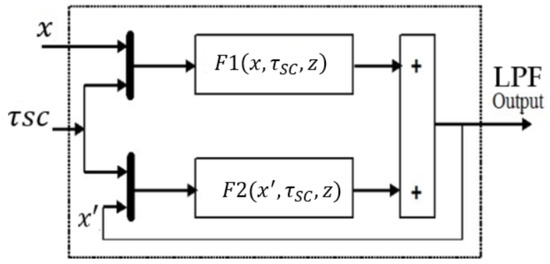
Figure 11.
Configuration of the numerical LPF with time constant access.
Equation (13) gives the mathematical representation of the designed energy management presented in Figure 11, where the fluctuating component is extracted from the PV current Ipv-HF and the load’s current ILoad-HF using the Low-Pass Filter (LPF) with adjustable time constant . Then, low frequency component is first extracted using the LPF and then subtracted from the remaining load’s current to obtain the Fuel cell reference current. From there we have estimated the FC and SC reference currents as presented in Equation (13).
3.2. Supercapacitors Fast Ageing Control Based Capacitance Maximization and Resistance Minimization
Supercapacitors bank has been used to mitigate the fluctuating components of the power in the system. Figure 12 shows the control technique used for the control of buck-boost converter which controls the supercapacitors capacitance variations from the SCs current and voltage measurements.
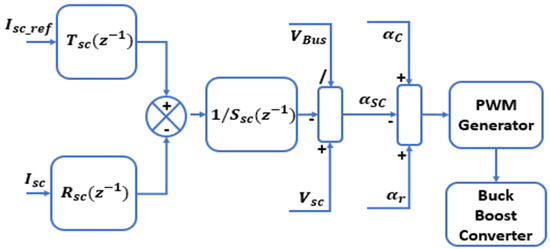
Figure 12.
SCs current control.
Equation (14) shows the mathematical model of the polynomial controller, where the value of depends on converter control frequency and it represents the current control bandwidth. is the sampling period. The buck boost converter is used to control the SCs current, and the control laws for the buck and boost operation mode are given in Equation (15).
These control laws are named as in Figure 12. The SCs current control signal is then added with the capacitance and resistance control signals and , then the sum of these 3 control signals is compared to a triangular waveform to modulate PWM signals for the buck-boost converter.
Model of the SCs includes an equivalent series resistance and equivalent capacitance . The ageing of the SCs module is defined by decrease of its capacitance and increase its resistance values when they are compared to initial value. Temperature and number of charging and discharging cycles are found to be the most important parameters which impact the SCs capacitance degradation [32]. In our case, the maximum degradation parameters are said to be 200% of the rated series resistance and 80% of the rated capacitance [33]. Conventional energy management strategies do not take the degradation of the SCs parameters into account. The key contribution of this work is the design of energy management considering the degradation of the SCs series resistance and its capacitance. The proposed energy management strategy minimizes the impact of fast ageing caused by the resistance increase, and capacitance decrease. Therefore, we have added the impacts of SCs equivalent capacitance and resistance variations in the current control loop in the form of duty cycle and . Figure 13 shows the capacitance control loop, where the reference of the SCs capacitance Cref is obtained from experimental data of cells characterization. has been calculated by using the experimental data and a lookup table to find the reference value in optimal temperature range. T and DC current ripple rate τ from Figure 4 are given as input to the system. Equation (16) shows the technique of capacitance estimation based the voltage and current measuring during microgrid operation. Here, Np*CN/NS shows the nominal capacitance of the SCs module-based series and parallel association.
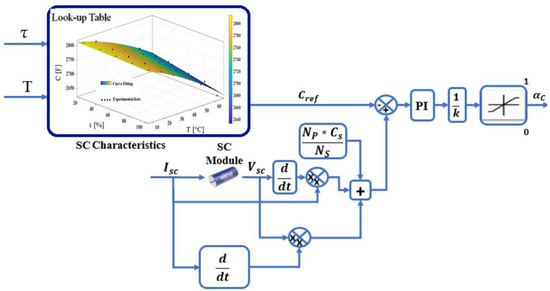
Figure 13.
SCs fast ageing control-based capacitance maximizing.
Equations (17) and (18) show the SCs pack efficiency during the charging and discharging operations. The efficiency of the SCs is the ratio of power used and power absorbed in the charging and discharging phase. The losses incurred in this case are purely joule losses which happen inside the SCs module often caused by the equivalent series resistance , [34].
Figure 14 shows the SCs energetic efficiency control strategy based on the SCs resistance minimization, where and are the duty cycles for the SCs charging and discharging operations respectively. Both signals are added to obtain a duty cycle presented in Equation (19) which is then added to the SCs current control duty cycle and capacitance control duty cycle to obtain the global control. The role of is to maximize the energetic efficiency of the supercapacitors within charge and discharge modes.
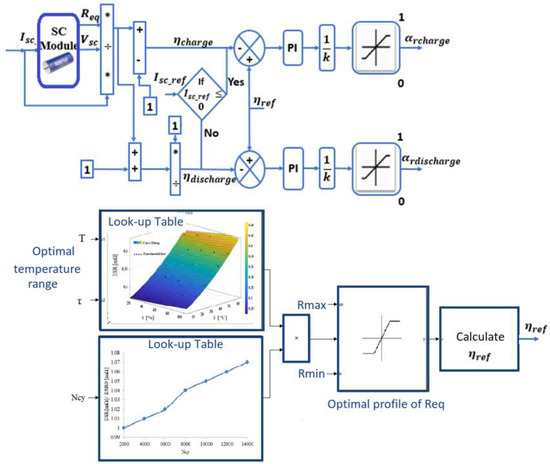
Figure 14.
SCs fast ageing control-based energetic efficiency maximizing (resistance minimizing).
The switching of charging and discharging cycles is based on the sign of the which has been estimated in the previous section. The reference of SCs energetic efficiency ηref is estimated from Look-up Tables based experimental data as illustrated in Figure 14, where Rmin is the initial value of the series resistance given in SCs datasheet for the new module, Rmax is the maximum limit fixed here to 2*Rmin. In other terms, the reference of the SCs energetic efficiency changes according to the SCs current magnitude, the operating temperature T, the DC current ripple rate τ, and the number of SCs charge/discharge cycles Ncy.
3.3. MPPT Control of the PV System
There are many techniques of the control of PV modules being proposed by the scientific community, but one that stands out the most is the maximum power point tracking (MPPT) technique. It is used to extract maximum power available at a certain point of time from the solar PV system, [35].
Equation (20) shows the mathematical model of the DC/DC converter, where and C are the inductance and capacitance of the boost converter respectively and D is the duty cycle which is used to control the converter. Figure 15 shows the flowchart of the algorithm that has been programmed in our system.
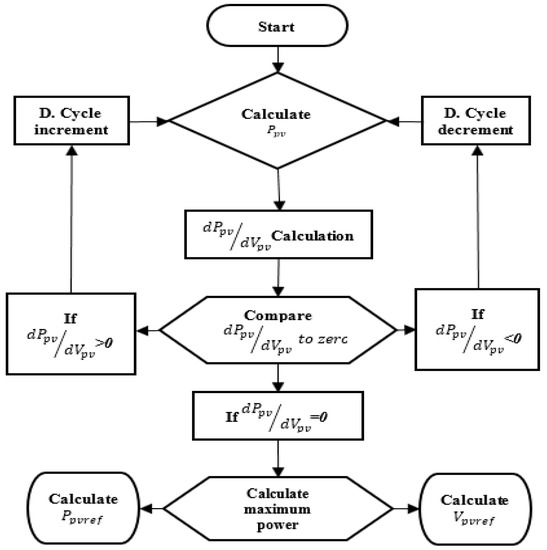
Figure 15.
MPPT Algorithm.
3.4. DC-Bus Voltage Control
In this work, we have used a single voltage control loop to achieve voltage control. The fuel cell current demand is calculated by taking the difference between the low frequency component of the load demand and the low frequency component of the PV current. To achieve a minimum static error and reject most of the disturbances, we have used polynomial-based control which is given in Equation (21), where is the sampling period, shows the bandwidth used for voltage control, and is the total capacitance in the DC-bus.
Fuel Cell (FC) is used in this work to maintain the DC-bus voltage level due to its high energy density with the help of an interleaved boost converter. The current of the FC system is not directedly controlled and we have left that to be automatically determined according to the system’s progress. FC current is therefore obtained from Kirchhoff’s current law which is equal to the load current after subtracting the contributions from the pack of the SCs and PV. Figure 16 shows the DC-bus voltage control loop, where the polynomial controller based on Equation (21) is used to maintain the DC-bus voltage through an interleaved boost converter.
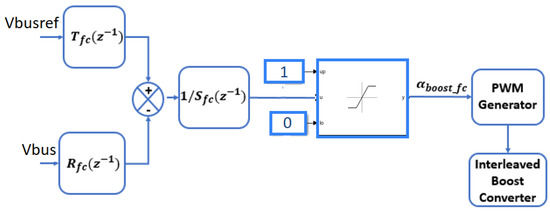
Figure 16.
DC bus voltage control.
4. Simulations Results and Discussions
In this work, the DC-bus voltage reference is respectively fixed to 330 V and 400 V to show the performances of the control [27]. The contribution of energy sources and the EVCS solicitations are presented in the current and power as the DC link voltages are more or less constant. The simulations are based on variable operating temperature of the supercapacitors modules to control the impacts of changing temperature on the SCs capacitance and efficiency. Used temperature profile is shown in Figure 16.
Figure 17 shows the temperature profile of the supercapacitors module. The supercapacitors model explained in Section 2 of the paper has temperature as a variable. The model used in this article only has two equations, one for positive temperatures and one for negative temperature. Here we consider the positive temperature as it contributes to the fast ageing as explained in Section 2. This temperature profile is given as an input to the model as the profile has two temperature levels 5 °C and 55 °C, it also contains a part of temperature transition which helps us analyze the model performance during the transition phase.
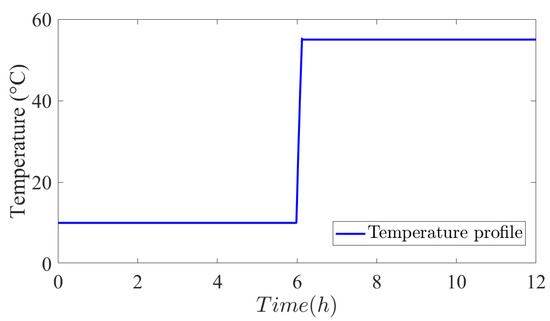
Figure 17.
Temperature profile.
Load’s model is based on the residential power demand including electric vehicle charging system for one day, extracted from [29] which shows the average power consumption of appliances. We have considered 12 h of this profile which last from 6 am to 6 pm. The load’s current profile used in the system simulations is given in Figure 18.
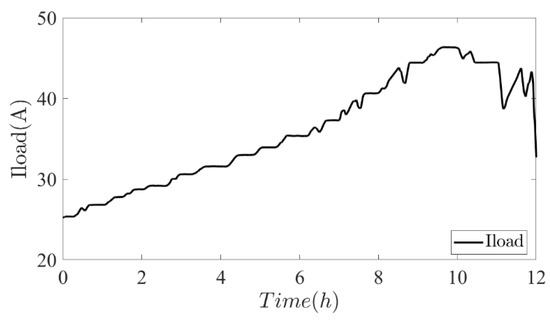
Figure 18.
Load’s current profile.
Figure 19 shows the power (load) demand for twelve hours of a day approximately. An increase in the demand can be noted after half of the time which is due to an increase in the DC-bus voltage level. Other than that, the power demand profile is strictly according to the appliances of residential households.
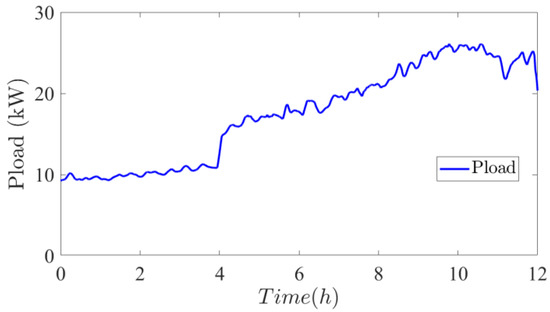
Figure 19.
Load power demand profile.
Figure 20 illustrates the DC-bus voltage control, where it can be observed that there is a good correlation between the and the actual . Two levels of DC-bus voltage reference are considered to see how the control system responds to a sudden change in the reference voltage level.
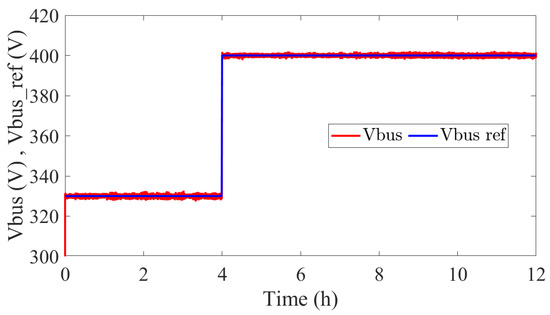
Figure 20.
DC bus voltage control result.
Figure 21 shows the SCs current control, where and are plotted on the same scale and we can clearly observe that there is a good correlation between the reference and the measured current.
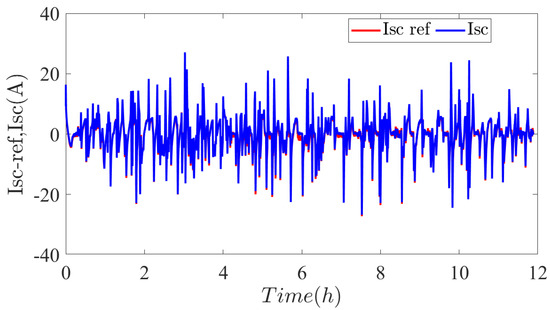
Figure 21.
SCs current control result.
Figure 22 shows the SCs efficiency control result. The control works perfectly despite many disturbances in the system and the change of temperature profile. The efficiency remains near the reference value and there is a good correlation with the reference of efficiency. The green line represents the supercapacitors energetic efficiency without the proposed control technique. The comparative analysis indicates that the average efficiency of the system increases from 97% to 99.5% which shows an average improvement of 2.5% during the overall time duration of 12 h. In this paper, the proposed concept focuses on optimal energy management using efficiency reference from an experimental database obtained by characterization tests of SCs based electrical and thermal constraints. In other words, the reference is obtained by reading the database as a function of temperature and supercapacitors current ripple rate as illustrated in Figure 14. The possible convergence problem is that of the controllers. The convergence criteria for SCs energetic efficiency can be expressed as presented in Equation (22).
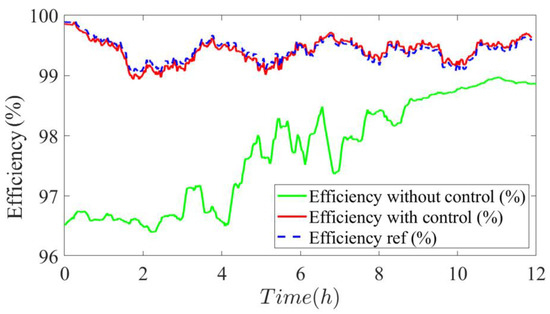
Figure 22.
SCs Energetic efficiency control result.
Here ηcharge/discharge denotes the evaluated efficiency of the supercapacitors system. ηref is the calculated reference efficiency. εη is an acceptable tolerance that determines the acceptable deviation from the reference efficiency. If the absolute difference between the measured efficiency and the target efficiency is smaller than εη, we consider the efficiency to have converged. The proof of convergence is illustrated by the concordance of the reference and measurement values in Figure 22, where error εη is less of 5%.
Figure 23 shows the SCs module capacitance Cest control result. We can observe some fluctuations in the capacitance measurement which is due to the delay time used to estimate the capacitance. It’s imporant to mention that it’s not possible to measure the capacitance of the running system, and it can only be estimated by using voltage and current measurements. Futhermore, is evident from the comparative analysis that the control is maintaining the capacitance along the optimal operational point. The green line shows the result obtained from simulations without the control technique, it also indicated that the SC capacitance decreases with time as the capacitors are directly subjected to DC current ripples at high temperatures. The comparactive analysis indicates that the average capacitance of the system with proposed control is about 40 F compared to that without control of 39 F, which shows an average improvement of 2.5% for an operating time of 12 h. The proposed concept for SCs capacitance control is too focused on optimal energy management using capacitance reference from an experimental database obtained by characterization tests of SCs based electrical and thermal constraints. In other words, the reference is obtained by reading the database as a function of temperature and supercapacitors current ripple rate as illustrated in Figure 13. The possible convergence problem is that of the controllers. The convergence criteria for SCs capacitance can be expressed as presented in Equation (23).
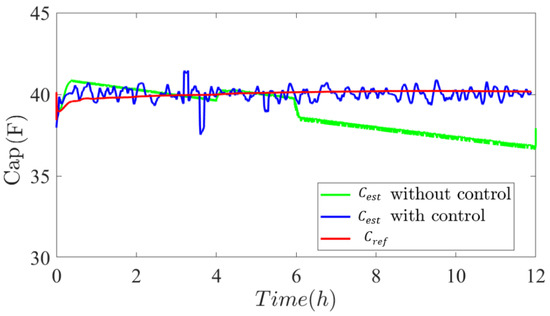
Figure 23.
SCs capacitance control result.
Here correspond to the capacitance of the supercapacitors system. is the reference target capacitance. is a small positive tolerance value that determines the acceptable deviation compared to the reference. If the absolute difference between the measured capacitance and the target capacitance is smaller than , we consider that capacitance has converged. The proof of convergence is illustrated by the concordance of the reference and measurement values in Figure 23, where error is less of 5%.
Figure 24, Figure 25 and Figure 26 show the power profiles of the PV, Fuel Cell (FC), and Supercapacitors (SCs) systems respectively. Here we can observe that has more fluctuations as compared to . It proves that the fluctuating power components from the PV and the load are being compensated by the SCs, and the low frequency components of the power from PV and load are taken care by the FC. In other words FC act as the base load supplier while the SCs act as the peak load suppliers and mitigate the power disturbances from PV and the load. We can see that all the powers of the system add up to supply the load with less power fluctuations for the Fuel Cell system.
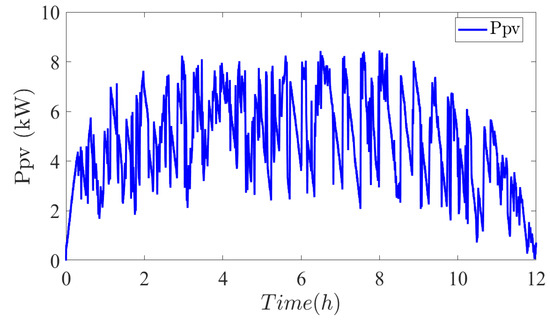
Figure 24.
PV system power.
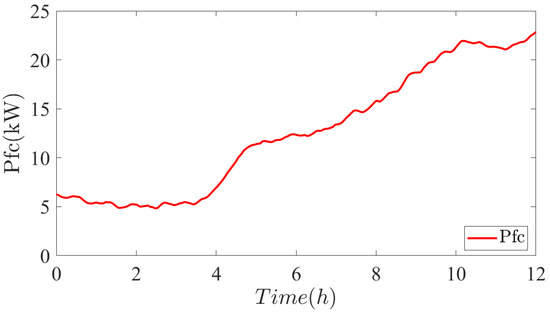
Figure 25.
Fuel cells power.
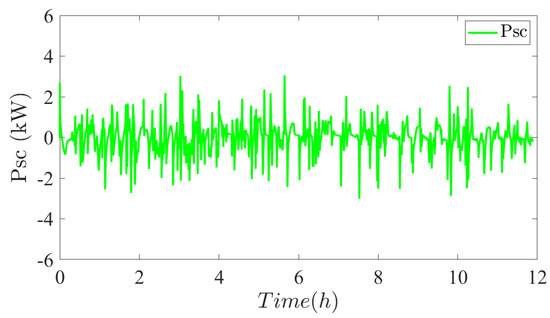
Figure 26.
Supercapacitors module power.
5. Conclusions
In this paper, the authors present a microgrid energy management approach based on supercapacitor (SC) fast aging control to minimize the accelerated degradation of SCs’ electrical parameters, particularly the series resistance and module capacitance. The system design depends on the cumulative residential energy demand and involves a microgrid configuration consisting of a photovoltaic (PV) system, supercapacitor module, fuel cells, and an electric vehicle charging system. The PV system is the primary power source, supplying energy whenever abundant solar resources are available. To ensure consistent operation and voltage control of the DC-bus, fuel cells are used as an energy source within the microgrid. Alongwith that, supercapacitors play a vital role in mitigating power oscillations that originate from the renewable energy production by the PV in the system. Therefore, supercapacitors are important to maintain the grid stability and optimal energy management. In order to understand the impact of aging on the supercapacitor’s performance, the proposed model considers the normal aging process over time. Additionally the control strategy presented by the authors effectively limits the fast aging of the supercapacitors, primarily caused by temperature variations and the ripple rate of the DC current. This control approach ensures that the electrical parameters of the supercapacitors are maintained around optimal operation point. The central focus of this research work was to develop an energy management concept centered around power fluctuation reduction in the PV—FC—Supercapacitors system. By successfully limiting the fast aging of the supercapacitors, the authors aimed to optimize their performance by controlling the parameters ilflicting the fast ageing within the supercapacitors. The results presented in this paper validate the effectiveness of the proposed approach in achieving these objectives. Furthermore, the authors present a comprehensive evaluation of the proposed control algorithm’s effectiveness. The authors conducted comparative analyses between the results obtained with the proposed aging control and the results obtained without it, considering supercapacitors efficiency and capacitance as performance metrics. The comparative results clearly display the effectiveness of the control algorithm in successfully managing the supercapacitors parameters, where the average efficiency and average capacitance of the system show an improvement of 2.5% for an operating time of 12 h. The proposed approach effectively limits the degradation of supercapacitor efficiency and optimizes the capacitance, leading to improved overall system performance. These findings highlight the importance of integrating the aging control strategy to maintain the desired operating characteristics of supercapacitors in microgrid systems. The findings of this study hold great implications for the larger context of microgrid and renewable energy integration. Moving forward, future research directions could explore the application of this control strategy to larger microgrid systems and investigate its compatibility with different renewable energy sources. Additionally, the incorporation of energy storage technologies and the development of nouvelle control algorithms can further boost the performance and efficacy of microgrid systems.
Author Contributions
Conceptualization, M.B.C. and B.D.; methodology, M.B.C.; software, A.B.; validation, A.B., M.B.C. and B.D.; formal analysis, M.B.C.; investigation, A.B.; resources, M.B.C.; data curation, A.B.; writing—original draft preparation, A.B.; writing—review and editing, M.B.C.; visualization, A.B.; supervision, M.B.C. and B.D.; project administration, M.B.C.; funding acquisition, M.B.C. and B.D. All authors have read and agreed to the published version of the manuscript.
Funding
This research received no external funding.
Data Availability Statement
The data presented in this study are available upon request from the corresponding author.
Acknowledgments
The authors would like to thank the Council of the Region Normandy/France, University of Le Havre Normandie, and the Council of the European Union for their financial support.
Conflicts of Interest
The authors declare no conflict of interest.
Nomenclature
| C(τ, T, Ncy) | Capacitance of the supercapacitor cell in (F) |
| ESR(τ, T, Ncy) | Resistance of the supercapacitor cell in (Ω) |
| EVCS | Electric Vehicle Charging Station |
| FC | Fuel cell |
| PV | Photovoltaic system |
| SC | Supercapacitor |
| Isc | Current of the supercapacitors in (A) |
| Ifc | Current of the fuel cell in (A) |
| Ipv | Current of the PV module in (A) |
| Iave | Average value of the intermittent current in (A) |
| Imax | Maximum value of the intermittent current in (A) |
| Imin | Minimum value of the intermittent current in (A) |
| ∆I | Intermittent current variation ranges in (A) |
| Ncy | Number of charge/discharge cycles |
| T | Supercapacitors operating temperature in (°C) |
| τ | Current ripple rate |
| Vfc | Fuel cell voltage in (V) |
| Vpv | PV module voltage in (V) |
| Vsc | Supercapacitor voltage in (V) |
References
- Khalid, H.M.; Peng, J.C.H. Bidirectional Charging in V2G Systems: An In-Cell Variation Analysis of Vehicle Batteries. IEEE Syst. J. 2020, 14, 3665–3675. [Google Scholar] [CrossRef]
- Khalid, H.M.; Ahmed, Q.; Peng, J.C.H.; Rizzoni, G. Current-Split Estimation in Li-Ion Battery Pack: An Enhanced Weighted Recursive Filter Method. IEEE Trans. Transp. Electrif. 2015, 1, 402–412. [Google Scholar] [CrossRef]
- Khalid, H.M.; Flitti, F.; Muyeen, S.M.; Elmoursi, M.; Sweidan, T.; Yu, X. Parameter Estimation of Vehicle Batteries in V2G Systems: An Exogenous Function-Based Approach. IEEE Trans. Ind. Electron. 2022, 69, 9535–9546. [Google Scholar] [CrossRef]
- Kouchachvili, L.; Yaïci, W.; Entchev, E. Hybrid Battery/Supercapacitor Energy Storage System for the Electric Vehicles. J. Power Sources 2018, 374, 237–248. [Google Scholar] [CrossRef]
- Hasan, M.K.; Mahmud, M.; Ahasan Habib, A.K.M.; Motakabber, S.M.A.; Islam, S. Review of Electric Vehicle Energy Storage and Management System: Standards, Issues, and Challenges. J. Energy Storage 2021, 41, 102940. [Google Scholar] [CrossRef]
- Aliakbari, R.; Kowsari, E.; Marfavi, Y.; Ramakrishna, S.; Chinnappan, A.; Cheshmeh, Z.A. Comprehensive Study on Poly Ortho-Aminophenol Composite Electrodes and Their Utilization for Supercapacitor Applications and Green Energy Storage: A Review. J. Energy Storage 2021, 44, 103365. [Google Scholar] [CrossRef]
- Sarr, C.T.; Camara, M.B.; Dakyo, B. Supercapacitors Characterization using Impedance Spectroscopy and taking account Dynamics Contraints and their combinations. In Proceedings of the 8th IEEE International Conference on Renewable Energy Research and Applications (ICRERA), Brasov, Romania, 3–6 November 2019. [Google Scholar] [CrossRef]
- Wang, C.; Liu, R.; Tang, A. Energy Management Strategy of Hybrid Energy Storage System for Electric Vehicles Based on Genetic Algorithm Optimization and Temperature Effect. J. Energy Storage 2022, 51, 104314. [Google Scholar] [CrossRef]
- He, J.; Shi, C.; Wei, T.; Peng, X.; Guan, Y. Hierarchical Optimal Energy Management Strategy of Hybrid Energy Storage Considering Uncertainty for a 100% Clean Energy Town. J. Energy Storage 2021, 41, 102917. [Google Scholar] [CrossRef]
- Baqar, A.; Camara, M.B.; Dakyo, B. Energy Management in the Multi-Source Systems. Energies 2022, 15, 2713. [Google Scholar] [CrossRef]
- Tankari, M.A.; Camara, M.B.; Dakyo, B.; Lefebvre, G. Use of Ultracapacitors and Batteries for Efficient Energy Management in Wind-Diesel Hybrid System. IEEE Trans. Sustain. Energy 2013, 4, 414–424. [Google Scholar] [CrossRef]
- Njoya Motapon, S.; Dessaint, L.A.; Al-Haddad, K. A Comparative Study of Energy Management Schemes for a Fuel-Cell Hybrid Emergency Power System of More-Electric Aircraft. IEEE Trans. Ind. Electron. 2014, 61, 1320–1334. [Google Scholar] [CrossRef]
- Rezk, H.; Nassef, A.M.; Abdelkareem, M.A.; Alami, A.H.; Fathy, A. Comparison among Various Energy Management Strategies for Reducing Hydrogen Consumption in a Hybrid Fuel Cell/Supercapacitor/Battery System. Int. J. Hydrogen Energy 2021, 46, 6110–6126. [Google Scholar] [CrossRef]
- Romero, A.; Carvalho, M.; Millar, D. Optimal Design and Control of Wind-Diesel Hybrid Energy Systems for Remote Arctic Mines. In Proceedings of the 28th International Conference on Efficiency, Cost, Optimization, Simulation and Environmental Impact of Energy Systems, Pau, France, 29 June–3 July 2015; p. 138. [Google Scholar] [CrossRef]
- Guentri, H.; Allaoui, T.; Mekki, M.; Denai, M. Power Management and Control of A Photovoltaic System with Hybrid Battery-Supercapacitor Energy Storage Based On Heuristics Methods. J. Energy Storage 2021, 39, 102578. [Google Scholar] [CrossRef]
- Asensio, E.M.; Magallán, G.A.; De Angelo, C.H.; Serra, F.M. Energy Management on Battery/Ultracapacitor Hybrid Energy Storage System Based on Adjustable Bandwidth Filter and Sliding-Mode Control. J. Energy Storage 2020, 30, 101569. [Google Scholar] [CrossRef]
- Župan, I.; Šunde, V.; Ban, Ž.; Krušelj, D. Algorithm with Temperature-Dependent Maximum Charging Current of a Supercapacitor Module in a Tram Regenerative Braking System. J. Energy Storage 2021, 36, 102378. [Google Scholar] [CrossRef]
- Zhao, J.; Burke, A.F. Review on Supercapacitors: Technologies and Performance Evaluation. J. Energy Chem. 2021, 59, 276–291. [Google Scholar] [CrossRef]
- Rahman, A.U.; Zehra, S.S.; Ahmad, I.; Armghan, H. Fuzzy Supertwisting Sliding Mode-Based Energy Management and Control of Hybrid Energy Storage System in Electric Vehicle Considering Fuel Economy. J. Energy Storage 2021, 37, 102468. [Google Scholar] [CrossRef]
- Sarr, C.T.; Camara, M.B.; Dakyo, B. Supercapacitors Aging Assessment in Wind/Tidal Intermittent Energies Application with Variable Temperature. J. Energy Storage 2022, 46, 103790. [Google Scholar] [CrossRef]
- Sarr, C.T.; Camara, M.B.; Dakyo, B. Influence of Cycles Number and RMS Value of DC-Current Ripple on Supercapacitors Aging. In Proceedings of the 7th International Conference on Clean. Electrical Power: Renewable Energy Resources Impact, Otranto, Italy, 2–4 July 2019; pp. 539–543. [Google Scholar] [CrossRef]
- Gualous, H.; Louahlia, H.; Gallay, R. Supercapacitor Characterization and Thermal Modelling with Reversible and Irreversible Heat Effect. IEEE Trans. Power Electron. 2011, 26, 3402–3409. [Google Scholar] [CrossRef]
- Gualous, H.; Chaoui, H.S.; Gallay, R. Supercapacitor calendar aging for telecommunication applications. In Proceedings of the INTELEC-2016 IEEE International Telecommunications Energy Conference, Austin, TX, USA, 23–27 October 2016. [Google Scholar] [CrossRef]
- Ionescu, C.; Vasile, A.; Negroiu, R. Accurate Modeling of Supercapacitors for DC Operation Regime. In Proceedings of the IEEE 21st International Symposium for Design and Technology of Electronics Packages (SIITME), Craiova, Romania, 22–25 October 2015; pp. 303–306. [Google Scholar] [CrossRef]
- Liu, K.; Zhu, C.; Lu, R.; Chan, C.C. Improved Study of Temperature Dependence Equivalent Circuit Model for Supercapacitors. IEEE Trans. Plasma Sci. 2013, 41, 1267–1271. [Google Scholar] [CrossRef]
- Wang, Y.X.; Ou, K.; Kim, Y.B. Modeling and Experimental Validation of Hybrid Proton Exchange Membrane Fuel Cell/Battery System for Power Management Control. Int. J. Hydrogen Energy 2015, 40, 11713–11721. [Google Scholar] [CrossRef]
- Anand, S.; Fernandes, B.G. Optimal Voltage Level for DC Microgrids. In Proceedings of the 36th Annual Conference of Industrial Electronics Society, Glendale, AZ, USA, 7–10 November 2010; pp. 3034–3039. [Google Scholar] [CrossRef]
- Parhizi, S.; Lotfi, H.; Khodaei, A.; Bahramirad, S. State of the Art in Research on Microgrids: A Review. IEEE Access 2015, 3, 890–925. [Google Scholar] [CrossRef]
- Tani, A.; Camara, M.B.; Dakyo, B. Energy Management in the Decentralized Generation Systems Based on Renewable Energy-Ultracapacitors and Battery to Compensate the Wind/Load Power Fluctuations. IEEE Trans. Ind. Appl. 2015, 51, 1817–1827. [Google Scholar] [CrossRef]
- Camara, M.B.; Gualous, H.; Gustin, F.; Berthon, A.; Dakyo, B. DC/DC Converter Design for Supercapacitor and Battery Power Management in Hybrid Vehicle Applicationspolynomial Control Strategy. IEEE Trans. Ind. Electron. 2010, 57, 587–597. [Google Scholar] [CrossRef]
- Al Amerl, A.; Oukkacha, I.; Camara, M.B.; Dakyo, B. Real-Time Control Strategy of Fuel Cell and Battery System for Electric Hybrid Boat Application. Sustainability 2021, 13, 8693. [Google Scholar] [CrossRef]
- Bellache, K.; Camara, M.B.; Dakyo, B. Supercapacitors Characterization and Modeling Using Combined Electro-Thermal Stress Approach Batteries. IEEE Trans. Ind. Appl. 2019, 55, 1817–1827. [Google Scholar] [CrossRef]
- Cell, U. Maxwell’s High Power and Energy Cell. Available online: https://maxwell.com/products/ultracapacitors/cells/ (accessed on 25 June 2023).
- Nguyễn, B.H.; Vo-Duy, T.; Henggeler Antunes, C.; Trovão, J.P.F. Multi-Objective Benchmark for Energy Management of Dual-Source Electric Vehicles: An Optimal Control Approach. Energy 2021, 223, 119857. [Google Scholar] [CrossRef]
- Benyahia, N.; Denoun, H.; Zaouia, M.; Tamalouzt, S.; Bouheraoua, M.; Benamrouche, N.; Rekioua, T.; Haddad, S. Characterization and Control of Supercapacitors Bank for Stand-Alone Photovoltaic Energy. Energy Procedia 2013, 42, 539–548. [Google Scholar] [CrossRef]
Disclaimer/Publisher’s Note: The statements, opinions and data contained in all publications are solely those of the individual author(s) and contributor(s) and not of MDPI and/or the editor(s). MDPI and/or the editor(s) disclaim responsibility for any injury to people or property resulting from any ideas, methods, instructions or products referred to in the content. |
© 2023 by the authors. Licensee MDPI, Basel, Switzerland. This article is an open access article distributed under the terms and conditions of the Creative Commons Attribution (CC BY) license (https://creativecommons.org/licenses/by/4.0/).