Abstract
The adhesive properties of aircraft icing play an important role in guiding the design of protection systems, while the formation environment, freezing process, and measurement methods have a great impact on the mechanical characteristics of ice, leading to significant differences in the available experimental results. Therefore, to improve the proximity between the experimental simulation and the actual process of inflight ice shedding, a generation system for the water cloud environment was built and integrated with a set of rotary measuring mechanisms in this paper, allowing the adhesion strength of impact ice to be measured online. In the present test, the appearance characteristics of ice formed under different conditions were observed and analyzed, with the range of its adhesion strength determined. And the effects of freezing mode, ambient temperature, and wind speed on ice adhesion were further discussed. It can be found that the impact ice has a more irregular shape and less adhesion compared to the static ice, and this difference will grow larger with the drop in ambient temperature. In addition, the adhesion of ice first increases and then decreases with the rising ambient temperature, reaching the maximum value (0.254 MPa) around −12 °C. When the flow velocity in the test section increases, the freezing process of water on the substrate will slow down, leading to greater surface adhesion.
1. Introduction
The physical and mechanical properties of ice formed under various environmental and interface conditions are crucial for fundamental research in materials and mechanics and also have widespread practical value in the field of engineering technology. Many fields involve the discussion of the mechanical performance and material properties of ice, such as glacier movement [1,2], lake ice growth [3,4], food refrigeration [5], and so on. However, the internal structures of ice with varied growth histories are essentially different, leading to poor universality of its physical parameters. In the aviation field, after long-term data accumulation, a certain understanding of the shape and characteristics of ice accretion under different meteorological conditions has been established. Aircraft icing can be divided into three types according to its shape and construction: glaze ice, rime ice, and mixed ice [6]. Their mechanical properties are generally obtained through different experimental methods [7]. As shown in Figure 1, when measuring the shear strength closely related to aircraft deicing, the most commonly used methods are centrifugal type [8] and side push type [9].
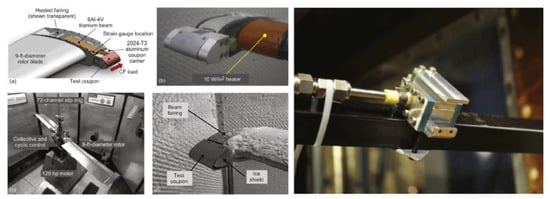
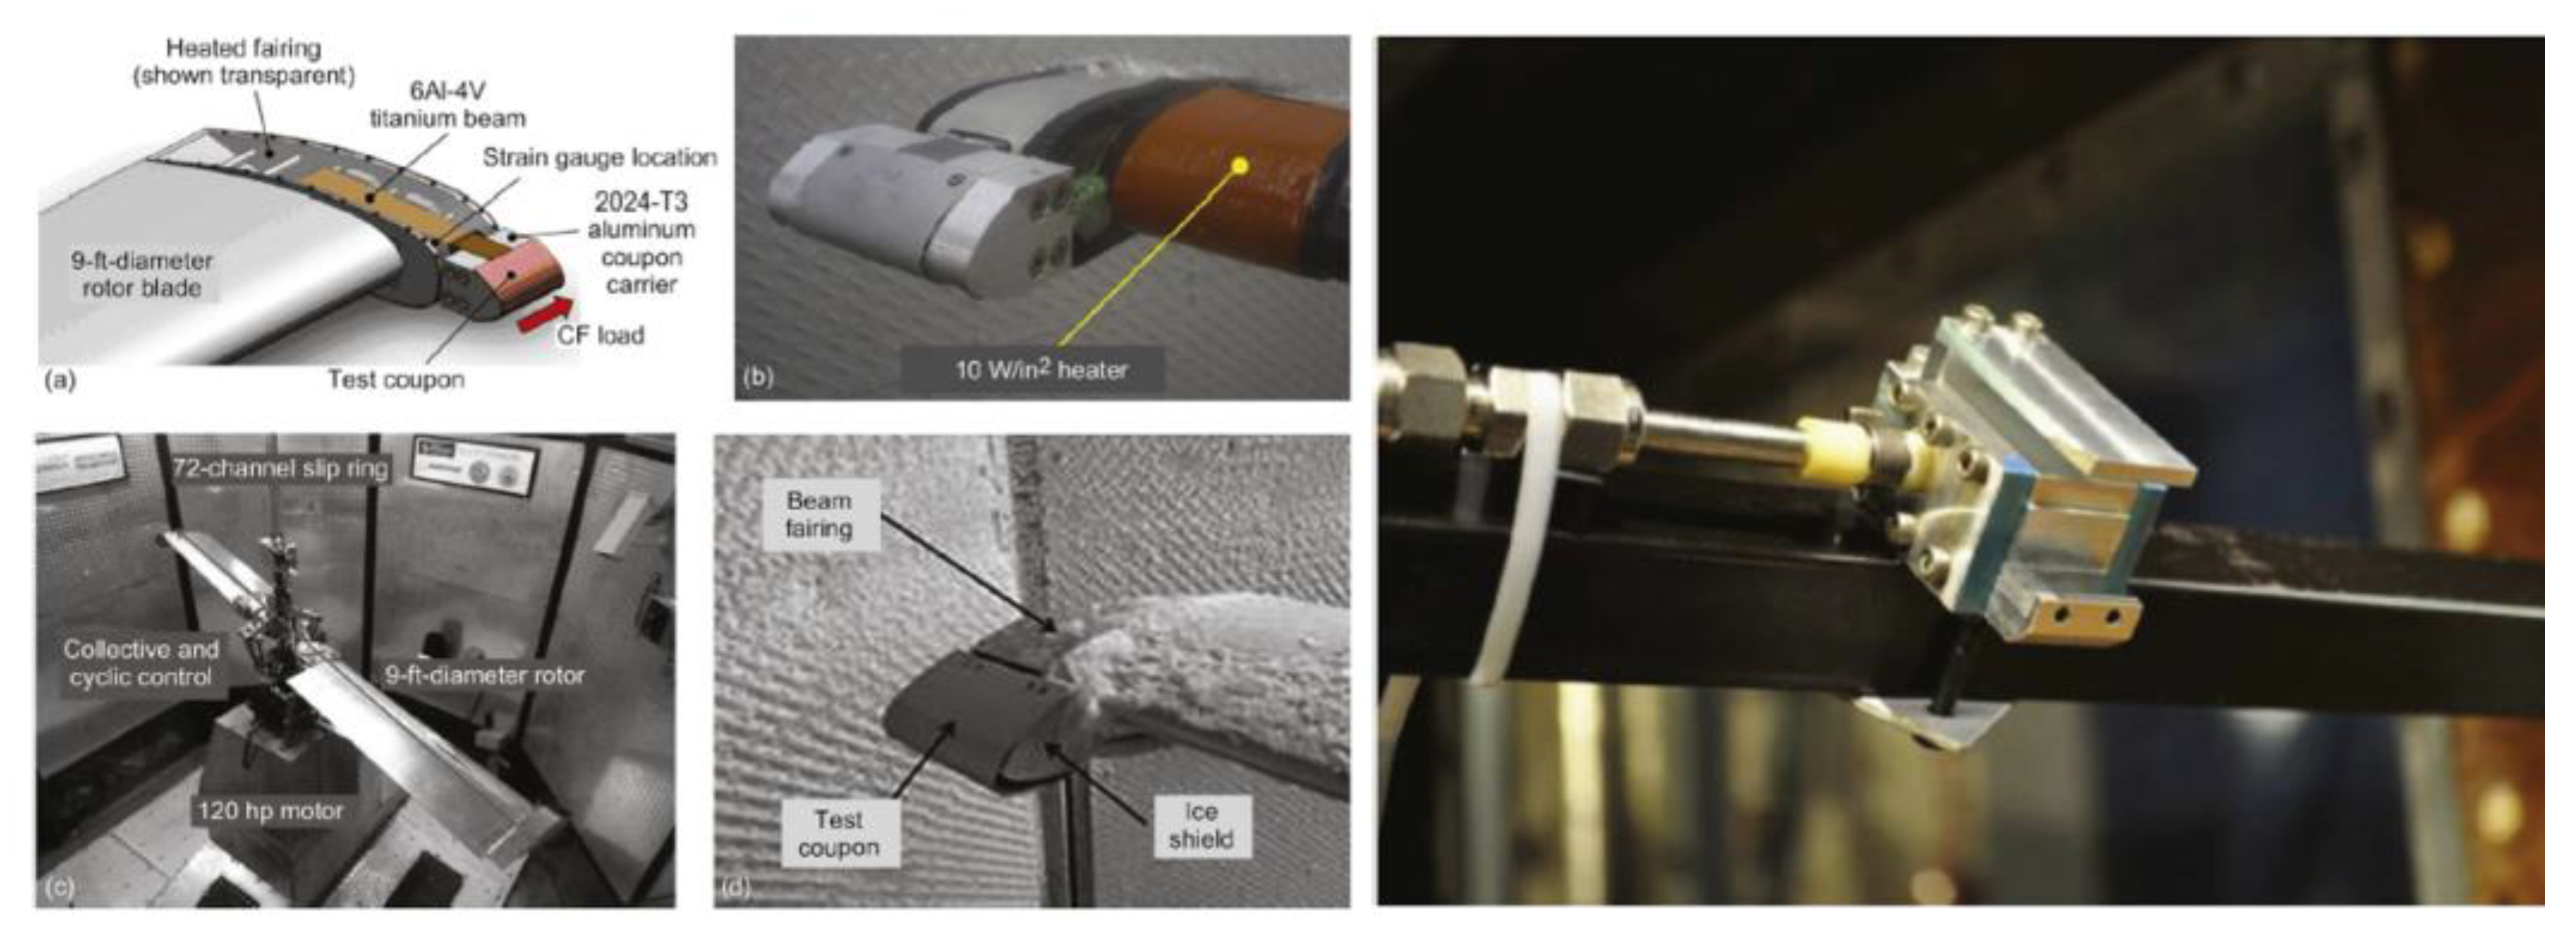
Figure 1.
The adverse environment rotor test stand (AERTS) [8] (left) (a–d) and the side push test stand in an icing wind tunnel [9] (right).
The adhesion strength of ice can be divided into tensile strength, compressive strength, and shear strength according to the different stress directions. There have been some available research on the range of ice adhesion in academia. Druez [10], Phan [11], and Laforte [12] have studied the adhesion strength of rime ice and glaze ice formed around the aluminum ropes of transmission lines under natural conditions, and the measured viscosity shear strength ranges from 0.067 to 0.4 MPa and shows a tendency to increase with wind speed and surface roughness. Stallabrass, Price [13], and Itagaki [14] used a needle tube to extrude water droplets and freeze them on a cold surface; the measured viscous shear strength between ice and substrate is relatively small, ranging from 0.03 to 0.07 MPa at an ambient temperature of −6.6 °C. The Canadian International Anti-Icing Material Laboratory (AMIL) carried out a centrifugal test for adhesion measurement in a constant-temperature room [15] and found that the shear strength of ice was about 0.35 MPa at −10 °C. The above experimental data were all obtained by the centrifugal force measuring method that uses rotating devices. However, due to the different freezing processes generated, these measured data still vary greatly, indicating that the formation conditions of ice have a significant impact on its adhesive properties.
Based on the mechanical deicing method, the ice shear strength was measured by Scavuzzo et al. using a double-layer cylindrical device in an IRT wind tunnel of NASA [16], and the main factors affecting the shear strength were comprehensively studied, showing that the shear strength of rime ice (0.12 MPa) only accounts for 30% of that of glaze ice (0.4 MPa). According to the interaction mechanism of electrostatics and mechanics, Perron and Forten have established a shear-strength calculation model related to ice shedding [17,18] and measured the viscous shear strength of ice through the rotating-blade test bench (SRB). In addition, Petrenko et al. revealed the microscopic mechanism of the formation of ice adhesion and divided the bonding mode between ice and substrate into three categories: chemical bond, Van der Waals force, and electrostatic force [19].
As a special material, the physical properties of inflight dynamic icing are complex and changeable, leading to the high difficulty in measuring its specific mechanical parameters and the uncertainty in selecting available methods. There have been some experimental studies on the value range of the ice adhesion for reference, while different tests focus on different objects in which the conditions of ice formation vary greatly, resulting in a significant gap between the available experimental data. There is still much room for relevant research in the aviation field. Therefore, to conduct on-line measurement for the adhesion strength of the ice, a vertical-reflux wind tunnel was designed and established in the present work, which integrates the generation system for a water cloud environment with the rotary measurement actuator, making the formation process of the impact ice close enough to the real inflight icing so as to improve the reference value of the obtained experimental results.
2. Experimental Principle and Method
According to the classical d’Alembert principle, at any moment when a particle is forced to move, the active force, binding force, and inertial force acting on the particle are balanced with each other [20]. Based on this, the dynamic problem of ice shedding caused by rotation can be transformed into a static problem. Assuming that the rotating component is a rigid body, its movement will generate centrifugal forces related to rotational speed and radius of rotation, which act on the ice attached to the rotating beam in the form of inertial forces. At the moment when the ice falls off, it can be considered that the shear-adhesion force between the ice and the substrate surface is equal to the inertial force (i.e., the centrifugal force generated by rotation) it receives.
Based on the above analysis, the force–balance relationship at the moment of ice shedding can be established as:
where Fc is the centrifugal force generated by the rotating beam, τ is the shear-adhesion force between the ice and the substrate, and Aice represents the contact area between the ice and the substrate.
Assuming that the mass of the attached ice formed during the freezing process is uniform, it can be considered that the action point of the centrifugal force is at the geometric center of the ice accumulation. Combining the calculation formula of the centrifugal force, it can be obtained that:
where Rbeam is the distance from the center of the rotating shaft to the center of the attached ice. The mass of the attached ice is mice, which can be determined by the mass variation of the experimental platform before and after ice shedding, and Ω represents the rotational angular velocity at the moment of ice shedding.
Substituting Equation (2) into Equation (1), and assuming that the icing experimental platform is circular and has a radius of Rice, the shear-adhesion force between the ice and the substrate can then be obtained:
Equation (3) reveals the calculation method for centrifugal measurement of ice adhesion in principle. However, when the real icing conditions are simulated, the ice shape can be more complex and the position of the center of mass is difficult to determine. Therefore, the irregular ice shape should be regularized before the beginning of the test to reduce calculation errors caused by the presented theoretical method.
In addition, the way of ice shedding during the experiment has a significant impact on the accuracy of the measurement results. Generally, there are two typical forms of ice failure in adhesion-measurement experiments: cohesive failure and adhesive failure. These two forms have different mechanisms of action and performance characteristics [17]. The cohesive failure is the separation of different ice layers from each other. In contrast, adhesive failure occurs at the interface between the ice and the substrate surface, while the crystal structure of the ice itself remains intact. The cohesive failure is manifested as structural fracture and there will be crystal residues on the substrate surface. While after the adhesive failure occurs, the accumulated ice integrally separates from the substrate, and no crystal residue can be found on the surface of the substrate. In this paper, the calculation principle and the test method are more applicable to the study of adhesive failure and the simulation object is also the overall separation of the impact ice during aircraft deicing. Therefore, when recording and analyzing the test results, the situation of cohesive failure should be screened out to avoid interference with the final conclusions.
3. Design of the Measurement System
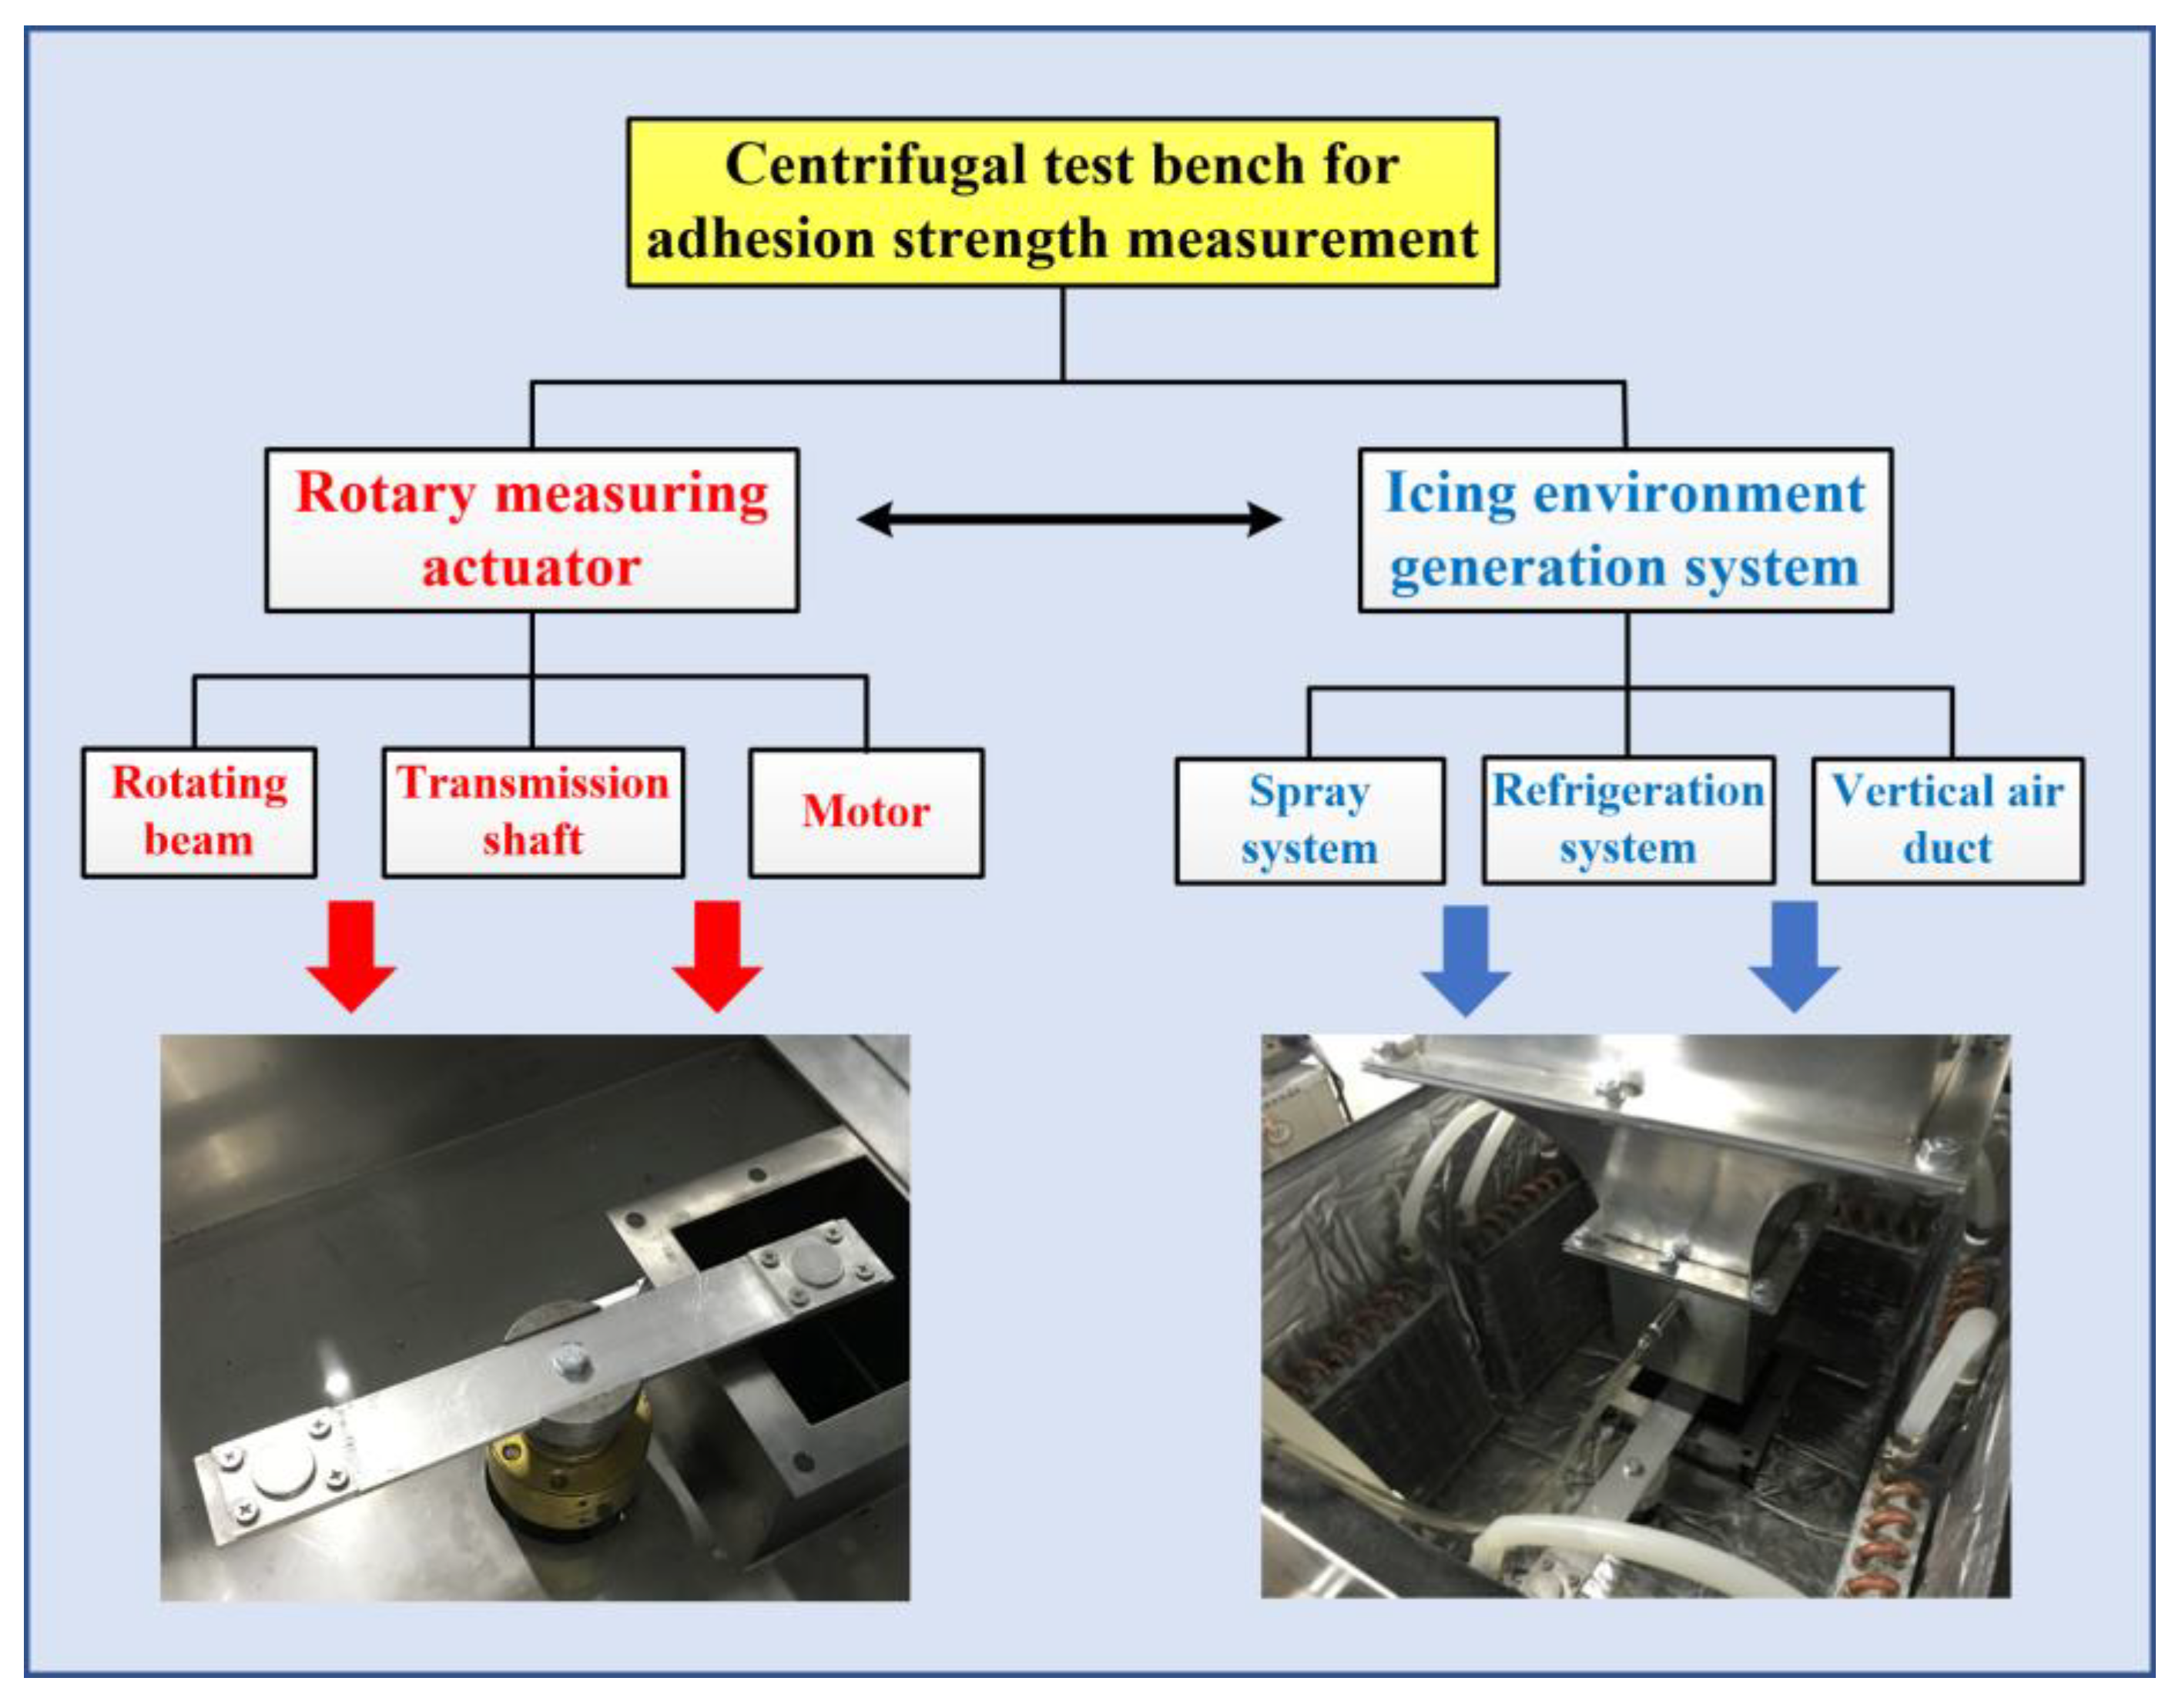
In the present work, an integrated design idea is used to build the experimental setup. The subsystems, such as the rotary measuring actuator, the refrigeration system, the spray system, and the vertical air duct are integrated closely to improve the proximity between experimental simulation and the real process of inflight ice shedding. The composition of the measurement system is shown in Figure 2.
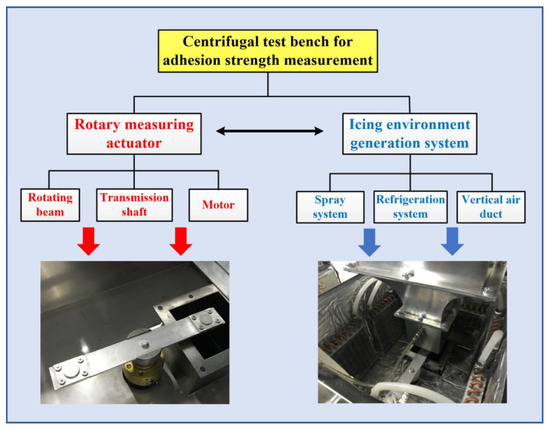
Figure 2.
Components of the measurement system for ice adhesion.
The rotary measuring actuator is mainly composed of a rotating beam, a beam seat, an icing platform, a motor, a transmission shaft, and some corresponding connectors [21]. The rotating beam is driven by a motor to generate the centrifugal force that acts on the attached ice. The icing platform is installed at the end of the beam, which is made of aluminum. To ensure force balance during the test and reduce vibration, icing platforms with the same mass are installed at both ends. One end of the transmission shaft is connected to the motor shaft through a coupling, and the other end is fitted to the rotating beam seat in an interference-fit manner to transmit the torque output of the motor to the rotating beam, making it perform circular motion at a certain speed.
The refrigeration system consists of a stainless-steel tank, a surface cooler, a coolant circulator, insulation cotton, and connecting hoses. The coolant circulator transmits low-temperature alcohol refrigerant to the copper tube of the surface cooler, transferring the cooling capacity to the air inside the tank that is isolated from the outside to reduce the overall temperature of the inner space. The purpose of the spray system is to create a stable and uniform cloud of water droplets in the test section. It provides a water droplet source with a certain initial speed to make the droplets hit the surface of the experimental platform and freeze in the cold environment. This spray system mainly includes a nozzle, a barometer, an air filter, an air switch valve, and a liquid filter.
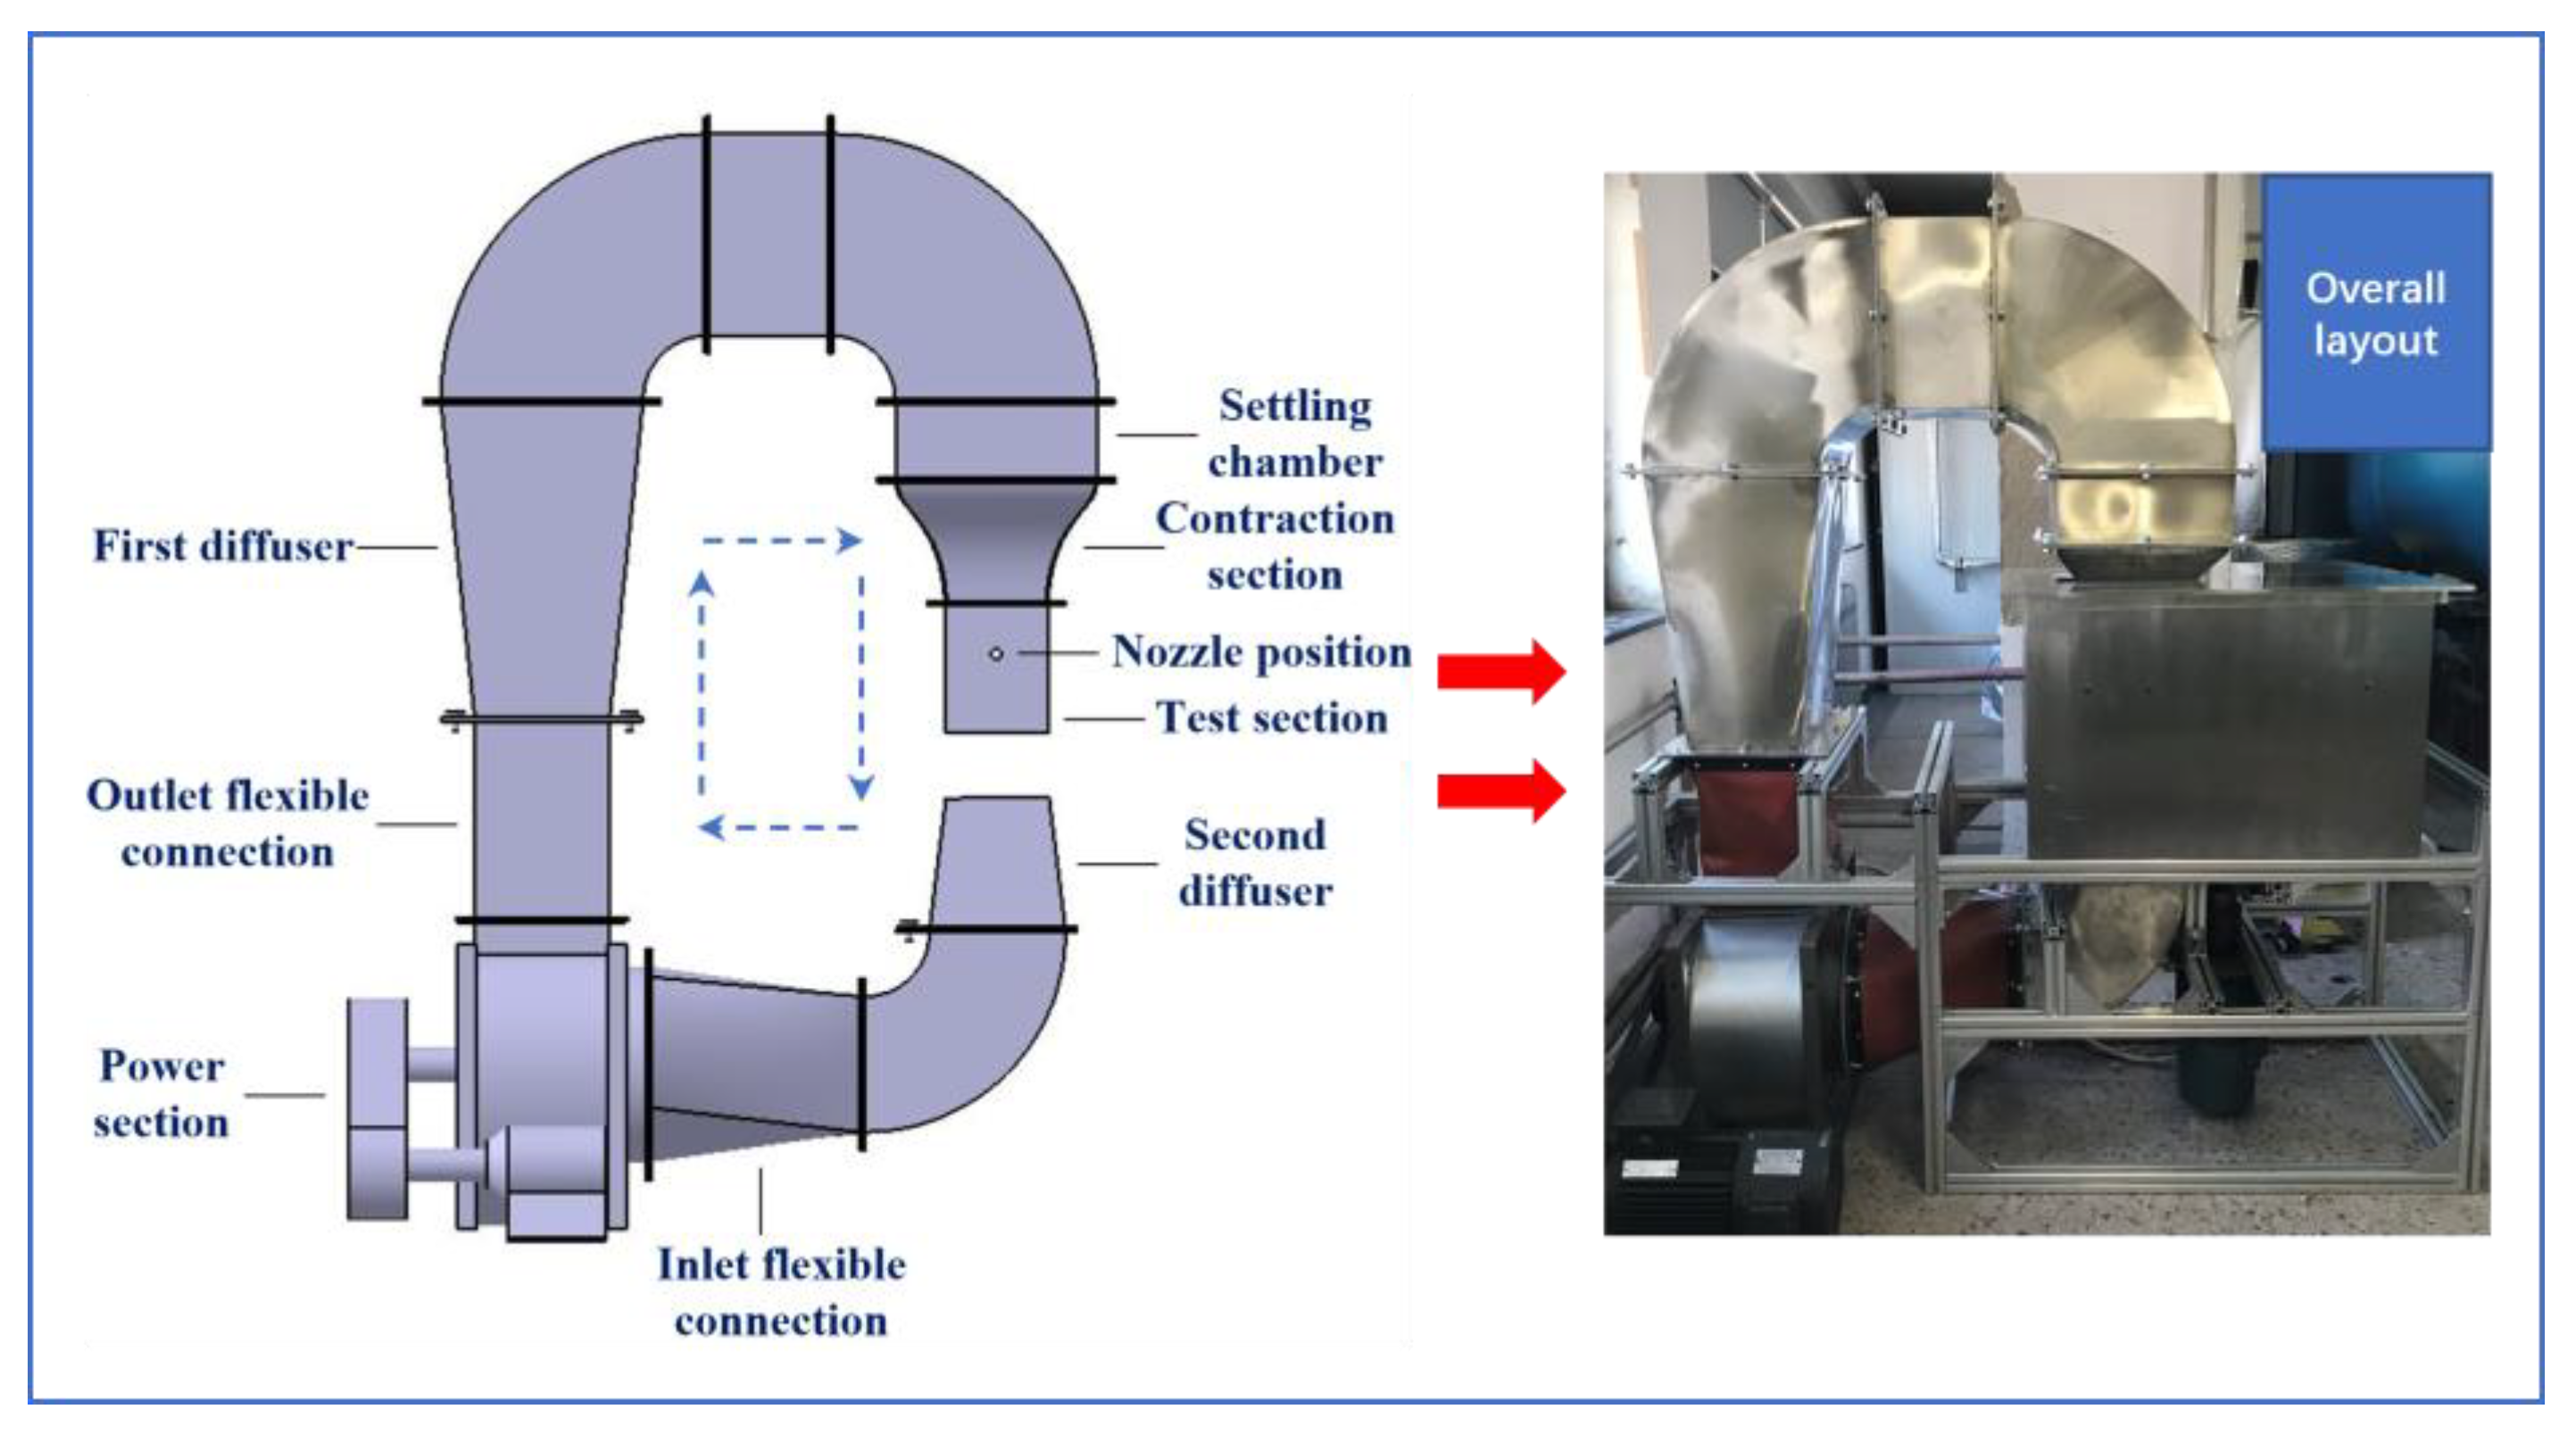
A wind tunnel system is designed to provide uniform airflow and adjustable wind speed for this experiment, which includes the air-duct design and pressure-drop calculation. This system is designed in the form of a vertical wind tunnel to provide upright airflow for the rotating measurement platform. In addition, to maintain a cold environment for icing inside the test section, the wind-tunnel system is required to achieve the circulation function of cold air; thus it should be of the reflux type.
According to the above design requirements of this experiment, and with reference to the standardized design manual for vertical reflux wind tunnels [22], the overall structural design of the wind tunnel is shown in Figure 3 and its power section is a centrifugal fan. To reduce the impact of vibration generated during the operation of the fan on other parts of the wind tunnel, two soft connection sections are installed at both the inlet and outlet of the fan to absorb vibration energy. The requirements for the contraction section curve mainly include two points: (a) the curve function is second-order derivable to ensure that there is no separation from the wall surface during the acceleration process of the airflow; (b) to avoid large overshoots at the outlet of the contraction section, the ratio of the curvature radius of the inlet and outlet should be as close as possible to the ratio of the inlet and outlet area [23]. A bicubic curve selected in the experimental design can well meet these requirements, which are described as:
where L is the length of the contraction section and xm represents the connection point of the front and rear two curves, which is taken as 0.5 in the design of this paper. Hin and Hout represent the height of the inlet and outlet sections of the contraction section from the central axis; x is the axial distance, and H is the height of the curve corresponding to the axial distance x.

Figure 3.
The components and assembly of the wind tunnel system.
4. Procedure of the Test
As described above, the whole experimental setup consists of a rotary measuring actuator, a refrigeration system, a spray system, and a vertical reflux wind tunnel. In addition, corresponding accessories are provided, including a water chiller, a temperature acquisition device, a host computer, several thermocouples, a weighing instrument, and a compressor. After the overall installation and commissioning of the system are completed, the measurement test of ice adhesion can be conducted.
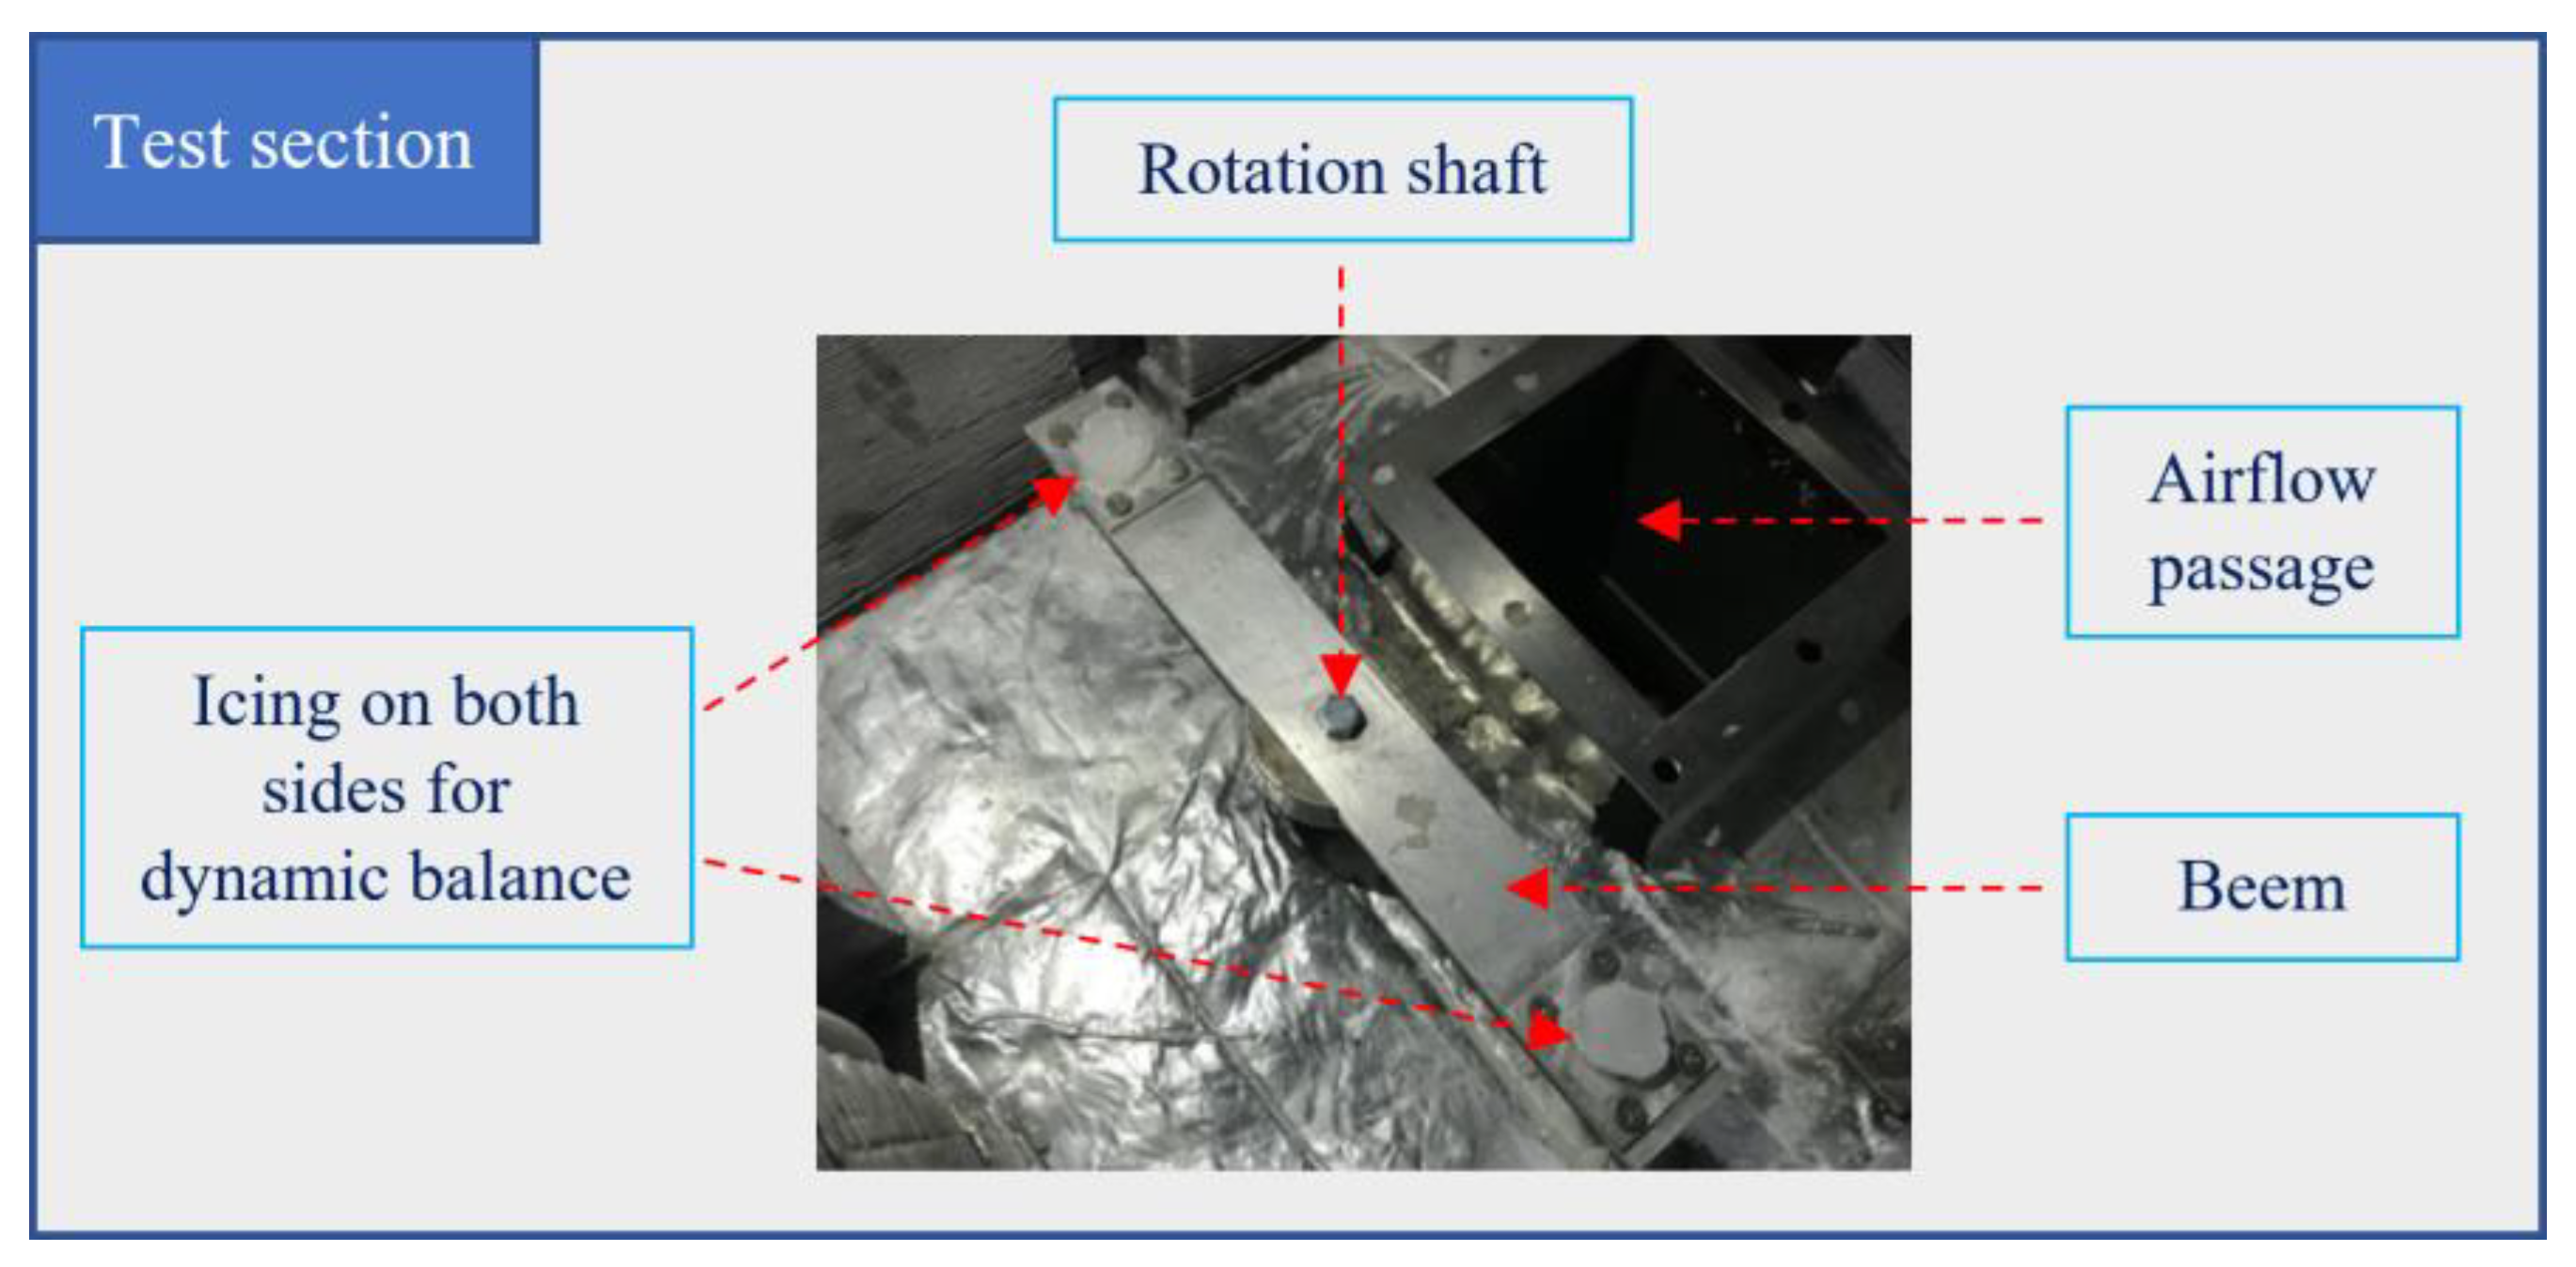
First, the environment inside the tunnel will be gradually cooled down, with the wind speed stabilized. As the difference of the lowest temperature inside the tank between two adjacent working cycles of the chiller is less than 0.1 °C, it can be considered that the temperature inside the test section is basically balanced. At this time, the nozzle will be started to spray towards the experimental platform. Then the angle of the rotating shaft will be adjusted after a period of time to make the other end of the beam also freeze (Figure 4), and the icing time at both ends should be kept the same. The icing mass can be determined by the mass difference of the rotating beam before and after the ice shedding. During the measurement process, the motor should be started at a small frequency of 5 HZ; then, the motor frequency is raised by 2.5 Hz each time to increase the motor speed gradually. For every moment at a new rotational speed, the rotating beam should be stabilized for a period of time before the next frequency rise. Finally, the motor frequency at the moment when the ice shedding happens under the action of centrifugal force will be recorded carefully.
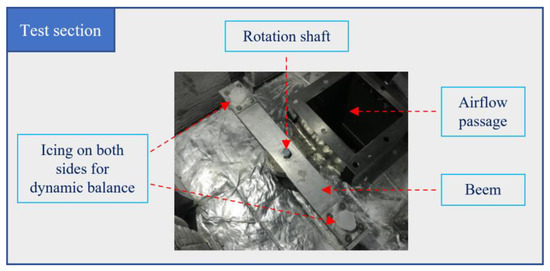
Figure 4.
Ice accretion in the test section.
Before this experimental study, the spray nozzle used was calibrated according to the guidelines for product performance and the change of liquid-water content in the test section was carefully measured. On this basis, the water pressure and air pressure of the spray nozzle were fixed, and a liquid-water content of 0.15 g/m3 was kept constant during the experiment. In addition, the test velocity was measured at the outlet cross section of the test section shown in Figure 3. Three points, including the center point of this cross section, were selected for velocity measurement, and the average value of their measurement results was determined as the experimental velocity.
Based on the experimental principle, the emphasis is placed on investigating the situation where the attached ice completely falls off from the test platform with no residue on the metal substrate. This form of ice shedding is the expected adhesive failure in this study, and the test results of partial detachment will be filtered out to eliminate the interference of the cohesive failure between ice layers.
5. Results and Discussion
Through multiple sets of adhesion tests, the bonding strength between the attached ice and the substrate under various conditions was obtained, and the focus of the impact analysis is on three aspects: ambient temperature, freezing mode, and wind speed.
5.1. Effects of Ambient Temperature
The ambient temperature controlled in this experiment ranges from −17 °C to −5 °C. Under different temperature conditions, the morphology and adhesion strength of the impact ice have their own characteristics.
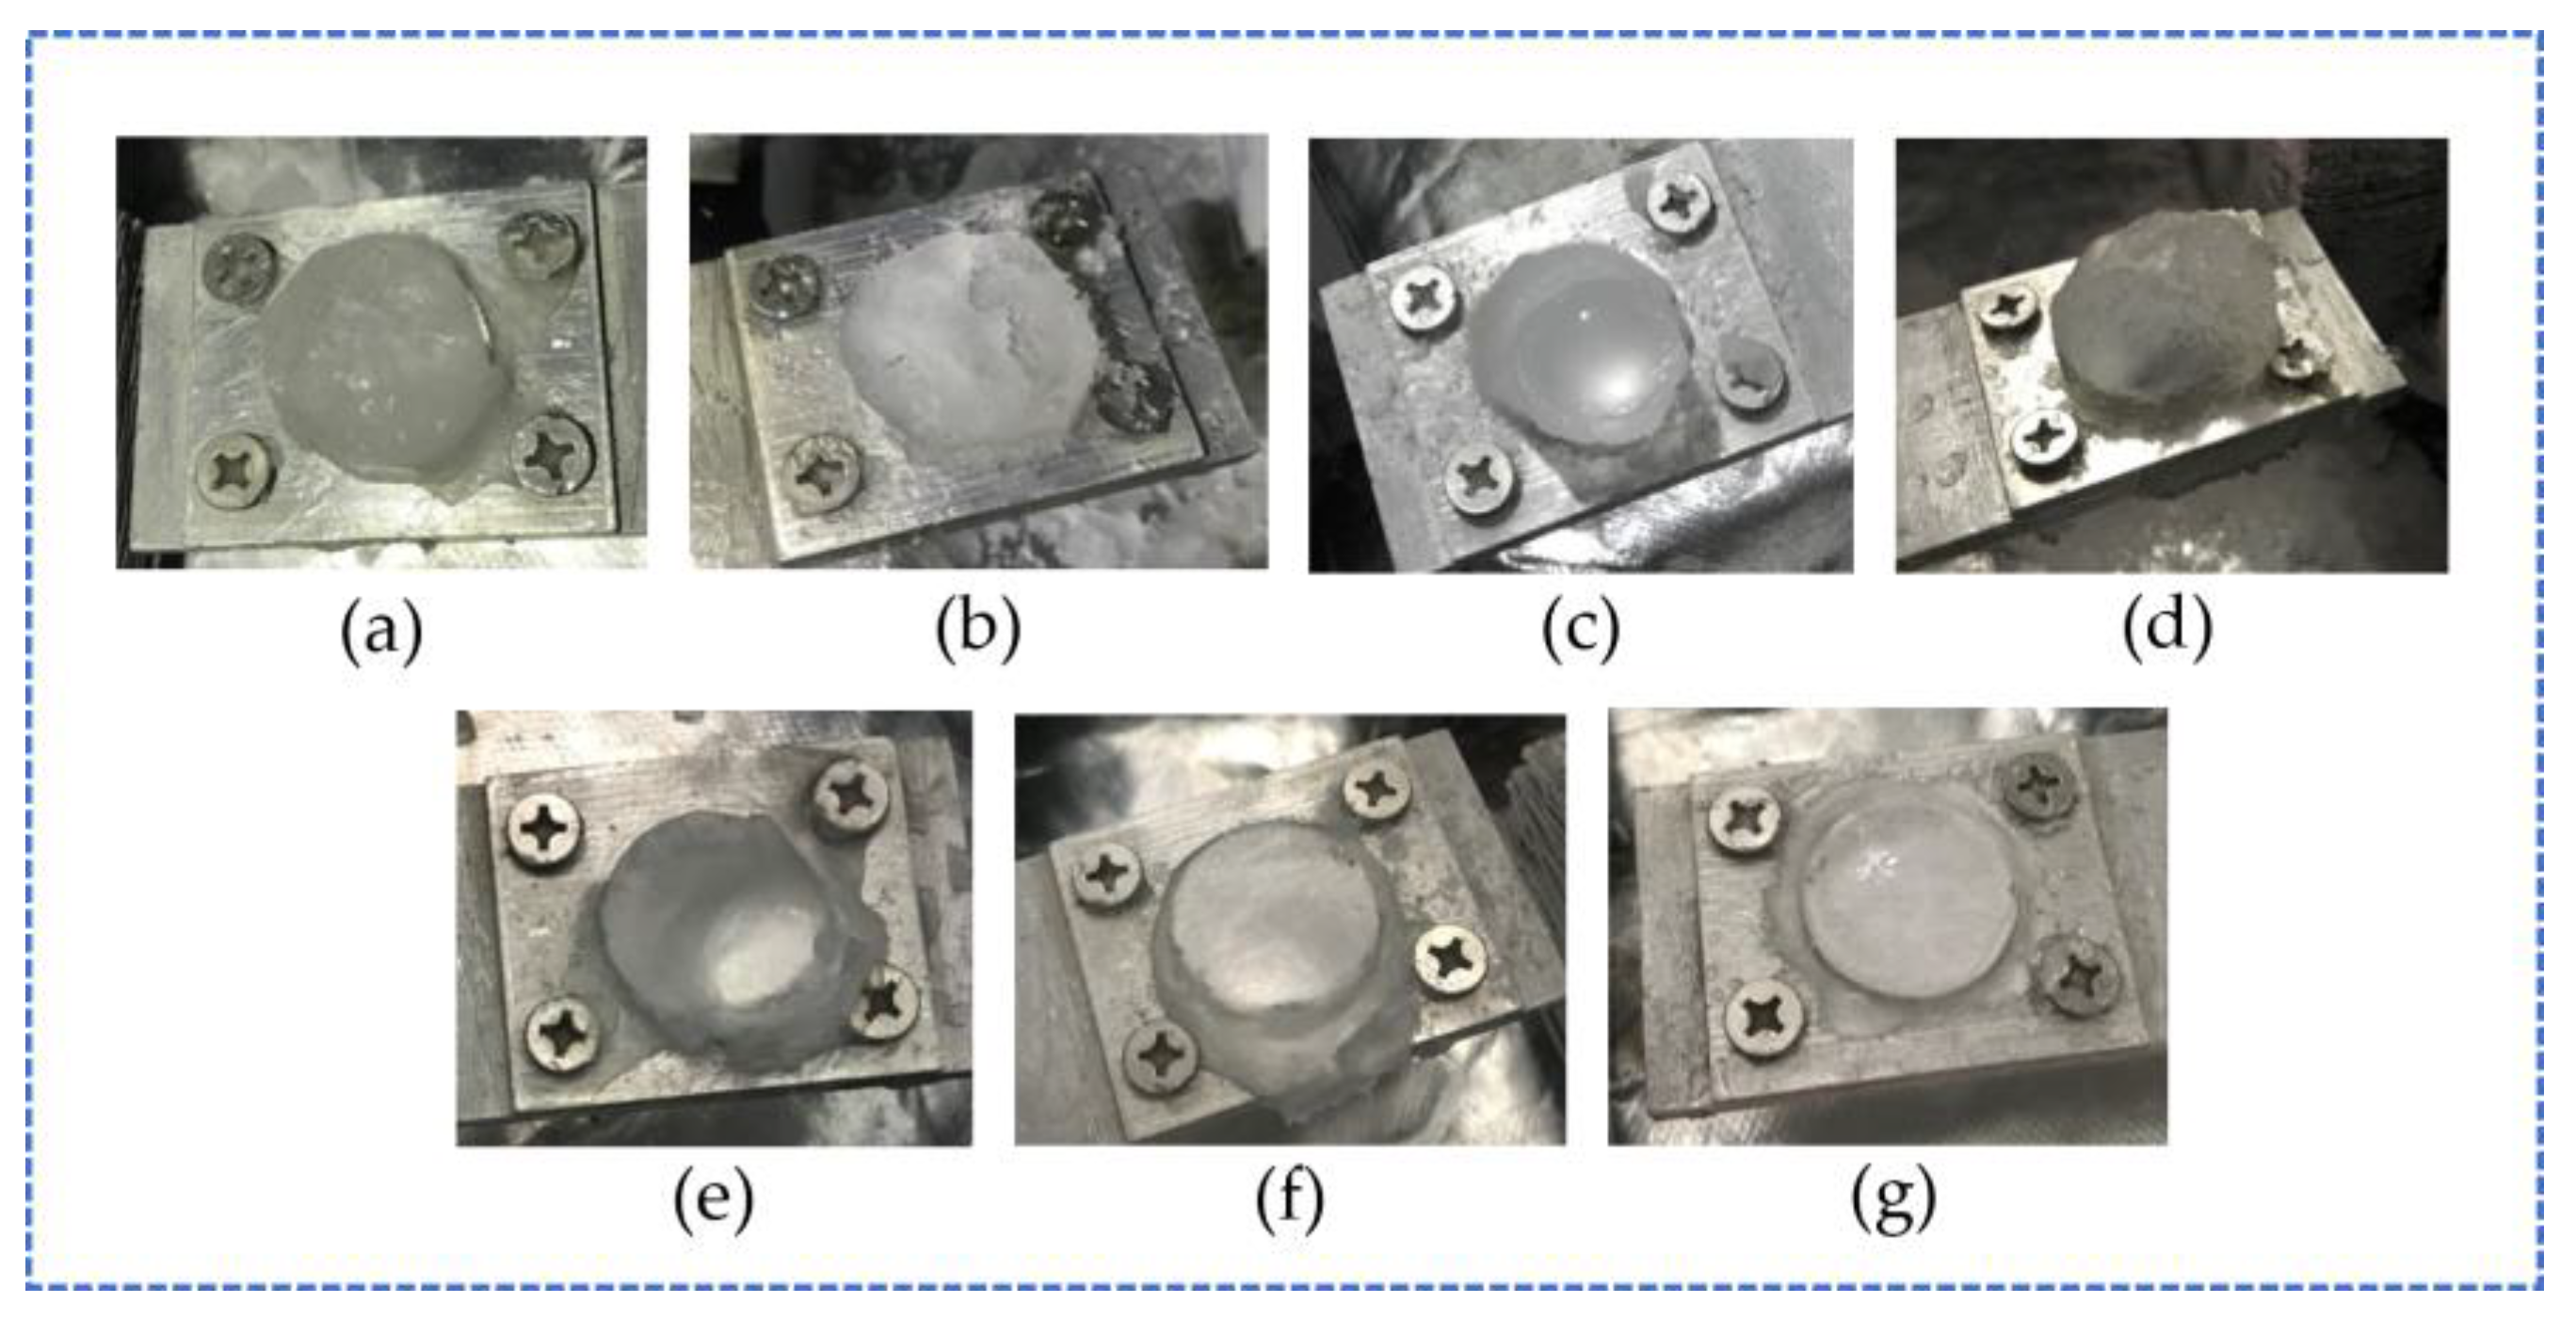
Figure 5 shows the ice shapes formed at the ambient temperatures of −17, −15, −13.5, −12, −10, −8, and −5 °C, respectively. At −17 °C, which is the lowest temperature that can be reached in this experiment, the impact ice is low in transparency and has an overall appearance of milky white, showing an opaque state of rime ice. It was observed that, at the beginning of ice accretion on the experimental platform, the water droplets quickly froze, which is consistent with the formation characteristics of rime ice. Due to the temperature rise of the platform after icing, the water droplets from the subsequent spray flowed on the surface of the ice layer, resulting in a smooth outer surface. However, this phenomenon will not significantly affect the adhesion between the ice and the substrate. Then, the circulating temperature of the chiller was adjusted and the stabilized ambient temperature was −15 °C and −13.5 °C. As shown in the figure, the ice shape at −15 °C is similar to that at −17 °C, showing an opaque and rough appearance, which is still in a typical state of rime ice. Under the ambient condition of −13.5 °C, the ice structure can be divided into two parts. The lower part of the ice connected to the substrate remains low in transparency and milky white but a transparent convex part of the ice appears at the top area. This is because at the end of the freezing time, a groove-shaped structure is formed at the top of the attached ice, and the temperature there becomes relatively high; thus a portion of the subsequent water droplets are collected into the groove and frozen slowly, which is similar to the static ice formation.
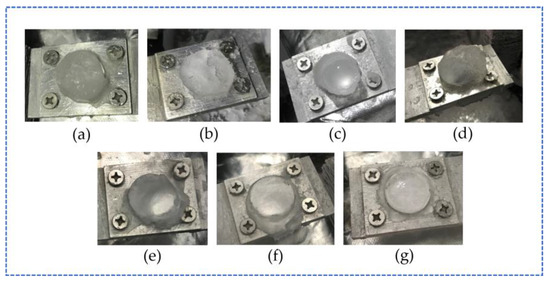
Figure 5.
Ice shapes formed at −17 °C (a), −15 °C (b), −13.5 °C (c), −12 °C (d), −10 °C (e), −8 °C (f), and −5 °C (g).
The ice accumulation at the ambient temperature of −12 °C is shown in Figure 5d. It can be seen that the ice formed at −12 °C has a rough surface and is generally milky white. However, an area that has a certain transparency can be found at its bottom, indicating that the slow freezing of water flow occurs there. Therefore, this ice has some of the characteristics of mixed ice.
Subsequently, the ambient temperature inside the test tank was further increased, and the corresponding impact ice was formed at −10 °C, −8 °C, and −5 °C, respectively. When the temperature rises above −10 °C, the water droplets in the spray will not freeze immediately after reaching the surface of the experimental platform but will form a water film to flow and slowly freeze. The bubbles in the water can be completely released, generating a smooth and transparent frozen surface with a relatively dense organization. It can be found that the accumulated ice is not completely transparent and still has some characteristics of mixed ice at −10 °C, while at −8 °C and −5 °C, the ice formed is almost completely transparent and is typical of glaze ice. Overall, as the ambient temperature increases, the transparency of the ice formed on the experimental platform increases significantly.
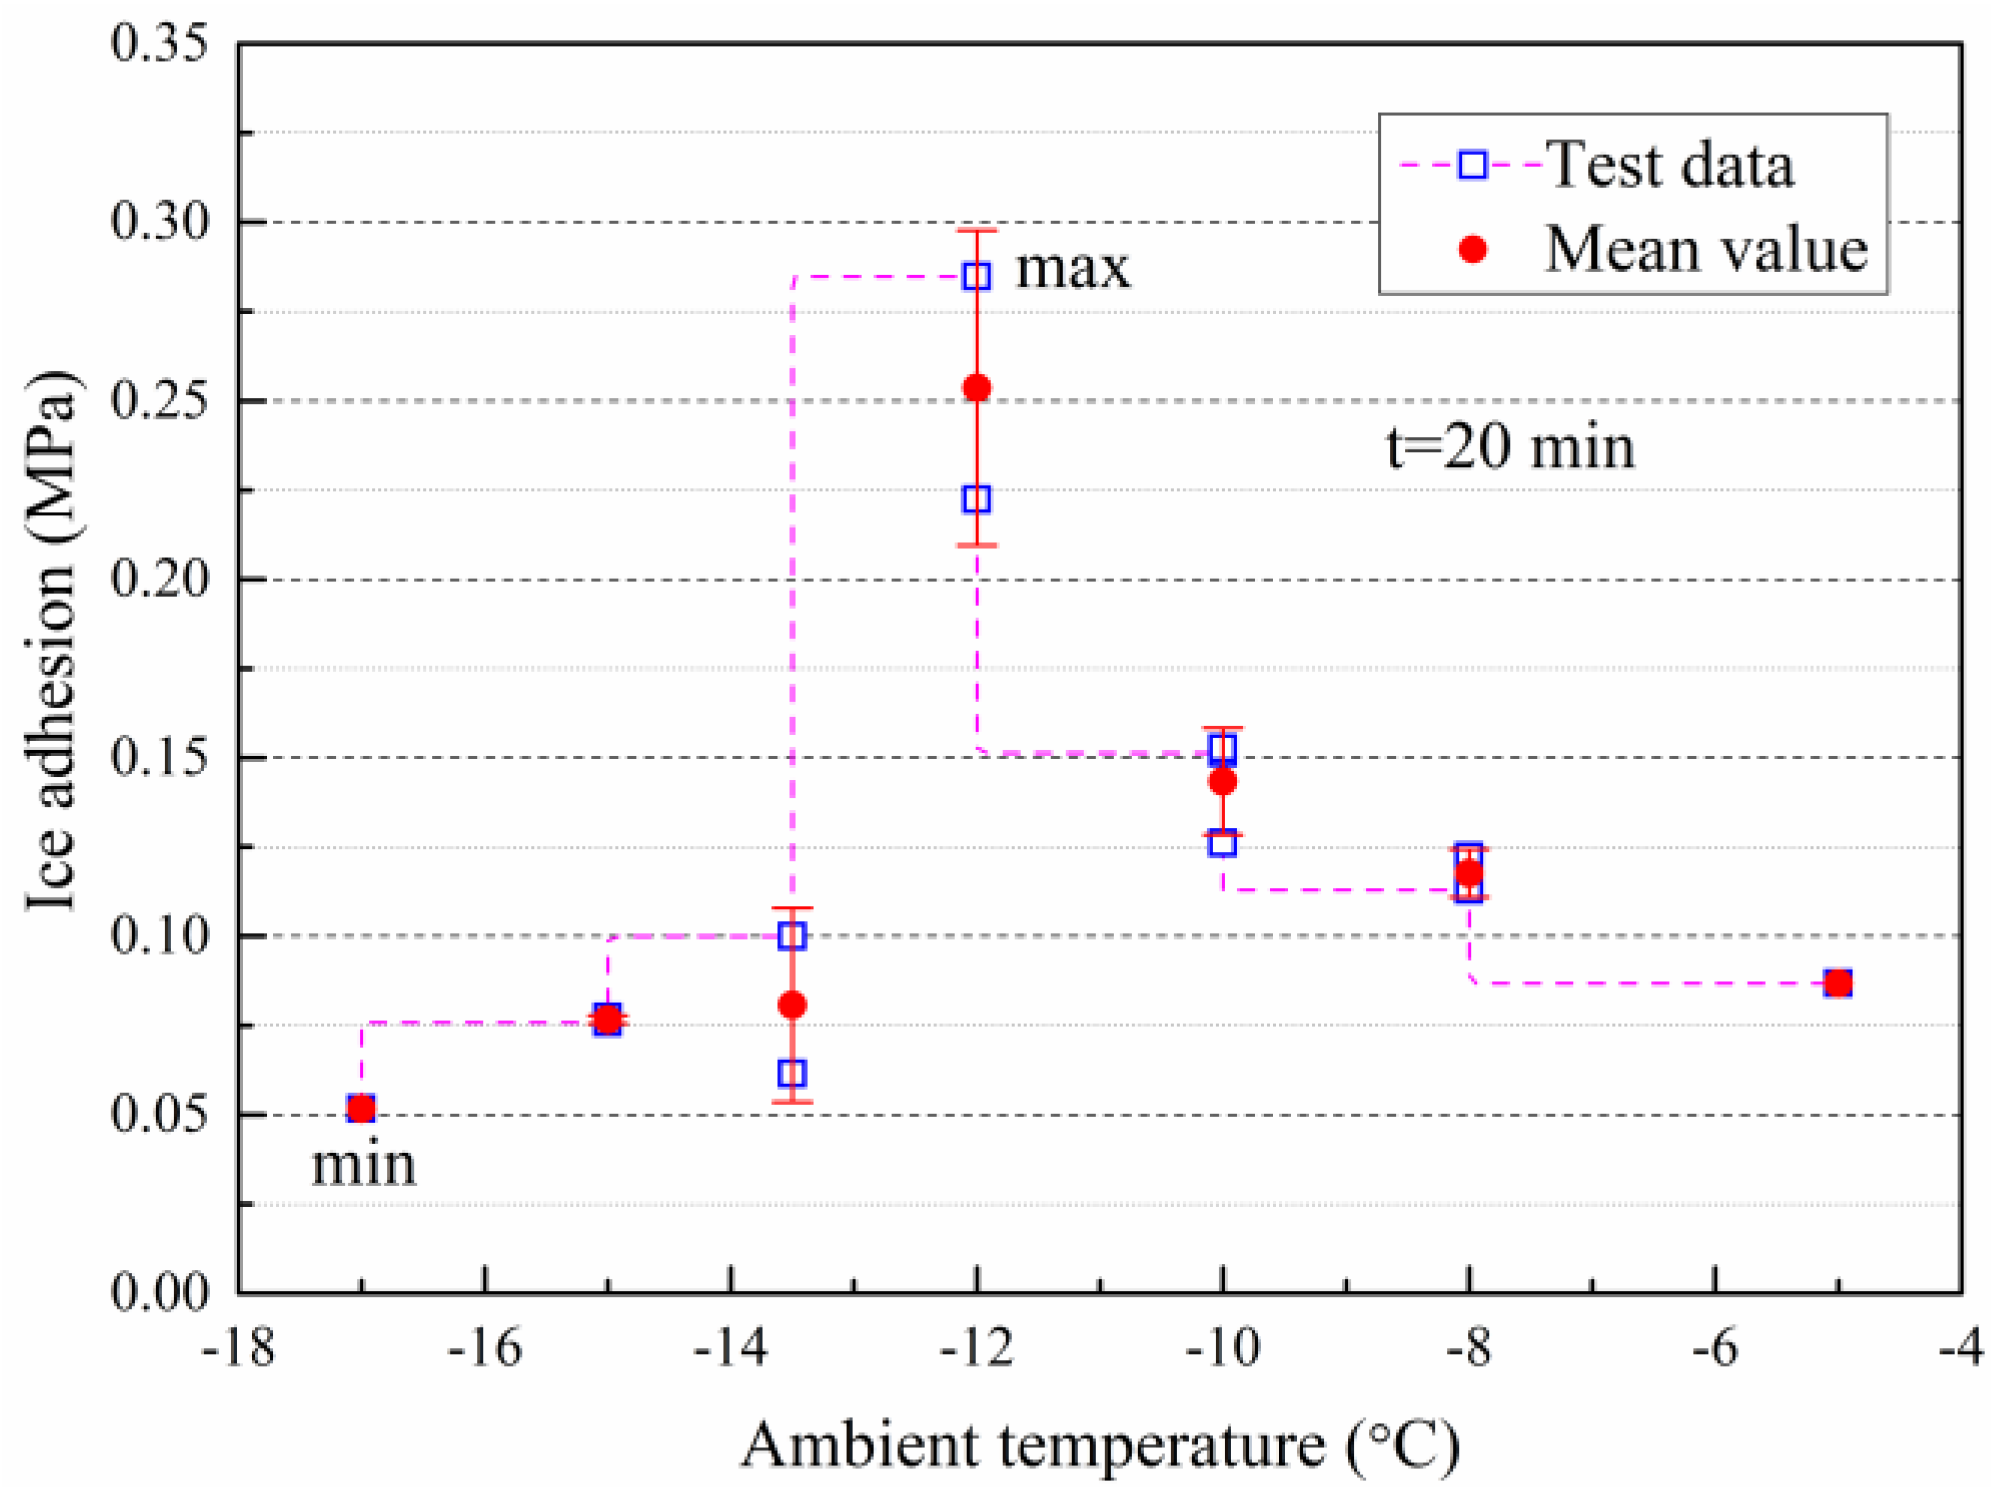
The measured values of adhesion at different environmental temperatures are recorded in Figure 6, with the average and standard deviation of adhesion at the same temperature provided. The freezing time is 20 min, and the mass of the attached ice is determined by the mass difference before and after ice shedding. The blue box represents the measured points, and there are multiple data under the same condition. The red dot represents its average value, and the length of the vertical line represents the standard deviation of the data set.
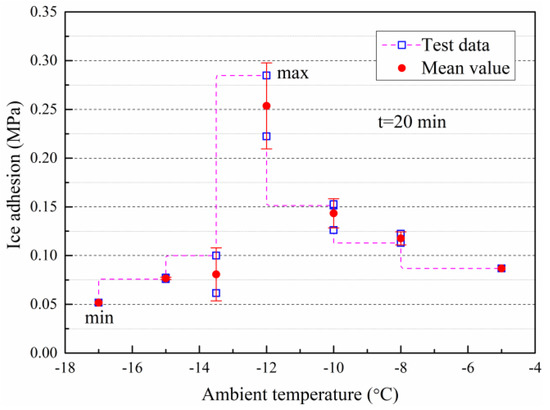
Figure 6.
Ice adhesion at different ambient temperatures.
By comparing the standard deviation of the data sets at the different temperatures shown in Figure 6, it can be seen that the concentration of the measured values is best at −8 °C and is relatively poor at −12 °C. Within the ambient temperature range of −17 °C to −5 °C, the adhesion force of the accumulated ice on the experimental platform shows a trend of first increasing and then decreasing, which reaches the maximum value of 0.2536 MPa at −12 °C. At this point, the attached ice shows the characteristics of the mixed ice, having a rough surface but strong adhesion to the substrate. At the ambient temperature below −12 °C, the ice is mainly in the form of rime ice, and the adhesive force decreases with the drop in temperature. This is because, at a lower temperature, the water droplets from the spray will freeze as soon as they reach the experimental platform. The lower the temperature, the faster the freezing rate, and the more loose the ice layer on the substrate, resulting in less adhesive force to the surface. In the temperature range above −12 °C, the formed ice shows the characteristics of glaze ice, which has a smooth surface and high transparency, and the adhesion will decrease with the rise of temperature. In this case, the water droplets flow on the surface of the test bench to form a water film and then slowly freeze. For the entire temperature range, the adhesion of the glaze ice formed above −12 °C is generally greater than that of the rime ice formed at low temperatures, which is consistent with the icing mechanism and adhesion theory. The minimum adhesive force measured is 0.0516 MPa at −17 °C, which is approximately 20% of the maximum value.
5.2. Effects of Different Freezing Methods
In the process of studying the adhesion force of impact ice, the way of producing ice has been gradually improved to be closer to actual ice accretion in flight, which is from the initial way of water freezing motionlessly in a sleeve (static icing) to the way of spray freezing on a surface (dynamic icing). Figure 7 shows the comparison of ice shapes between these two freezing methods.
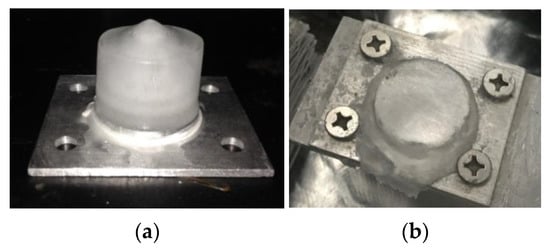
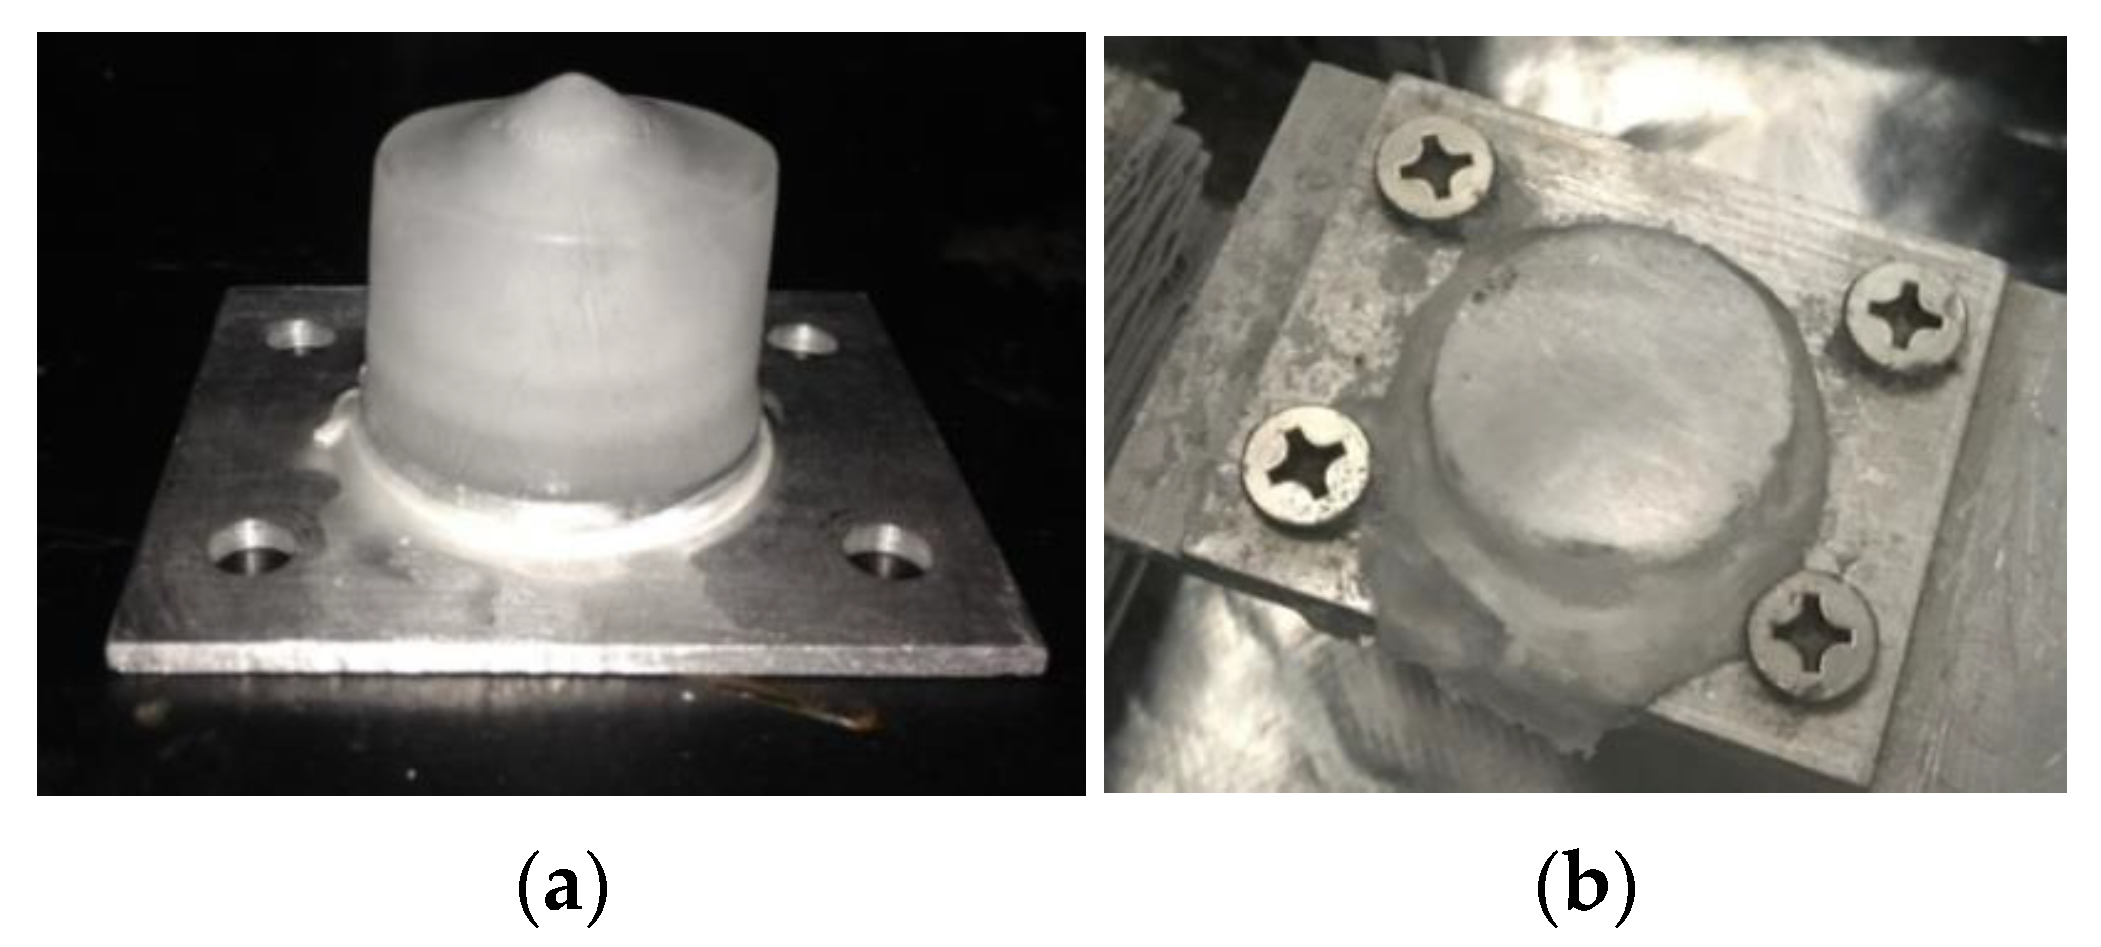
Figure 7.
Static icing (a) and dynamic icing (b) at −5 °C.
Figure 7a shows the result of static icing on the experimental platform at the ambient temperature of −5 °C and Figure 7b shows the result of dynamic icing at the same temperature. Compared to the static icing, the ice formed by droplet impingement has a smoother surface with high transparency and a more irregular shape, which is caused by its specific freezing process similar to that of glaze ice. The test results of static icing at the different temperatures of −5 °C, −10 °C, and −12 °C are listed in Table 1 and are compared correspondingly with the measured values of dynamic icing in Figure 8.

Table 1.
Adhesion data for static icing.
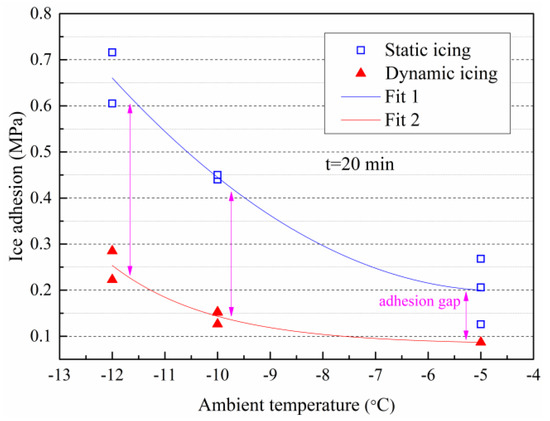
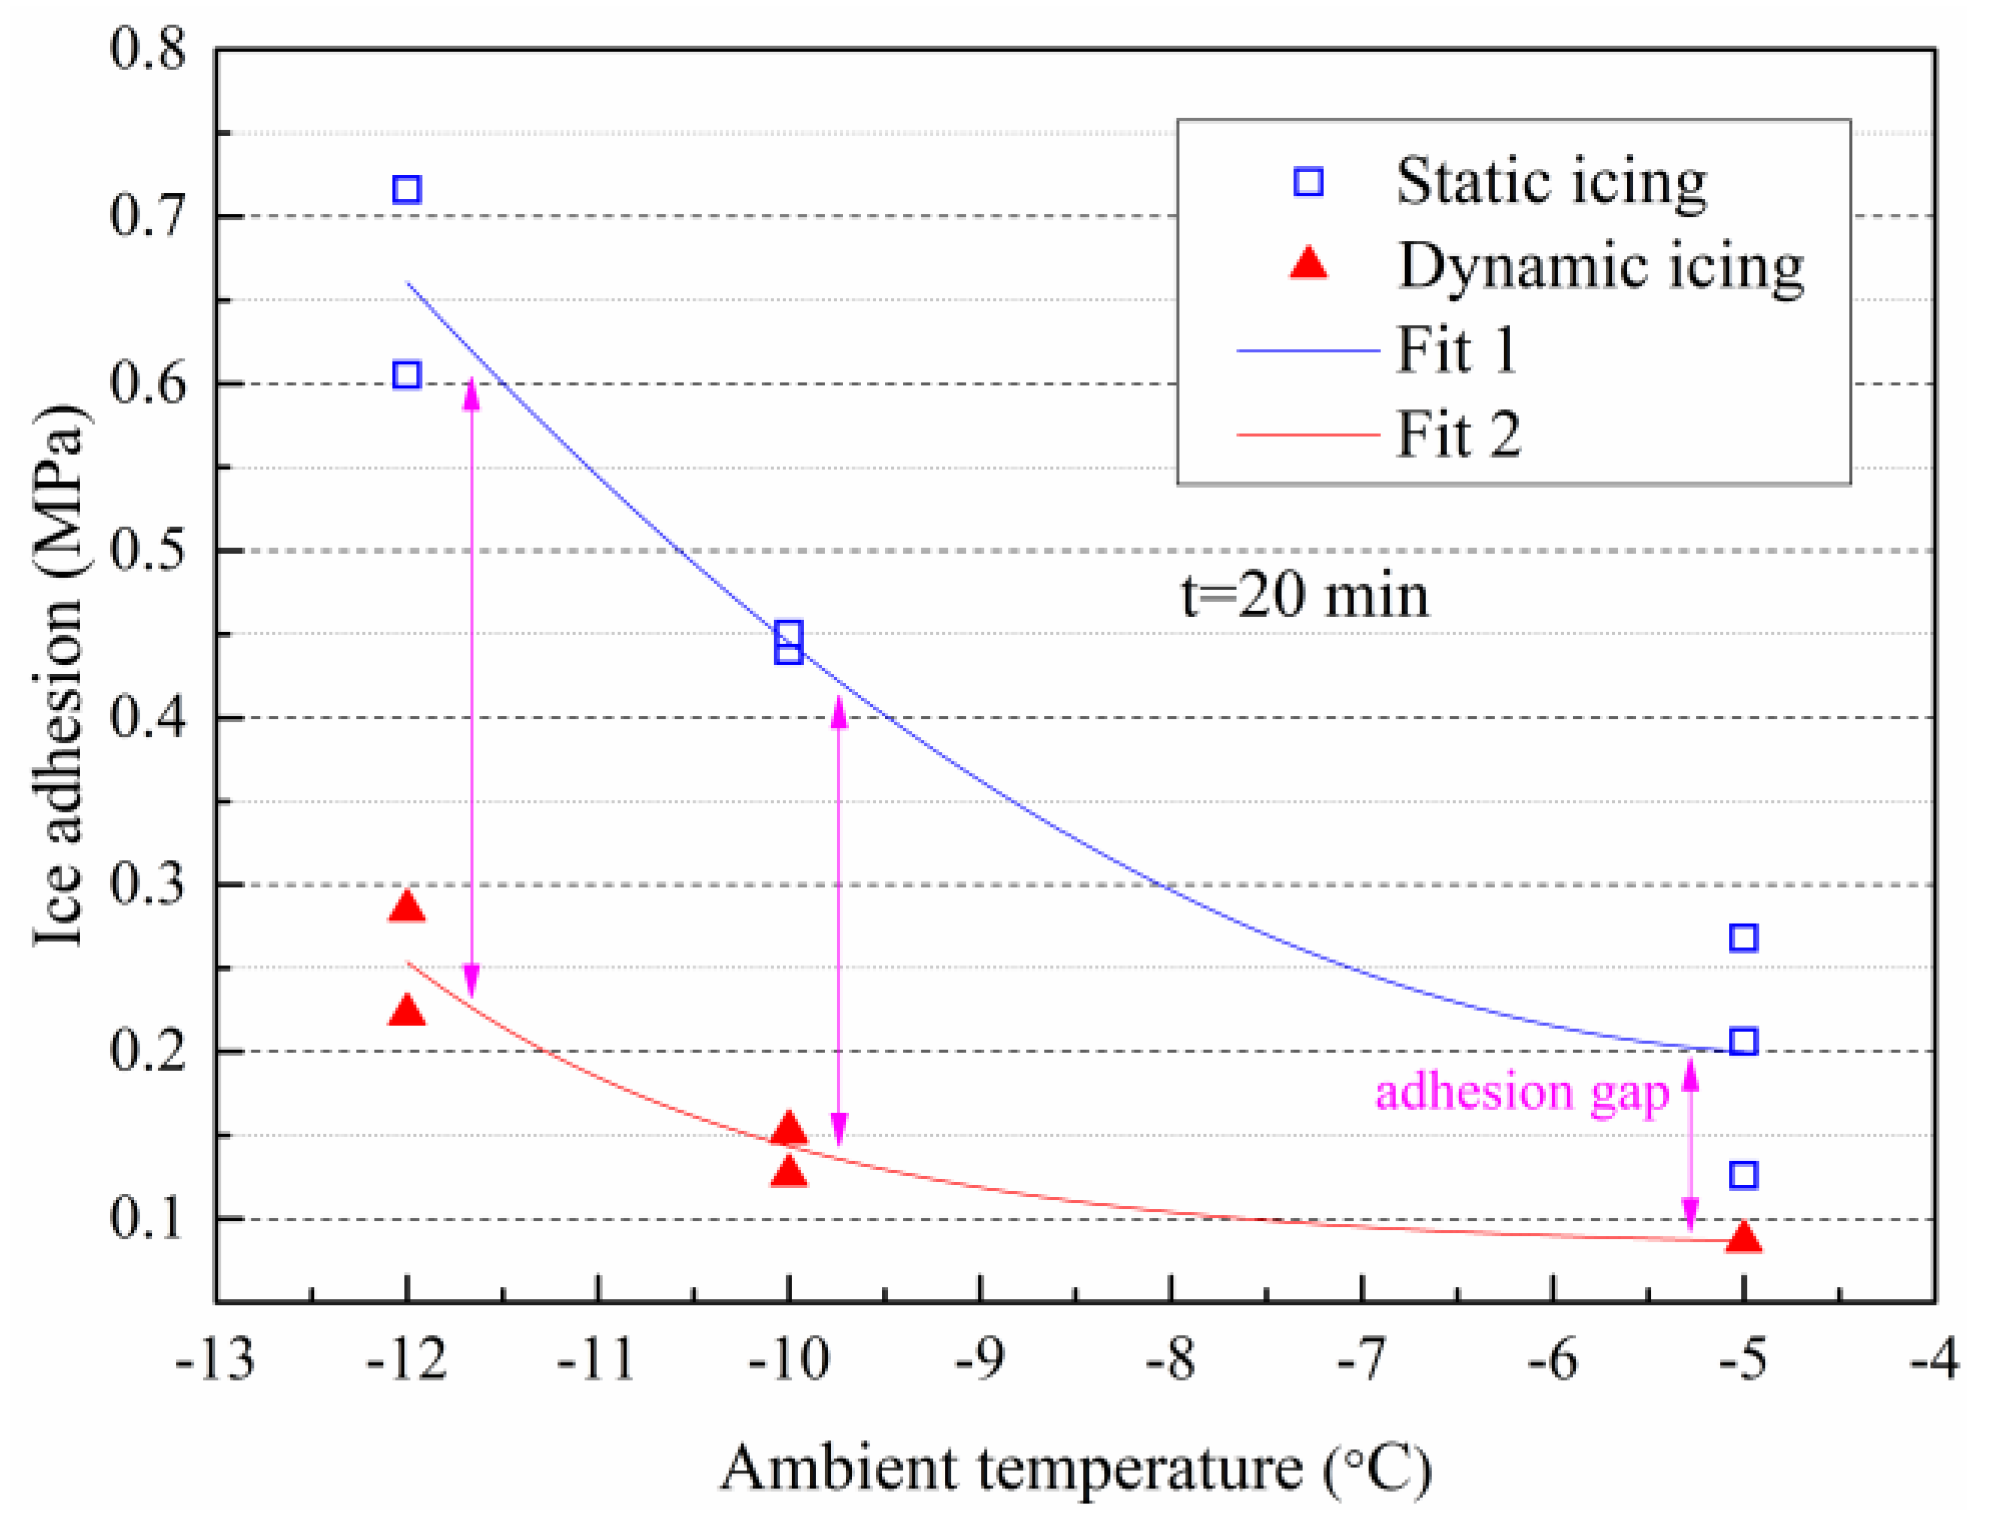
Figure 8.
Comparison of the adhesion between different freezing methods.
The blue box in the figure represents the measured adhesion of static icing, with the adhesion of dynamic icing denoted by the red triangle. These two were compared at the same ambient temperature. In terms of the overall trend of change, the adhesion values of both decrease to a similar extent with the temperature rise, indicating that the adhesion change characteristics of the static icing within this temperature range are consistent with that of the dynamic icing. However, at the same temperature values, the adhesion force of the dynamic icing is less than that of the static icing, Accounting for 43.4%, 32.2%, and 38.5% of the latter, respectively. This indicates that the static icing can generate a denser internal structure compared to the general glaze ice, resulting in greater bonding strength with the substrate. Moreover, as the ambient temperature decreases, the difference in adhesion between these two freezing methods will be amplified.
5.3. Effects of Wind Speed
The effects of wind speed on ice adhesion in various conditions have been carried out. To ensure the principle of one single variable, the ambient temperature remains the same, all at 13.5 °C. The following presents the morphology of the ice accretion on the experimental platform at different wind speeds.
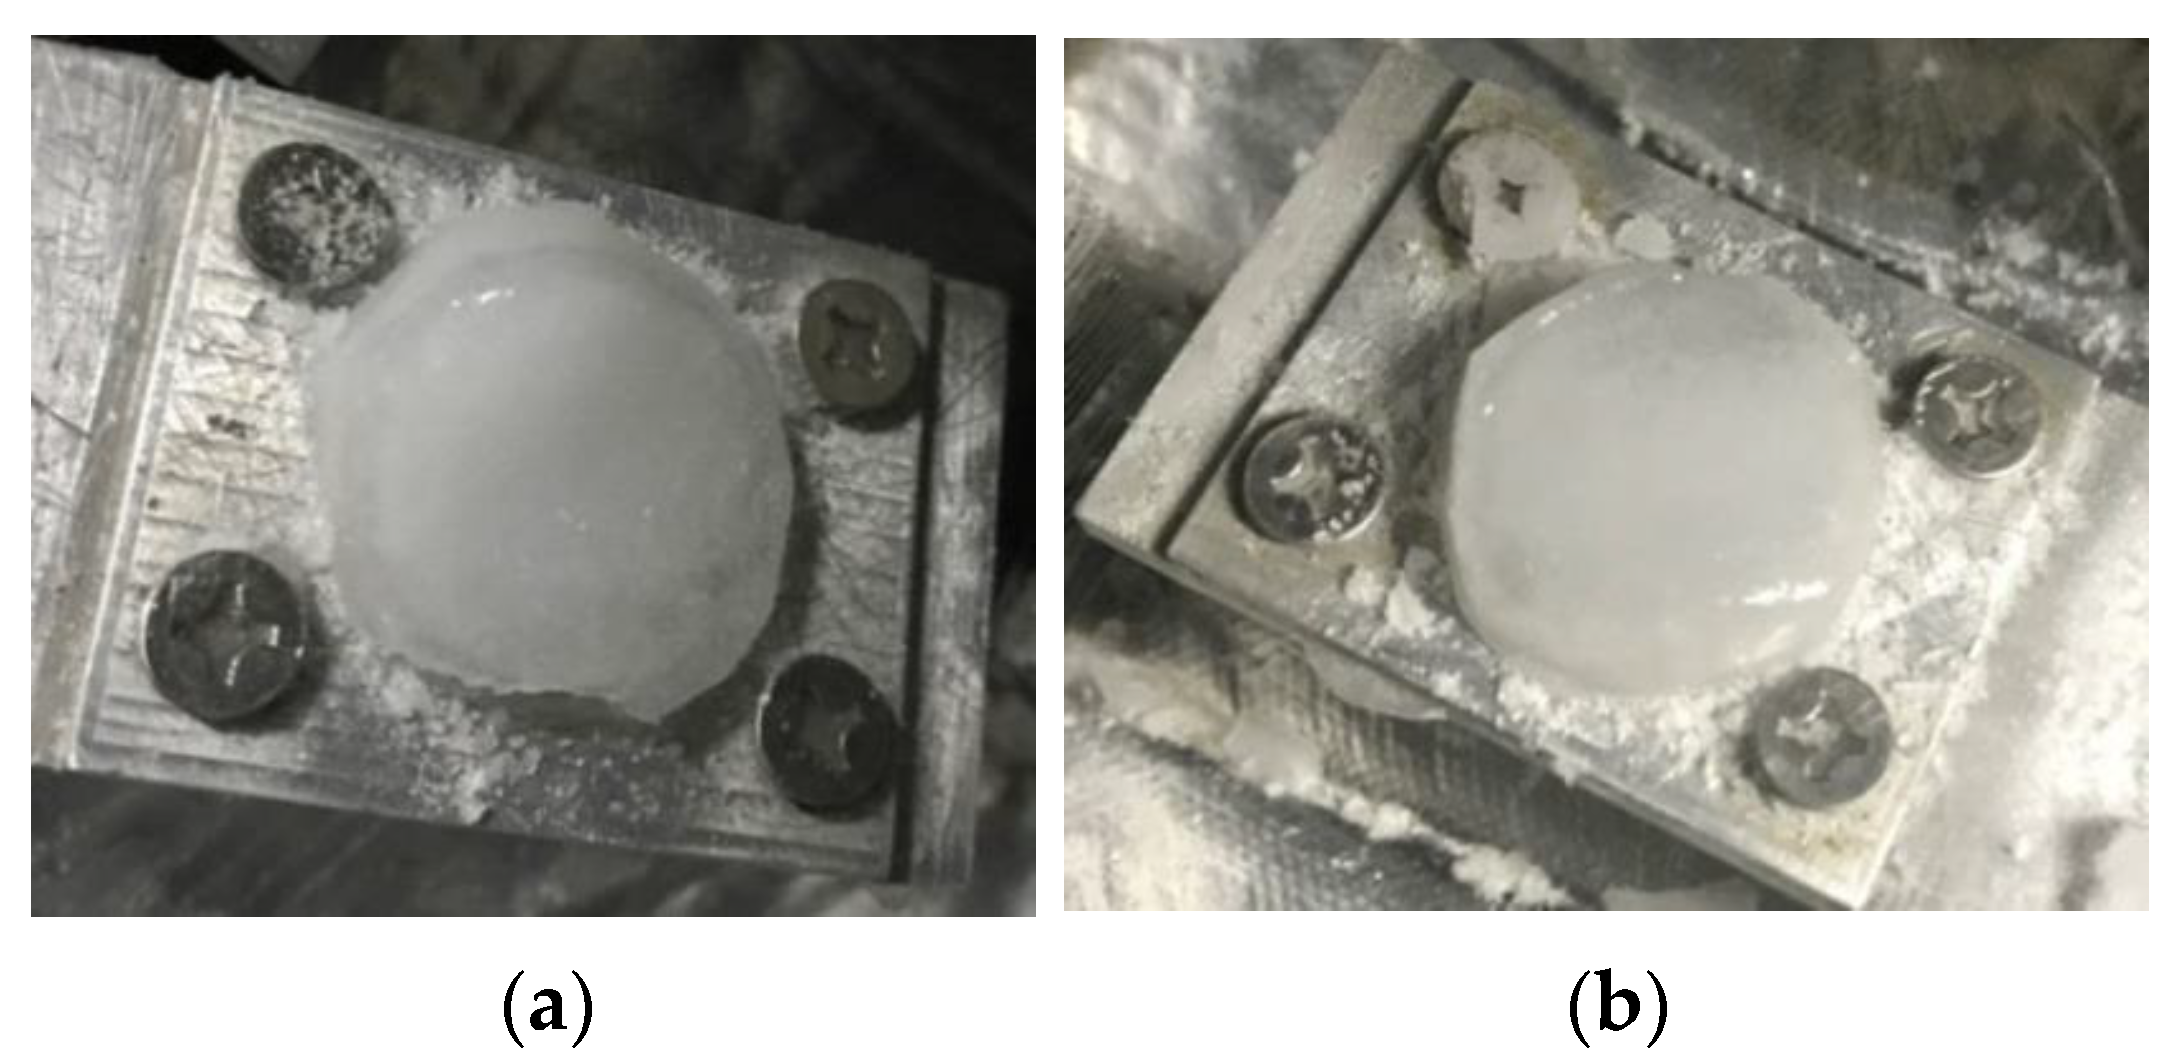
Figure 9 shows the ice formed at the experimental section with an ambient temperature of −13.5 °C and a wind speed of 5 m/s. The ice in Figure 9a has a clear sharp angle, and its mass is mainly concentrated on the side where the sharp angle appears. After the centrifugal fan starts operating in the process of wind speed effect investigation, the substrate surface will experience continuous temperature rise, with a certain degree of structural vibration occurring. In this situation, the water droplets may not freeze immediately after impacting onto the substrate but will flow toward the surrounding area, and the directions of flow and accumulation of the droplets are affected by the structural vibration, causing the generation of the special ice shape shown in Figure 9a. While during the ice-generation process in Figure 9b, the substrate surface temperature is still in a relatively low state and the freezing rate of the water droplets is relatively faster, resulting in a more regular shape of the attached ice.
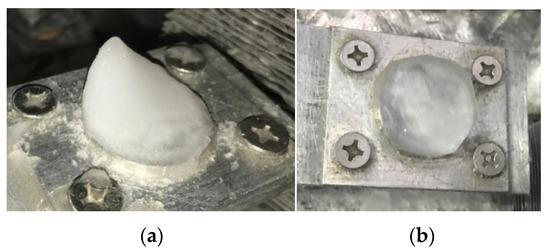
Figure 9.
Special (a) and regular (b) ice shapes at ambient temperature of −13.5 °C and wind speed of 5 m/s.
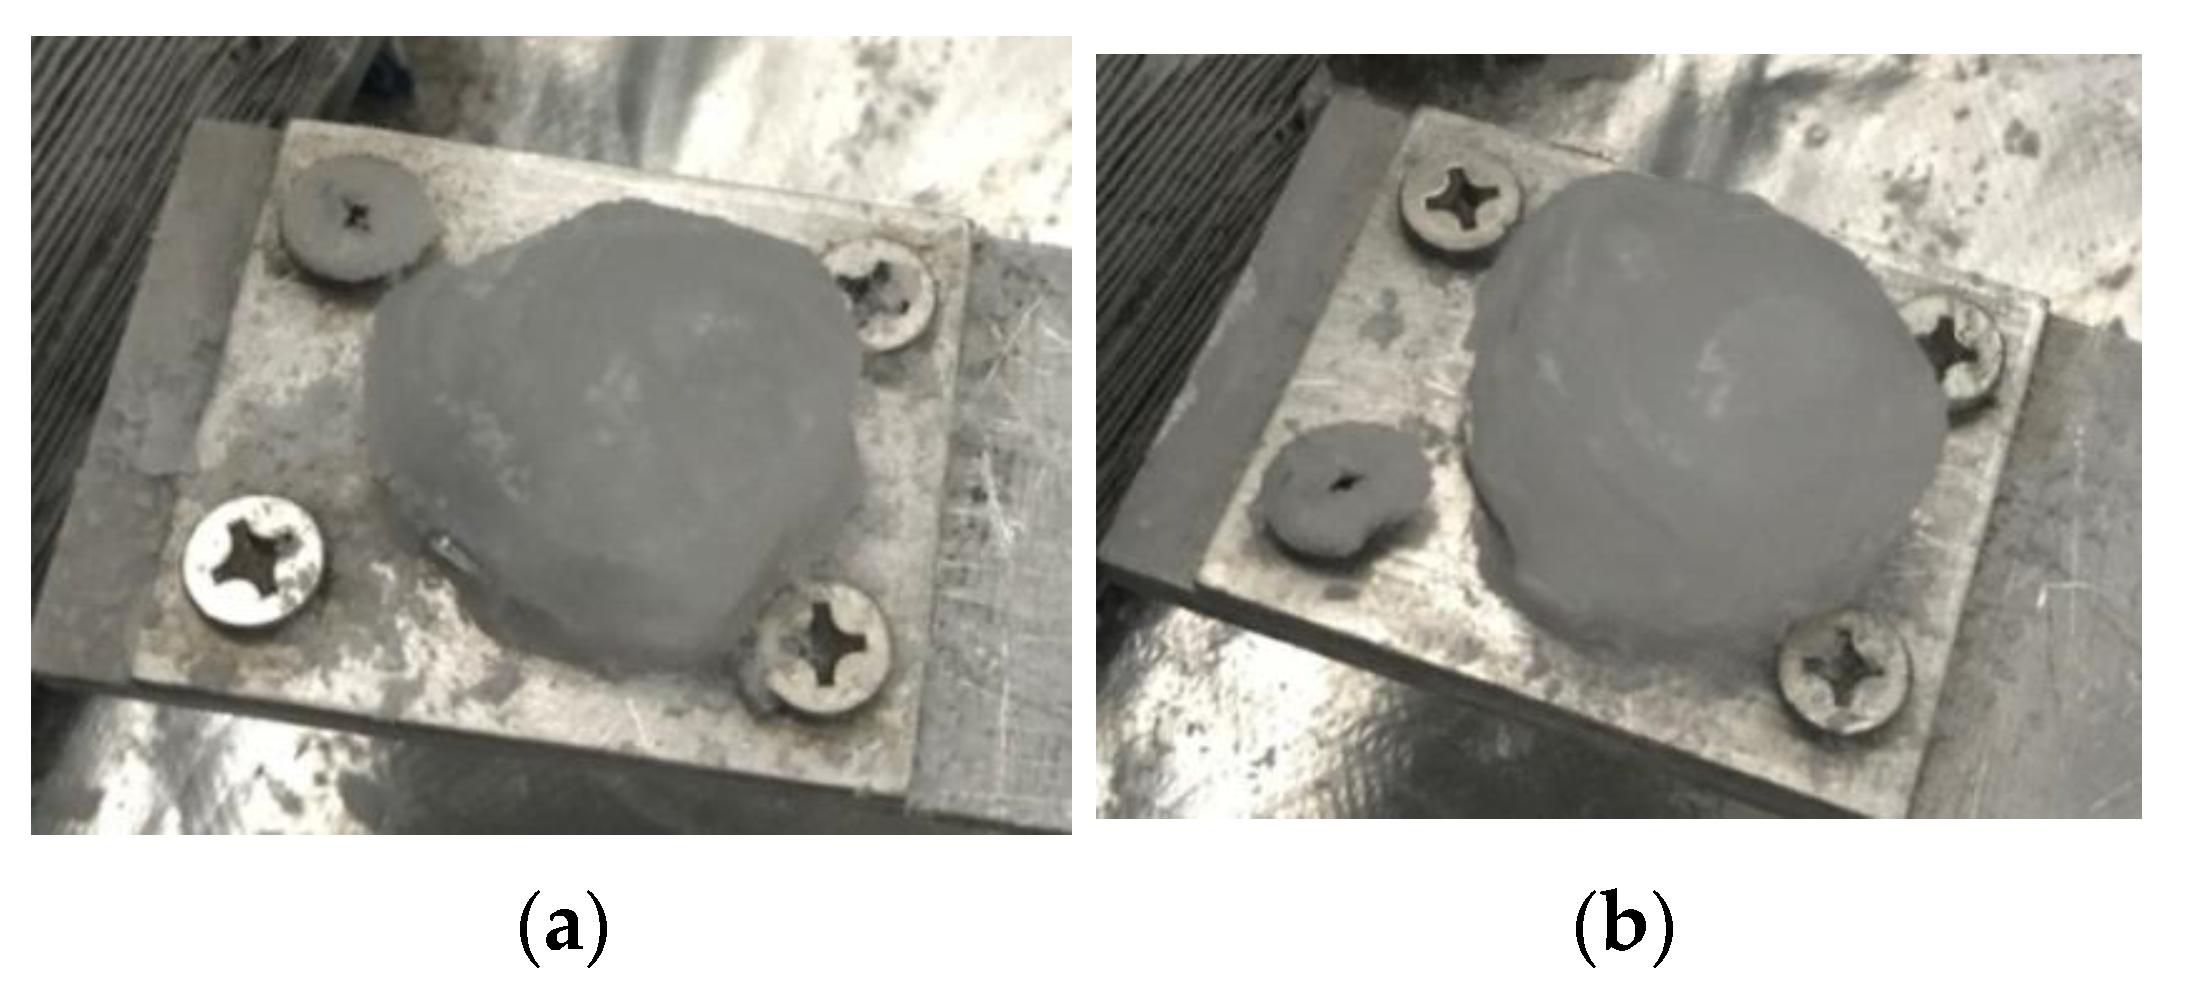
In addition, as shown in Figure 10 and Figure 11, when the air velocity increases, the amount of water hitting the platform surface increases per unit of time due to the carrying effect of the airflow and the flow of the water film is more sufficient, resulting in an increase in icing mass.
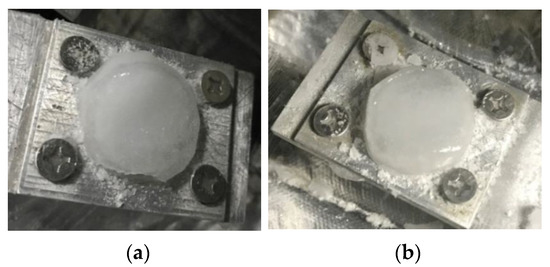
Figure 10.
Ice shapes at ambient temperature of −13.5 °C and wind speed of 10 m/s, first (a) and second (b) tests.
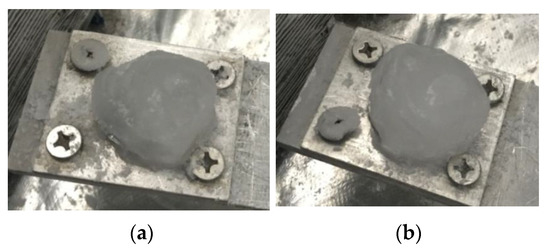
Figure 11.
Ice shapes at ambient temperature of −13.5 °C and wind speed of 15 m/s, first (a) and second (b) tests.
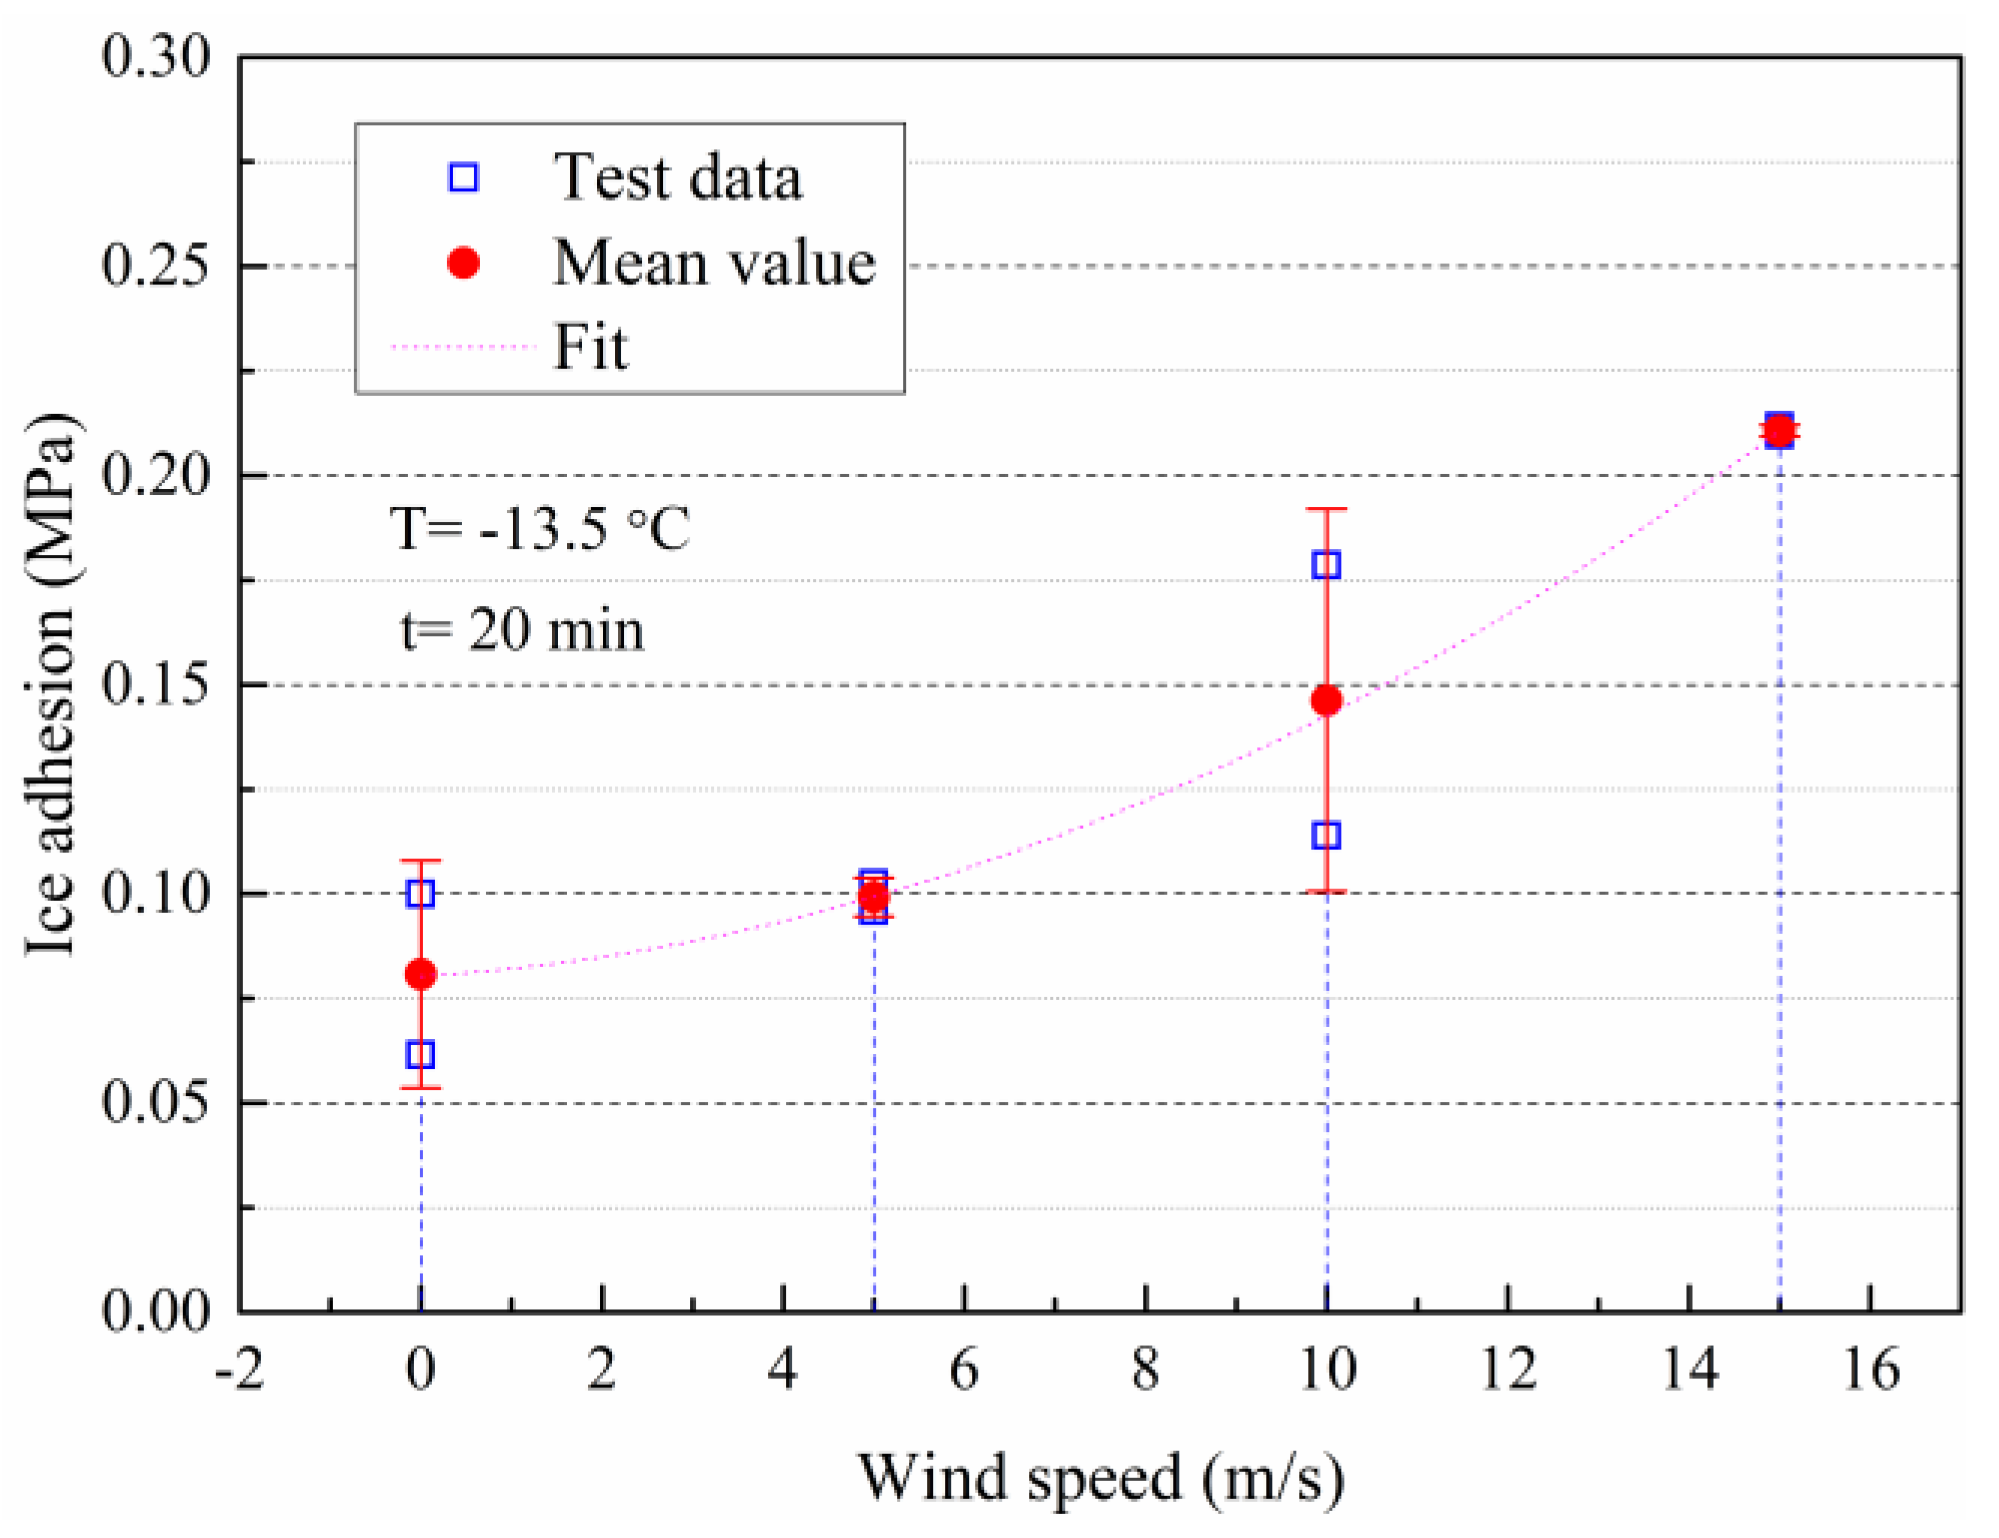
The experimental data of the ice adhesion under varying wind speeds are shown in Figure 12, with four different velocity conditions of 0 m/s, 5 m/s, 10 m/s, and 15 m/s studied. To investigate the repeatability of this measurement work, two sets of tests were conducted for each condition.
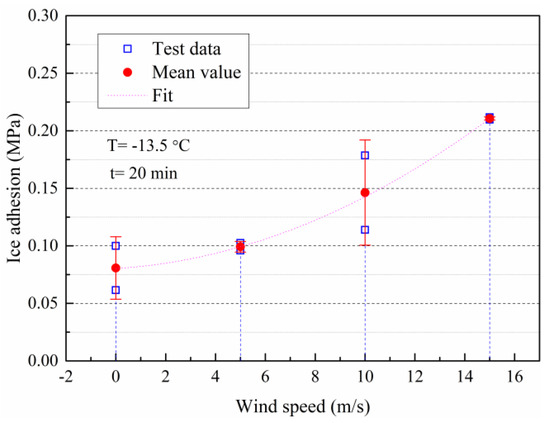
Figure 12.
Ice adhesion under varying wind speeds.
As shown in Figure 12, with the increase of the wind speed in the test section, the adhesion force of the attached ice also shows an upward trend at the same temperature of −13.5 °C. When the wind speed is relatively low, the increase in ice adhesion is not significant. However, as the wind speed exceeds a certain range, the rising amplitude of the ice adhesion increases obviously. The adhesion of the ice formed at a wind speed of 5 m/s is 1.23 times that when no wind blows, while the ice adhesion at a wind speed of 15 m/s is 2.61 times that when no wind blows. In the process of the experiment, the movement of the water droplets in the spray is accelerated after being affected by the airflow; Thus, the time of these droplets to reach the experimental platform is shortened, causing insufficient heat exchange with the cold environment. Accordingly, when the droplets hit the surface of the substrate, they will not immediately freeze but will form a flowing water film and freeze slowly after expelling impurities such as bubbles. The ice layer formed in this way has the characteristic of glaze ice and a strong bonding force with the substrate. On the other hand, the temperature of the airflow in this test is higher than that of the rotating beam; this blowing effect can increase the surface temperature of the experimental platform, which will make the entire process more inclined towards the slow freezing way of the glaze ice.
5.4. Error Analysis and Correction Methods
The potential experimental errors in the present work are given below in several aspects, with the corresponding solutions provided.
The mass of the accumulated ice is determined by the difference in mass before and after ice shedding but there may also be a small amount of ice on other positions of the rotating beam except for the experimental platform, which can also be thrown off during the rotation test. On the other hand, the motion of the rotating beam has been balanced by icing at both ends but it is difficult to maintain a completely consistent weight of ice accumulation at both ends. Therefore, small vibrations may occur during the rotation testing process, generating a certain amount of disturbance, which may interfere with the measurement results.
During the test, the temperature of the shaft is relatively low due to the effect of heat conduction in the cold environment, resulting in a certain error between the frequency displayed by the converter and the actual rotation speed. Similarly, the temperature distribution in the test section is not uniform, and the measurement accuracy of the thermocouple is limited, which may lead to a temperature measurement deviation. In addition, the shape of the accumulated ice in this experiment is relatively irregular, and it may not only form on the platform. Therefore, in order to determine the icing area accurately, a certain degree of modification has been made to the ice shape before the rotation test. Specifically, cutting tools were carefully used to make the contact surface between the ice and the substrate as consistent as possible with the circular platform in a short period of time and the excess attached ice was removed from the icing platform to reduce the experimental errors.
According to the analysis described above, and the final calculation formula for ice adhesion (Equation (3)), the maximum measurement error in this experimental study is caused by the mass determination of the attached ice (mice), which has a difference of 5% to 10% from the actual value based on the implementation procedure of the test. Combined with the range and magnitude of the measured values (0.05~0.254 MPa shown in Figure 6), the maximum measurement error can be estimated to be 0.025 MPa, which has an order of magnitude of 0.01 MPa.
6. Conclusions
An experimental study on the adhesive properties of impact ice has been conducted, with the experimental setup design and the factors affecting ice adhesion highlighted. The ambient temperature, freezing method, and wind speed of the test section were found to play important roles. Conclusions could be drawn as follows.
- (a)
- As the ambient temperature varies from −17 °C to −5 °C, the adhesion strength of the accumulated ice shows a trend of first increasing and then decreasing. At −12 °C, the adhesive strength reaches the maximum value of 0.254 MPa within the temperature range under investigation.
- (b)
- After the wind speed increases, the water film will flow more thoroughly on the substrate surface under the action of the airflow, leading to a slower freezing process. Therefore, as the ambient temperature is set to the same, the bonding strength of the attached ice increases with the wind speed rise in the test section.
- (c)
- Two different freezing methods, static icing and impact icing, are investigated in the experiment. When the environmental temperature is the same, the ice formed by droplets impacting has a more irregular shape and smaller adhesion strength compared to the static icing and this gap will widen with the temperature drop.
In future work, the substrate temperature should be controlled to study the direct impact of interface temperature on ice adhesion; in addition, as the icing platform has been designed to be detachable and replaceable, detailed research on the effects of different substrate materials with various roughness will be conducted.
Author Contributions
Methodology, S.C.; Validation, X.G.; Writing—original draft, L.D.; Writing—review & editing, X.Y. All authors have read and agreed to the published version of the manuscript.
Funding
This work was financially supported by the National Natural Science Foundation of China under Grant No. 52106001 and No. 12132019 and the China Postdoctoral Science Foundation under Grant No. 2022M713865.
Data Availability Statement
Data available on request due to restrictions e.g., privacy or ethical.
Conflicts of Interest
The authors declare no conflict of interest.
Nomenclature
| Aice | Contact area, m2 |
| Fc | Centrifugal force, N |
| H | Height of the curve, m |
| Hin | Height of the inlet, m |
| Hout | Height of the oulet, m |
| L | Length of the contraction section, m |
| mice | Mass of the attached ice, kg |
| Rbeam | Rotating radius of the beam, m |
| Rice | Radius of the attached ice, m |
| T | Ambient temperature, °C |
| t | Icing time, s |
| x | Axial distance, m |
| xm | Connection point, dimensionless |
| Greek symbols | |
| Ω | Rotational angular velocity, rad/s |
| Shear adhesion, Pa | |
| Subscripts | |
| c | centrifugal |
| in | inlet |
| m | middle |
| out | outlet |
References
- Schulson, M. Brittle failure of ice. Eng. Fract. Mech. 2001, 68, 1839–1887. [Google Scholar] [CrossRef]
- Cole, D.M. The microstructure of ice and its influence on mechanical properties. Eng. Fract. Mech. 2001, 68, 1797–1822. [Google Scholar] [CrossRef]
- Mackay, J.R.; Burn, C.R. The first 20 years (1978–1979 to 1998–1999) of ice-wedge growth at the Illisarvik experimental drained lake site, western Arctic coast, Canada. Can. J. Earth Sci. 2002, 39, 95–111. [Google Scholar] [CrossRef]
- Huang, W.; Li, Z.; Han, H.; Niu, F.; Lin, Z.; Leppäranta, M. Structural analysis of thermokarst lake ice in Beiluhe Basin, Qinghai–Tibet Plateau. Cold Reg. Sci. Technol. 2012, 72, 33–42. [Google Scholar] [CrossRef]
- Rai, A.; Tassou, S.A. Energy demand and environmental impacts of alternative food transport refrigeration systems. Energy Procedia 2017, 123, 113–120. [Google Scholar] [CrossRef]
- Lynch, F.T.; Khodadoust, A. Effects of ice accretions on aircraft aerodynamics. Prog. Aerosp. Sci. 2001, 37, 669–767. [Google Scholar] [CrossRef]
- Dong, W.; Ding, J.; Zhou, Z.X. Experimental Study on the Ice Freezing Adhesive Characteristics of Metal Surfaces. J. Aircr. 2014, 51, 719–726. [Google Scholar] [CrossRef]
- Brouwers, E.; Palacios, J.; Peterson, A.; Centolanza, L. Ice Adhesion Strength Measurements for Rotor Blade Leading Edge Materials. In Proceedings of the American Helicopter Society 67th Annual Forum, Virginia Beach, VA, USA, 5 May 2011; American Helicopter Society International Inc.: Fairfax, VA, USA, 2011. [Google Scholar]
- Lou, D.; Hammond, D.; Pervier, M.L. Investigation of the Adhesive Properties of the Ice-Aluminum Interface. J. Aircr. 2014, 51, 1051–1056. [Google Scholar] [CrossRef]
- Druez, J.; Phan, C.L.; Laforte, J.L.; Ngugyen, D.D. The Adhesion of Glaze and Rime on Aluminum Electric Conductors. Trans. CSME 1979, 5, 215–220. [Google Scholar]
- Phan, C.L.; McComber, P.; Mansianx, A. Adhesion of Rime and Glaze on Conductors Protected by Various Materials. Trans. CSME 1976, 4, 204–208. [Google Scholar] [CrossRef]
- Laforte, J.L.; Phan, C.L.; Felin, B.; Martin, R. Adhesion of Ice on Aluminum Conductor and Crystal Size in the Surface Layer. CRREL Spec. Rep. 1983, 3, 83–91. [Google Scholar]
- Stallabrass, J.R.; Price, R.D. On the Adhesion of Ice to Various Materials. In Canada Aeronautical Report LR-350; NRC No. 6980; National Research Council Canada: Ottawa, OT, Canada, 1962. [Google Scholar]
- Itagaki, K. Self-Shedding of Accreted Ice from High-Speed Rotors; ASME Paper 83-WA/HT-68; ASME Press: New York, NY, USA, 1983. [Google Scholar]
- Laforte, C.; Beisswenger, A. Icephobic Material Centrifuge Adhesion Test. In Proceedings of the 11th International Workshop on Atmospheric Icing of Structures, Montreal, QC, Canada, 12–16 June 2005. [Google Scholar]
- Scavuzzo, R.J.; Chu, M.L.; Olsen, W.A. Structural Properties of Impact Ices Accreted on Aircraft Structures; NASA-CR-179580; NASA: Greenbelt, MD, USA, 1987.
- Perron, J.; Fortin, G. Ice Adhesion Models to Predict Shear Stress at Shedding. J. Adhes. Sci. Technol. 2012, 26, 523–553. [Google Scholar]
- Perron, J.; Fortin, G. Spinning Rotor Blade Tests in Icing Wind Tunnel. AIAA 2009-4260. In Proceedings of the 1st AIAA Atmospheric and Space Environments Conference, San Antonio, TX, USA, 22–25 June 2009. [Google Scholar]
- Petrenko, V.F.; Whitworth, R.W. Physics of Ice; Oxford University Press: New York, NY, USA, 1999. [Google Scholar]
- Lanczos, C. The Variational Principles of Mechanics; Dovers Publications: New York, NY, USA, 1970. [Google Scholar]
- Fortin, G.; Beisswenger, A.; Perron, J. Centrifuge Adhesion Tests to Evaluate Icephobic Coatings. AIAA 2010-7837. In Proceedings of the 2010 AIAA Atmospheric and Space Environments Conference, Toronto, ON, Canada, 2–5 August 2010. [Google Scholar]
- Wu, R.; Wang, Z. Principles of Wind Tunnel Design; Beijing Institute of Aeronautics and Astronautics Press: Beijing, China, 1985. [Google Scholar]
- Wang, S.; Liu, X.; Lu, L. Simulation analysis of the contraction curve in the contraction section of a DC low-speed wind tunnel. Mach. Tools Hydraul. 2012, 40, 100–104. [Google Scholar]

Disclaimer/Publisher’s Note: The statements, opinions and data contained in all publications are solely those of the individual author(s) and contributor(s) and not of MDPI and/or the editor(s). MDPI and/or the editor(s) disclaim responsibility for any injury to people or property resulting from any ideas, methods, instructions or products referred to in the content. |
© 2023 by the authors. Licensee MDPI, Basel, Switzerland. This article is an open access article distributed under the terms and conditions of the Creative Commons Attribution (CC BY) license (https://creativecommons.org/licenses/by/4.0/).