
Analysis of Phase Diagram of CaO-CoOx-ErOy and Crystal Structure of Perovskite (Ca3−xErx)Co2O6−z Solid Solution


Abstract
1. Introduction
2. Materials and Methods
2.1. Sample Preparation
2.2. X-ray Powder Diffraction
2.3. Rietveld Refinements
3. Results
3.1. Binary Oxide Systems
3.1.1. CaO-CoOx
3.1.2. CaO-ErOy
3.1.3. CoOx-ErOy
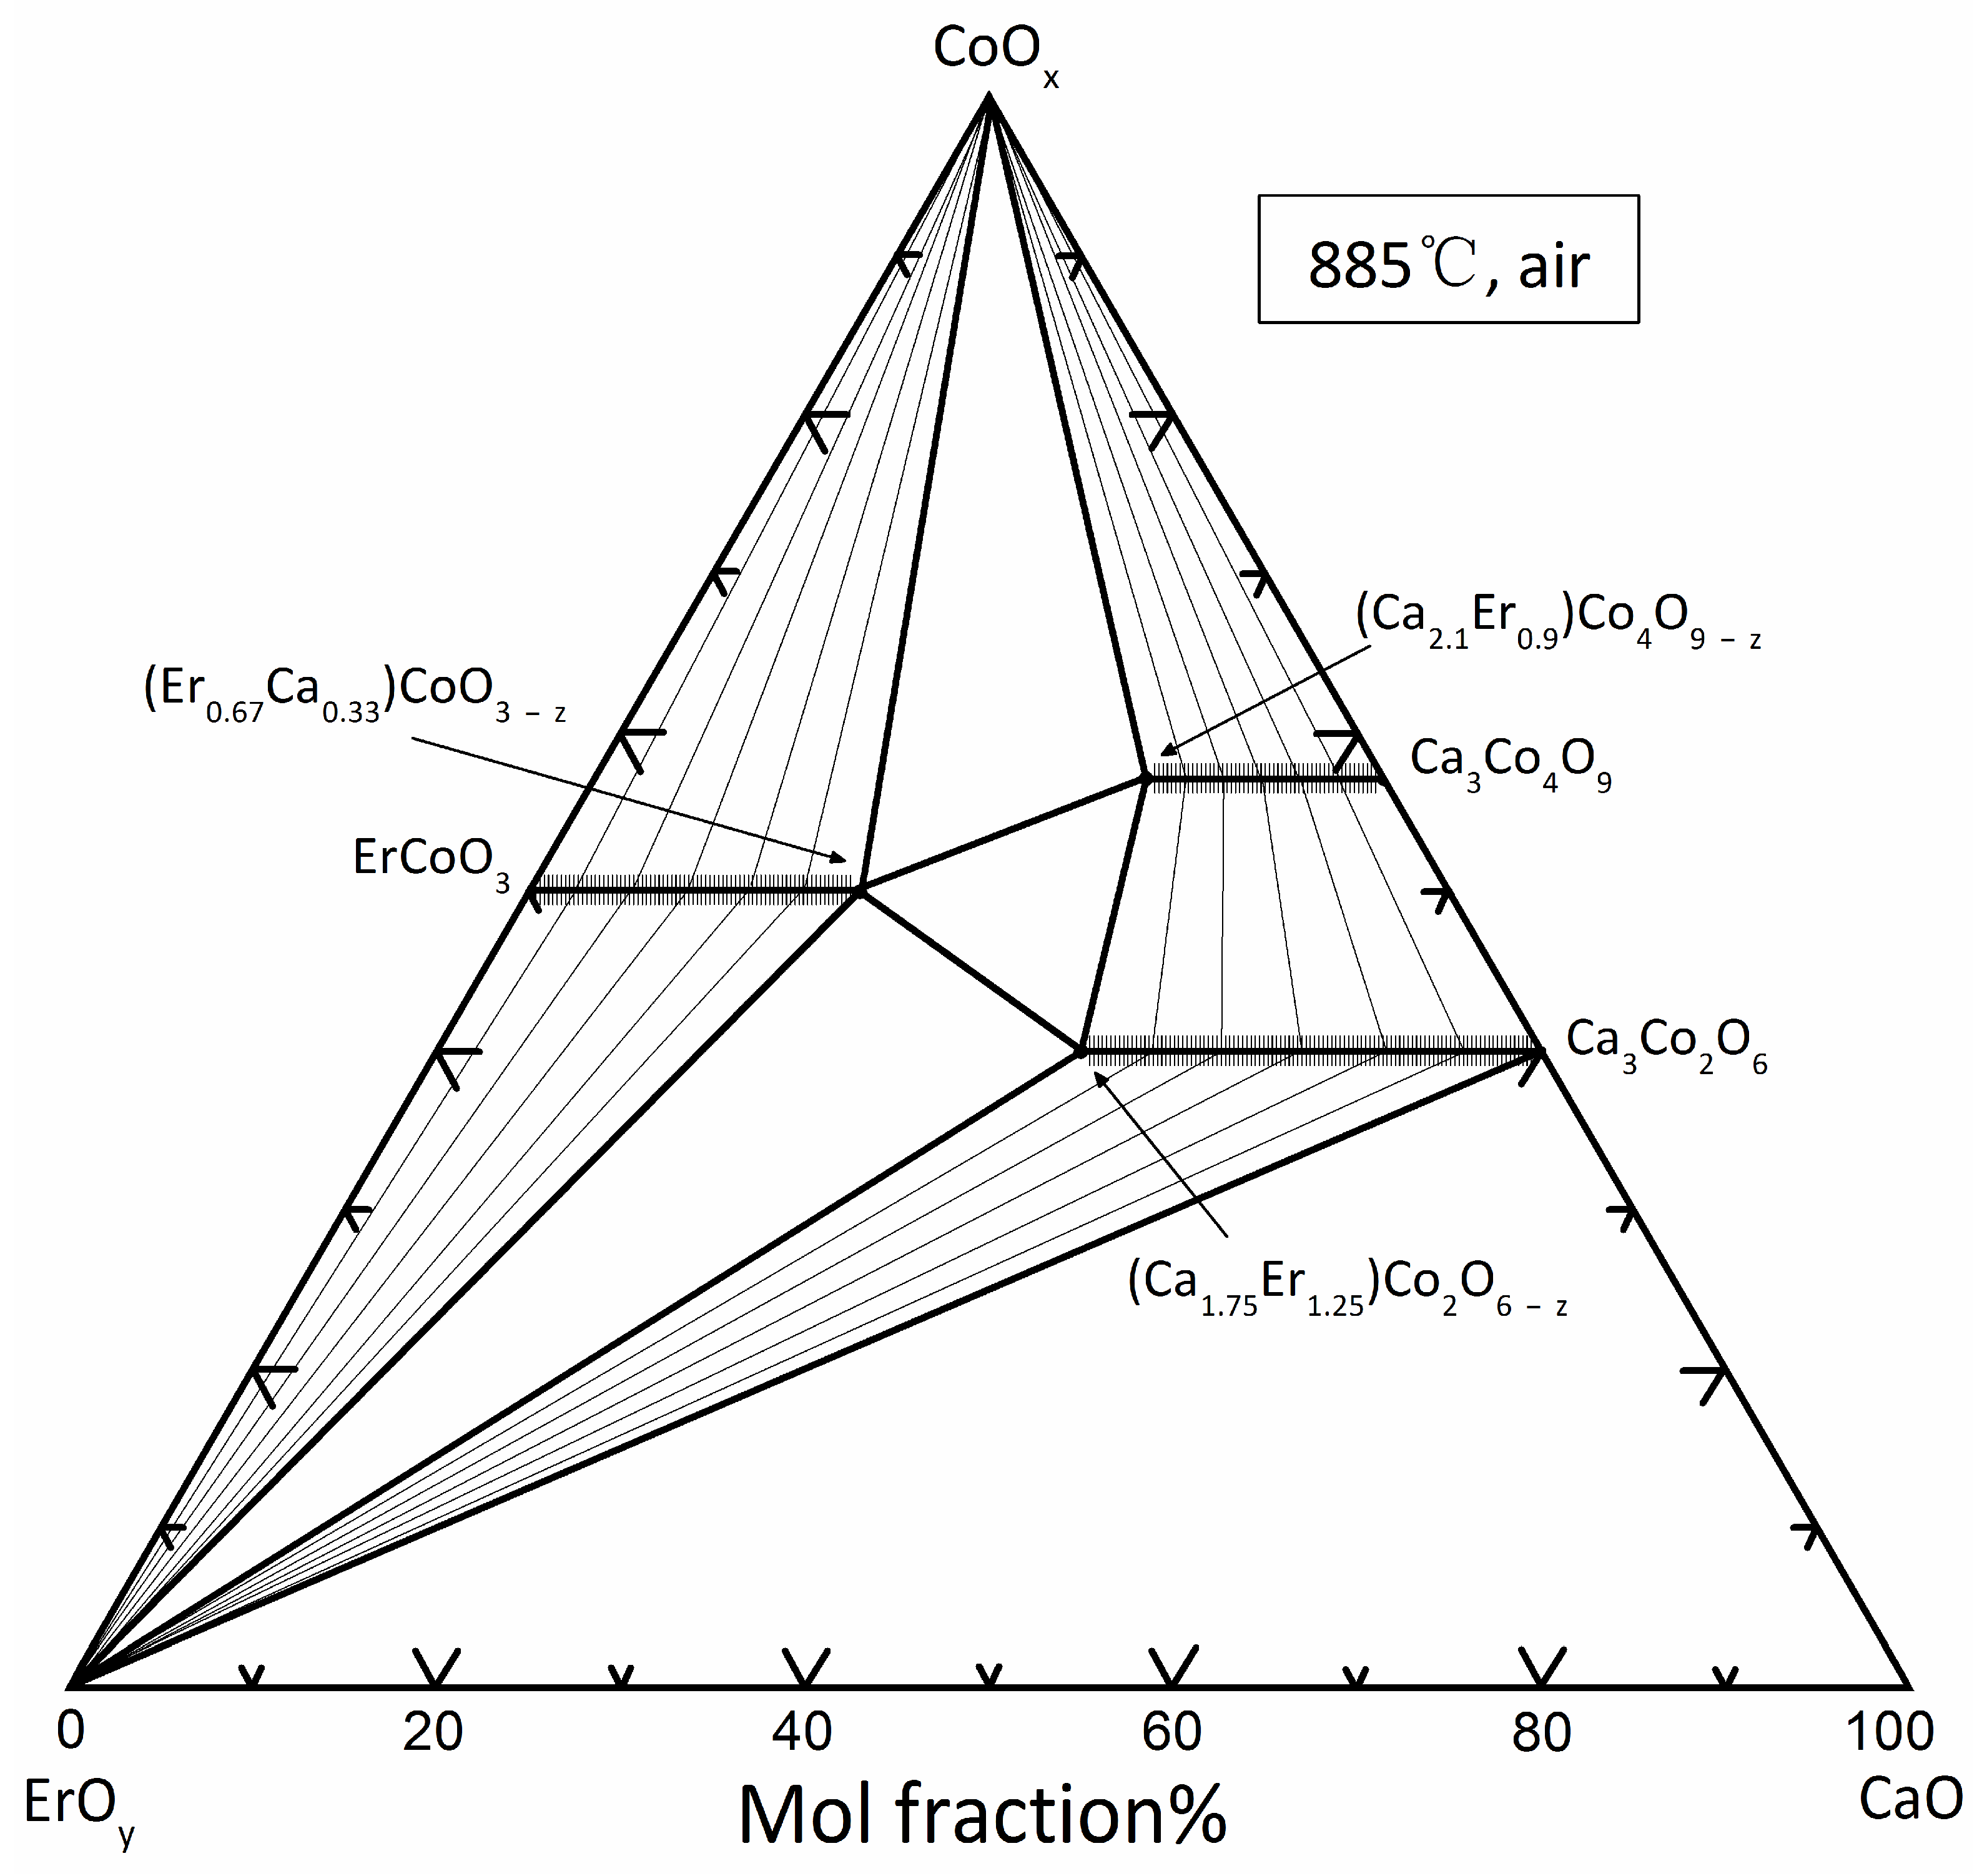
3.2. Ternary Oxide Systems
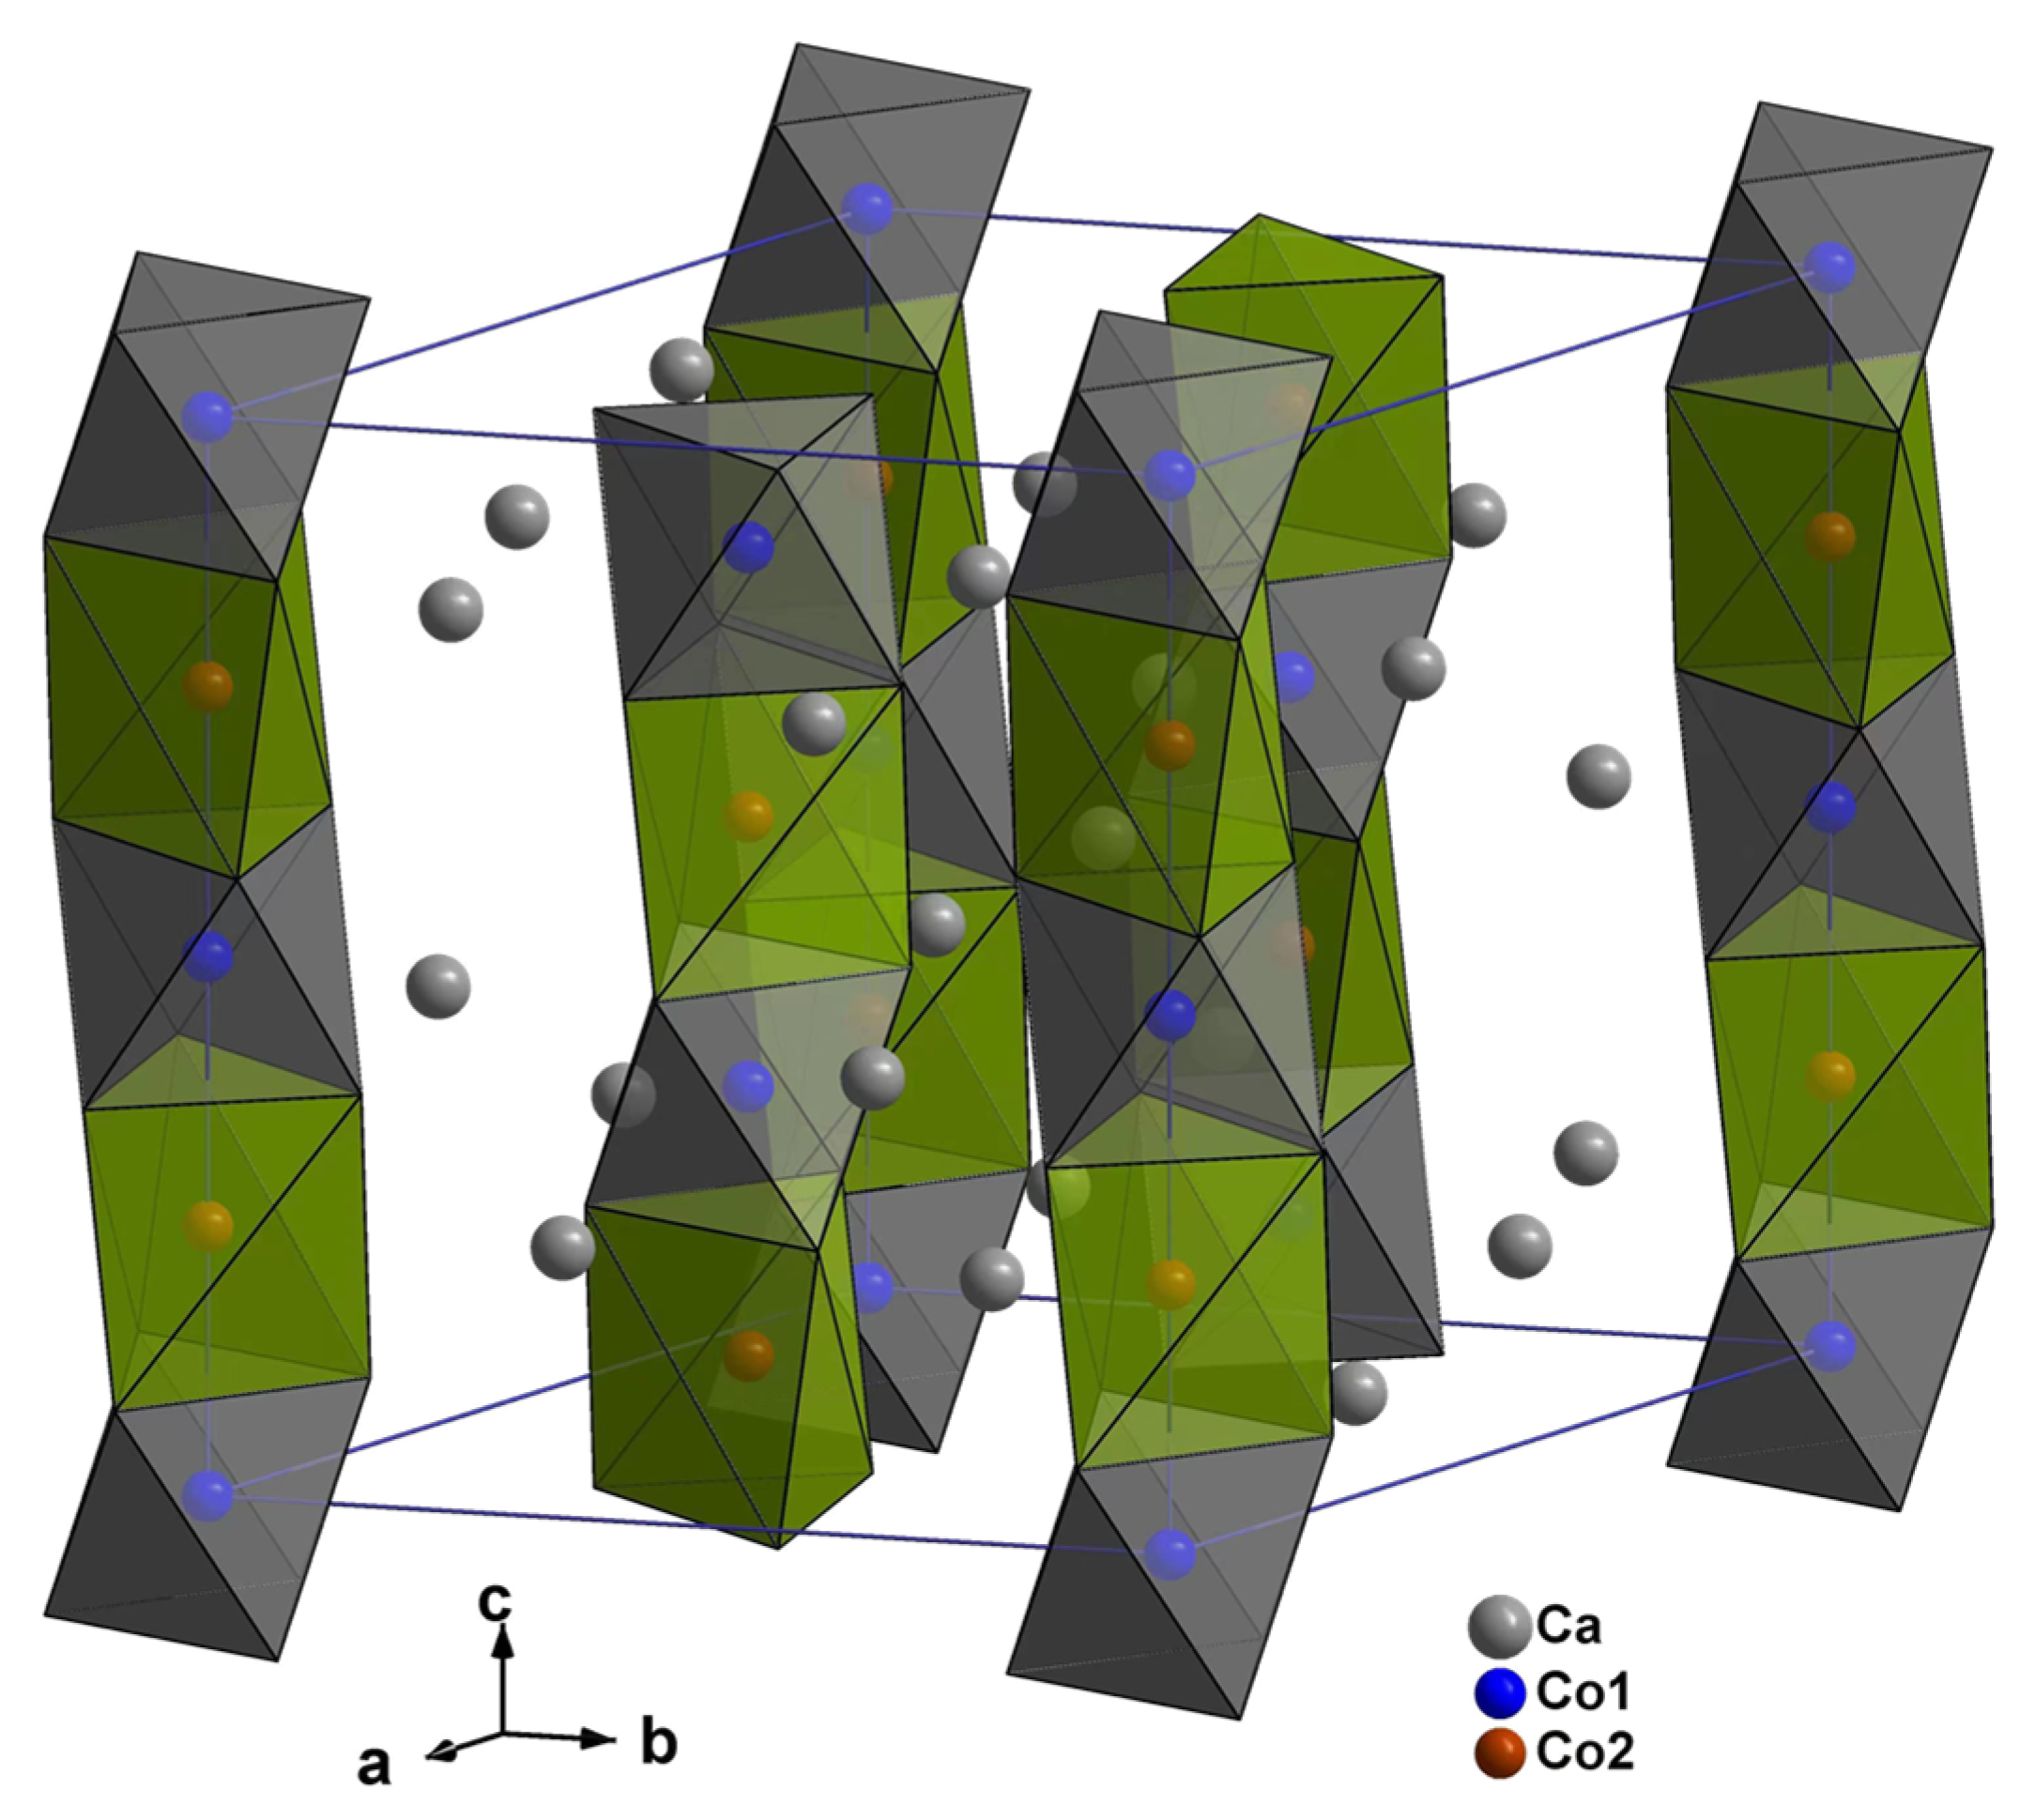
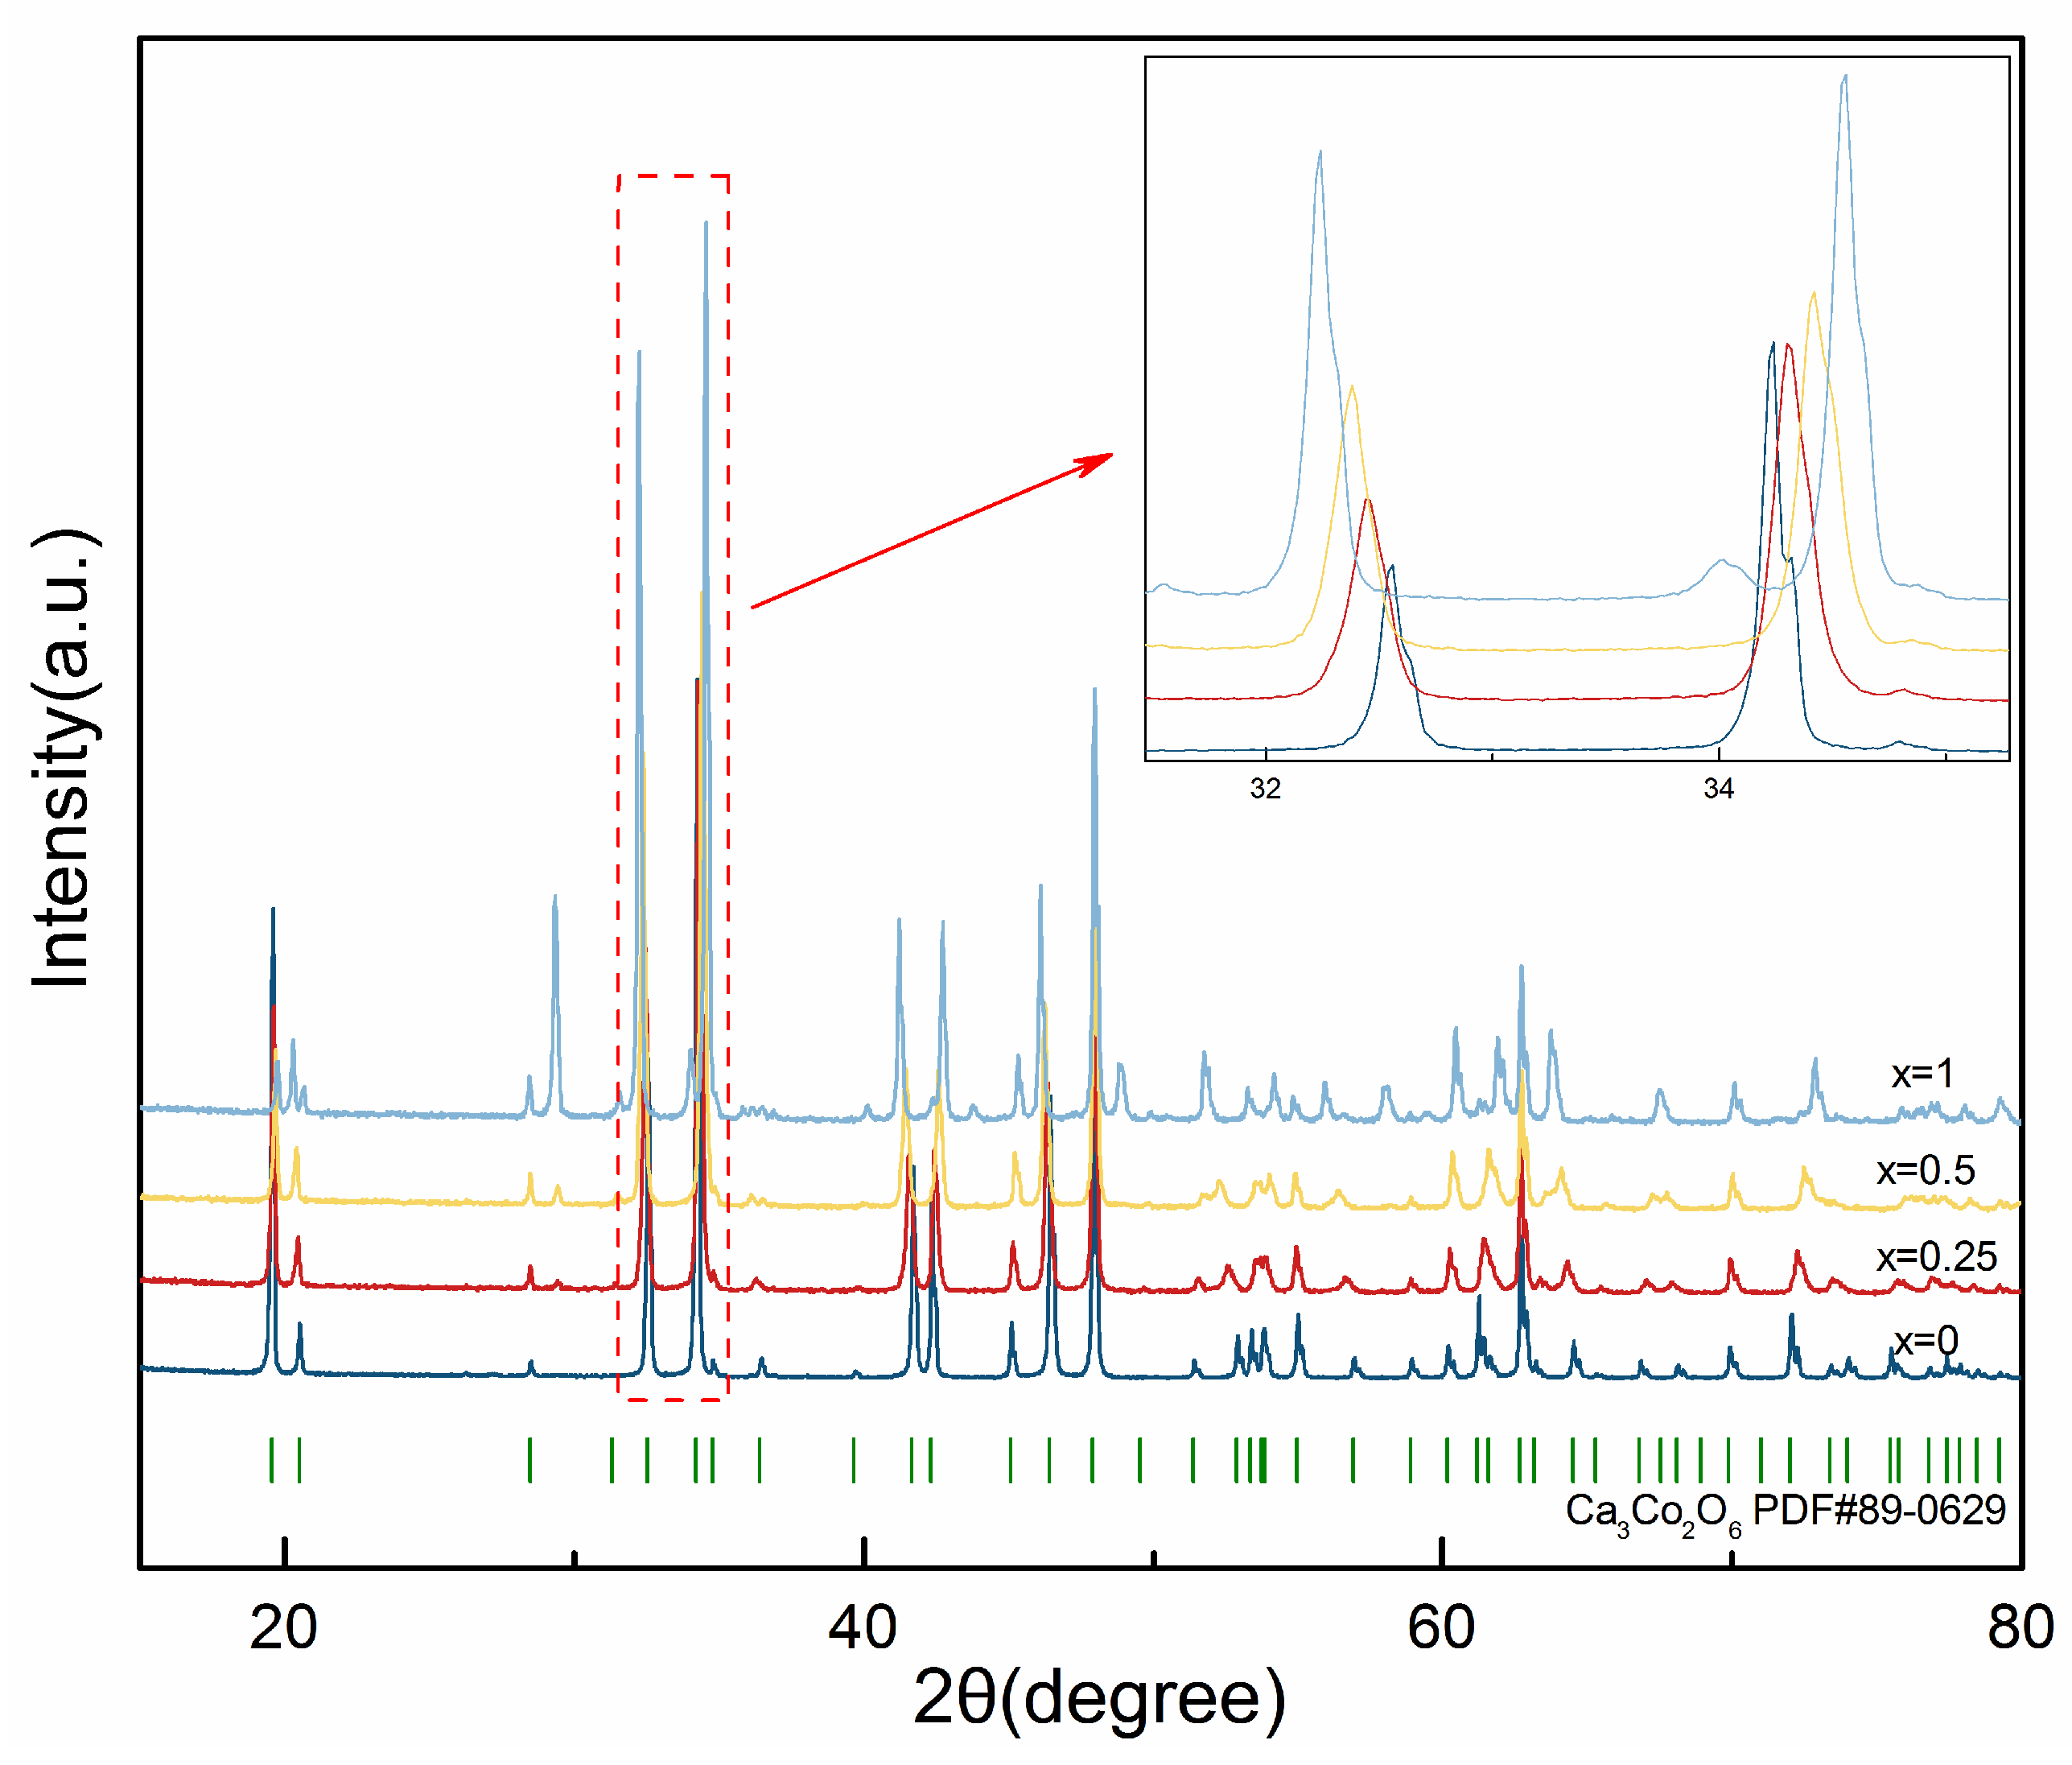
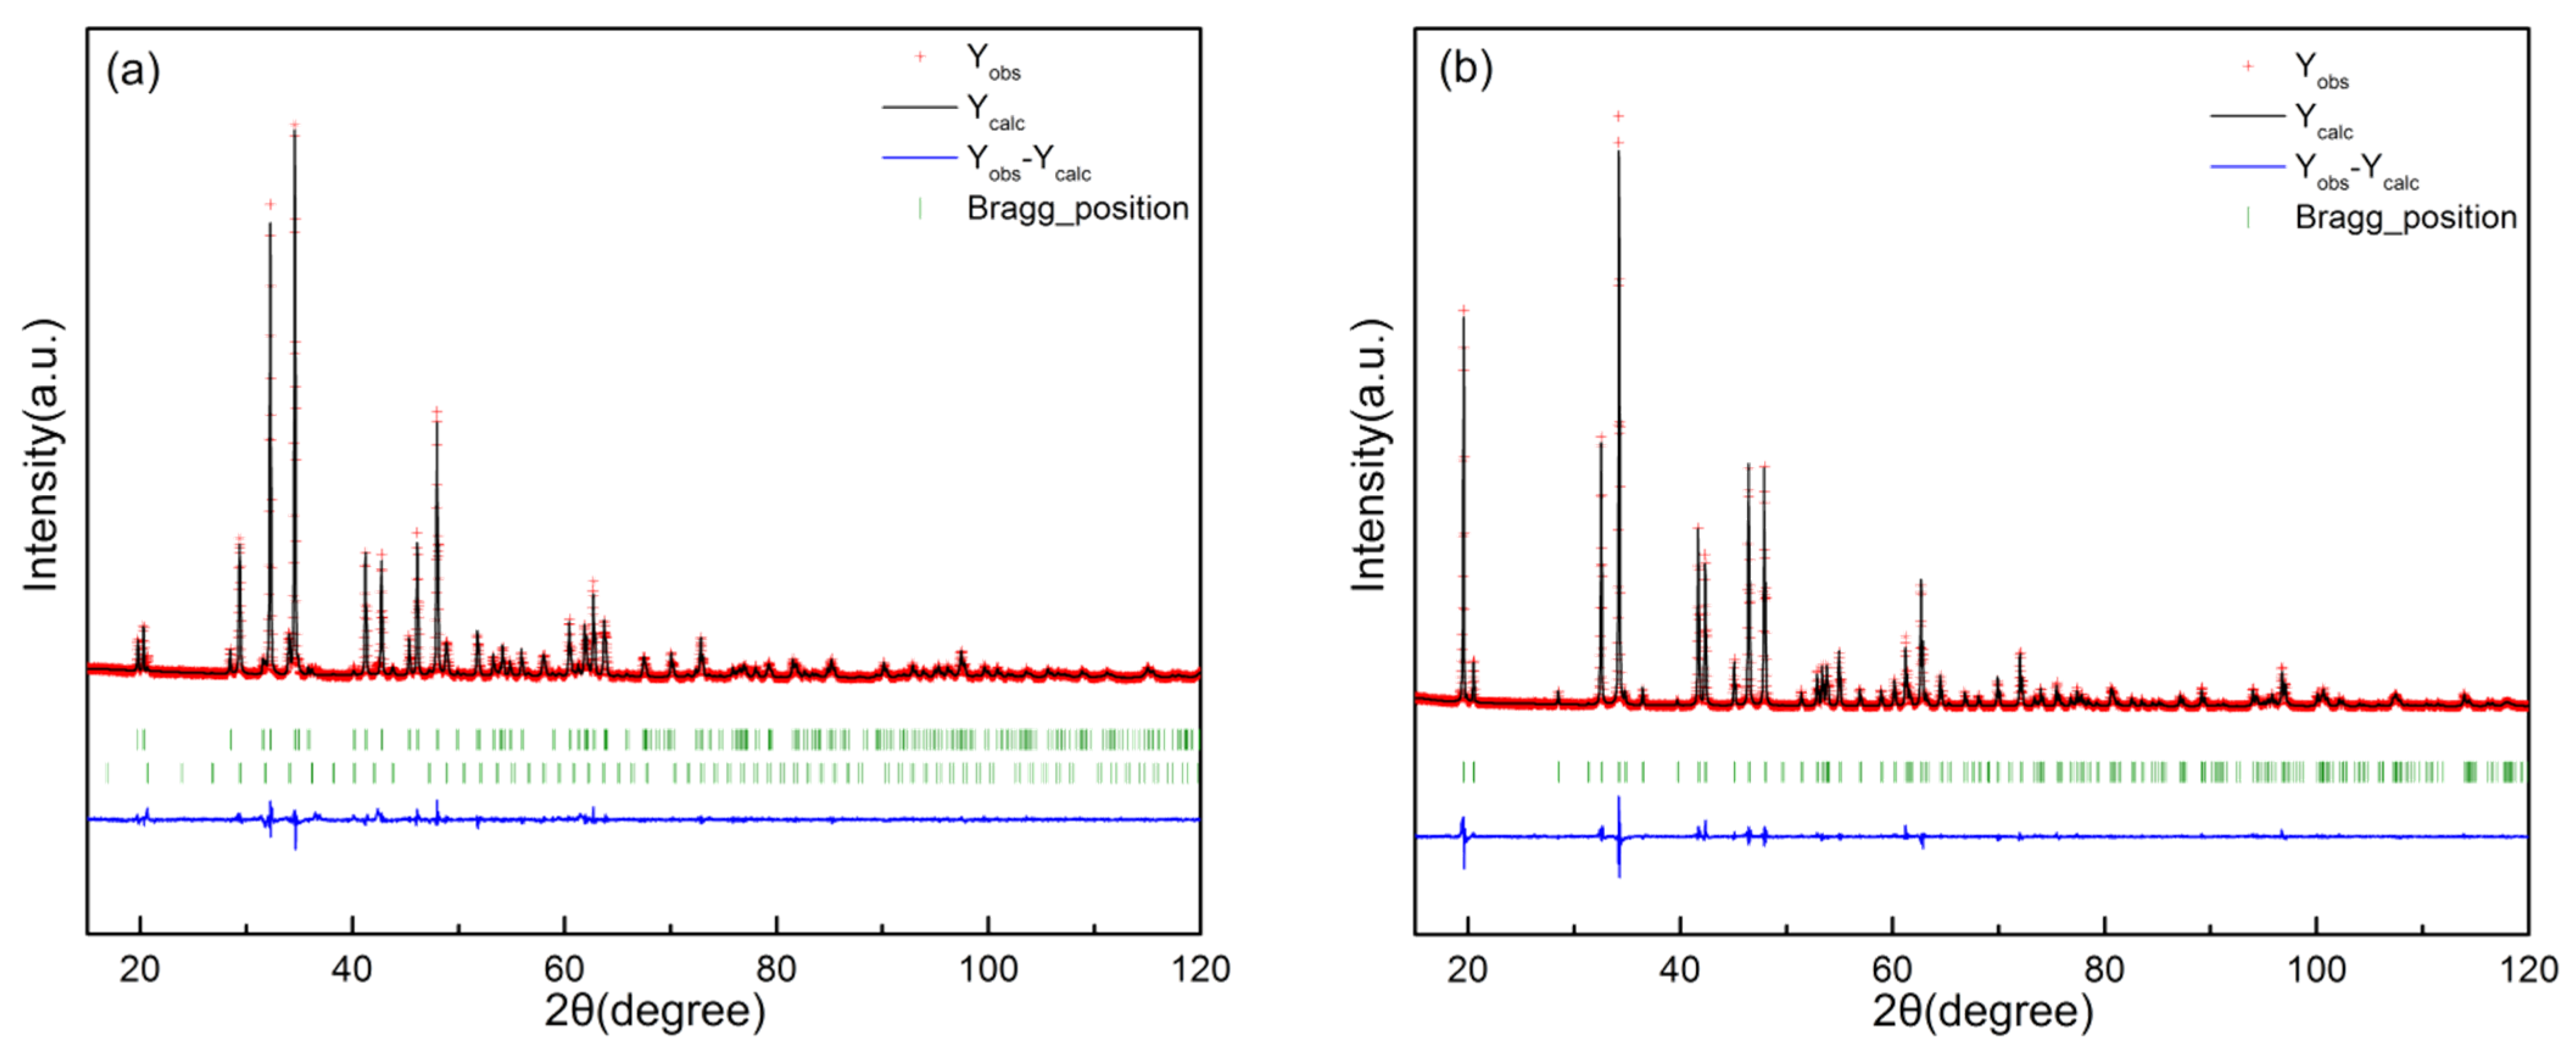
3.2.1. (Ca3−xErx)Co2O6−z
3.2.2. (Er1−xCax)CoO3−z
3.2.3. (Ca3−xErx)Co4O9−z
4. Discussion
5. Conclusions
Author Contributions
Funding
Data Availability Statement
Conflicts of Interest
References
- Xiao, Z.W.; Song, Z.N.; Yan, Y.F. From Lead Halide Perovskites to Lead-Free Metal Halide Perovskites and Perovskite Derivatives. Adv. Mater. 2019, 31, 1803792. [Google Scholar] [CrossRef]
- Shen, L.; Chen, R.; Zhang, D.; Yilmazoglu, U.C.; Gu, K.; Sarmiento, J.S.; Zhu, T.; Zheng, L.; Zheng, J.; Wang, H.; et al. High-Performance Perovskite Photovoltaics by Heterovalent Substituted Mixed Perovskites. Adv. Funct. Mater. 2022, 32, 2207911. [Google Scholar] [CrossRef]
- Wang, J.; Luo, S.; Lin, Y.; Chen, Y.; Deng, Y.; Li, Z.; Meng, K.; Chen, G.; Huang, T.; Xiao, S.; et al. Templated growth of oriented layered hybrid perovskites on 3D-like perovskites. Nat. Commun. 2020, 11, 582. [Google Scholar] [CrossRef]
- Mohapatra, A.; Singh, N.; Singh, A.; Lee, C.-Y.; Lu, Y.-J.; Tao, Y.-T.; Lee, C.-H.; Chu, C.W. Solution-Processed Perovskite/Perovskite Heterostructure Via a Grafting-Assisted Transfer Technique. ACS Appl. Energy Mater. 2021, 4, 1962–1971. [Google Scholar] [CrossRef]
- Clark, C.P.; Mann, J.E.; Bangsund, J.S.; Hsu, W.-J.; Aydil, E.S.; Holmes, R.J. Formation of Stable Metal Halide Perovskite/Perovskite Heterojunctions. ACS Energy Lett. 2020, 5, 3443–3451. [Google Scholar] [CrossRef]
- Hu, L.; Wu, H.; Zhu, T.; Fu, C.; He, J.; Ying, P.; Zhao, X. Tuning multiscale microstructures to enhance thermoelectric performance of n-Type bismuth-telluride-based solid solutions. Adv. Energy Mater. 2015, 5, 1500411. [Google Scholar] [CrossRef]
- Zhao, H.; Sui, J.; Tang, Z.; Lan, Y.; Jie, Q.; Kraemer, D.; McEnaney, K.; Guloy, A.; Chen, G.; Ren, Z. High thermoelectric performanceof MgAgSb-based materials. Nano Energy 2014, 7, 97–103. [Google Scholar] [CrossRef]
- Biswas, K.; He, J.; Blum, I.D.; Wu, C.-I.; Hogan, T.P.; Seidman, D.N.; Dravid, V.P.; Kanatzidis, M.G. High-performance bulk thermoelectrics with all-scale hierarchical architectures. Nature 2012, 489, 414. [Google Scholar] [CrossRef]
- Yu, B.; Zebarjadi, M.; Wang, H.; Lukas, K.; Wang, H.; Wang, D.; Opeil, C.; Dresselhaus, M.; Chen, G.; Ren, Z. Enhancement of thermoelectric properties by modulation-doping in silicon germanium alloy nanocomposites. Nano Lett. 2012, 12, 2077–2082. [Google Scholar] [CrossRef] [PubMed]
- Xie, H.Y.; Hao, S.Q.; Bao, J.K.; Slade, T.J.; Snyder, G.J.; Wolverton, C.; Kanatzidis, M.G. All-inorganic halide perovskites as potential thermoelectric materials: Dynamic cation off-centering induces ultralow thermal conductivity. J. Am. Chem. Soc. 2020, 142, 9553–9563. [Google Scholar] [CrossRef] [PubMed]
- Riffat, S.B.; Ma, X. Thermoelectrics: A review of present and potential applications. Appl. Therm. Eng. 2003, 23, 913–935. [Google Scholar] [CrossRef]
- Ma, Z.; Wei, J.T.; Song, P.S.; Zhang, M.; Yang, L.; Ma, J.; Liu, W.; Yang, F.; Wang, X. Review of experimental approaches for improving zT of thermoelectric materials. Mat. Sci. Semicon. Proc. 2021, 121, 105303. [Google Scholar] [CrossRef]
- Zhang, S.H.; Niu, X.B.; Xie, Y.Q.; Gong, K.; Shao, H.; Hu, Y.; Wang, Y. High intrinsic ZT in InP3 monolayer at room temperature. J. Phys. Condens. Mat. 2019, 31, 365501. [Google Scholar] [CrossRef] [PubMed]
- Zhu, T.J.; Liu, Y.T.; Fu, C.G.; Heremans, J.P.; Snyder, J.G.; Zhao, X. Compromise and Synergy in High-Efficiency Thermoelectric Materials. Adv. Mater. 2017, 29, 1605884. [Google Scholar] [CrossRef] [PubMed]
- Fjellva, G.H.; Gulbrandsen, E.; Aasland, S.; Olsén, A.; Hauback, B.C. Crystal Structure and Possible Charge Ordering in One-Dimensional Ca3Co2O6. J. Solid State Chem. 1996, 124, 190–194. [Google Scholar] [CrossRef]
- Hardy, V.; Flahaut, D.; Fresard, R.; Maignan, A. Anisotropic susceptibility of the geometrically frustrated spin-chain compound Ca3Co2O6. J. Phys. Condens. Mat. 2007, 19, 1898–1908. [Google Scholar] [CrossRef]
- Hardy, V.; Lees, M.R.; Petrenko, O.A.; Paul, D.M.; Flahaut, D.; Hébert, S.; Maignan, A. Temperature and time dependence of the field-driven magnetization steps in Ca3Co2O6 single crystals. Phys. Rev. B 2004, 70, 064424. [Google Scholar] [CrossRef]
- Masset, A.C.; Michel, C.; Maignan, A.; Hervieu, M.; Toulemonde, O.; Studer, F.; Raveau, B.; Hejtmanek, J. Misfit-layered cobaltite with an anisotropic giant magnetoresistance: Ca3Co4O9. Phys. Rev. B 2000, 62, 166–175. [Google Scholar] [CrossRef]
- Kenfaui, D.; Chateigner, D.; Gomina, M.; Noudem, J.G. Texture, mechanical and thermoelectric properties of Ca3Co4O9 ceramics. J. Alloys Compd. 2009, 490, 472–479. [Google Scholar] [CrossRef]
- Saini, S.; Yaddanapudi, H.S.; Tian, K.; Yin, Y.; Magginetti, D.; Tiwari, A. Terbium Ion Doping in Ca3Co4O9: A Step towards High-Performance Thermoelectric Materials. Sci. Rep. 2017, 7, 44621. [Google Scholar] [CrossRef]
- Ren, G.K.; Lan, J.L.; Zhao, L.D.; Yin, Y.; Magginetti, D.; Tiwari, A. Layered oxygen-containing thermoelectric materials: Mechanisms, strategies, and beyond. Mater. Today 2019, 29, 68–85. [Google Scholar] [CrossRef]
- Tanabe, K.; Okazaki, R.; Taniguchi, H.; Terasaki, I. Optical conductivity of layered calcium cobaltate Ca3Co4O9. J. Phys. Condens. Mat. 2016, 28, 085601. [Google Scholar] [CrossRef] [PubMed]
- Li, S.W.; Funahashi, R.; Matsubara, I.; Yamada, H.; Ueno, K.; Sodeoka, S. Synthesis and thermoelectric properties of the new oxide ceramics Ca3-xSrxCo4O9+δ (x = 0.0 − 1.0). Ceram. Int. 2001, 27, 321–324. [Google Scholar] [CrossRef]
- Bhattacharya, S.; Aswal, D.K.; Singh, A.; Thinaharan, C.; Kulkarni, N.; Gupta, S.; Yakhmi, J.V. Anisotropic electrical transport studies of Ca3Co4O9 single crystals grown by the flux method. J. Cryst. Growth 2005, 277, 246–251. [Google Scholar] [CrossRef]
- Wolf, M.; Rehder, L.; Steinbach, F.; Abt, M.; Hinterding, R.; Overmeyer, L.; Feldhoff, A. Combination of Laser and Thermal Sintering of Thermoelectric Ca3Co4O9 Films. Chem. Ing. Tech. 2021, 94, 177–185. [Google Scholar] [CrossRef]
- Li, Y.N.; Wu, P.; Zhang, S.P.; Pei, Y.L.; Yang, J.; Chen, S.; Wang, L. Enhanced thermoelectric properties of Ca3Co4O9 by adding nano MoSi2. Ceram. Int. 2022, 48, 33967–33975. [Google Scholar] [CrossRef]
- Terasaki, I.; Sasago, Y.; Uchinokura, K. Large thermoelectric power in NaCo2O4 single crystals. Phys. Rev. B 1997, 56, R12685–R12687. [Google Scholar] [CrossRef]
- Wang, S.F.; Venimadhav, A.; Guo, S.M.; Chen, K.; Li, Q.; Soukiassian, A.; Schlom, D.G.; Katz, M.B.; Pan, X.Q.; Wong-Ng, W.; et al. Structural and thermoelectric properties of Bi2Sr2Co2Oy thin films on LaAlO3 (100) and fused silica substrates. Appl. Phys. Lett. 2009, 94, R12685. [Google Scholar] [CrossRef]
- Wong-Ng, W.; Yan, Y.; Kaduk, J.A.; Tang, X.F. X-ray powder diffraction reference patterns for Bi1-xPb(x)OCuSe. Power Diffr. 2006, 31, 223–228. [Google Scholar] [CrossRef]
- Wong-Ng, W.; Liu, G.Y.; Martin, J.; Thomas, E.L.; Lowhorn, N.; Kaduk, J.A. Phase compatibility and thermoelectric properties of compounds in the Sr–Ca–Co–O system. J. Appl. Phys. 2010, 107, 188–488. [Google Scholar] [CrossRef]
- Wong-Ng, W.; Luo, T.; Xie, W.; Tang, W.; Kaduk, J.; Huang, Q.; Yan, Y.; Chattopadhyay, S.; Tang, X.; Tritt, T. Phase diagram, crystal chemistry and thermoelectric properties of compounds in the Ca-Co-Zn-O system. J. Solid State Chem. 2011, 184, 2159–2166. [Google Scholar] [CrossRef]
- Li, S.W.; Funahashi, R.; Matsubara, I.; Ueno, K.; Sodeoka, S.; Yamada, H. Synthesis and Thermoelectric Properties of the New Oxide Materials Ca3-xBixCo4O9+δ (0.0 < x < 0.75). Chem. Mater. 2000, 31, 2424–2427. [Google Scholar] [CrossRef]
- Thorogood, G.J.; Orain, P.Y.; Ouvry, M.; Piriou, B.; Tedesco, T.; Wallwork, K.S.; Herrmann, J.; James, M. Structure, crystal chemistry and magnetism of rare earth calcium-doped cobaltates: Ln2-xCaxCoO4+δ (Ln = Pr, Nd, Sm, Eu and Gd). Solid State Sci. 2011, 13, 2113–2123. [Google Scholar] [CrossRef]
- Wong-Ng, W.; Laws, W.J.; Yan, Y.G. Phase diagram and crystal chemistry of the La-Ca-Co-O system. Solid State Sci. 2013, 17, 107–110. [Google Scholar] [CrossRef]
- Wong-Ng, W.; Laws, W.J.; Talley, K.; Huang, Q.; Yan, Y.; Martin, J.; Kaduk, J. Phase equilibria and crystal chemistry of the CaO-Nd2O3-CoOz system at 885 °C in air. Solid State Sci. 2014, 215, 128–134. [Google Scholar] [CrossRef]
- Wong-Ng, W.; Laws, W.J.; Lapidus, S.H.; Kaduk, J. Phase equilibria and crystal chemistry of the CaO-Sm2O3-CoOz system at 885 °C in air. Solid State Sci. 2015, 48, 31–38. [Google Scholar] [CrossRef]
- Wong-Ng, W.; Laws, W.J.; Kaduk, J.A. Crystal chemistry and phase equilibria of the CaO-Eu2O3-CoOz system at 885 °C in air. Solid State Sci. 2016, 2558, 30391. [Google Scholar] [CrossRef]
- Wong-Ng, W.; Laws, W.J.; Lapidus, S.H.; Ribaud, L.; Kaduk, J. Phase equilibria and crystal chemistry of the CaO-Gd2O3-CoOz system at 885 °C in air. Solid State Sci. 2017, 72, 128–134. [Google Scholar] [CrossRef]
- Wong-Ng, W.; Laws, W.J.; Kaduk, J.A. Crystal chemistry and phase equilibria of the CaO-Dy2O3-CoOz system at 885 °C in air. Solid State Sci. 2018, 88, 57–62. [Google Scholar] [CrossRef]
- Wong-Ng, W.; Laws, W.J.; Huang, Q.; Hou, J.; Lapidus, S.; Ribaud, L.; Kaduk, J. Crystal chemistry and phase equilibria of the CaO-Ho2O3-CoOz system at 885 °C in air. Solid State Sci. 2020, 107, 106348. [Google Scholar] [CrossRef]
- Gates-Rector, S.D.; Blanton, T.N. The Powder Diffraction File: A quality Materials Characterization Database. Powder Diffr. 2019, 34, 352–360. [Google Scholar] [CrossRef]
- Papynov, E.K.; Portnyagin, A.S.; Modinc, E.B.; Mayorov, V.; Shichalin, O.; Golikov, A.; Pechnikov, V.; Gridasova, E.; Tananaev, I.; Avramenko, V. A complex approach to assessing porous structure of structured ceramics obtained by SPS technique. Mater. Charact. 2018, 145, 284–302. [Google Scholar] [CrossRef]
- Papynov, E.K.; Shichalin, O.O.; Medkov, M.A.; Grishchenko, D.N.; Tkachenko, I.A.; Fedorets, A.N.; Pechnikov, V.S.; Golub, A.V.; Buravlev, I.Y.; Tananaev, I.G.; et al. Spark Plasma Sintering of Special-Purpose Functional Ceramics Based on UO2, ZrO2, Fe3O4/α-Fe2O3. Glass Phys. Chem. 2018, 44, 632–640. [Google Scholar] [CrossRef]
- Buravlev, I.; Shichalin, O.; Papynov, E.; Golub, A.; Gridasova, E.; Buravleva, A.; Yagofarov, V.; Dvornik, M.; Fedorets, A.; Reva, V.; et al. WC-5TiC-10Co hard metal alloy fabrication via mechanochemical and SPS techniques. Int. J. Refract. Met. H 2020, 94, 105385. [Google Scholar] [CrossRef]
- Rietveld, H.M. A method for including the line profiles of neutron powder diffraction peaks in the determination of crystal structures. Acta Crystallogr. 1966, 229, 151. [Google Scholar]
- Rodriguez-Carvajal, J.L. Recent advances in magnetic structure determination by neutron powder diffraction. Phys. B 1993, 192, 55–69. [Google Scholar] [CrossRef]
- Jain, A.; Singh, S.; Yusuf, S.M. Structural and magnetic properties of spin chain compounds Ca3Co2-xFexO6. Phys. Rev. B 2006, 74, 174419. [Google Scholar] [CrossRef]
- Shannon, R.D. Revised Effective Ionic Radii and Systematic Studies of Interatomie Distances in Halides and Chaleogenides. Acta Cryst. 1976, A32, 751–767. [Google Scholar] [CrossRef]


| Sample # | Ca | Co | Er |
|---|---|---|---|
| #01 | 0.05 | 0 | 0.95 |
| #02 | 0.08 | 0 | 0.92 |
| #03 | 0.1 | 0 | 0.9 |
| #04 | 0.95 | 0 | 0.05 |
| #05 | 0.98 | 0 | 0.02 |
| #06 | 0.05 | 0.2 | 0.75 |
| #07 | 0.2 | 0.2 | 0.6 |
| #08 | 0.55 | 0.24 | 0.21 |
| #09 | 0.65 | 0.25 | 0.1 |
| #10 | 0 | 0.3333 | 0.6667 |
| #11 | 0.3 | 0.3333 | 0.3667 |
| #12 | 0.31 | 0.3333 | 0.3567 |
| #13 | 0.32 | 0.3333 | 0.3467 |
| #14 | 0.3333 | 0.3333 | 0.3334 |
| #15 | 0.35 | 0.3333 | 0.3167 |
| #16 | 0.39 | 0.3333 | 0.2767 |
| #17 | 0.4 | 0.3333 | 0.2667 |
| #18 | 0.42 | 0.3333 | 0.2467 |
| #19 | 0.43 | 0.3333 | 0.2367 |
| #20 | 0.45 | 0.3333 | 0.2167 |
| #21 | 0.5 | 0.3333 | 0.1667 |
| #22 | 0.55 | 0.3333 | 0.1167 |
| #23 | 0.4 | 0.4 | 0.2 |
| #24 | 0.5 | 0.4 | 0.1 |
| #25 | 0.55 | 0.4 | 0.05 |
| #26 | 0.6 | 0.4 | 0 |
| #27 | 0.2 | 0.425 | 0.375 |
| #28 | 0 | 0.5 | 0.5 |
| #29 | 0.1 | 0.5 | 0.4 |
| #30 | 0.15 | 0.5 | 0.35 |
| #31 | 0.16 | 0.5 | 0.34 |
| #32 | 0.17 | 0.5 | 0.33 |
| #33 | 0.18 | 0.5 | 0.32 |
| #34 | 0.19 | 0.5 | 0.31 |
| #35 | 0.2 | 0.5 | 0.3 |
| #36 | 0.21 | 0.5 | 0.29 |
| #37 | 0.22 | 0.5 | 0.28 |
| #38 | 0.25 | 0.5 | 0.25 |
| #39 | 0.28 | 0.5 | 0.22 |
| #40 | 0.3 | 0.5 | 0.2 |
| #41 | 0.25 | 0.5714 | 0.1786 |
| #42 | 0.26 | 0.5714 | 0.1686 |
| #43 | 0.27 | 0.5714 | 0.1586 |
| #44 | 0.28 | 0.5714 | 0.1486 |
| #45 | 0.29 | 0.5714 | 0.1386 |
| #46 | 0.295 | 0.5714 | 0.1336 |
| #47 | 0.3 | 0.5714 | 0.1286 |
| #48 | 0.3572 | 0.5714 | 0.0714 |
| #49 | 0.4143 | 0.5714 | 0.0143 |
| #50 | 0.4286 | 0.5714 | 0 |
| #51 | 0.02 | 0.6 | 0.38 |
| #52 | 0.2 | 0.65 | 0.15 |
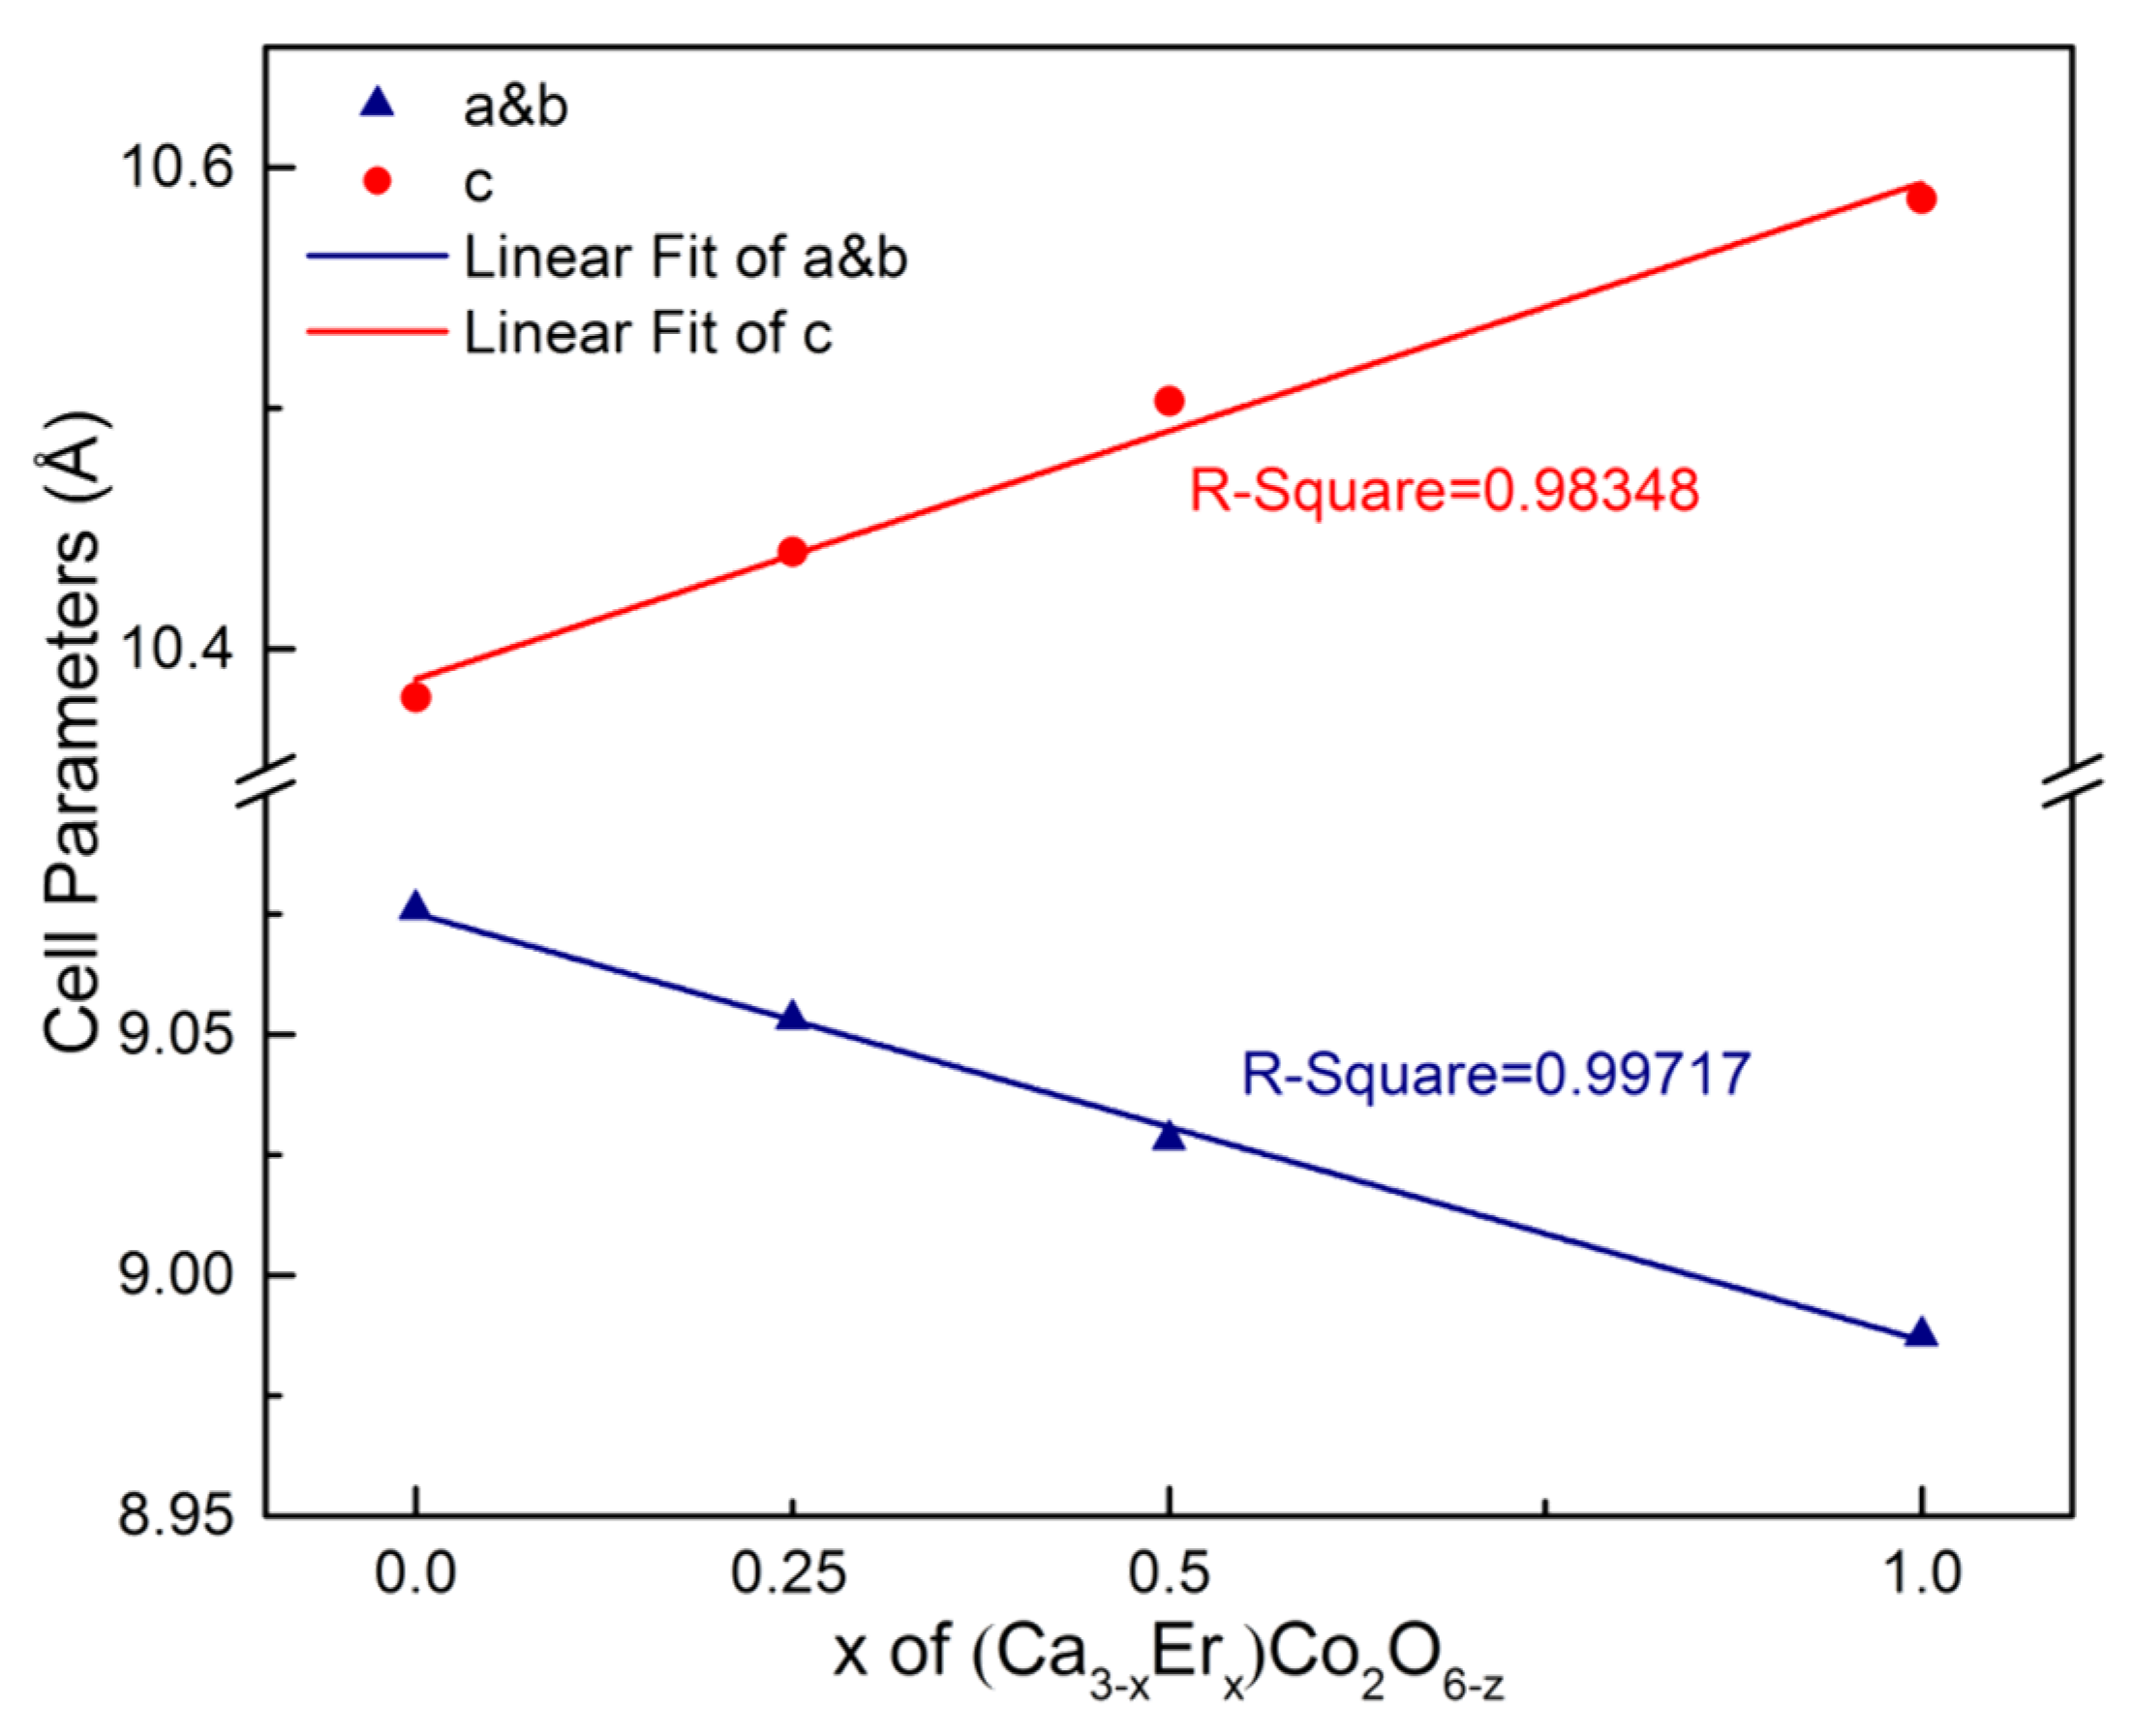
| x | a&b (Å) | c (Å) | Rwp (%) | χ2 |
|---|---|---|---|---|
| 0 | 9.07628 (8) | 10.38005 (12) | 11.0 | 2.22 |
| 0.25 | 9.05344 (21) | 10.44059 (28) | 10.8 | 3.53 |
| 0.5 | 9.02907 (22) | 10.50383 (28) | 9.57 | 3.43 |
| 1 | 8.98770 (12) | 10.58704 (17) | 6.79 | 2.47 |
| x | y | z | Biso [47] | |
|---|---|---|---|---|
| Ca3Co2O6 | ||||
| Ca | 0.36986 (2) | 0 | 0.25 | 0.39 |
| Co1 | 0 | 0 | 0 | 0.37 |
| Co2 | 0 | 0 | 0.25 | 0.48 |
| O | 0.17804 (6) | 0.02561 (8) | 0.11402 (5) | 0.53 |
| (Ca2.75Er0.25)Co2O6−z | ||||
| Ca/Er | 0.36834 (3) | 0 | 0.25 | 0.39 |
| Co1 | 0 | 0 | 0 | 0.37 |
| Co2 | 0 | 0 | 0.25 | 0.48 |
| O | 0.17787 (11) | 0.02463 (13) | 0.11268 (7) | 0.53 |
| (Ca2.5Er0.5)Co2O6−z | ||||
| Ca/Er | 0.36773 (3) | 0 | 0.25 | 0.39 |
| Co1 | 0 | 0 | 0 | 0.37 |
| Co2 | 0 | 0 | 0.25 | 0.48 |
| O | 0.17959 (12) | 0.02464 (14) | 0.11238 (8) | 0.53 |
| (Ca2Er1)Co2O6−z | ||||
| Ca/Er | 0.36688 (2) | 0 | 0.25 | 0.39 |
| Co1 | 0 | 0 | 0 | 0.37 |
| Co2 | 0 | 0 | 0.25 | 0.48 |
| O | 0.18265 (12) | 0.02475 (13) | 0.11010 (7) | 0.53 |
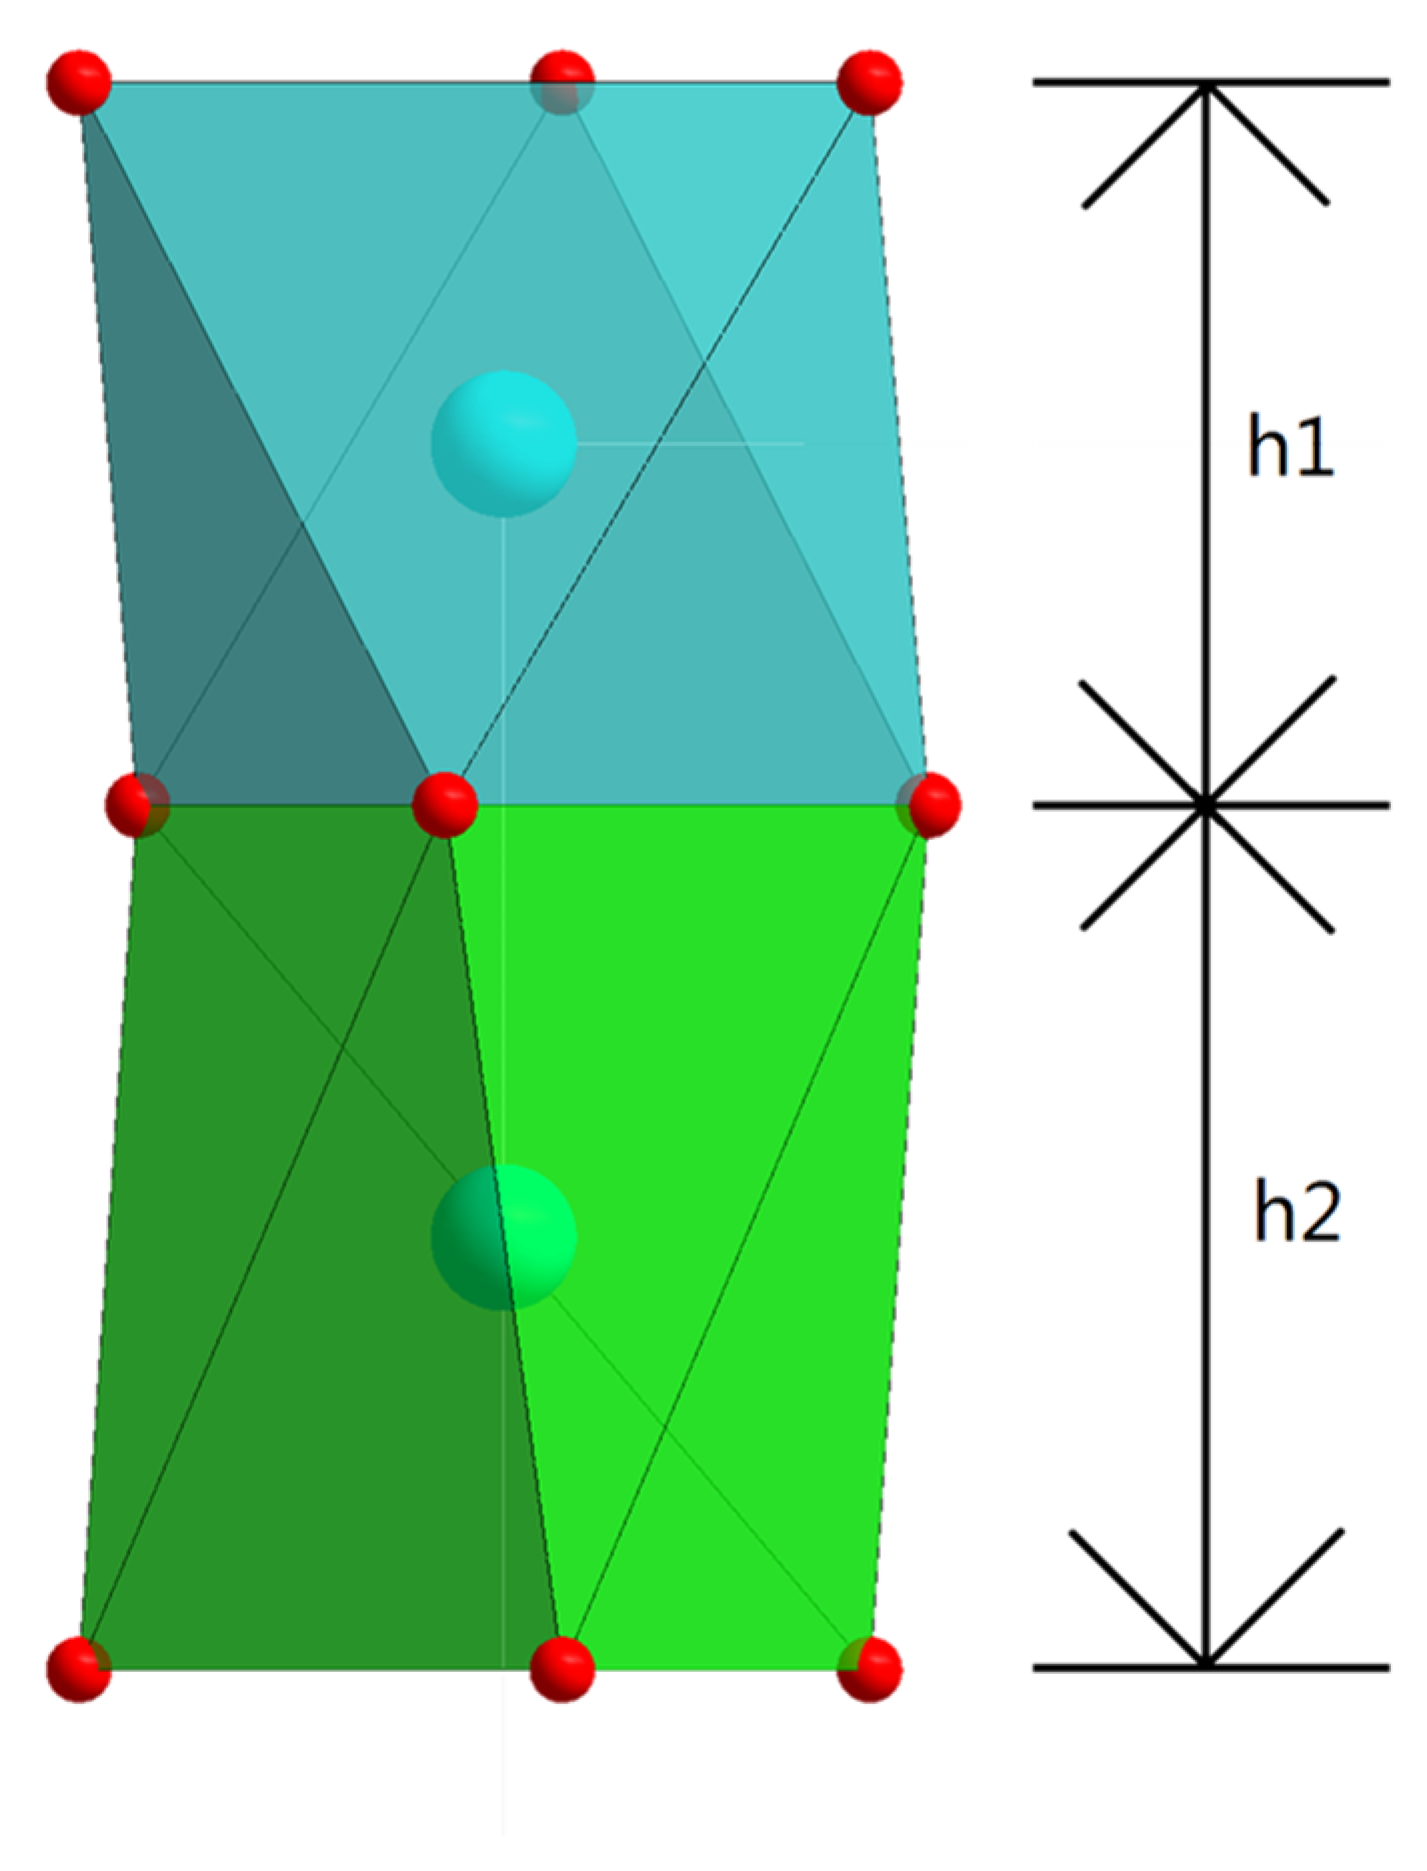
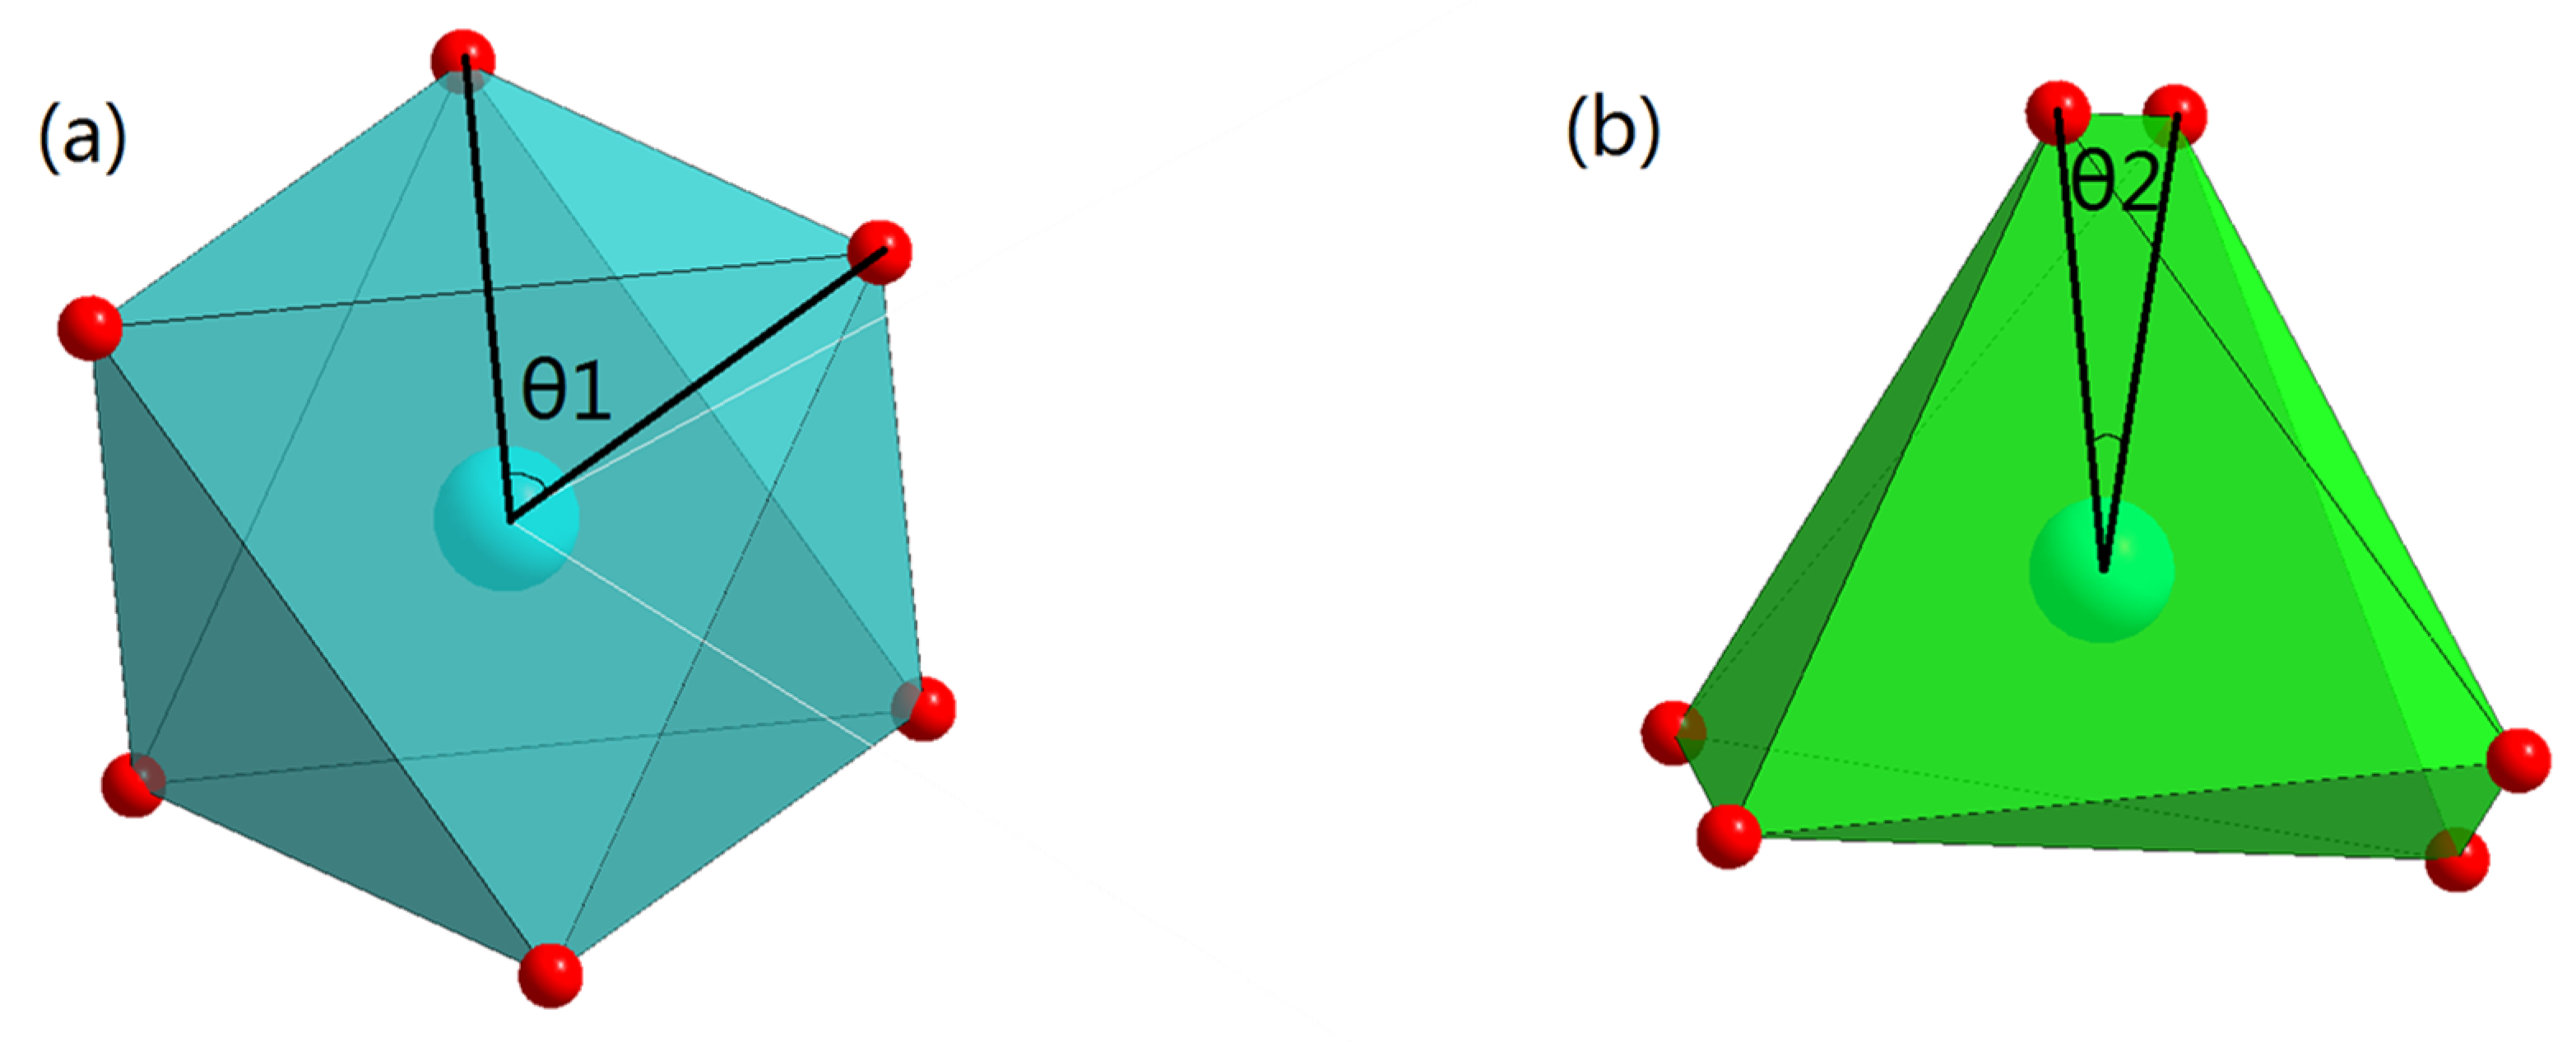
| x | h1 (Å) | h2 (Å) | h1 + h2 (Å) | OccCa | OccEr | θ1 (°) | θ2 (°) |
|---|---|---|---|---|---|---|---|
| 0 | 2.367 | 2.823 | 5.19 | 1 | 0 | 60.000 (44) | 15.290 (39) |
| 0.25 | 2.3529 | 2.8674 | 5.2203 | 0.916 | 0.076 | 60.000 (53) | 14.683 (52) |
| 0.5 | 2.3608 | 2.8911 | 5.2519 | 0.834 | 0.16 | 60.000 (51) | 14.540 (52) |
| 1 | 2.3312 | 2.9623 | 5.2935 | 0.666 | 0.298 | 60.000 (45) | 14.349 (38) |
Disclaimer/Publisher’s Note: The statements, opinions and data contained in all publications are solely those of the individual author(s) and contributor(s) and not of MDPI and/or the editor(s). MDPI and/or the editor(s) disclaim responsibility for any injury to people or property resulting from any ideas, methods, instructions or products referred to in the content. |
© 2023 by the authors. Licensee MDPI, Basel, Switzerland. This article is an open access article distributed under the terms and conditions of the Creative Commons Attribution (CC BY) license (https://creativecommons.org/licenses/by/4.0/).
Share and Cite
Wang, H.; Ning, H.; Fan, Z.; Liu, G. Analysis of Phase Diagram of CaO-CoOx-ErOy and Crystal Structure of Perovskite (Ca3−xErx)Co2O6−z Solid Solution. Energies 2023, 16, 4958. https://doi.org/10.3390/en16134958
Wang H, Ning H, Fan Z, Liu G. Analysis of Phase Diagram of CaO-CoOx-ErOy and Crystal Structure of Perovskite (Ca3−xErx)Co2O6−z Solid Solution. Energies. 2023; 16(13):4958. https://doi.org/10.3390/en16134958
Chicago/Turabian StyleWang, Haocheng, Haoming Ning, Zhenjun Fan, and Guangyao Liu. 2023. "Analysis of Phase Diagram of CaO-CoOx-ErOy and Crystal Structure of Perovskite (Ca3−xErx)Co2O6−z Solid Solution" Energies 16, no. 13: 4958. https://doi.org/10.3390/en16134958
APA StyleWang, H., Ning, H., Fan, Z., & Liu, G. (2023). Analysis of Phase Diagram of CaO-CoOx-ErOy and Crystal Structure of Perovskite (Ca3−xErx)Co2O6−z Solid Solution. Energies, 16(13), 4958. https://doi.org/10.3390/en16134958