Abstract
CSZM compounds were synthesized by dry chemistry route with 5, 10, and 15% dopant of Mg dopants in the Ce 0.8−2x Sm 0.2 Zrx Mgx O2−d, {x = 0.05, 0.1 & 0.15}. The newly investigated materials were physically, chemically, and electrochemically studied and have shown promising results. The CSZM was crystalized in a fluorite structure with a pure cubic phase in a space group Fm3m and cell parameter a = 5.401742 and theoretical density from 7.6 to 8.9 after firing in the air with a final temperature of 1400 °C. Characterization of the structure and indexing of electrolyte materials were made after X-ray diffraction (XRD) testing. A Scanning electron microscope (SEM) morphological analysis was used to examine the microstructure details. Electrochemical impedance spectroscopy (EIS) measurements were performed from 400 °C to 700 °C which show the highest conductivity value of 1.0461 × 10+1 S/cm at 700 °C. In comparison, the minimum value was 2.7329 × 10⁻² S/cm at 400 °C, and the total activation energy (Ea) was found to be 0.6865 eV under 5% H2/Ar.
1. Introduction
The shift from dependence on fossil fuels to renewable energy resources is extremely important nowadays, especially with their zero-pollution impacts solar cells, fuel cells, and other types of renewables [1,2,3,4,5]. Solid oxide fuel cell (SOFC) devices recently proved their highly remarkable source of chemical clean energy conversions. The main structure of these devices is defined by two electrodes (Anode and Cathode) detached by highly dense electrolyte materials generating power through electrochemical reactions [1,2]. The used electrolyte can be a proton ion conductor, otherwise an oxygen ion conductor [2,3,4], and they should be relatively or closely compacted, durable, and chemically and thermally stable in a reducing and oxidizing environment [5,6,7].
The more important thing recently investigated is using an integrated system from biomass gasification and fuel cells together [8,9,10,11,12,13,14] to get higher performance and supply more power. After developing new materials to be applied in SOFCs, there is a higher potential to apply it in biomass-gasification fuel cell systems investigated in many research works [8]. Since H2 exists as a low-density gas, posing a significant storage challenge. Hydrogen storage in solid state and liquid methods relying on metal hydrides outperforms traditional bulky gaseous in terms of protection, production costs, and density [15,16,17]. MgH2 is one of the most effective types among light hydrides with reversible H2 storage due to its capacity for high hydrogen storage, its reversibility, and H2 storage abundance reserves on Earth [18,19,20].
In the last two decades, scientists and researchers have been seeking high-performance techniques to investigate material properties, focusing on Magnesium based hydrogen [15,21] with remarkable activities, especially with doping of Mg-oxides [22]. The addition of metal oxides (Fe2O3, Nb2O5, CeO2, etc.) [16,23,24] or (Ni, Co, Fe, etc.) transition metals [15,25,26] to magnesium were reported as an effective candidate due to their altered reaction pathway in optimized thermodynamics [27]. Hence, developing new electrolyte materials through rare earth elements in single or multi-dopants is essential when applied in SOFC devices. Thereby, Lanthanides doped cerium {Sm, Gd, Nd} based materials have shown closely or relatively compacted electrolytes applied in SOFCs at intermediate or low-temperature levels (IT/LT- SOFCs) [28,29,30,31,32,33,34]. These crystalline structures are dry and wet chemical synthesized and have introduced high oxygen ionic conductivities at temperature ranges from 500 to 800 °C [35,36]. The single or multi-dopant ceria-based Rare-earth and alkaline- elements have greatly enhanced the ionic conductivities at a reduced temperature range compared with common electrolyte ones YSZ [37,38,39]. But introducing Mg in these compounds will be expected to show remarkable results in obtained power and the whole performance of the designed system. Many trials were made to investigate the use of Mg in various applications through energy devices as introduced by V.A. Yartys et.al [40] and in recent work done through fuel cell devices. A trial was made by Jianjiang Hu et al. [41] where a high-temperature PEM fuel cell stack was used for a prototype auxiliary power unit, through the application of Li-Mg-N-H. They succeeded to get the Maximum working temperature being 200 °C with a designed output of 1 kW. While, Jingfeng Xue et al. [42] used pure perovskite Mg co-doped compounds at intermediate temperature SOFCs. They have got power of 0.5 Wcm−2 at 600 °C and maximum power of 0.8 Wcm−2 at 850 °C.
Recently Flores et al. [43] have made an investigation of a multi-dopant including Mg co-doped compound as double perovskites derived material Sr2MgMoO6-d as anode with potential application in SOFCs and succeeded to show acceptable electrical conductivity, power density, and thermal expansion coefficient, in redox environments synthesized through various techniques.
In the current study, Ce 0.8−2x Sm0.2 Zrx Mgx O2−d series of materials were synthesized {x = 0.05, 0.1 & 0.15} as novel electrolyte compounds working in both intermediate and high-temperature ranges applied in SOFC devices which can also be used in an integrated system of biomass gasification with SOFC. Mg doping has shown a significant and good impact on hydrogen storage capacity. As a result, we are trying to confirm this investigation by doping it in some materials that can be applied in fuel cell applications. The obtained results have shown the potential of applying Mg as electrolyte materials, and it can also be used in electrode materials as well in SOFCs devices. Physical and electrochemical characterization for the materials was made and the obtained results showed remarkable results in both physical characterizations and the output power.
2. Experimental
2.1. CSZM Materials Synthesis
Series of Mgx doped Ce 0.8−2x Sm0.2 Zrx O2−d, {x = 0.05, 0.1 & 0.15} were synthesized using solid-state reaction method in the air at 1400 °C for 12 h inside a muffle furnace. The used chemicals of CeO2, ZrO2, Sm2O3, and MgO in precise stoichiometric ratios were purchased from Sigma Aldrich (purity of more than 99.95%). Collected powders were preheated at 350 °C for 8 h in a muffle furnace for humidity and re-carbonation avoidance, followed by quick weight on an accurate digital microbalance. All compounds with a small amount of acetone CH3CoCH3 were hand mixed in an agate mortar pestle for almost 2 h. The ball milling technique was followed in the previous step to get a homogenous mixture of the compounds with an appropriate amount of ethanol C2H5OH for 48 h. Afterwards, a mixture of ball-milled compounds was collected and dried in a fume hood overnight. Finally, the collected powders were heated on a magnetic hotplate at 70 °C for 4 h of each composition. The calcination process at 800 °C for 12 h was achieved for the collected powders at a rate of 5 °C/min (heating and cooling). Again, samples were ground for 45 min with a small amount of binder of terpineol (90%, technical grade—Sigma-Aldrich) before being compressed to form pellets of 2 g 20 mm in diameter using the hydraulic press of 100 MPa. The formed pellets were fired at 1200 °C in the air for 12 h in a carbolite furnace. Following that, the X-Ray diffraction (XRD) for the compounds was checked to confirm the phase purity and reaction. Then again, after regrinding like the earlier stage, CSZM pellets again sintered at a final temperature of 1400 °C for 12 h to achieve a single phase and complete reaction of all synthesized series. Figure 1 summarizes the preparation process until getting the final pure phase.
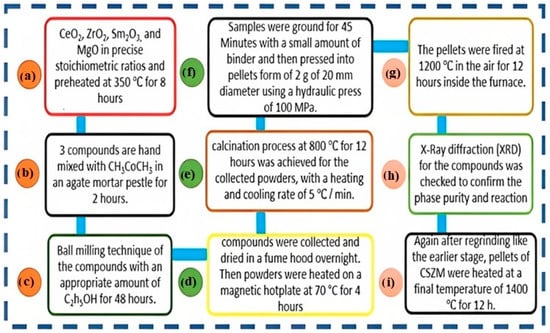
Figure 1.
Summary of the preparation process (a–i) using solid-state reaction method to get confirmed structure of CSZM in a single structure pure phase.
2.2. Characterizations of the Samples
The thermal response and behavior of the formed materials were investigated for the uncalcined powder through thermogravimetric analysis (TGA) PerkinElmer, STA 6000, USA in a range of 50 to 1000 °C with a heating and cooling rate of 5 °C/min with flowing nitrogen 50 mL/min where samples were kept isothermally for 30 min at the final temperature. After that, the XRD patterns of the synthesized samples for Mgx doped Ce 0.8−2x Sm0.2 Zrx O2−d, {x = 0.05, 0.1 & 0.15} where D8 Advanced Bruker XRD system with CuKα1 radiation of λ = 1.5406 Å and using 2θ = 10° to 90° angular range with 0.02° step size in RT. After XRD data were collected, WinXpow and TREOR90 [44] were used for indexing. Following the previous step, Rietveld refinements analysis of XRD data was done carefully using the FullProf software [45]. A scanning electron microscope (SEM) of JEOL 5600, Akishima, Japan) was used for studying the microstructure and crystal features for the 3 synthesized compounds of 5%, 10%, and 15%. In addition, the investigation of Energy-dispersive X-ray Spectroscopy (EDX) analysis of JEOL 5600, Akishima, Japan) for the tested samples was performed for element percentage in the final formed compound. A Solartron EIS spectrometer (SI-9300R-AMETEK Scientific Instruments, SR Technical Associates 801 S Illinois Ave, USA) with a frequency response analyzer was utilized for impedance measurements and analysis. A symmetrical cell was prepared to have a size of 13 mm Diameter (1.1 mm thickness), where on both sides of the tested pellet, platinum paste was printed with an effective area of 1 cm2. Afterward, the tested pellet was inserted in the furnace for drying at 700 °C for 1 h. In the impedance measurement, stage 50 mA current amplitude was applied in a range of temperature 300 to 800 °C with a stepped temperature of 50 °C and of 3 °C/min heating rate in a wet 5% H2/Ar with a range of frequency from 1 MHz to 10 MHz.
3. Results and Discussion
3.1. Structural and Phase Analysis of XRD Data
The collected data of XRD spectra for the 3 synthesized series of Mgx doped Ce 0.8−2x Sm0.2 Zrx O2−d, x = 0.05, 0.1 & 0.15} were analyzed by Rietveld analysis at RT after the final sintering temperature of 1400 °C appears in Figure 2 with peak indexing showing the single-phase purity. The Rietveld analyses of the XRD patterns of all materials confirm a stable single-phase cubic structure in the F m-3m space group, a fluorite type with JCPDS number 35-0816 with nearly similar cell parameter a = 5.4 for all compounds.
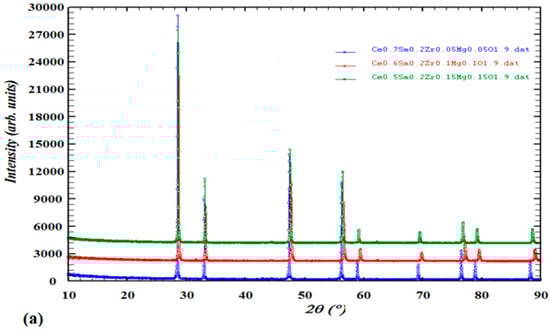
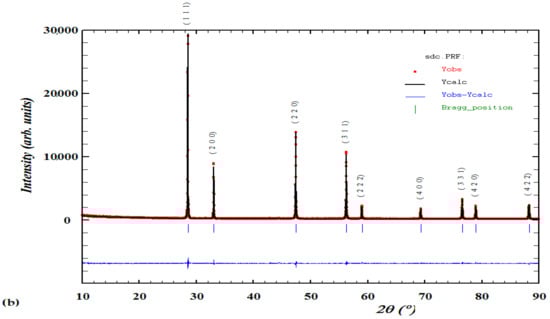
Figure 2.
(a) XRD patterns of Ce0.7Sm0.2ZrxMgxO1.9, Ce0.6Sm0.2ZrxMgxO1.9, Ce0.5Sm0.2ZrxMgxO1.9 x = {0.05, 0.1, 0.15} and (b) Rietveld refinement analysis of a single pure phase material with indexed peaks.
Indexing of the patterns was performed by using Winx POW and TREOR90 software, the existence of sharp peaks like in (111), (200), (220) and (311) is because of well crystalline after the calcination process. Considering the values of observed minus calculated (obs-calc) represents indexed materials in a precise symmetry (cubic) and space group (F m-3m). The refinement parameters of all compounds were similar in their lattice, in addition to the calculated theoretical density is almost very close in values when calculated using the following equation [46]:
where MWCSZM is the molecular weight of CSZM electrolytes, and NA is Avogadro’s number, a representing lattice parameter as listed in Table 1. Rietveld refinement parameters of the CSZM materials showing similar values of lattice parameters as the samarium (Sm) amount is the same in the whole synthesized compounds and due to its ionic radius (0.958 Å, coordination number (CN) = 6 compared to cerium (Ce) (0.87 Å with the same CN). However density increased with increasing Mg doped amount from 5% to 15% due to the lattice parameter increase which directly affects the volume of the synthesized sample. After getting XRD patterns, the confirmed structure of the synthesized material obyes Vegard’s law. It is also clear that the change that happened in the peak shift as shown in Figure 1a was due to the small change of lattice parameters, and due to the increase of Mg% dopant results in an increase of tensile strength that makes this small shift of the plane towards the lower angle. This also can be observed from the lattice parameters and volume of the indexed XRD patterns from the given data in Table 1 and confirms with previous work in the literature [47].

Table 1.
Synthesized series of CSZM in 5%, 10%, and 15% showing cell, refinement parameters theoretical densities value and atomic positions.
However, the atomic position of the multi-dopant is almost the same in the 3 compounds, and that was due to the stability of the structure with higher densification of Mg doping and when the percentage increased from 5% to 15% porosity increased with grain growth increase at higher sintering temperature of 1400 °C.
3.2. Surface Morphology of Synthesized Samples Using SEM & EDX
Surface morphology and microstructure of the 3 synthesized compounds of electrolyte materials were carefully checked through SEM to show the level of densification at the 5%, 10%, and 15% levels. Figure 3 shows a clear view of the microstructures of CSZM compounds. Images show that higher doping of Mg resulted in higher porosity; however, the final sintering temperature was 1400 °C. Thereby, the Mg doping has shown abnormal grain growth due to the thermomechanical treatments that have a direct effect and significant role in the investigation of the synthesized samples owing to the close dependence of properties upon grain size [48].
Figure 3.
SEM images of (a,b) surface, and (c) Cross section for CSZM compounds in 5%,doping in Ce0.7Sm0.2Zr0.05Mg0.05O1.
But the grain growth occurred on 5% doping of Mg during the densification [49] compared to other percentages. It was observed that 1 μm average grain size for the pellet sintered at 1200 °C, whereas for 1300 1.6 to 2.3 μm and at the final temperature of 1400 °C, the grain size ranged from 2.5 to 3.7 μm; from Figure 3, Figure 4 and Figure 5 of the compound Ce0.7Sm0.2Zr0.05Mg0.05O1.9. Showing some inhomogeneity in grain sizes due to higher sintering temperatures, but the most interesting is getting well compact and dense electrolyte materials compared to the other 2 compounds. Some pores started to occur, with higher Mg doping, abnormal grain growth resulted in some pores being trapped inside the microstructure even with higher sintering temperatures it is difficult to erase [50,51,52]. The EDX elemental analysis of CSZM was investigated, as shown in Figure 6 and Table 2 showing CSZM with the selected spectrum with the existence of all chemicals Ce, Sm, Zr, and Mg with a total percentage of 100% without any other impurities and proof of a full and complete solid-state reaction occurred for all compounds showing a pure fluorite type phase. What was interesting was the homogeneity of the surface. There is no existence of any impurities or agglomerations [52] and it is clearly observed in the selected spectrum, considering this case for all synthesized compounds with the different doping percentages of Mg i.e., 5%, 10%, and 15%.
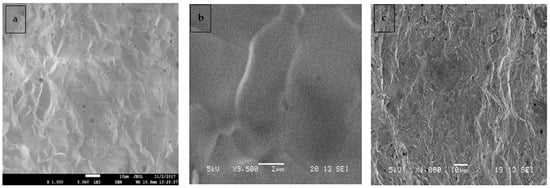
Figure 4.
SEM images of (a,b) surface, and (c) Cross section for CSZM compounds in 10% doping Ce0.6Sm0.2Zr0.1Mg0.1O1.9.
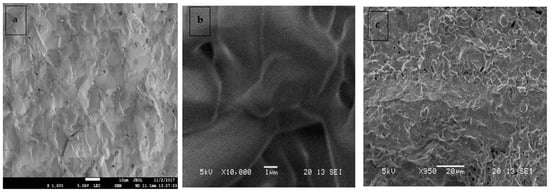
Figure 5.
SEM images of (a,b) surface, and (c) Cross section for CSZM compounds in 15% doping Ce0.5Sm0.2Zr0.15Mg0.15O1.9.
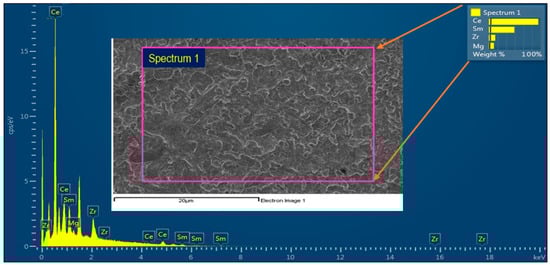
Figure 6.
EDX analysis of the synthesized components showing the existence of Ce, Sm, Zr, and Mg with a total percentage of 100%.
Table 2.
EDX measurements for CSZM, Processing option: All elements analyzed (Normalised), Number of iterations = 2, Spectrum processing: (O K-series peaks omitted).
3.3. Thermogravimetric (TGA) of the Synthesized Series of Mgx/2 Doped Ce 0.8-x Sm 0.2 Zrx/2 O2−d
Thermogravimetric data was collected on uncalcined samples of Ce0.7Sm0.2Zr0.05Mg0.05O1.9 (5%Mg), Ce0.6Sm0.2Zr0.1Mg0.1O1.9 (10% Mg) and Ce0.5Sm0.2Zr0.15Mg0.15O1.9 (15% Mg) to know the sintering behavior of the samples. The weight loss started around 60 °C, and lost about 6% until 275 °C due to the evaporation of the absorbed water molecules. From 275 °C to 730 °C, another big loss (about 30%) was observed due to the decomposition of some oxides and organic fuel into different gases, such as nitrogen, carbon dioxide, and water vapors [53]. The final weight loss was observed until 900 °C, about 15%. Figure 7 illustrates the TGA profile of all 3 samples. There are small differences between the samples which can be neglected. The high-temperature loss is normally related to the chemical reaction [54,55], oxygen vacancy formation, and valence change of the constituting cations. This change confirms the full crystallization and phase formation above 900 °C. All gaseous products generated by volatilization and chemical reaction are transferred from the furnace chamber with the help of N2 gas, which guarantees no interference with the sample during thermal treatment. TGA data were taken on uncalcined samples, and the 50% weight loss is normal. The samples were heated under a nitrogen atmosphere to avoid the presence of H2 or O2. The high-temperature region of TGA in the nitrogen atmosphere indicates the oxygen loss from the crystalline. All XRD patterns were taken after TGA and the final sintering for CSZM was collected for the structure analysis as referred to that in Section 3.1 showing a pure structural cubic phase which was also confirmed using SEM and EDX analysis.
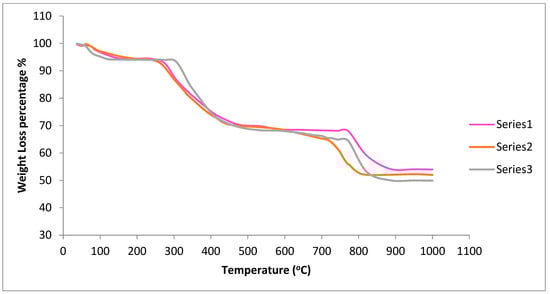
Figure 7.
The thermogravimetric plot of CSZM powders for 5% CSZM (Series 1) and 10% CSZM (Series 2) and 15% CSZM (Series 3).
3.4. Electrochemical Impedance spectroscopy (EIS) of the prepared samples under 5% H2/Ar
The solid electrolyte electrical properties were investigated and studied using (EIS) measurements and based on the given Nyquist plots in the three synthesized compounds total ionic conductivities were evaluated according to the given data in Table 3, where symmetrical cells testing of the pellets were prepared and EIS measurements were achieved in the wet condition of 5% H2/Ar.
Table 3.
Dimensions of tested pellets during EIS measurements.
The EIS measurements were used to find out the electrical properties of CSZM compounds. The related electrical properties of the synthesized electrolyte material in a symmetrical supported cell testing based on anode-supported materials as can be observed from Table 3, and the resultant ionic conductivity was calculated accordingly. Through Nyquist plots and with the relevant fitting results, it was easy to identify the needed information about the separate contribution of grain resistance, grain boundary resistance, and electrode process. The EIS measurements were achieved using a Solartron 1255 (Schlumberger) frequency response analyzer (0.01 Hz~1 MHz). Results from Nyquist patterns were analysed using Z-plot software followed the included circuit range of 400 °C to, 700 °C with a step of 50 °C in wet 5% H2/Ar. Figure 8a–c show the fitted impedance plots obtained for CSZM oxides within the range of 400 °C to 700 °C. Resulted plots were evaluated by comparing with equivalent circuits by the start of inductance L1 and followed by semicircles of two regions indicating the polarization resistance Rp from the electrode as grain boundaries [56] along the whole tested ranges.
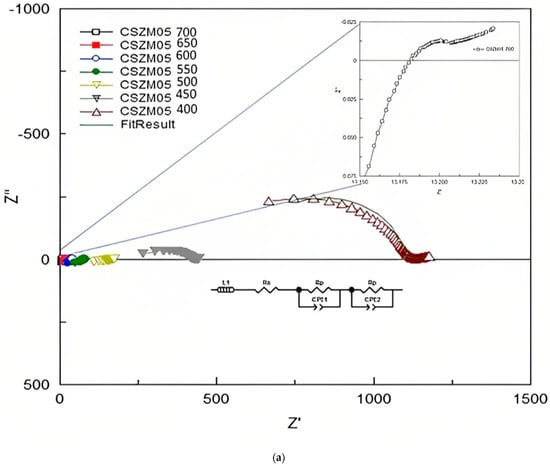
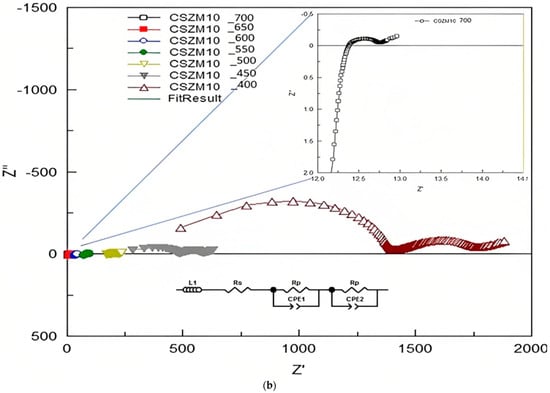
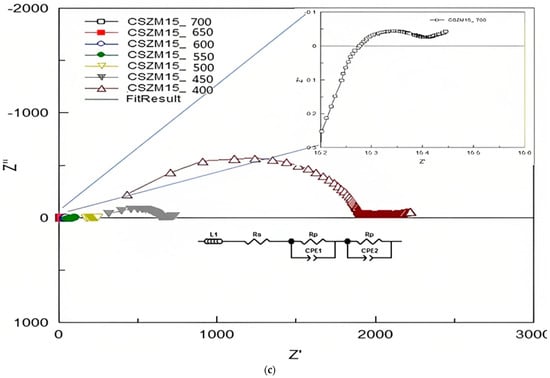
Figure 8.
(a) Fitted EIS plots with equivalent circuits obtained for 5% CSZM oxide within the range of 400 to 700 °C in a 5% H2 and wet argon atmosphere. (b) Fitted EIS plots with equivalent circuits obtained for 10% CSZM oxides within the range of 400 to 700 °C in a 5% H2 and wet argon atmosphere. (c) Fitted EIS plots with equivalent circuits obtained for 15% CSZM oxides within the range of 400 to 700 °C in a 5% H2 and wet argon atmosphere.
From the analysis and fitting of the EIS plots and collected data were listed in Table 4, Table 5 and Table 6, also the capacitance was calculated for CSZM compounds [56] in a range from 4.45 × 10⁻³ F to 1.16 × 10⁻¹⁰ F in a temperature from 400 to 700 °C for 5% doping with a narrow range of polarization resistance values from 3.35 × 10⁻³ Ω to 3.77 × 10+1Ω [49]. For 10% CSZM, the values of calculated capacitance were 8.54 × 10⁻³ F to 5.2 × 10⁻¹¹ F in the same temperature range with a range of polarization resistance from 1.55 × 10⁻³ Ω to 1.74 × 10+2 Ω. While in the last composition, 15% CSZM, the calculated values of capacitance are 8.54 × 10⁻³ F to 5.34 × 10⁻¹¹ F with a polarization resistance 1.55 × 10⁻² Ω to 1.34 × 10+2. The total conductivity of the symmetrical cell (σ), the total capacitance (C), and the area-specific resistance (ASR), in addition to the polarization resistance (Ω) values, are listed in the following Table 4, Table 5 and Table 6.
Table 4.
The electrical properties values of CSZM of 5% doping Mg.
Table 5.
The electrical properties values of CSZM of 10% doping Mg.
Table 6.
The electrical properties values of CSZM of 15% doping Mg.
It was clear from the given results that the compounds of CSZM electrolyte materials show exceptional values in the measured conductivities. However, there is a small gap in the total conductivities between the 5% CSZM and 15% CSZM which are still higher than some reported electrolyte materials [57]. The Arrhenius plots in Figure 9 demonstrated that Ce0.7Sm0.2Zr0.05 Mg0.05O1.9 showed a higher value of 1.0461 × 10+1 S/cm at 700 °C while the minimum value was 2.7329 × 10⁻² S/cm at 400 °C and the total activation energy was found to be 0.6865 eV. The CSZM 5% was the highest in conductivity values compared to others 10% and 15% CSZM, which is directly related to the density of the materials. This was noticed from the SEM images. Meanwhile, the occurrence of this porosity still gives higher values of conductivities compared to the previously investigated electrolyte materials [58], which can be observed from plotted Arrhenius plots in Figure 9 under 5% H2/Argon wet atmosphere.
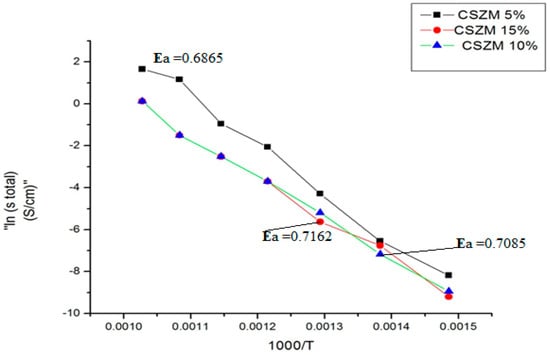
Figure 9.
Arrhenius plots of CSZM conductivity 5%, 10%, and 15% under 5%H2/Argon.
The CSZM electrolyte conductivity at 700 °C with 5% dopant has shown a higher value. It was higher than the reported ones in multi-dopant ceria electrolytes [59,60,61,62]. This is because of the ordering of oxygen vacancies with small ionic radii and mobility makes these materials very conductive. However, the other 10% and 15% showed lower values due to the occurrence of voids and pores, which can be overcome with doping of some materials in B site like lithium oxide, [63] or Zin oxides [64]. It can be achieved at lower range of temperature less than 1400 °C. The essential finding of Mg doping materials for giving the higher conductivity values other than porosity and density in all synthesized series. It is due to the Mg doping altered the electronic structure [65] of the host compound by altering the ion bond and crystal layer gap, and the chemical bond length between the doped and O atoms is proportional to the atomic radius of the doped cations.
4. Conclusions and Recommendations
Three different materials were investigated with different percentage dopants of Mg and Zr with 5, 10, and 15% in the CSZM electrolyte compounds. The results showed remarkable findings when the compounds were characterized physically and electrochemically with higher stability and conductivity in symmetrical cell testing. Structural analyses of the synthesized compounds were achieved accurately after careful analysis and refinement of X-ray diffraction data, showing the materials crystallized in a pure fluorite cubic structure with the goodness of the fitting in the Fm3mspace group with a cell parameter value of about 5.401742 after the final sintering temperature of 1400 °C. SEM images show that the highly dense compound of the synthesized series is the 5% dopant Ce0.7Sm0.2Zr0.05 Mg0.05O1.9. while the other two compounds 10% and 15% show some pores. However, these pores existed but the conductivity testing showed higher values compared to the similar materials reported before in the literature. Moreover, EIS analysis indicates that the 5% CSZM under investigation of 5% H2/Ar atmosphere showed the highest value of conductivity 2.347 S/cm at 700 °C higher than the similar reported electrolyte materials when comparing the CSZM with the microstructure features in terms of densification and porosity. Also, it is clear from SEM images that among the 3 synthesized compounds, 5% doping showed higher densification and conductivity compared to both 10 and 15%. The densification of the samples can be increased by adding zinc oxide or lanthanum oxides with an expectation of higher performance and less sintering temperature.
Author Contributions
Conceptualization, A.M.A.; formal analysis, A.M.A. and M.M.K.D.; writing—original draft and final paper preparation A.M.A.; writing—review and editing, M.M.K.D., J.T. and A.K.A.; supervision J.T. and A.K.A.; project administration, J.T. and A.K.A.; funding acquisition, J.T. All authors have read and agreed to the published version of the manuscript.
Funding
It is financially supported by Prince of Songkla University, (Grant Number REV65012).
Institutional Review Board Statement
Not applicable.
Informed Consent Statement
Not applicable.
Data Availability Statement
Not applicable.
Acknowledgments
This research was financially supported by Prince of Songkla University and the Ministry of Higher Education, Science, Research and Innovation under the Reinventing University Project (Grant Number REV65012).
Conflicts of Interest
There is no conflict of interest.
References
- Wolfram, T.; Ellialtioglu, S. Electronic and Optical Properties of d-Band Perovs; Cambridge University Press: Cambridge, UK, 2006. [Google Scholar]
- Tejuca, L.G.; Fierro, J.L.G.; Tascón, J.M.D. Structure and Reactivity of Perovskite-Type Oxides. Adv. Catal. 1989, 36, 237–328. [Google Scholar]
- Hossain, S.; Abdalla, A.M.; Jamain, S.N.B.; Zaini, J.H.; Azad, A.K. A review on proton conducting electrolytes for clean energy and intermediate temperature-solid oxide fuel cells. Renew. Sustain. Energy Rev. 2017, 79, 750–764. [Google Scholar] [CrossRef]
- Levy, M.R. Chapter 3: Perovskite Perfect Lattice. Cryst. Struct. Defect Prop. Predict. Ceram. Mater. 2005, 79–114. [Google Scholar]
- Johnsson, M.; Lemmens, P. Crystallography and Chemistry of Perovskites. Handbook. Magn. Adv. Magn. Mater. 2007. [Google Scholar]
- Raza, T.; Yang, J.; Wang, R.; Xia, C.; Raza, R.; Zhu, B.; Yun, S. Recent advance in physical description and material development for single component SOFC: A mini-review. Chem. Eng. J. 2022, 444, 136533. [Google Scholar] [CrossRef]
- Irshad, M.; Hanif, M.B.; Tabish, A.N.; Ghaffar, A.; Rafique, M.; Siraj, K.; Aslam, Z.; Assiri, M.A.; Imran, M.; Mosiałek, M.; et al. Investigating the microstructural and electrochemical performance of novel La0.3Ba0.7Zr0.5X0.3Y0.2 (X = Gd, Mn, Ce) electrolytes at intermediate temperature SOFCs. Sustain. Energy Fuels 2022, 6, 5384–5391. [Google Scholar] [CrossRef]
- UdDin, Z.; Zainal, Z.A. Biomass integrated gasification–SOFC systems: Technology overview. Renew. Sustain. Energy Rev. 2016, 53, 1356–1376. [Google Scholar] [CrossRef]
- Radenahmad, N.; Azad, A.T.; Saghir, M.; Taweekun, J.; Bakar, M.S.A.; Reza, M.S.; Azad, A.K. A review on biomass derived syngas for SOFC based combined heat and power application. Renew. Sustain. Energy Rev. 2020, 119, 109560. [Google Scholar] [CrossRef]
- Capurso, G.; Agresti, F.; Crociani, L.; Rossetto, G.; Schiavo, B.; Maddalena, A.; Russo, S.L.; Principi, G. Nanoconfined mixed Li and Mg borohydrides as materials for solid state hydrogen storage. Int. J. Hydrog. Energy 2012, 37, 10768–10773. [Google Scholar] [CrossRef]
- Radenahmad, N.; Taweekun, J.; Afif, A.; Lee, J.I.; Park, J.-Y.; Zaini, J.; Azad, A.K. Syngas Fuelled High Performance Solid Oxide Fuel Cell. ECS Trans. 2019, 91, 1621–1629. [Google Scholar] [CrossRef]
- Aravind, P.V.; Woudstra, T.; Woudstra, N.; Spliethoff, H. Thermodynamic evaluation of small-scale systems with biomass gasifiers, solid oxide fuel cells with Ni/GDC anodes and gas turbines. J. Power Sources 2009, 190, 461–475. [Google Scholar] [CrossRef]
- Pukazhselvan, D.; Sandhya, K.; Nasani, N.; Paul, D. Chemical transformation of additive phase in MgH2/CeO2 hydrogen storage system and its effect on catalytic performance. Appl. Surf. Sci. 2021, 561, 150062. [Google Scholar] [CrossRef]
- Zhang, Q.; Liu, W.J.; Wang, J.; Liu, D.; Sun, Z.H.C. Processing of perovskite La0.9Sr0.1Ga0.8Mg0.2O3-δ electrolyte by glycine-nitrate combustion method. Int. J. Hydrog. Energy 2021, 46, 31362–31369. [Google Scholar] [CrossRef]
- Nagar, R.; Vinayan, B.; Samantaray, P.; Ramaprabhu, S. Recent advances in hydrogen storage using catalytically and chemically modified graphene nanocomposites. J. Mater. Chem. A 2017, 5, 22897–22912. [Google Scholar] [CrossRef]
- Peng, D.; Ding, Z.; Fu, Y.; Wang, Y.; Bi, J.; Li, Y.; Han, S. Enhanced H2 sorption performance of magnesium hydride with hard-carbon-sphere-wrapped nickel. RSC Adv. 2018, 8, 28787–28796. [Google Scholar] [CrossRef] [PubMed]
- Zhang, X.; Liu, Y.; Zhang, X.; Hu, J.; Gao, M.; Pan, H. Empowering hydrogen storage performance of MgH2 by nanoengineering and nanocatalysis. Mater. Today Nano 2020, 9, 100064. [Google Scholar] [CrossRef]
- Ma, Z.; Zhang, Q.; Zhu, W.; Khan, D.; Hu, C.; Huang, T.; Ding, W.; Zou, J. Nano Fe and Mg2Ni derived from TMA-TM (TM=Fe, Ni) MOFs as synergetic catalysts for hydrogen storage in MgH2. Sustain. Energ. Fuels 2020, 4, 2192–2200. [Google Scholar] [CrossRef]
- Abdalla, A.; Hossain, S.; Nisfindy, O.; Azad, A.; Dawood, M.; Azad, A. Hydrogen production, storage, transportation and key challenges with applications: A review. Energ. Convers. Manag. 2018, 165, 602–627. [Google Scholar] [CrossRef]
- Mohtadi, R.; Orimo, S. The renaissance of hydrides as energy materials. Nat. Rev. Mater. 2016, 2, 16091. [Google Scholar] [CrossRef]
- Nyamsi, S.N.; Lototskyy, M.V.; Yartys, V.A.; Capurso, G.C.; Davids, M.W.; Pasupathi, S. 200 NL H2 hydrogen storage tank using MgH2eTiH2eC nanocomposite as H2 storage Material. Int. J. Hydrog. Energy 2021, 46, 19046–19059. [Google Scholar] [CrossRef]
- Ouyang, L.; Chen, K.; Jiang, J.; Yang, X.; Zhu, M. Hydrogen storage in light-metal based systems: A review. J. Alloys Compd. 2020, 829, 154597. [Google Scholar] [CrossRef]
- Huang, Z.; Guo, Z.; Calka, A.; Wexler, D.; Lukey, C.; Liu, H. Effects of iron oxide (Fe2O3, Fe3O4) on hydrogen storage properties of Mg-based composites. J. Alloys Compd. 2006, 422, 299–304. [Google Scholar] [CrossRef]
- Zhang, X.; Wang, K.; Zhang, X.; Hu, J.; Gao, M.; Pan, H.; Liu, Y. Synthesis process and catalytic activity of Nb2O5 hollow spheres for reversible hydrogen storage of MgH2. Int. J. Energ. Res. 2020, 45, 3129–3141. [Google Scholar] [CrossRef]
- Shahi, R.; Tiwari, A.; Shaz, M.; Srivastava, O. Studies on de/rehydrogenation characteristics of nanocrystalline MgH2 co-catalyzed with Ti, Fe and Ni. Int. J. Hydrog. Energy 2013, 38, 2778–2784. [Google Scholar] [CrossRef]
- Shevlin, S.; Guo, Z. MgH2 Dehydrogenation Thermodynamics: Nanostructuring and Transition Metal Doping. J. Phys. Chem. C. 2013, 117, 10883–10891. [Google Scholar] [CrossRef]
- Ponthieu, M.; Calizzi, M.; Pasquini, L.; Fernández, J.; Cuevas, F. Synthesis by reactive ball milling and cycling properties of MgH2-TiH2 nanocomposites: Kinetics and isotopic effects. Int. J. Hydrog. Energy 2014, 39, 9918–9923. [Google Scholar] [CrossRef]
- De Souza, E.C.C.; Muccillo, R. Properties and applications of perovskite proton conductors. Mater. Res. 2010, 13, 385–394. [Google Scholar] [CrossRef]
- Haugsrud, R.; Norby, T. Proton conduction in rare-earth ortho-niobates and ortho-tantalates. Nat. Mater. 2006, 5, 193–196. [Google Scholar] [CrossRef]
- Fabbri, E.; Pergolesi, D.; Traversa, E. Materials challenges toward proton conducting oxide fuel cells: A critical review. Chem. Soc. Rev. 2010, 39, 4355–4369. [Google Scholar] [CrossRef]
- Duan, C.; Tong, J.; Shang, M.; Nikodemski, S.; Sanders, M.; Ricote, S.; Almansoori, A.; O’Hayre, R. Readily processed protonic ceramic fuel cells with high performance at low temperatures. Sci. Rep. 2015, 349, 1321–1326. [Google Scholar] [CrossRef]
- Kreuer, K.D. Proton-Conducting Oxides. Annu. Rev. Mater. Res. 2003, 33, 333–359. [Google Scholar] [CrossRef]
- Irshad, M.; Khalid, M.; Rafique, M.; Ahmad, N.; Siraj, K.; Raza, R.; Sadiq, M.; Ahsan, M.; Ghaffarg, A.; Ashfaq, A. Evaluation of BaCo0.4Fe0.4Zr0.2−xNixO3−δ perovskite cathode using nickel as a sintering aid for IT-SOFC. RSC Adv. 2021, 11, 14475–14483. [Google Scholar] [CrossRef]
- Zhang, W.; Hu, Y.H. Recent progress in design and fabrication of SOFC cathodes for efficient catalytic oxygen reduction Author links open overlay panel. Catal. Today 2023, 409, 71–86. [Google Scholar] [CrossRef]
- Fabbri, E.; Pergolesi, D.; Traversa, E. Electrode materials: A challenge for the exploitation of protonic solid oxide fuel cells. Sci Technol. Adv. Mater. 2010, 11, 044301. [Google Scholar] [CrossRef] [PubMed]
- Bonano, N.; Ellis, B.; Mahmood, M.N. Construction and operation of fuel cells based on the solid electrolyte BaCeO3,Gd. Solid. State Ion. 1991, 44, 305–311. [Google Scholar] [CrossRef]
- Ma, G.L.; Shimura, T.; Iwahara, H. Ionic conduction and nonstoichiometry in BaxCe0.90Y0.10O3-δ. Solid. State Ion. 1998, 110, 103–110. [Google Scholar] [CrossRef]
- Schober, T.; Bohn, H.G. Water vapor solubility and electrochemical characterization of the high temperature proton conductor BaZr0.9Y0.1O2.95. Solid. State Ion. 2000, 127, 351–360. [Google Scholar] [CrossRef]
- Kreuer, K.D.; Adams, S.; Münch, W.; Fuchs, A.; Klock, U.; Maier, J. Proton conducting alkaline earth zirconates and titanates for high drain electrochemical applications. Solid. State Ion. 2001, 145, 295–306. [Google Scholar] [CrossRef]
- Yartys, V.; Lototskyy, M.; Akiba, E.; Albert, R.; Antonov, V.; Ares, J.; Baricco, M.; Bourgeois, N.; Buckley, C.; von Colbe, J.B.; et al. Magnesium based materials for hydrogen based energy storage: Past, present and future. Int. J. Hydrog. Energy 2019, 44, 7809–7859. [Google Scholar] [CrossRef]
- Hu, J.; Fichtner, M. Marcello Baricco Preparation of Li-Mg-N-H hydrogen storage materials for an auxiliary power unit. Int. J. Hydrog. Energy 2017, 42, 17144–17148. [Google Scholar] [CrossRef]
- Xue, J.; Shen, Y.; Zhou, Q.; He, T.; Han, Y. Combustion synthesis and properties of highly phase-pure perovskite electrolyte Co-doped La0.9Sr0.1Ga0.8Mg0.2O2.85 for IT-SOFCs. Int. J. Hydrog. Energy 2010, 35, 294–300. [Google Scholar] [CrossRef]
- Flores, J.J.A.; Rodríguez, M.L.Á.; Vera, J.V.A.; Quiñones, J.G.R.; Martínez, S.J.G.; Zarraga, R.A. Advances in the knowledge of the double perovskites derived from the conformation and substitution of the material Sr2MgMoO6−d as anode with potential application in SOFC cell. Int. J. Hydrog. Energy 2021, 46, 26152–26162. [Google Scholar] [CrossRef]
- Friedrich, D.; Schlosser, M.; Pfitzner, A. Synthesis, Crystal Structure, and Physical Properties of Two Polymorphs of CsGaSe2, and High-Temperature X-ray Diffraction Study of the Phase Transition Kinetics. J. Cryst. Growth Des. 2016, 16, 3983–3992. [Google Scholar] [CrossRef]
- Lufaso, M.W.; Woodward, P.M. Research papers Prediction of the crystal structures of perovskites using the software program. J. Acta Crystallogr. B 2001, 57, 725–738. [Google Scholar] [CrossRef]
- Anwar, M.; Ali, S.M.; Abdalla, A.M.; Somalu, M.R.; Muchtar, A. Effect of sintering temperature on the microstructure and ionic conductivity of Ce0.8Sm0.1Ba0.1O2−d electrolyte. Process. Appl. Ceram. 2017, 11, 67–74. [Google Scholar] [CrossRef]
- Irshad, M.; Idrees, R.; Siraj, K.; Shakir, I.; Rafique, M.; Ain, Q.U.; Raza, R. Electrochemical evaluation of mixed ionic electronic perovskite cathode LaNi1−xCoxO3-δ for IT-SOFC synthesized by high temperature decomposition Author links open overlay panel. Int. J. Hydrog. Energy 2021, 16, 10448–10456. [Google Scholar] [CrossRef]
- Pei, R.; Korte-Kerzel, S.; Al-Samman, T. Normal and abnormal grain growth in magnesium: Experimental observations and simulations. J. Mater. Sci. Technol. 2020, 50, 257–270. [Google Scholar] [CrossRef]
- Kingery, W.D.; Bowen, H.K.; Uhlmann, D.R. Introduction to Ceramics; John Wiley & Sons: New York, NY, USA, 1976. [Google Scholar]
- Rahaman, M.N. Ceramic Processing and Sintering; Marcel Dekker Inc.: New York, NY, USA, 1995. [Google Scholar]
- Chen, L.; Zhou, D.F.; Wang, Y.; Zhu, X.F.; Meng, J. Enhanced sintering of Ce0.8Nd0.2O2, La0.8Sr0.2Ga0.8Mg0.2O3, using CoO as a sintering aid. Ceram. Int. 2017, 43, 3583–3589. [Google Scholar] [CrossRef]
- Xiong, J.; Jiao, C.; Han, M.; Yi, W.; Ma, J.; Yan, C.; Cai, W.; Cheng, H. Effect of Li2O additions upon the crystal structure, sinterability and electrical properties of yttria stabilized zirconia electrolyte. RSC Adv. 2016, 6, 106555–106562. [Google Scholar] [CrossRef]
- Guo, C.X.; Wang, J.X.; He, C.R.; Wang, W.G. Effect of alumina on the properties of ceria and scandia co-doped zirconia for electrolyte-supported SOFC. Ceram. Int. 2013, 39, 9575–9582. [Google Scholar] [CrossRef]
- Gill, S.; Kannan, R.; Maffei, N.; Thangadurai, V. Effect of Zr substitution for Ce in BaCe0.8Gd0.15Pr0.05O3−δ on the chemical stability in CO2 and water, and electrical conductivity. RSC Adv. 2013, 3, 3599–3605. [Google Scholar] [CrossRef]
- Kannan, R.; Singh, K.; Gill, S.; Fürstenhaupt, T.; Thangadurai, V. Chemically Stable Proton Conducting Doped BaCeO3 -No More Fear to SOFC Wastes. Sci. Rep. 2013, 3, 2138. [Google Scholar] [CrossRef] [PubMed]
- Barsoukov, E.; Macdonald, J.R. Impedance Spectroscopy: Theory, Experiment, and Applications; John Wiley & Sons, Inc.: Hoboken, NJ, USA, 2005. [Google Scholar]
- Chen, D.; Ran, R.; Zhang, K.; Wang, J.; Shao, Z. Intermediate-temperature electrochemical performance of a polycrystalline PrBaCo2O5+δ cathode on samarium-doped ceria electrolyte. J. Power Sources 2009, 188, 96–105. [Google Scholar] [CrossRef]
- Lin, B.; Wang, S.; Liu, X.; Meng, G. Simple solid oxide fuel cells. J. Alloys Compd. 2010, 490, 214–222. [Google Scholar] [CrossRef]
- Polini, R.; Pamio, A.; Traversa, E. Effect of synthetic route on sintering behaviour, phase purity and conductivity of Sr- and Mg-doped LaGaO3 perovskites. J. Eur. Ceram. Soc. 2004, 24, 1365–1370. [Google Scholar] [CrossRef]
- Yang, J.; Ji, B.; Si, J.; Zhang, Q.; Yin, Q.; Xie, J.; Tian, C. Synthesis and properties of ceria based electrolyte for ITSOFCs. Int. J. Hydrog. Energy 2016, 41, 15979–15984. [Google Scholar] [CrossRef]
- Sha, X.; Lü, Z.; Huang, X.; Miao, J.; Liu, Z.; Xin, X.; Zhang, Y.; Su, W. Influence of the sintering temperature on electrical property of the Ce0.8Sm0.1Y0.1O1.9 electrolyte. J. Alloys Compd. 2007, 433, 274–278. [Google Scholar] [CrossRef]
- Hong, S.J.; Virkar, A.V. Lattice parameters and densities of rare-earth oxide doped ceria electrolytes. J. Am. Ceram. Soc. 1995, 78, 433–439. [Google Scholar] [CrossRef]
- Kahlaoui, M.; Chefi, S.; Inoubli, A.; Madani, A.; Chefi, C. Synthesis and electrical properties of co-doping with La3+, Nd3+, Y3+, and Eu3+ citric acid-nitrate prepared samarium-doped ceria ceramics. Ceram. Int. 2013, 39, 3873–3879. [Google Scholar] [CrossRef]
- Peng, J.; Zhao, S.; Raza, A.H.; Wu, Y. Energy band modulation of Mg-doped ZnO electrolyte for low-temperature advanced fuel cells. Int. J. Hydrog. Energy 2023, 48, 6088–6098. [Google Scholar] [CrossRef]
- Majeed, M.H.; Aycibin, M.; Imer, A.G. Study of the electronic, structure and electrical properties of Mg and Y single doped and Mg/Y co-doped ZnO: Experimental and theoretical studies. Optik 2022, 258, 168949. [Google Scholar] [CrossRef]
Disclaimer/Publisher’s Note: The statements, opinions and data contained in all publications are solely those of the individual author(s) and contributor(s) and not of MDPI and/or the editor(s). MDPI and/or the editor(s) disclaim responsibility for any injury to people or property resulting from any ideas, methods, instructions or products referred to in the content. |
© 2023 by the authors. Licensee MDPI, Basel, Switzerland. This article is an open access article distributed under the terms and conditions of the Creative Commons Attribution (CC BY) license (https://creativecommons.org/licenses/by/4.0/).