Article

Data-Driven Minute-Ahead Forecast of PV Generation with Adjacent PV Sector Information

Korea Electrotechnology Research Institute, Changwon 51543, Republic of Korea
*
Author to whom correspondence should be addressed.
Energies 2023, 16(13), 4905; https://doi.org/10.3390/en16134905
Submission received: 12 May 2023 / Revised: 13 June 2023 / Accepted: 21 June 2023 / Published: 23 June 2023
(This article belongs to the Topic Solar and Wind Power and Energy Forecasting)

Abstract

:
This paper proposes and validates a data-driven minute-ahead forecast model for photovoltaic (PV) generation, which is essential for real-time micro-grid scheduling. Unlike day-ahead PV forecasts that heavily rely on weather forecast information, our proposed model does not require such data as it operates in an ultra-short-term time domain. Instead, the model leverages the generation data of the target PV sector and its adjacent sectors to capture short-term factors that affect electricity generation, such as the movement of clouds. The proposed model employs a long short-term memory (LSTM) network to process the data. By conducting experiments with real PV site data, we demonstrate that the information from adjacent PV sectors improves the accuracy of minute-ahead PV generation forecasts by 3.66% in the mean squared error index and 1.19% in the mean absolute error index compared to the model without adjacent sector information.

1. Introduction

Photovoltaic (PV) electricity generation is widely recognized as one of the most promising distributed energy resources (DERs). It is being adopted worldwide, especially by countries committed to pursuing renewable energy goals after the Paris Agreement [1]. However, PV generation is notorious for its instability, with power output fluctuating significantly due to various environmental factors unlike other traditional power sources [2]. Traditional energy sources, such as thermal power plants, provide stable and reliable output according to the dispatched schedule from the energy management system (EMS). Ordinary EMS only needed to watch the load status to stabilize the system. Recent massive installations of PV panels, however, triggered serious issues such as over-voltage problems around the world [3]. For example, EMS in Korea forced some local PV sites to be disconnected from the grid more than 10 times only in April 2023 because PV sites provided too much instantaneous power that was not expected [4]. Under these circumstances, it is clear that forecasting the PV output is crucial for effective and sophisticated energy control [5]. As a result, forecasting PV generation has become an essential part of the related research field. In this paper, we also propose a method that forecasts PV power output.
It is necessary to mention the forecasting horizon for PV generation in which we are interested. The interval from the current point to the future forecasting time can be a minute, an hour, a day, or even more than a year, and each forecasting horizon has its own applications. For example, prediction on a yearly scale is essential for the long-term planning of PV installations, and clear sky models [6] that calculate solar irradiance are very important in this time horizon. Hour-ahead or day-ahead predictions can be used in the scheduling of power generators, while minute-ahead predictions can be applied to the real-time control of microgrids [7]. Among these various forecasting horizons, we focus on the ultra-short-term forecast model that predicts outputs one minute ahead. Most forecasting models that are considered in the literature are day-ahead or hour-ahead models because the energy market currently requires this information to stabilize energy networks. Although these day-ahead or hour-ahead models are also valuable, we needed minute-ahead forecasting for the real-time control of our micro-grid, which is composed of various power sources such as PV, energy storage services (ESS), combined heat and power generators (CHP), fuel cells, and vehicle-to-grid (V2G) electric vehicles. By forecasting the minute-ahead PV output, ESS and CHP can be controlled every minute to balance the supply and demand of energy. Although we started our research for real-time micro-grid control, it is certain that minute-ahead PV prediction has other potential applications such as grid problem detection or real-time voltage control.
The scale of the target PV generator that we consider must also be clarified. If we consider the entire country’s PV output, it can be used for national-level EMS to control and stabilize the power system. If we consider a single PV site, the result can be used for micro-grid EMS to control its power sources and demand. As mentioned earlier, we started our research to control a micro-grid, and as a result, we focus on the scale of a single PV site, which can be a part of a micro-grid.
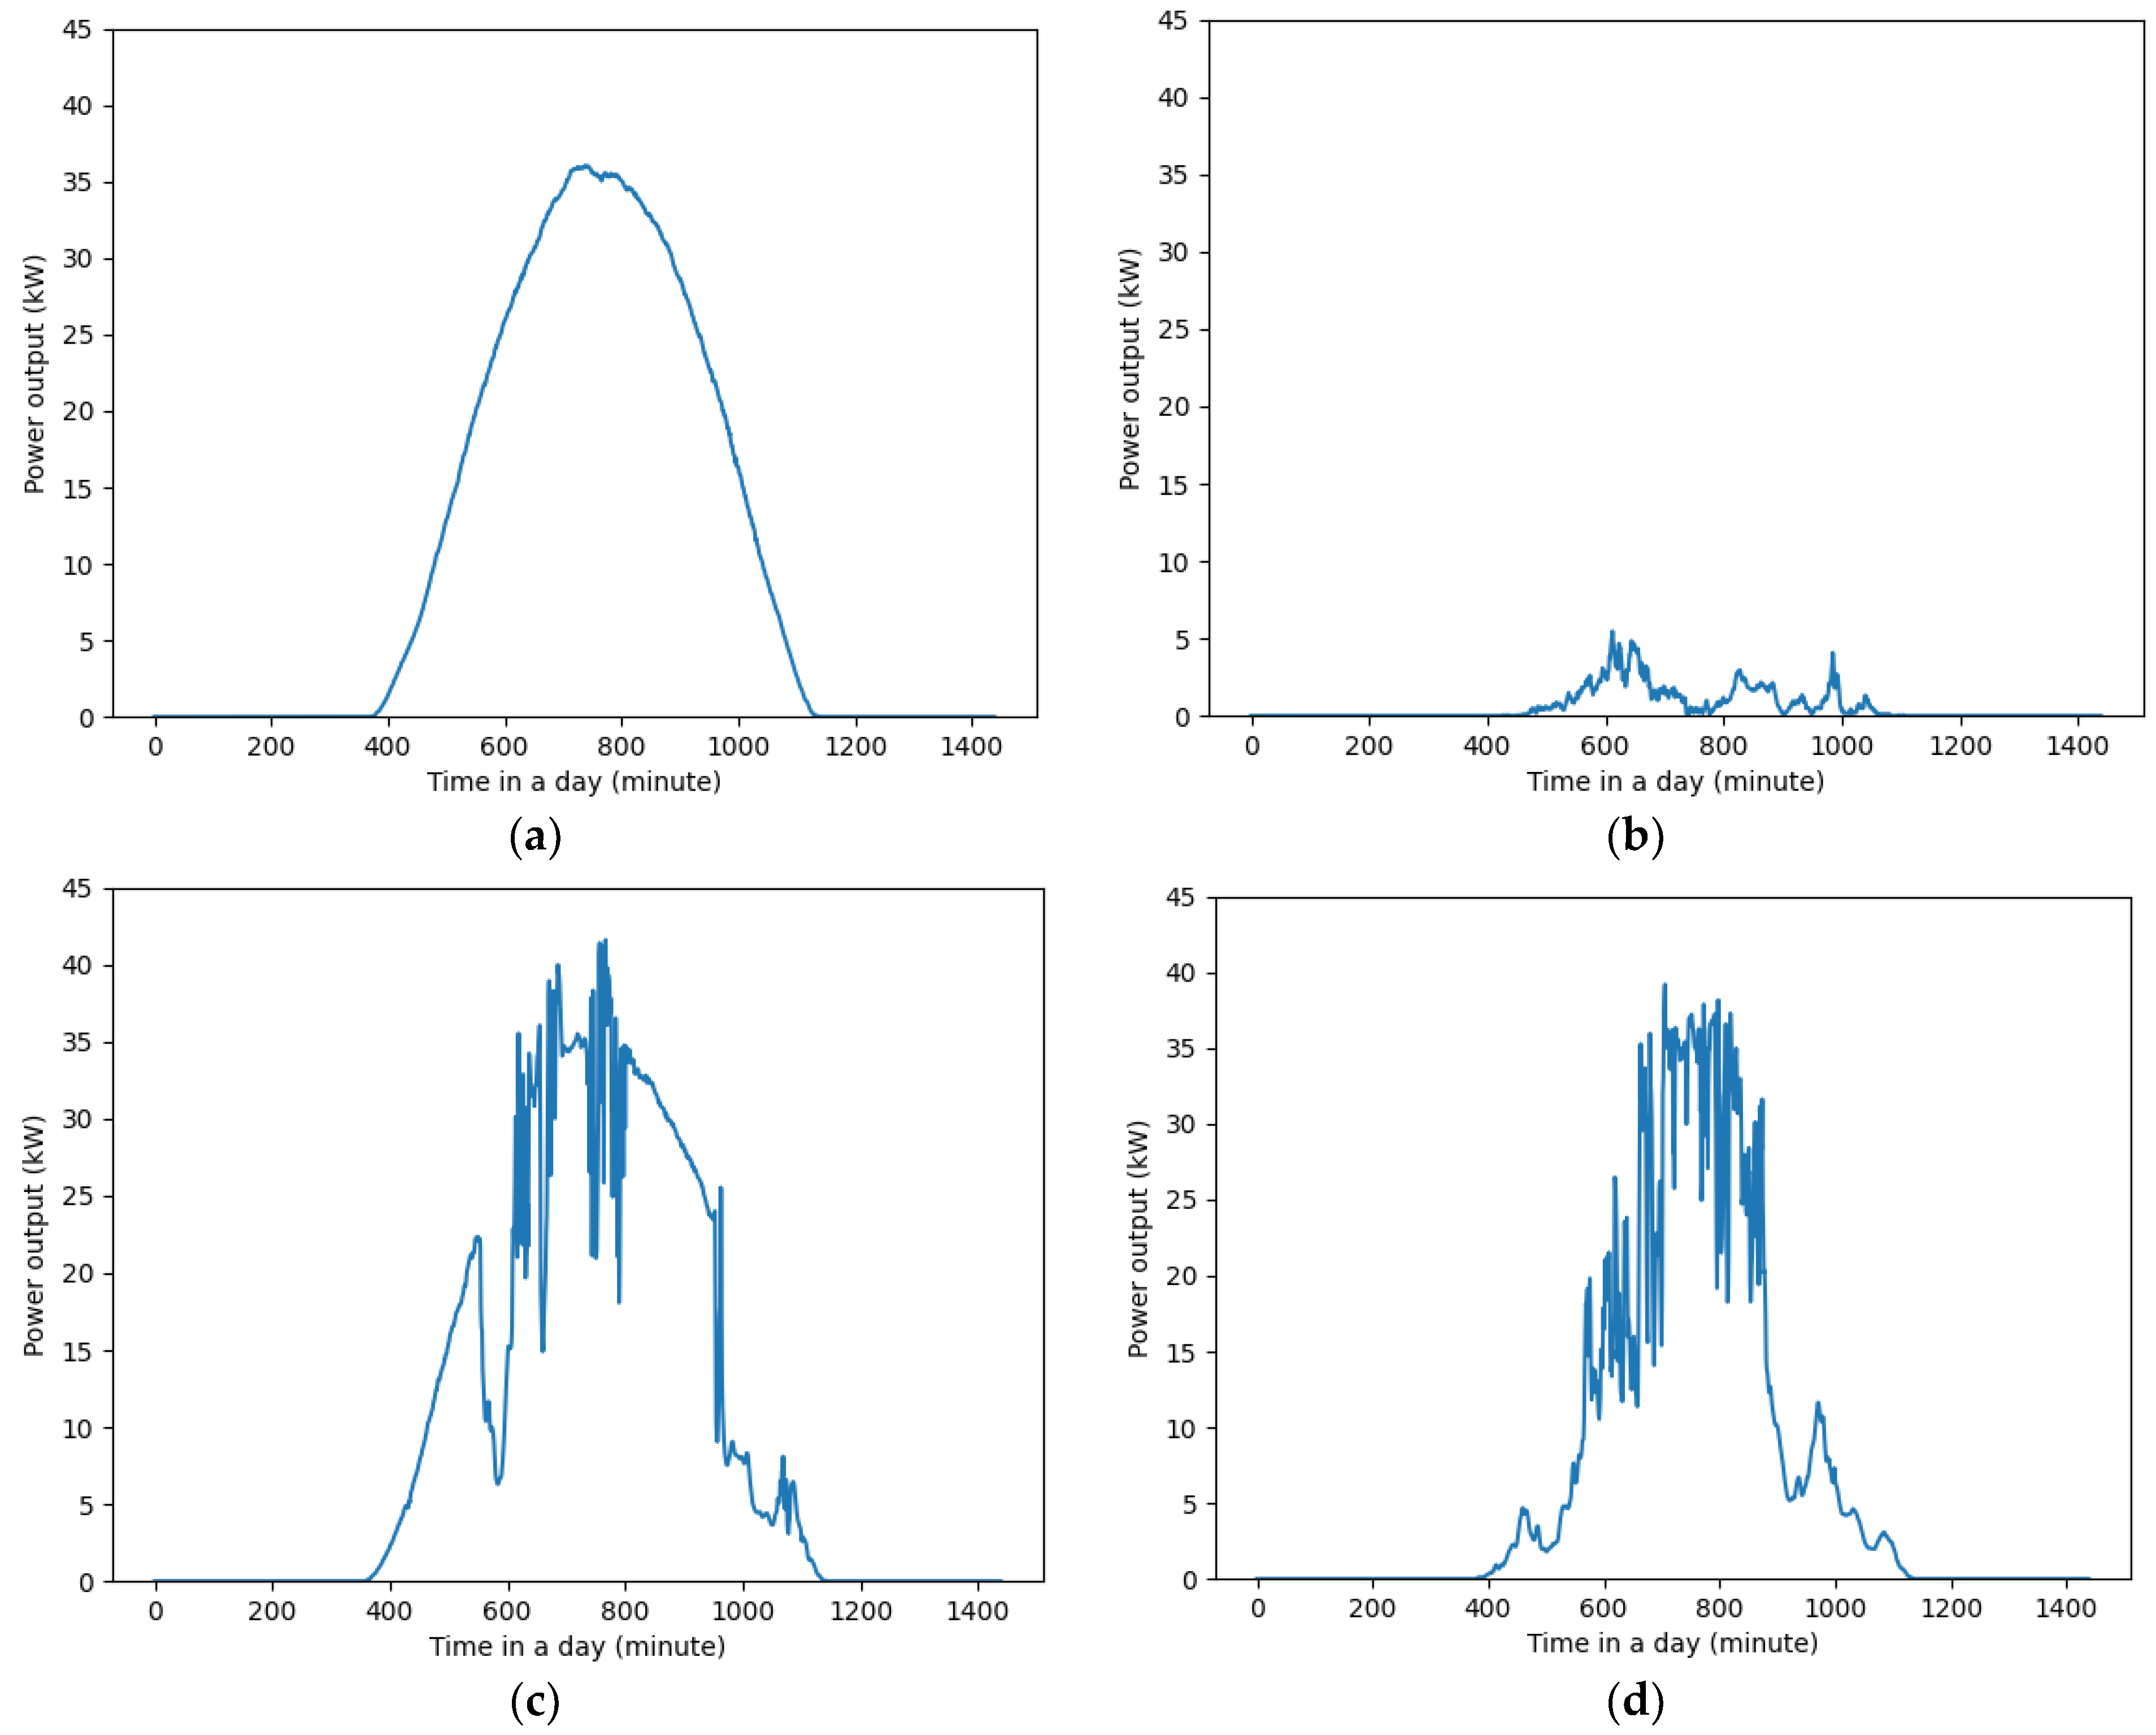
When it comes to minute-ahead forecasting, the difficulty lies in the significant power output fluctuations compared to hour-ahead forecasting. Figure 1 compares the hour-scale and minute-scale PV output of a real site, providing a visual representation for those who are not familiar with ultra-short-term forecasting. In the hourly generation, it shows a relatively stable and predictable graph, as shown in Figure 1a. On the contrary, the power output at the minute scale, which we are interested in, appears to experience heavy fluctuations. To investigate the reasons behind these fluctuations in Figure 1b, we compared the minute-scale power output on a sunny day, a rainy day, and cloudy days in Figure 2. In Figure 2a, the output of a sunny day with a cloud cover index of 0.0 shows smooth and predictable patterns, even at the minute-scale measurement. The cloud cover index, provided by the local meteorological office, indicates the amount of clouds in the sky with a number from a minimum of 0.0 to a maximum of 10.0. In Figure 2b, it is shown that the output on a rainy day decreased as we can easily expect. The output on a cloudy day with the amount of cloud 4.4 is, however, highly unstable, as shown in Figure 2c. Furthermore, the output in Figure 2d with a cloud index of 7.6 exhibits even greater fluctuations. Figure 2 clearly indicates that clouds are the main source of power output fluctuation in minute-scale PV generation. Based on this finding, we endeavor to incorporate cloud movement information into our minute-ahead forecasting model to increase the accuracy of forecasting.
In this paper, we propose a minute-ahead PV forecasting model, which utilizes the power generation data of small sectors that comprise a large PV site. Our proposed forecast model does not incorporate weather information at all, as weather forecasts are not conducted in minute-scale timeframes, and weather conditions do not change significantly every minute. Similarly, we do not consider on-site sensor information such as cloud conditions, wind speed, and temperature. Instead, our model utilizes two primary inputs: sequential electricity generation data from the target PV sector and electricity generation data from adjacent neighbor PV sectors. In ultra-short-term PV forecasts, the movement of clouds is the most significant factor, as shown in Figure 2. We believe that the generation history from adjacent neighbor PV sectors can provide the necessary information related to cloud movement. This is because if the power output of a neighbor sector is decreased by clouds, the next sector will be affected by the same clouds moving forward, within a minute. Direct information related to the movement of clouds, such as cloud cover, wind direction, and wind speed, would be helpful if they are obtainable. However, we do not consider them as input data because additional assets such as site-specific cloud sensors are necessary. On the contrary, we assume that the information related to clouds and winds is implicitly included in the adjacent power output history because the movement of the cloud eventually affects neighboring PV sectors, sequentially. The power output data from each PV sector can be easily acquired since an inverter reports its output to the server and a PV site consists of many inverters. Our model is based on the long short-term memory (LSTM) recurrent neural network model [8], which has been a popular and effective choice in PV forecasting [9,10]. We do not consider more recent recurrent network models such as the transformer model [11] because the primary focus of our model is on the utilization of data from adjacent PV sectors to capture clouds in ultra-short-term forecasting rather than the novelty of the brand-new neural network model.
The contribution of our paper can be viewed in three parts. Firstly, it is clearly shown that the main factor in minute-scale prediction is the movement of clouds. Secondly, we propose a PV forecasting model that relies solely on generation history data from adjacent PV sectors to consider cloud movement, eliminating the need for specialized weather sensors. To the best of our knowledge, this is the first study that incorporates data from small neighboring sectors to forecast ultra-short-term PV generation. Finally, we demonstrate that electricity generation data from neighboring PV sectors can effectively reduce forecasting errors, with real power output data from a PV site.
In Section 2, we briefly describe the relevant literature, and in Section 3, we provide the details of the proposed forecast model. In Section 4, we validate the performance of our model with real PV generation data. Finally, Section 5 concludes our paper.

2. Related Work

The forecast of PV generation has been widely studied for the past years. There also exist many review papers about PV solar power forecasting research studies [12,13,14,15]. Because plenty of studies exist in the field of PV forecasting, we tried to classify research studies into several categories and mention only the studies that show high relevance to our forecasting goal.
First, regarding the forecasting methods of ultra-short-term PV forecasting, they can be categorized into three groups, which are physical methods, statistical methods, and machine learning methods [7]. Physical models attempt to model PV generation systems using mathematical equations [16]. For this purpose, the entire system is divided into subparts, and each part is electrically modeled. However, this method is usually suitable for long-term forecasting, which predicts the yearly output and requires specific sensors for short-term forecasting due to its mathematical basis. Statistical methods consider sequential PV output as a sequence of signals to predict the next value [17]. The autoregressive, integral, and moving average (ARIMA) model [18] can be an option in this type of method. However, it only utilizes past data and does not accept other valuable information that can be accepted by the third type of method. Nowadays, data-driven machine learning methods are widely accepted in this field [7,19,20,21,22,23,24]. Various learning models such as support vector regression, extreme learning machine, and particle swarm optimizer are applied to PV forecasting to increase the accuracy of predictions. Our proposed model can also be classified as a data-driven method, and we employ the LSTM network, which is one of the most popular recurrent neural network models in the recent decade. However, the name of the applied model is not of much importance because our focus is not on the structure of the learning model but on incorporating cloud movement with neighbor sectors’ information. We focus on analyzing the effect of the neighboring sectors’ information using the widely accepted LSTM model.
The forecasting horizon, which is the time duration between the current time and the target time of prediction, can also divide research studies on PV forecasting into a few categories. Long-term (more than 24 h), medium-term (6–24 h), short-term (between 30 min and 6 h), and ultra-short-term (shorter than 30 min) durations are mentioned in a previous review [12]. Among them, most research works focus on long-term or medium-term durations because services that require this forecasting horizon already exist in the market. For example, in Korea, PV generators that can provide day-ahead prediction and keep the error below 8% receive an additional 3 pennies per generated kWh [25]. Consequently, all PV service providers strive to deliver accurate day-ahead predictions. In contrast, there are fewer studies in the literature that focus on ultra-short-term predictions. This is because, as mentioned right above, many applications require day-ahead or hour-ahead predictions. Additionally, most pre-installed PV systems do not support minute-scale measurements. However, in recent times, ultra-short-term data gathering has become possible and essential in some PV generation facilities because real-time applications require ultra-short-term load forecasting for microgrid control. There are a few studies that consider horizons that are less than 30 min [7,19,26,27,28]. However, their focus has been on adopting new model types, such as an ensemble model, weighted Gaussian process regression, swarm optimizer, and support vector machine. Our focus is to incorporate the information related to the cloud into the model.
The input variables, which are the data fed into the prediction model, can be other criteria that can categorize related research studies. The widely utilized data are weather forecasts and satellite pictures from meteorological offices. Solar irradiance [29], temperature [30], clouds [31], and wind [32] have been referred to in the literature. Alternatively, specially installed site-specific equipment such as an on-site cloud image sensor [33] can also be considered. Weather information, however, is not important in the minute-ahead horizon because the weather does not change every minute. The past generation history of PV is also an effective input data in statistical methods. However, it cannot consider any information related to coming clouds that change every time slot. Regarding the movement of weather conditions, there exist a few studies that incorporate information from multiple PV sites [34,35,36,37]. They predict the PV generation of a certain PV site using the output data from other PV sites that are located a hundred miles away from the target PV site. Since weather conditions are often correlated across adjacent areas, a decrease in generation from one site can indicate that neighboring sites may also experience related weather conditions in the coming hours. Although it is debatable that this information is already included in the weather forecasts from meteorological offices, it is good to know that this approach is implementable without relying on weather forecasts. While these studies focus on large systems with long-term forecasts, our focus is on minute-ahead predictions with intra-site sector information.

3. Forecast Model

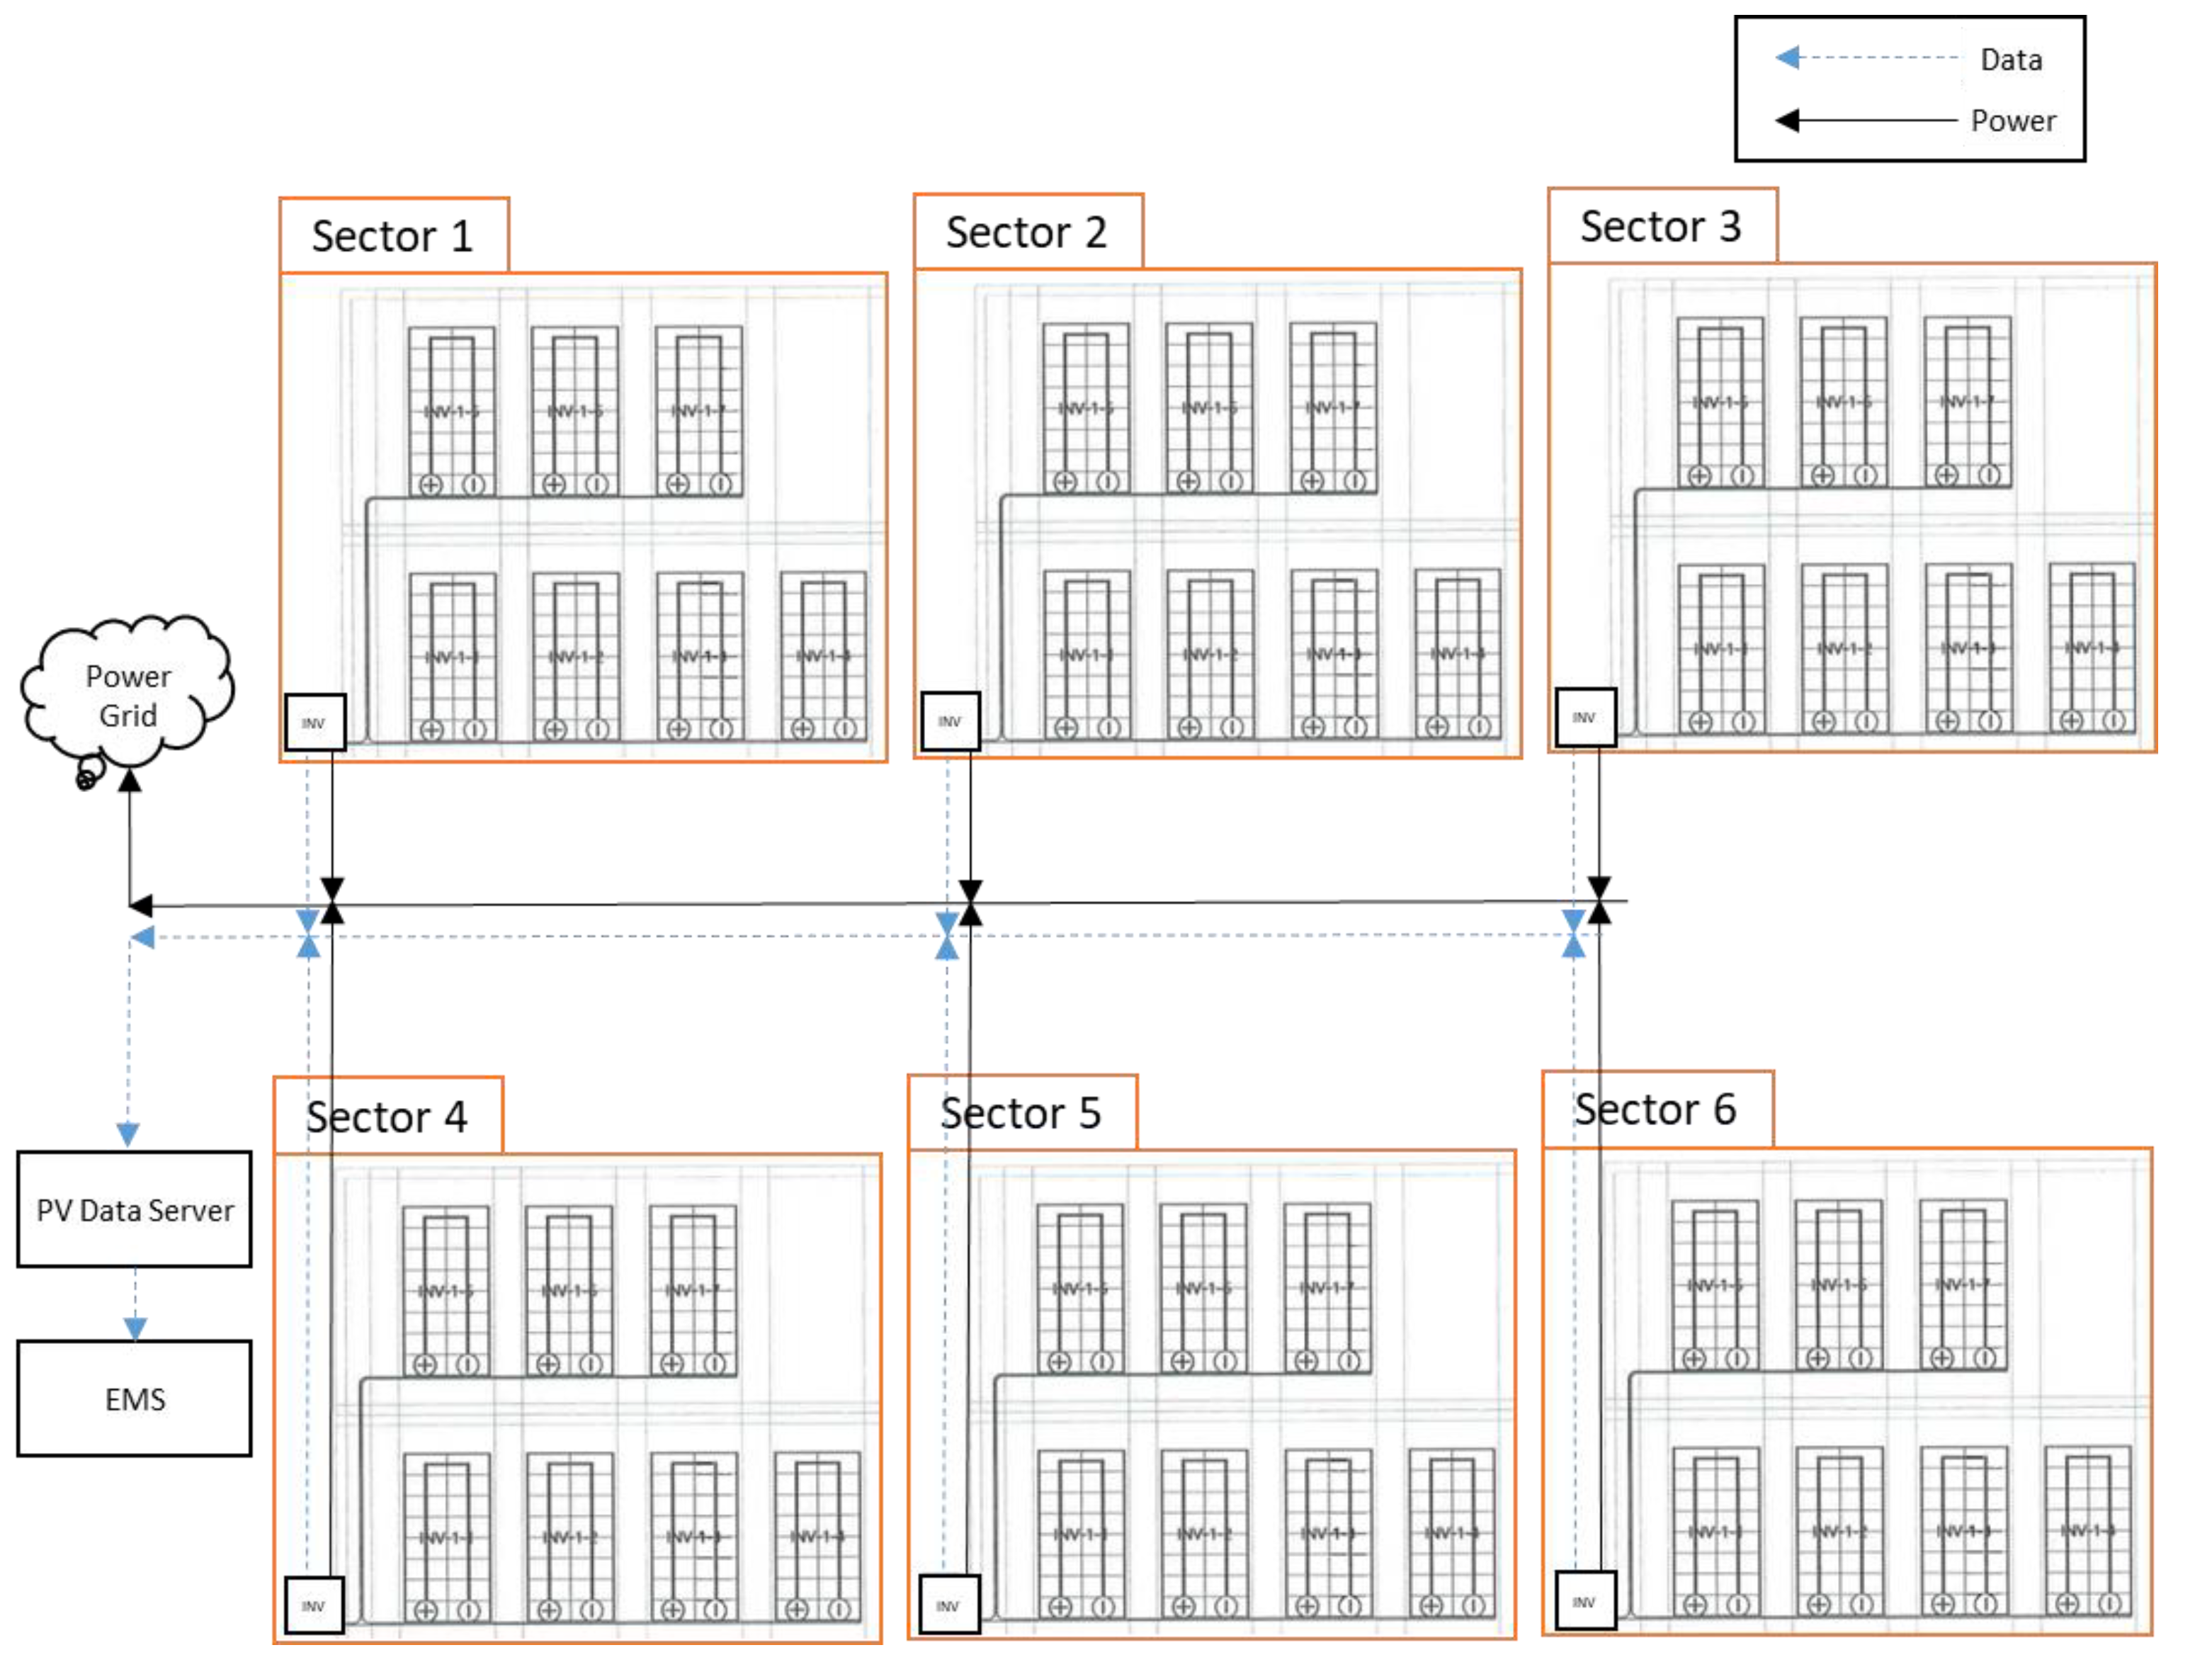
Our goal is to forecast the next minute’s generation of a PV sector. It is assumed that a PV generation site is composed of multiple PV sectors, and each PV sector consists of many PV panels that are wired together, as shown in Figure 3. In this system, the output power can be independently measured for each PV sector. This is possible because each individual inverter reports its status to the data server in most recently installed PV sites.

3.1. Learning Model

LSTM was selected as the learning model of our proposed prediction method because previous studies have demonstrated its ability to provide accurate and reliable predictions with different types of sequential data. Although other models, such as the transformer architecture that is popular in natural language processing tasks, might be effective for PV generation forecasting, we did not consider them for our proposed method because our focus is on incorporating neighboring PV sector information. However, other learning models can also leverage this information to enhance forecasting performance.
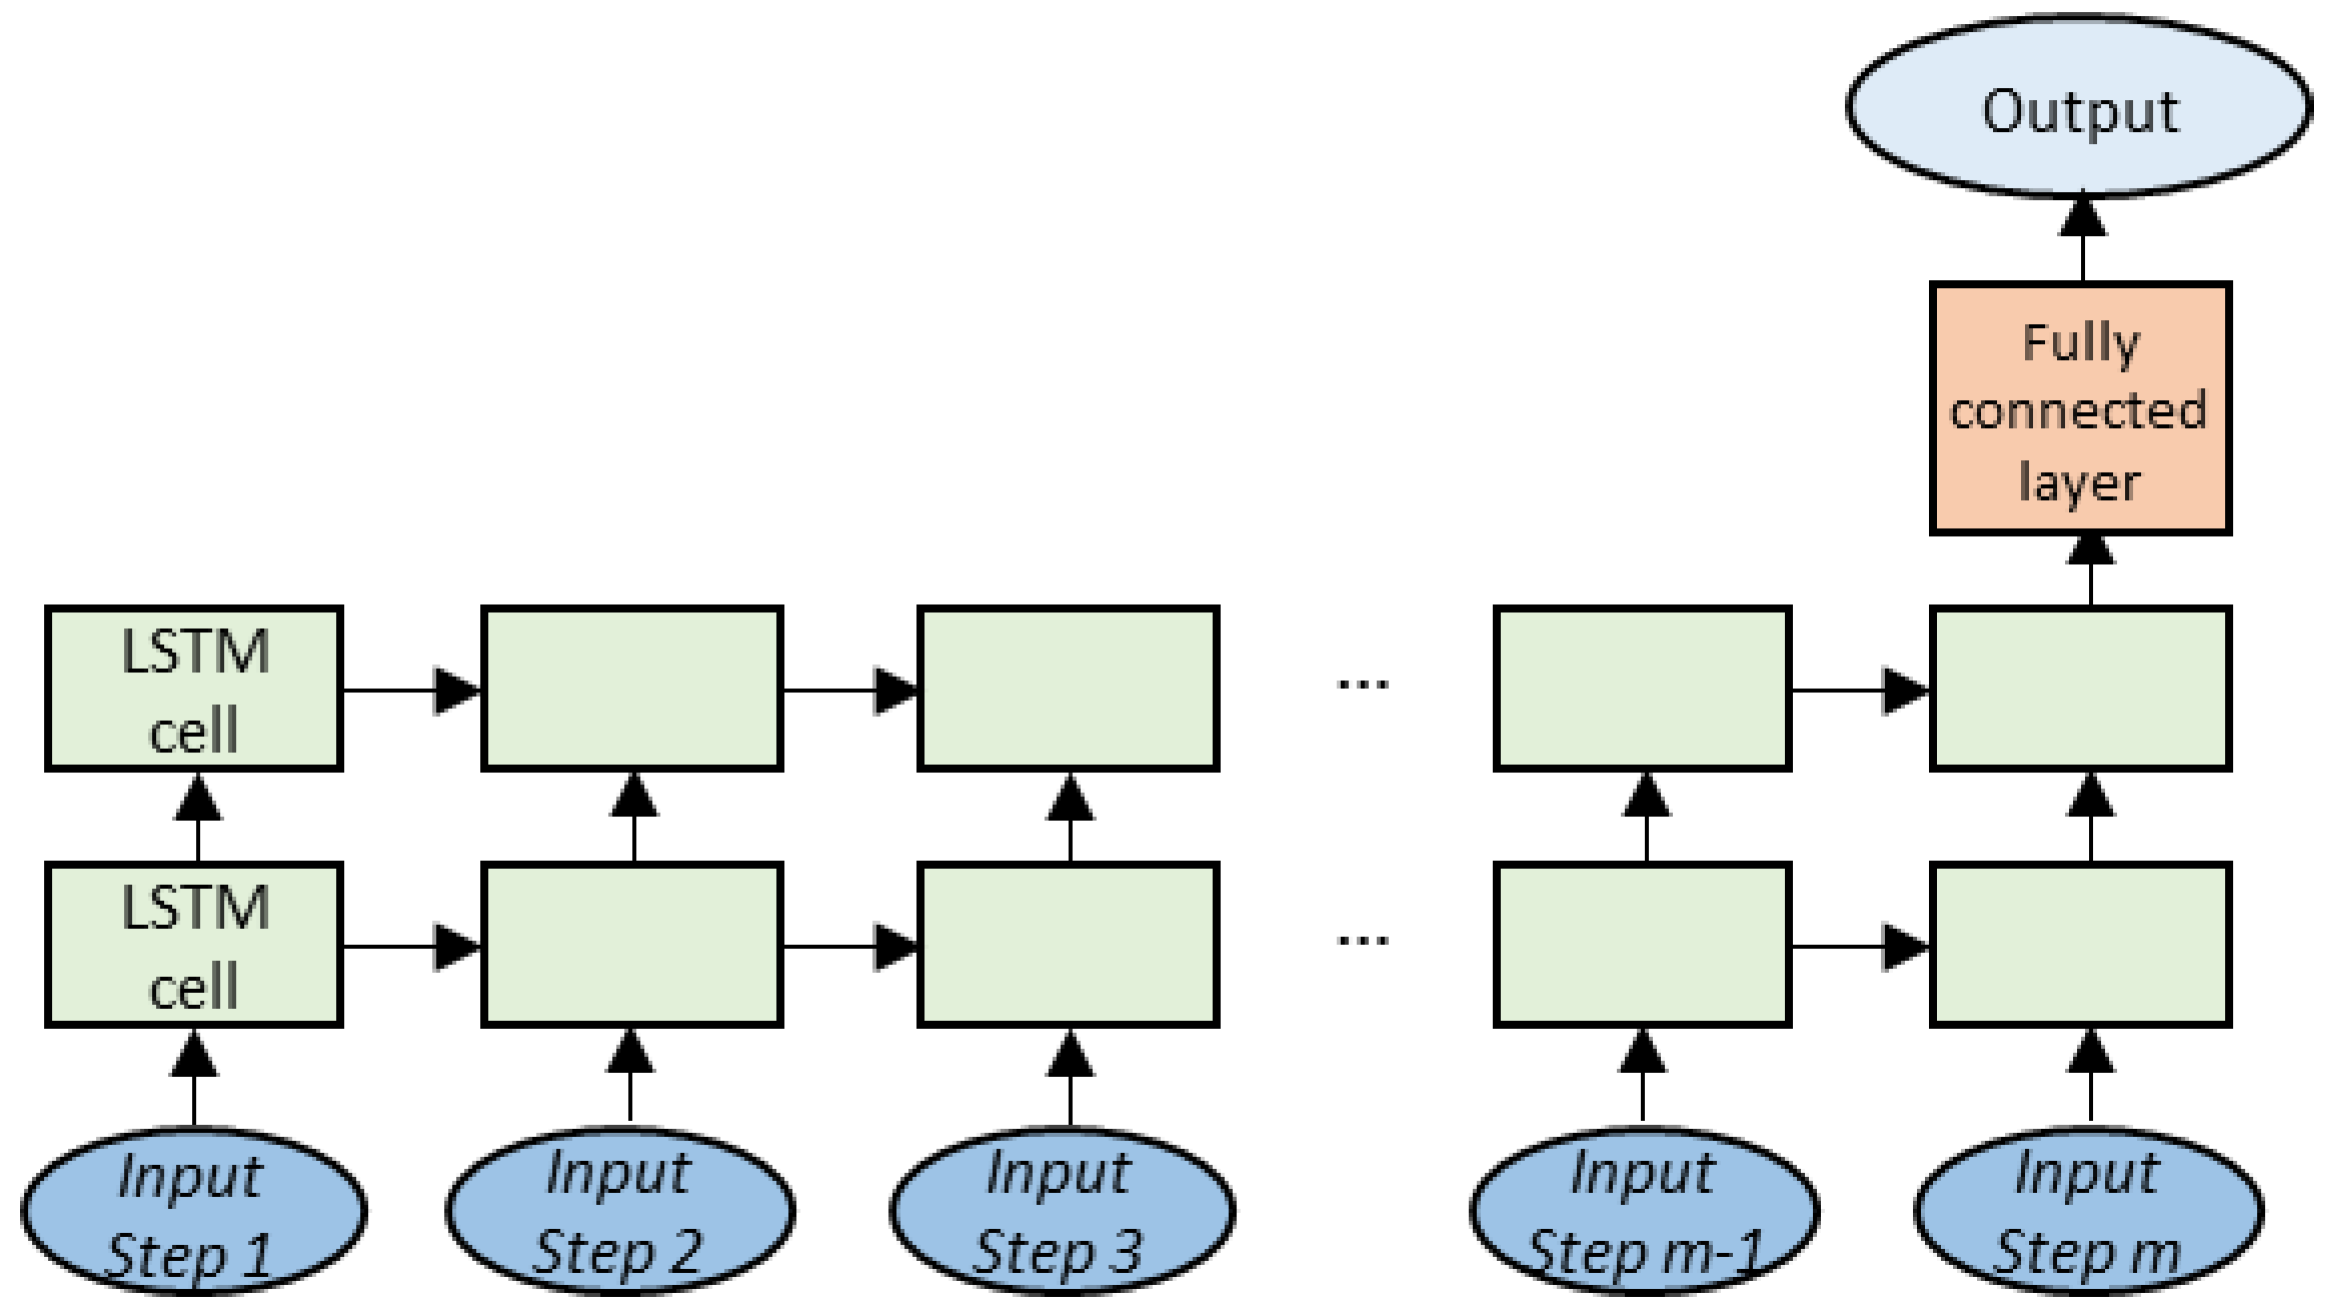
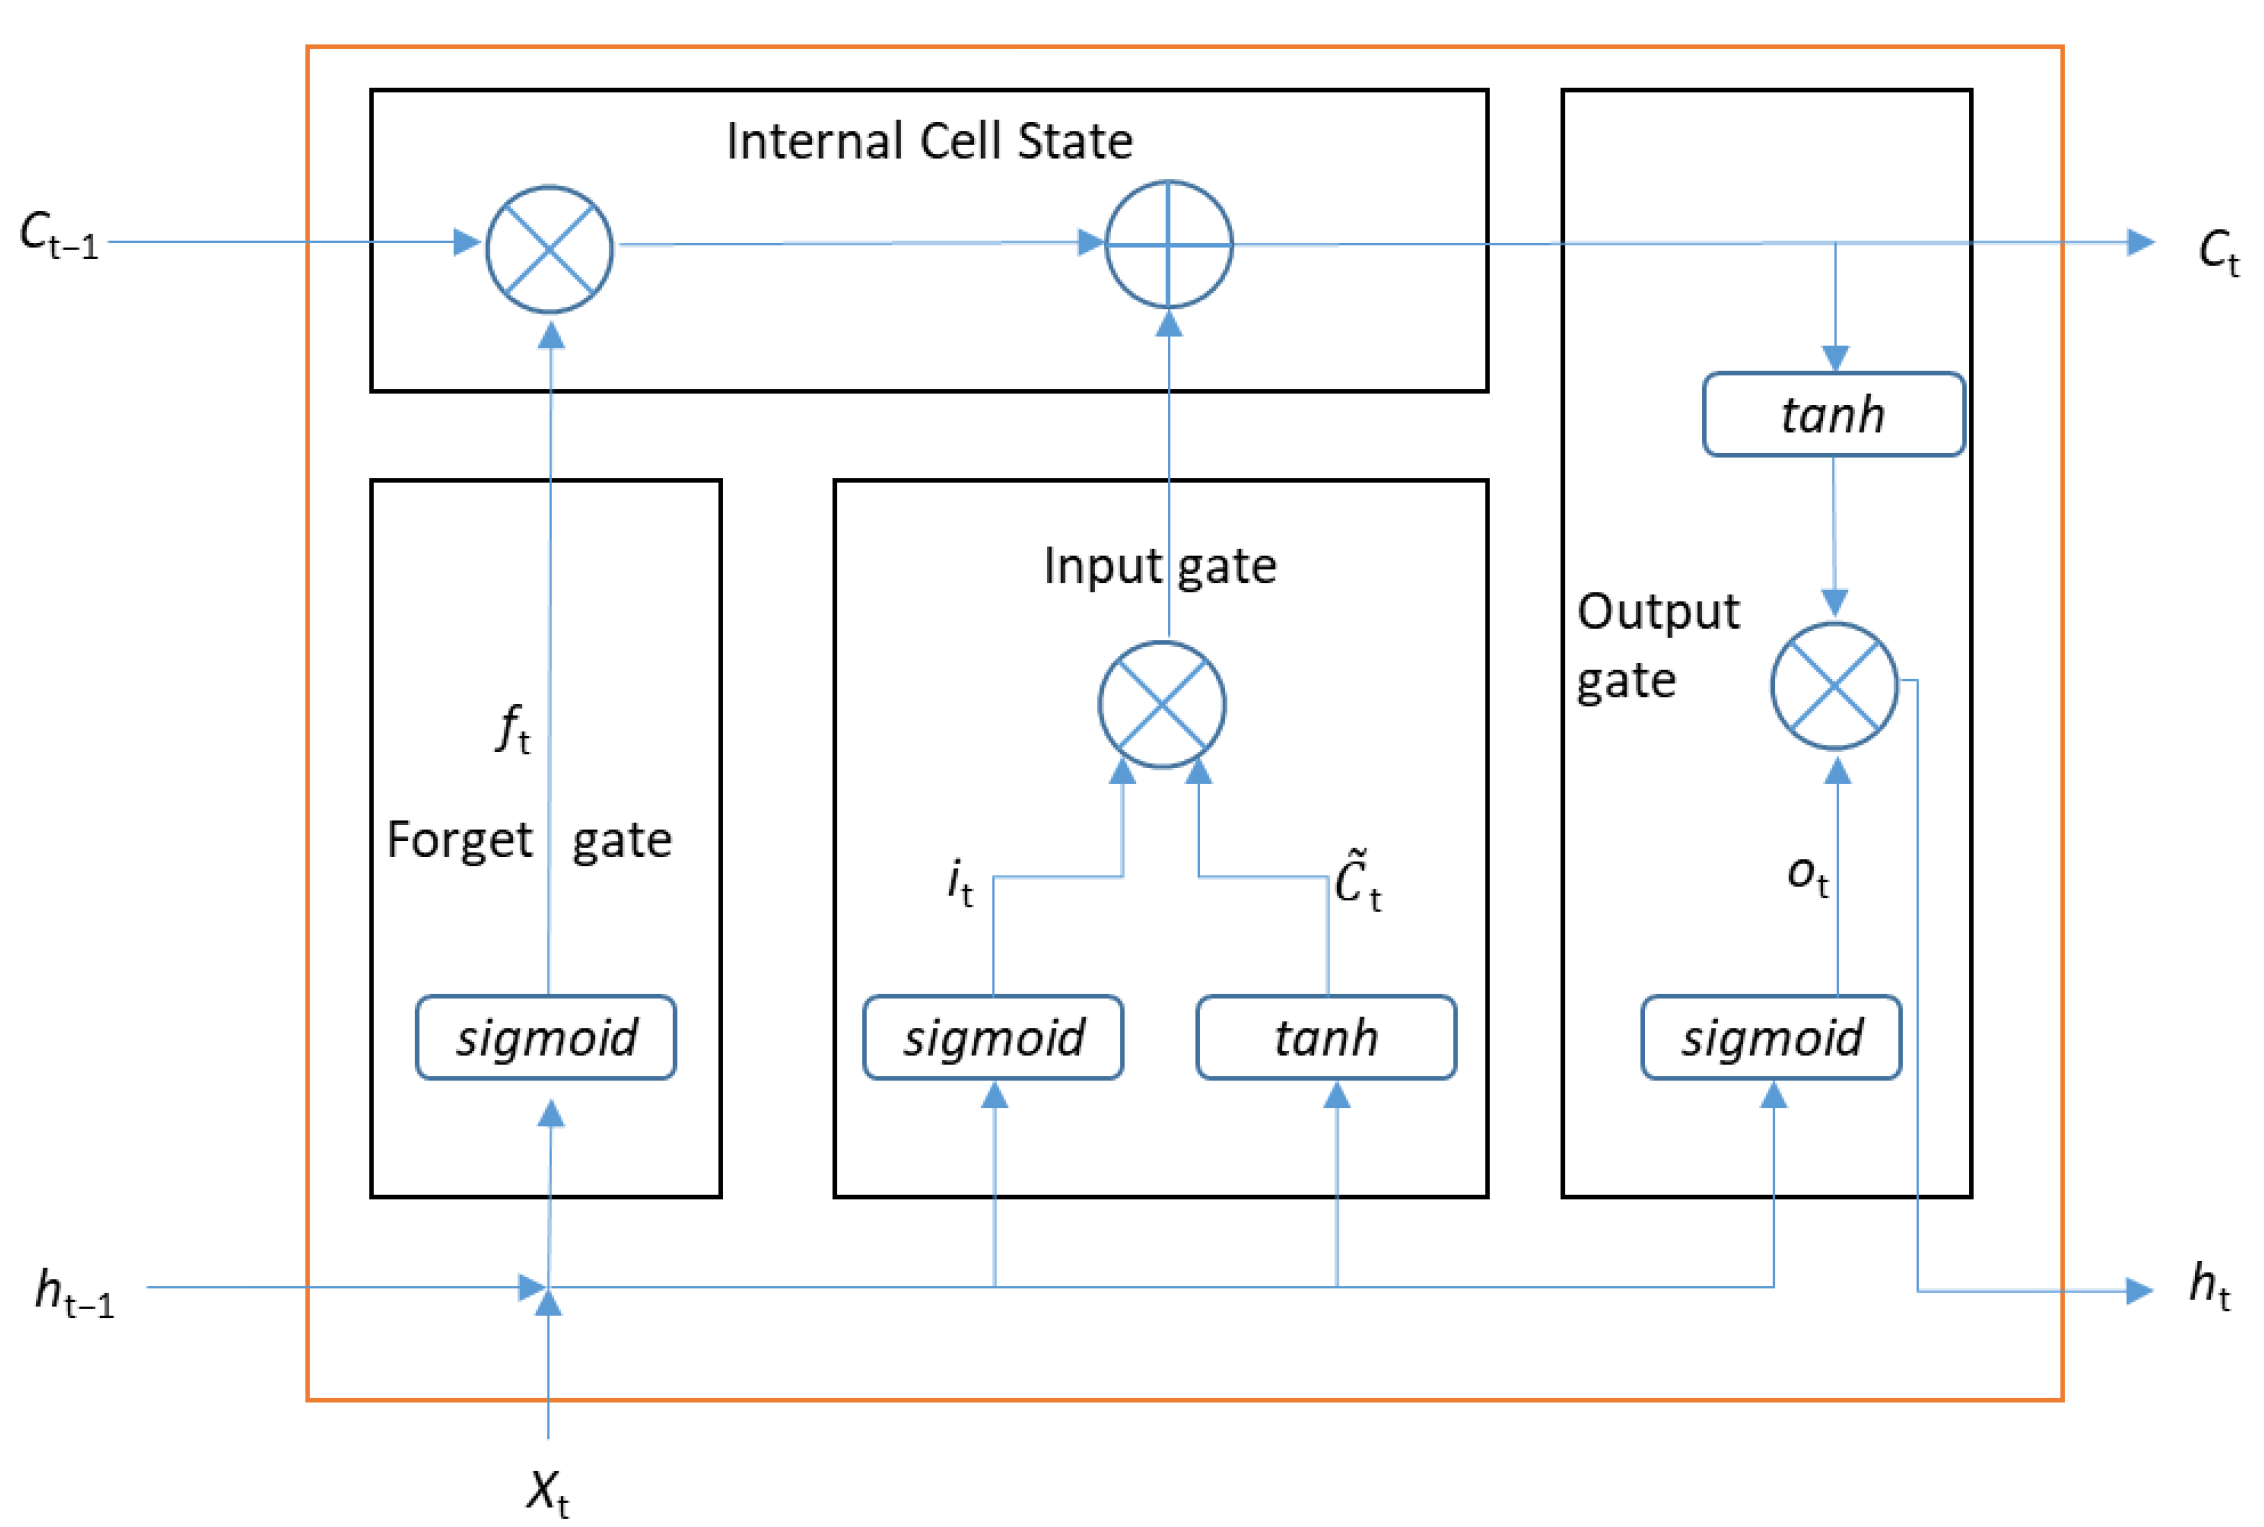
Figure 4 illustrates the employed LSTM model, which utilizes a many-to-one architecture with a two-layer design. At the final output of the network, a fully connected layer is included to produce a single scalar value, which is the next minute’s electricity generation. Through m time steps, data are sequentially fed into the LSTM cell, which is composed of a forget gate, input gate, output gate, and internal cell state. The internal structure of an LSTM cell is briefly presented in Figure 5, and the output of each gate is calculated as in Equations (1)–(6). The concept behind LSTM is to retain meaningful past information in the internal state while processing each time-step data Xt. The input gate identifies and incorporates recent relevant information, while the forget gate eliminates unnecessary information from the past. Each gate has weight matrices (W), which are learned during the training process. In our case, the input data (Xt) mainly consists of the amount of the past generation of small PV sectors.
f t = σ W f · h t 1 , x t + b f
  • where   W f = weight   matrix   of   the   forget   gate ;
  • b f = connection   bias   of   the   forget   gate ;   σ = sigmoid   function .
i t = σ W i · h t 1 , x t + b i
C ˜ t = t a n h W C · h t 1 , x t + b C
  • where   W i = weight   matrix   of   the   current   input ;
  • W C = weight   matrix   of   the   hidden   state ;
  • b i , b C = connection   bias   of   the   input   gate .
C t = f t C t 1 + i t C ˜ t
o t = σ W o · h t 1 , x t + b o
  • where   W o = weight   matrix   of   the   output   gate ;
  • b o = connection   bias   of   the   output   gate .
h t = o t t a n h C t
Further theoretical details of the LSTM model can be found in the literature [8].

3.2. Input Data

As mentioned previously, the weather forecast is not required as an input variable. Instead, the main input feature is the generation data from neighboring sectors. In our PV site, we have a total of nine sectors, and the generation data from these sectors serve as input variables, reflecting the intra-site variations that occur on an ultra-short-term timescale. In addition to the PV generation data from neighboring sectors, we incorporate the time of day and clear-sky irradiance data provided by the pvlib library [38] as input variables. These variables capture long-term patterns such as daily and seasonal variation, which can also influence next-minute generation.
Other possible information such as the direction of wind or relative location of PV sectors is not considered at all in the model because it requires additional sensors or site-specific information, which may not be readily available. We believe that neural networks can learn the relation between sectors by training neighboring sectors’ generation data, as mentioned in Section 1. By analyzing the patterns in the generation data from neighboring sectors, the model can capture the interdependencies and correlations that exist between the sectors.
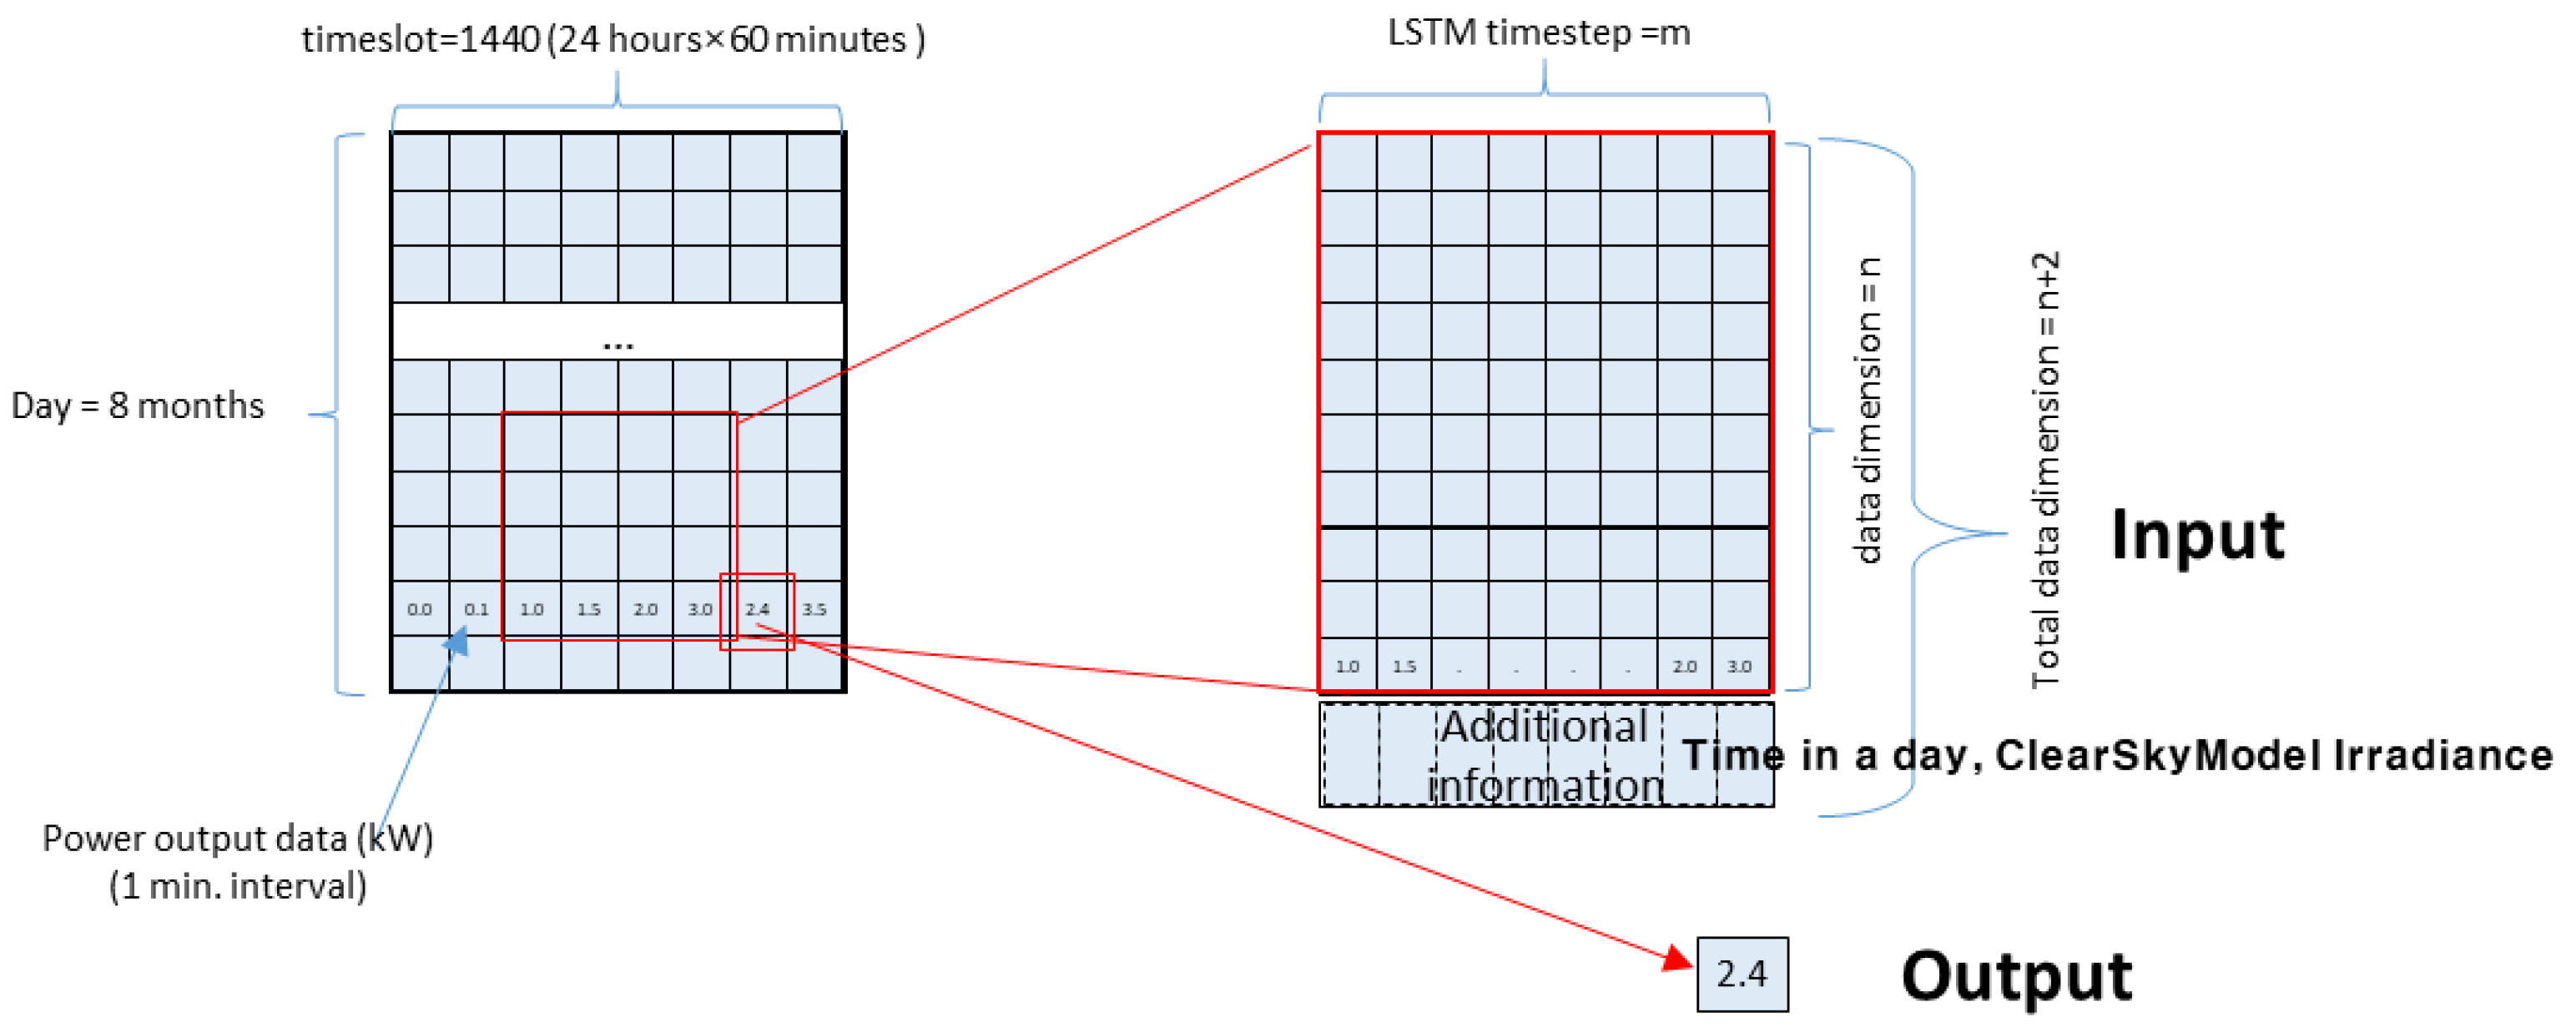
The shape of the input data from a single PV sector is depicted in Figure 6. The energy generation data from the past m minutes is fed into LSTM as m time steps. Past n days’ energy generation data of the same time of day are considered as n data dimension. This is because it can supply information about energy generation for the current week. We note that with this input structure, the LSTM model does not utilize information from neighboring sectors. It only accepts data from its own sector, focusing on output patterns within that specific sector.
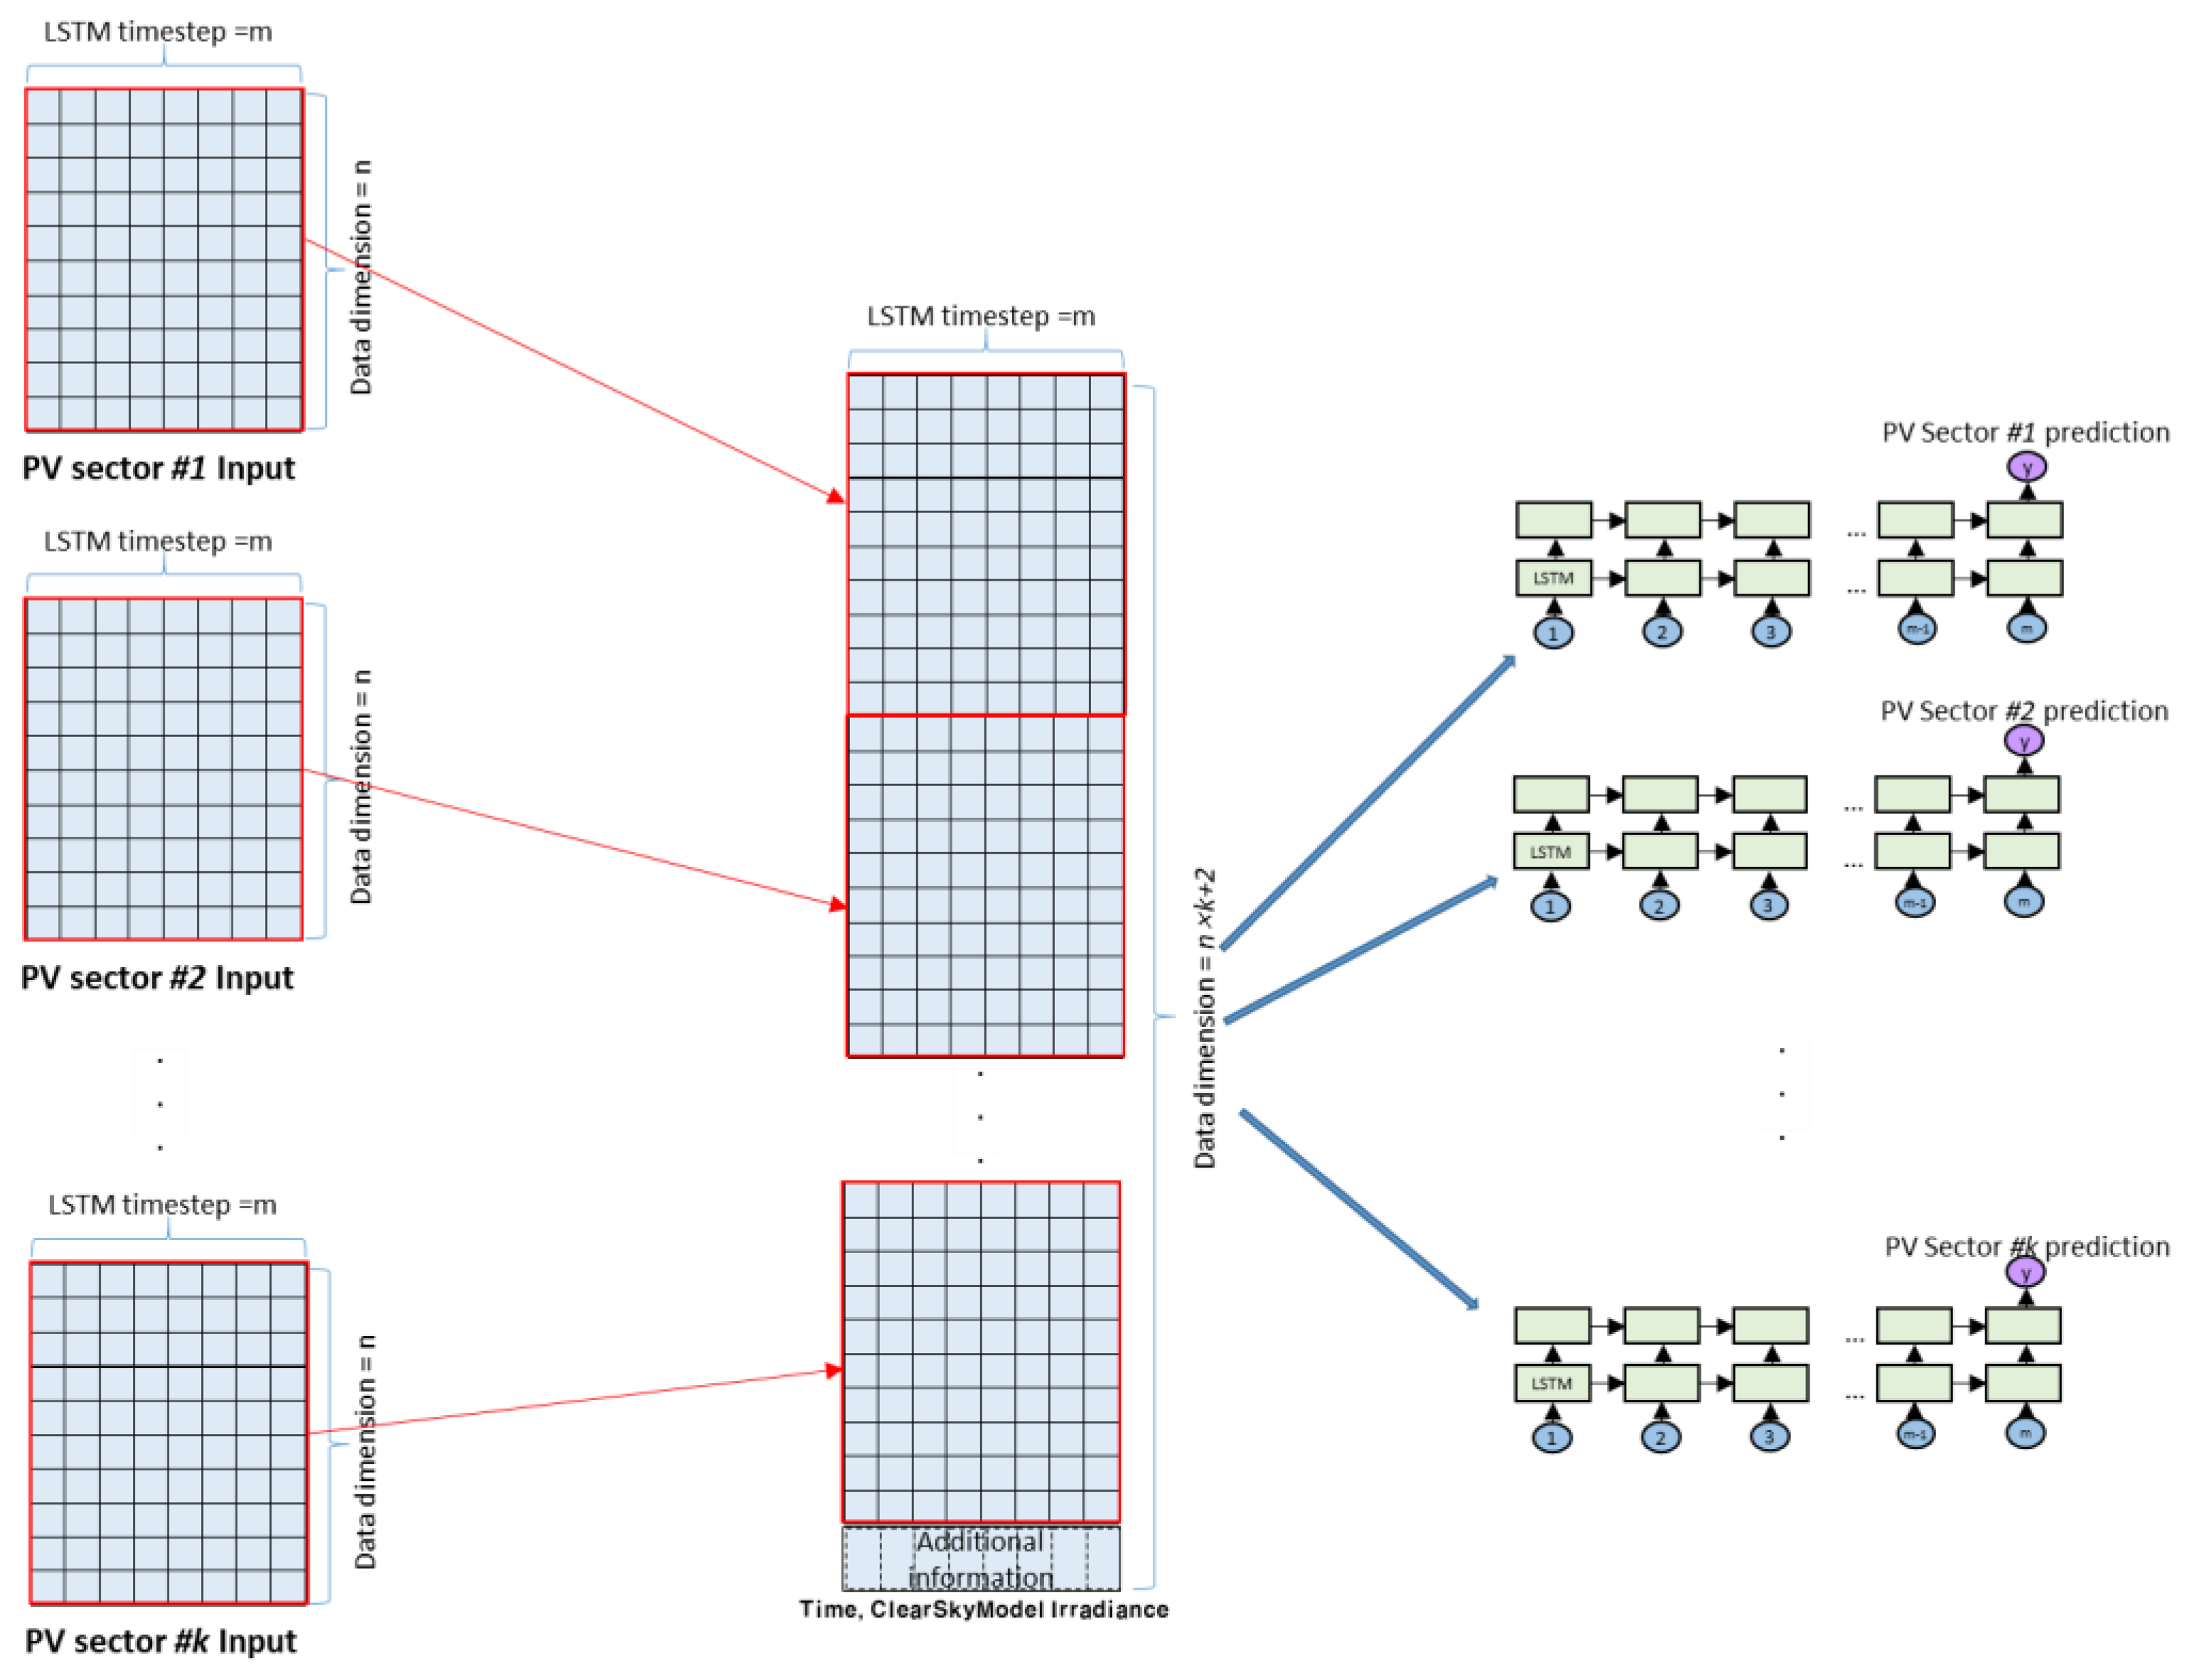
Contrary to the previous statement, in the proposed prediction shown in Figure 7, the energy generation data from k neighboring sectors are concatenated, resulting in data dimension k × n. Time and clear sky model irradiance are also padded at the end of data, which yields a total of k × n + 2 data dimension. Each sector has an individual LSTM network dedicated to predicting its next minute’s generation. The reason for having separate LSTM networks for each sector is to focus on the influence of neighbor sectors’ information, regardless of the training network’s shape. Although the size of input data is multiplied by k compared to the model with single-sector information, the padding of neighbors’ data allows the model to capture the clouds’ movement. We note that the relative position of each sector is not considered, because the neural network will find the dependency between sectors during the training process.

4. Experimental Result

4.1. Experiment Setup

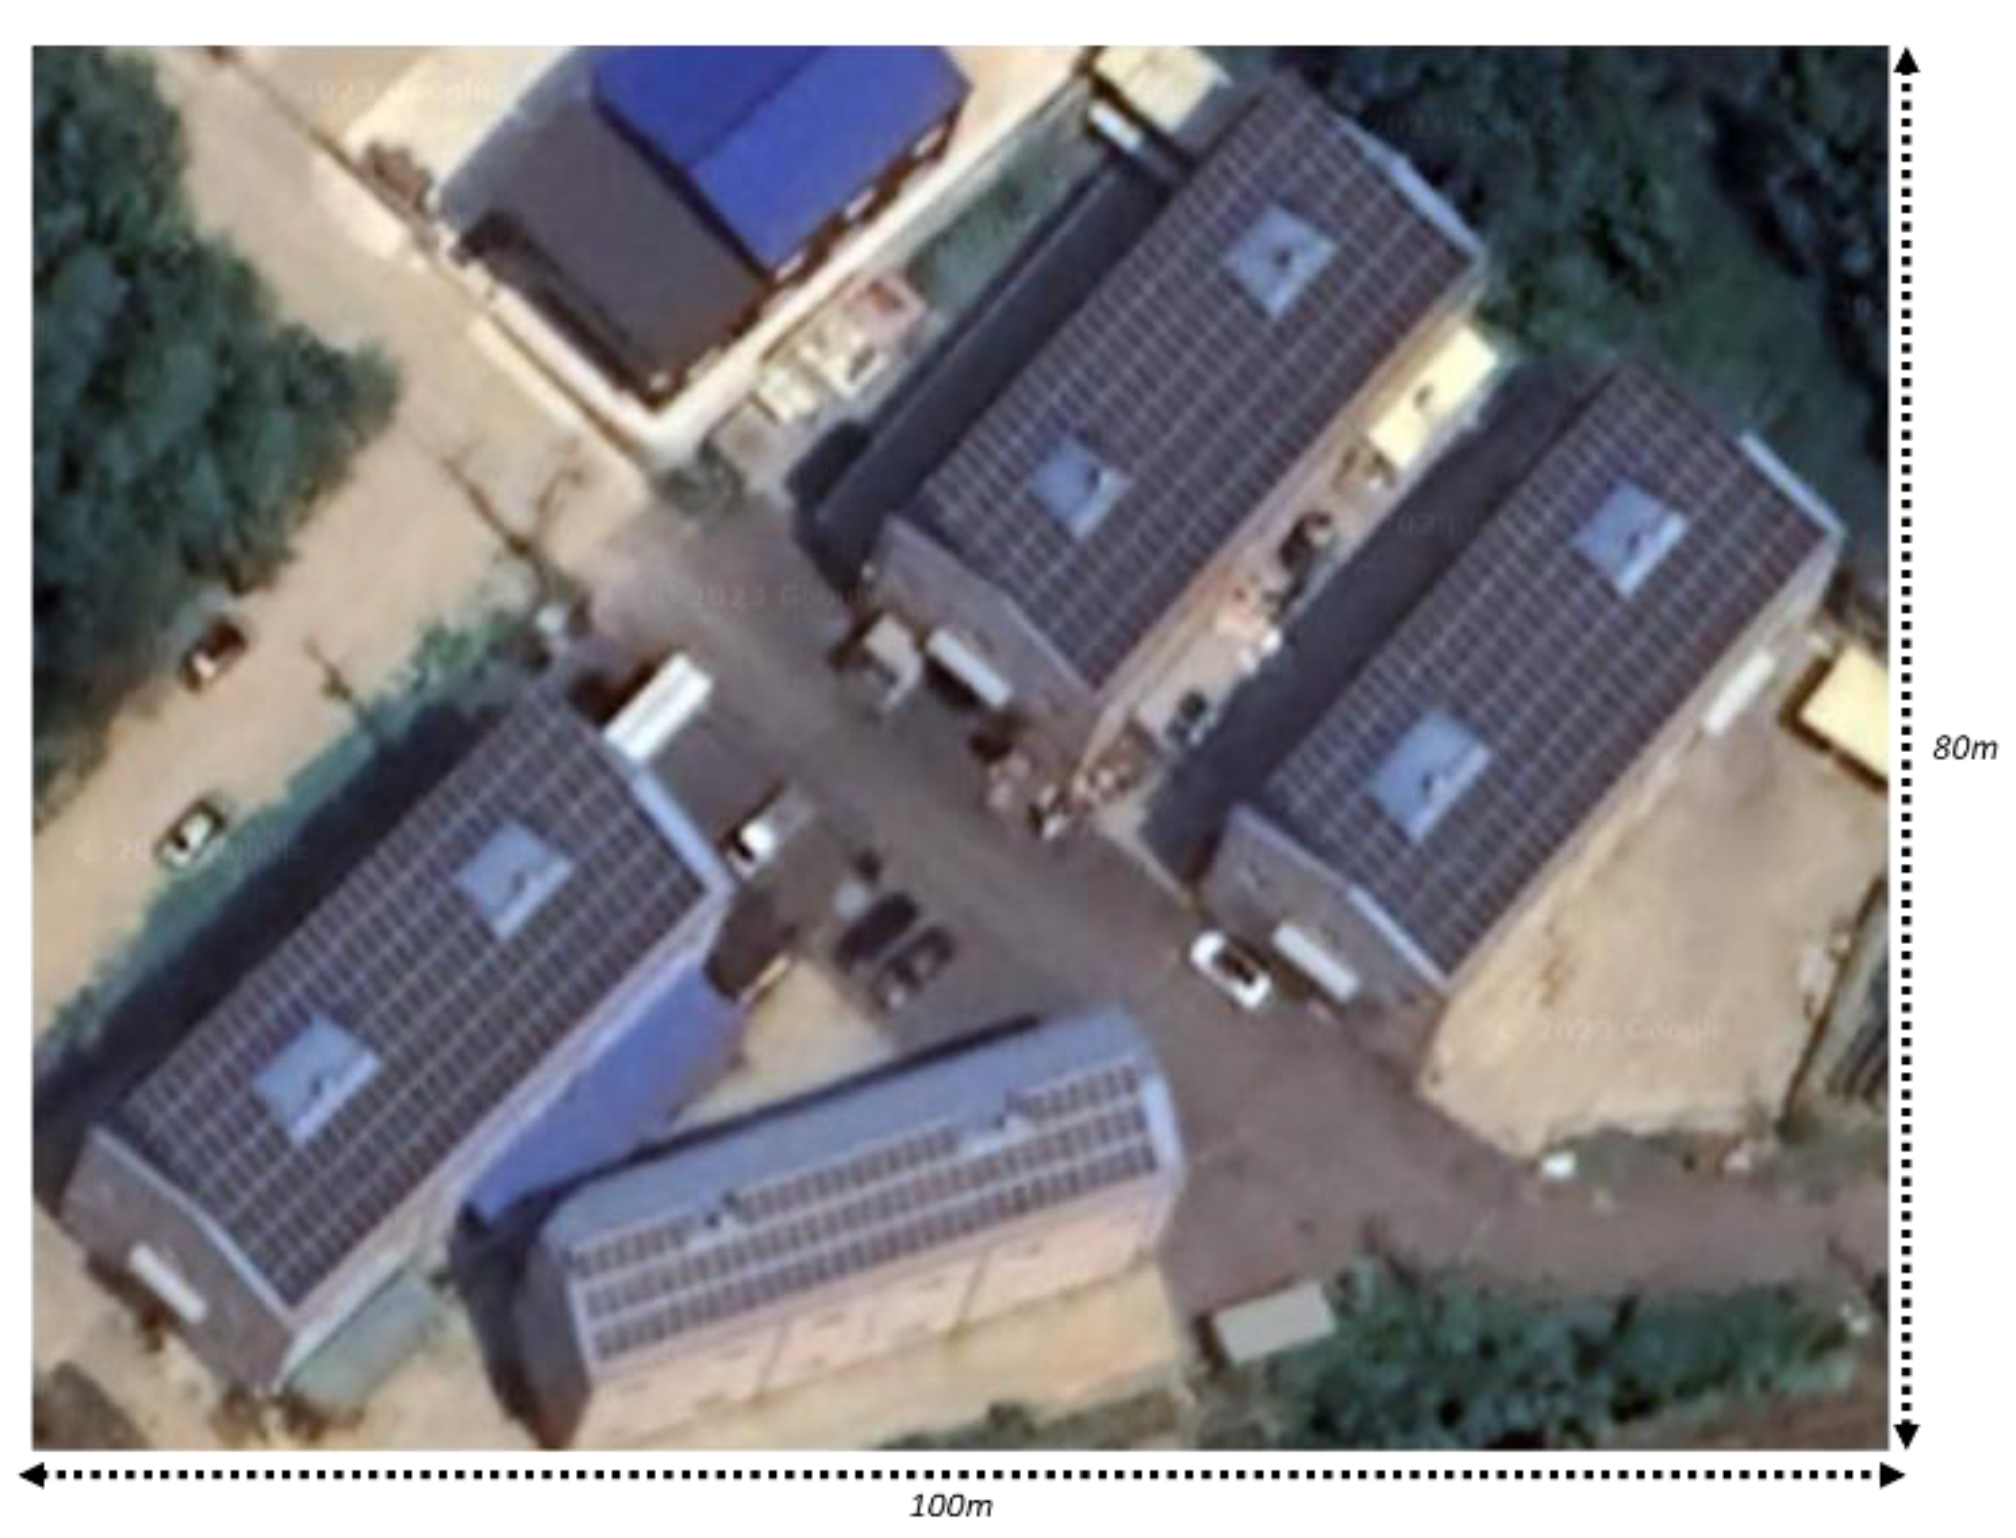
The experiment data for our study are obtained from our test site, which is illustrated in Figure 8. PV panels capable of a total of 225 kW are distributed on the loop of four nearby buildings, which are located within a 100 m × 80 m rectangular area. A total of nine inverters are installed, and data from each individual inverter are sent to the server every minute. The duration of real measurements is 8 months, from May to December. After preprocessing, which eliminates data with sensor malfunction, the total number of days is 234, and the total size of the dataset is 336,960: that is, 234 × 24 × 60.
A 10-fold cross-validation approach is employed throughout the experiment. In the split of data, the data are divided in a timely order, without shuffling to check the seasonal effect. The forecasting target is each individual PV sector rather than the entire PV site. All nine target sectors are tested, and the results are averaged in the subsequent analysis. Various parameters, such as the number of LSTM time steps, the number of data dimensions, and the number of hidden nodes in the LSTM cell, are varied in the experiment. The Adam optimizer [39], which is widely accepted in related research, is selected as the optimization method during training. We note that, during performance validation, power output data below 10% of its capacity are not considered because night, sunrise, or sunset times provide near-zero output values and are not important in the prediction. To assess the effect of the neighboring sector information, the proposed model is compared mostly to the LSTM-with-single-sector model, which reuses an identical LSTM network to the proposed model but limits input data to only the target sector’s data, as shown in Figure 6.

4.2. Performance Comparison

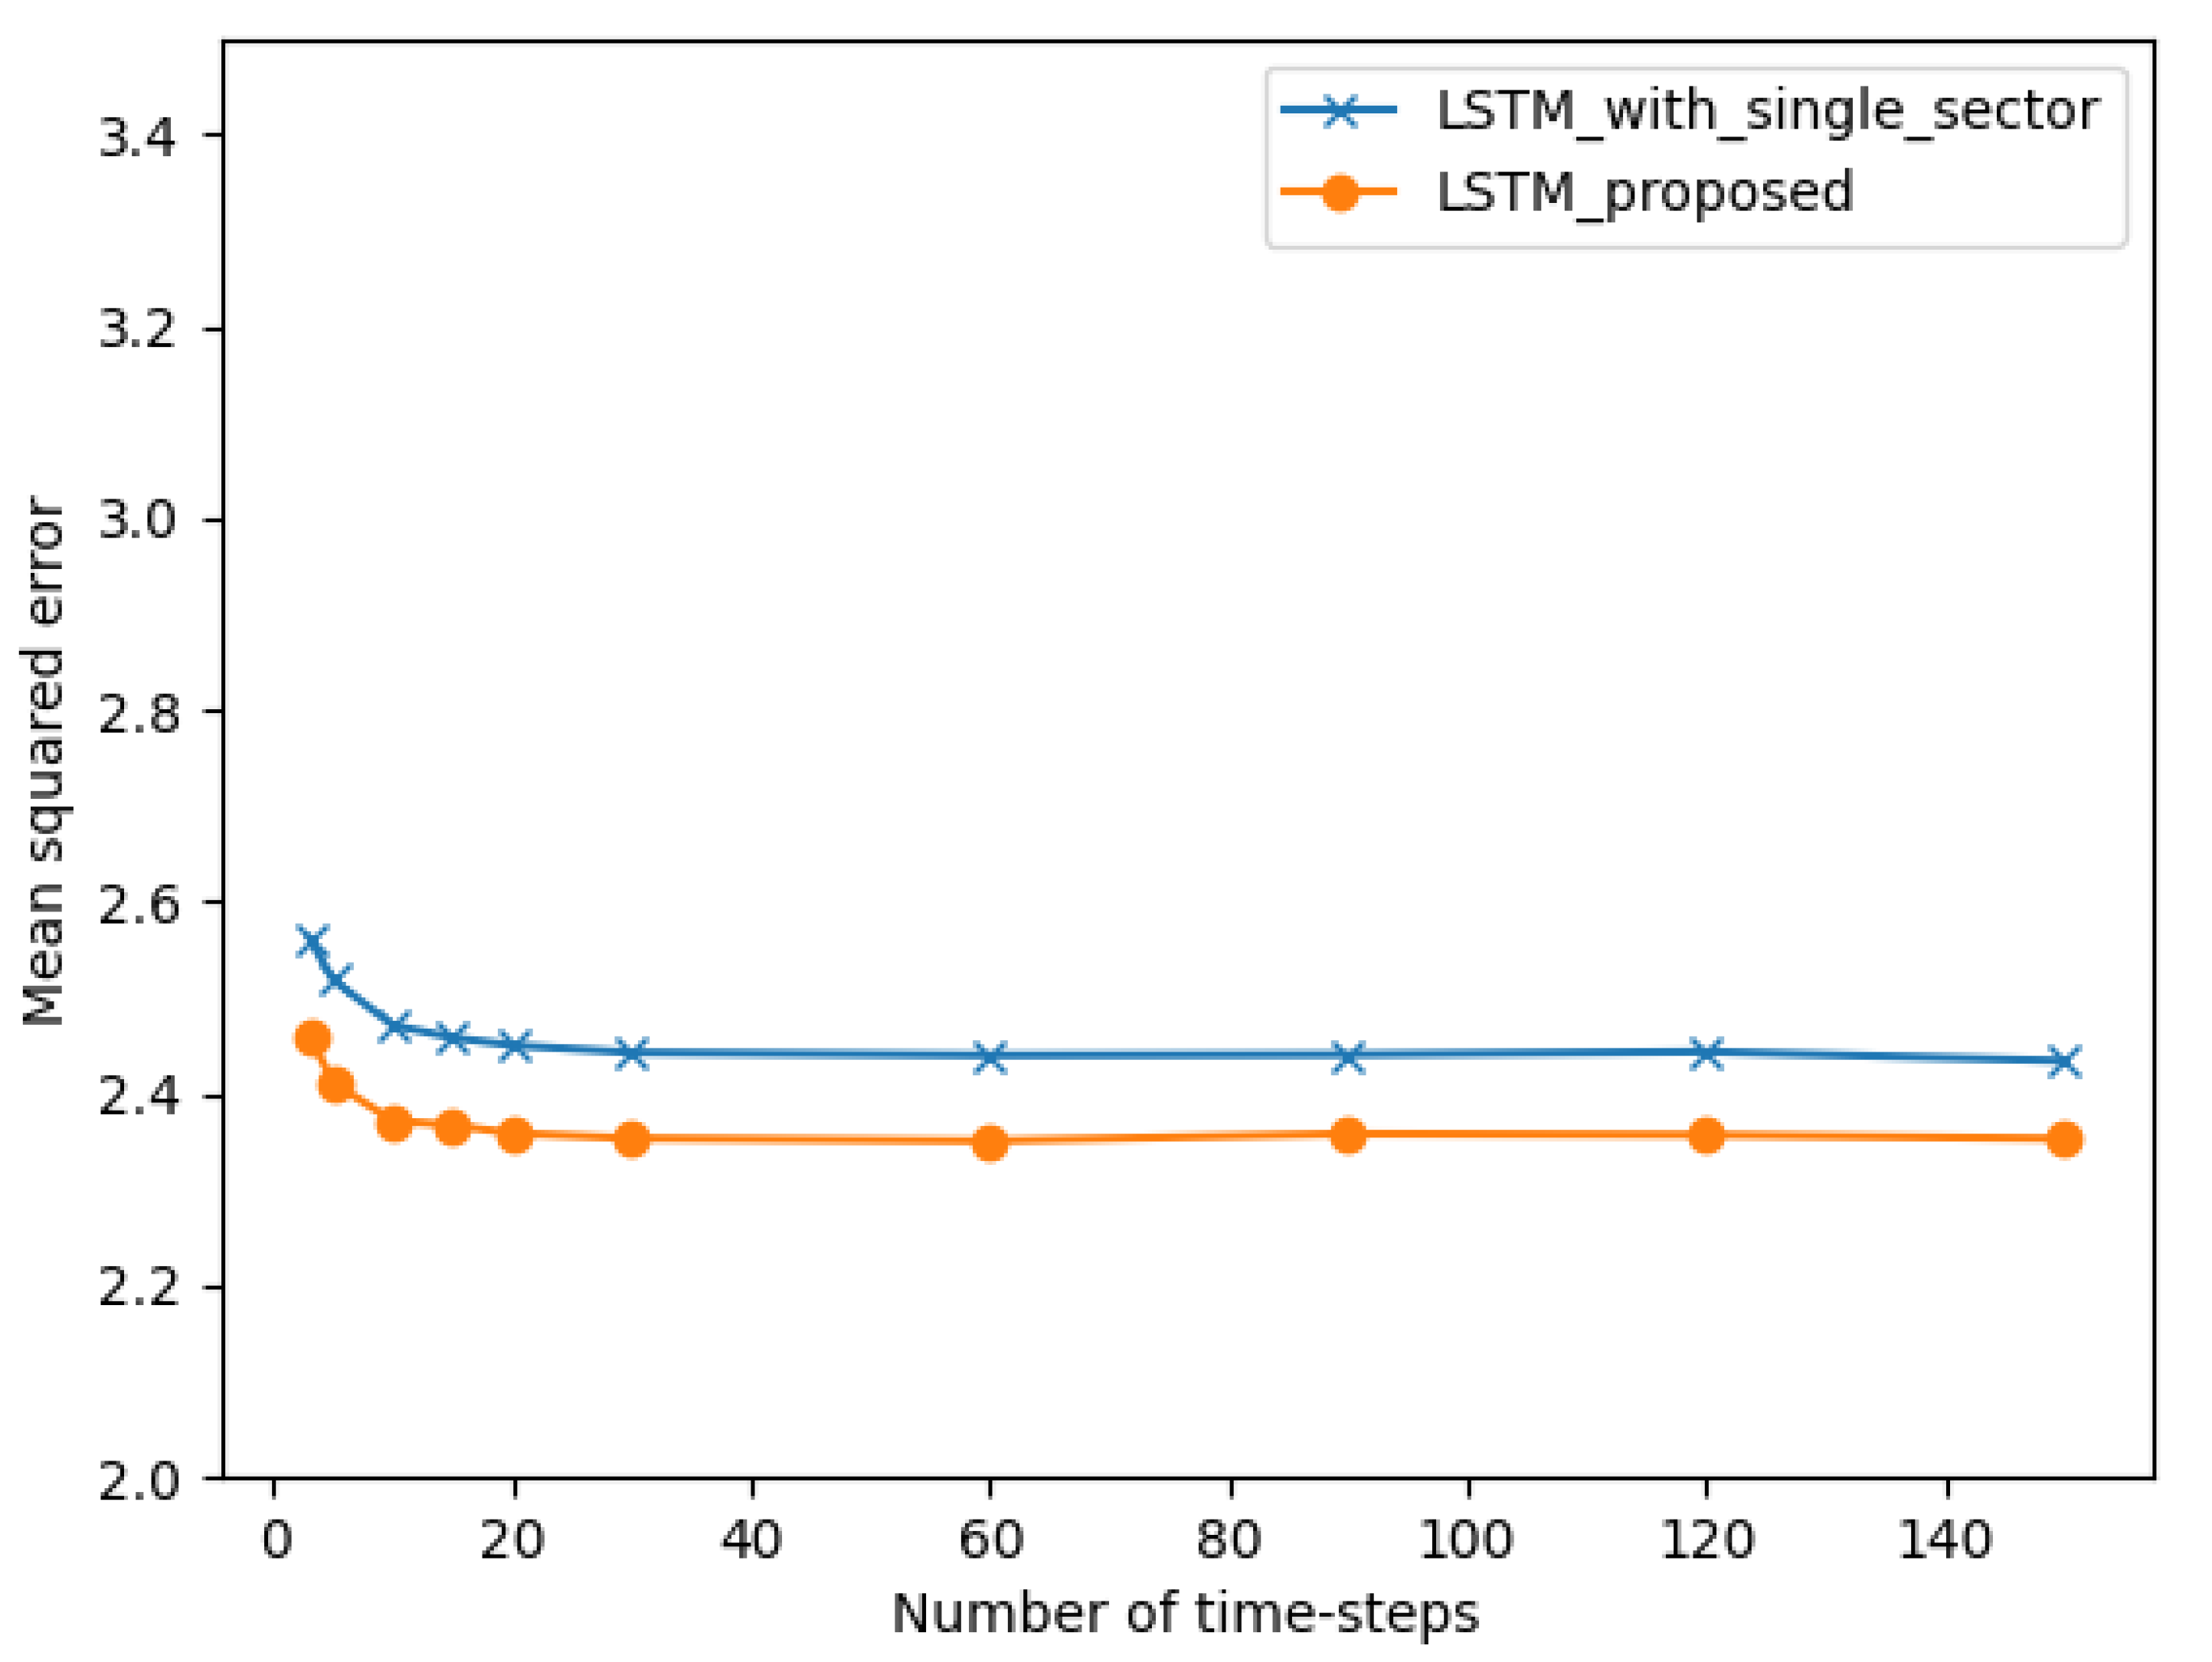
In this subsection, the performance of the proposed model is provided. In Figure 9, the number of LSTM time steps (m) is varied from 3 min to 150 min. This experiment aims to determine the length of past generation data that significantly affect prediction accuracy. As observed in Figure 9, the error decreases as the number of time steps increases. However, after 60 min, there is no significant improvement, which indicates that the information from the past hour is sufficient for forecasting the next minute’s generation. With only the past 60 min data, the model can find the relation between the past and future, as well as the dependencies between neighboring sectors and the target sector. During the experiment, the number of input dimensions (n) is fixed to 1. We note that the proposed method constantly outperforms the LSTM with single-sector information. From Figure 9, it is certain that the proposed method successfully integrates the movement of clouds into the model, leading to improved prediction accuracy.
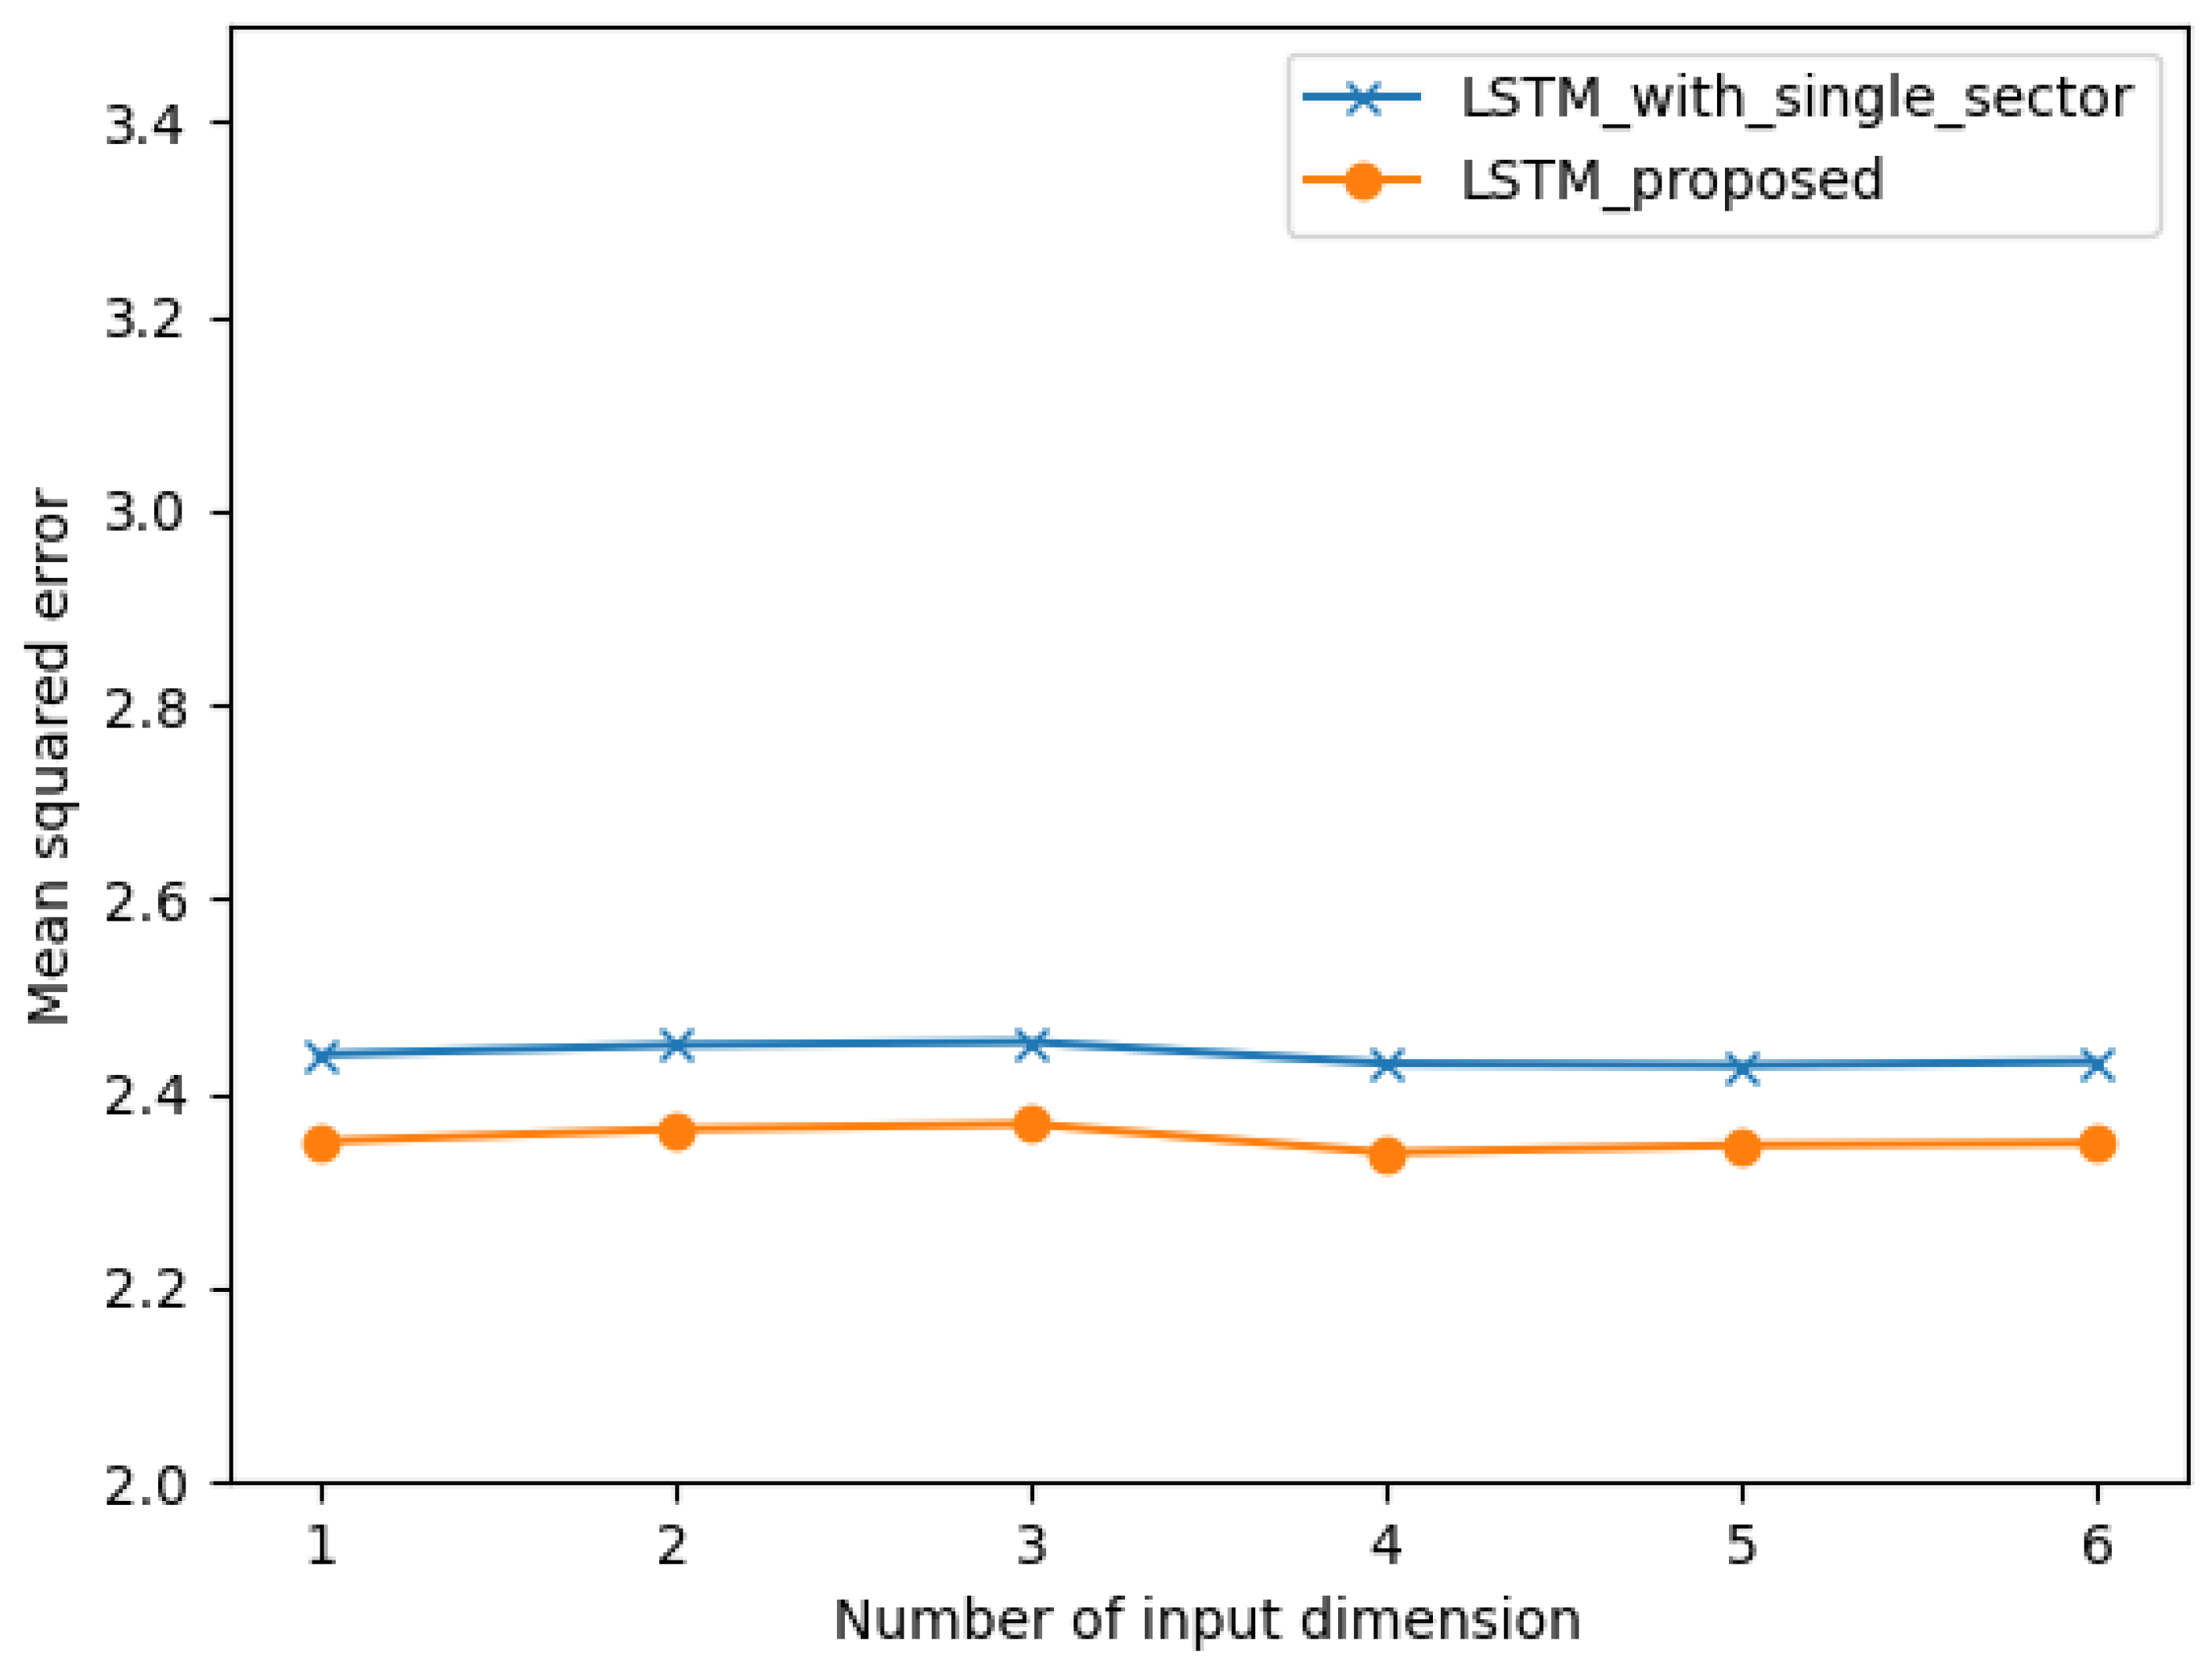
The number of input dimensions (n), which represents the number of past days considered, is varied in Figure 10. In this case, different data dimensions do not provide meaningful differences in the error. This suggests that data from yesterday or the day before yesterday do not have a meaningful impact on minute-ahead forecasting. Only today’s data are necessary for accurate ultra-short-term predictions. Time and clear sky irradiance are added in the experiment but omitted in the number of data dimensions. Meanwhile, the prediction error of the proposed model also constantly shows improved results compared to those of LSTM with single-sector information. The number of time steps in this experiment is set to 60.
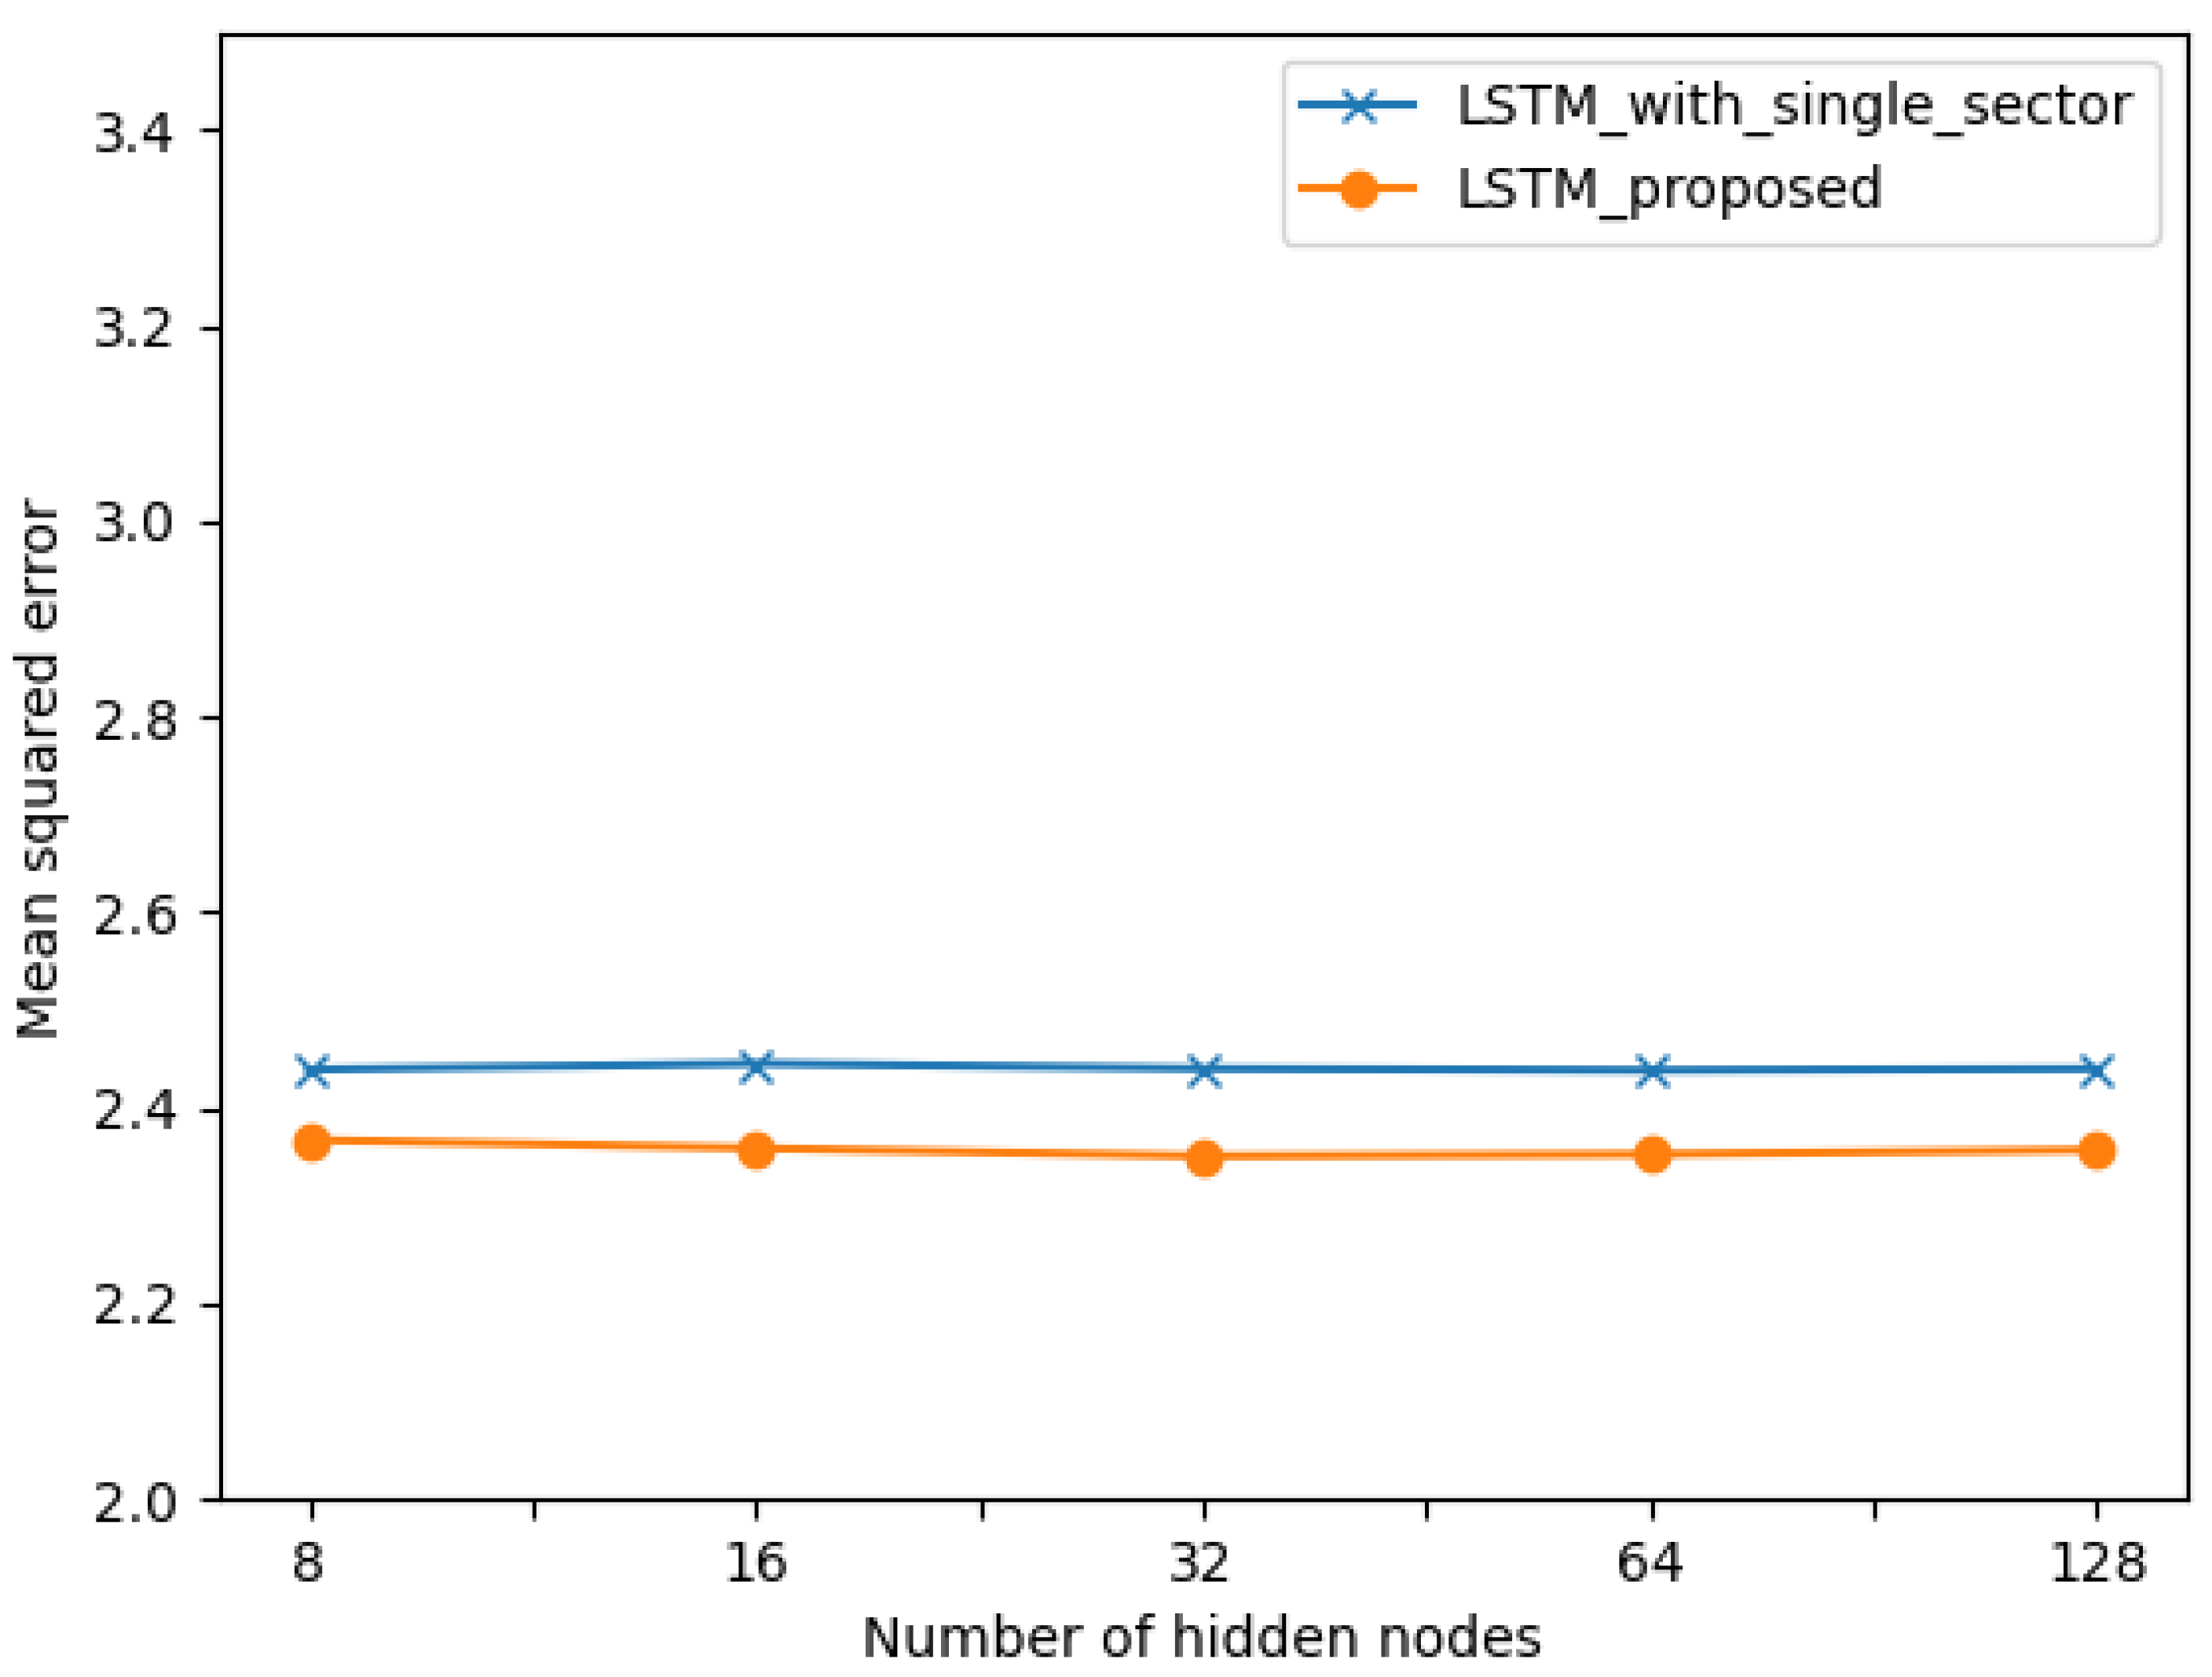
Figure 11 illustrates the impact of the number of hidden nodes in an LSTM cell on prediction performance. Although different numbers of hidden nodes do not have a remarkable effect on the error, there is a slight decrease in error with an increasing number of hidden nodes. However, the error stopped decreasing when the number of hidden nodes was above 32, indicating that the model is simple. Still, the proposed model constantly provides reduced errors compared to the case of single-sector information in all cases.
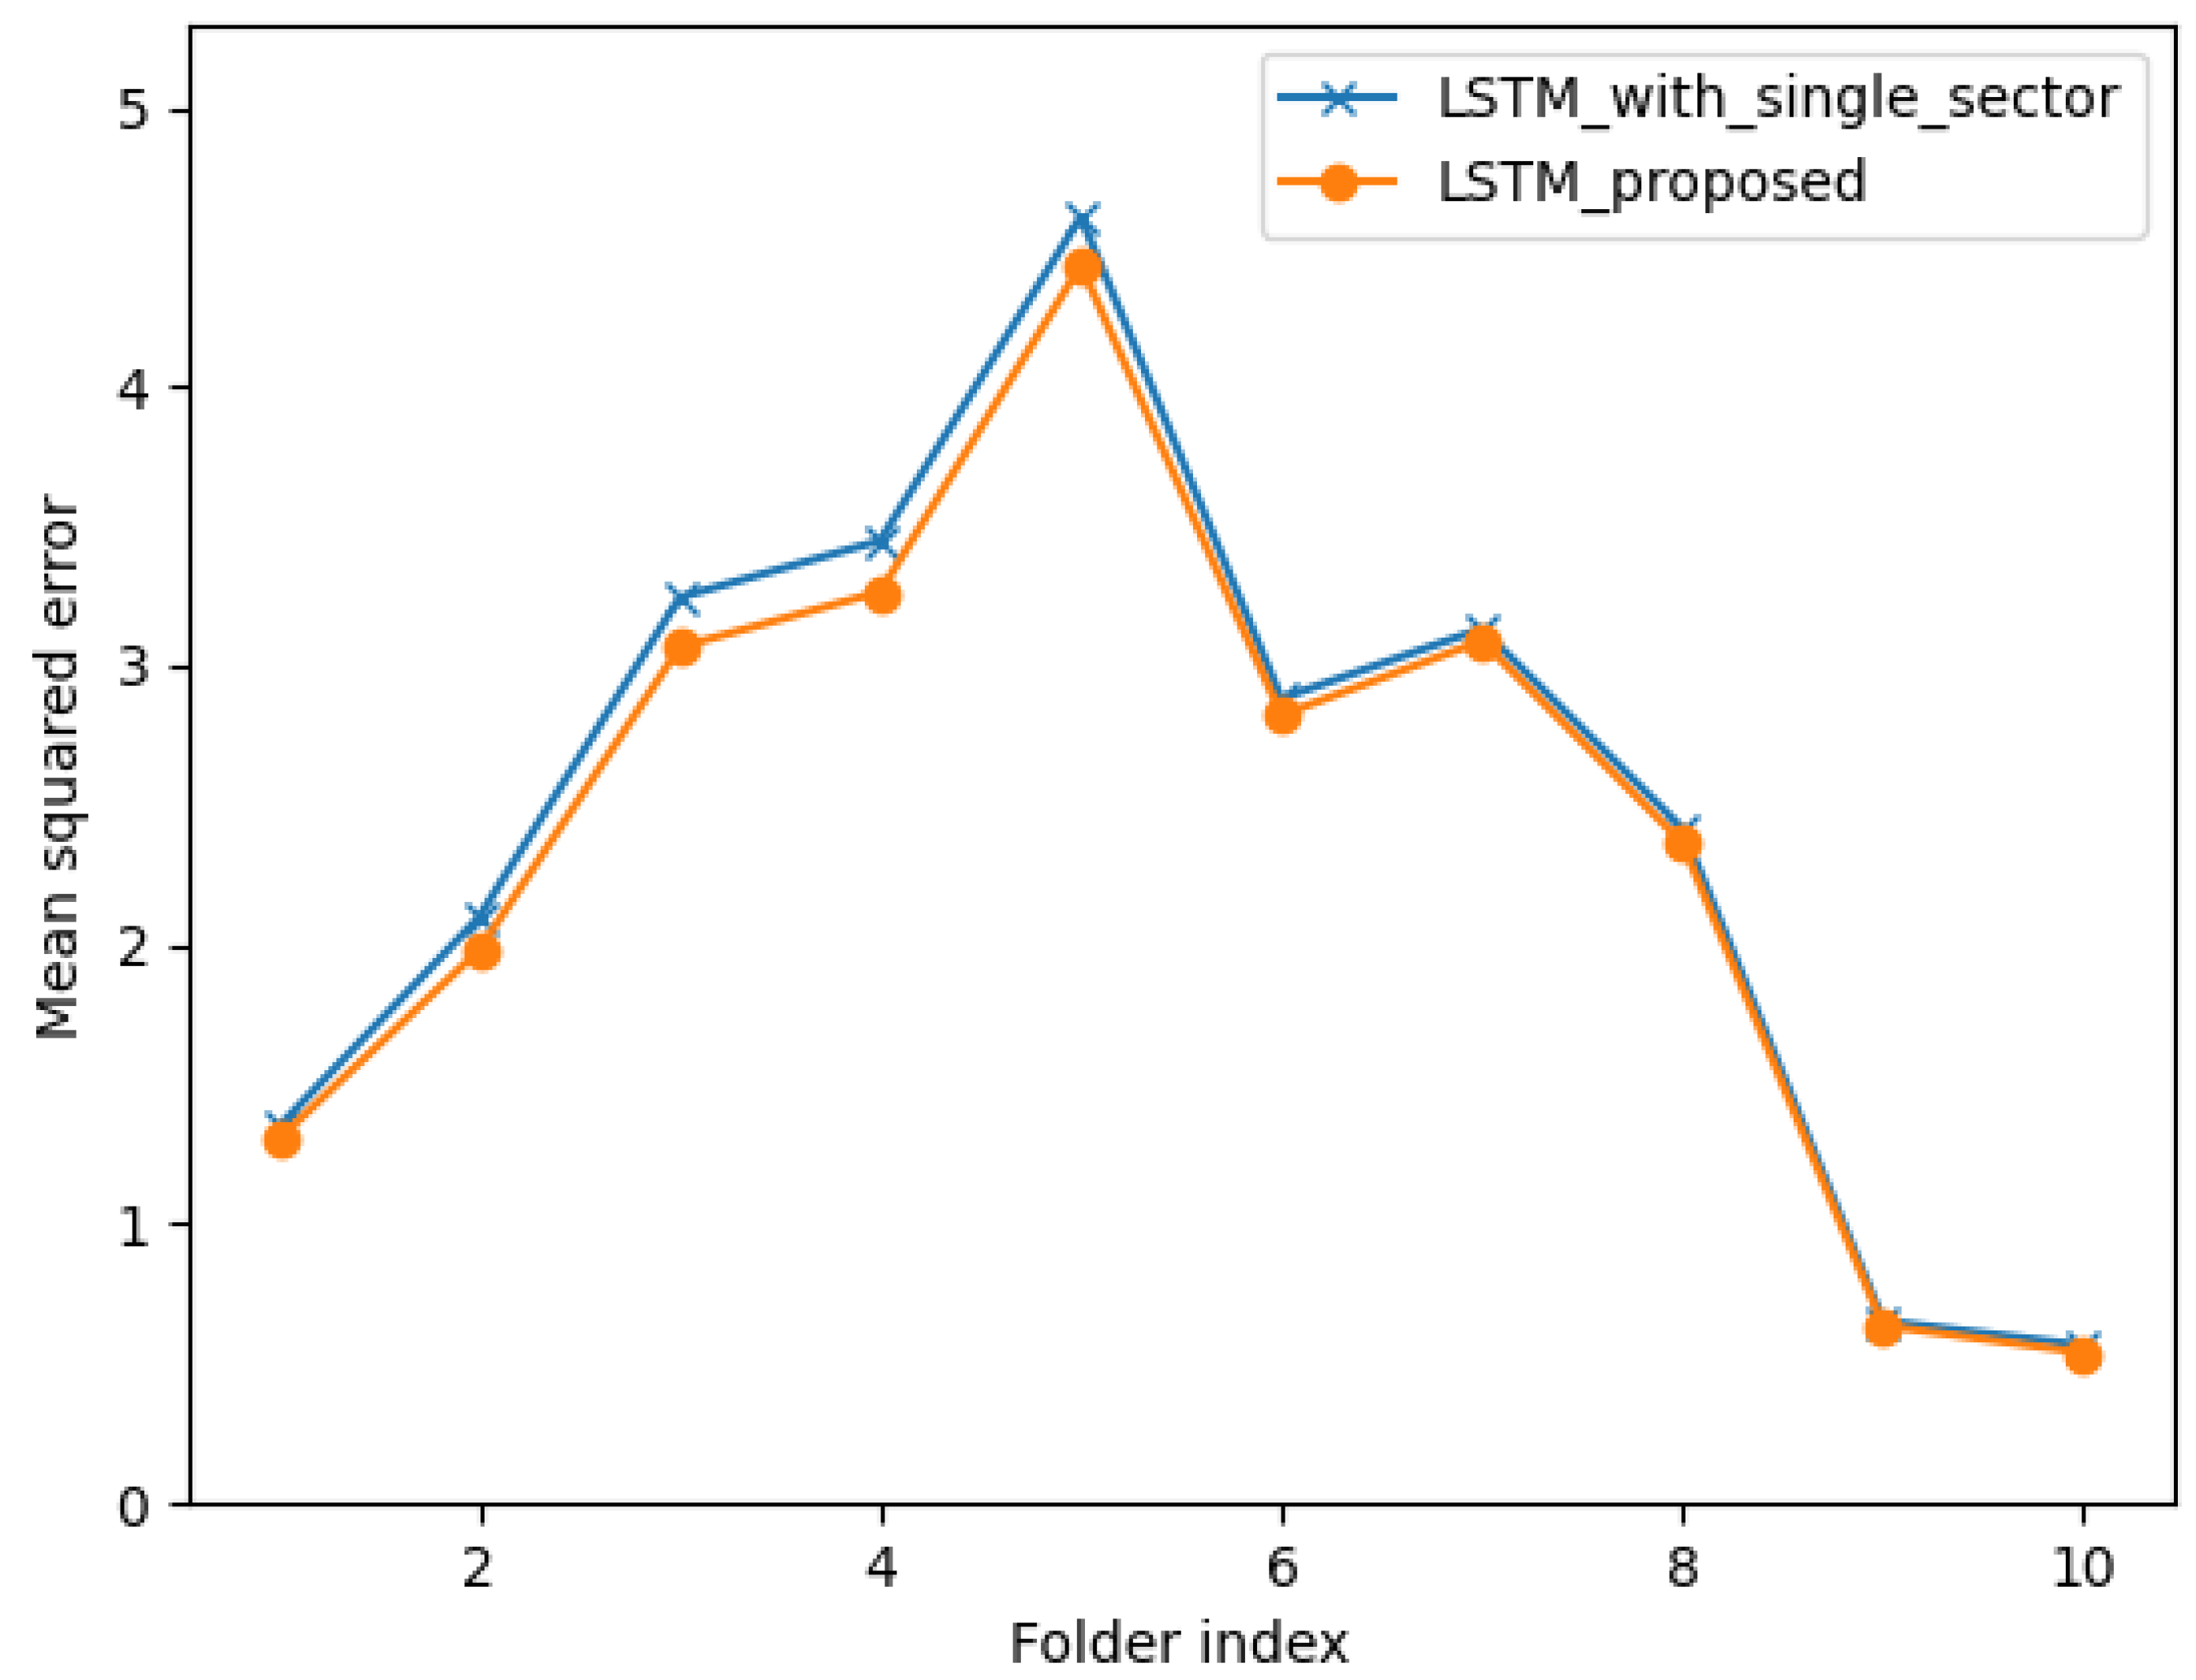
Figure 12 presents the performance results on different folders. As mentioned earlier, data were tested with 10-fold cross-validation without shuffling. This means that the test days in folder #1 correspond to the month of May, and those in folder #10 correspond to the month of December. From the results, it is evident that the error in folders #9 and #10 is relatively small, and information from adjacent sectors does not provide noticeable improvements. This is because the fall and winter months in Korea are very dry seasons with fewer clouds in the sky. In contrast, the spring and summer months are relatively rainy with more cloud cover. Therefore, the adjacent sectors’ information is expected to provide more substantial improvements concerning predictions during these months, as demonstrated by the results in folders #1 to #8.
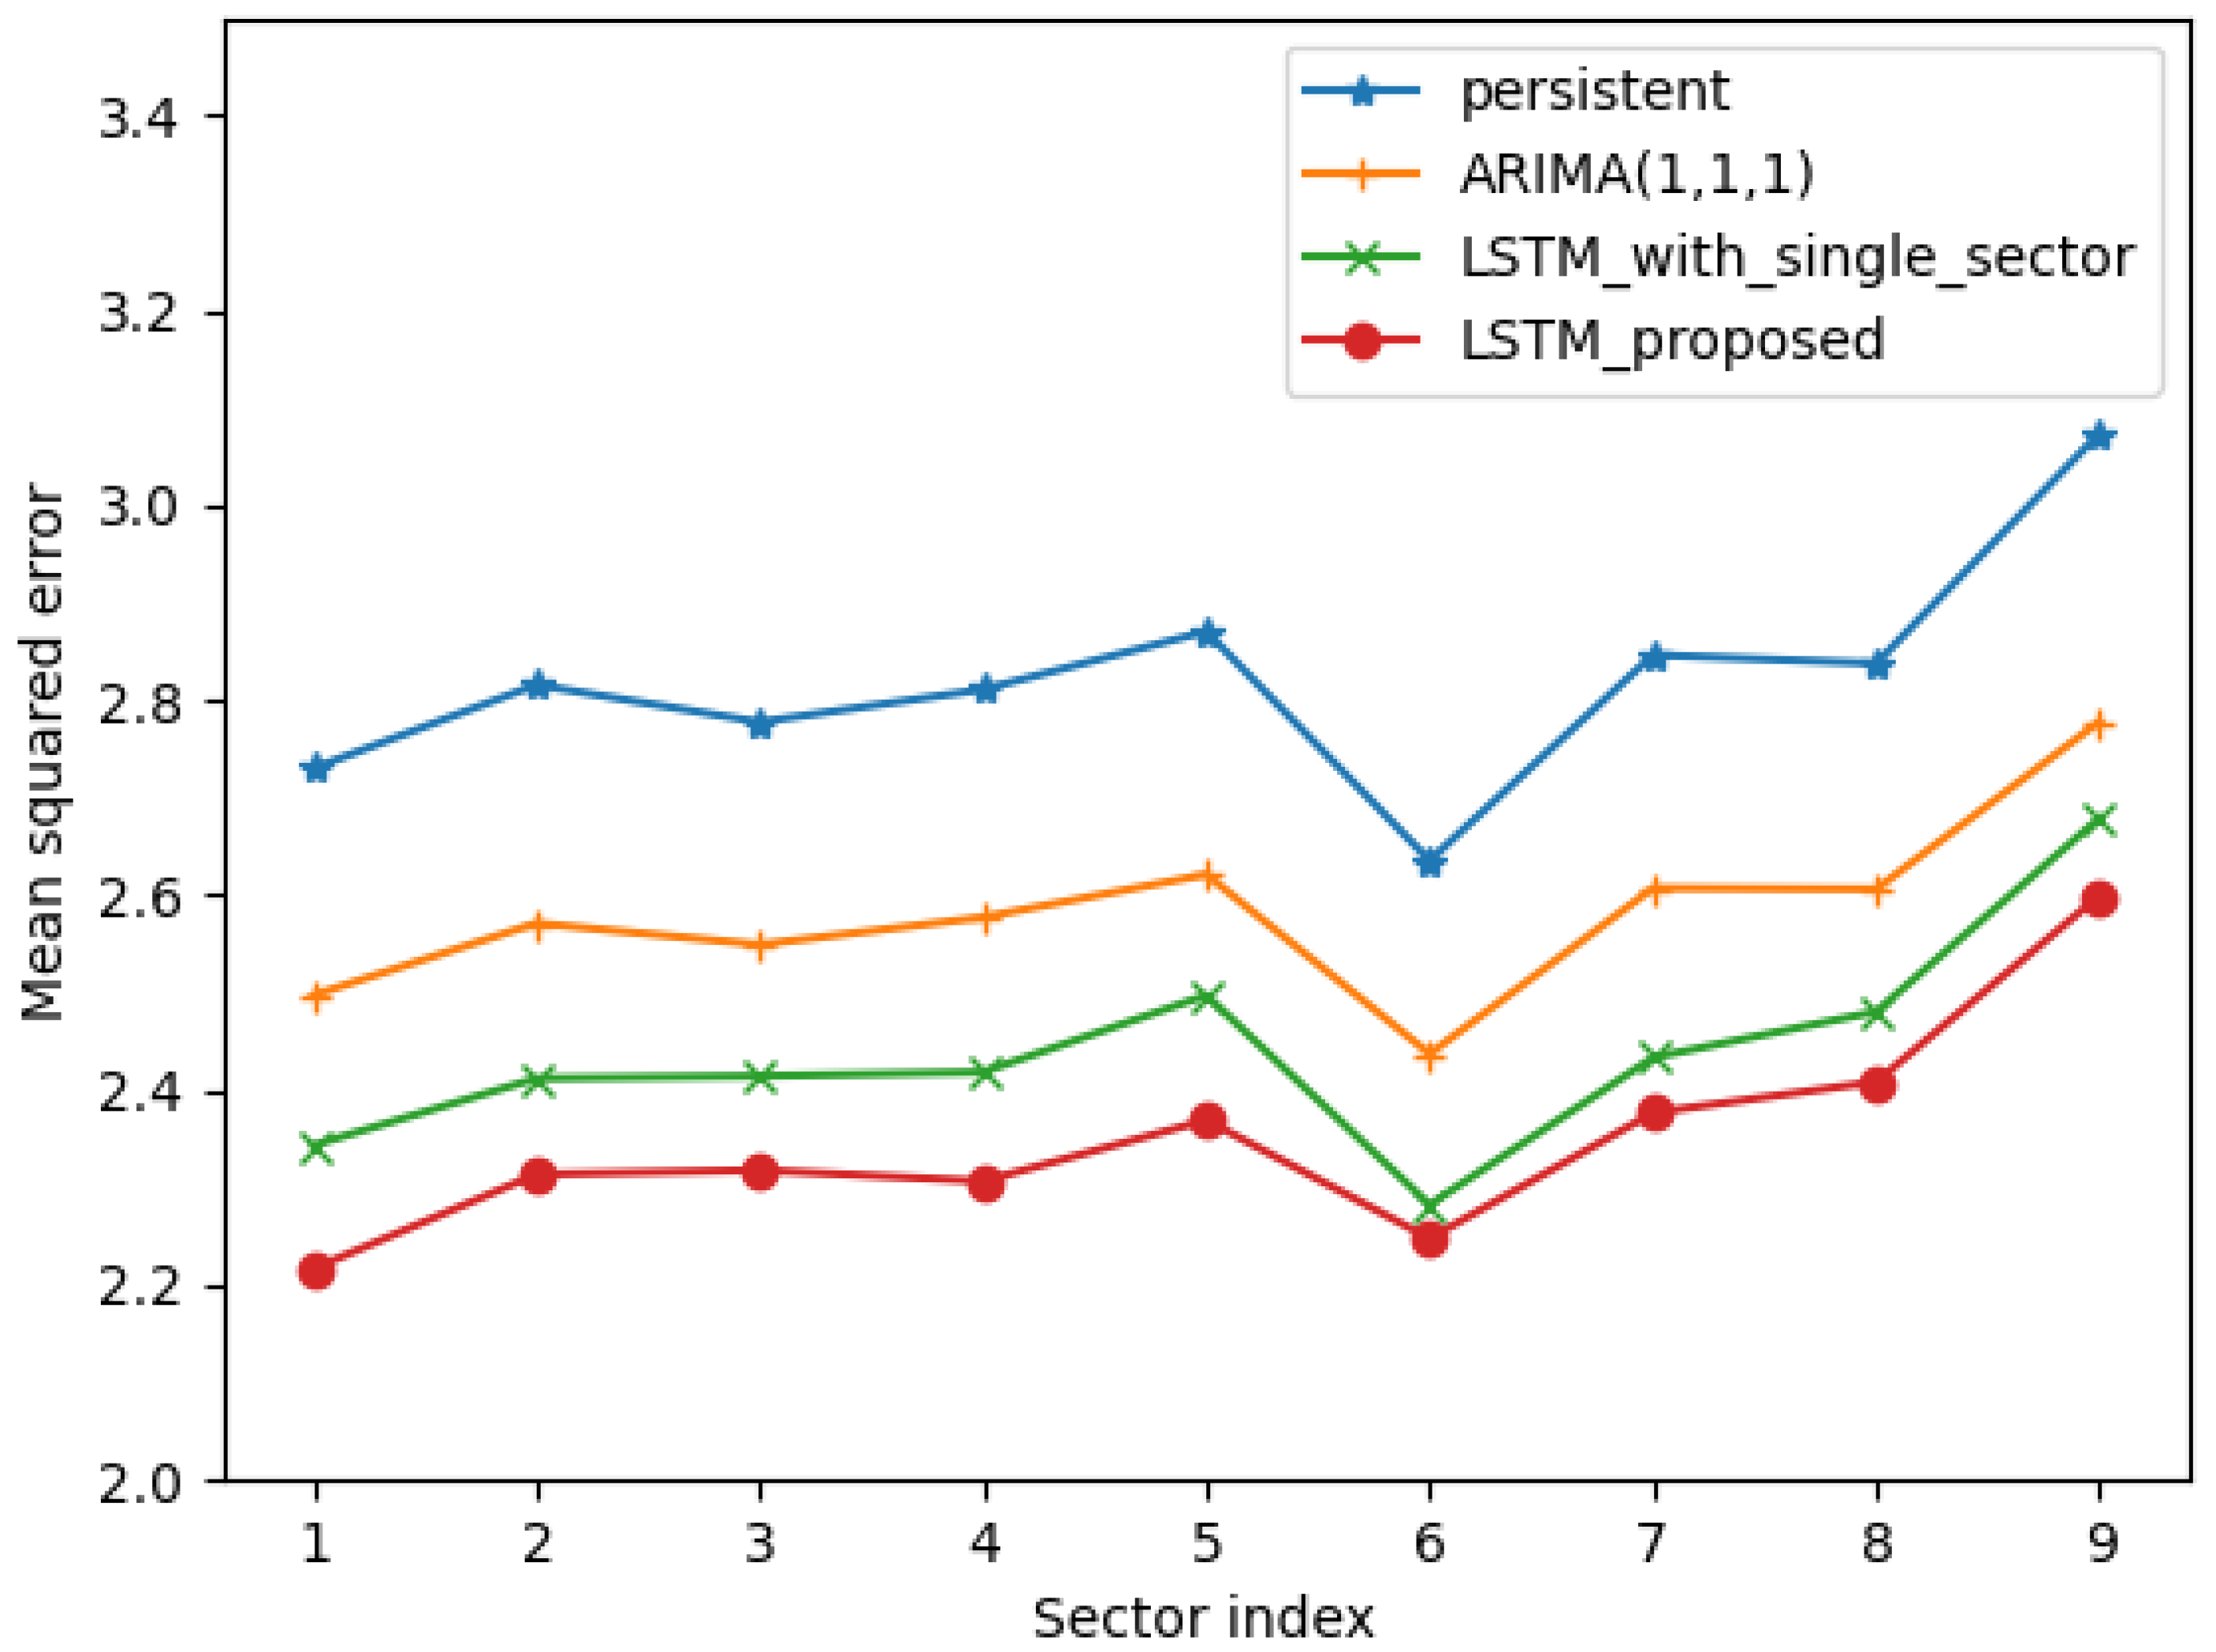
Finally, we compare the proposed model with three other models: the persistent model [40], auto-regressive integral moving average (ARIMA) model [18], and LSTM model with single-sector information. The persistent model simply predicts that the next minute’s power output is the same as the current minute’s output, without any data processing or modeling. The ARIMA model is a powerful prediction algorithm in traditional sequential data processing. The number of time steps, the number of input data dimensions, and the number of hidden nodes are set to 60, 3, and 32, respectively, based on the experiments described above.
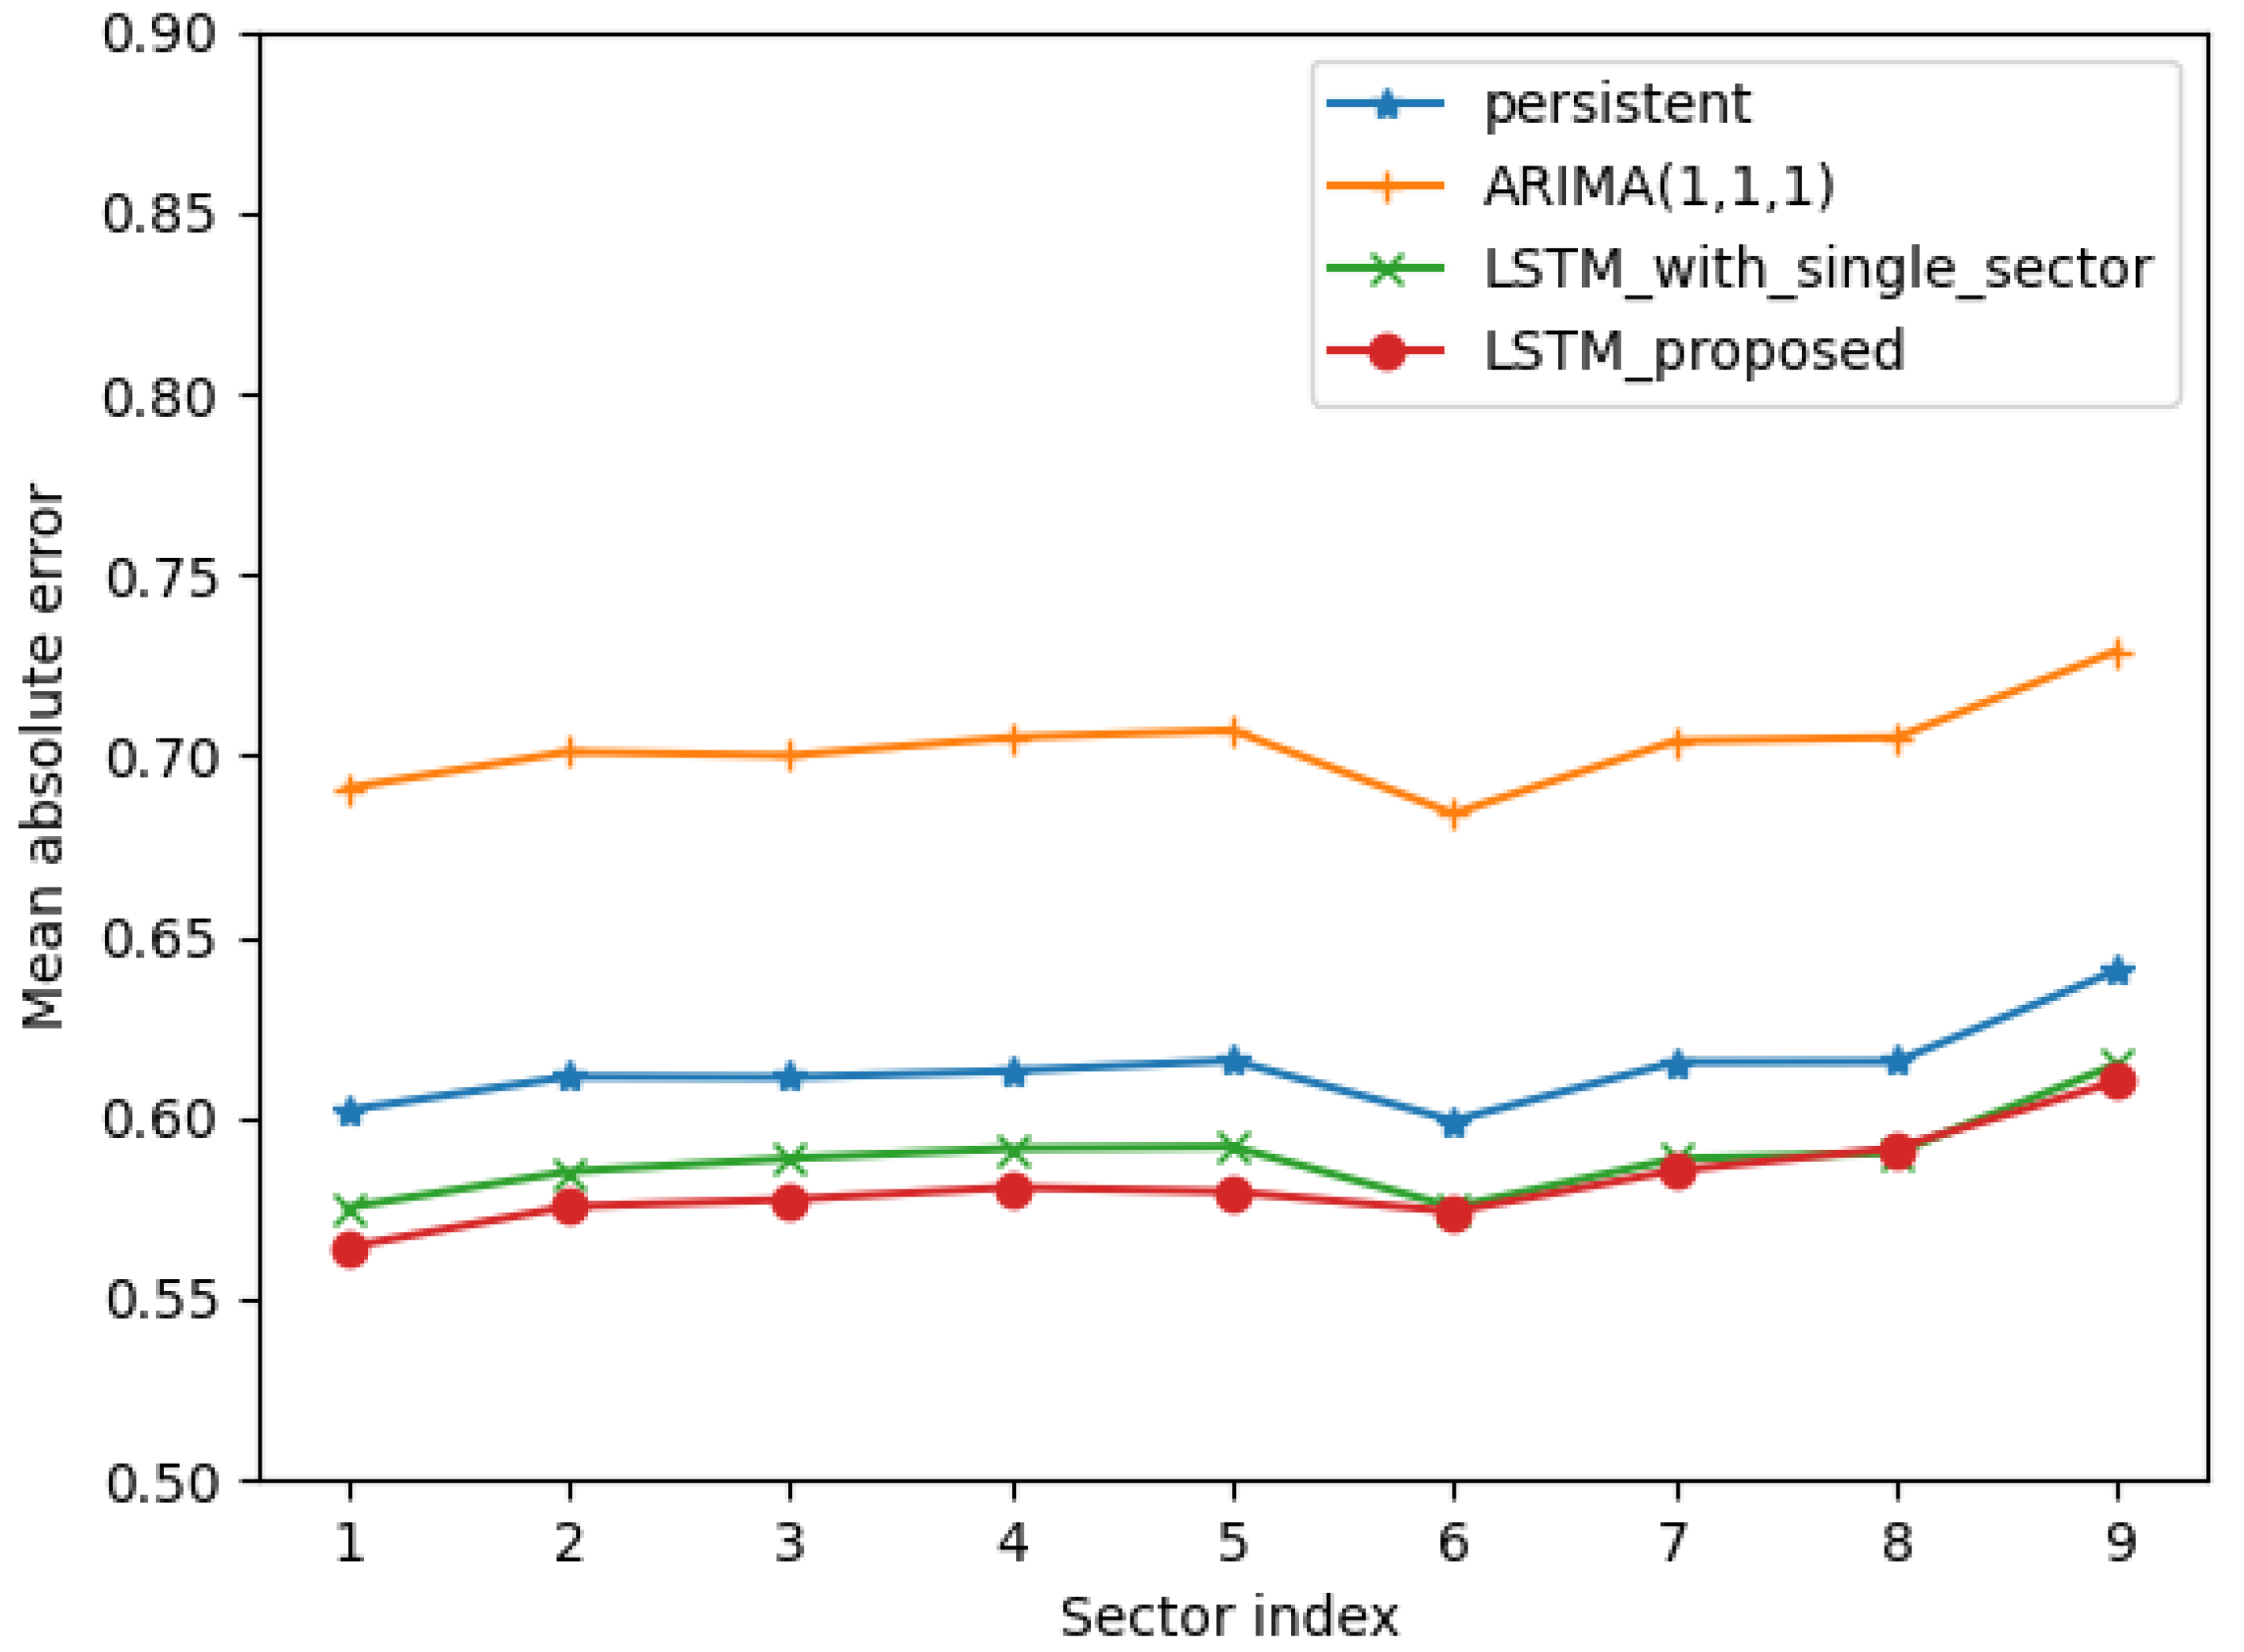
In Figure 13 and Figure 14, the mean squared error (MSE) and mean absolute error (MAE) of each sector are presented. In Figure 13, the results clearly indicate that the proposed model consistently outperforms all three comparison models for every sector. Similarly, in Figure 14, the proposed model provides improved error performance in most sectors’ predictions. From the results, it can be concluded that the adjacent sectors’ information can provide short-term environmental information, such as the movement of the cloud.
From Figure 13 and Figure 14, it is observed that the experiment with the MSE index had a more stable performance improvement compared to the MAE index. This suggests that the proposed prediction method can effectively reduce errors of greater magnitudes, as MSE weights larger errors more heavily than smaller errors. In other words, the information from adjacent PV sectors can capture the effect of clouds because substantial errors arise from significant changes in status, such as the movement of clouds, while small errors come from minor changes in status, such as the temperature, wind speed, or dust.
The results with two other relative metrics are also presented in Table 1 and Table 2. The best performance in each sector is highlighted in bold numbers. As observed in the tables, the proposed method with neighbor sector information outperforms the prediction without the neighboring sectors’ information. Exceptionally, sector #8 provides a slightly degraded MAE and mean absolute range normalized error (MARNE) value. If we further analyze the result, improvements in sectors 1 to 5 are much higher than those of sectors 6 to 9. This discrepancy can be attributed to the real site’s characteristics, where clouds tend to move from the west to east and sectors 6 to 9 may reside on the west side. The gain of the neighboring sectors’ information arises from knowing the movement of the cloud, and the sectors that first meet incoming clouds cannot acquire meaningful data regarding clouds.
The average performance improvement in the proposed method compared to the LSTM model with single-sector information is 3.66% in MSE, 1.85% in NRMSE, and 1.19% in MAE and MAPE, respectively. The improvement can be thought to be large or small depending on the viewpoint. Increasing the accuracy of ultra-short-term forecasting is not an easy task, and we believe it is a valuable difference. Furthermore, the proposed concept is usually effective where clouds exist in the sky. Because performance validation includes all days, such as sunny days, cloudy days, and rainy days, the reported improvement tends to underestimate the potential of the proposed method. The improvement can be further multiplied by testing on only cloudy days. Overall, it is certain that neighboring PV sector data can be a valuable source of information for minute-ahead forecasting scenarios.
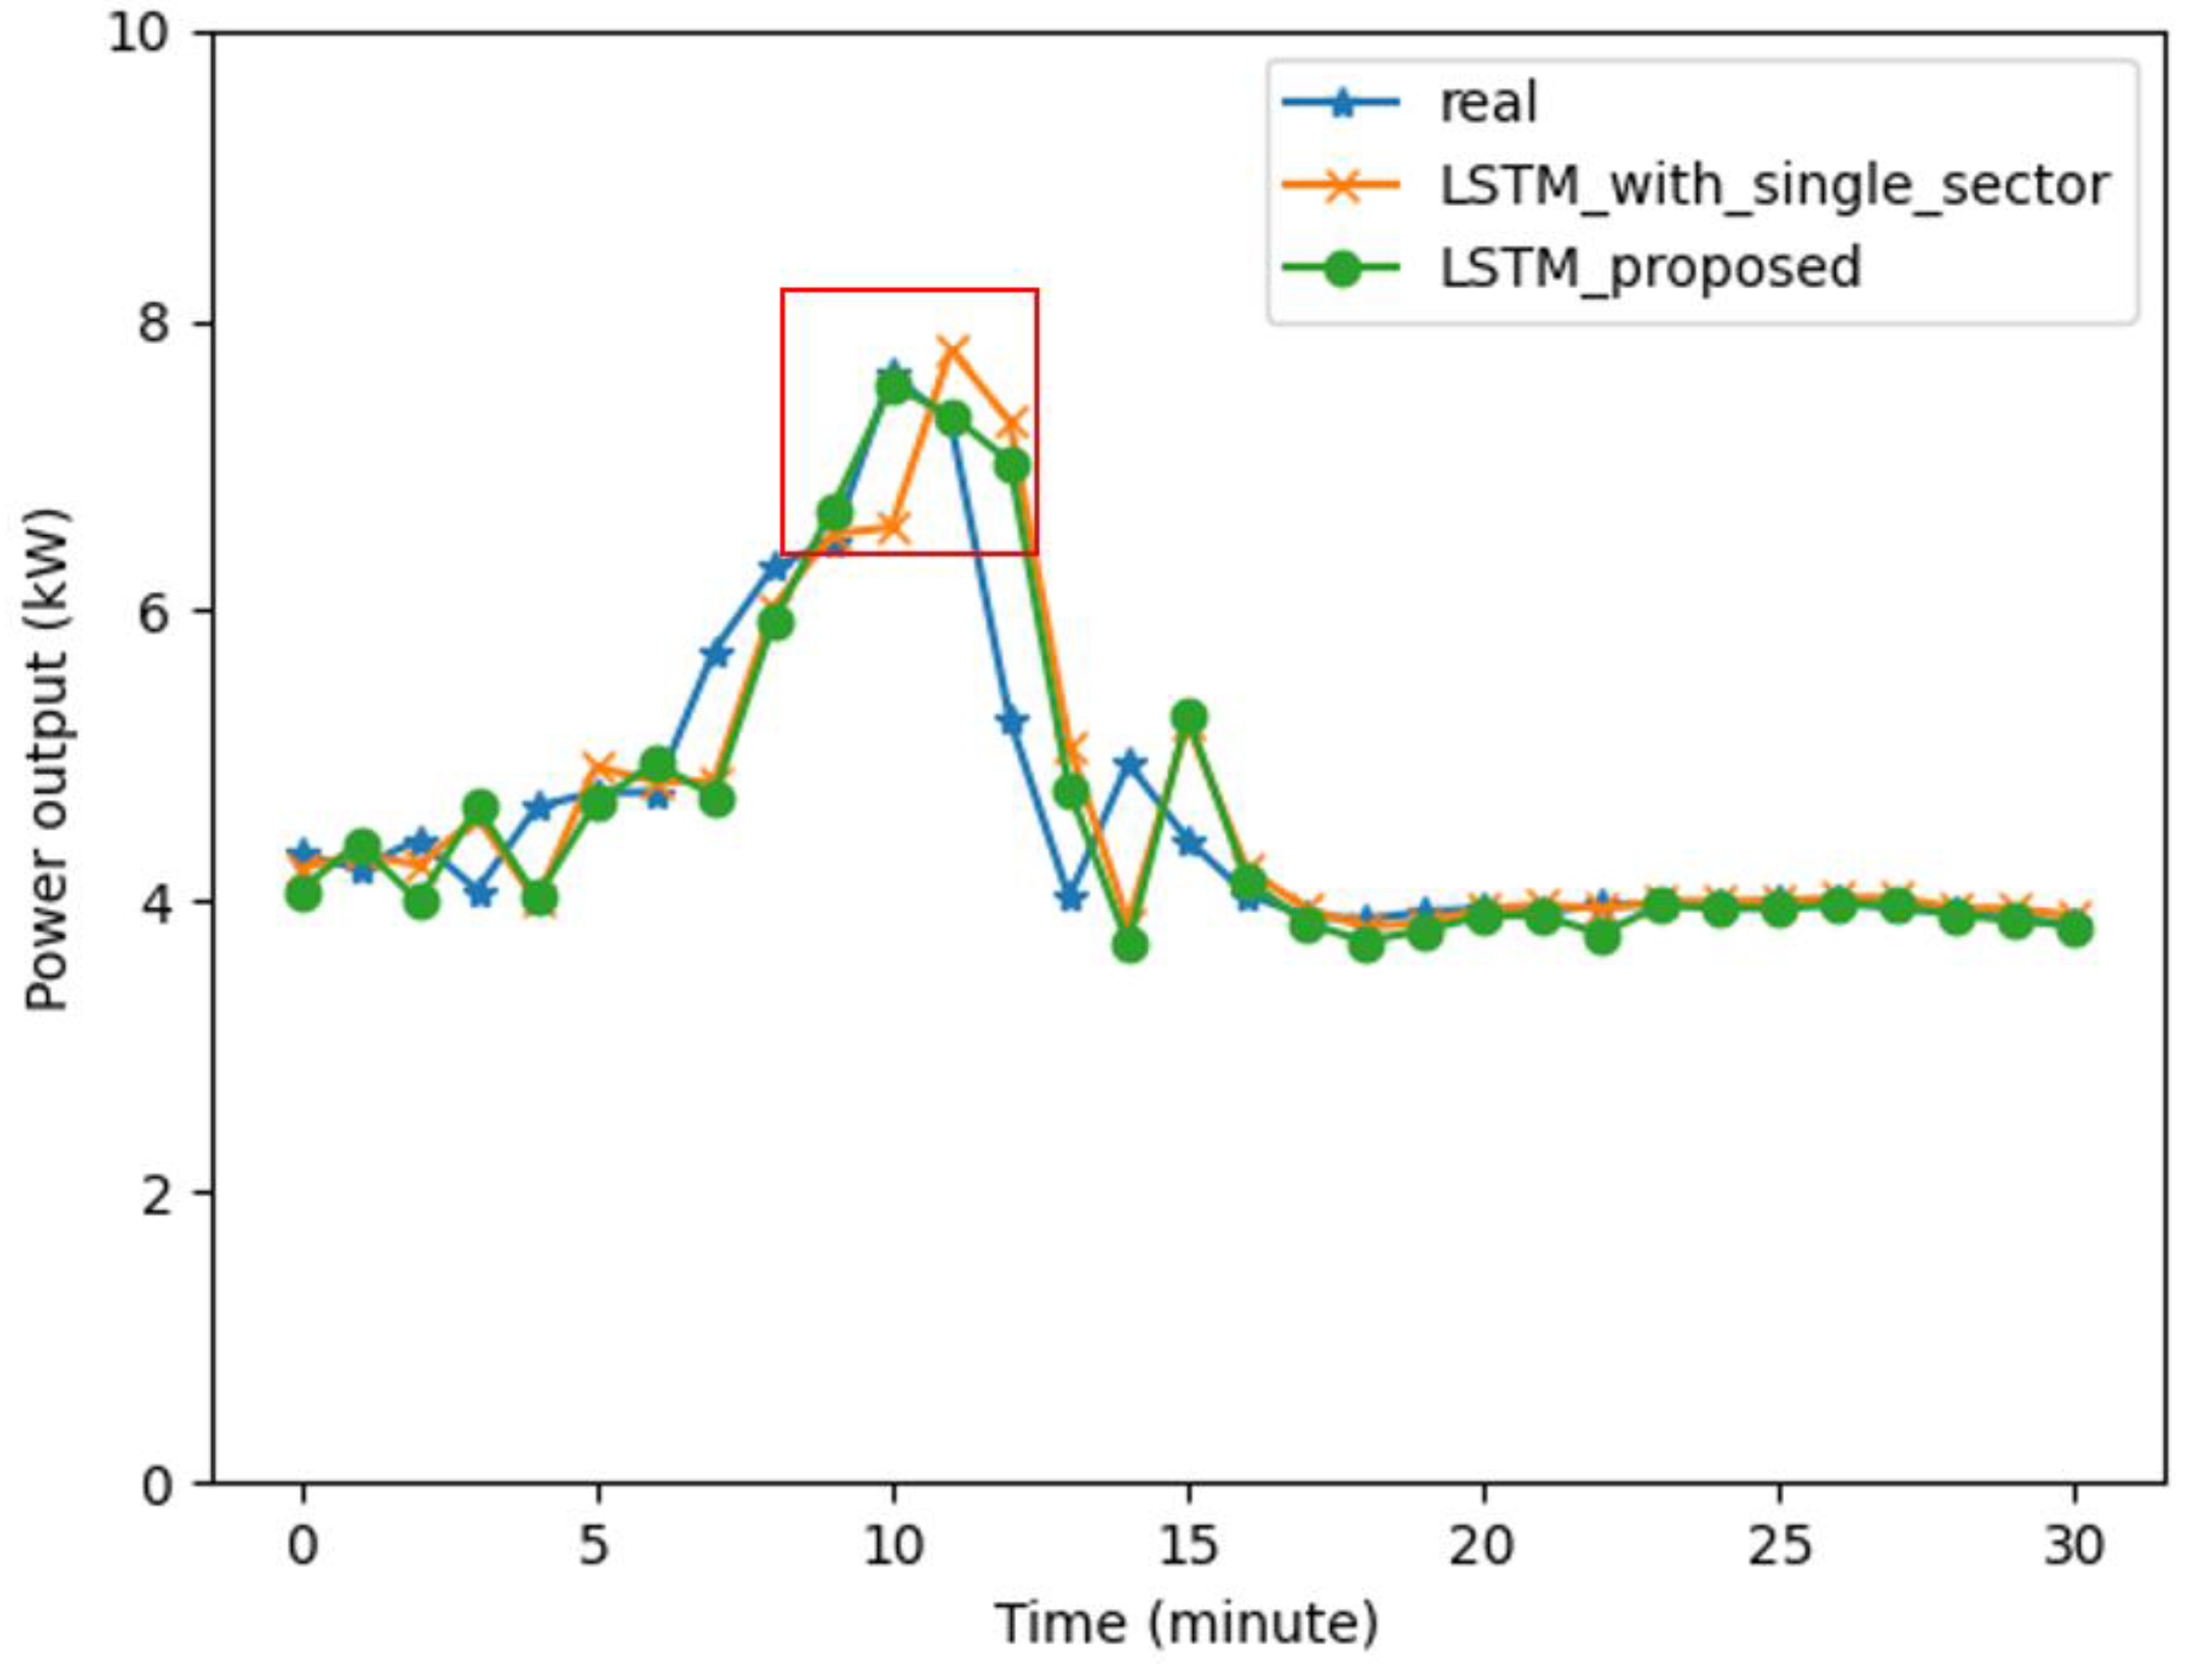
Figure 15 presents an example of minute-ahead forecasts. It is not easy to predict the next minute’s forecast when the output fluctuates significantly. Although the proposed model does not always accurately track the real power output, there are certain points where the proposed model closely follows the power output. In the highlighted red box, the proposed model with the neighboring sectors’ information predicted the peak output and anticipated a subsequent decrease in the following minute, whereas the model with single-sector information did not capture this trend. The performance can be further improved using more subdivided neighboring sectors’ data and other up-to-date recurrent network models.

5. Conclusions

The study presented in this work focused on minute-ahead PV forecasting, which is of great importance for small electricity systems, such as microgrids and voltage control systems. Cloud movement is one of the most important factors in this ultra-short-term forecasting horizon.
The authors proposed to utilize the neighboring sectors’ power output pattern to observe cloud movements because it is not easy to acquire cloud movement directly. The authors demonstrated that incorporating the neighboring sectors’ information can significantly reduce prediction errors, particularly in the presence of clouds, using real PV site data. Although PV sectors in this work are divided based on the installed inverters, this approach can be extended to each PV panel for further improvements. Neighboring PV power output data can be also utilized in other recurrent models, such as the transformer model, to provide more improved performance. In summary, it is clear that the neighboring PV sectors’ generation data must be included in the prediction model in the ultra-short-term horizon of PV forecasting.

Author Contributions

Conceptualization, J.K.; data curation, S.L.; methodology, J.L. All authors have read and agreed to the published version of the manuscript.

Funding

This work was supported by the Korea Institute of Energy Technology Evaluation and Planning (KETEP) and the Ministry of Trade, Industry & Energy (MOTIE) of the Republic of Korea (No. 2022202090010A).

Data Availability Statement

Currently, the data are not publicly available due to privacy issues of the data holder.

Conflicts of Interest

The authors declare no conflict of interest. The funders had no role in the design of the study; in the collection, analyses, or interpretation of data; in the writing of the manuscript; or in the decision to publish the results.

References

  1. Antonanzas, J.; Osorio, N.; Escobar, R.; Urraca, R.; Martinez-de-Pison, F.J.; Antonanzas-Torres, F. Review of Photovoltaic Power Forecasting. Sol. Energy 2016, 136, 78–111. [Google Scholar] [CrossRef]
  2. Blaga, R.; Sabadus, A.; Stefu, N.; Dughir, C.; Paulescu, M.; Badescu, V. A Current Perspective on the Accuracy of Incoming Solar Energy Forecasting. Prog. Energy Combust. Sci. 2019, 70, 119–144. [Google Scholar] [CrossRef]
  3. Shi, Q.; Feng, W.; Zhang, Q.; Wang, X.; Li, F. Overvoltage Mitigation through Volt-Var Control of Distributed PV Systems. In Proceedings of the 2020 IEEE/PES Transmission and Distribution Conference and Exposition (T&D), Chicago, IL, USA, 12–15 October 2020; IEEE: Piscataway, NJ, USA; pp. 1–5. [Google Scholar]
  4. News, Josun Biz (In Korean). Available online: https://biz.chosun.com/policy/policy_sub/2023/04/25/WG7AH55FDFGUFI4K65GJGQSB3E/?utm_source=naver&utm_medium=original&utm_campaign=biz (accessed on 27 April 2023).
  5. Lin, K.-P.; Pai, P.-F. Solar Power Output Forecasting Using Evolutionary Seasonal Decomposition Least-Square Support Vector Regression. J. Clean. Prod. 2016, 134, 456–462. [Google Scholar] [CrossRef]
  6. Yang, D. Choice of Clear-Sky Model in Solar Forecasting. J. Renew. Sustain. Energy 2020, 12, 026101. [Google Scholar] [CrossRef]
  7. Pan, M.; Li, C.; Gao, R.; Huang, Y.; You, H.; Gu, T.; Qin, F. Photovoltaic Power Forecasting Based on a Support Vector Machine with Improved Ant Colony Optimization. J. Clean. Prod. 2020, 277, 123948. [Google Scholar] [CrossRef]
  8. Hochreiter, S.; Schmidhuber, J. Long Short-Term Memory. Neural Comput. 1997, 9, 1735–1780. [Google Scholar] [CrossRef] [PubMed]
  9. Hossain, M.S.; Mahmood, H. Short-Term Photovoltaic Power Forecasting Using an LSTM Neural Network and Synthetic Weather Forecast. IEEE Access 2020, 8, 172524–172533. [Google Scholar] [CrossRef]
  10. Kothona, D.; Panapakidis, I.P.; Christoforidis, G.C. A Novel Hybrid Ensemble LSTM-FFNN Forecasting Model for Very Short-Term and Short-Term PV Generation Forecasting. IET Renew. Power Gener. 2022, 16, 3–18. [Google Scholar] [CrossRef]
  11. López Santos, M.; García-Santiago, X.; Echevarría Camarero, F.; Blázquez Gil, G.; Carrasco Ortega, P. Application of Temporal Fusion Transformer for Day-Ahead PV Power Forecasting. Energies 2022, 15, 5232. [Google Scholar] [CrossRef]
  12. Ahmed, R.; Sreeram, V.; Mishra, Y.; Arif, M.D. A Review and Evaluation of the State-of-the-Art in PV Solar Power Forecasting: Techniques and Optimization. Renew. Sustain. Energy Rev. 2020, 124, 109792. [Google Scholar] [CrossRef]
  13. Gupta, P.; Singh, R. PV Power Forecasting Based on Data-Driven Models: A Review. Int. J. Sustain. Eng. 2021, 14, 1733–1755. [Google Scholar] [CrossRef]
  14. Alkhayat, G.; Mehmood, R. A Review and Taxonomy of Wind and Solar Energy Forecasting Methods Based on Deep Learning. Energy AI 2021, 4, 100060. [Google Scholar] [CrossRef]
  15. Tina, G.M.; Ventura, C.; Ferlito, S.; De Vito, S. A State-of-Art-Review on Machine-Learning Based Methods for PV. Appl. Sci. 2021, 11, 7550. [Google Scholar] [CrossRef]
  16. Ogliari, E.; Dolara, A.; Manzolini, G.; Leva, S. Physical and Hybrid Methods Comparison for the Day Ahead PV Output Power Forecast. Renew. Energy 2017, 113, 11–21. [Google Scholar] [CrossRef]
  17. Li, Y.; He, Y.; Su, Y.; Shu, L. Forecasting the Daily Power Output of a Grid-Connected Photovoltaic System Based on Multivariate Adaptive Regression Splines. Appl. Energy 2016, 180, 392–401. [Google Scholar] [CrossRef]
  18. Box, G.E.P.; Jenkins, G.M.; Reinsel, G.C.; Ljung, G.M. Time Series Analysis: Forecasting and Control; John Wiley & Sons: Hoboken, NJ, USA, 1970; ISBN 978-1-118-67492-5. [Google Scholar]
  19. Liu, Z.-F.; Li, L.-L.; Tseng, M.-L.; Lim, M.K. Prediction Short-Term Photovoltaic Power Using Improved Chicken Swarm Optimizer-Extreme Learning Machine Model. J. Clean. Prod. 2020, 248, 119272. [Google Scholar] [CrossRef]
  20. Zhou, Y.; Zhou, N.; Gong, L.; Jiang, M. Prediction of Photovoltaic Power Output Based on Similar Day Analysis, Genetic Algorithm and Extreme Learning Machine. Energy 2020, 204, 117894. [Google Scholar] [CrossRef]
  21. Dewangan, C.L.; Singh, S.N.; Chakrabarti, S. Combining Forecasts of Day-Ahead Solar Power. Energy 2020, 202, 117743. [Google Scholar] [CrossRef]
  22. Yin, W.; Han, Y.; Zhou, H.; Ma, M.; Li, L.; Zhu, H. A Novel Non-Iterative Correction Method for Short-Term Photovoltaic Power Forecasting. Renew. Energy 2020, 159, 23–32. [Google Scholar] [CrossRef]
  23. Sharadga, H.; Hajimirza, S.; Balog, R.S. Time Series Forecasting of Solar Power Generation for Large-Scale Photovoltaic Plants. Renew. Energy 2020, 150, 797–807. [Google Scholar] [CrossRef]
  24. Jallal, M.A.; Chabaa, S.; Zeroual, A. A Novel Deep Neural Network Based on Randomly Occurring Distributed Delayed PSO Algorithm for Monitoring the Energy Produced by Four Dual-Axis Solar Trackers. Renew. Energy 2020, 149, 1182–1196. [Google Scholar] [CrossRef]
  25. Korea Energy Market Operation Protocol, Korea power exchanage: Naju, Jeollanam-do, Korea. Available online: https://www.kpx.or.kr/board.es?mid=a11002010000&bid=0030&act=view&list_no=69371 (accessed on 10 May 2023). (In Korean).
  26. Rana, M.; Koprinska, I.; Agelidis, V.G. Univariate and Multivariate Methods for Very Short-Term Solar Photovoltaic Power Forecasting. Energy Convers. Manag. 2016, 121, 380–390. [Google Scholar] [CrossRef]
  27. Sheng, H.; Xiao, J.; Cheng, Y.; Ni, Q.; Wang, S. Short-Term Solar Power Forecasting Based on Weighted Gaussian Process Regression. IEEE Trans. Ind. Electron. 2018, 65, 300–308. [Google Scholar] [CrossRef]
  28. Huang, J.; Khan, M.M.; Qin, Y.; West, S. Hybrid Intra-Hour Solar PV Power Forecasting Using Statistical and Skycam-Based Methods. In Proceedings of the 2019 IEEE 46th Photovoltaic Specialists Conference (PVSC), Chicago, IL, USA, 16–21 June 2019; pp. 2434–2439. [Google Scholar]
  29. De Giorgi, M.G.; Congedo, P.M.; Malvoni, M. Photovoltaic Power Forecasting Using Statistical Methods: Impact of Weather Data. IET Sci. Meas. Amp Technol. 2014, 8, 90–97. [Google Scholar] [CrossRef]
  30. Das, U.K.; Tey, K.S.; Seyedmahmoudian, M.; Mekhilef, S.; Idris, M.Y.I.; Van Deventer, W.; Horan, B.; Stojcevski, A. Forecasting of Photovoltaic Power Generation and Model Optimization: A Review. Renew. Sustain. Energy Rev. 2018, 81, 912–928. [Google Scholar] [CrossRef]
  31. Peng, Z.; Yu, D.; Huang, D.; Heiser, J.; Yoo, S.; Kalb, P. 3D Cloud Detection and Tracking System for Solar Forecast Using Multiple Sky Imagers. Sol. Energy 2015, 118, 496–519. [Google Scholar] [CrossRef] [Green Version]
  32. Al-Dahidi, S.; Ayadi, O.; Alrbai, M.; Adeeb, J. Ensemble Approach of Optimized Artificial Neural Networks for Solar Photovoltaic Power Prediction. IEEE Access 2019, 7, 81741–81758. [Google Scholar] [CrossRef]
  33. Wang, F.; Zhen, Z.; Liu, C.; Mi, Z.; Hodge, B.-M.; Shafie-khah, M.; Catalão, J.P.S. Image Phase Shift Invariance Based Cloud Motion Displacement Vector Calculation Method for Ultra-Short-Term Solar PV Power Forecasting. Energy Convers. Manag. 2018, 157, 123–135. [Google Scholar] [CrossRef]
  34. Yang, C.; Thatte, A.A.; Xie, L. Multitime-Scale Data-Driven Spatio-Temporal Forecast of Photovoltaic Generation. IEEE Trans. Sustain. Energy 2015, 6, 104–112. [Google Scholar] [CrossRef]
  35. Agoua, X.G.; Girard, R.; Kariniotakis, G. Short-Term Spatio-Temporal Forecasting of Photovoltaic Power Production. IEEE Trans. Sustain. Energy 2018, 9, 538–546. [Google Scholar] [CrossRef] [Green Version]
  36. Kashyap, Y.; Bansal, A.; Sao, A.K. Spatial Approach of Artificial Neural Network for Solar Radiation Forecasting: Modeling Issues. J. Sol. Energy 2015, 2015, 1–13. [Google Scholar] [CrossRef] [Green Version]
  37. Jeong, J.; Kim, H. Multi-Site Photovoltaic Forecasting Exploiting Space-Time Convolutional Neural Network. Energies 2019, 12, 4490. [Google Scholar] [CrossRef] [Green Version]
  38. Holmgren, W.F.; Hansen, C.W.; Mikofski, M.A. Pvlib Python: A Python Package for Modeling Solar Energy Systems. J. Open Source Softw. 2018, 3, 884. [Google Scholar] [CrossRef] [Green Version]
  39. Kingma, D.P.; Ba, J. Adam: A Method for Stochastic Optimization. arXiv 2014, arXiv:1412.6980. [Google Scholar]
  40. Nelson, C.R.; Plosser, C.R. Trends and Random Walks in Macroeconmic Time Series: Some Evidence and Implications. J. Monet. Econ. 1982, 10, 139–162. [Google Scholar] [CrossRef]
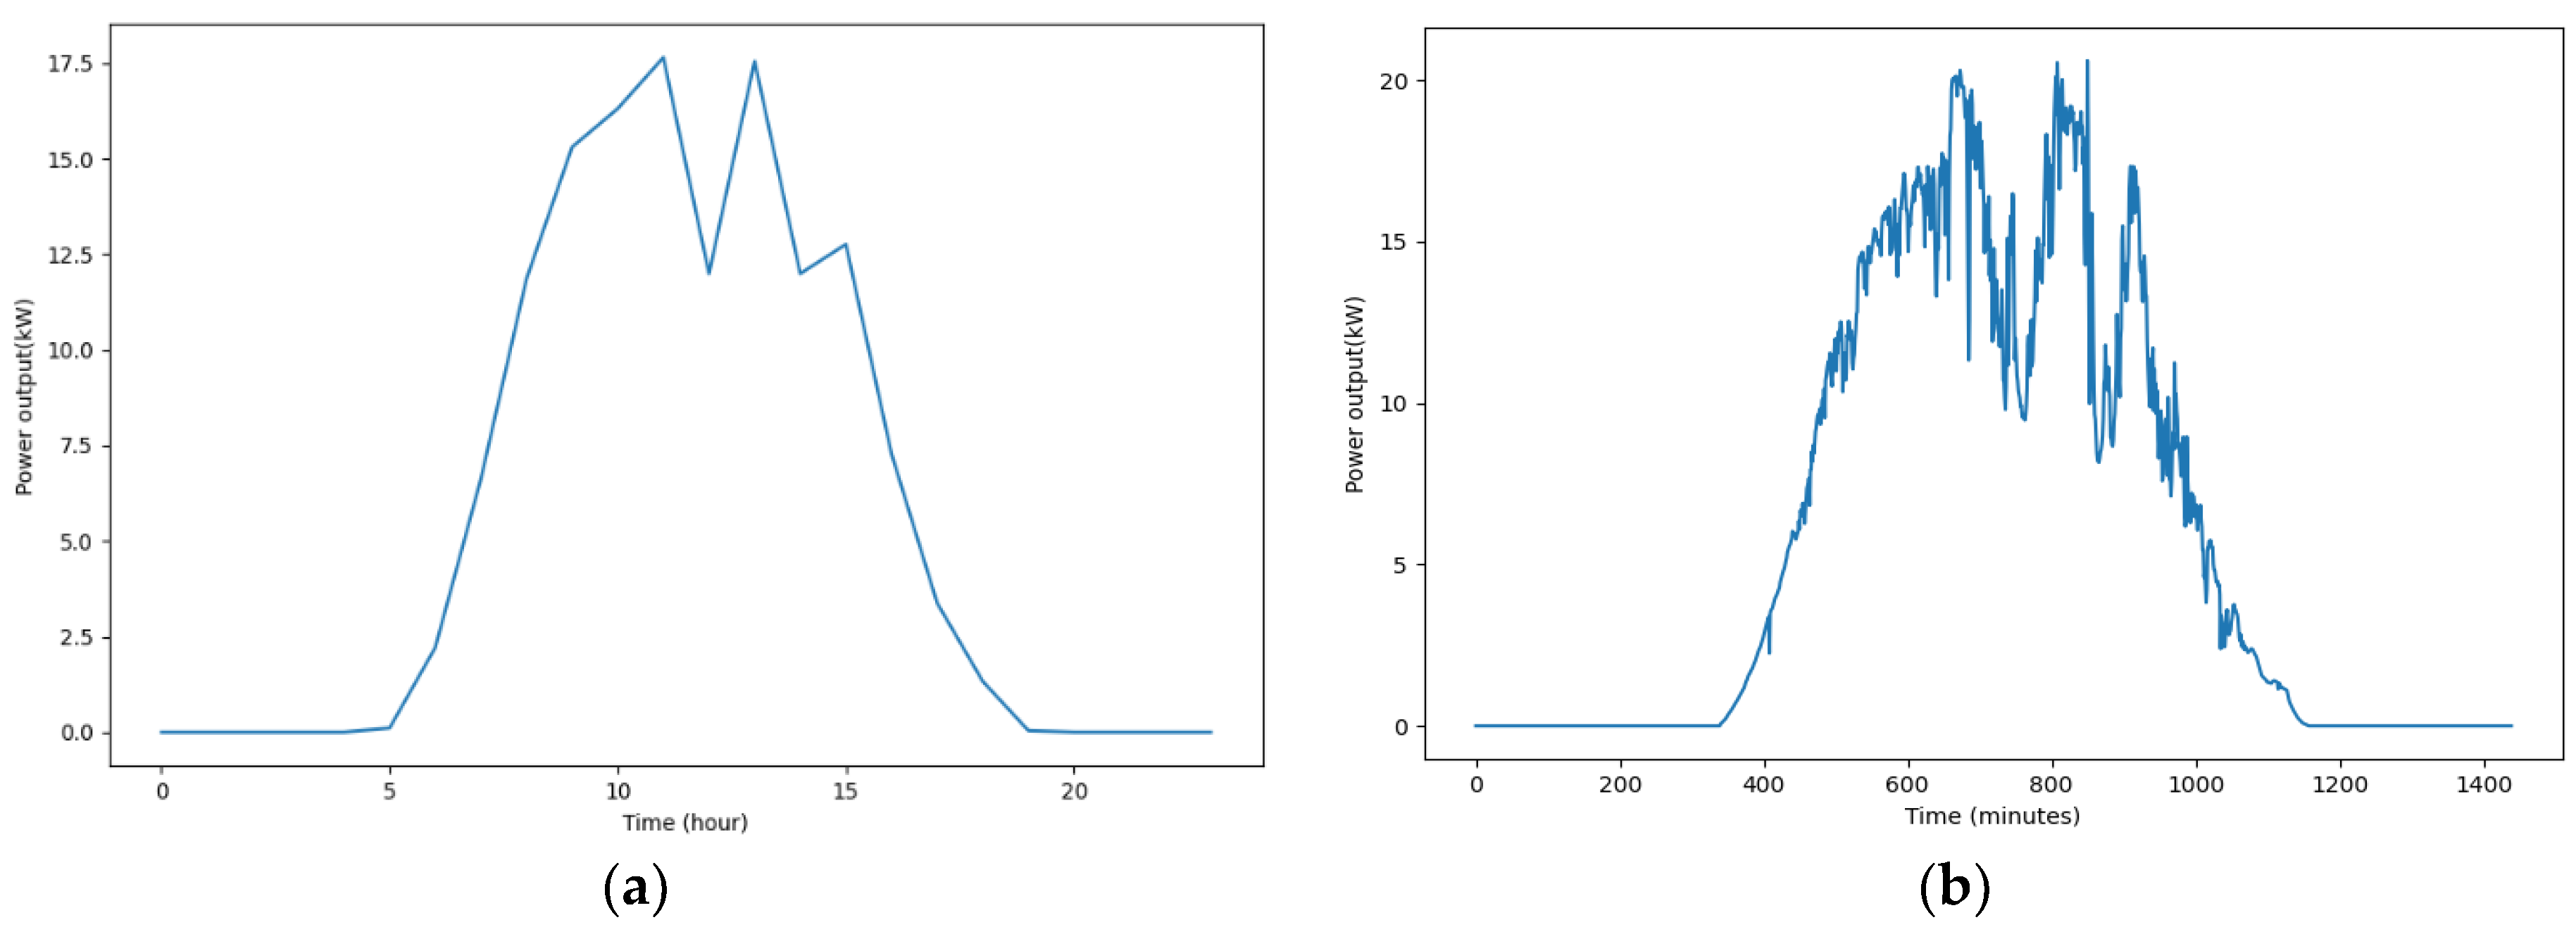
Figure 1. Power output of a sector in a PV site: (a) hour scale; (b) minute scale.
Energies 16 04905 g001
Figure 2. Minute-scale power output for different weather conditions. (a) Sunny day and cloud cover index = 0.0; (b) rainy day and cloud cover index = 9.9; (c) cloudy day and cloud cover index = 4.4; (d) cloudy day and cloud cover index = 7.6.
Energies 16 04905 g002
Figure 3. An example PV site, which is composed of 6 PV sectors.
Energies 16 04905 g003
Figure 4. Two-layer many-to-one LSTM model.
Energies 16 04905 g004
Figure 5. Structure of an LSTM cell.
Energies 16 04905 g005
Figure 6. Input and output data of LSTM network with a single sector.
Energies 16 04905 g006
Figure 7. Input data of LSTM network incorporating neighbor sectors’ information.
Energies 16 04905 g007
Figure 8. Picture of the test PV generation site.
Energies 16 04905 g008
Figure 9. Prediction error of different LSTM time steps.
Energies 16 04905 g009
Figure 10. Prediction error of different LSTM input dimensions.
Energies 16 04905 g010
Figure 11. Prediction error of a different number of hidden nodes.
Energies 16 04905 g011
Figure 12. Prediction error of different folders.
Energies 16 04905 g012
Figure 13. Mean squared error of minute-ahead predictions for each PV sector.
Energies 16 04905 g013
Figure 14. Mean absolute error of minute-ahead predictions for each PV sector.
Energies 16 04905 g014
Figure 15. Result of minute-ahead forecasts.
Energies 16 04905 g015
Table 1. Normalized root mean squared error (NRMSE *) of minute-ahead predictions.
PersistentARIMA (1,1,1)LSTM_with_Single_SectorLSTM_Proposed
Sector #10.0659810.0631070.0611310.059457
Sector #20.0667970.0638310.0618230.060548
Sector #30.0663680.0635830.0618790.060629
Sector #40.0669530.0641100.0621040.060649
Sector #50.0676590.0646550.0631080.061468
Sector #60.0647020.0622200.0602130.059754
Sector #70.0673470.0644560.0622700.061541
Sector #80.0672440.0644440.0628710.061952
Sector #90.0699870.0665360.0653400.064362
Average0.0670040.0641040.0623040.061151
* NRMSE = M S E m a x R e a l   V a l u e .
Table 2. Mean absolute range normalized error (MARNE *) of minute-ahead predictions.
PersistentARIMA (1,1,1)LSTM_with_Single_SectorLSTM_Proposed
Sector #10.0240440.0275960.022970.022535
Sector #20.0243370.0279060.0232940.022909
Sector #30.024340.0278770.0234490.022996
Sector #40.0244780.0281550.0236240.023194
Sector #50.0245930.0282350.0236440.023146
Sector #60.0238820.0272620.0229300.022882
Sector #70.0245650.0281040.0235000.023370
Sector #80.0245700.0281440.0235660.023619
Sector #90.0255790.0291020.0245470.024357
Average0.0244870.0280420.0235030.023223
* MARNE = M A E m a x R e a l   V a l u e .
Disclaimer/Publisher’s Note: The statements, opinions and data contained in all publications are solely those of the individual author(s) and contributor(s) and not of MDPI and/or the editor(s). MDPI and/or the editor(s) disclaim responsibility for any injury to people or property resulting from any ideas, methods, instructions or products referred to in the content.