Article

Efficiency Enhancement of the Single Line Multi-Stage Gasification of Hungarian Low-Rank Coal: Effects of Gasification Temperature and Steam/Carbon (S/C) Ratio

1
Institute of Energy, Ceramics and Polymer Technology, Faculty of Materials and Chemical Engineering, University of Miskolc, Miskolc-Egyetemváros, 3515 Miskolc, Hungary
2
Institute of Energy and Chemical Engineering, Faculty of Mechanical Engineering and Informatics, University of Miskolc, Miskolc-Egyetemváros, 3515 Miskolc, Hungary
*
Author to whom correspondence should be addressed.
Energies 2023, 16(11), 4427; https://doi.org/10.3390/en16114427
Submission received: 9 May 2023 / Revised: 23 May 2023 / Accepted: 26 May 2023 / Published: 30 May 2023
(This article belongs to the Special Issue Energy Efficiency of the Buildings II)

Abstract

:
Coal gasification is considered a promising solution for the production of synthetic fuels and eventually as a fuel for combined heat and power systems and heating buildings. There are several factors that affect the gasification efficiency and syngas quality, such as gasification parameters (temperature, pressure, etc.), reactants and their ratio, utilisation of catalysts, and gasifier design. The multi-stage gasifier is known as a promising approach in the enhancement of process efficiency, as well as the syngas quality. In this study, the Hungarian brown coal was gasified in a two-stage gasifier. The pyrolysis stage was kept at 600 °C. The gasification stage was conducted at 700, 800, and 900 °C. The steam per carbon (S/C) ratio was examined at 0.75, 1.00, and 1.25. The positive effects of increasing gasification temperature on char and dry gas yield were obviously shown at all S/C ratios. The increase in the S/C ratio did not show a positive effect at all temperature conditions, especially at 700 and 900 °C. The highest dry syngas yield was 1.14 Nm3/kgcoal obtained at 900 °C and the S/C ratio of 1.25. The increase in the gasification temperature also had a significant impact on the volume fraction of CO and CO2. Meanwhile, the syngas concentration varied slightly when the S/C ratio increased from 0.75 to 1.25. From a chemical utilization point of view, the gasification temperature at 900 °C and the S/C ratio of 1.25 resulted in the most promising H2/CO ratio of 1.99. In addition, the highest carbon conversion and cold gas efficiency were achieved at 900 °C and an S/C ratio of 1.00–1.25, respectively.

1. Introduction

Global energy is particularly dependent on fossil fuels (coal, oil, and natural gas), especially in the case of transport. Consequently, it leads to the depletion of fossil fuel resources. At the usual consumption rate, the existing reserve of oil will be exhausted within 50.6 years and 153 years for coal [1]. At present, coal is primarily used in coal-fired power plants in developing countries. Conventional coal-fired power plants have an overall energy efficiency exceeding 43%, while the combined heat and power or combined cooling, heating, and power (CCHP) systems can achieve over 60% total energy conversion efficiency [2,3]. One of the most interesting areas of research in CCHP systems is their integration with the gasification process [4,5,6,7,8].
Gasification is a complex process with several sub-processes, including dehydration, pyrolysis, reduction, and oxidation. These sub-processes can take place simultaneously with the various chemical reactions between gas-gas and gas-solid in a simple gasifier. Researchers categorize gasifiers as entrained flow, fluidized bed, and fixed bed (known as moving bed) gasifiers. Entrained flow gasifiers require fuels to be finely pulverized and gasifying agents to be fed into it under the gas phase condition, leading to strict requirements for feeding particle size, operating temperature, and pressure; consequently, they require higher input energy compared to other types of gasifiers. On the other hand, the fluidized bed gasifier suspends the fuel-gas mixing in the reaction zone, making it a popular choice for biomass due to its low average tar production. However, carbon conversion problems can arise with this gasifier type. Lastly, the fixed bed gasifier has low requirements for thermal input, an effective heat exchanger, and low gas exit temperature, as well as being easy to control [9]. Therefore, fixed bed gasifiers have found widespread use not only in the chemical production processes [10,11,12,13] and conventional combined heat and power systems but also in the field of energy efficiency in buildings [14,15,16]. It is quite difficult to achieve the optimisation conditions for each sub-process in a simple gasifier, especially in the entrained flow and fluidized bed types. Therefore, the multi-stage fixed bed gasifier with the separation of sub-processes could help to improve the optimization for the specific utilisation goal.
The multi-stage fixed bed gasification process can be categorized into single- and double-line processes [17], as shown in Figure 1. In the single-line multi-stage gasification process, there is only one stream of mass (solid and gas products) that goes through several reactors in a series or a reactor with multi-injection positions of reactants. In the double-line process, the mass stream is separated into at least two partial lines which flow through several reactors in parallel. In the case of the single-line process, there are two specific types listed as multi-air stage and multi-stage gasification process. In the case of the single-line multi-air stage gasification process, there are two or more air intakes used at different levels of a single reactor [18,19,20]. The starting material is usually pyrolysed in the first stage of the single-line multi-stage gasification process. After that, the pyrolysis products are gasified in the second stage in the presence of reactants.
Previous research on the performance of single-line multi-stage gasification can be found in the literature; however, there is a lack of information about the effects of operation parameters, pure steam as a reactant and using brown coal as the starting material for the chemical utilization point of view during the single line multi-stage gasification process. Brandt et al. [21] studied the tar reduction of biomass air-gasification in the two-stage gasifier (Viking two-stage gasifier). Firstly, the biomass fuel was pyrolyzed in an allothermal auger reactor with the exhaust heat from the flue gas of a gas engine. After that, the pyrolysis products (including pyrolysis char and gas) were transported to an autothermal downdraft fixed-bed gasifier for the partial oxidation process of volatile matter and char reduction processes, as shown in Figure 2. The air was supplied from the top of the second stage reactor, above the char bed of reduction zone for the partial oxidation process. The pyrolysis temperature was 420 and 600 °C at two different test series. While the temperature in the partial oxidation zone was 1050 and 1100 °C, respectively. Within the biomass air gasification in the two-stage gasifier, the tar content was less than 15 mg/Nm3 without heavy tar. Using the same Viking two-stage gasifier above for a long-term operation of the combined heat and power system, Ahrenfeldt et al. [22] experimented with wood chips, a range of 550–600 °C of pyrolysis temperature, and 1100–1300 °C at the oxidation zone. The experiment results showed that there were only minor amounts of naphthalene in the raw synthesis gas (0.1 mg/Nm3). The experiments were performed using the same Viking two-stage gasifier in another study [23] at 550–600 °C of pyrolysis temperature, 1150–1300 °C of oxidation temperature and an O2-CO2 mixture as a reactant. It was concluded that the synthesis gas during the O2-CO2-blown experiment gained a higher quality than the typical air-blown mode at <11 mg/Nm3 of tar content and <3 ppm of Sulphur content. From the chemical point of view, the H2/CO ratio was around 1.76 in the air-blown mode. While there was a significant increase in CO concentration due to the high CO2 concentration in the reactant, it led to a decreasing trend in the H2/CO ratio, a range of 0.8–0.89 in the case of 21%V O2-CO2-blown experiments and 1.11 ÷ 1.14 in the case of 25%V O2-CO2 blown experiments. Wang et al. [24] studied the biomass gasification process in a pilot-scale two-stage gasifier with oxygen-enriched air. During the stable operation time of the gasification process, the heat demand for the pyrolysis process was supplied from the flue gas of a syngas burner. It helped to retain the pyrolysis temperature around 350 and 450 °C. With an increase in O2 concentration, the total content of H2 and CO increased in all cases of experiments. The H2/CO ratio was around one with the O2 concentration at 50–100%V.
The main goal of this paper is to investigate the synergy effects of the temperature of the reduction stage within a specific high pyrolysis temperature and steam flow rate during the two-stage gasification process of Hungarian brown coal on gasification products distribution, synthesis gas composition, as well as the efficiency of the gasification process. This study will enhance our understanding of fine-tuning the synthesis gas composition for further application in the chemical processes during the single-line multi-stage gasification process of Hungarian brown coal.

2. Materials and Methods

2.1. Material

The Hungarian brown coal studied in these experiments was supplied by the Ormosszén Zrt. from their mining site in Felsőnyárád, Hungary. The coal samples were dried at room temperature for 7 days. After that, the coal samples were stored in different packages for the experiment. The coal sample is presented in Figure 3. The diameter of coal particles was 10–30 mm.
The ultimate analysis of the coal sample was conducted under the standard ISO 29541:2010 Solid mineral fuels—determination of total carbon, hydrogen, and nitrogen content—Instrumental method, within a Carlo Erba EA 1108 equipment analyser. The high heating value of the coal sample was examined by a bomb calorimeter—Parr 6200 Isoperibol Calorimeter type analyser, using the ISO 1928:2009—Solid mineral fuels—determination of gross calorific value by the bomb calorimetric method and calculation of net calorific value standard. The proximate analysis of the coal sample was measured by thermal gravimetric analysis in a MOM Derivatograph-C type. The results of elemental, proximate, and heating value analysis are shown in Table 1. The TG and DTG curves during the thermal gravimetric analysis are presented in Figure 4.

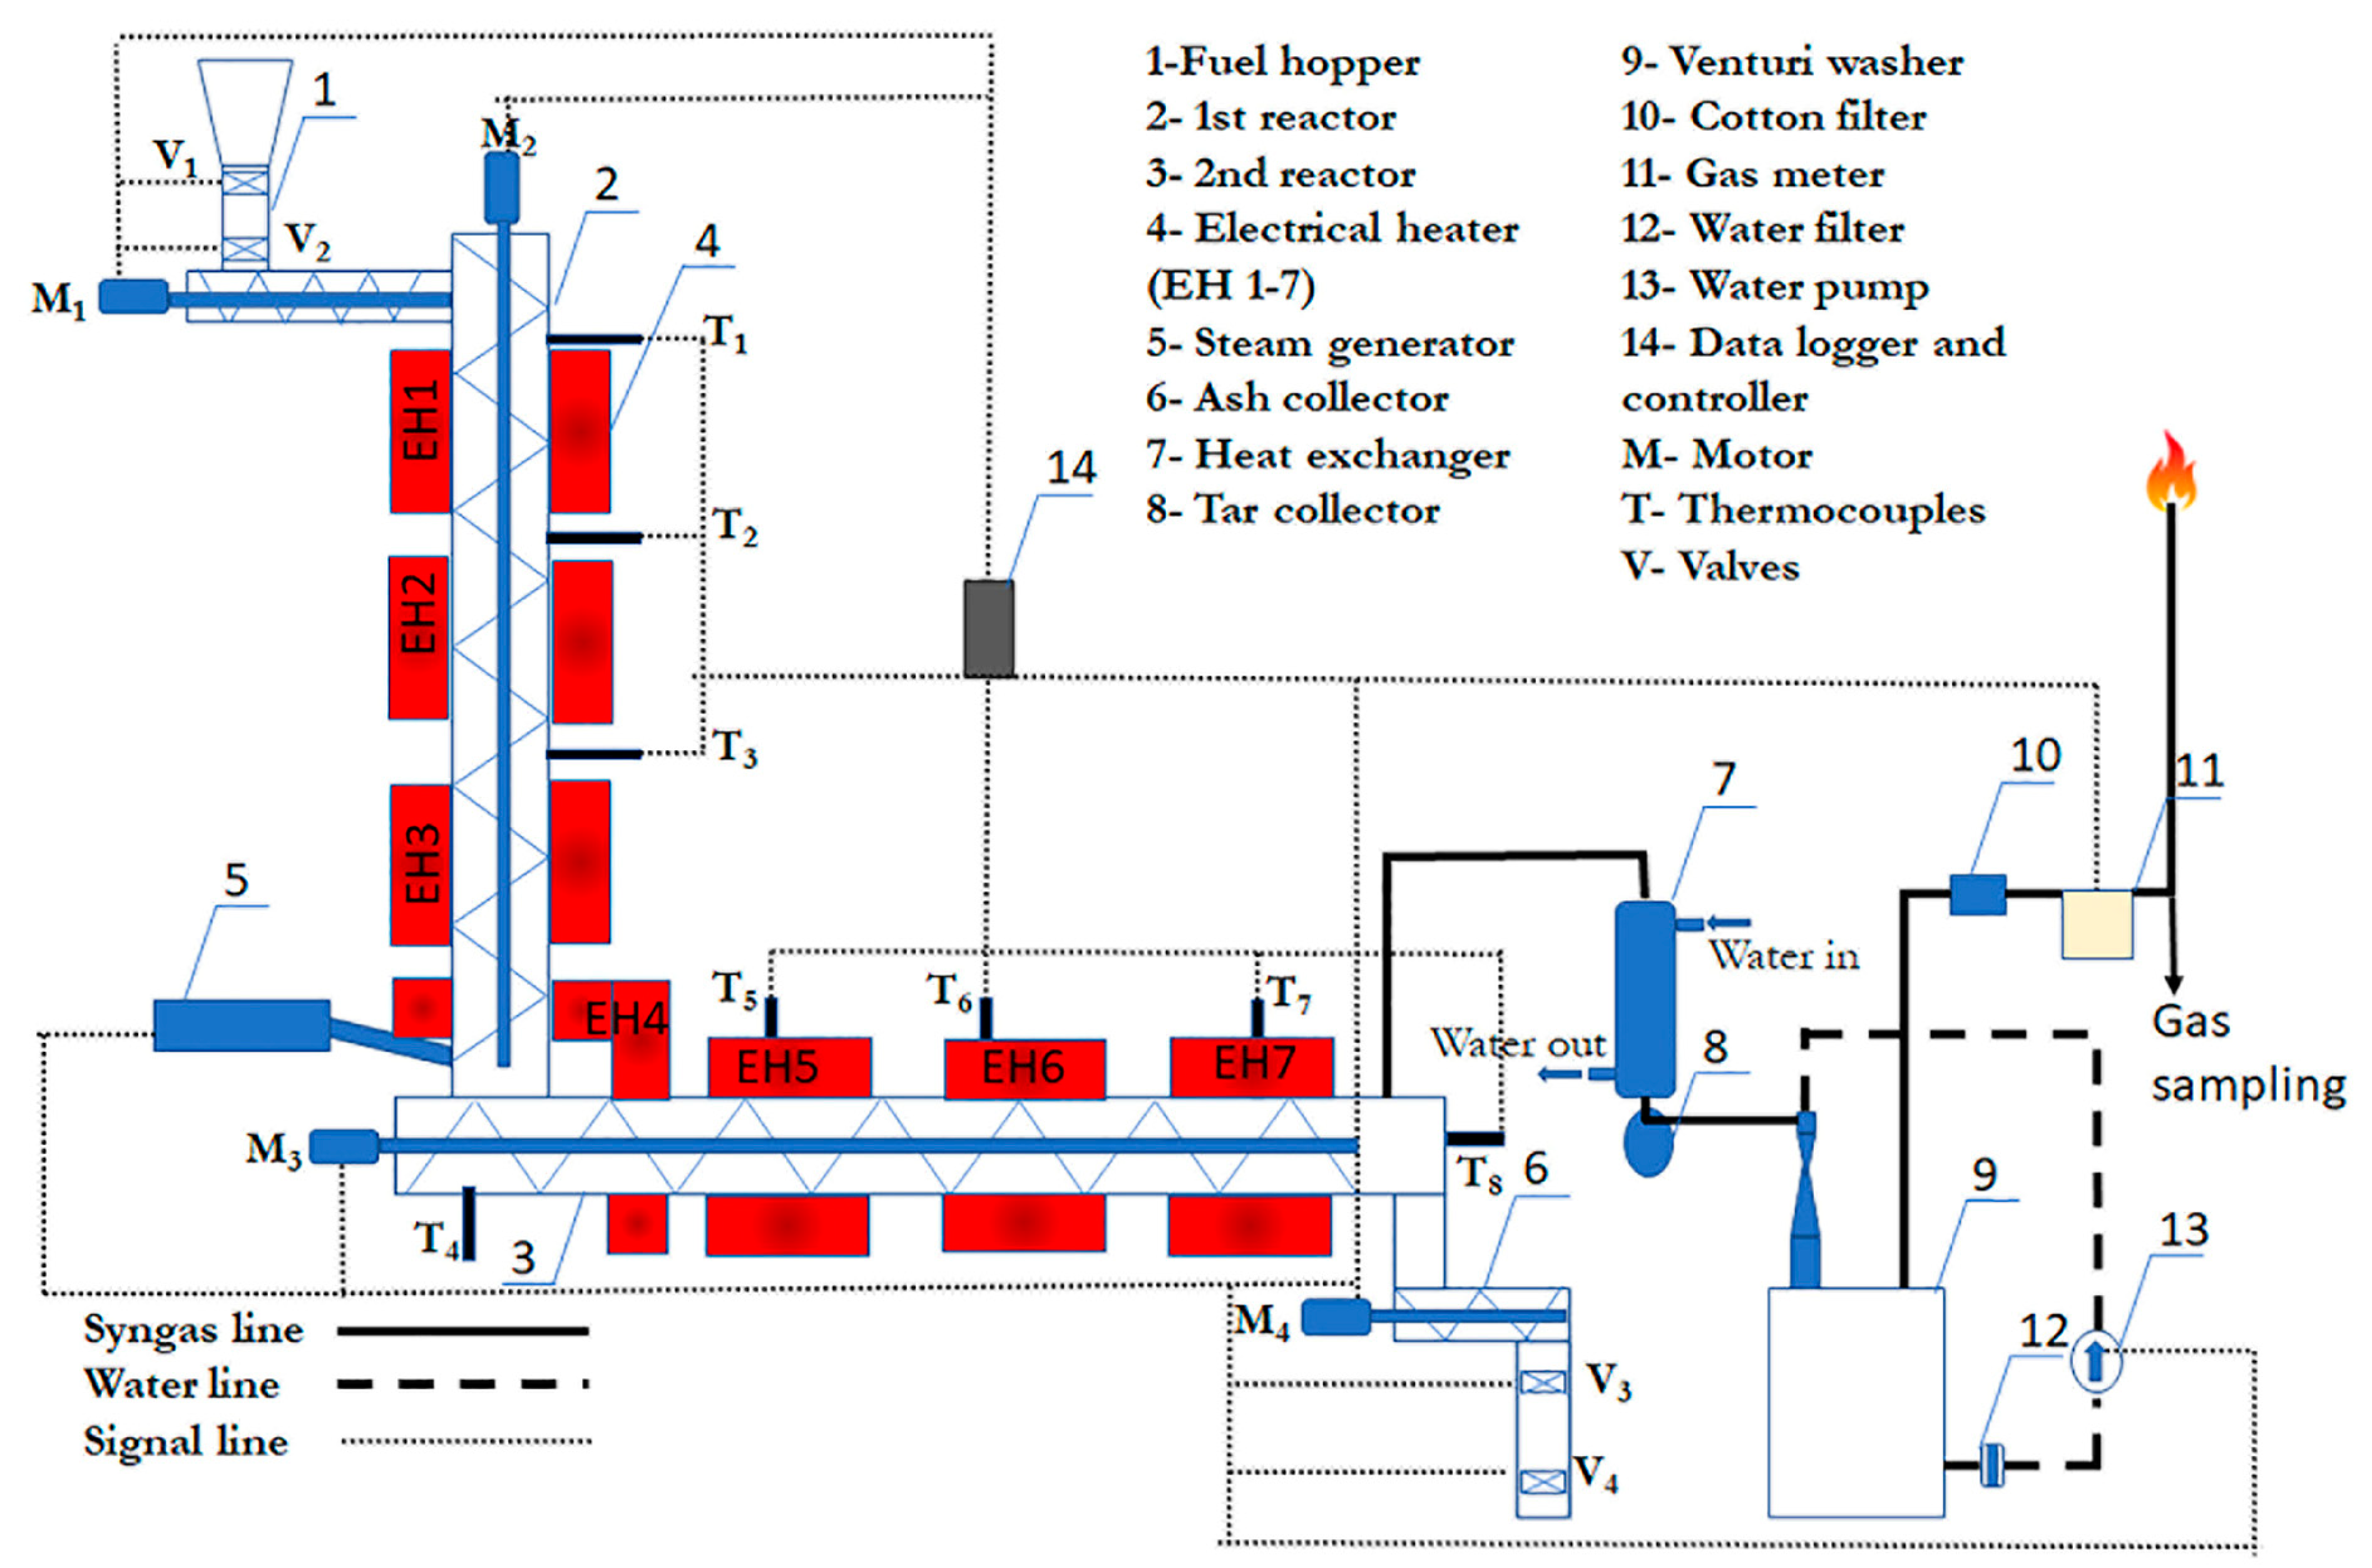
2.2. Experimental Apparatus

Figure 5 shows the single line multi-stage gasification system which is used in this research. This multi-stage gasifier is placed in the workshop of the Institute of Energy and Quality, University of Miskolc, Miskolc, Hungary.
The system is installed in a 6 m2 area and 3.4 m in height. The multi-stage gasification system can preliminarily be grouped into three parts, up-stream, down-stream, and control part. The upstream part includes the fuel feeding system, reactors, electrical heaters, steam generator, and ash collecting system. The downstream part involves the tar collecting system, venturi washer, gas meter, and gas analyser. The control part is used for the automation of the gasification system, as well as the data logging during the gasification process. The main controlled devices are the motors, the steam generator, and the electrical heaters. While the main input parameters are the temperature along with reactors, the synthesis gas flow rate, the synthesis gas pressure, the water flow rate and pressure in the venturi scrubber, and the synthesis gas composition from the gas analyser. There are seven separate electrical heaters installed along the reactor surface. This helps to operate at different temperatures at each segment of the reactor during the gasification process.
Both reactors are made of heat-resistant steel, with 100 mm of outer diameter and 80 mm of inner diameter. The effective length of each reactor is 1600 mm and is covered by electrical heaters. The 1st and 2nd electrical heaters are used for the pyrolysis process in the first stage. The 3rd to 7th electrical heaters are used for the gasification process in the second stage.
The schematic diagram of the multi-stage gasification system is depicted in Figure 6. In each experiment, the reactors were heated up to the desired temperature. When the reactor reached the set temperatures, the starting material was fed from the fuel hopper to the first stage of the gasifier through a screw conveyor. In the first stage of the gasifier, the pyrolysis process was carried out. Following, the pyrolysis char and gas flowed through to the second stage of the gasifier. In the second stage, the steam was introduced into the gasifier for the reduction reactions. The ash produced from the gasification then was collected in the ash collector. After the gasification process took place, the synthesis gas entered the downstream section. In this section, the removal of tar and particle content took place within the heat exchanger and the venturi scrubber. In the heat exchanger, the synthesis gas was cooled down to collect the condensable components from the produced synthesis gas. The venturi scrubber was mainly used to control the flow rate of synthesis gas and to separate the remaining particles and volatiles from synthesis gas. In the venturi scrubber, the scrubbing water from the bottom of the water tank was pumped through a water filter to remove large size particles before entering the spaying nozzle. The high pressure ensures the atomizing of the washing liquid, which then is turbulently mixed at the throat section of the scrubber with the synthesis gas. In addition, the high-pressure spray of scrubbing liquid creates a vacuum at the gas inlet of the scrubber. Therefore, through the regulation of the liquid pressure in the venturi scrubber, we can set the pressure within the reactor. Finally, the dry synthesis gas passes through the gas meter and is combusted in a burner.
The operation parameters are presented in Table 2. The temperatures were kept at 300 °C in the 1st electrical heater and 600 °C in the 2nd electrical heater for the pyrolysis process at all experiments. At each operation parameter (gasification temperature in the second stage and steam flow rate), the experiment was conducted at least for 3 days. During the experiments, the condensate liquid and char yield was collected and weighed every hour for further analysis. During the gasification process, the temperature of the gasifier was independently regulated for the first and second stages by the controller. The steam flow rate was also controlled through the main control panel. The temperature along the gasifier, as well as the volume flow rate of synthesis gas, were recorded and monitored by the PLC.
The synthesis gas concentration was analysed in-situ with a GASBOARD-3100P gas analyser. The synthesis gas composition of CO, CO2, CH4 and CnHm is measured within a non-dispersive infrared sensor (NDIR sensor). The H2 concentration is determined by a thermal conductivity detector (TCD sensor), while the O2 concentration is evaluated by an electron capture detector (ECD sensor).

2.3. Methods of Data Processing

The low heating value of syngas (LHVsyngas) was determined using the following equation:
L H V s y n g a s M J N m 3 = H 2 × 10.798 + C O × 12.636 + C H 4 × 35.818 100
in which H2, CO and CH4 are volume concentrations of components in synthesis gas (V/V%).
The carbon conversion efficiency (CCE) of the gasification process is calculated by:
C C E ( % ) = 12 × Y × ( C O + C O 2 + C H 4 ) 22.4 × C % × 100
where Y is the yield of synthesis gas (Nm3/kgcoal) and C% is the carbon content of coal in weight percentage (wt%).
The cold gas efficiency (CGE) is calculated by:
C G E % = L H V s y n g a s × Y L H V c o a l × 100
where LHVcoal is the lower heating value of coal (MJ/kg).

3. Results and Discussions

3.1. Effects of Gasification Temperature and Steam Flow Rate on Gasification Products

In the present experiment, the temperature of the first and second electrical heaters were kept at 300 and 600 °C, respectively. The gasification temperature of the second stage (3rd–7th electrical heater) was examined at 700, 800 and 900 °C. At each temperature condition, the steam/carbon (S/C) ratio was studied at 0.75, 1.00 and 1.25. The main gasification products are char, condensate liquid and syngas. In this study, the char and condensate liquid yields were the mean value of char and condensate liquid collected during the last 3 h on the last day at each experiment condition. The detailed data of char and condensate liquid yield are described in Table A1.
The effects of gasification temperature and S/C ratio on char yield are shown in Figure 7. The char yield decreased when the gasification temperature increased from 700 to 900 °C at all S/C ratios. At the S/C ratio of 0.75 and 1.00, the char yield declined slightly when the gasification temperature increased from 700 to 800 °C. From the initial 622.73 g/h to 580.87 g/h at 700 °C and from 599.65 g/h to 567.97 g/h at 800 °C. The char yield decreased when the S/C ratio varied from 0.75 to 1.25 for 800 and 900 °C, but in the case of 700 °C, the char yield increased from 580.87 g/h to 601.10 g/h when the S/C ratio varied from 1.00 to 1.25. This can be a result of the higher steam flow rate at low gasification temperature lowering the local temperature inside the gasifier. It led to a lower conversion rate of char in the gasifier. The lowest char yield was 373.03 g/h at 900 °C of gasification temperature and 1.25 of S/C ratio.
The effects of the gasification temperature and S/C ratio on condensate liquid yield are shown in Figure 8. The condensate liquid yield extremely decreased with the increasing gasification temperature at the same S/C ratio. At the S/C ratio of 0.75, the condensate liquid dropped from 327.9 g/h to 85.10 g/h at 700 and 900 °C, respectively. At the S/C ratio of 1.25, that numbers were 432.5 g/h at 700 °C and 269.2 g/h at 900 °C. However, at the same gasification temperature, the greater S/C ratio led to the higher condensate liquid. This can be basically explained by the higher S/C ratio that requires a higher introduction of steam flow rate into the gasifier.
The effects of the gasification temperature and S/C ratio on dry gas yield are illustrated in Figure 9. At a constant S/C ratio, the dry gas yield increased significantly with the increasing gasification temperature. At the S/C ratio of 0.75, the dry gas yield was only 0.41 Nm3/kgcoal at 700 °C of gasification temperature. While that was around two times higher at 900 °C of gasification temperature, with 0.85 Nm3/kgcoal of dry gas yield. The positive effects of increasing gasification temperature on dry gas yield were obviously shown at a higher S/C ratio. The dry gas yield generated at 900 °C was 2.3 and 2.6 times higher than that at 700 °C, with the S/C ratio at 1.00 and 1.25, respectively.
The increase in dry gas yield at higher gasification temperatures could be explained by two aspects. Firstly, the higher gasification temperature promoted the thermal cracking (Equation (4)) and steam reforming (Equation (5)) reactions of tar content [25,26,27]. It led to a higher yield of dry gas generated. Secondly, the endothermic reactions (Boudouard reaction—Equation (6), water gas reaction—Equation (7)) were promoted by increasing gasification temperatures [28,29]. Therefore, the higher gasification temperature resulted in a higher gas yield.
T a r l i g h t   h y d r o c a r b o n s + g a s e s
T a r + n 1 H 2 O n 2 C O 2 + n 3 H 2   ( H > 0 )
C + C O 2 2 C O   ( H = 172   k J m o l 1 )
C + H 2 O H 2 + C O   ( H = 131   k J m o l 1 )
At a constant gasification temperature, the dry gas yield increased remarkably if the S/C ratio increased from 0.75 to 1.00, and they increased slowly if the S/C ratio increased further from 1.00 to 1.25. The dry gas yield decreased slightly at 700 °C when the S/C ratio increased from 1.00 to 1.25. This means that the positive effects of increasing the S/C ratio on char gasification were limited at this temperature below the 1.25 S/C ratio. The highest dry gas yield was 1.14 Nm3/kgcoal at 900 °C of gasification temperature and 1.25 of S/C ratio.

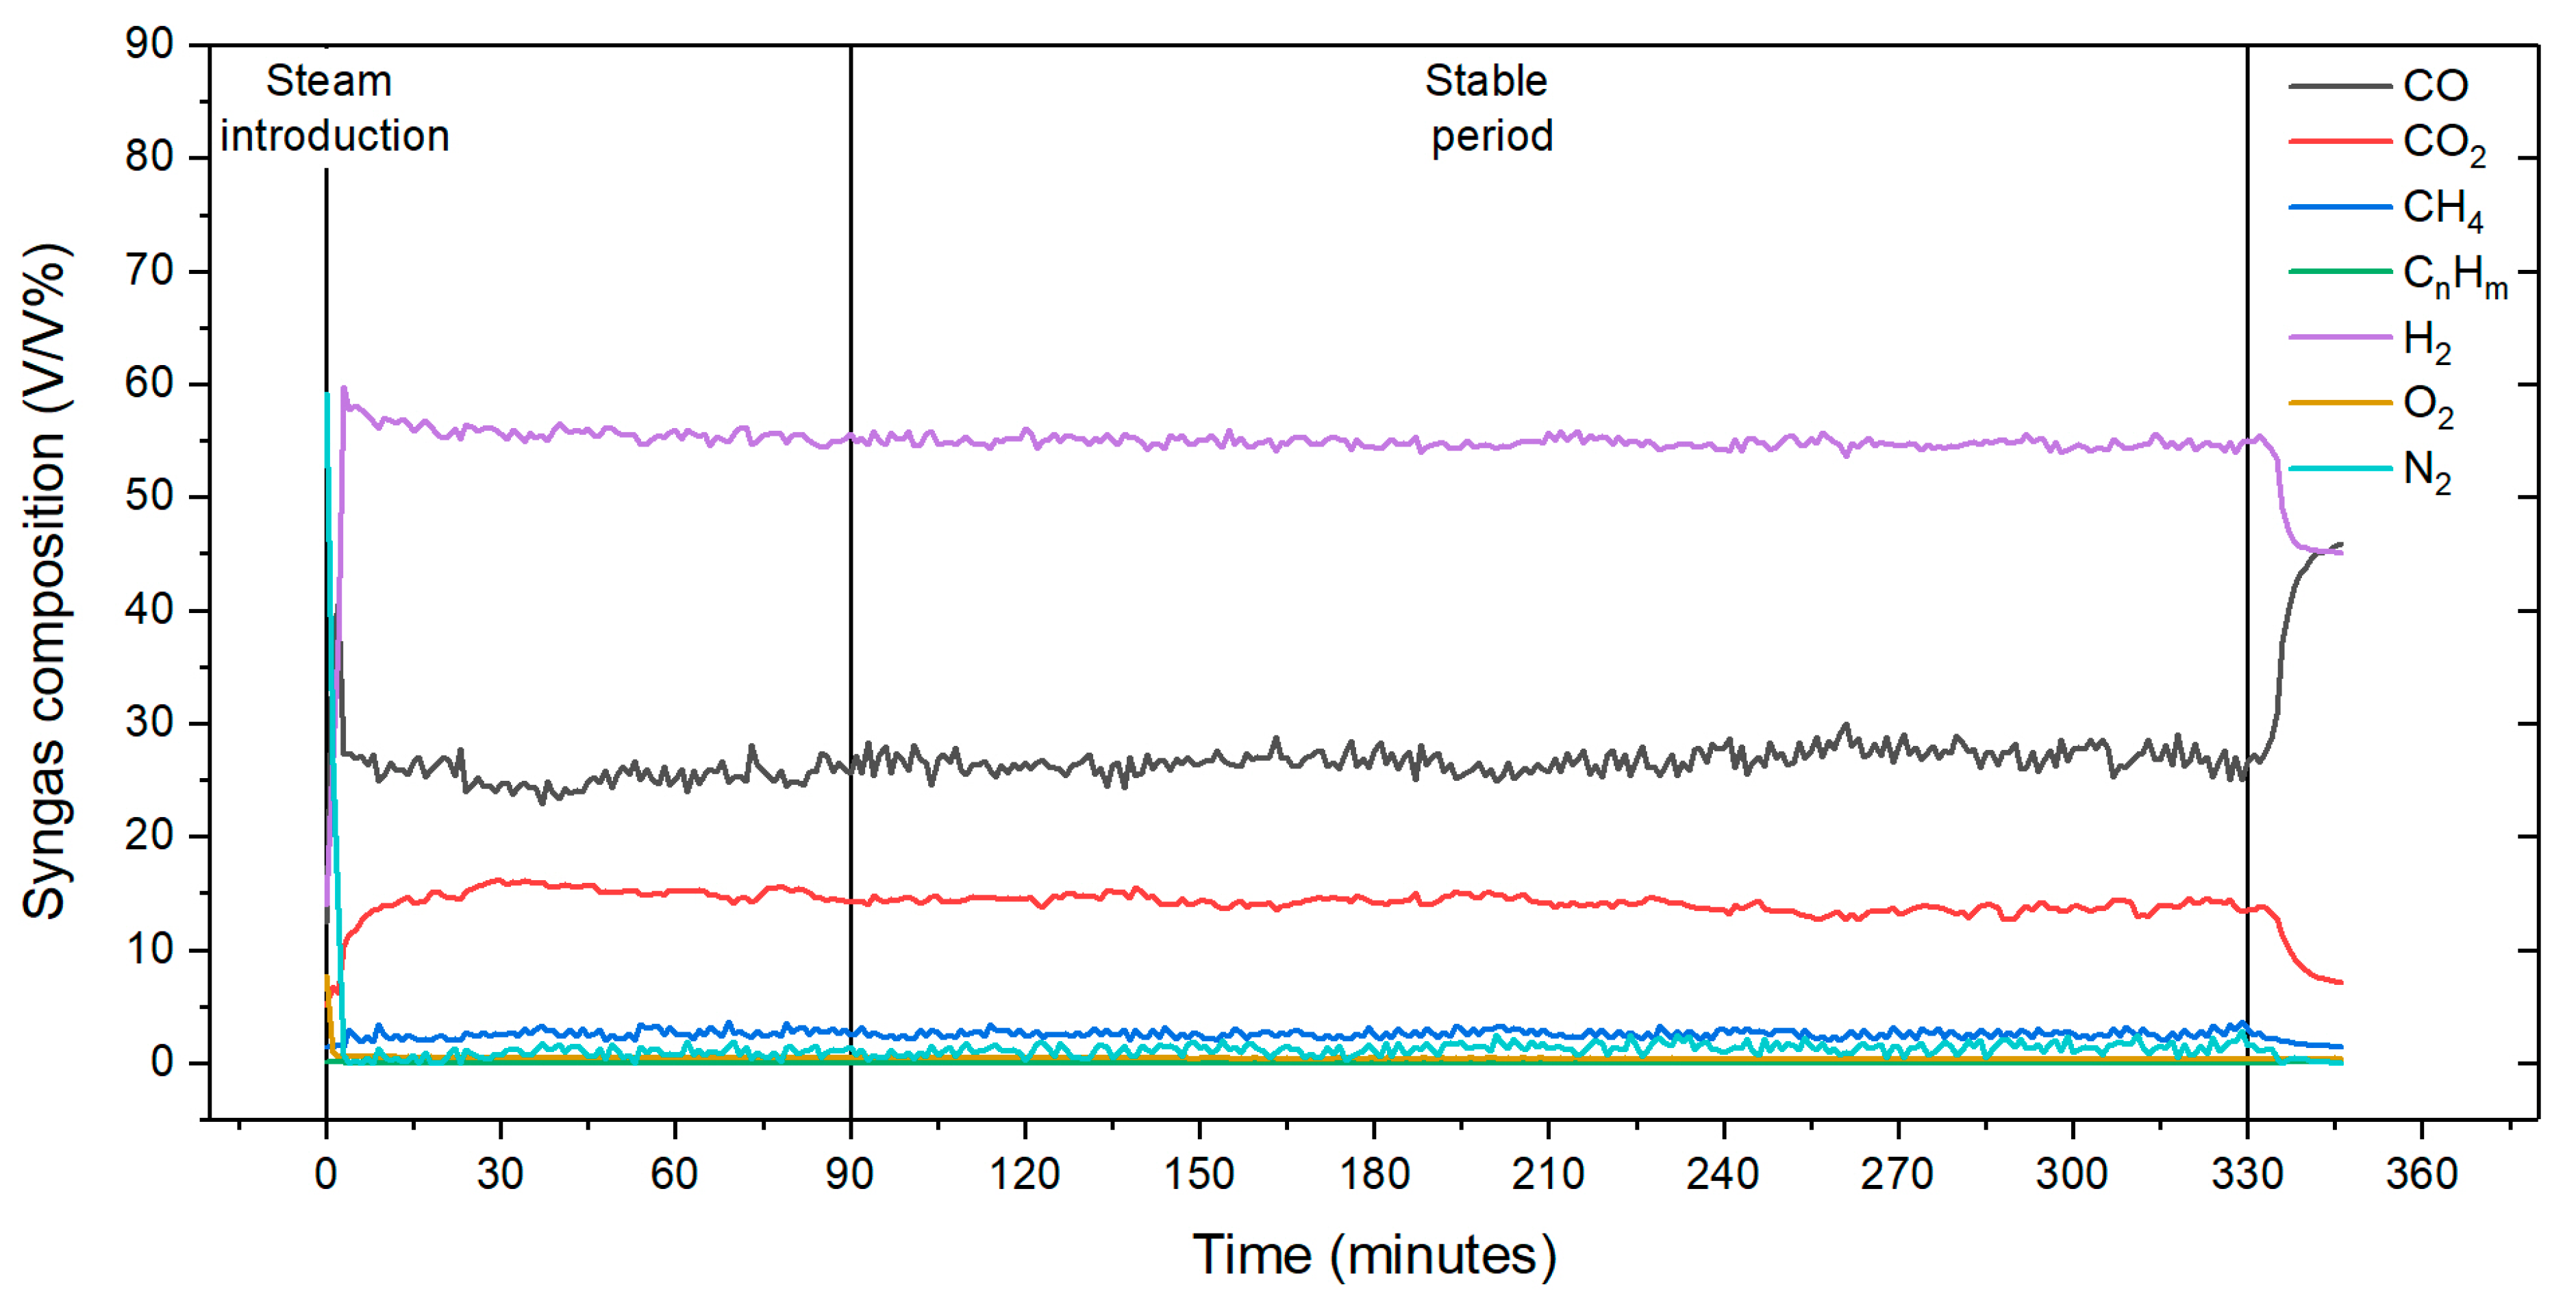
3.2. Effects of Gasification Temperature and Steam Flow Rate on Syngas Composition

Figure 10 presents the volume fraction of syngas components of a typical experiment at 900 °C of gasification temperature and an S/C ratio of 1.25. In all experiments, it took from 60 to 90 min to reach the steady state after the steam feeding. In this experiment, after the steam introduction, the stable period was selected for analysis from the 90th min to the 330th min (4 h).
As shown in Figure 10, the syngas composition was steady during the stable period. During this time, the concentrations of the long-chain hydrocarbon (CnHm) and O2 in the producer gas were nearly unnoticed, which indicated the high reaction rate of the steam reforming reaction of the long-chain hydrocarbons in the steam gasification process. It was similar in the other experiments. The N2 concentration was under 2% during the stable period. This N2 content was mainly due to the air entering during the material feeding period. The most abundant gas compound was H2, around 55.5 V/V% during the stable period. Other main gas components were CO and CO2, around 27.55 and 13.7 V/V%, respectively. The produced gas also included a small amount of CH4, lower than 4 V/V% in this case.
The effects of gasification temperature and steam flow rate on syngas composition, H2/CO ratio, and low heating value of syngas (LHVsyngas) are illustrated in Figure 11. The main components of producer gas were H2, CO, CO2, and CH4, with the total average volume fraction accounting for higher than 94 V/V% under all experiments. The details of the syngas composition are summarised in Table A2.
As shown in Figure 11a,b, the average volume fraction of CO, CO2 and CH4 showed a significant variation when the gasification temperature increased from 700 to 900 °C. At 700 °C, the CO concentration was only below 9 V/V%, but it increased drastically by approximately four times at 900 °C of gasification temperature. On the other hand, the CO2 concentration decreased roughly by 2.4 times when the gasification temperature rose from 700 to 900 °C. At 700 °C of the gasification temperature, the volume fraction of CH4 was around 7 V/V%, which decreased by approximately 2.8 times at 900 °C. In particular, the changes in H2 concentration did not appear to be a monotonic trend when the gasification temperature increased from 700 to 900 °C. It increased first and then slightly decreased as the increasing gasification temperature from 700 to 900 °C. The H2 concentration was around 54 V/V% at 900 °C. The variation of syngas concentration could be a result of the strengthening of endothermic reactions (Equations (5)–(7), and methane reforming reaction—Equation (8)) by increasing gasification temperature [28,29,30]. Therefore, more CO and H2 were generated and more CO2 and CH4 were consumed during the gasification process. The water-gas shift reaction—Equation (9) is an exothermic reaction; consequently, it was pushed back when the gasification temperature was higher than the equilibrium temperature [31,32]. Therefore, it led to a slight drop in the H2 volume fraction when the gasification temperature increased from 800 to 900 °C.
C H 4 + H 2 O C O + 3 H 2   ( H = 206   k J m o l 1 )
C O + H 2 O C O 2 + H 2   ( H = 41   k J m o l 1 )
As is observed in Figure 11a,b, at 700 °C of the gasification temperature, the H2 concentration increased slightly and the CH4 concentration decreased slightly when the S/C ratio increased from 0.75 to 1.25. While the gasification temperature was at 800 and 900 °C, an increased S/C ratio demonstrated no significant effect on the H2 and CH4 concentrations. At 700 °C of the gasification temperature, the H2 concentration increased from 52.96 V/V% at 0.75 to 54.29 V/V% at the S/C ratio of 1.25. Meanwhile, the CH4 concentration decreased from 7.18 V/V% to 6.61 V/V%, respectively. At each experimental gasification temperature, the variation of the S/C ratio exhibited a considerable impact on the volume fraction of CO and CO2, especially at 800 °C of the gasification temperature. The volume fraction of CO decreased by nearly 1.5 V/V% at 700 °C and 3.8 V/V% at 900 °C when the S/C ratio rose from 0.75 to 1.25, while that number was 4.8 V/V% at 800 °C. As the S/C ratio increased from 0.75 to 1.25, the volume fraction of CO2 increased by around 2 V/V% and 2.8 V/V% at 700 °C and 900 °C, respectively. At 800 °C, the volume fraction of CO2 rose by 5 V/V%. The results discussed above indicate that the higher S/C ratio increased the reaction rate of the water–gas reaction— Equation (7), methane reforming reaction—Equation (8), and water–gas shift reaction—Equation (9) [33,34,35].
Figure 11c depicts the effects of the gasification temperature and steam flow rate on the H2/CO ratio. As discussed above, the H2 concentration increased slightly when the gasification temperature increased from 700 to 900 °C. While the CO concentration increased significantly. Therefore, the H2/CO ratio decreased with the increase in the gasification temperature. The H2/CO ratio was above 6 at 700 °C and then decreased to around 2 at 900 °C of the gasification temperature. In addition, the increase in the S/C ratio led to a decrease in the CO concentration. While the H2 concentration did not vary significantly. Hence, the H2/CO ratio increased as the rising of S/C ratio from 0.75 to 1.25, especially at 700 °C of the gasification temperature. At 700 °C, the H2/CO ratio increased from 6.19 at the S/C ratio of 0.75 to 7.63 at the S/C ratio of 1.25. That numbers were 1.72 and 1.99, respectively, at 900 °C of the gasification temperature.
The LHVsyngas as functions of the gasification temperature and S/C ratio are illustrated in Figure 11d. The LHVsyngas was calculated based on the volume fraction of combustible gases, such as H2, CO, and CH4. The volume fraction of CO increased significantly with an increase in the gasification temperature. It led to an increase in the LHVsyngas. In addition, when the S/C ratio increased, the volume fraction of CO and CH4 decreased relatively such that the LHVsyngas showed a downward trend when the S/C ratio increased from 0.75 to 1.25. The highest LHVsyngas reached 10.69 MJ/Nm3 at 900 °C of the gasification temperature and S/C ratio of 0.75.

3.3. Effects of Gasification Temperature and Steam Flow Rate on Gasification Efficiency

The carbon conversion and cold gas efficiency as functions of the gasification temperature and S/C ratio are shown in Figure 12a.
CCE depends on the dry gas yield, as well as the volume fraction of CO, CO2, and CH4, as expressed in Equation (2). The total volume fraction of CO, CO2, and CH4 increased only by nearly 3 V/V% when the gasification temperature increased from 700 to 900 °C. Therefore, the dry gas yield played an important role in the change in CCE when the gasification temperature rose from 700 to 900 °C. As is observed, the increasing gasification temperature increased the CCE. The highest CCE was 75.32% at 900 °C of the gasification temperature and the S/C ratio of 1.00. At each temperature condition, the CCE increased significantly as the S/C ratio increased from 0.75 to 1.00. Then the CCE decreased slightly when the S/C ratio increased to 1.25. At 900 °C of the gasification temperature, the CCE at the S/C ratios of 1.00 and 1.25 were 75.32 and 75.09%, respectively.
As described in Equation (3), the CGE is affected by the dry syngas yield and LHVsyngas. As is observed in Figure 12a, the CGE expressed the same trends as the change in CCE when the gasification temperature increased from 700 to 900 °C and the S/C ratio increased from 0.75 to 1.25. The highest CGE was 83.69% at 900 °C and the S/C ratio of 1.25.
The effects of the gasification temperature and S/C ratio on specific power consumption per cubic meter of syngas are illustrated in Figure 12b. The higher gasification temperature led to an increase in the dry syngas yield. Therefore, the specific power consumption was lower in the case of the gasification temperature at 900 °C. As the S/C ratio increased from 0.75 to 1.00, the specific power consumption decreased drastically at all gasification temperature conditions. It can be explained that the higher S/C ratio resulted in a higher syngas flow rate. Although, the steam generator consumed more energy at a higher S/C ratio. When the S/C ratio increased from 1.00 to 1.25, the specific power consumption decreased gradually at 800 °C of the gasification temperature, from 7.89 to 6.97 kWh/Nm3, respectively. However, the changes in specific power consumption showed different trends at 700 and 900 °C. At 700 °C, the specific power consumption increased significantly when the S/C ratio increased from 1.00 to 1.25, due to a decrease in the dry syngas yield. In the case of 900 °C, the specific power consumption decreased slightly from 6.18 kWh/Nm3 at the S/C ratio of 1.00 to 6.05 kWh/Nm3 at the S/C ratio of 1.25. The lowest specific power consumption was at 900 °C of the gasification temperature and the S/C ratio of 1.25.

4. Conclusions

The multi-stage gasification of Hungarian brown coal was investigated in this study. The experiments were performed in a multi-stage reactor with a continuous moving of starting material. The mass flow rate of starting material was 1084 g/h. The temperature of the pyrolysis stage remained at 600 °C during all experiments. The gasification temperature was studied at 700, 800, and 900 °C. The S/C ratio was examined at 0.75, 1.00, and 1.25 at each temperature condition. The main conclusions are listed below.
  • The higher gasification temperature significantly improved the gasification efficiency, as a decrease in char yield and an increase in dry syngas yield. The positive effects of the increasing S/C ratio on char gasification were limited, especially at 700 and 900 °C. The excess steam lowered the dry gas yield in the case of 700 °C of the gasification temperature. The highest dry syngas yield was 1.14 Nm3/kgcoal at 900 °C and the S/C ratio of 1.25.
  • The increase in the gasification temperature had a significant effect on the syngas composition. Meanwhile, the syngas concentration varied slightly when the S/C ratio increased from 0.75 to 1.25. From a chemical utilization point of view, the gasification temperature at 900 °C and the S/C ratio of 1.25 resulted in the most promising H2/CO ratio of 1.99. From an energetic point of view, the highest LHVsyngas was observed at 900 °C and the S/C ratio of 0.75, about 10.69 MJ/Nm3.
  • The carbon conversion also reached the highest values at 900 °C and the S/C ratio of 1.00, around 75.32%. The highest value of cold gas efficiency was 83.69% at 900 °C and the S/C ratio of 1.25.
  • The experimental results showed that the multi-stage gasification process is a viable solution to improve not only the use value of Hungarian brown coal but also the carbon emission reduction by producing a synthesis gas that is readily usable for methanol synthesis.

Author Contributions

T.D.M.: writing—original draft preparation; T.D.M., E.S. and T.K.: Experiment; A.A.K.: Methodology; A.A.K. and Z.S.: supervision, writing—review and editing. All authors have read and agreed to the published version of the manuscript.

Funding

This research was supported by the Hungarian State in the framework of the RF-2.3.1-21-2022-00014 National Multidisciplinary Laboratory for Climate Change project.

Data Availability Statement

Not applicable.

Conflicts of Interest

The authors declare no conflict of interest.

Appendix A

Table A1. The data of char and liquid yield.
Gasification Temperature
700 °C800 °C900 °C
S/C ratio Char (g/h)Liquid (g/h)Char (g/h)Liquid (g/h)Char (g/h)Liquid (g/h)
0.751625.70329.50547.30141.10470.0090.60
2629.80326.30621.05151.50502.9083.40
3612.70327.90630.60132.30491.9081.30
Mean value622.73327.90599.65141.90488.2785.10
1.001568.00410.80568.90260.40417.00169.10
2588.80409.60584.50273.60401.60185.60
3585.80417.10550.50273.50402.70170.60
Mean value580.87412.50567.97269.17407.10175.10
1.251593.60431.30499.70359.90409.00277.40
2596.30435.00484.00338.00363.60263.50
3613.40431.40490.00310.70346.50266.90
Mean value601.10432.57491.23336.20373.03269.27
Table A2. The data of syngas composition.
Gasification
Temperature
S/C Ratio Syngas Composition (V/V%)LHVsyngas
COCO2CH4CnHmH2O2N2MJ/Nm3
7000.75Mean8.5626.127.180.1352.960.574.489.47
Max9.4727.539.040.2355.490.665.919.99
Min7.7024.385.680.0550.320.503.269.00
SD0.300.590.610.030.900.030.680.17
1.00Mean8.0426.726.920.1553.480.614.089.39
Max8.8127.918.870.2555.540.845.929.92
Min7.1525.875.530.0851.210.533.028.99
SD0.270.370.550.030.850.050.430.15
1.25Mean7.1228.156.610.1154.290.633.089.21
Max7.6830.397.820.1956.680.764.569.59
Min6.1926.485.190.0251.950.551.448.70
SD0.280.720.520.030.760.040.550.15
COCO2CH4CnHmH2O2N2
8000.75Mean22.3215.343.940.0155.040.522.7910.17
Max25.5118.785.520.0657.530.604.3510.62
Min18.1811.752.930.0052.180.471.309.71
SD1.561.370.440.010.770.030.520.17
1.00Mean19.0119.044.110.0155.000.532.309.80
Max21.2621.775.260.0756.650.652.9610.15
Min15.8817.463.260.0053.330.461.389.47
SD0.980.770.370.010.470.050.300.11
1.25Mean17.5220.313.880.0055.570.642.069.59
Max19.2322.375.040.0657.050.784.739.87
Min15.4718.913.040.0050.080.581.109.10
SD0.740.600.370.010.600.040.420.10
COCO2CH4CnHmH2O2N2
9000.75Mean31.3810.902.540.0054.030.520.5910.69
Max35.1914.003.560.1556.000.662.5110.93
Min23.398.991.820.0052.270.430.0010.32
SD1.700.960.310.020.660.060.510.11
1.00Mean30.9911.302.350.0154.100.430.7910.59
Max36.5513.543.210.1656.170.592.7510.98
Min26.018.951.650.0051.010.360.0010.20
SD1.920.990.310.040.750.030.640.14
1.25Mean27.5513.702.520.0054.760.401.0610.28
Max30.7915.473.740.1356.150.472.8510.51
Min24.3412.291.860.0053.570.350.009.96
SD1.230.610.320.010.460.030.580.10

References

  1. Song, Y.; Wang, N. Exploring Temporal and Spatial Evolution of Global Coal Supply-Demand and Flow Structure. Energy 2019, 168, 1073–1080. [Google Scholar] [CrossRef]
  2. Zang, G.; Zhang, J.; Ratner, A.; Shi, Y. Techno-Economic Analysis of a Cooling, Heating, and Electricity Trigeneration System Based on Downdraft Fixed Bed Wood and Tire Gasification: Case Study of a Campus Office Building. Sustain. Energy Technol. Assess. 2023, 55, 102939. [Google Scholar] [CrossRef]
  3. Xie, S.; Qin, P.; Zhang, M.; Xu, J.; Ouyang, T. A High-Efficiency and Eco-Friendly Design for Coal-Fired Power Plants: Combined Waste Heat Recovery and Electron Beam Irradiation. Energy 2022, 258, 124884. [Google Scholar] [CrossRef]
  4. Wu, J.; Wang, J.; Wu, J.; Ma, C. Exergy and Exergoeconomic Analysis of a Combined Cooling, Heating, and Power System Based on Solar Thermal Biomass Gasification. Energies 2019, 12, 2418. [Google Scholar] [CrossRef]
  5. Prestipino, M.; Piccolo, A.; Polito, M.F.; Galvagno, A. Combined Bio-Hydrogen, Heat, and Power Production Based on Residual Biomass Gasification: Energy, Exergy, and Renewability Assessment of an Alternative Process Configuration. Energies 2022, 15, 5524. [Google Scholar] [CrossRef]
  6. Li, C.Y.; Deethayat, T.; Wu, J.Y.; Kiatsiriroat, T.; Wang, R.Z. Simulation and Evaluation of a Biomass Gasification-Based Combined Cooling, Heating, and Power System Integrated with an Organic Rankine Cycle. Energy 2018, 158, 238–255. [Google Scholar] [CrossRef]
  7. Li, C.Y.; Wu, J.Y.; Shen, Y.; Kan, X.; Dai, Y.J.; Wang, C.-H. Evaluation of a Combined Cooling, Heating, and Power System Based on Biomass Gasification in Different Climate Zones in the U.S. Energy 2018, 144, 326–340. [Google Scholar] [CrossRef]
  8. Jie, P.; Yan, F.; Wen, Z.; Li, J. Evaluation of the Biomass Gasification-Based Combined Cooling, Heating and Power System Using the Maximum Generalized Entropy Principle. Energy Convers. Manag. 2019, 192, 150–160. [Google Scholar] [CrossRef]
  9. Speight, J.G. Handbook of Gasification Technology; Wiley: Hoboken, NJ, USA, 2020; ISBN 9781118773536. [Google Scholar]
  10. Lamprecht, D.; Nel, R.; Leckel, D. Production of On-Specification Fuels in Coal-to-Liquid (CTL) Fischer−Tropsch Plants Based on Fixed-Bed Dry Bottom Coal Gasification. Energy Fuels 2010, 24, 1479–1486. [Google Scholar] [CrossRef]
  11. Yang, Q.; Zhu, S.; Yu, P.; Yang, Q.; Zhang, D. Thermodynamic and Techno-Economic Analysis of Coal to Ethylene Glycol Process (CtEG) with Different Coal Gasifiers. Energy Convers. Manag. 2019, 191, 80–92. [Google Scholar] [CrossRef]
  12. Frilund, C.; Kurkela, E.; Hiltunen, I. Development of a Simplified Gas Ultracleaning Process: Experiments in Biomass Residue-Based Fixed-Bed Gasification Syngas. Biomass Convers. Biorefinery 2021, 1–12. [Google Scholar] [CrossRef]
  13. Kurkela, E.; Kurkela, M.; Hiltunen, I. Pilot-Scale Development of Pressurized Fixed-Bed Gasification for Synthesis Gas Production from Biomass Residues. Biomass Convers. Biorefinery 2021, 1–22. [Google Scholar] [CrossRef]
  14. Bany Ata, A.; Seufert, P.M.; Heinze, C.; Alobaid, F.; Epple, B. Optimization of Integrated Gasification Combined-Cycle Power Plant for Polygeneration of Power and Chemicals. Energies 2021, 14, 7285. [Google Scholar] [CrossRef]
  15. Alves, O.; Garcia, B.; Rijo, B.; Lourinho, G.; Nobre, C. Market Opportunities in Portugal for the Water-and-Waste Sector Using Sludge Gasification. Energies 2022, 15, 6600. [Google Scholar] [CrossRef]
  16. Wang, J.-J.; Yang, K.; Xu, Z.-L.; Fu, C.; Li, L.; Zhou, Z.-K. Combined Methodology of Optimization and Life Cycle Inventory for a Biomass Gasification Based BCHP System. Biomass Bioenergy 2014, 67, 32–45. [Google Scholar] [CrossRef]
  17. Hamel, S.; Hasselbach, H.; Weil, S.; Krumm, W. Autothermal Two-Stage Gasification of Low-Density Waste-Derived Fuels. Energy 2007, 32, 95–107. [Google Scholar] [CrossRef]
  18. Bui, T.; Loof, R.; Bhattacharya, S.C. Multi-Stage Reactor for Thermal Gasification of Wood. Energy 1994, 19, 397–404. [Google Scholar] [CrossRef]
  19. Galindo, A.L.; Lora, E.S.; Andrade, R.V.; Giraldo, S.Y.; Jaén, R.L.; Cobas, V.M. Biomass Gasification in a Downdraft Gasifier with a Two-Stage Air Supply: Effect of Operating Conditions on Gas Quality. Biomass Bioenergy 2014, 61, 236–244. [Google Scholar] [CrossRef]
  20. Saleh, A.R.; Sudarmanta, B.; Fansuri, H.; Muraza, O. Syngas Production from Municipal Solid Waste with a Reduced Tar Yield by Three-Stages of Air Inlet to a Downdraft Gasifier. Fuel 2020, 263, 116509. [Google Scholar] [CrossRef]
  21. Brandt, P.; Larson, E.; Henriksen, U. High Tar Reduction in a Two Stage Gasifier. Energy Fuels 2000, 14, 816–819. [Google Scholar] [CrossRef]
  22. Ahrenfeldt, J.; Henriksen, U.; Jensen, T.K.; Gøbel, B.; Wiese, L.; Kather, A.; Egsgaard, H. Validation of a Continuous Combined Heat and Power (CHP) Operation of a Two-Stage Biomass Gasifier. Energy Fuels 2006, 20, 2672–2680. [Google Scholar] [CrossRef]
  23. Gadsbøll, R.Ø.; Sárossy, Z.; Jørgensen, L.; Ahrenfeldt, J.; Henriksen, U.B. Oxygen-Blown Operation of the TwoStage Viking Gasifier. Energy 2018, 158, 495–503. [Google Scholar] [CrossRef]
  24. Wang, Z.; He, T.; Qin, J.; Wu, J.; Li, J.; Zi, Z.; Liu, G.; Wu, J.; Sun, L. Gasification of Biomass with Oxygen-Enriched Air in a Pilot Scale Two-Stage Gasifier. Fuel 2015, 150, 386–393. [Google Scholar] [CrossRef]
  25. Luo, S.; Zhou, Y.; Yi, C. Syngas Production by Catalytic Steam Gasification of Municipal Solid Waste in Fixed-Bed Reactor. Energy 2012, 44, 391–395. [Google Scholar] [CrossRef]
  26. Soni, C.G.; Wang, Z.; Dalai, A.K.; Pugsley, T.; Fonstad, T. Hydrogen Production via Gasification of Meat and Bone Meal in Two-Stage Fixed Bed Reactor System. Fuel 2009, 88, 920–925. [Google Scholar] [CrossRef]
  27. Chen, G.; Guo, X.; Cheng, Z.; Yan, B.; Dan, Z.; Ma, W. Air Gasification of Biogas-Derived Digestate in a Downdraft Fixed Bed Gasifier. Waste Manag. 2017, 69, 162–169. [Google Scholar] [CrossRef]
  28. Xiao, Y.; Xu, S.; Song, Y.; Wang, C.; Ouyang, S. Gasification of Low-Rank Coal for Hydrogen-Rich Gas Production in a Dual Loop Gasification System. Fuel Process. Technol. 2018, 171, 110–116. [Google Scholar] [CrossRef]
  29. Yuan, X.; Namkung, H.; Kang, T.J.; Kim, H.-T. K2CO3-Catalyzed Steam Gasification of Indonesian Low-Rank Coal for H2-Rich Gas Production in a Fixed Bed Reactor. Energy Technol. 2015, 3, 527–534. [Google Scholar] [CrossRef]
  30. Chang, S.; Zhang, Z.; Cao, L.; Ma, L.; You, S.; Li, W. Co-Gasification of Digestate and Lignite in a Downdraft Fixed Bed Gasifier: Effect of Temperature. Energy Convers. Manag. 2020, 213, 112798. [Google Scholar] [CrossRef]
  31. Fan, S.; Yuan, X.; Zhao, L.; Xu, L.H.; Kang, T.J.; Kim, H.T. Experimental and Kinetic Study of Catalytic Steam Gasification of Low Rank Coal with an Environmentally Friendly, Inexpensive Composite K2CO3-Eggshell Derived CaO Catalyst. Fuel 2016, 165, 397–404. [Google Scholar] [CrossRef]
  32. Chen, Z.; Dun, Q.; Shi, Y.; Lai, D.; Zhou, Y.; Gao, S.; Xu, G. High Quality Syngas Production from Catalytic Coal Gasification Using Disposable Ca(OH)2 Catalyst. Chem. Eng. J. 2017, 316, 842–849. [Google Scholar] [CrossRef]
  33. Li, K.; Zhang, R.; Bi, J. Experimental Study on Syngas Production by Co-Gasification of Coal and Biomass in a Fluidized Bed. Int. J. Hydrogen Energy 2010, 35, 2722–2726. [Google Scholar] [CrossRef]
  34. Lin, C.-L.; Weng, W.-C. Effects of Different Operating Parameters on the Syngas Composition in a Two-Stage Gasification Process. Renew. Energy 2017, 109, 135–143. [Google Scholar] [CrossRef]
  35. Mondal, K.; Piotrowski, K.; Dasgupta, D.; Hippo, E.; Wiltowski, T. Hydrogen from Coal in a Single Step. Ind. Eng. Chem. Res. 2005, 44, 5508–5517. [Google Scholar] [CrossRef]
Figure 1. Single and double-line multi-stage gasification process.
Energies 16 04427 g001
Figure 2. Two-stage gasifier.
Energies 16 04427 g002
Figure 3. Hungarian brown coal sample.
Energies 16 04427 g003
Figure 4. TG and DTG analysis curves of coal sample.
Energies 16 04427 g004
Figure 5. Mutil-stage gasification system at the University of Miskolc, Hungary.
Energies 16 04427 g005
Figure 6. Schematic diagram of muti-stage gasification system at the University of Miskolc, Hungary.
Energies 16 04427 g006
Figure 7. The effect of gasification temperature and S/C ratio on char yield.
Energies 16 04427 g007
Figure 8. The effect of gasification temperature and S/C ratio on liquid yield.
Energies 16 04427 g008
Figure 9. The effect of gasification temperature and S/C ratio on dry gas yield.
Energies 16 04427 g009
Figure 10. The syngas concentration of a typical experimental day at 900 °C of gasification temperature and 1.25 of S/C ratio.
Energies 16 04427 g010
Figure 11. The effect of gasification temperature and S/C ratio on (a,b)—syngas composition, (c)—H2/CO ratio, and (d)—LHVsyngas.
Energies 16 04427 g011
Figure 12. The effect of gasification temperature and S/C ratio on (a)—carbon conversion and cold gas efficiency and (b)—specific power consumption.
Energies 16 04427 g012
Table 1. Elemental, proximate, and heating value analysis of sample (air-dried basis).
Ultimate AnalysisProximate Analysis
N0.72wt%Moisture10.37wt%
C35.60wt%Volatile32.33wt%
H3.39wt%Fixed carbon25.22wt%
S3.07wt%Ash32.08wt%
O a25.14wt%Higher heating value15.03MJ/kg
a: by difference.
Table 2. Experimental parameters.
Mass Flow Rate of CoalTemperature at 2nd StageSteam/C Ratio
g/h°Cmol/mol
10847000.75
1.00
1.25
10848000.75
1.00
1.25
10849000.75
1.00
1.25
Disclaimer/Publisher’s Note: The statements, opinions and data contained in all publications are solely those of the individual author(s) and contributor(s) and not of MDPI and/or the editor(s). MDPI and/or the editor(s) disclaim responsibility for any injury to people or property resulting from any ideas, methods, instructions or products referred to in the content.

