Article

Methane Production from Confectionery Wastewater Treated in the Anaerobic Labyrinth-Flow Bioreactor

by
Marcin Dębowski
1,*,
Marta Kisielewska
1,
Joanna Kazimierowicz
2 and
Marcin Zieliński
1
1
Department of Environmental Engineering, Faculty of Geoengineering, University of Warmia and Mazury in Olsztyn, 10-719 Olsztyn, Poland
2
Department of Water Supply and Sewage Systems, Faculty of Civil Engineering and Environmental Sciences, Bialystok University of Technology, 15-351 Bialystok, Poland
*
Author to whom correspondence should be addressed.
Energies 2023, 16(1), 571; https://doi.org/10.3390/en16010571
Submission received: 16 November 2022 / Revised: 30 December 2022 / Accepted: 30 December 2022 / Published: 3 January 2023
(This article belongs to the Section A4: Bio-Energy)

Abstract

:
Production and consumption of confectionery products have increased worldwide, thus, effective management of wastewater produced is now an important issue. The confectionery high-load sewage was explored for biogas production in an innovative-design anaerobic reactor with labyrinth flow. The experimental studies were focused on determining the best technological parameters of anaerobic digestion for the effective removal of pollutants and obtaining high CH4 production efficiency. It was found that organic loading rate (OLR) of 5.0–6.0 g COD/L·d contributed to the highest CH4 generation of 94.7 ± 6.1 to 97.1 ± 5.1 L CH4/d, which corresponded to a high COD removal of 75.4 ± 1.5 to 75.0 ± 0.6%. Under such conditions the FOS/TAC ratio was below 0.4, indicating reactor stability, and pH was on the level of 7.15 ± 0.04 at OLR 5.0 g COD/L·d and 7.04 ± 0.07 at OLR 6.0 g COD/L·d.

1. Introduction

The confectionery industry is a group of companies that produces various types of sweets and products made from cocoa. It is one of the most widespread factories around the world and manufactured 37 billion tons of products, which corresponded to 4% of the whole food industry in 2017 [1]. There is constant and dynamic development in the confectionery industry worldwide [2]. In global comparison, most revenue is generated in the United States which amounted to USD 186.50 billion in 2022, and the global confectionery market is expected to grow annually by 3.03% [3].
The increase in confectionery production and the variety produced directly affect the quantity and quality of wastewater. The activity of confectionery plants requires a considerable amount of freshwater used both in the production process and for equipment washing, which generates large amounts of wastewater [4]. Wastewater is characterized by daily and seasonal variations in composition and quantity which adversely affect the disposal process [2]. Confectionery plants discharge about 300–500 m3 per month of wastewater that predominantly consists of organic compounds and suspensions, such as dissolved sugars, coarse impurities, emulsified fat particles, organic colloidal and solutes, surfactants, and dyes as well as other chemical additives [5,6]. The values of chemical oxygen demand (COD) vary from 2500 to 20,025 mg O2/L, while biological oxygen demand (BOD5) concentrations are up to 500–8000 mg O2/L, which allows the classification of this sewage as biodegradable [2,5,7]. Confectionery wastewater is comprised of low nutrient concentrations (nitrogen and phosphorus compounds) at 30–120 mg N-NH4/L and 3.2–157 mg TP/L [2]. The confectionery sewage has a mostly acidic pH of five due to the presence of readily soluble fermentable organic compounds [8]. Moreover, washing and disinfecting substances in wastewater can cause changes in the pH values within the limits of 3.2–9.5 [2]. A high load of organic compounds can create a problem with the treatment, thus improper or insufficient treatment can enhance the processes of eutrophication and degradation of natural water reservoirs when wastewater is discharged into them [9].
According to the literature, various methods are used to treat wastewater from the confectionery industry, and due to the variety of production, there is no versatile method for its treatment [2,10]. Effluents from small confectionery plants are usually discharged directly into the municipal sewerage system where they are diluted by household wastewater and then treated in a municipal sewage treatment plant [2]. However, this can cause some technological problems in treatment plants and is quite expensive [11]. Thus, it is recommended to treat confectionery sewage at the place of its formation to meet standards for industrial effluent discharge into the municipal sewerage system or natural water reservoirs [8]. Both aerobic and anaerobic biological treatment systems are used to treat confectionery wastewater [1,12]. Aerobic systems are generally based on the activated sludge process, however high concentrations of readily biodegradable organic matter in confectionery wastewater can cause rapid dissolved oxygen depletion in aeration tanks [5]. Another drawback of this method is the need to manage wastewater sewage sludge, which is produced in large amounts in aerobic treatment systems [13,14]. Thus, high-rate anaerobic technologies are more feasible for the treatment of confectionery wastewater [1,10,15,16]. Nowadays, high-rate anaerobic reactors are used for the treatment of different types of food-processing industrial wastewater [17,18,19,20,21]. The successful application of anaerobic technology to the treatment of industrial wastewater is mainly related to the resistance of anaerobic microflora to a high load of organic compounds [16,22]. Moreover, high-rate anaerobic technologies are characterized by low energy consumption, low excess sludge production, aerosol, and odor spread reduction, and quick start-up even after a long outage in operation [23]. The most important advantage of using anaerobic digestion to treat high-load industrial effluents is biogas production, which is used for heating and electricity generation [24,25].
Different types of anaerobic reactors are used to treat confectionery wastewater and upflow anaerobic sludge blanket (UASB) reactors are the most widely used [2,26,27]. A high flow wastewater velocity and mixing resulting from biogas production ensure the granular biomass formation at a concentration of approx. 80 g/L, which allows the treatment of high-load confectionery wastewater with concentrations ranging from 0.5 to 16 g COD/L [28]. The major limitation of the use of the UASB reactor in the treatment of confectionery wastewater is the need for pre-treating wastewater with a high content of suspended solids and fats, which inhibit the development of granular sludge [29]. Long-term dynamic performance of a full-scale anaerobic expanded granular sludge bed (EGSB) reactor treating confectionery effluent was simulated by using Anaerobic Digestion Model No. 1 (ADM1) by Dereli [1]. Although the author found good performance of EGSB reactor, it is unsuitable to treat confectionery wastewater with high concentrations of fats and suspended solids [30]. Other types of most commonly used reactors for confectionery wastewater treatment are down-flow anaerobic filters (DAFs) and up-flow anaerobic filters (UAFs) [31,32]. However, the operational problems of AFs result from system clogging and the stability of filter material that can be washed out from the reaction chamber, thus the reactors are operated at relatively low OLR up to 10 kg COD/m3·d [33].
Problems with the operation of typical anaerobic reactors have prompted the search for improvements to make them more effective and economical; therefore, hybrid reactors are designed to combine the positive features of individual anaerobic reactors to provide more effective treatment [34]. In most cases, hybrid reactors offer the separation of acidogenesis and methanogenesis phases into two stages to enhance biogas production, because each metabolic pathway requires specific conditions for a smooth and efficient operation [35]. In this study, an anaerobic labyrinth-flow bioreactor (AL-FB) was constructed as the combination of UASB reactor with methanogenesis phase separation and a settling tank. The reactor design enhanced the longer retention time of anaerobic biomass, provided a larger exchange surface between the liquid and gas phases, and minimized problems related to sludge flotation and preventing sludge loss.
The aim of this work was to study the process of anaerobic digestion of wastewater from a confectionery plant. The experimental studies were focused on determining the technological parameters of anaerobic digestion for the effective removal of pollutants and obtaining high methane production efficiency. The research was carried out in two stages, on a laboratory scale, and then in the AL-FB operated on a semi-technical scale.

2. Materials and Methods

2.1. Design of the Study

The study was divided into two stages (Figure 1).
In stage 1, batch anaerobic biodegradability tests were performed in semi-continuous respirometric reactors. The experiment was divided into four series identified depending on an organic loading rate (OLR) per unit respirometer volume, as follows: series 1: 2.0 g COD/L·d; series 2: 5.0 g COD/L·d; series 3: 7.0 g COD/L·d; series 4: 8.0 g COD/L·d. Stage 1 focused on selecting the most effective OLRs ensuring the highest efficiency of organic compound removal and efficient biomethane (CH4) production.
The selected value of the most effective OLR was the basis for determination of technological parameters of the AL-FB exploited in stage 2. This part of the research was focused on the anaerobic digestion efficiency assessment of confectionery wastewater in a continuous reactor on a semi-technical scale. The changes in concentrations of organic and biogenic compounds were monitored during the study, and the indicators characterizing the methane fermentation process, such as pH, volatile fatty acids (VFAs), the ratio of free organic acids (FOS) to total alkaline capacity (TAC), as well as biogas production and composition.

2.2. Materials

Confectionery wastewater was collected from the confectionery plant producing gingerbreads, jelly biscuits, shortbread biscuits, and biscuits. The average daily wastewater flows were approximately 20 m3/day. The physicochemical characteristics of confectionery wastewater used in the study are presented in Table 1.
The anaerobic granular sludge for respirometer inoculation was collected from a full-size fruit and vegetable processing wastewater treatment plant. The operation parameters of anaerobic digesters were: OLR of approx. 10 kg COD/m3·d, hydraulic retention time (HRT) of 24 h, and temperature of 37 °C. At the beginning of the batch anaerobic biodegradability tests, the respirometers were inoculated with 500 mL of anaerobic granular sludge with characteristics presented in Table 2. After inoculation, anaerobic granular sludge was worked out over a period of 45 days to adapt the biomass to wastewater composition.

2.3. Experimental Station Construction and Exploitation in Stage 1

The Automatic Methane Potential Test System (AMPTS II, BPC Instruments AB, Sweden) was used to evaluate the biogas potential of confectionery wastewater in stage 1. The schematic of the experimental station is shown in Figure 2.
The AMPTS II has an automatic temperature-controlled water bath (sample incubator) for 15 parallel 500 mL respirometric reactors. The reactors were incubated at 35 °C (mesophilic conditions), while the process of anaerobic digestion was performed for 25 days. The bioreactors were equipped with a methane recording system attached to the acquisition system. The produced biogas was transferred by a capillary to a CO2 trap vessel containing alkaline scrubbing solution (3M NaOH) for CO2 absorption. Then, the cleaned biogas was sent to a volumetric measuring system to analyze CH4 concentrations. Biomethane concentrations were recorded automatically and converted to normal conditions (1013 hPa, 273 K, dry gases). Since negative control samples were run in parallel to a primary experiment and with the same procedures. The samples consisted of 200 g of the inoculum without the substrate (confectionery wastewater).
The experimental series were divided according to the different amounts of confectionery wastewater dosed into the respirometers, which influenced the hydraulic retention time (HRT) as well as determined the value of OLRs (Table 3). Anaerobic conditions inside the respirometers were ensured by flushing the reaction chambers with nitrogen gas (15 min, 150 L/h). Thereafter, the reactors were closed with a rubber stopper and connected to the mechanical agitators. Agitators of all respirometers were set to be 30 s on/600 s off at 50 rpm during the experimental studies to provide contact between inoculum and wastewater without destroying the cells of microflora. The experiments in stage 1 were performed in triplicate.

2.4. Experimental Station Construction and Exploitation in Stage 2

Anaerobic digestion of confectionery wastewater in stage 2 was performed in the AL-FB with a vertical wastewater flow on a semi-technical scale. The total working volume of the reactor was 110 L. The reactor was constructed in the form of three coaxially placed tanks, where the inner tank (20 L) was a hydrolyzer and the middle container (80 L) served as an acidogenesis and methanogenesis tank. In the external tank (10 L), sedimentation of the anaerobic granular sludge and final clarification of purified wastewater took place. The reactor design enhanced the longer retention time of anaerobic biomass, a larger exchange surface between the liquid and gas phases, and minimized problems related to sludge flotation. The AL-FB was covered with a gas-tight cover which was flooded in the sewage (as a water seal) equipped with a biogas inlet and a gas flow meter. The overall and detailed construction of AL-FB is shown in Figure 3.
Wastewater flowed from the bottom of the reactor to the central part of the hydrolyzer. The complete mixing course in the tank was maintained by a recirculation pump working at a rate of 30 L/min, and the suction pipeline was 5 cm below the liquid level. In the upper part of the hydrolyzer, there was a wastewater outflow to the fermentation tank with a piston flow character from the top to the bottom of the fermentation tank. In the external tank, an upstream flow was forced. Clarified and treated wastewater was discharged outside the reactor through the overflow.
The initial OLR was at the level of 5.0 g COD/L·d, which was established on the results obtained in the first stage of the experiment in series 1, while the average daily wastewater flow was 50 L/d. Confectionery wastewater from the retention tank was dosed to the anaerobic reactor by a pump working with a capacity of 5 L/h. The retention tank was equipped with a recirculation pump for mixing the wastewater. The pumps were switched on 10 times a day in a time regime of 60 min wastewater dosing pump and 84 min recirculation pump. In subsequent experimental series, the applied OLRs were 6.0 g COD/L·d (series 2) and 7.0 g COD/L·d (series 3). The study organization in stage 2 is summarized in Table 4.
The AL-FB was heated by a water jacket consisting of a hot water storage tank with a capacity of 40 L and an electric heater (2000 W). The circulation pump working at a flow of 4 m3/h was associated with the water jacket and was automatically switched on/off to maintain the temperature inside the chamber of the reactor at the level of 35 ± 1 °C. A temperature sensor to control the work of the circulation pump was placed at the bottom of the reactor. The AL-FB was also insulated with a 50 mm layer of mineral wool.

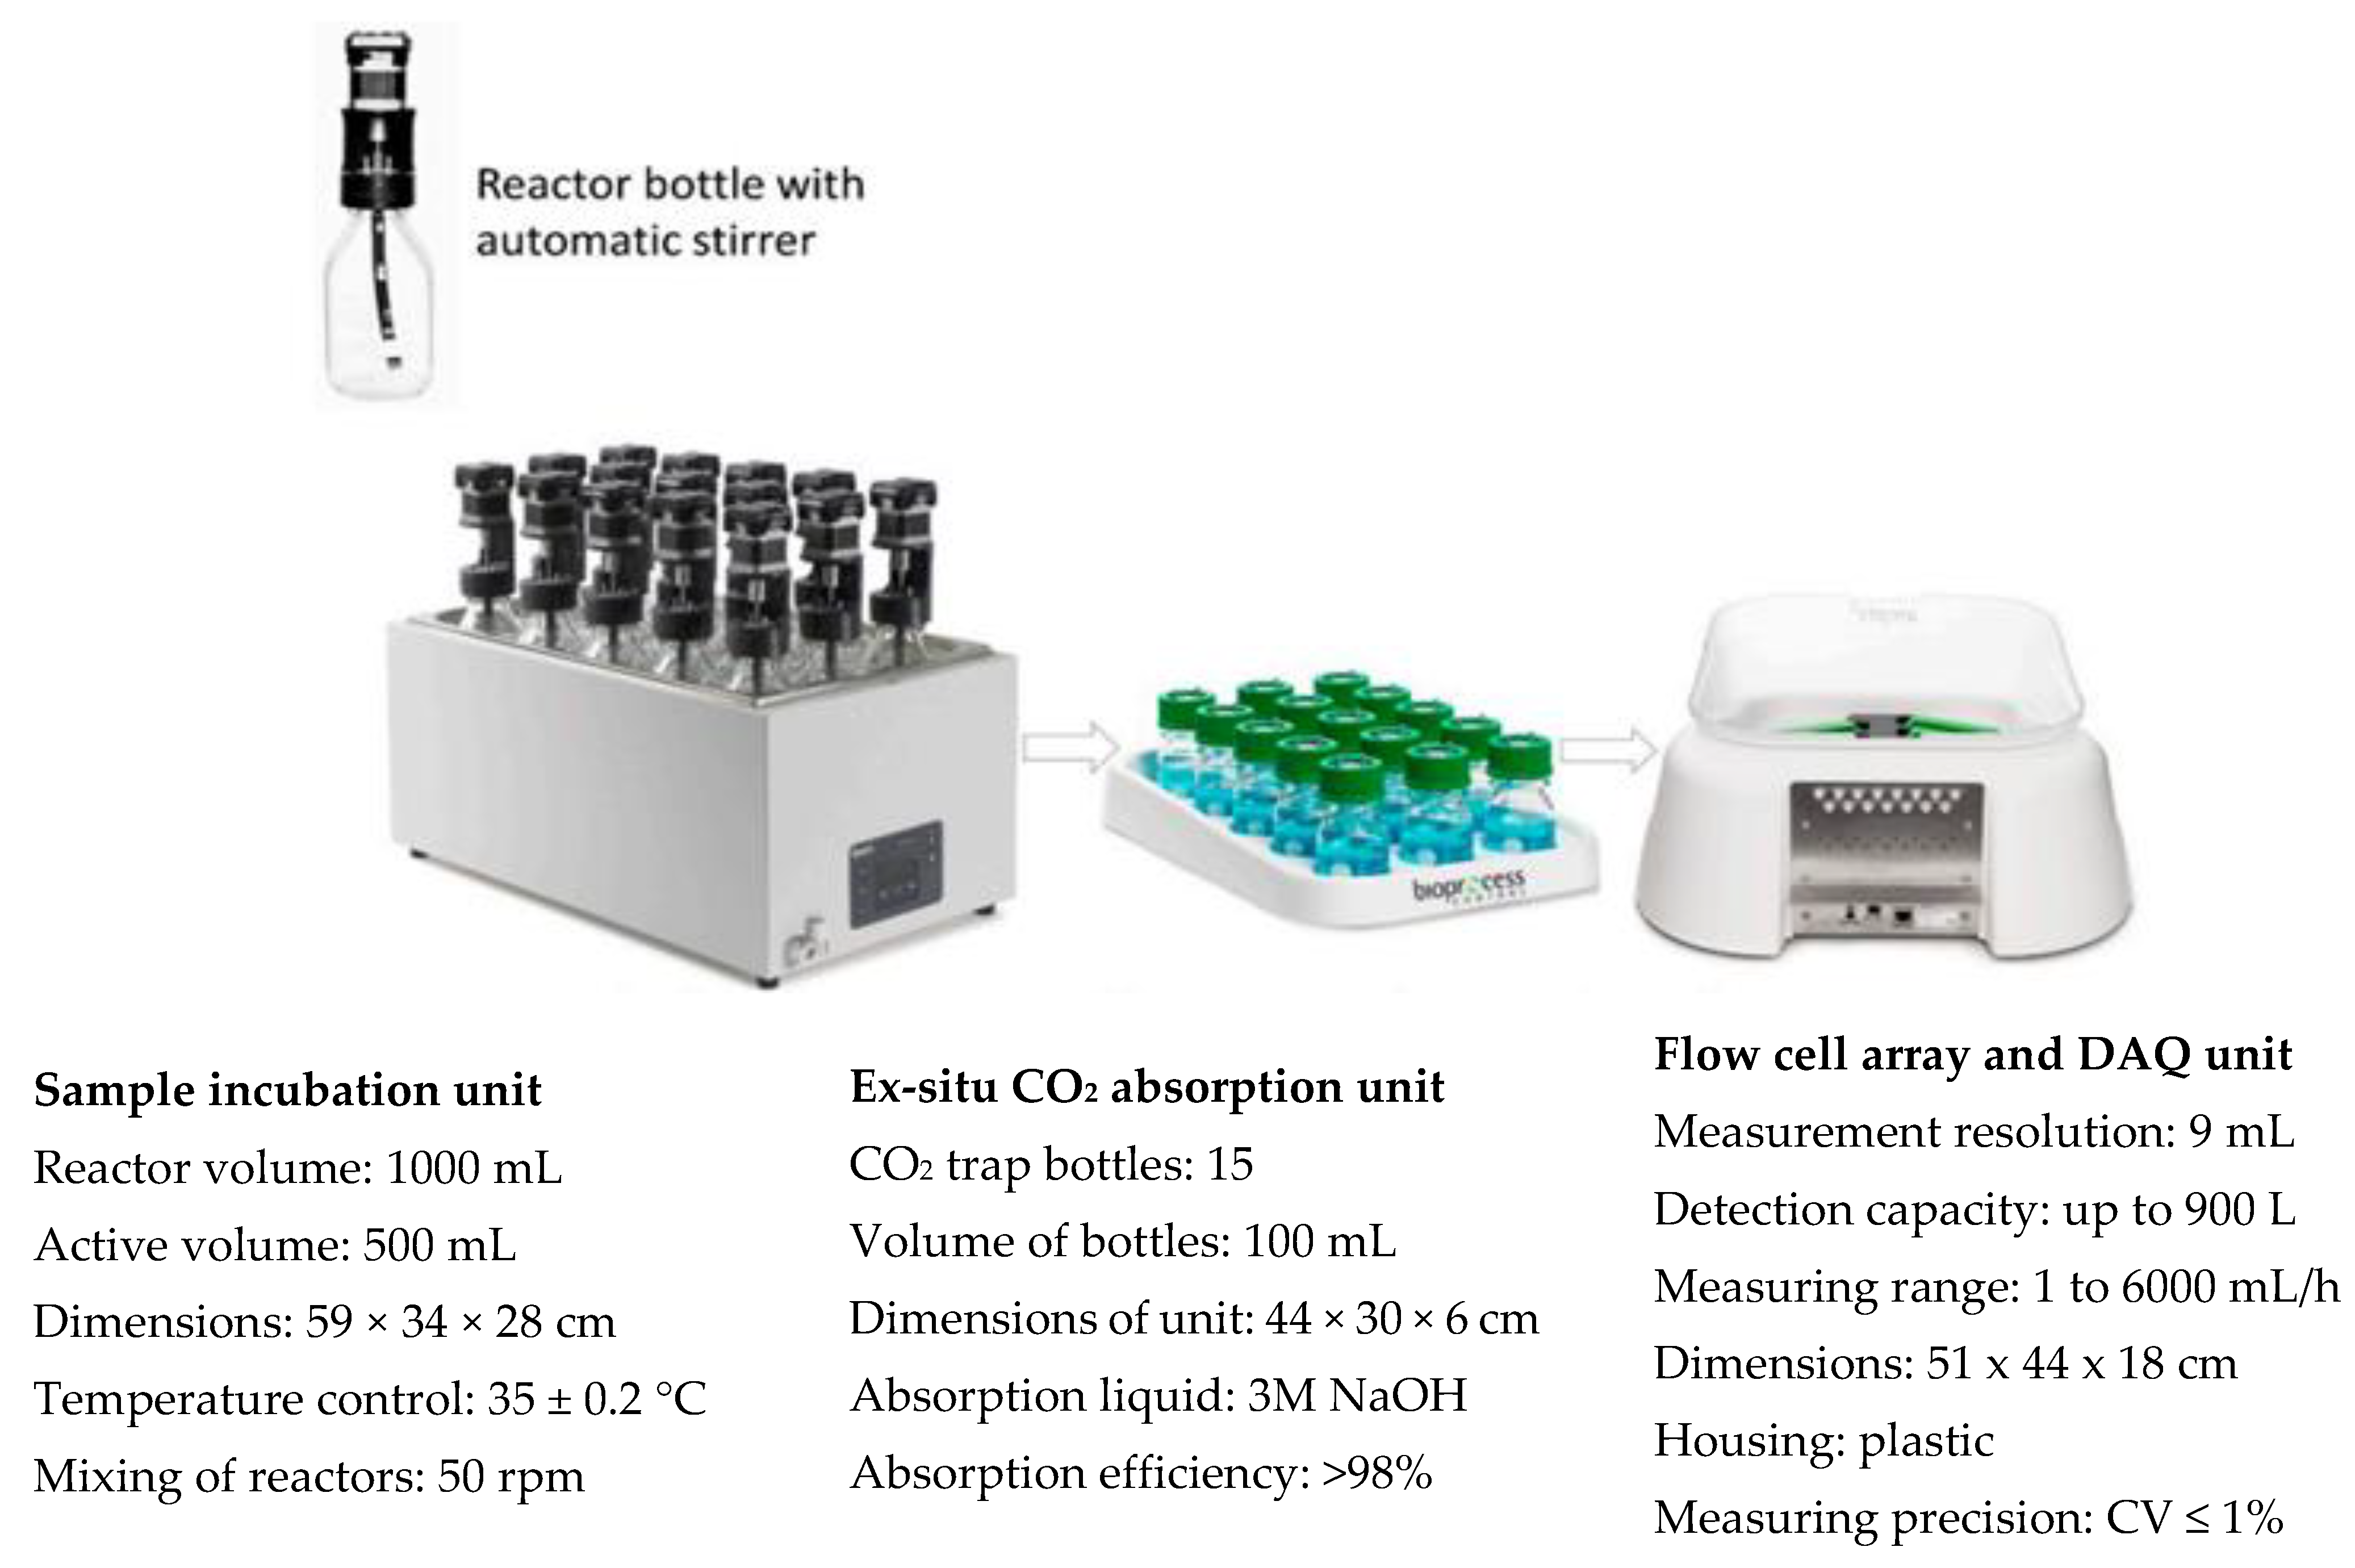
2.5. Analytical Methods

The parameters such as COD, total phosphorus (TP), total nitrogen (TN), ammonia nitrogen (N-NH4), TP, and orthophosphates (P-PO4) were analyzed once a day using cuvette tests of the DR 2800 spectrophotometer with mineralizer (HACH Lange, Düsseldorf, Germany), total solids (TS), and volatile solids (VS) concentration by gravimetric method (part of EPA Standard Method 2540), TOC using a TOC 1200 analyzer (Thermo Scientific, Waltham, MA, USA). Determination of biochemical oxygen demand (BOD5) was carried out according to PN-EN 1899-1. The pH in the reactor compartments was determined with a VWR 1000 L pH meter (Germany). The ether extract was analyzed by the gravimetric method by determining the total content of organic substances extractable with petroleum ether (PN-86/C-0457/01). The FOS/TAC ratio was determined by a titration method (Tritlab AT 1000, Hach, Düsseldorf, Germany). The concentration of lipids was determined by Soxhlet extraction (B-323 Büchi, Flawil, Switzerland).
A digital gas flow meter (XFM17S, Aalborg Instruments & Controls, Inc., Orangeburg, NY, USA) measured the instant flow rate and total biogas flow. The biogas composition was analyzed every 24 h using a gas chromatograph (GC 7890A, Agilent). The device was equipped with a thermal conductivity detector (TCD), two Hayesep Q columns (80/100 mesh), two molecular sieves columns (60/80 mesh), and a Porapak Q column (80/100). The temperatures of the injection and detector ports were 150 °C and 250 °C, respectively. Helium and argon were used as carrier gases at 15 mL/min flow. Additionally, the biogas composition (CO2 and CH4 concentration) was analyzed with the GMF 430 Gas Data analyzer.

2.6. Statistical Methods

The Statistica 13.1 PL software package (StatSoft, Inc., Tulsa, OK, USA) was used for the analysis. The homogeneity of variance in groups was determined using Levene’s test. Tukey’s HSD test was applied to determine the significance of differences between the series (p = 0.05).

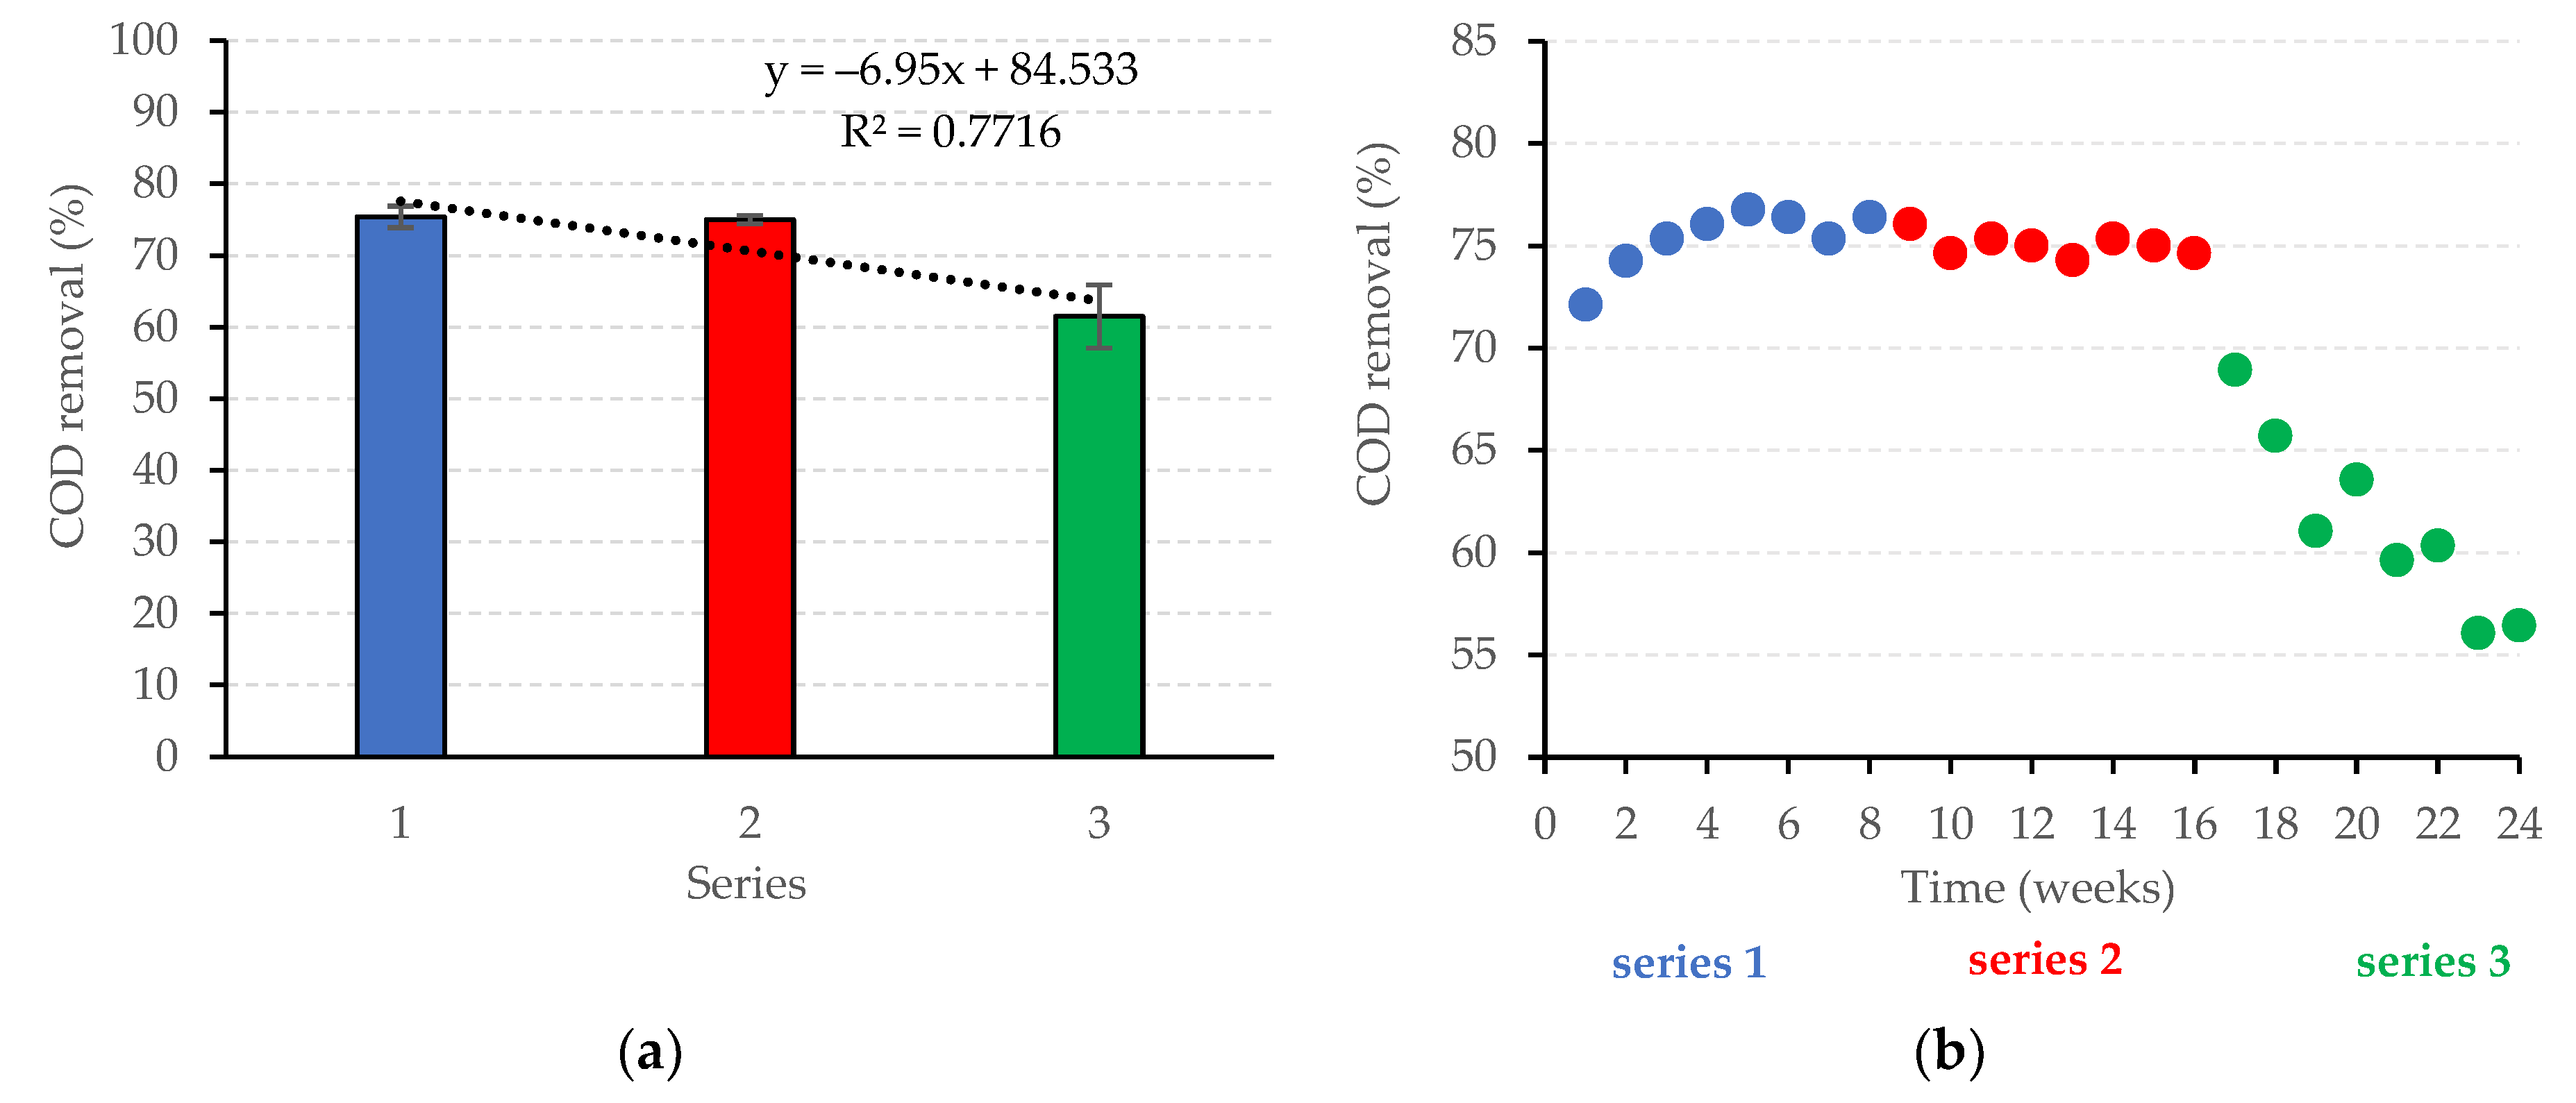
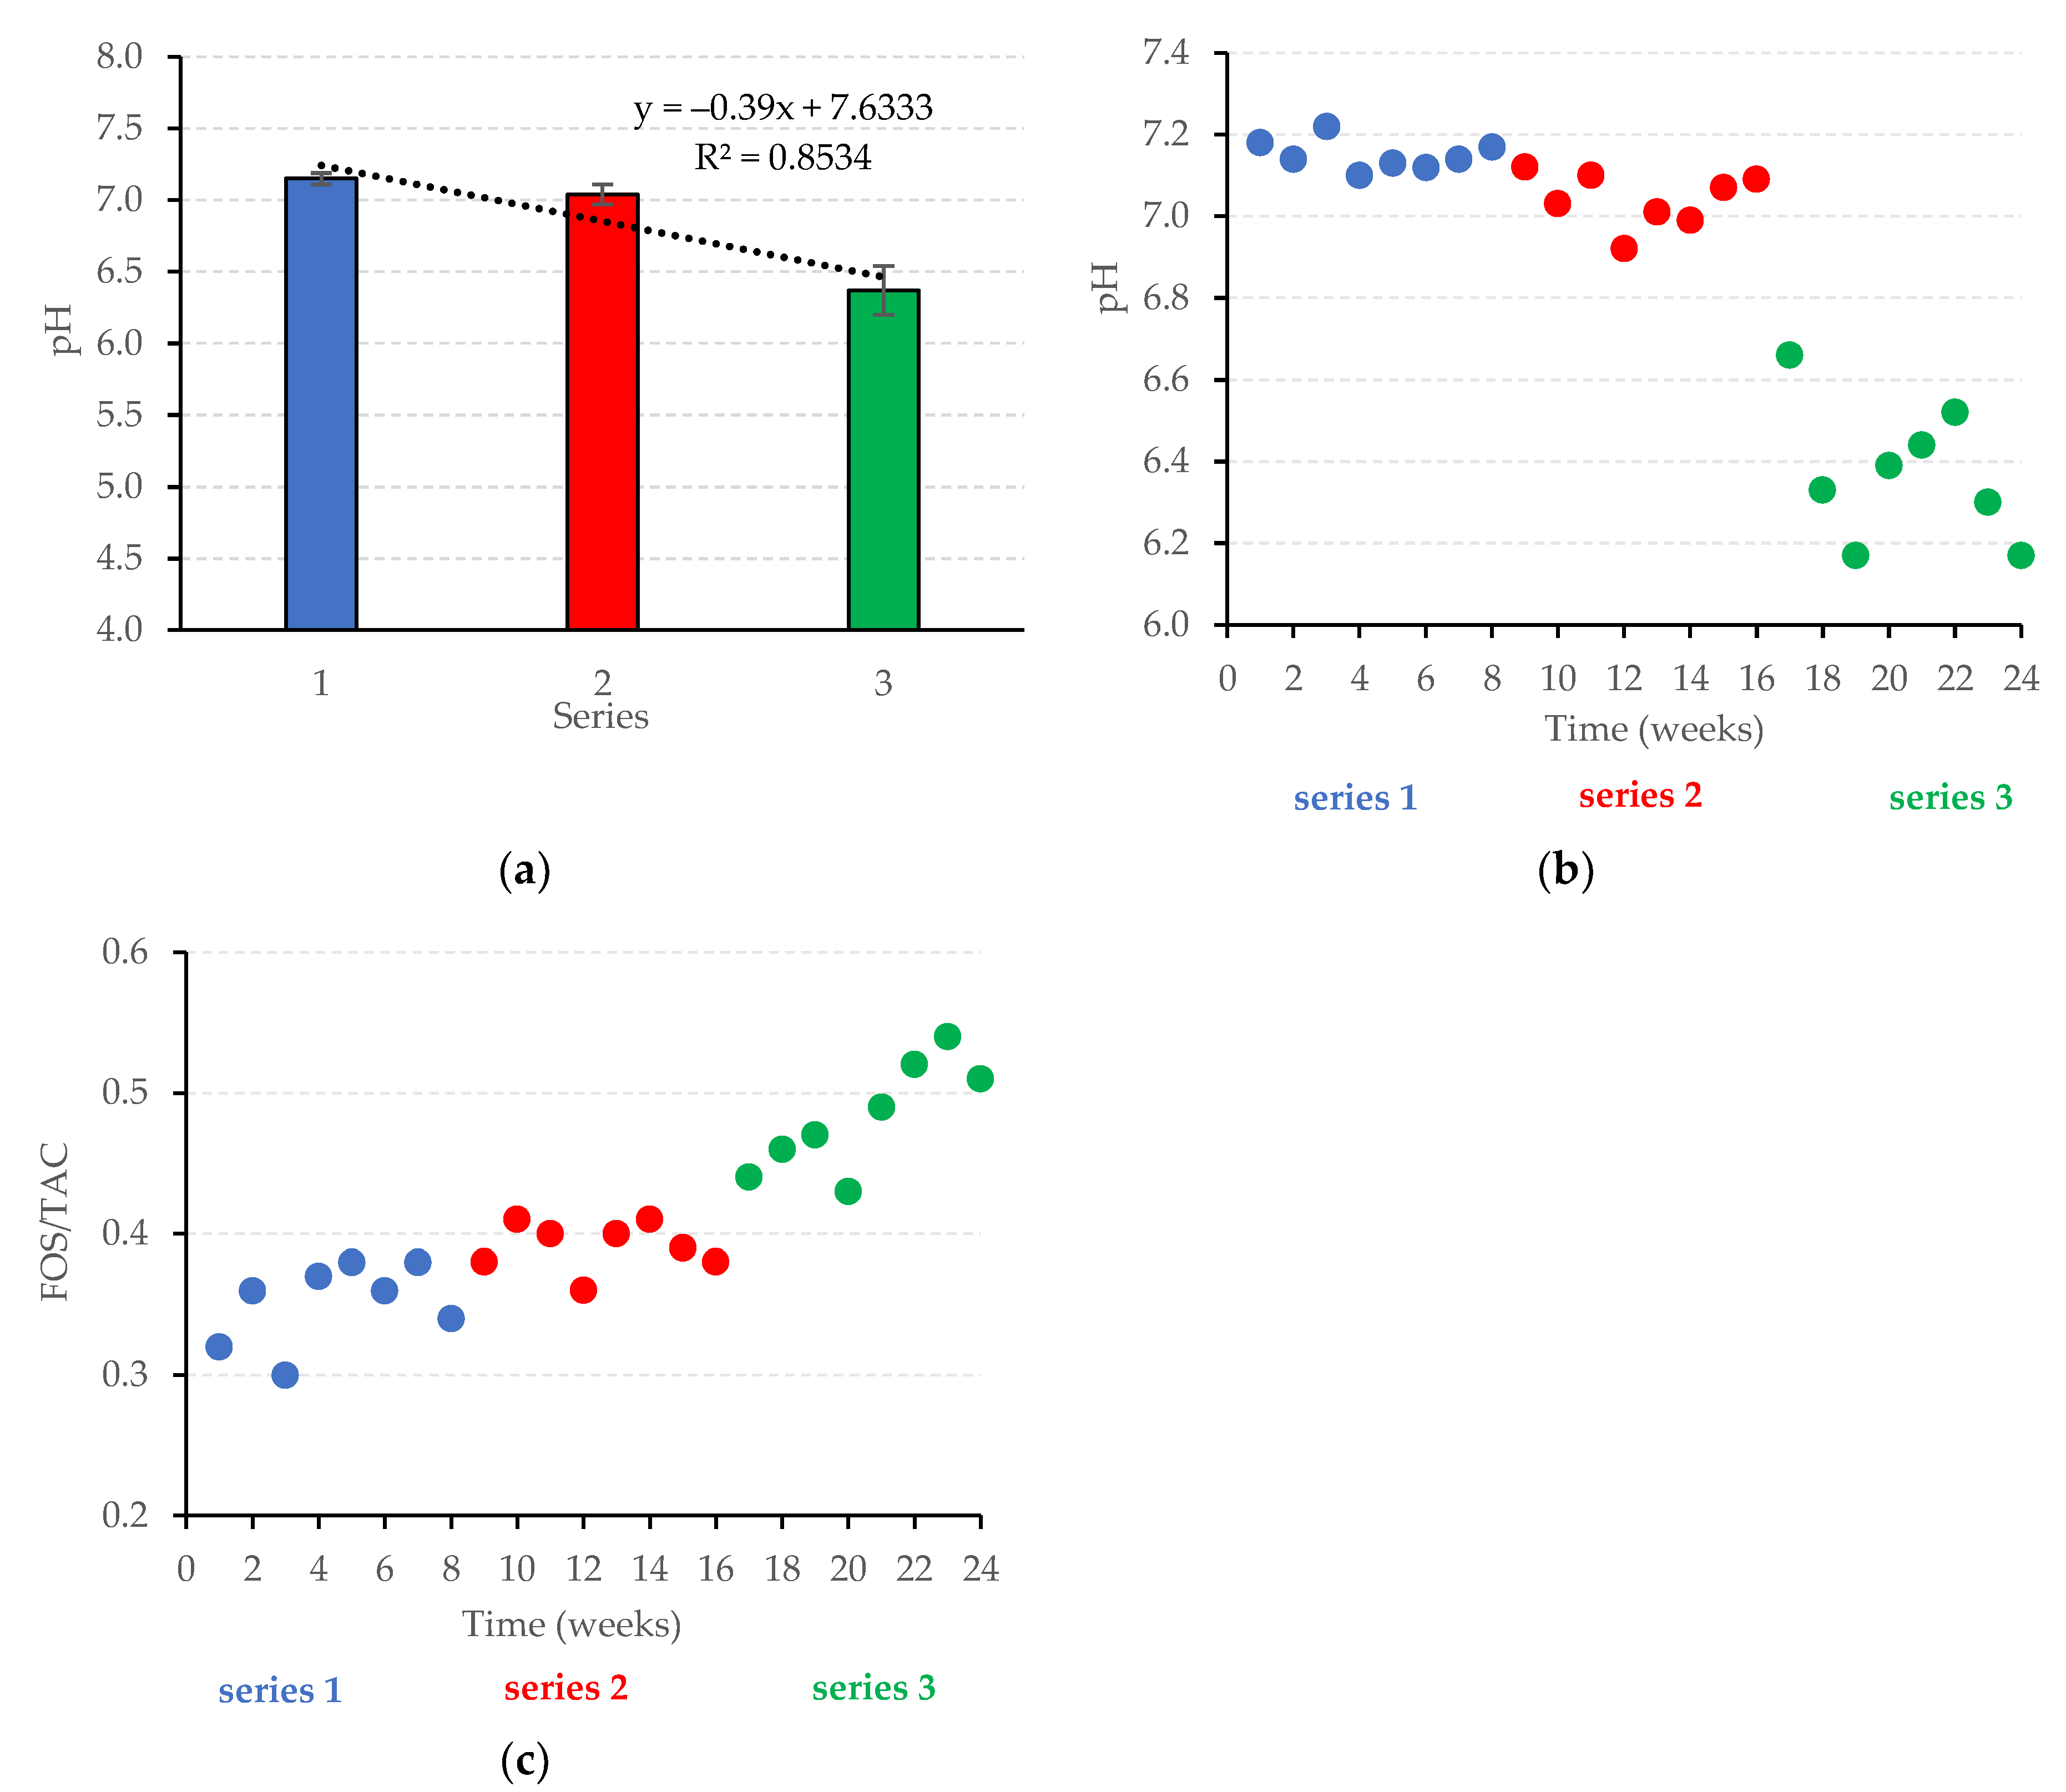
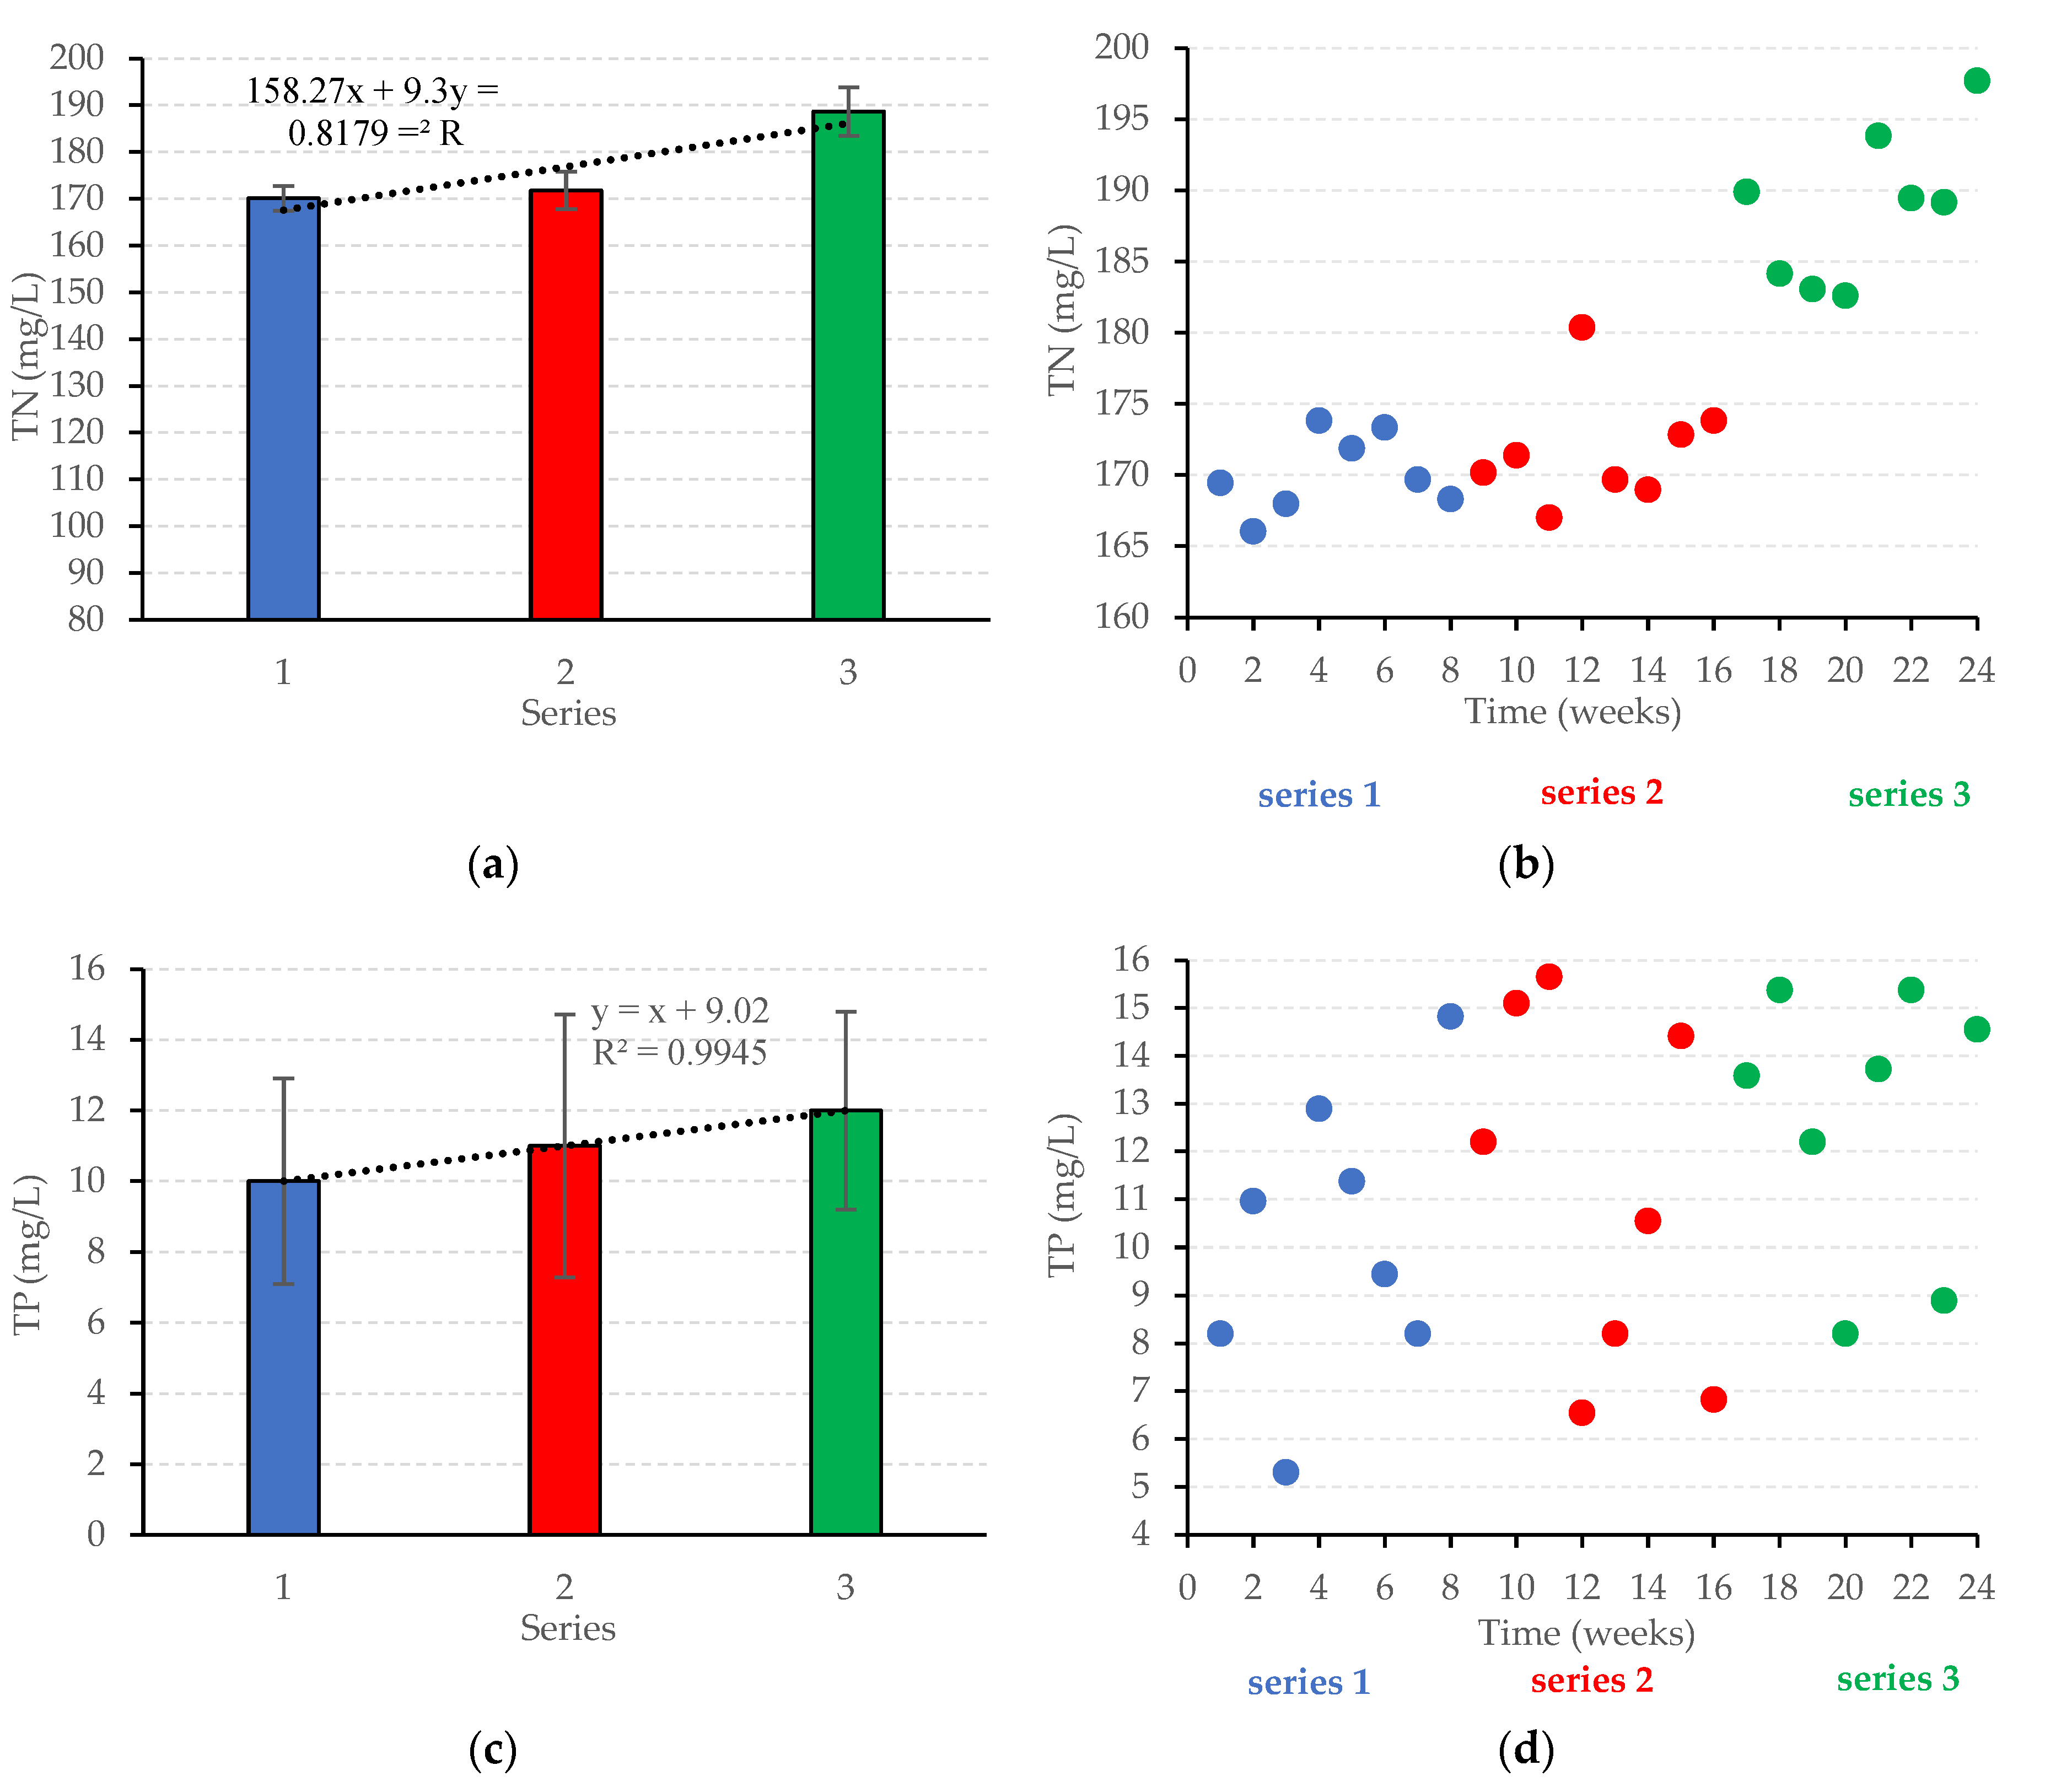
3. Results and Discussion

Confectionery wastewater used in the study originating from the plant that produced gingerbreads, jelly biscuits, shortbread biscuits, and biscuits is shown in Table 1. As can be seen, it contained a high concentration of organic compounds (11,200 ± 1700 mg O2/L as COD and 5100 ± 600 mg O2/L as BOD5), a TN value of 198 ± 27 mg/L, lipids concentration on the level of 370 ± 120 mg/L, and a low content of phosphorus (14 ± 7 mg/L). A balanced carbon-to-nitrogen (C/N) ratio is necessary for the optimization of methane production during anaerobic digestion [36]. It was found that the C/N ratio between 20 and 35 is recommended for maximizing methane generation [37,38]. In the study, the C/N ratio was over 56, indicating the excess carbon content in the wastewater. According to the literature, the excess carbon concentration may result in the accumulation of CO2 in the biogas [36,39]. In turn, the TOC/TN ratio was at the level of 18.9. According to the literature, the optimal ratio of TOC/TN for anaerobic digestion is from 20:1 to 30:1 [40,41], however other authors found that 15 was also suitable [42]. Confectionery wastewater used in the study had a low content of dissolved matter and was characterized by a high concentration of suspended solids (Table 1). The average pH was close to the neutral value of 6.71 ± 0.16, which was favorable for anaerobic digestion.
The high organic content in confectionery sewage promoted the application of anaerobic digestion as a method of treatment. The experiments were performed in 500 mL respirometric reactors and in semi-technical scaled AL-FB with a working volume of 110 L.
In stage 1, the respirometric reactors were operated at four different OLRs of 2.0, 5.0, 7.0, and 8.0 g COD/L·d. The application of increasing OLRs to respirometric reactors directly influenced the reduction of its performance. COD reduction was found to be higher at OLRs 2.0 g COD/L·d and 5.0 g COD/L·d, and respectively were 56.8 ± 4.6% and 54.6 ± 2.3% compared to OLRs of 7.0 g COD/L·d and 8.0 g COD/L·d (Figure 4, Table 5). A similar relationship was noted for BOD5 and TOC removal (Figure 4, Table 5). However, the highest organic load removal of 1.37 ± 0.04 g COD/d was noted at OLR of 5.0 g COD/L·d, which was over two times higher than at the lowest OLR (Table 5). The FOS/TAC ratio was found to be less than 0.4 for OLRs (0.33 in series 1 and 0.37 in series 2) indicating the presence of a proper buffering capacity in the reactor chambers, [43,44]. The highest CH4 production of 0.34 ± 0.014 L CH4/d (0.25 ± 0.010 L CH4/g COD removed) was achieved when OLR was 5.0 g COD/L·d (Table 5, Figure 4). There was a significant decrease in CH4 generation (0.25 ± 0.019 L CH4/d) when the OLR increased to 7.0 g COD/L·d (Table 5). The pH value in series 1–3 was from 6.73 ± 0.09 in series 3 to 6.94 ± 0.17 in series 1, which was within the optimum range for methanogens (pH 6.6–7.0) [45,46]. The increase in OLR in series 4 led to a decrease in pH to the average level of pH 6.31 ± 0.11, growth in FOS/TAC ratio to 0.51, and a reduction in biogas production to the level of 0.18 ± 0.009 L CH4/d (0.16 ± 0.008 L CH4/g COD removed) (Table 5, Figure 4).
Based on the results from stage 1, biogas productivity, COD removal efficiency, and organic load removal were the highest at OLR of 5.0 g COD/L·d. Thus, in the second stage of the experiment, the AL-FB reactor was initially fed at 5.0 g COD/L·d, and then gradually increased to 6.0 and 7.0 g COD/L·d.
The efficiency of organic compound removal determines the yield of methane produced and generally, a higher COD removal indicates a better conversion of organic compounds into biogas components [47]. In stage 2, the highest organic compound removal of about 75% as COD was obtained at OLRs ranging from 5.0 to 6.0 g COD/L·d, and at OLR of 7.0 g COD/L·d it dropped to 61.6 ± 4.4% (Table 6, Figure 5). The obtained removals were lower than the performances achieved by other researchers. For example, Beal and Raman [16] exploited a sequential two-stage anaerobic treatment system of confectionery wastewater consisting of an upflow anaerobic sludge blanket (UASB) reactor and a downflow anaerobic filter. They found that the UASB reactor achieved COD removal of 98%, while the downflow filter achieved about 50%. The two-stage anaerobic system enhanced COD removal to an overall treatment efficiency of 98% as COD at an overall OLR of 12.5 g/L·d. Balcıoğlu et al. [31] reported 99% of COD removal efficiency at OLRs ranging from 1.1 to 7.9 g COD/L·d in an Anaerobic Membrane Bioreactor (AnMBR). The AnMBR is an integrated system of the anaerobic reactor and the low-pressure ultrafiltration or microfiltration membrane filtration, in which membranes retain suspended solids, thus in the AnMBR system, a complete separation of the solid retention time from the hydraulic retention time is achieved, enhancing an overall COD removal [48]. In turn, 85.46% COD removal was achieved during anaerobic treatment with the application of ultrasound pretreatment [39]. The pretreatment promotes the disintegration of complex structure molecules, which were easier degraded by anaerobic microflora [49]. The treatment of wastewater containing sugars by the UASB reactor was also investigated by Tanksali et al. [50]. The COD removal efficiency was obtained from 80% to 96% within the values of OLR between 2 g COD/L·d to 4.67 g COD/L·d.
In the study, any pretreatment was used to enhance COD removal. As the sewage was rich in suspended solids, a relatively low removal of organic compounds could be attributed to their poor decomposition. According to Ramanathan et al. [51], particulate organic material limited the hydrolysis stage of anaerobic digestion. Moreover, lipids, which are usually abundant in confectionery wastewater, may also be the cause. Some authors noted that lipid hydrolysis is the rate-limiting step of the overall anaerobic digestion process and the rate of lipid hydrolysis is affected by their chemical and physical properties (i.e., degree of un-saturation, fluidity, available surface area, particle size) [52,53]. For example, saturated lipids and long-chain fatty acids (LCFA) in mesophilic temperatures are in the solid phase, therefore their availability to microorganisms is limited [54,55]. The size of LCFA also affects its bioavailability [56]. In addition, it was found that LCFAs suppress microbial activity by adsorbing onto the cells of biomass limiting access to substrate and nutrients [56].
When OLR was maintained at 5.0–6.0 g COD/L·d, a FOS/TAC ratio was below 0.4, indicating reactor stability (Figure 6). The average pH in the chamber of the reactor was on the level of 7.15 ± 0.04 at OLR 5.0 g COD/L·d, and 7.04 ± 0.07 at OLR 6.0 g COD/L·d (Figure 6). Under such conditions, biogas production achieved 145.8 ± 10.0 L/d (0.29 ± 0.02 L/g COD removed) in series 2 and 135.0 ± 12.6 L/d (0.32 ± 0.03 L/g COD removed) series 1 (Table 6, Figure 7). The highest daily methane production of 97.1 ± 5.1 L CH4 was obtained when OLR was maintained at OLR 6.0 g COD/L·d (Table 6). However, the highest CH4 concentration in biogas of 70.1 ± 0.7% was at the lowest OLR (Figure 7). An increase in OLR to 7.0 g COD/L·d resulted in a significant reduction in biogas and CH4 production, the pH value dropped to 6.37 ± 0.17, while the FOS/TAC ratio increased to 0.48, which indicates the accumulation of volatile fatty acids in a reactor chamber and overloading the reactor (Table 6, Figure 6 and Figure 7) [43,57,58].
The treatment of confectionery wastewater was also studied by Balcıoğlu et al. [31]. They operated an anaerobic membrane bioreactor (AnMBR) at various OLRs of 1.1, 2.2, 4.4, 6.6, and 7.9 g COD/L·d. The maximum methane production of 0.26 L/g COD removed was achieved at OLR 7.9 g COD/L·d, which was lower than the values obtained in the study (Table 6). In turn, the average biogas production in the EGSB reactor treating confectionery wastewater achieved 1730 m3/d and 88% of COD removal at OLR 2.9 ± 0.8 g COD/L·d [12]. Rusín et al. [59] obtained the biogas production from confectionery wastes (waste wafer material) of 0.703 L/g volatile solids removed with an average methane content in biogas of 55.1% at the average load of 8.23 g volatile solids/L·d.
During anaerobic digestion, the complex compounds of nutrients in the sewage were decomposed into simple particles that could be easily absorbed by microorganisms. It was observed that in series 1 and 2, the concentration of total nitrogen in digestate was on the level of 170–172 mg/L, while in series 3 it was higher (188.7 ± 5.2 mg/L) (Figure 8). There were no differences in phosphorus contents in digestate in all series (Figure 8). During anaerobic digestion, the removal of nitrogen and phosphorus from sewage is low and mainly related to the biomass cells growing [60]. Thus, generally, the biological degradation of the organic matter leads to an increase in the concentration of soluble nutrient species in digestate, in the form of ammonia nitrogen and orthophosphate [61].
The results of this work could be taken for optimizing the operational conditions of the full-scale plant and also as a starting basis for scaling up the process to the industrial scale. Due to the high organic content of confectionery effluents, the new construction of the anaerobic reactor is suitable to treat such kinds of sewage. Anaerobic digestion takes place in four metabolic phases (hydrolysis, acidogenesis, acetogenesis, and methanogenesis), and each of them requires specific conditions for a smooth and efficient run [62,63]. The most popular reactors used in full-scale to treat confectionery sewage are single-stage tank biogas reactors, such as UASB and EGSB reactors, in which all phases of anaerobic digestion are conducted in parallel in one digestion chamber. The disadvantage of using single-stage tank reactors is the possibility of destabilizing the process when treating high loads of organic substrate due to acidification [1]. This can lead to process upsets and considerable downtimes [58]. In the AL-FB, individual phases of anaerobic digestion take place in separate chambers which promotes the treatment of highly loaded confectionery wastewater. In the study, biogas production was high regardless of OLRs, even though the COD removal was lower than noted by other researchers using single-stage tank anaerobic reactors. According to the literature, the separation of metabolic pathways of the digestion enhanced to produce biogas, because the products of the hydrolysis could be added dynamically to the methanogenic stage [1,64,65].

4. Conclusions

A high content of organic compounds in confectionery wastewater promotes the application of anaerobic digestion as a method of treatment. Moreover, biogas production is a benefit that can be used as a source of renewable energy. The experimental studies were focused on determining the technological parameters of anaerobic digestion for effective organic compound removal with simultaneous high methane production efficiency.
The research was carried out in two stages. In the first stage, respirometric reactors were used in batch anaerobic biodegradability tests to select the most effective OLR. There were identified four series depending on OLR ranging from 2.0 g COD/L·d to 8.0 g COD/L·d. On the basis of the results from stage 1, biogas productivity, COD removal efficiency, and organic load removal were the highest at OLR of 5.0 g COD/L·d.
In the second stage, the anaerobic labyrinth-flow bioreactor with innovative construction and a working volume of 110 L was operated on a semi-technical scale. The reactor was initially fed at 5.0 g COD/L·d, and then gradually increased to 6.0 and 7.0 g COD/L·d. When OLR was maintained at 5.0–6.0 g COD/L·d, biogas production ranged from 135.0 ± 12.6 L/d (0.32 ± 0.03 L/g COD removed) to 145.8 ± 10.0 L/d (0.29 ± 0.02 L/g COD removed). Under such conditions, the FOS/TAC ratio was below 0.4, and the pH in the chamber of the reactor was 7.04 ± 0.07–7.15 ± 0.04, indicating reactor stability. The highest daily methane production of 97.1 ± 5.1 L CH4 was obtained at OLR 6.0 g COD/L·d, while the highest CH4 concentration in biogas of 70.1 ± 0.7% was noted at OLR 5.0 g COD/L·d. An increase in OLR to 7.0 g COD/L·d resulted in a significant reduction in biogas and methane production. Anaerobic digestion of confectionery wastewater did not contribute to the significant removal of nitrogen and phosphorus.

Author Contributions

Conceptualization, M.D. and M.Z.; Data curation, M.D., M.K., J.K. and M.Z.; Formal analysis, M.D. and M.Z.; Funding acquisition, M.D. and M.Z.; Investigation, M.K.; Methodology, M.Z.; Project administration, M.D.; Resources, M.D., M.K., J.K. and M.Z.; Supervision, M.D.; Writing—original draft, M.K. and J.K.; Writing—review & editing, M.D. All authors have read and agreed to the published version of the manuscript.

Funding

This project was financially supported by Minister of Education and Science in the range of the program entitled “Regional Initiative of Excellence” for the years 2019–2023, project no. 010/RID/2018/19, amount of funding: PLN 12,000,000, and project no. 29.610.023-110 of the University of Warmia and Mazury in Olsztyn funded by the Minister of Education and Science.

Data Availability Statement

Not applicable.

Acknowledgments

Not applicable.

Conflicts of Interest

The authors declare no conflict of interest. The funders had no role in the design of the study, in the collection, analyses and or interpretation of data, in the writing of the manuscript and in the decision to publish the results.

References

  1. Dereli, R.K. Modeling long-term performance of full-scale anaerobic expanded granular sludge bed reactor treating confectionery industry wastewater. Environ. Sci. Pollut. Res. 2019, 6, 25037–25045. [Google Scholar] [CrossRef] [PubMed]
  2. Zajda, M.; Aleksander-Kwaterczak, U. Wastewater treatment methods for effluents from the confectionery industry—An overview. J. Ecol. Eng. 2019, 20, 293–304. [Google Scholar] [CrossRef]
  3. Statista com. Available online: https://www.statista.com/outlook/cmo/food/confectionery-snacks/confectionery/united-states (accessed on 2 November 2022).
  4. Dębowski, M.; Zieliński, M. Technological Effectiveness of Sugar-Industry Effluent Methane Fermentation in a Fluidized Active Filling Reactor (FAF-R). Energies 2020, 13, 6626. [Google Scholar] [CrossRef]
  5. Sabliy, L.A.; Zhukowa, V.S. Efficient treatment of industrial wastewater using immobilized microorganisms. In Water Supply and Wastewater Disposal; Kowalska, B., Kowalski, D., Eds.; Wydawnictwo Politechniki Lubelskiej: Lublin, Poland, 2022; pp. 248–262. [Google Scholar]
  6. Mikheeva, E.R.; Katraeva, I.V.; Kovalevc, A.A.; Kovalevc, D.A.; Litti, Y.V. Effects of pretreatment in a vortex layer apparatus on the properties of confectionery wastewater and its dark fermentation. Int. J. Hydrog. Energy 2022, 47, 23165–23174. [Google Scholar] [CrossRef]
  7. Ersahin, E.M.; Ozgun, H.; Dereli, R.K.; Ozturk, I. Anaerobic Treatment of Industrial Effluents: An Overview of Applications. In Waste Water: Treatment and Reutilization; Einschlag, F.S.G., Ed.; InTech Open: Rijeka, Croatia, 2011; pp. 3–26. [Google Scholar]
  8. Nasr, F.A.; Abdelfattah, I.; El-Shafai, S.A. Cost Effective Management of Confectionery Industrial Wastewater. Egypt. J. Chem. 2022, 65, 391–399. [Google Scholar] [CrossRef]
  9. Zieliński, M.; Dębowski, M.; Kazimierowicz, J. The Effect of Static Magnetic Field on Methanogenesis in the Anaerobic Digestion of Municipal Sewage Sludge. Energies 2021, 14, 590. [Google Scholar] [CrossRef]
  10. Pilarska, A. Anaerobic Co-Digestion of Waste Wafers from Confectionery Production with Sewage Sludge. Pol. J. Environ. Stud. 2018, 27, 237–245. [Google Scholar] [CrossRef]
  11. Ntuli, F.; Kuipa, P.K.; Muzenda, E. Designing of sampling programmes for industrial effluent monitoring. Environ. Sci. Pollut. Res. 2011, 18, 479–484. [Google Scholar] [CrossRef]
  12. Ozgun, H.; Karagul, N.; Dereli, R.K.; Ersahin, M.E.; Coskuner, T.; Ciftci, D.I.; Ozturk, I.; Altinbas, M. Confectionery industry: A case study on treatability-based effluent characterization and treatment system performance. Water Sci. Technol. 2012, 66, 15–20. [Google Scholar] [CrossRef]
  13. Bratina, B.; Sorgo, A.; Kramberger, J.; Ajdnik, U. From municipal/industrial wastewater sludge and FOG to fertilizer: A proposal for economic sustainable sludge management. J. Environ. Manag. 2016, 183 Pt 3, 1009–1025. [Google Scholar] [CrossRef]
  14. Mininni, G.; Blanch, A.R.; Lucena, F.; Berselli, S. EU policy on sewage sludge utilization and perspectives on new approaches of sludge management. Environ. Sci. Pollut. Res. 2015, 22, 7361–7374. [Google Scholar] [CrossRef]
  15. Yogeswari, M.K.; Dharmalingam, K.; Mullai, P. Implementation of artificial neural network model for continuous hydrogen production using confectionery wastewater. J. Environ. Manag. 2019, 252, 109684. [Google Scholar] [CrossRef]
  16. Beal, L.J.; Raman, D.R. Sequential Two-stage Anaerobic Treatment of Confectionery Wastewater. J. Agric. Eng. Res. 2000, 76, 211–217. [Google Scholar] [CrossRef]
  17. Wei, C.; Zhang, T.; Feng, C.; Wu, H.; Deng, Z.; Wu, C.; Lu, B. Treatment of food processing wastewater in a full-scale jet biogas internal loop anaerobic fluidized bed reactor. Biodegradation 2011, 22, 347–357. [Google Scholar] [CrossRef]
  18. Sinsuw, A.A.E.; Wuisang, C.E.; Chu, C.Y. Assessment of environmental and social impacts on rural community by two-stage biogas production pilot plant from slaughterhouse wastewater. J. Water Process Eng. 2021, 40, 101796. [Google Scholar] [CrossRef]
  19. Shrivastava, V.; Ali, I.; Marjub, M.M.; Rene, E.R.; Soto, A.M.F. Wastewater in the food industry: Treatment technologies and reuse potential. Chemosphere 2022, 293, 133553. [Google Scholar] [CrossRef]
  20. Rajeshwari, K.V.; Balakrishnan, M.; Kansal, A.; Lata, K.; Kishore, V.V.N. State-of-the-art of anaerobic digestion technology for industrial wastewater treatment. Renew. Sustain. Energy Rev. 2000, 4, 135–156. [Google Scholar] [CrossRef]
  21. Qu, Y.; Qu, J.; Yan, W.; Yue, T.; Zhang, Q.; Yi, W.; Sun, Y. Influence of Biochar on Physico-Chemical, Microbial Community and Maturity during Biogas Residue Aerobic Composting Process. Fermentation 2022, 8, 623. [Google Scholar] [CrossRef]
  22. Monroy, O.; Famá, G.; Meraz, M.; Montoya, L.; Macarie, H. Anaerobic digestion for wastewater treatment in Mexico: State of the technology. Water Res. 2000, 34, 1803–1816. [Google Scholar] [CrossRef]
  23. Stronach, S.M.; Rudd, T.; Lester, J.N. Anaerobic Digestion Processes in Industrial Wastewater Treatment (Biotechnology Monographs), 2nd ed.; Springer: New York, NY, USA, 2011. [Google Scholar]
  24. Kumar, A.; Samadder, S.R. Performance evaluation of anaerobic digestion technology for energy recovery from organic fraction of municipal solid waste: A review. Energy 2020, 197, 117253. [Google Scholar] [CrossRef]
  25. Bhatt, A.H.; Tao, L. Economic Perspectives of Biogas Production via Anaerobic Digestion. Bioengineering 2020, 7, 74. [Google Scholar] [CrossRef]
  26. Esparza-Soto, M.; Alcaraz-Ibarra, S.; Lucero-Chávez, M.; Mier-Quiroga, M.; Fall, C. Influence of low operating temperature on biomass yield during anaerobic treatment of chocolate confectionery wastewater in a pilot-scale UASB reactor. J. Water Process Eng. 2022, 48, 102918. [Google Scholar] [CrossRef]
  27. Alcaraz-Ibarra, S.; Mier-Quiroga, M.A.; Esparza-Soto, M.; Lucero-Chávez, M.; Fall, C. Treatment of chocolate-processing industry wastewater in a low-temperature pilot-scale UASB: Reactor performance and in-situ biogas use for bioenergy recovery. Biomass Bioenergy 2020, 142, 105786. [Google Scholar] [CrossRef]
  28. Kaviyarasan, K. Application of UASB reactor in industrial wastewater treatment—A review. Int. J. Sci. Eng. Res. 2014, 5, 584. [Google Scholar]
  29. Mainardis, M.; Buttazzoni, M.; Goi, D. Up-flow anaerobic sludge blanket (UASB) technology for energy recovery: A review on state-of-the-art and recent technological advances. Bioengineering 2020, 7, 43. [Google Scholar] [CrossRef]
  30. Seghezzo, L.; Zeeman, G.; van Lier, J.B.; Hamelers, H.V.M.; Lettinga, G. A review: The anaerobic treatment of sewage in UASB and EGSB reactors. Bioresour. Technol. 1998, 65, 175–190. [Google Scholar] [CrossRef]
  31. Balcıoğlu, G.; Yilmaz, G.; Goender, Z.B. Evaluation of anaerobic membrane bioreactor (AnMBR) treating confectionery wastewater at long-term operation under different organic loading rates: Performance and membrane fouling. Chem. Eng. J. 2021, 404, 126261. [Google Scholar] [CrossRef]
  32. Di Berardino, S.; Costa, S.; Converti, A. Semi-continuous anaerobic digestion of a food industry wastewater in an anaerobic filter. Bioresour. Technol. 2000, 71, 261–266. [Google Scholar] [CrossRef]
  33. Young, J.C.; McCarty, P.L. The anaerobic filter for waste treatment. J. Water Pollut. Control. Fed. 1969, 41, R160–R173. [Google Scholar]
  34. Rajagopal, R.; Saady, N.M.C.; Torrijos, M.; Thanikal, J.V.; Hung, Y.T. Sustainable agro-food industrial wastewater treatment using high rate anaerobic process. Water 2013, 5, 292–311. [Google Scholar] [CrossRef] [Green Version]
  35. Lau, P.L.; Trzcinski, A.P. A review of modified and hybrid anaerobic baffled reactors for industrial wastewater treatment. Water Sci. Eng. 2022, 15, 247–256. [Google Scholar] [CrossRef]
  36. Induchoodan, T.G.; Haq, I.; Kalamdhad, A.S. Factors affecting anaerobic digestion for biogas production: A review. In Advanced Organic Waste Management; Chaudhery, H., Subrata, H., Eds.; Elsevier: Amsterdam, The Netherlands, 2022; pp. 223–233. [Google Scholar] [CrossRef]
  37. Khanal, S.K.; Nindhia, T.G.T.; Nitayavardhana, S. Biogas from wastes: Processes and applications. In Sustainable Resource Recovery and Zero Waste Approaches; Taherzadeh, M., Bolton, K., Wong, J., Pandey, A., Eds.; Elsevier: Amsterdam, The Netherlands, 2019; pp. 165–174. [Google Scholar]
  38. Labatut, R.A.; Pronto, J.L. Sustainable waste-to-energy technologies: Anaerobic digestion. In Sustainable Food Waste-to-Energy Systems; Trabold, T.A., Babbit, C.W., Eds.; Academic Press: London, UK, 2018; pp. 47–67. [Google Scholar]
  39. Muthudineshkumar, R.; Anand, R. Anaerobic digestion of various feedstocks for second-generation biofuel production. In Advances in Eco-Fuels for a Sustainable Environment; Azad, K., Ed.; Woodhead Publishing: Sawston, UK, 2019; pp. 157–185. [Google Scholar]
  40. Dębowski, M.; Kazimierowicz, J.; Zieliński, M.; Bartkowska, I. Co-Fermentation of Microalgae Biomass and Miscanthus × giganteus Silage—Assessment of the Substrate, Biogas Production and Digestate Characteristics. Appl. Sci. 2022, 12, 7291. [Google Scholar] [CrossRef]
  41. Xue, S.; Wang, Y.; Lyu, X.; Zhao, N.; Song, J.; Wang, X.; Yang, G. Interactive effects of carbohydrate, lipid, protein composition and carbon/nitrogen ratio on biogas production of different food wastes. Bioresour. Technol. 2020, 312, 123566. [Google Scholar] [CrossRef] [PubMed]
  42. Romano, R.T.; Zhang, R. Co-digestion of onion juice and wastewater sludge using an anaerobic mixed biofilm reactor. Bioresour. Technol. 2008, 99, 631–637. [Google Scholar] [CrossRef] [PubMed]
  43. Lili, M.; Biró, G.; Sulyok, E.; Petis, M.; Borbély, J.; Tamás, J. Novel approach on the basis of FOS/TAC method. An. Univ. Ii Din Oradea Fasc. Protecţia Mediu. 2011, 17, 713–718. [Google Scholar]
  44. Liu, X.; André, L.; Mercier-Huat, M.; Grosmaître, J.M.; Pauss, A.; Ribeiro, T. Accurate Estimation of Bicarbonate and Acetic Acid Concentrations with Wider Ranges in Anaerobic Media Using Classical FOS/TAC Titration Method. Appl. Sci. 2021, 11, 11843. [Google Scholar] [CrossRef]
  45. Ghaly, A.; Ramkumar, D.R.; Sadaka, S.; Rohon, J.D. Effect of reseeding and pH control on the performance of a two-stage mesophilic anaerobic digester operating on acid cheese whey. Can. Agric. Eng. 2000, 42, 173–183. [Google Scholar]
  46. Kothari, R.; Pandey, A.K.; Kumar, S.; Tyagi, V.V.; Tyagi, S.K. Different aspects of dry anaerobic digestion for bio-energy: An overview. Renew. Sustain. Energy Rev. 2014, 39, 174–195. [Google Scholar] [CrossRef]
  47. Choeisai, P.; Jitkam, N.; Silapanoraset, K.; Yubolsai, C.; Yoochatchaval, W.; Yamaguchi, T.; Onodera, T.; Syutsubo, K. Sugarcane molasses-based bio-ethanol wastewater treatment by two-phase multi-staged up-flow anaerobic sludge blanket (UASB) combination with up-flow UASB and down-flow hanging sponge. Water Sci. Technol. 2014, 6, 1174–1180. [Google Scholar] [CrossRef]
  48. Chang, S. Anaerobic membrane bioreactors (AnMBR) for wastewater treatment. Adv. Chem. Eng. Sci. 2014, 4, 42423. [Google Scholar] [CrossRef] [Green Version]
  49. Oz, N.A.; Uzun, A.C. Ultrasound pretreatment for enhanced biogas production from olive mill wastewater. Ultrason. Sonochemistry 2015, 22, 565–572. [Google Scholar] [CrossRef]
  50. Tanksali, A.S. Treatment of sugar industry wastewater by upflow anaerobic sludge blanket reactor. Int. J. ChemTech Res. 2013, 5, 1246–1253. [Google Scholar]
  51. Ramanathan, R.M.; Balasubramanian, N.; Chithra, K. Biogas from confectionery wastewater with the application of ultrasound pre-treatment. Energy Sour Part A Recovery Util. Environ. Eff. 2022, 44, 2309–2320. [Google Scholar] [CrossRef]
  52. Vavilin, V.A.; Fernandez, B.; Palatsi, J.; Flotats, X. Hydrolysis kinetics in anaerobic degradation of particulate organic material: An overview. Waste Manag. 2008, 28, 939–951. [Google Scholar] [CrossRef] [PubMed]
  53. Ware, A.; Power, N. What is the effect of mandatory pasteurisation on the biogas transformation of solid slaughterhouse wastes? Waste Manag. 2016, 48, 503–512. [Google Scholar] [CrossRef] [Green Version]
  54. Wu, L.J.; Kobayashi, T.; Li, Y.Y.; Xu, K.Q.; Lv, Y. Determination and abatement of methanogenic inhibition from oleic and palmitic acids. Int. Biodeterior. Biodegrad. 2017, 123, 10–16. [Google Scholar] [CrossRef]
  55. Ramachandran, K.B.; Al-Zuhair, S.; Fong, C.S.; Gak, C.W. Kinetic study on hydrolysis of oils by lipase with ultrasonic emulsification. Biochem. Eng. J. 2006, 32, 19–24. [Google Scholar] [CrossRef]
  56. Dereli, R.K.; van der Zee, F.P.; Heffernan, B.; Grelot, A.; van Lier, J.B. Effect of sludge retention time on the biological performance of anaerobic membrane bioreactors treating corn-to-ethanol thin stillage with high lipid content. Water Res. 2014, 49, 453–464. [Google Scholar] [CrossRef]
  57. Nkuna, R.; Roopnarain, A.; Rashama, C.; Adeleke, R. Insights into organic loading rates of anaerobic digestion for biogas production: A review. Crit. Rev. Biotechnol. 2022, 42, 487–507. [Google Scholar] [CrossRef]
  58. Moeller, L.; Zehnsdorf, A. Process upsets in a full-scale anaerobic digestion bioreactor: Over-acidification and foam formation during biogas production. Energy Sustain. Soc. 2016, 6, 1–10. [Google Scholar] [CrossRef] [Green Version]
  59. Rusín, J.; Kašáková, K.; Chamrádová, K. Anaerobic digestion of waste wafer material from the confectionery production. Energy 2015, 85, 194–199. [Google Scholar] [CrossRef]
  60. Campos, J.L.; Crutchik, D.; Franchi, Ó.; Pavissich, J.P.; Belmonte, M.; Pedrouso, A.; Mosquera-Corral, A.; Val del Río, Á. Nitrogen and phosphorus recovery from anaerobically pretreated agro-food wastes: A review. Front. Sustain. Food Syst. 2019, 2, 91. [Google Scholar] [CrossRef] [Green Version]
  61. Di Costanzo, N.; Cesaro, A.; Di Capua, F.; Esposito, G. Exploiting the nutrient potential of anaerobically digested sewage sludge: A review. Energies 2021, 14, 8149. [Google Scholar] [CrossRef]
  62. Kazimierowicz, J.; Dębowski, M. Aerobic Granular Sludge as a Substrate in Anaerobic Digestion—Current Status and Perspectives. Sustainability 2022, 14, 10904. [Google Scholar] [CrossRef]
  63. Richard, E.N.; Hilonga, A.; Machunda, R.L.; Njau, K.N. A review on strategies to optimize metabolic stages of anaerobic digestion of municipal solid wastes towards enhanced resources recovery. Sustain. Environ. Res. 2019, 29, 36. [Google Scholar] [CrossRef] [Green Version]
  64. Janesch, E.; Pereira, J.; Neubauer, P.; Junne, S. Phase Separation in Anaerobic Digestion: A Potential for Easier Process Combination? Front Chem. Eng. 2021, 3, 711971. [Google Scholar] [CrossRef]
  65. Dahiya, S.; Kumar, A.N.; Shanthi Sravan, J.; Chatterjee, S.; Sarkar, O.; Mohan, S.V. Food Waste Biorefinery: Sustainable Strategy for Circular Bioeconomy. Bioresour. Technol. 2018, 248, 2–12. [Google Scholar] [CrossRef]
Figure 1. The study organization.
Energies 16 00571 g001
Figure 2. Schematic diagram of the experimental station in stage 1.
Energies 16 00571 g002
Figure 3. The AL-FB with vertical wastewater flows exploited on a semi-technical scale.
Energies 16 00571 g003
Figure 4. The efficiency of anaerobic confectionery wastewater treatment in stage 1: (a) organic compound removal; (b) CH4 production per g of organic substances removed (b).
Energies 16 00571 g004
Figure 5. The efficiency of anaerobic confectionery wastewater treatment in stage 2: (a) average COD removal with the standard deviation; (b) COD removal during experimental time.
Energies 16 00571 g005
Figure 6. The efficiency of anaerobic confectionery wastewater treatment in stage 2: (a) average pH with the standard deviation; (b) pH in a chamber during experimental time; (c) FOS/TAC ratio in a chamber during experimental time.
Energies 16 00571 g006
Figure 7. The efficiency of anaerobic confectionery wastewater treatment in stage 2: (a) average biogas production per g of COD removed with the standard deviation; (b) biogas production per g of COD removed during experimental time; (c) CH4 concentration in biogas with the standard deviation; (d) CH4 concentration in biogas during experimental time.
Energies 16 00571 g007aEnergies 16 00571 g007b
Figure 8. The efficiency of anaerobic confectionery wastewater treatment in stage 2: (a) average total nitrogen (TN) concentration with the standard deviation; (b) total nitrogen (TN) concentration during experimental time; (c) total phosphorus (TP) concentration with the standard deviation; (d) total phosphorus (TP) concentration during experimental time.
Energies 16 00571 g008
Table 1. Characteristics of confectionery wastewater used in the study (±std. dev., n = 96).
ParameterUnitsValue
CODmg O2/L11,200 ± 1700
BOD5mg O2/L5100 ± 600
TOCmg/L3750 ± 190
TNmg N/L198 ± 27
N-NH4mg N-NH4/L147 ± 14
TPmg P/L19 ± 9
P-PO4mg P-PO4/L14 ± 7
lipids mg/L370 ± 120
suspended solidsmg TS/L890 ± 420
pH-6.71 ± 0.16
Table 2. Characteristics of anaerobic granular sludge used as inoculum in the study (±std. dev., n = 16).
ParameterUnitsValue
hydration%97.3 ± 0.3
capillary suction timesec680 ± 27
total solidsg TS/L44.6 ± 1.8
mineral solidsg MS/L15.8 ± 0.8
volatile solidsg VS/L28.7 ± 1.4
filtrate CODmg O2/L710 ± 80
filtrate P-PO4mg P-PO4/L41.3 ± 7.2
filtrate TNmg TN/L112 ± 13.7
filtrate N-NH4mg N-NH4/L97 ± 9.2
pH-7.42 ± 0.17
Table 3. Study organization and exploitation parameters in stage 1.
SeriesOLR
(g COD/L·d)
Working
Volume of the
Reactor (mL)
COD
(g O2/L)
Sewage Amount (mL/d)COD Load (g/d)HRT (h)
12.050011.2 ± 1.7901.0 ± 0.15133
25.02202.5 ± 0.3854
37.03103.5 ± 0.5339
48.03604.0 ± 0.6133
Table 4. Study organization and exploitation parameters in stage 2.
SeriesOLR
(g COD/L·d)
Working
Volume of the
Reactor (L)
COD
(g O2/L)
Sewage Amount (L/d)Dosing Pump
Capacity (L/h)
COD Load (g/d)HRT (h)
15.011011.2 ± 1.7505.0560 ± 8553
26.0606.0670 ± 10244
37.0707.0780 ± 11938
Table 5. Removal of organic compounds as COD, BOD5, TOC, and production of CH4 in stage 1.
SeriesOLR
(g COD/L·d)
CODCH4 Production
Influent
(g O2/L)
Effluent
(g O2/L)
Removal (%)Influent Load
(g COD/d)
Load
Removal
(g COD/d)
(L CH4/g COD
Introduced)
(L CH4/g COD
Removed)
(L CH4/d)
12.011.2 ± 1.74.84 ± 0.3956.8 ± 4.61.0 ± 0.150.57 ± 0.050.13 ± 0.0110.23 ± 0.0190.13 ± 0.010
25.05.08 ± 0.2154.6 ± 2.32.5 ± 0.381.37 ± 0.040.14 ± 0.0070.25 ± 0.0100.34 ± 0.014
37.07.20 ± 0.5435.7 ± 2.73.5 ± 0.531.25 ± 0.090.07 ± 0.0050.20 ± 0.0150.25 ± 0.019
48.08.11 ± 0.4227.6 ± 1.44.0 ± 0.611.10 ± 0.030.04 ± 0.0020.16 ± 0.0080.18 ± 0.009
SeriesOLR
(g BOD5/L·d)
BOD5CH4 production
Influent
(g O2/L)
Effluent
(g O2/L)
Removal (%)Influent Load
(g BOD5/d)
Load
Removal
(g BOD5/d)
(L CH4/g BOD5
Introduced)
(L CH4/g BOD5
Removed)
(L CH4/d)
10.95.1 ± 0.61.65 ± 0.2267.6 ± 9.00.46 ± 0.050.31 ± 0.040.29 ± 0.0380.42 ± 0.0570.13 ± 0.010
22.31.58 ± 0.1369.0 ± 5.71.14 ± 0.130.79 ± 0.060.30 ± 0.0250.43 ± 0.0360.34 ± 0.014
33.22.49 ± 0.3651.2 ± 7.41.59 ± 0.190.82 ± 0.120.16 ± 0.0230.31 ± 0.0440.25 ± 0.019
43.62.74 ± 0.3846.3 ± 6.41.82 ± 0.210.84 ± 0.110.10 ± 0.0130.21 ± 0.0290.18 ± 0.009
SeriesOLR
(g TOC/L·d)
TOCCH4 Production
Influent
(g/L)
Effluent
(g/L)
Removal (%)Influent Load
(g TOC/d)
Load
Removal
(g TOC/d)
(L CH4/g TOC
Introduced)
(L CH4/g TOC
Removed)
(L CH4/d)
10.73.75 ± 0.21.52 ± 0.1459.5 ± 5.50.33 ± 0.0170.20 ± 0.02039 ± 0.040.66 ± 0.060.13 ± 0.010
21.71.47 ± 0.2160.8 ± 8.70.84 ± 0.0420.51 ± 0.070.41 ± 0.060.67 ± 0.100.34 ± 0.014
32.32.34 ± 0.1837.6 ± 2.91.17 ± 0.0590.44 ± 0.030.21 ± 0.020.57 ± 0.040.25 ± 0.019
42.72.49 ± 0.2733.6 ± 3.61.34 ± 0.0680.45 ± 0.050.13 ± 0.010.39 ± 0.040.18 ± 0.009
Table 6. Removal of organic compounds such as COD, BOD5, TOC, and production of biogas and CH4 in stage 2.
SeriesOLR
(g COD/L·d)
CODBiogas ProductionCH4 Production
Influent
(g O2/L)
Effluent
(g O2/L)
Removal (%)Influent Load
(g COD/d)
Load
Removal
(g COD/d)
(L/d)(L CH4/g COD Removed)(L CH4/d)
15.011.2 ± 1.72.76 ± 0.1775.4 ± 1.5560 ± 85422 ± 8.4135.0 ± 12.60.22 ± 0.0194.7 ± 6.1
26.02.80 ± 0.0675.0 ± 0.6670 ± 102503 ± 4.0145.8 ± 10.00.19 ± 0.0197.1 ± 5.1
37.04.30 ± 0.4861.6 ± 4.4780 ± 118480 ± 32.1129.6 ± 9.60.16 ± 0.0176.4 ± 4.8
SeriesOLR
(g BOD5/L·d)
BOD5Biogas ProductionCH4 Production
Influent
(g O2/L)
Effluent
(g O2/L)
Removal
(%)
Influent Load
(g BOD5/d)
Load
Removal
(g BOD5/d)
(L/d)(L CH4/g BOD5 Removed)(L CH4/d)
12.35.1 ± 0.60.82 ± 0.0383.9 ± 2.7250 ± 29210 ± 6.7135.0 ± 12.60.45 ± 0.0494.7 ± 6.1
22.70.91 ± 0.0482.2 ± 3.6300 ± 35247 ± 10.8145.8 ± 10.00.39 ± 0.0297.1 ± 5.1
33.21.49 ± 0.1370.7 ± 6.2350 ± 41248 ± 21.7129.6 ± 9.60.31 ± 0.0276.4 ± 4.8
SeriesOLR
(g TOC/L·d)
TOCBiogas ProductionCH4 Production
Influent
(g O2/L)
Effluent
(g O2/L)
Removal (%)Influent Load
(g TOC/d)
Load
Removal
(g TOC/d)
(L/d)(L CH4/g TOC Removed)(L CH4/d)
11.73.75 ± 0.20.85 ± 0.0477.4 ± 3.4190 ± 9.6148 ± 6.5135.0 ± 12.60.64 ± 0.0494.7 ± 6.1
22.00.93 ± 0.0675.2 ± 5.2220 ± 11.1165 ± 11.4145.8 ± 10.00.59 ± 0.0397.1 ± 5.1
32.31.32 ± 0.1264.9 ± 8.7250 ± 12.7162 ± 20.1129.6 ± 9.60.47 ± 0.0276.4 ± 4.8
Disclaimer/Publisher’s Note: The statements, opinions and data contained in all publications are solely those of the individual author(s) and contributor(s) and not of MDPI and/or the editor(s). MDPI and/or the editor(s) disclaim responsibility for any injury to people or property resulting from any ideas, methods, instructions or products referred to in the content.

