Article

Experimental Investigation on the Imbibition Behavior of Nanofluids in the Tight Oil and Gas Reservoir through the Application of Nuclear Magnetic Resonance Method

Unconventional Petroleum Research Institute, China University of Petroleum, Beijing 102249, China
*
Author to whom correspondence should be addressed.
Energies 2023, 16(1), 454; https://doi.org/10.3390/en16010454
Submission received: 7 September 2022 / Revised: 13 December 2022 / Accepted: 16 December 2022 / Published: 31 December 2022

Abstract

:
Tight oil and gas resources are widely distributed and play an important role in the petroleum industry. Due to its nanoscale pore-throat characteristics, the capillary effect is remarkable, and spontaneous imbibition is very beneficial to the development of low-permeability reservoirs. In this study, the imbibition experiments of 2D nano blackcard, nanoemulsion, and water were carried out, respectively. The pore-throat fluid distribution characteristics before and after core imbibition were analyzed with nuclear magnetic resonance technology, and the enhanced oil recovery effects of 2D nano blackcard nanoemulsion, and water were comprehensively evaluated. The results show that the final recovery factors of cores soaked in 2D nano blackcard (0.005 ωt%) and nanoemulsion (0.02 ωt%) or imbibed in water are 32.29%, 26.05%, and 7.19%, respectively. It can be found that 2D nano blackcard is the fluid with the best imbibition effect. In this work, a new type of 2D nano blackcard was proposed and identified as a functional imbibition fluid for enhanced oil recovery in tight reservoirs, providing a practical reference for the effective development of tight, low-permeability oil and gas reservoirs.

1. Introduction

Tight, low-permeability reservoirs have low permeability and high resistance to oil–water seepage due to their small rock porosity and compact structure [1]. With the continuous development of the exploration and development of unconventional oil and gas resources, volume fracturing has become the main technical direction of stimulation for this type of reservoir, which is achieved by connecting microfractures to form a complex fracture network and improving conductivity [2]. Tight, low-permeability oil and gas reservoirs have micro–nanoscale pore-throat radii. The pore roar radius is small. While forming a complex fracture network, fracturing artificially changes the wettability of the rock, and uses the capillary force to generate the imbibition effect to achieve oil–water replacement. Supplementing the formation energy has a positive effect on improving single-well production. Spontaneous imbibition refers to the process in which the wetting phase can replace the nonwetting phase only by capillary force in tight reservoirs. It is one of the important displacement mechanisms for enhancing oil recovery in tight oil and gas fields [3]. Scholars at home and abroad have been studying the spontaneous imbibition process of tight reservoirs in different ways since the 1960s and have achieved many results. Li [4] studied the imbibition behavior of surfactant in the core through the imbibition experiment of surfactant solution in the core and corrected the Bond index. Low-permeability cores have different imbibition phenomena and imbibition mechanisms; the primary condition for imbibition in oleophilic and high-permeability cores is the reversal of wettability, so that capillary force becomes the imbibition power.
Nanoparticles have the characteristics of small size (nanoscale), large specific surface area, and green environmental protection [5]. In recent years, its research and application in enhancing oil recovery in tight oil reservoirs have achieved preliminary results. As a new type of fluid, nanofluids have broad application prospects in different enhanced oil recovery (EOR) processes [6,7]. The enhanced oil recovery potential of nanomaterials such as silica (SiO2), zirconium oxide (ZrO2), aluminum oxide (Al2O3), and titanium oxide (TiO2) has been demonstrated in previous studies. Li’s [8] research believes that nanoparticle solutions can effectively improve the imbibition recovery rate of ultra-low-permeability cores. Roustaeia [9] conducted experiments on oil-wet cores using an aqueous solution of a synergistic mixture of cationic surfactants (C12TAB) and SiO2 nanoparticles, and the results showed that the application of SiO2 nanoparticles made the oil-wet cores more hydrophilic, resulting in easier water availability imbibition into small pores; therefore, it proved that SiO2 nanofluids can further improve the recovery degree than surfactants in imbibition experiments. Karimi [10] and others studied the effect of ZrO2-based nanofluids on the wettability of carbonate reservoir rocks. The results showed that the designed ZrO2 nanofluids can significantly change the wettability of rocks, from a strong, oil-wet state to a strong, water-wet state. Bayat [11] and others compared the effects of Al2O3, TiO2, and SiO2 on the tertiary oil recovery of medium-wet limestone core samples at higher temperatures through experimental studies. The tertiary-oil-recovery effect of TiO2 nanofluid was better than that of SiO2. Ehtesabi [12] et al. used anatase and amorphous TiO2 nanoparticles to enhance the recovery of heavy oil in sandstone cores. After the nanoparticle treatment, the wettability of the rock changed from an oil-wet state to a water-wet state. Electron microscopy (SEM) results confirmed the diffusion and uniform distribution of nanoparticles in porous media, but as the nanoparticle concentration increased, more nanorods of the same diameter were formed, leading to clogging. The possibility of yield (EOR), however, requires more research to overcome the multinanoparticle deposition on pores.
At present, the experiments on the imbibition law of porous media at home and abroad are divided into two categories according to the purpose of the experiment: static and dynamic imbibition experiments. Indoor imbibition experiments include the mass method, the volume method, and the CT-scanning method. The mass method and the volume method can qualitatively characterize the experimental results by the core mass and imbibition volume, respectively, and study the influence of parameters such as core size on imbibition [13]. At present, indoor imbibition experiments are mainly used in China, and two methods of mass and volume are used. Because the volume method is simple to operate, it is widely used. By recording the change in oil recovery by imbibition with time, the recovery degree is calculated to evaluate the oil-displacement effect [14]. However, these traditional imbibition experimental methods, such as the volume method, have shortcomings, such as inaccurate measurements, slow speed, and inability to image [15]. In order to conduct more accurate experiments and obtain more convincing data, the imbibition experiment was studied with the help of nuclear magnetic resonance technology. Low-field nuclear magnetic resonance technology is a core-nondestructive testing technology developed in recent years, which is widely used in various aspects of the experimental evaluation of low-permeability tight reservoirs [16]. After the low-permeability tight core is saturated with oil or water, the hydrogen nuclei in the oil and water generate energy level splitting under the action of an external magnetic field. In the external radio frequency field of a specific frequency, nuclear magnetic resonance and nuclear magnetic resonance can be generated during the transition of the nuclear magnetic moment of the hydrogen nuclei. The intensity of the resonance signal is proportional to the number of hydrogen nuclei contained in the tested sample [17], and this method can directly observe the fluid steps inside the pores of tight cores without destroying the core morphology. The combination of nuclear magnetic resonance (NMR) and imbibition experiments can accurately study the distribution characteristics of oil in pores [18]. Dai [19] et al. used NMR technology to conduct dynamic imbibition experiments in a core-flooding system and studied the migration behavior of oil in nanopores to micropores during dynamic imbibition. Scanning T2 spectroscopy, magnetic resonance imaging (MRI), and the mercury intrusion curve were used to convert the T2 relaxation time to the pore size, and the crude-oil recovery factor in nanopores and macropores was calculated. Tension (IFT) and permeability increased with increasing injection volume and decreased with increasing injection volume. Lin et al. [20] studied the relationship of water saturation with time at different positions during the imbibition process of shale gas through NMR experiments, and qualitatively analyzed the relationship between imbibition front length and clay content and salinity. Zhou H et al. [21] used nanofluid imbibition experiments combined with nuclear magnetic resonance measurement methods to monitor the migration law and distribution of oil and gas during imbibition. Imbibition experiments showed that the interfacial modulus between silica nanofluid and kerosene increased significantly, indicating that the adsorption of functional silica nanoparticles at the oil–water interface increased the strength of the interfacial film, and the adsorption at the oil–water interface significantly decreased the interfacial tension. However, there are few studies on the migration law of nanoparticles in the core pores, and few people have studied the nano-imbibition by nuclear magnetic resonance technology.
In this study, according to the reservoir characteristics of the tight, low-permeability sandstone of the Changqing Oilfield in China, the spontaneous imbibition process of the low-permeability reservoir was studied with nuclear magnetic resonance technology, and the distribution and migration patterns of oil and water in the pore throats were evaluated. On this basis, the imbibition effects of different oil displacement systems were analyzed, and the efficient and intelligent nano-oil displacement system suitable for tight, low-permeability reservoirs was compared and optimized. Our experiments show that that 2D nano black card can significantly improve the degree of imbibition and recovery, which provides an effective reference for imbibition-flooding and oil recovery in low-permeability reservoirs, and is of great significance to the field exploration and development of oilfields.

2. Experimental Materials and Methods

2.1. Experimental Materials and Instruments

2.1.1. Materials

The natural core (Figure 1) was taken from the Chang 7 reservoir of the Yanchang Formation of Changqing oilfield. The reservoir is mainly composed of feldspar sandstone and lithic feldspar sandstone. The porosity is mainly distributed between 12 and 15%, the permeability is mainly distributed between 2 and 4 mD, and the pore-throat sorting is relatively good. Table 1 shows the basic parameters of the core, such as length, diameter, permeability, and porosity. The imbibition experiment used 2D nano blackcard (Figure 2a) (0.005 ωt%) and nanoemulsion (0.02 ωt%) with two kinds of nanofluids. The water used in the experiment was laboratory-deionized water. The core saturation oil was domestic fluorine oil (YBS-1097) without hydrogen.

2.1.2. Characterization of Nanomaterials

The nanoemulsion and black nanocard used in this study were self-made materials from the China University of Petroleum (Beijing).
The nanoemulsion used in the experiment had a small particle size and an ultra-low-concentration nanoemulsion composition (Figure 2b). In weight percentage, its homogeneous microemulsion was made by mixing the following raw materials: 8~40 ωt% of surfactant, 0.5~10 ωt% of polymer, 10~30 ωt% of alcohol, 3~30 ωt% of oil, and 0~20 ωt% of salt and water allowance. The nanoemulsion was a homogeneous and transparent liquid–liquid dispersion system, wherein the particle size of the emulsion was 5–30 nm.
The black nanocard was prepared with the reaction of synthetic-material transition metal minerals and inorganic reducing agents in a certain proportion in a high-pressure microreactor, after cooling and separation (Figure 2a). Two-dimensional smart black nanocard solution was a suspension prepared by mixing solid black card and formation water in a certain proportion and vibrating for 30 min under the action of an ultrasonic wave. The SEM image of the black nanocard shows that the area of the black nanocard is about 100 nm × 80 nm. Observed under the microscope: the black nanocard had a layered structure and the thickness was less than 10 nm. In addition, it was verified by the corresponding height distribution of the black card that the thickness of the black nanocard was about 1.2 nm on average, that is, the size of the black nanocard was 100 nm × 80 nm × 1.2 nm (Figure 3).

2.1.3. Instrument

The static imbibition method was used in this study. MacroMR12-15H-I nuclear magnetic resonance equipment (sourced from Suzhou Niumag Analytical Instrument Co., Ltd. Suzhou, China) was used for the NMR measurements. NMR T2 spectra and two-dimensional imaging were scanned before and after being saturated with water and saturated with fluorine oil, respectively. Instruments such as beakers, vacuum saturation devices, and drying ovens were used in the saturated water and fluorine oil stages. LE204E/02 electronic balance (Mettler-Toledo Instruments Shanghai Co., Ltd. Shanghai, China) was used for weighing before and after the experiment. PDP200 gas permeability measuring instrument (Core Lab, Houston, TX, USA) was used for core permeability measurements, and PS-20A ultrasonic cleaner was used in the nanofluid preparation stage (Shenzhen Kejie Ultrasound Technology Co., Ltd. Shenzhen, China).

2.2. Experimental Program

2.2.1. Nuclear Magnetic Resonance Theory

Since the introduction of nuclear magnetic resonance technology to the petroleum industry in the 1990s [22], it has played an important role in describing complex reservoirs. From the NMR transverse relaxation time distribution, many important parameters can be derived, such as total porosity, effective porosity, irreducible water saturation, permeability, and pore-size composition and distribution, etc. [23,24]. It is an indispensable technical means in the evaluation of complex reservoirs.
In porous rocks, the amplitude of the NMR signal is proportional to the number of hydrogen atoms in the hydrogen-containing fluid. Therefore, this technique can be used to study the distribution of hydrogen-bearing fluids (oil or water) in porous rocks. During the time evolution of the dipole moment, there are two kinds of NMR relaxations: longitudinal relaxation (T1) and transverse relaxation (T2) (Liu et al., 2018). T2 spectroscopy is currently the most widely used NMR method because it can quickly and nondestructively obtain pore-throat scans.
The hydrogen nucleus relaxation time of the nuclear magnetic resonance T2 spectrum can effectively characterize the pore radius of the reservoir rock. The longer the T2 relaxation time, the larger the corresponding pore radius, and vice versa [25]. The fluid in the large pores is less affected by the force of the core wall, so the relaxation rate is slow and the T2 relaxation time is long. The fluid in the small pores is relatively large under the force of the core wall, the relaxation rate is slightly faster, and the T2 relaxation time is short [26]. In order to facilitate the analysis and research, according to the method mentioned in the literature [27,28,29,30], the T2 relaxation time can be converted into the throat radius:
R = 0.735 T 2 / C
where R is the throat radius, μm; T2 is the NMR T2 relaxation time, ms; and C is the conversion coefficient, ms/μm. The conversion coefficient is 14.1 ms/μm; under this conversion coefficient, the NMR T2 spectrum fits well with the conventional mercury intrusion curve, and the correlation is high.
According to the size of the relaxation time, the pores are classified according to Hodot, and the pore types are divided into four categories: the radius of the micropore is less than or equal to 2 μm; the radius of the small hole is greater than 2 μm and less than or equal to 10 μm; the radius of the mesopore is greater than 10 μm and less than or equal to 20 μm; The pore radius is greater than 20 μm and less than or equal to 200 μm (Shi, 2018). According to previous research, there is a corresponding relationship between the relaxation time and the pore radius, as shown in Table 2 (Chen, 2020).
Magnetic resonance imaging can obtain cross-sectional, sagittal, coronal, and three-dimensional images of rock samples. The image signal represents the distribution of fluid in the core space. The brighter the image, the looser the core, and the higher the porosity and saturation. Conversely, the darker the image, the tighter the core, and the lower the porosity and saturation [31].
Magnetic resonance technology uses the principle of nuclear magnetic resonance plus a gradient magnetic field to detect the emitted electromagnetic waves. The principle is simply summarized as: core samples are divided into several thin layers, which are called slices. This process is called slice selection, and each slice can be divided into many small volumes, called voxels. A token is assigned to each voxel, a process called encoding or spatial localization. A radio frequency pulse is applied to a certain layer, and the nuclear magnetic resonance signal of the layer is received and decoded. Then, the size of each voxel nuclear magnetic resonance signal of the layer is obtained. The size of the voxel signal is displayed on the corresponding pixel of the fluorescent screen, and the signal size is represented by different gray levels. Finally, an image reflecting the size of each voxel NMR signal at the slice is obtained, that is, an MRI image [32].
The nuclear magnetic resonance image is a two-dimensional display of the three-dimensional space. The nuclear magnetic resonance scans the local and overall hydrogen-containing fluid conditions. The gray-scale pixel points correspond to the spatial position of the hydrogen-containing fluid (oil) in the core. Therefore, with the relative content of hydrogen fluid, the change in oil saturation can be obtained by comparing the gray value of the displacement image before and after [32]. The brighter the gray level, the higher the fluid saturation in the core; conversely, the darker the gray level, the lower the fluid saturation in the core. Therefore, the total amount of fluid in the core directly affects the strength of the NMR signal.
Both ordinary oil and formation water contain hydrogen, and it is hard to know the distribution of oil and water in the pores after the imbibition experiment. Therefore, fluorine oil without hydrogen elements was used for the imbibition experiments in this study. NMR scanning T2 map and two-dimensional imaging were used to observe the distribution of imbibition fluid entering the core. Since the density of fluorine oil is greater than that of water, we fixed the core at the bottom of the imbibition bottle, turned the imbibition bottle upside down, and carried out the imbibition experiments in both forward and reverse directions to compare and analyze the effect of gravity on imbibition. In the research process of this experiment, the nuclear magnetic resonance experiment combined with the mass method was used to analyze the final imbibition results. Then, the volume method was used to carry out the comparison and verification of the imbibition recovery degree, and to quantitatively characterize the spontaneous imbibition experiments of different imbibition liquids.
In the process of this experimental research, the mass method combined with the NMR scanning process, and the calculation formula are
m w 1 m w 2 = S 1 S 2 m w 2
R = Δ m 0 ( Δ m m w 2 ) Δ m 0 × 100 %
where R is the degree of recovery, %; Δ m 0 is the mass of saturated fluorine oil, g; Δ m is the total mass of water and remaining fluorine oil in the core after imbibition, g; m w 1 and m w 2 are saturated water and imbibition core water content, g; and S 1 and S 2 are the envelope area under the T2 spectrum after water saturation and imbibition, respectively.

2.2.2. Experimental Procedures

The specific steps of the experiment were as follows:
(1)
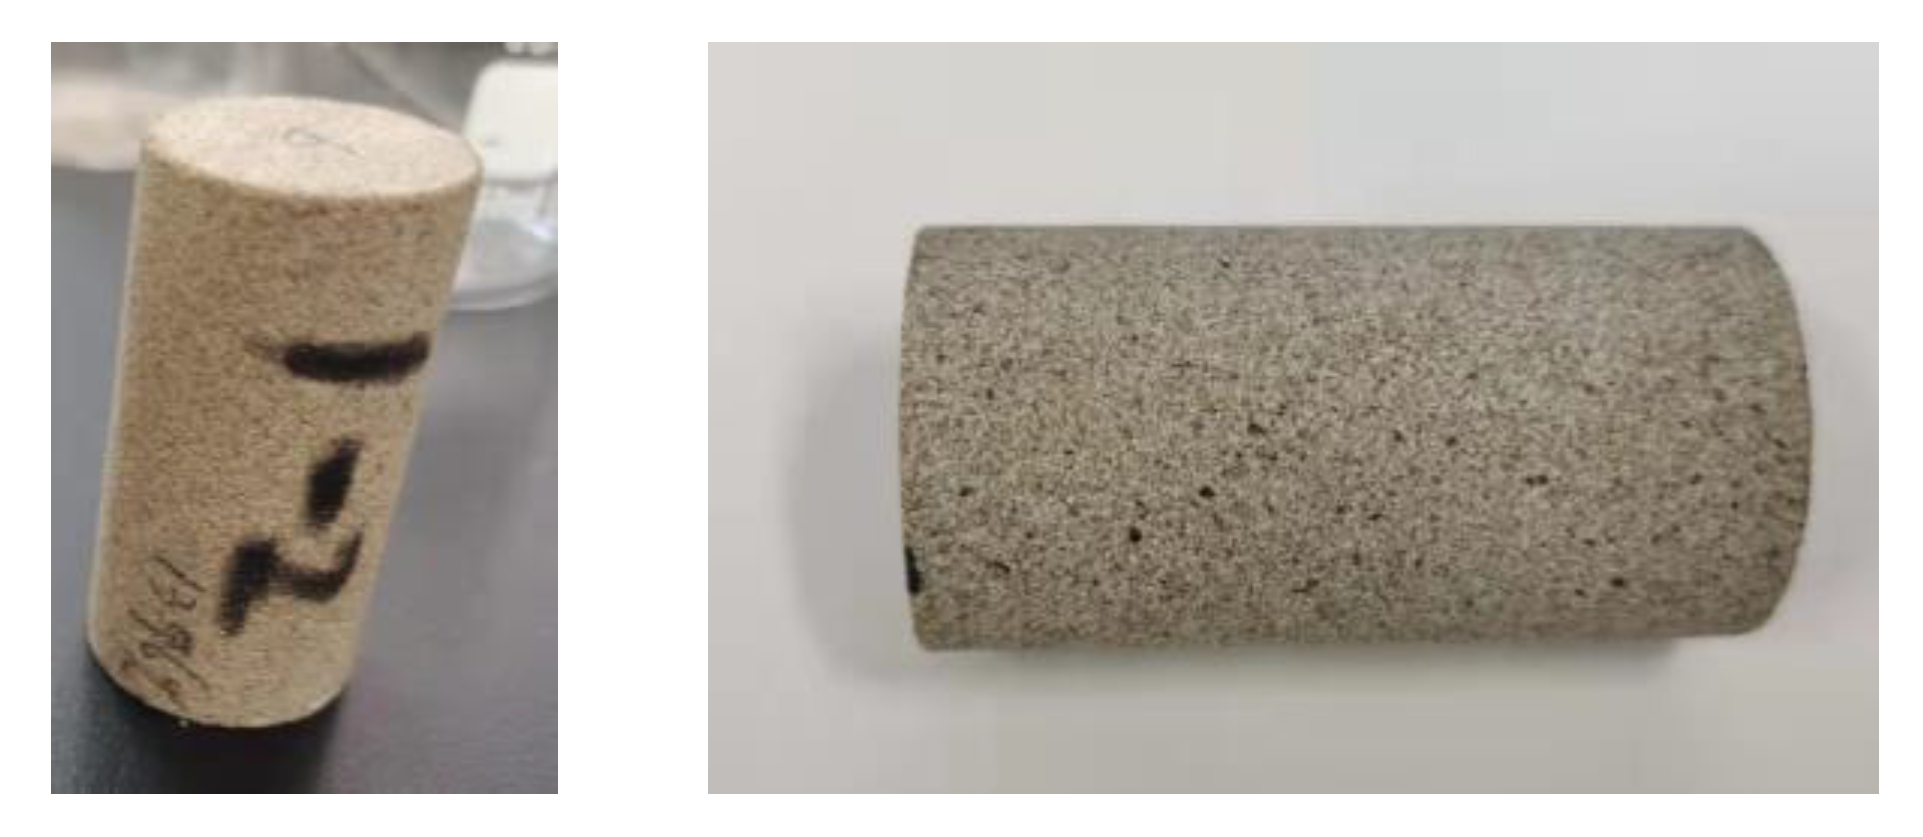
The cores were washed with oil, dried, weighed, and the gas-measured permeability and porosity were determined;
(2)
The cores were vacuum-saturated with water (24 h), weighed, and the NMR T2 profiles and 2D imaging in the saturated water state were determined;
(3)
The cores were dried (24 h), weighed, and saturated with fluorine oil (24 h), weighed, and the 2D imaging in the saturated fluorine oil state was determined;
(4)
The cores were put into water, nanoemulsion (0.02 ωt%), and 2D nano blackcard (0.005 ωt%) solution, respectively. The imbibition of the imbibition cores was observed at different times, and the oil volume was recorded at the same time;
(5)
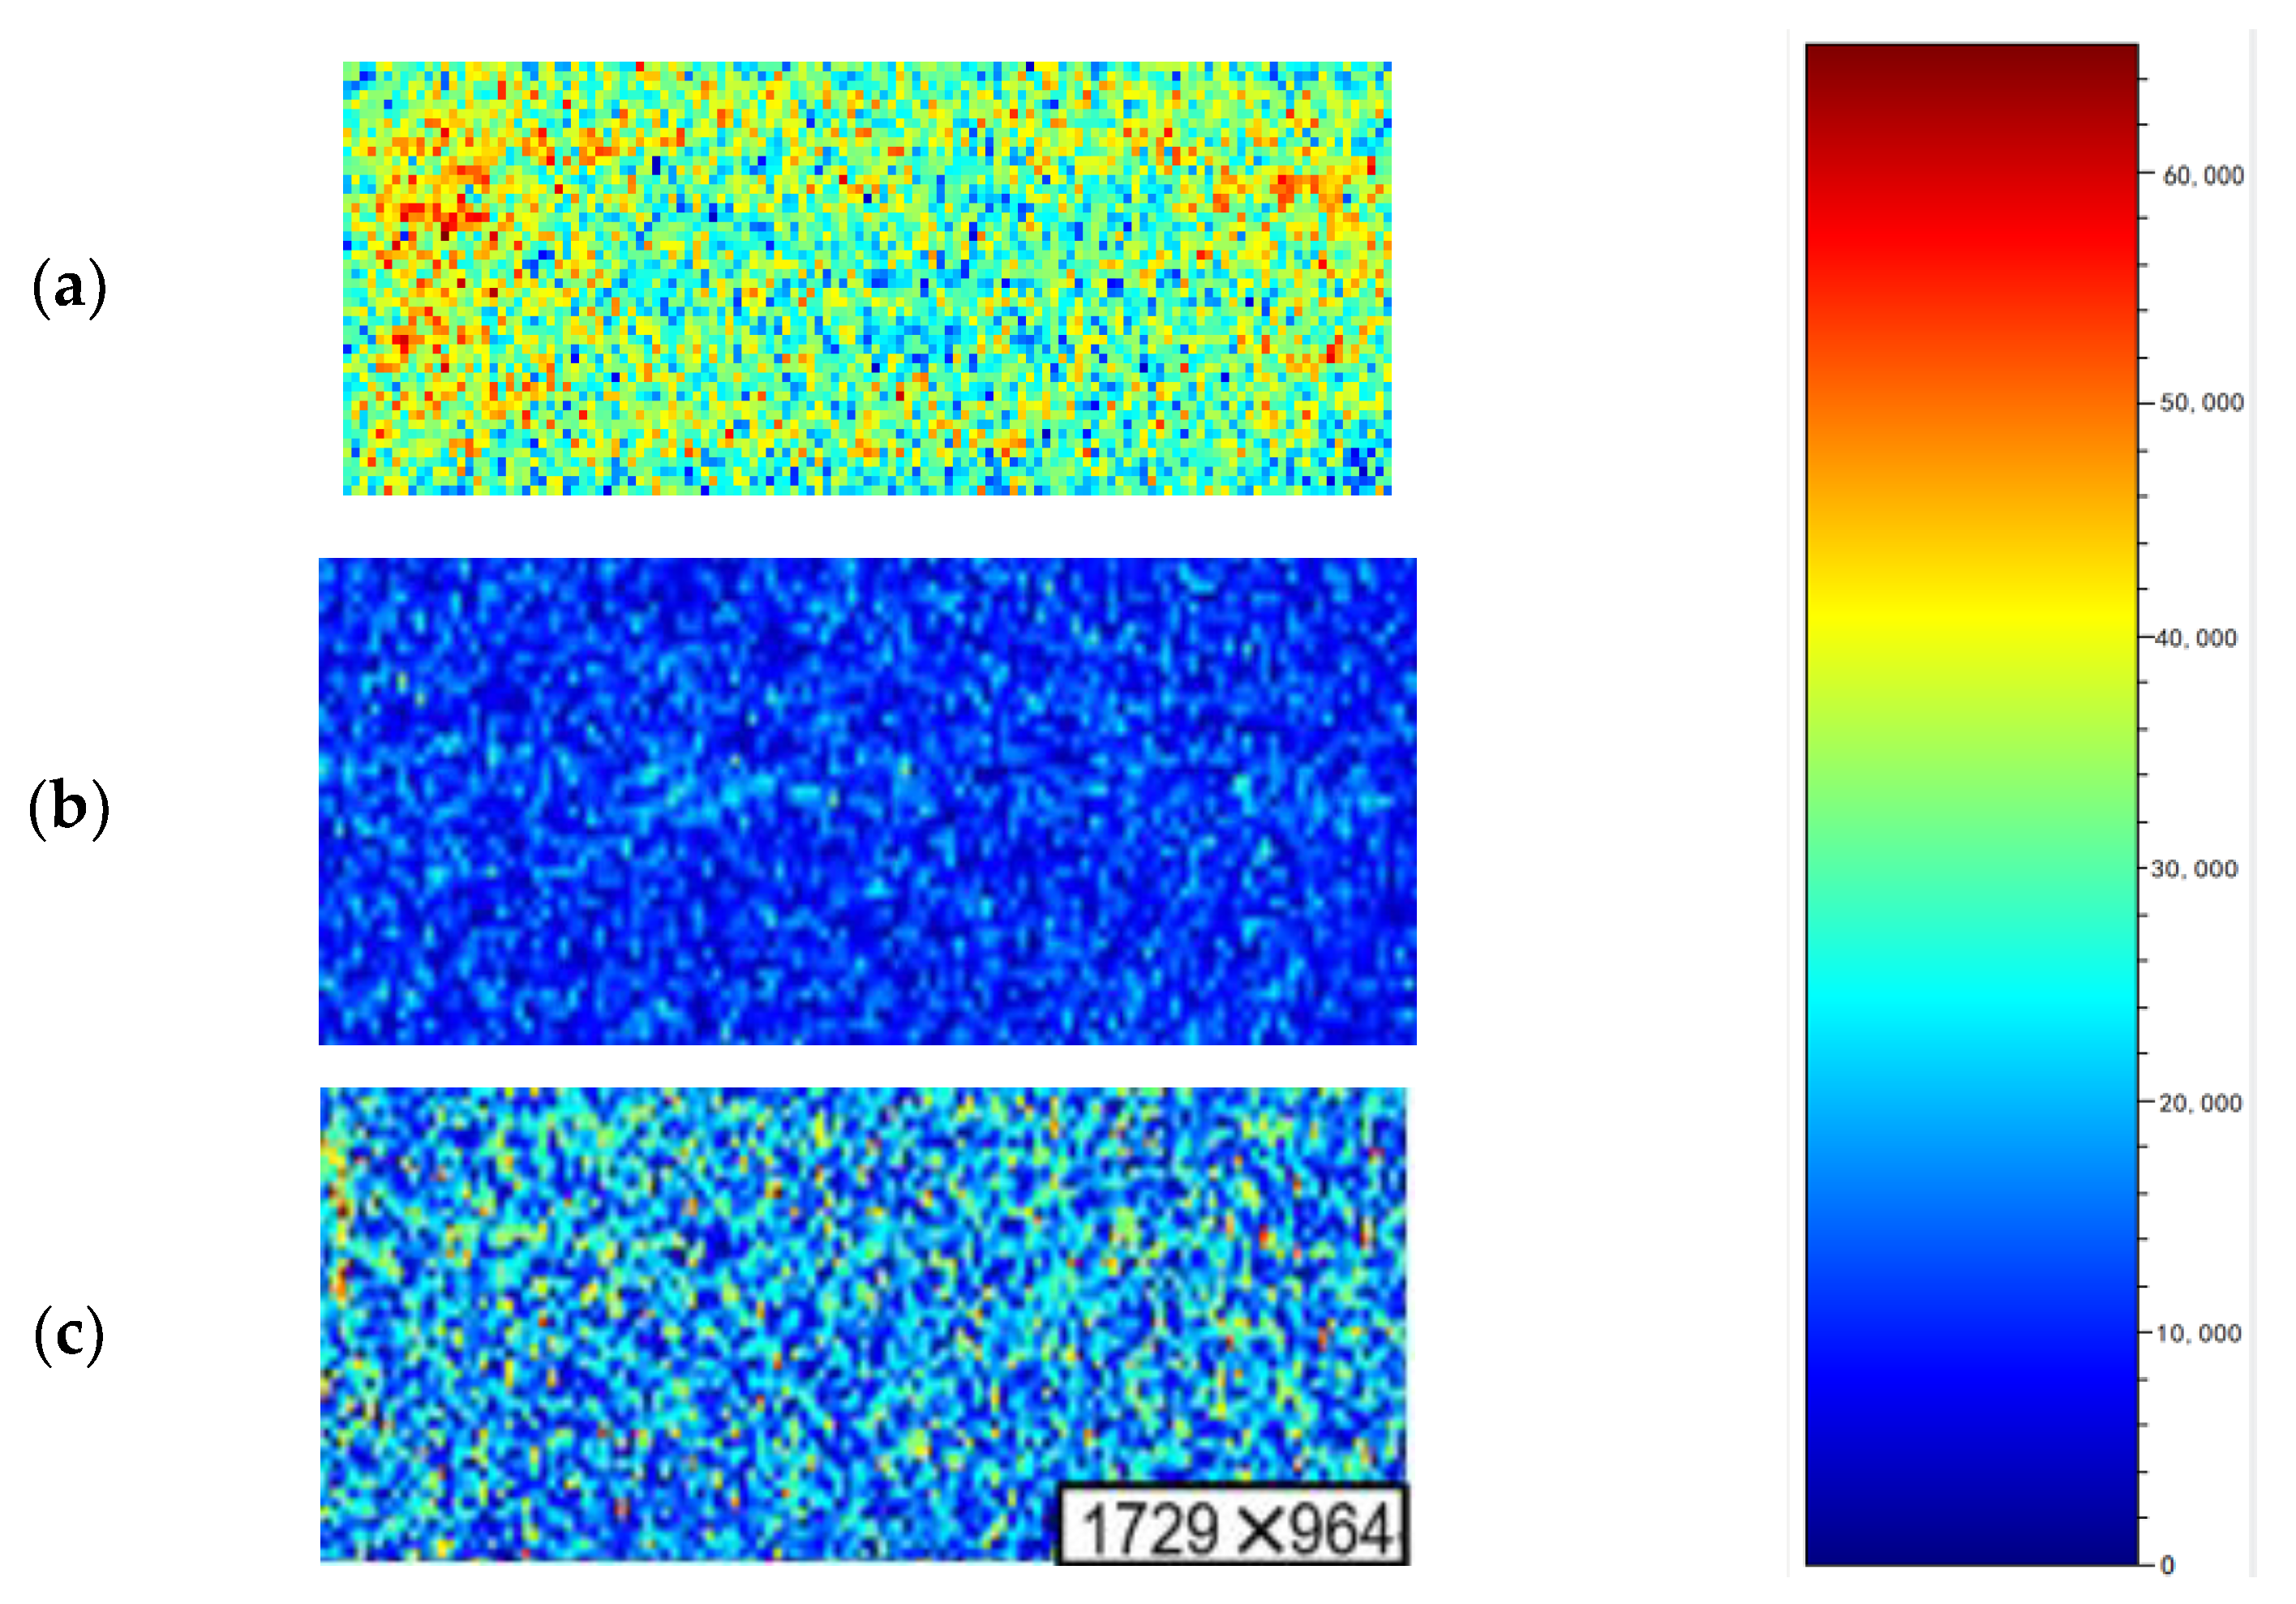
The imbibition ends of the core sample were observed when the oil volume did not change. The surface of the core was dried. Then, the core was wrapped with plastic wrap and put it into the NMR instrument for the NMR T2 spectrum test. After the test, the two-dimensional pseudocolor imaging test was performed immediately. During the two-dimensional pseudocolor imaging test, the lateral center layer of the core was selected as the imaging operation layer, and the two-dimensional pseudocolor image was inverted by using the NMR signal changes in different areas of the core center plane;
(6)
The data was processed, images were drawn, and the experimental results were analyzed.

3. Analysis of the Results

3.1. Analysis of the Results of NMR Experiments

3.1.1. Pore Throat Characteristics and Fluid Distribution Based on T2 Spectrum

Since the fluorine oil used in the experiment does not contain hydrogen, NMR signals are not generated by the fluorine oil, and NMR signals are all contributed by water. Therefore, the measured T2 relaxation time spectrum reflects the water pore-size distribution. The T2 relaxation spectrum collected during the imbibition process can reflect the change in the water content in the core pores. The larger the peak area, the greater the water content in the pores.
As shown in Figure 4, there is an obvious T2 spectrum after imbibition, indicating that the imbibition liquid replaced the fluorine oil. The water saturated in the core before imbibition is mainly distributed in the large and medium pore throats, accounting for about 60% and 30%, respectively. The small pore throats are less distributed, which conforms to the typical bimodal distribution characteristics of the ultra-low-permeability sandstone NMR T2 spectrum; After imbibition, most of the imbibition liquid is distributed in the large pore throat, accounting for more than 50%, and the fluorine oil in the large pore throat is replaced. The fluorine oil tends to flow out of the core from the large pore throats, and the residual fluorine oil is mainly distributed in the small and medium pore throats. From Figure 5a we can observe that the area enclosed by the T2 spectrum after imbibition represents the amount of oil–water exchange, which means the larger the area, the higher the imbibition efficiency and the higher the recovery degree. As shown in Figure 5b, the area of the T2 spectrum after imbibition is: Sblack card > Semulsion > Swater, corresponding to the recovery degree that: Rblack card > Remulsion > Rwater, indicating that the 2D nano blackcard can more significantly improve the imbibition efficiency than nanoemulsion and water.

3.1.2. Analysis of Imbibition Results Based on Two-Dimensional Imaging

In order to facilitate the observation of the fluid distribution and saturation state in the core pores before and after imbibition, this study carried out core scanning of the NMR two-dimensional pseudocolor image. The dark blue in the image indicates that the the hydrogen signal intensity is poor, indicating low water content, while the orange-red color indicates the hydrogen signal intensity is strong, indicating high water content. Therefore, the distribution state of oil in the core pores can be seen [33]. Comparing the two-dimensional imaging of saturated fluorine oil before and after imbibition (Figure 6), it was found that after imbibition, the hydrogen signal intensity increases and the water content increases, indicating that the imbibition liquid obviously enters into the core sample and replaces the fluorine oil. From Figure 6c, the two-dimensional imaging of the core after imbibition, it can be found that the hydrogen signal intensity distribution inside the core is uniform, indicating that the imbibition liquid in the core sample is evenly distributed and no obvious dominant imbibition channel is formed. It shows that the spontaneous imbibition of the tight, low-permeability core sample not only occurs on the core surface, but also has an effect on the deep pore throats, indicating that the capillary force plays a leading role in the imbibition process, while gravity and buoyancy are weak.

3.2. Results Analysis of Mass Method with Nuclear Magnetic Resonance Experiment

The commonly used imbibition test methods are the volume method and the mass method [34]. In this work, the nuclear magnetic resonance experiment combined with the mass method was used to analyze the final imbibition results, and then the volume method was used to verify the imbibition recovery degree.
The mass method is easy to operate and has high precision, which is suitable for medium-high-permeability and low-permeability sandstones. In the NMR-scanning method, the T2 pattern-length cutoff is proportional to the pore size, and its magnitude is proportional to the fluid content. The curve envelope area reflects the change in water content, that is, the peak area of the T2 spectrum is proportional to the water content. Using the relationship between relaxation time and pore radius, the water content can be calculated according to the change in the area enclosed by the T2 spectrum before and after imbibition, and then the oil saturation and the final recovery degree can be calculated. The calculation formula is shown in Equation (2).
As observed from Figure 7, the imbibition effect of the 2D nano blackcard is the best, and the recovery degree can reach up to about 32%. The recovery degree of nanoemulsion is about 26%. The recovery degree of water imbibition is the lowest, which is about 8%. The density of fluorine oil at room temperature is 1.8 g/cm3, which is greater than the imbibition liquids. So, the density has a certain influence. Comparing the imbibition recovery degree of normally placed imbibition and inverted imbibition of 2D nano blackcard, nanoemulsion, and water, the recovery degree of reverse imbibition is only about 1% higher than that of forward imbibition. Therefore, the influence of gravity differentiation is negligible.

3.3. Volume Method Calculation Results and Results Analysis

In the reverse-imbibition volumetric method, the tested core sample is completely immersed into the liquid, and the nonwetting phase in the core is displaced by the wetting phase due to imbibition. Under gravity, the thin tube converges at the top of the container, and the imbibition recovery factor is obtained by measuring and recording the volume of liquid or gas at the top of the container [35]. Since the density of fluorine oil is higher than that of imbibition liquids, the reverse-imbibition method was used in this work. Due to the action of gravity, the imbibed fluorine oil is gathered in the thin tube of the container, and the volume of the imbibed fluorine oil is read and recorded to calculate the imbibition recovery degree. The test results are shown in Figure 8, from which we can observe that the maximum recovery degree of 2D nano blackcard is 32.29% (highest) and the maximum recovery degree of emulsion is 26.05% (medium), while the maximum recovery degree of water is 7.19% (lowest). The results of the volume method are consistent with the results of the mass method combined with NMR scanning.

4. Conclusions

In this study, imbibition experiments were carried out with 2D nano blackcard (0.005 ωt%), nanoemulsion (0.02 ωt%), and water, respectively. Based on nuclear magnetic resonance technology, the imbibition, the distribution mechanism, and the migration law of oil and water in the core pore throat were investigated. According to the research results, this paper draws the following conclusions:
(1)
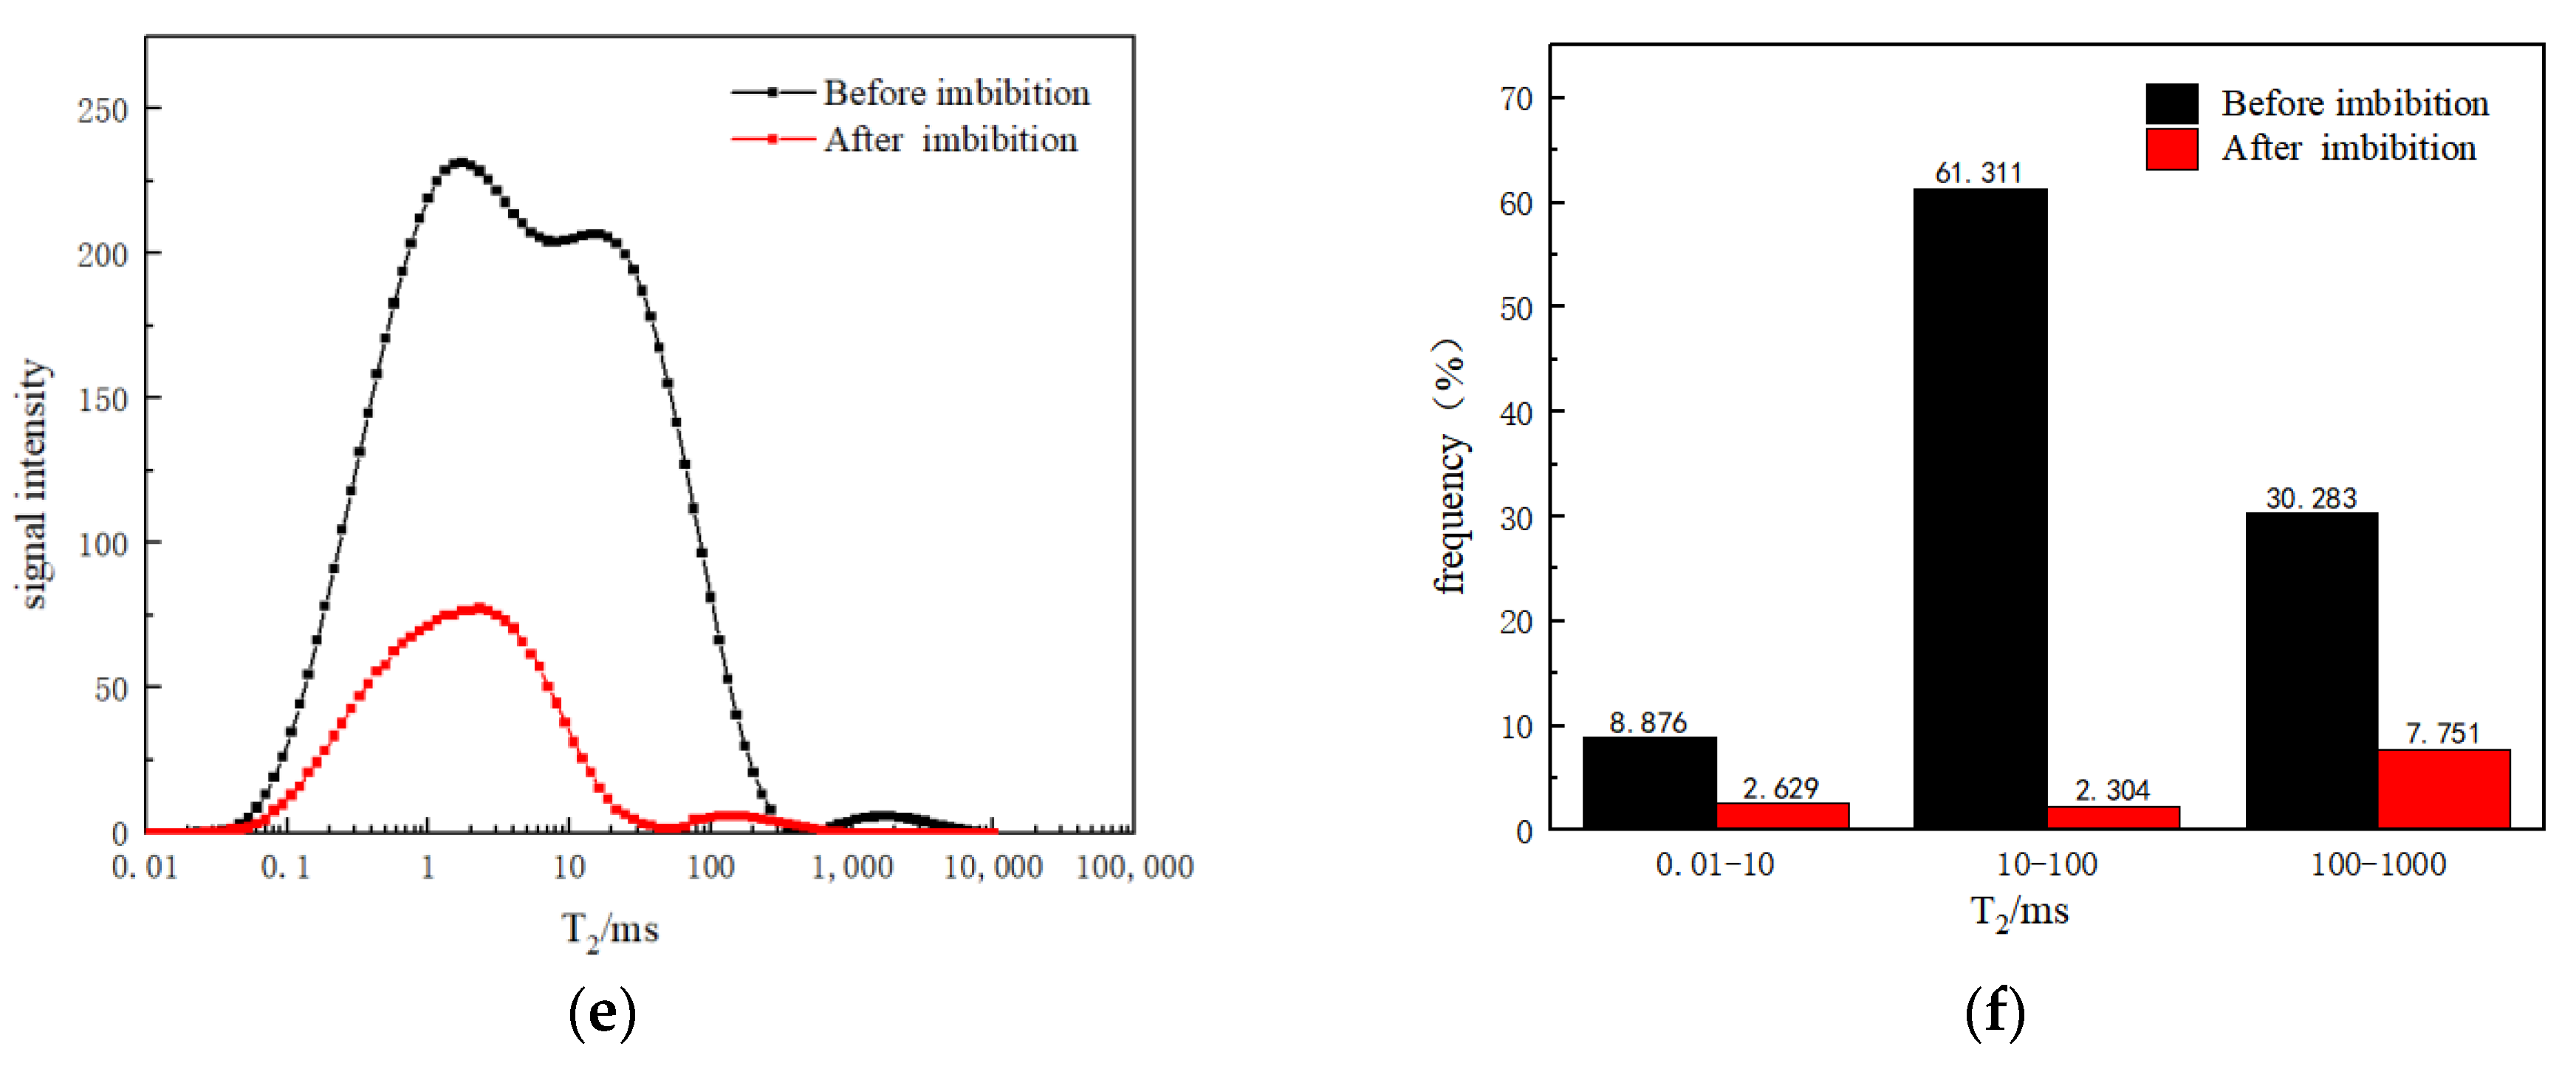
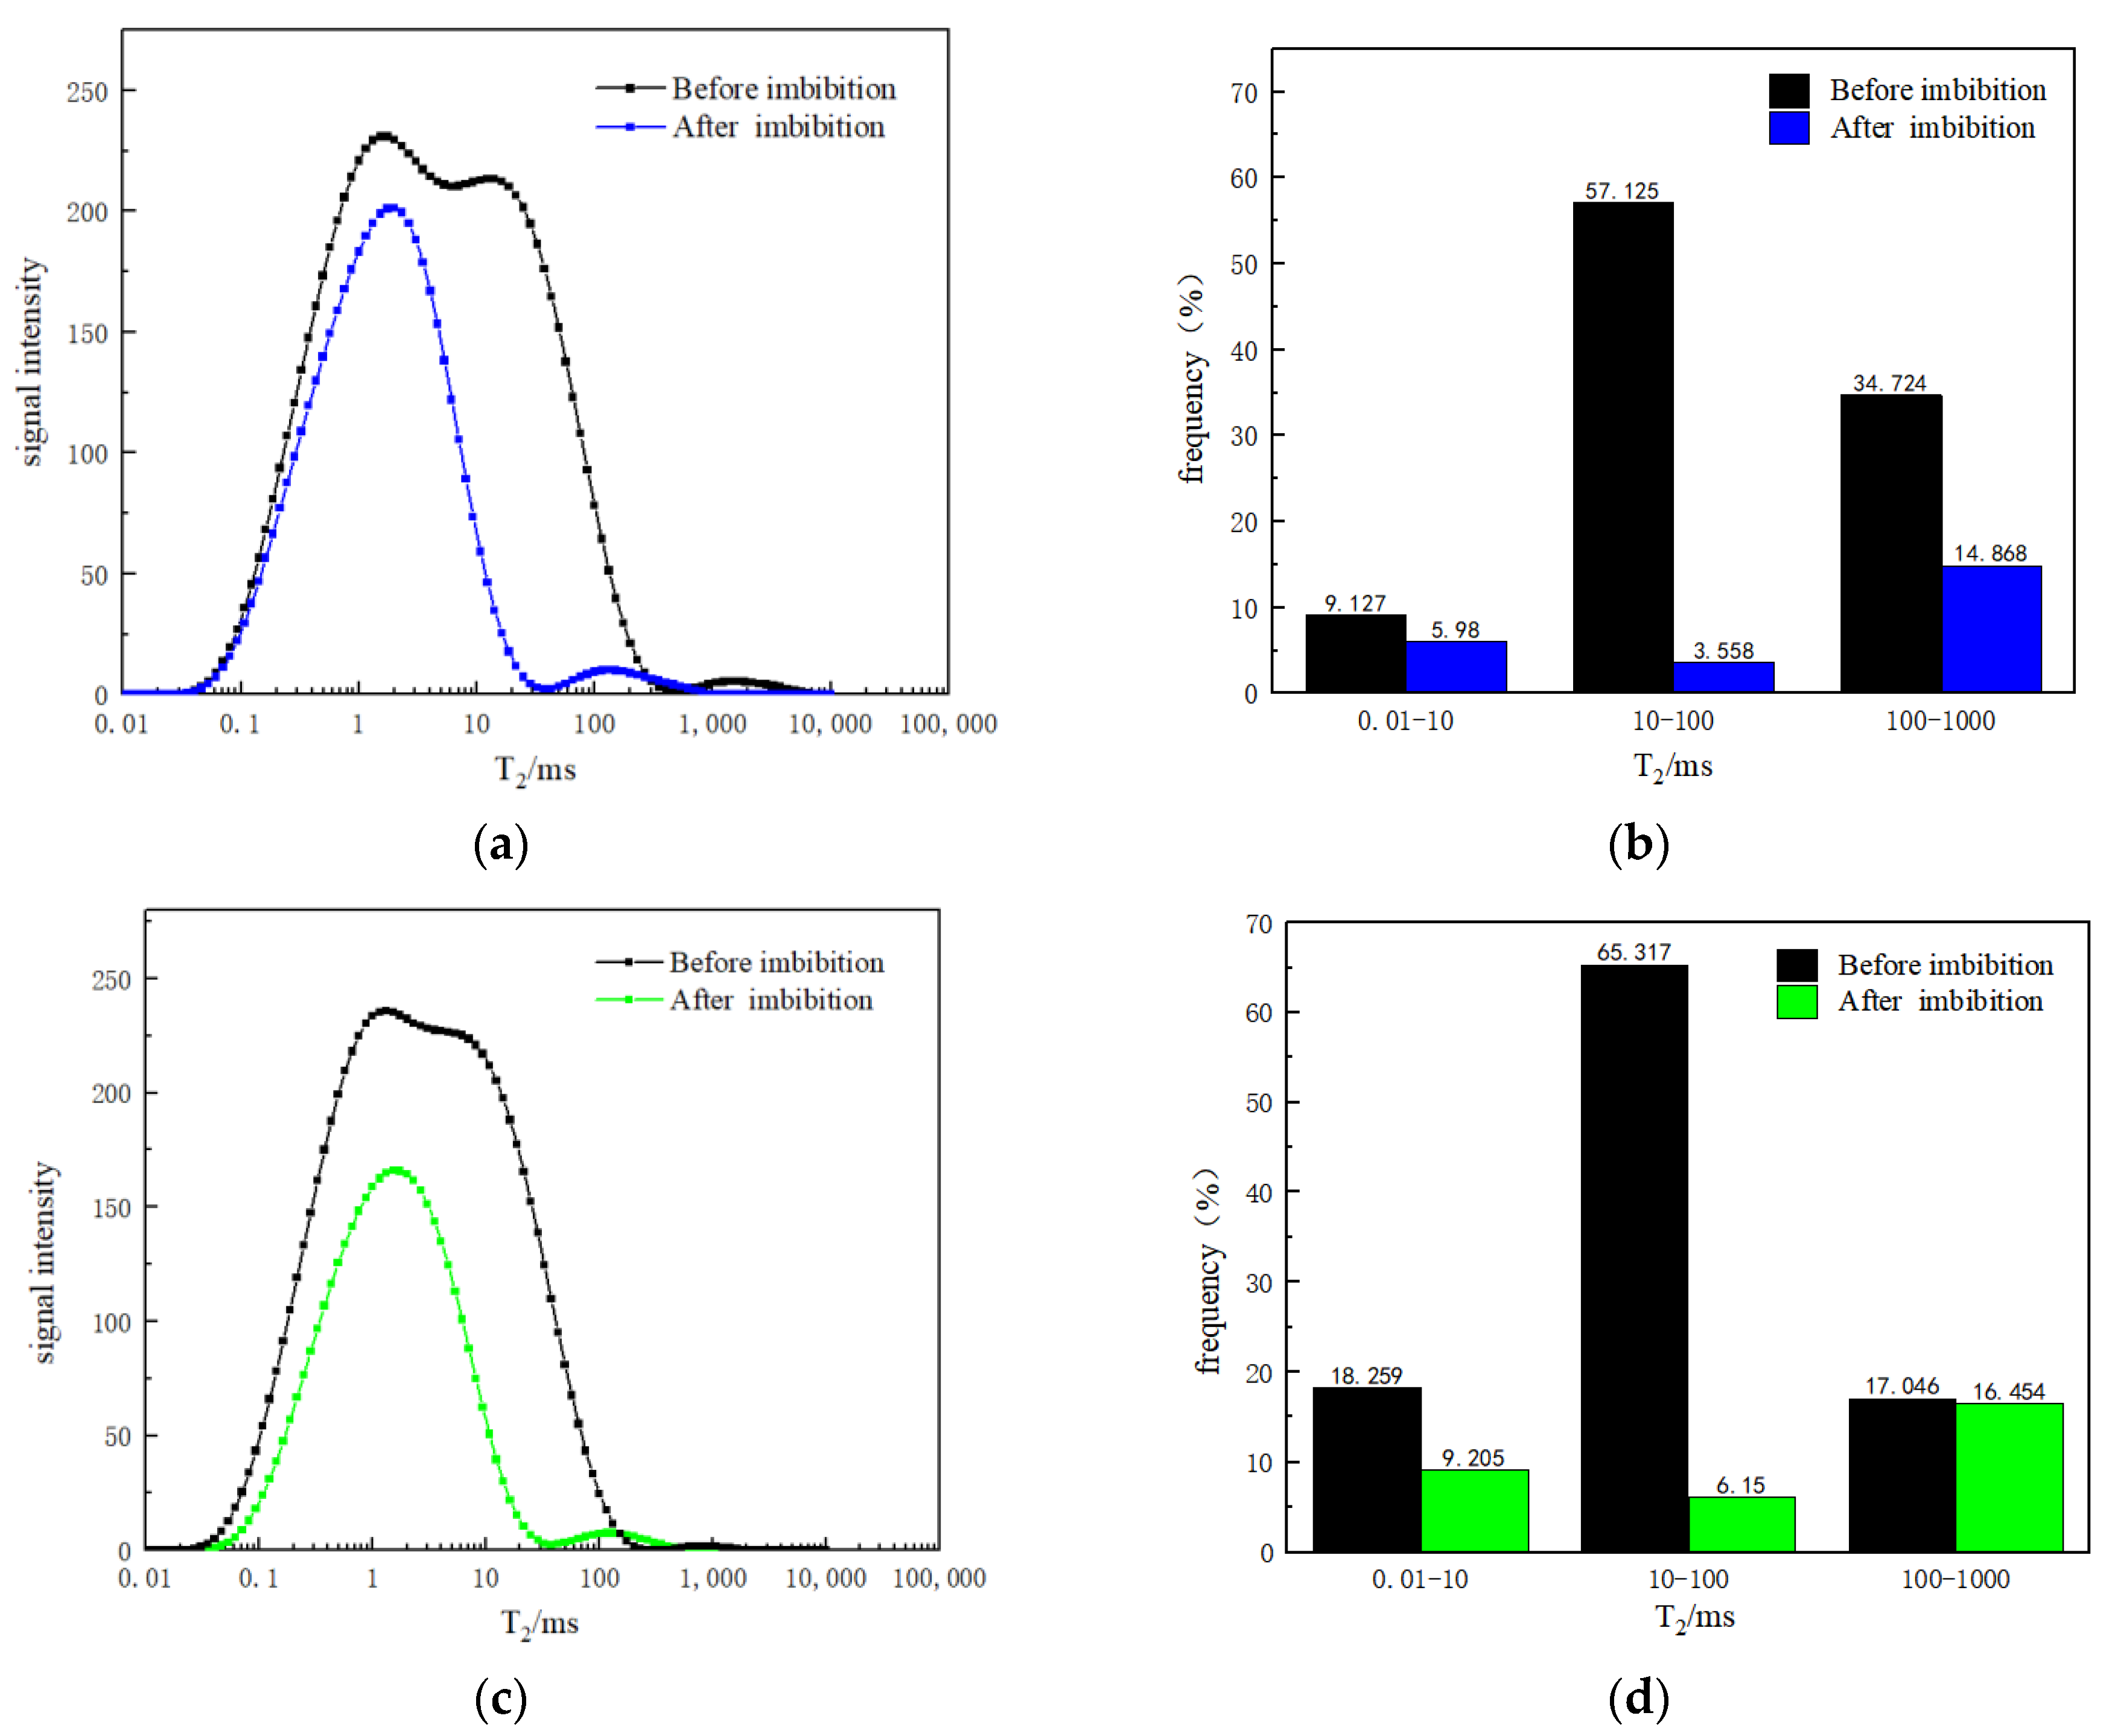
Analysis of the T2 spectrum after saturating it with water shows that in the low-permeability sandstones, the distribution of medium and small pore throats is widely accounted for (about 60%), and the distribution of large pore throats is less than about 30%. These are the typical distribution characteristics of ultra-low-permeability sandstone NMR T2 spectra;
(2)
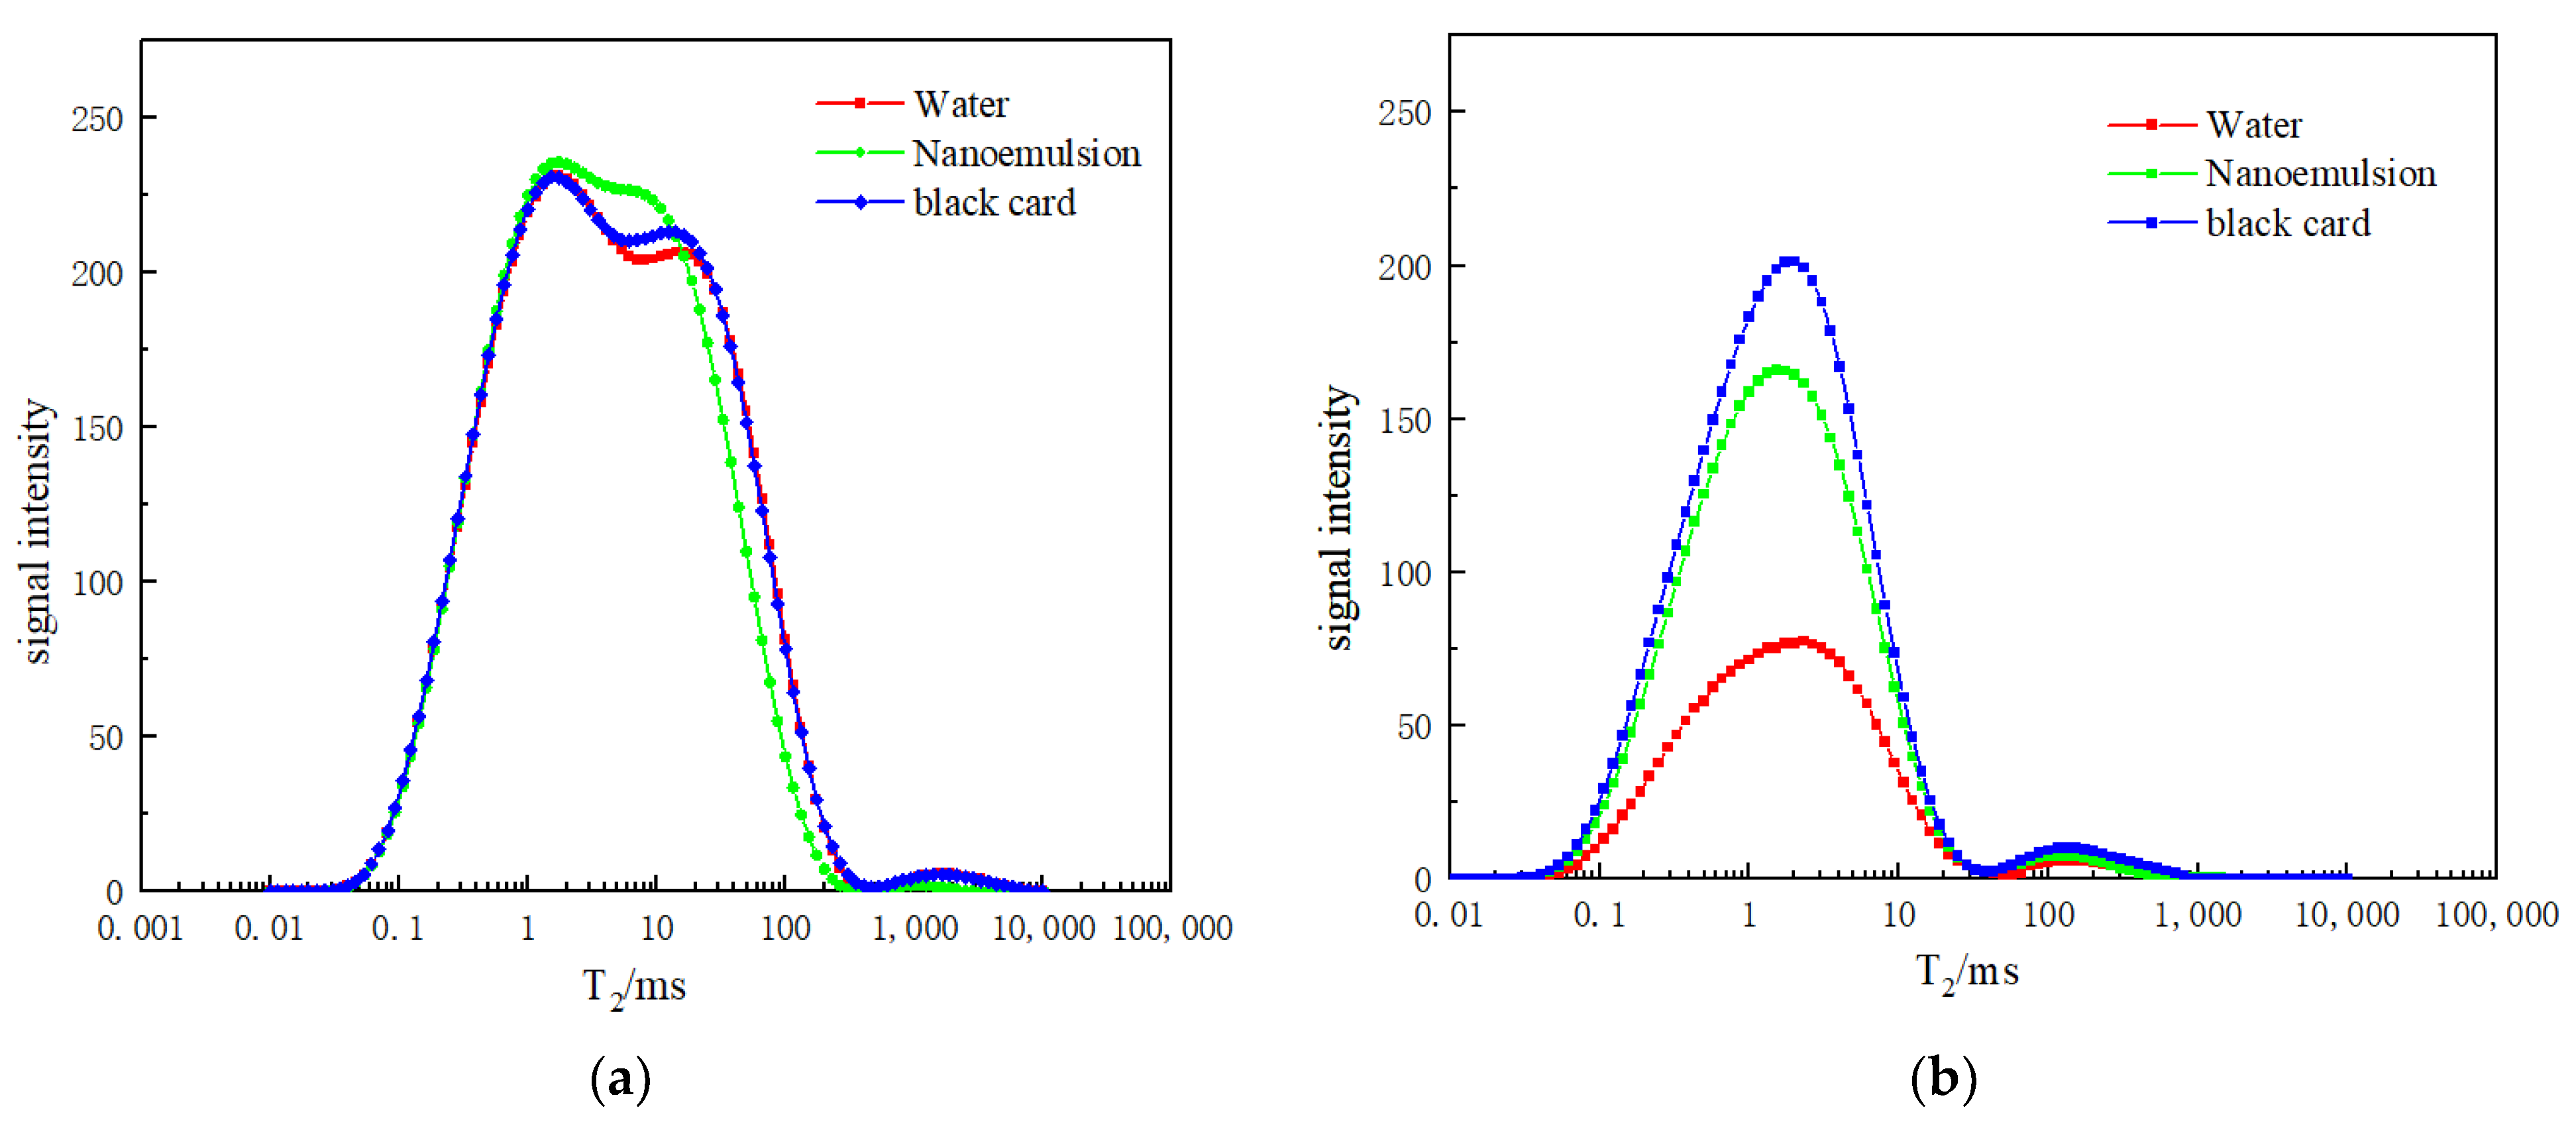
In the imbibition process, combined with the T2 spectrum, although the water and water-based imbibition fluid entered the core from the small and medium pore throats due to capillary force, the fluorine oil tends to flow out of the core from the large pore throats, and the residual fluorine oil is mainly distributed in the small and medium pore throats;
(3)
The 2D pseudocolor imaging results show that the imbibition liquid enters the core evenly, the imbibition liquid surface advances relatively uniformly, and no obvious dominant imbibition channel is formed. It shows that the spontaneous imbibition of low-permeability sandstone not only occurs on the core surface, but also has an effect on the deep pore throats;
(4)
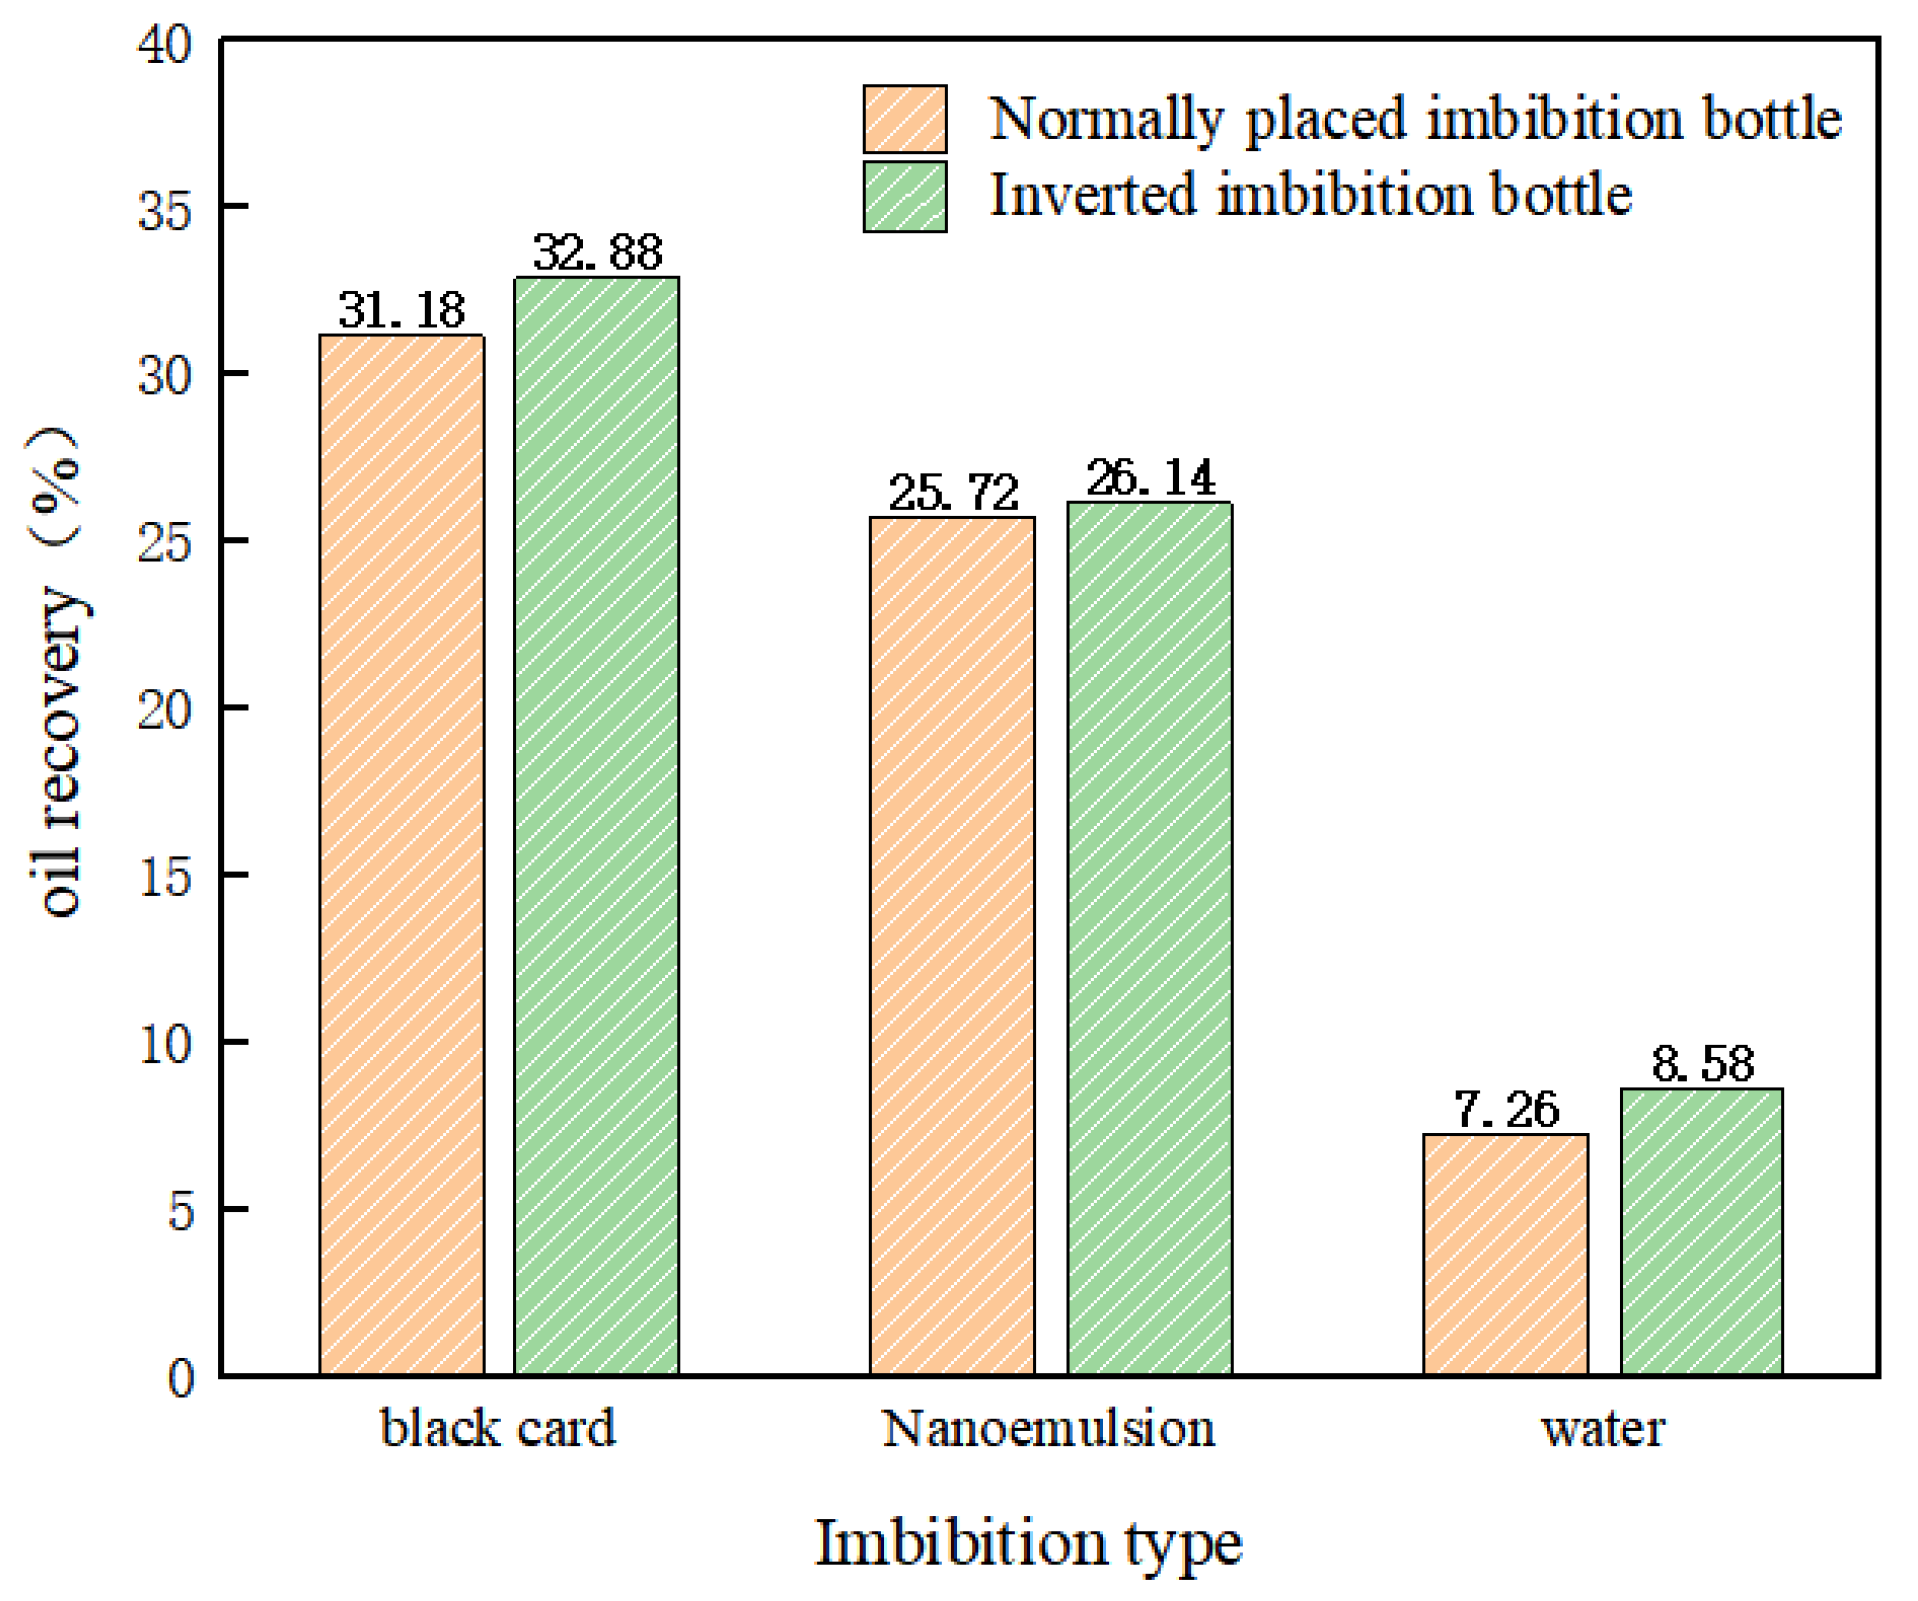
Comparing the imbibition results of the positive and negative directions, it is found that there is no obvious end-face enrichment phenomenon during the spontaneous imbibition, and the imbibition is uniform in all directions. This indicates that the capillary force plays a leading role in the imbibition process, and that the effects of gravity and buoyancy are weak;
(5)
During the imbibition experiment, adding nanomaterials improved the wettability of the core surface, thereby accelerating the imbibition efficiency, which is due to the adsorption of nanoparticles on the core surface. Comparing the imbibition effects of the three imbibition liquids (the 2D nano black card can significantly improve the recovery degree up to 25.1%), it provides an effective reference for the practical application of low-permeability oilfield development.

Author Contributions

H.L., take the idea and conducte the experiment, C.W. literature revie, B.L. conducte the experiment, X.W. grammma check, J.L. literature review and data processing, L.T., gramma check and supervision. All authors have read and agreed to the published version of the manuscript.

Funding

This research was funded by the National Natural Science Foundation of China (Nos. 52004308 and 52174027), by the Integrated Program of National Natural Science Foundation of China (No. U22B6005) and by Major Strategic Project of CNPC (ZLZX2020-01-04).

Institutional Review Board Statement

Not applicable.

Informed Consent Statement

Not applicable.

Data Availability Statement

The data is includeded in this paper.

Conflicts of Interest

The authors declare no conflict of interest.

References

  1. Qu, Z.H.; Kong, L.R. Microscopic water-driven oil characteristics of low-permeability oil formations. J. Northwestern Univ. (Nat. Sci. Ed.) 2002, 4, 329–334. [Google Scholar]
  2. Yang, W.S. Study on Dynamic Imbibition and Expulsion Law of Tight Reservoirs; China University of Petroleum: Beijing, China, 2018. [Google Scholar]
  3. Cai, J.C.; Yu, B.M. Research progress on spontaneous imbibition in porous media. Adv. Mech. 2012, 42, 735–754. [Google Scholar]
  4. Li, J.S. Effect of Surfactant System on Imbibition Process; Graduate School of Chinese Academy of Sciences (Institute of Percolation Fluid Mechanics): China, Beijing, 2006. [Google Scholar]
  5. Chen, C.; Wang, S.; Kadhum, M.J.; Harwell, J.H.; Shiau, B.J. Using carbonaceous nanoparticles as surfactant carrier in enhanced oil recovery: A laboratory study. Fuel 2018, 222, 561–568. [Google Scholar] [CrossRef]
  6. Cheng, Z.; Wang, Q.; Ning, Z.; Li, M.; Lyu, C.; Huang, L.; Wu, X. Experimental Investigation of Countercurrent Spontaneous Imbibition in Tight Sandstone Using Nuclear Magnetic Resonance. Energy Fuels 2018, 32, 6507–6517. [Google Scholar] [CrossRef]
  7. Zhou, Y.; Pu, H.; Zhong, X.; Li, C.C.; Zhang, S.J.; Sun, R.X. Visualization experiment of nanoparticle imbibition oil recovery in Hele-Shaw model. Daqing Pet. Geol. Dev. 2019, 38, 6. [Google Scholar]
  8. Li, Y.; Dai, C.; Zhou, H.; Wang, X.; Lv, W.; Zhao, M. Investigation of Spontaneous Imbibition by Using a Surfactant-Free Active Silica Water-Based Nanofluid for Enhanced Oil Recovery. Energy Fuels 2018, 32, 287–293. [Google Scholar] [CrossRef]
  9. Roustaei, A. An Evaluation of Spontaneous Imbibition of Water into Oil-Wet Carbonate Reservoir Cores Using Nanofluid. Petrophysics 2014, 55, 31–37. [Google Scholar]
  10. Karimi, A.; Fakhroueian, Z.; Bahramian, A.; Pour Khiabani, N.; Darabad, J.B.; Azin, R.; Arya, S. Wettability Alteration in Carbonates using Zirconium Oxide Nanofluids: EOR Implications. Energy Fuels 2012, 26, 1028–1036. [Google Scholar]
  11. Bayat, A.E.; Junin, R.; Samsuri, A.; Piroozian, A.; Hokmabadi, M. Impact of Metal Oxide Nanoparticles on Enhanced Oil Recovery from Limestone Media at Several Temperatures. Energy Fuels 2014, 28, 6255–6266. [Google Scholar] [CrossRef]
  12. Ehtesabi, H.; Ahadian, M.M.; Taghikhani, V.; Ghazanfari, M.H. Enhanced Heavy Oil Recovery in Sandstone Cores Using TiO2 Nanofluids. Energy Fuels 2013, 28, 423–430. [Google Scholar] [CrossRef]
  13. Yang, J. Analysis on the mechanism of porous media imbibition and its influencing factors. Yunnan Chem. Ind. 2020, 47, 3. [Google Scholar]
  14. Wang, X.X. Study on imbibition mechanism and development of low permeability reservoirs. Adv. Fine Petrochem. 2017, 18, 4. [Google Scholar]
  15. Shi, Y.H. Study on Imbibition o Fracturing Fluid in Chang 7 Reservoir Based on Nuclear Magnetic Resonance; Xi’an Petroleum University: Xi’an, China, 2018. [Google Scholar]
  16. Pu, Y.; Wang, X.Y.; Yang, S.L. Using NMRI technology to study the static imbibition mechanism of tight reservoirs. J. Petrochem. Univ. 2017, 1, 48–51, 56. [Google Scholar]
  17. Dang, H.L.; Wang, X.F.; Cui, P.X.; Hou, F.C.; Li, T. Research on imbibition and oil displacement characteristics of low-permeability tight sandstone reservoirs based on nuclear magnetic resonance technology. Prog. Geophys. 2020, 35, 129–139. [Google Scholar]
  18. Chen, Y.X. Study on Imbibition Experiment and Numerical Simulation of Yanchang Tight Oil Reservoir; China University of Geosciences: Beijing, China, 2020. [Google Scholar]
  19. Dai, C.; Cheng, R.; Sun, X.; Liu, Y.; Zhou, H.; Wu, Y.; You, Q.; Zhang, Y.; Sun, Y. Oil migration in nanometer to micrometer sized pores of tight oil sandstone during dynamic surfactant imbibition with online NMR. Fuel 2019, 245, 544–553. [Google Scholar] [CrossRef]
  20. Hun, L.; Shicheng, Z.; Fei, W.; Ziqing, P.; Jianye, M.; Tong, Z.; Zongxiao, R. Experimental Investigation on Imbibition-Front Progression in Shale Based on Nuclear Magnetic Resonance. Energy Fuel 2016, 30, 9097–9105. [Google Scholar] [CrossRef]
  21. Zhou, H.; Zhang, Q.; Dai, C.; Li, Y.; Lv, W.; Wu, Y.; Cheng, R.; Zhao, M. Experimental investigation of spontaneous imbibition process of nanofluid in ultralow permeable reservoir with nuclear magnetic resonance. Chem. Eng. Sci. 2019, 201, 212–221. [Google Scholar] [CrossRef]
  22. Cannon, D.E.; Minh, C.; Kleinberg, R.L. Quantitative NMR Interpretation. In Proceedings of the SPE Annual Technical Conference and Exhibition, New Orleans, LA, USA, 27–30 September 1998; OnePetro: Richardson, TX, USA, 1998. [Google Scholar]
  23. Kleinberg, R.L. Utility of NMR T 2 distributions, connection with capillary pressure, clay effect, and determination of the surface relaxivity parameter ρ2. Magn. Reson. Imaging 1996, 14, 761–767. [Google Scholar] [CrossRef]
  24. Zhao, P.; Wang, Z.; Sun, Z.; Cai, J.; Wang, L. Investigation on the pore structure and multifractal characteristics of tight oil reservoirs using NMR measurements: Permian Lucaogou Formation in Jimusaer Sag, Junggar Basin. Mar. Pet. Geol. 2017, 86, 1067–1081. [Google Scholar] [CrossRef]
  25. Liu, J.; Sheng, J.J. Experimental investigation of surfactant enhanced spontaneous imbibition in Chinese shale oil reservoirs using NMR tests. J. Ind. Eng. Chem. 2019, 72, 414–422. [Google Scholar]
  26. Liu, T.Y.; Wang, S.M.; Fu, R.S.; Zhou, M.S.; Li, Y.H.; Luo, M. Analysis of rock pore throat structure by nuclear magnetic resonance spectroscopy. Pet. Geophys. Explor. 2003, 18, 737–742. [Google Scholar]
  27. Guo, G.J.; Gu Chang, C. Nuclear Magnetic Resonance Experimental Study on Pore Production Law of Water-flooding Oil. J. Xi’an Shiyou Univ. (Nat. Sci. Ed.) 2005, 9–10, 57–60. [Google Scholar]
  28. Yun, H.Y.; Zhao, W.J.; Liu, B.K.; Zhou, C.C.; Zhou, F.M. Study on rock pore structure based on T2 distribution. Logging Technol. 2002, 18–21, 89. [Google Scholar] [CrossRef]
  29. He, Y.D.; Mao, Z.Q.; Xiao, L.Z.; Ren, X.J. An improved method for evaluating rock pore size distribution by nuclear magnetic resonance T2 distribution. Acta Geophys. 2005, 2, 373–378. [Google Scholar]
  30. Li, H.B.; Zhu, J.Y.; Guo, H.K. Research on the distribution of pore radius converted from nuclear magnetic resonance T2 spectrum. J. Spectrosc. 2008, 273–280. [Google Scholar]
  31. Lang, D.J.; Shang, G.H.; Lv, C.Y.; Ding, S.Q.; Sun, A.J.; Shan, X.L. Experiment and application of NMR analysis method for carbonate reservoirs—Take Tahe Oilfield as an example. Pet. Nat. Gas Geol. 2009, 30, 363–369. [Google Scholar]
  32. Ju, M.S.; Wang, X.Y.; Yu, W.S.; Yang, S.L.; Ye, W.Z.; Zhang, T.Q. Static imbibition law of tight reservoirs based on nuclear magnetic resonance technology. Xinjiang Pet. Geol. 2019, 40, 334–339. [Google Scholar]
  33. Zhao, M.W.; Liu, S.C.; Li, Y.; Song, X.G.; Yan, R.Q. Comprehensive experimental design for detecting the distribution characteristics of crude oil in cores by nuclear magnetic resonance T2 spectroscopy and imaging technology. Exp. Technol. Manag. 2021, 38, 4. [Google Scholar]
  34. Su, Y.B.; Lin GY Han, Y. Effects of surfactants on spontaneous imbibition and oil displacement in tight sandstone reservoirs. Fault Block Oil Gas Fields 2017, 24, 4. [Google Scholar]
  35. Nowrouzi, I.; Manshad, A.K.; Mohammadi, A.H. Effects of concentration and size of TiO2 nano-particles on the performance of smart water in wettability alteration and oil production under spontaneous imbibition. J. Pet. Sci. Eng. 2019, 183, 106357. [Google Scholar] [CrossRef]
Figure 1. Core samples for imbibition experiments.
Energies 16 00454 g001
Figure 2. Macroscopic schematic diagram of nanoadditives. (a) Nanoemulsion; (b) 2D nano blackcard.
Energies 16 00454 g002
Figure 3. Two-dimensional nanometer black card, microscopic-size image. (a) Electron microscope scanning image; (b) corresponding height-distribution image.
Energies 16 00454 g003
Figure 4. (a) T2 spectrum before and after black card imbibition; (b) fluid distribution frequency before and after black card imbibition; (c) T2 spectrum before and after emulsion imbibition; (d) fluid distribution frequency before and after emulsion imbibition; (e) T2 spectrum before and after water imbibition; (f) water fluid distribution frequency before and after imbibition.
Energies 16 00454 g004aEnergies 16 00454 g004b
Figure 5. (a) T2 spectrum after saturated water; (b) T2 spectrum after forward-directional imbibition.
Energies 16 00454 g005
Figure 6. (a) Core saturated water; (b) saturated fluorine oil; (c) after imbibition of 2D nano blackcard 2D pseudocolor imaging scan results.
Energies 16 00454 g006
Figure 7. Comparison of recovery degrees of different imbibed fluids.
Energies 16 00454 g007
Figure 8. The relationship between the recovery degree of different imbibed fluids and imbibition time.
Energies 16 00454 g008
Table 1. Basic data table of core samples.
Core NumberLength (cm)Diameter (cm)Porosity (%)Permeability (mD)
1–14.9062.51513.963.4502
1–24.9402.52513.383.2281
2–14.8802.52512.052.6480
2–24.9112.51514.651.9110
3–14.9002.52513.963.3075
3–24.9672.52512.362.8610
3–34.9712.51514.752.9370
Table 2. Corresponding relationship between relaxation time and pore radius.
T2 Relaxation Time/msPore Radius/μmPore Type
T2 ≤ 1≤2Micropore
1 < T2 ≤ 102 < r ≤ 10Small pore
10 < T2 ≤ 10010 < r ≤ 20Middle pore
100 < T2 ≤ 100020 < r ≤ 200Large pore
Disclaimer/Publisher’s Note: The statements, opinions and data contained in all publications are solely those of the individual author(s) and contributor(s) and not of MDPI and/or the editor(s). MDPI and/or the editor(s) disclaim responsibility for any injury to people or property resulting from any ideas, methods, instructions or products referred to in the content.

