Abstract
Well interference has drawn great attention in the development of shale gas reservoirs. In the W shale gas reservoir, well interference increased from 27% to 63% between 2016 and 2019, but the gas production recovery of parent wells was only about 40% between 2018 and 2019. Therefore, the mechanism and influencing factor of well interference degree were analyzed in this study. A numerical model of the W shale gas reservoir was developed for history matching, and the mechanisms of well interference and production recovery were analyzed. Sensitivity analysis about the effect of different parameters on well interference was carried out. Furthermore, the feasibility and effectiveness of gas injection pressure boosting to prevent interference were demonstrated. The results show that the main causes of inter-well interference are: the reservoir energy of the parent well before hydraulic fractures of the child well, well spacing, the fracture connection, etc. The fracture could open under high pressure causing fracturing fluid to flow in, while fracture closure happens under low pressure and the influence on the two-phase seepage in the fracture becomes more serious. The combination of liquid phase retention and fracture closure comprehensively affects the gas phase flow capacity in fractures. Gas injection pressure boosting can effectively prevent fracturing fluids flowing through connected fractures. Before the child well hydraulic fracturing, gas injection and pressurization in the parent well could reduce the stress difference and decrease the degree of well interference. The field case indicates that gas channeling could be effectively prevented through parent well gas injection pressurization.
1. Introduction
Different from conventional oil and gas reservoirs, shale gas reservoirs are characterized by low porosity and permeability, so it is difficult for shale reservoirs to form industrial oil flows without artificial fracture networks. However, with the large-scale hydraulic fracturing and the reduction in well distance, the possibility of inter-well fracture connection and interference becomes larger. The fracture fluid of the child well flows into the parent well, which leads to the water rate rapidly increasing and gas production sharply decreasing in the parent well [1,2]. In severe cases, it could cause well control problems such as casing damage, and even the scrapping of the parent well [1]. The mechanism of inter-well interference is a prerequisite for proposing well-interference preventative technologies. Previous studies clarified the causes and mechanisms of well interference, including stress changes during fracturing [3,4] and the effect on gas phase flow when there is fracturing fluid residue in the fractures. Fracture connectivity between the parent well and child well can be divided into short-term connectivity and long-term connectivity [5]. Short-term fracture connectivity means that the fracture connectivity and fracture fluid flow disappear when the hydraulic fracturing process is completed. Long-term fracture connectivity means that the fractures between the two wells remain connected and fluid exchange is maintained for a long time after the fracturing process is completed [6].
Generally, the inter-well interference phenomenon disappears with the closure of the inter-well connected fractures. However, because of the disturbance phenomenon, even if the production of the disturbed wells recovers after the fracture closure, it is difficult to recover to the original level [7]. Kang et al. identified the main control factors of well production by single-factor and multi-factor analyses, with the EUR set as the production capacity index [8]. Chang et al. explored the final economic analysis for different scenarios of natural fracture (NF) distributions and well spacing using the non-intrusive EDFM (embedded discrete fracture model) method [9,10]. Meanwhile, Huang et al. used the orthogonal experimental design method to optimize the best combination of well spacing and fracture spacing for different well types [11]. He et al. [12] evaluated different factors on pressure interference by gray correlation analysis with the production recovery rate as the evaluation index. Morales et al. [13] illustrated that the excessive extension of fractures of the child well to the parent well is one of the main reasons for well interference. However, the fracture extension involved is a complex problem in which reservoir energy, minimum in situ stress, maximum in situ stress, inter-well spacing [14], and pore pressure within complex fractures are the main factors affecting the shape of the fracture extension [15]. Wang et al. [16] analyzed the variation in fracture process data by optimizing the number of fracture sections and clusters and concluded that the stimulation volume and pumping rate of fracturing fluid are not the main factors controlling well interference. The alignment of fractured sections between the parent and child wells increases the chance of fracture interference, and the non-homogeneity and distance [17] between the two wells has to be considered as well. The possibility of well interference could increase as well distance becomes smaller and the production time becomes longer [18]. In addition, the study of the main control factors of inter-well interference should not be limited to engineering factors, geological factors should be taken into consideration as well.
The prevention of inter-well interference and the recovery of production after interference is attracting great attention in current research, and it has been suggested that different interference prevention methods should be adopted for different development statuses [19,20]. When severe well interference occurs, periodic well shut-in is needed to help restore the reservoir pressure and output capacity [21,22,23]. When the reservoir energy is low, the degree of well interference can be reduced by increasing well spacing [24,25], reducing the amount of fracturing fluid and gas injection to boost parent wells. However, Jacobs [26] argued that water injection could not prevent inter-well interference since it is not sufficient to create a pressure shield around the production wells, and he was positive about the CO2 or CH4 injection into parent wells for preventing inter-well interference. In addition, researchers have established models for evaluating the effectiveness of different fluid injection strategies (parent well pressurization) on well interference prevention [27,28]. Gala et al. [29] modeled the interaction between a parent well and child well during pressurization with different fracturing fluids, and it was found that the interference could not be eliminated completely, but the impact degree of well interference on production could be minimized. Swanson et al. [30] proposed a chemical treatment method based on a mixture of solvent and surfactant, which effectively reduced the well interference in the Woodford Block of the Anadarko Basin. Except for gas injection, Paryani et al. [31] proposed an integrated workflow combining geology, geophysics, and asymmetric fracturing models together. This workflow is capable of adjusting the fracture design at each stage based on in situ geological and geomechanical variability and estimating the impact of the fracture design on the final fracture geometry. This validated strain model enables the identification of fracturing stages that may cause interference. Additionally, a new fracturing fluid design would be a wise choice for the shale gas industry to prevent inter-well interference by adding a high concentration of reducer to the slip water or adding a high load of sand filler to reduce the amount of water in the fracturing fluid and keep the fracture open but close to the extension distance so that the quality of fracture modification can be maintained while avoiding inter-well interference [32]. For example, Johnson et al. [33] showed that a far-field steering agent consisting of 325-purpose silica could reduce the communication between the parent and child wells by 80%. Qin et al. [34] developed an integrated approach combining pressure and rate transient analysis for well interference diagnosis considering complex fracture networks of a parent well and child well in unconventional reservoirs. Han et al. [35] proposed the pressure derivative curve to diagnose the connection form of wells for the prevention of inter-well interference. In summary, the current research on shale gas inter-well pressure interference is not clear enough, and there is still a lack of feasible and effective technologies to prevent gas channeling.
2. History Matching of Wells in W Shale Gas Reservoir
The numerical model with a multi-fractured horizontal well in a shale gas reservoir is established using the numerical simulation software CMG (model dimension: 574.56 m × 2250 m × 36.5 m). The grid dimensions are 19 × 30.24 m and 45 × 50 m in the x and y directions. There are five layers in the z direction, with the size of 20 m, 6 m, 4 m, 5 m, and 1.5 m, respectively. Figure 1 displays the 3D grid division and plane grid division of this numerical model. The initial reservoir pressure is 45.6 MPa and the initial reservoir temperature is 105 °C.

Figure 1.
Grid distribution of numerical model. (a) 3D view of numerical model. (b) Top view of numerical model.
The multi-fractured horizontal wells in W Block were first injected with fracturing fluids at high pressure and then shut in. After two months of shut-in, the production wells were turned on and produced water and gas at the same time. The model focuses on history matching of the gas production and wellhead pressure of Well #W2-A and #W2-B in the W2 block. For Well #W2-A, the fitting time was from January 2018 to January 2020 and the results are shown in Figure 2. It can be seen that the history matching accuracy is quite high.
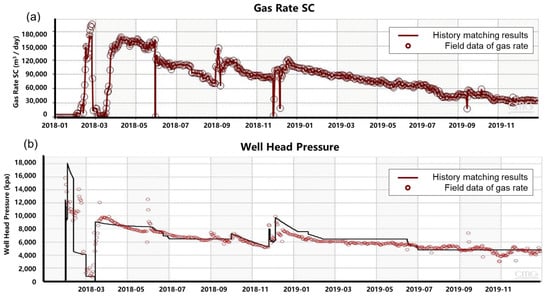
Figure 2.
History matching results of (a) gas production and (b) wellhead pressure of Well #W2-A.
The production data of Well #W2-B were also used for historical matching, and the fitting time was from January 2018 to January 2020. The results of the gas rate and wellhead pressure of Well #W2-B are shown in Figure 3, and it can be seen that the history matching accuracy is quite high.
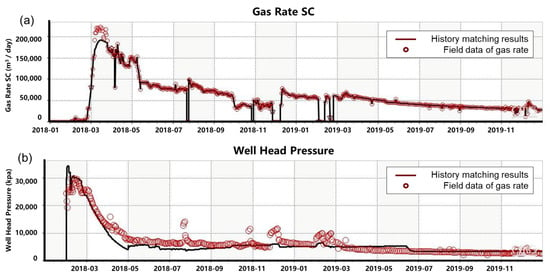
Figure 3.
History matching results of (a) gas production and (b) wellhead pressure of Well #W2-B.
3. Multi-Well Pressure Interference Analysis in W Shale Gas Reservoir
3.1. Numerical Modeling
The numerical model with a multi-fractured horizontal well in a shale gas reservoir is established using the numerical simulation software CMG (model dimension: 907.2 m × 2250 m × 36.5 m). The grid dimensions are 30 × 30.24 m and 45 × 50 m in the x and y directions. There are 5 layers in the z direction, with the size of 20 m, 6 m, 4 m, 5 m, and 1.5 m, respectively. Figure 4 displays the 3D grid mesh division of this numerical model. The basic parameters of W Block are shown in Table 1.
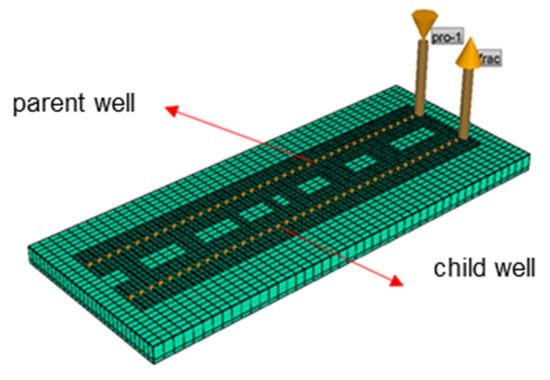
Figure 4.
D grid mesh division of numerical model of parent well and child well.

Table 1.
Basic information of numerical model of W Block.
The shale gas adsorption parameters were taken from the adsorption experimental data and the adsorption curve is shown in Figure 5.
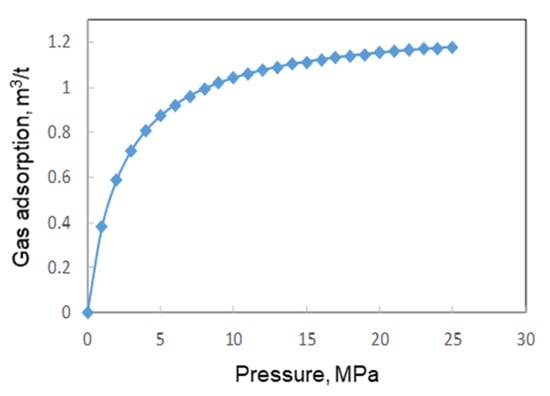
Figure 5.
Shale gas adsorption curve of W Block based on experiments.
To analyze the effect of different parameters on well interference, the following scenarios are set for further discussion. The summary of the model setup of different scenarios is tabulated in Table 2.

Table 2.
The summary of the model setup of different scenarios.
3.2. Well Interference Caused by Hydraulic Fracturing of Neighboring Wells
The gas and water production data of Scenarios 1 and 2 are compared to analyze the well interference caused by hydraulic fracturing. Scenario 1: The parent well depletes after hydraulic fracturing. Scenario 2: After one year’s depletion of the parent well, the child well starts hydraulic fracturing. In Scenarios 1 and 2, the injection rate of fracturing fluids was 500 m3/d and the injection duration was one month. The bottom-hole pressure of the production well was 15 MPa. The gas and water production rates for Scenarios 1 and 2 are shown in Figure 6a,b, respectively. Due to the hydraulic fracturing of the child well, the gas rate decreased rapidly and the water rate increased dramatically from 2 to 40 m3/d of the parent well. This is because the hydraulic fracture of the child well caused the fracture connection between two wells, and the fracturing fluids flowed from the child well to the parent well, which seriously influenced the production of the parent well. Later on, the connecting fractures gradually closed, and the daily water rate gradually decreased, while the gas well slowly recovered. However, since the interconnected fractures were not fully-closed and the fracturing fluids were retained, the relative permeability of the gas phase was affected, resulting in an irreversible decrease in gas production.

Figure 6.
Comparison of gas rate and water rate of Scenarios 1 and 2. (a) Gas rate. (b) Water rate.
3.3. Well Interference Caused by Frac-Hits
The effect of fracture connectivity on well interference is analyzed comparing Scenarios 3 and 4. In both cases, the child well starts hydraulic fracturing after one year’s depletion of the parent well. The fracture connectivity reaches 40% in Scenario 3 and 80% in Scenario 4. The simulation models of Scenarios 3 and 4 are shown in Figure 7a,b, and the simulation results of these two scenarios are shown in Figure 8a,b. For wells with higher fracture connectivity degree, it would be easier for the fracturing fluids to escape to the parent well from the child well (Figure 9). Moreover, the gas rate decrease rapidly and the water rate increases sharply due to the well interferences. Additionally, the recovery of the parent well gas production would be less compared with the scenario with less fracture connectivity.
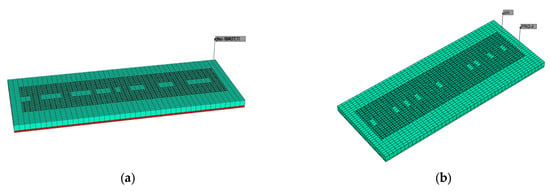
Figure 7.
D grid mesh division of numerical models of Scenarios 3 and 4. (a) Fracture connectivity of 40%. (b) Fracture connectivity of 80%.

Figure 8.
Comparison of gas rate and water rate of different scenarios. (a) Gas rate. (b) Water rate.

Figure 9.
Water saturation distribution of multi-well system. (a) Fracture connectivity of 40%. (b) Fracture connectivity of 80%.
3.4. Interference Degree under Different Well Distances
The effect of well spacing on well interference is discussed by comparing Scenarios 5 and 6 (Figure 10a,b). In Scenario 5, the well distance equals 300 m, while in Scenario 6, it increase to 510 m. The gas and water production are shown in Figure 11a,b. When the well distance equals 300 m, the water rate of the parent well increases sharply with the child well hydraulic fracturing, while the gas production decreases due to the well interference. When the well spacing equals 500 m, the inter-well fracture connectivity becomes smaller, and the hydraulic fracturing of the child well has less effect on the parent well.
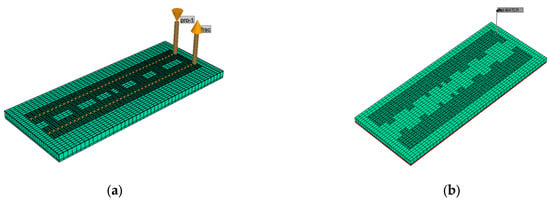
Figure 10.
3D grid mesh division of numerical models of Scenarios 5 and 6. (a) Well spacing is 300 m. (b) Well spacing is 510 m.

Figure 11.
Comparison of gas rate and water rates of different scenarios. (a) Gas rate. (b) Water rate.
3.5. Effect of Hydraulic Fracturing Timing on Production
The effect of fracturing timing on production is analyzed in Scenarios 7 and 8. In Scenario 7, after one year’s depletion of the parent well, the child well starts hydraulic fracturing. In Scenario 8, the depletion time of the parent well before the child well fracturing increases to two years. The gas rates of Scenarios 7 and 8 are shown in Figure 12a,b, separately. After the child well fractured, the gas rates of both Scenarios 7 and 8 decreased and then started to recover. The recovery degree of the gas rate reached 60% in Scenario 7, while it was only 40% in Scenario 8. When the fracturing timing of the child well happens later, the reservoir pressure near the parent well decreases due to the energy depletion. In that case, the differential pressure between the child well and the parent well becomes larger, and the well interference is more severe since more fracturing fluids are retained in the connected fractures (Figure 13b). When the reservoir energy is high enough (Figure 13a), the recovery degree of the parent well is higher after well interference.

Figure 12.
Gas rates of (a) Scenario 7 and (b) Scenario 8.

Figure 13.
Water saturation distribution after production recovery. (a) The reservoir energy level is high. (b) The reservoir energy level is low.
4. Channeling Control by Gas Injection Pressure Boosting of Newly Fractured Wells
Water starts to be produced from the parent well after 20 days of hydraulic fracturing of the child well. The gas rate of the parent well before fracturing was 57,700 m3/d. However, it sharply reduced to 0 after well interference. Therefore, the interference degree turned out to be 100%. After 5 months of recovery, the gas production rate was restored to 37,500 m3/d, and the recovery degree turned out to be 65%, as shown in Figure 14 and Figure 15. The fracture could open under high pressure and fracturing fluid flows in, while fracture closure happens under low pressure and the influence on the two-phase seepage in the fracture becomes more serious. In summary, the combination of liquid phase retention and fracture closure comprehensively affects gas phase flow capacity in fractures.
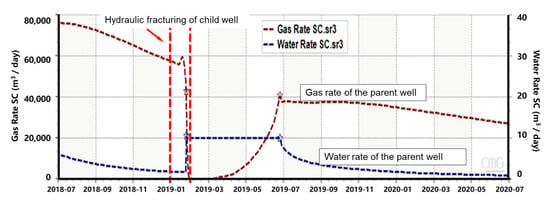
Figure 14.
Gas and water rates of the parent well before and after hydraulic fracturing of child well.
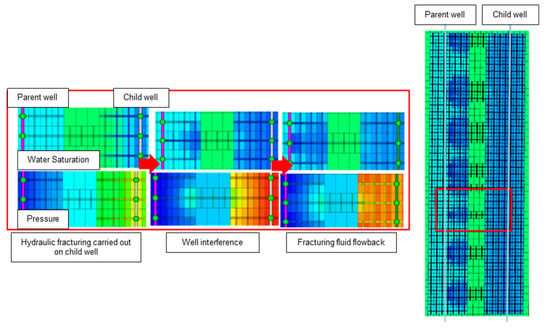
Figure 15.
Water saturation and pressure distribution after well interference.
In order to theoretically verify the effectiveness of the gas injection pressure boosting technology, a comparison between with and without gas injection was conducted. Figure 16 shows that after gas injection and pressurization of the parent well, the pressure difference between the wells reduces and the fracture propagation is restrained. Therefore, the risk of well interference is reduced.
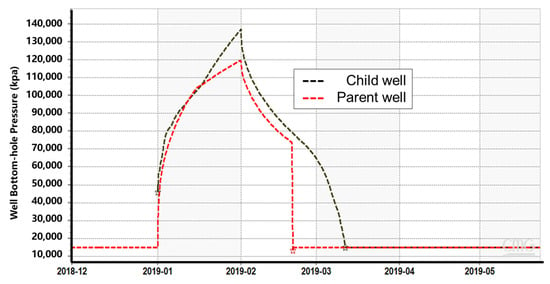
Figure 16.
Well bottom-hole pressure of parent well and child well.
The comparison of water saturation and pressure distribution between the cases with and without gas injection and pressurization are shown in Figure 17 and Figure 18. Compared with the case without gas injection and pressurization, the water saturation was lower and pressure was higher near the parent well after gas injection and pressurization, indicating that gas injection and pressurization is effective in gas channeling.
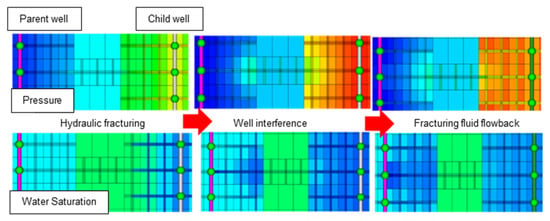
Figure 17.
Water saturation and pressure distribution without gas injection pressure boosting of newly fractured wells.

Figure 18.
Water saturation and pressure distribution with gas injection pressure boosting of newly fractured wells.
In order to optimize the effect of gas injection and pressure boosting, the effect of injection rate on gas production during gas injection and pressure boosting was analyzed. The gas rate, water rate, and cumulative gas production during gas injection are shown in Figure 19, Figure 20 and Figure 21. With the increase in gas injection rate, the water rate of the parent well decreases, and the channeling control results become better. Gas injection and pressure boosting can effectively prevent fracturing fluid flows through connecting fractures.
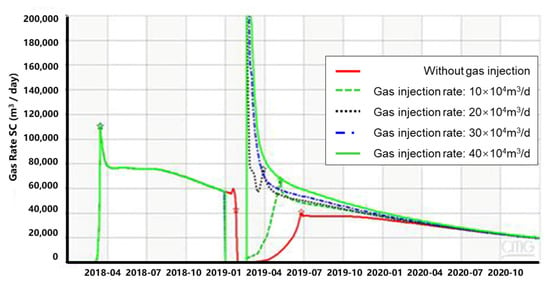
Figure 19.
Effect of injection rate of pressurization on gas rate.
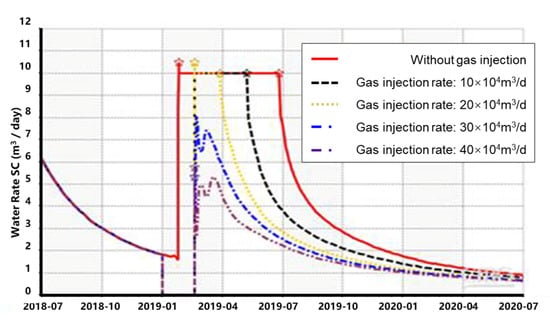
Figure 20.
Effect of injection rate of pressurization on water rate.
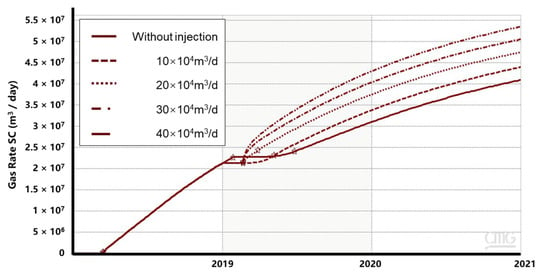
Figure 21.
Effect of injection rate of pressurization on cumulative gas production.
5. Conclusions
The well interference caused by child well hydraulic fracturing could lead to a rapid decrease in gas production and an increase in water production in the parent well, which would lead to lower cumulative gas production and gas recovery. As the fracture connectivity degree increases, the well interference between the parent well and child well becomes stronger. In addition, smaller well spacing, longer production history of the parent well before child well fracturing, and lower reservoir energy could cause more severe well interference.
Gas injection pressure boosting can effectively prevent fracturing fluids flowing through connected fractures. Before the child well hydraulic fracturing, gas injection and pressurization in the parent well could reduce the stress difference and decrease the degree of well interference.
Author Contributions
J.X.: study design and established model. Y.X.: data analysis. Y.W.: sensitivity analysis and paper writing. Y.T.: supervision and study design. All authors have read and agreed to the published version of the manuscript.
Funding
This research received no external funding.
Institutional Review Board Statement
Not applicable.
Acknowledgments
We would like to acknowledge Computer Modeling Group Ltd. for providing the CMG software.
Conflicts of Interest
The authors declare no conflict of interest.
References
- Jacobs, T. Oil and Gas Producers Find Frac Hits in Shale Wells a Major Challenge. J. Pet. Technol. 2017, 69, 29–34. [Google Scholar] [CrossRef]
- Kurtoglu, B.; Salman, A. How to utilize hydraulic fracture interference to improve unconventional development. In Proceedings of the Abu Dhabi International Petroleum Exhibition and Conference, Abu Dhabi, United Arab Emirates, 9–12 November 2015. [Google Scholar]
- Rungamornrat, J.; Wheeler, M.F.; Mear, M.E. A Numerical Technique for Simulating Nonplanar Evolution of Hydraulic Fractures. In Proceedings of the SPE Annual Technical Conference and Exhibition, Dallas, TX, USA, 9–12 October 2005. [Google Scholar]
- Fiallos, M.X.; Yu, W.; Ganjdanesh, R.; Kerr, E.; Sepehrnoori, K.; Miao, J.; Ambrose, R. Modeling Interwell Interference Due to Complex Fracture Hits in Eagle Ford Using EDFM. In Proceedings of the International Petroleum Technology Conference, Beijing, China, 26–28 March 2019. [Google Scholar]
- Jia, C.; Huang, Z.; Sepehrnoori, K.; Yao, J. Modification of two-scale continuum model and numerical studies for carbonate matrix acidizing. J. Pet. Sci. Eng. 2020, 197, 107972. [Google Scholar] [CrossRef]
- Daneshy, A.; King, G. Horizontal Well Frac-Driven Interactions: Types, Consequences, and Damage Mitigation. J. Pet. Technol. 2019, 71, 45–47. [Google Scholar] [CrossRef]
- Kang, L.; Guo, W.; Zhang, X.; Liu, Y.; Shao, Z. Differentiation and Prediction of Shale Gas Production in Horizontal Wells: A Case Study of the Weiyuan Shale Gas Field, China. Energies 2022, 15, 6161. [Google Scholar] [CrossRef]
- Shi, W.; Jiang, Z.; Gao, M.; Liu, Y.; Tao, L.; Bai, J.; Zhu, Q.; Cheng, J. Analytical model for transient pressure analysis in a horizontal well intercepting with multiple faults in karst carbonate reservoirs. J. Pet. Sci. Eng. 2023, 220, 111183. [Google Scholar] [CrossRef]
- Chang, C.; Li, Y.; Li, X.; Liu, C.; Torres, M.F.; Yu, W. Effect of Complex Natural Fractures on Economic Well Spacing Optimization in Shale Gas Reservoir with Gas-Water Two-Phase Flow. Energies 2020, 13, 2853. [Google Scholar] [CrossRef]
- Chang, C.; Liu, C.; Li, Y.; Li, X.; Yu, W.; Miao, J.; Sepehrnoori, K. A Novel Optimization Workflow Coupling Statistics-Based Methods to Determine Optimal Well Spacing and Economics in Shale Gas Reservoir with Complex Natural Fractures. Energies 2020, 13, 3965. [Google Scholar] [CrossRef]
- Huang, T.; Liao, X.; Huang, Z.; Song, F.; Wang, R. Numerical Simulation of Well Type Optimization in Tridimensional Development of Multi-Layer Shale Gas Reservoir. Energies 2022, 15, 6529. [Google Scholar] [CrossRef]
- He, L.; Yuan, C.; Gong, W. Influencing factors and preventing measures of intra-well frac hit in shale gas. Reserv. Eval. Dev. 2020, 10, 63–69. [Google Scholar]
- Morales, A.; Zhang, K.; Gakhar, K.; Porcu, M.M.; Lee, D.; Shan, D.; Malpani, R.; Pope, T.; Sobernheim, D.; Acock, A. Advanced modeling of interwell fracturing interference: An Eagle Ford Shale oil study-refracturing. In Proceedings of the SPE Hydraulic Fracturing Technology Conference, The Woodlands, TX, USA, 9–11 February 2016. [Google Scholar]
- Khodabakhshnejad, A. Impact of frac hits on production performance-a case study in Marcellus Shale. In Proceedings of the SPE Western Regional Meeting, San Jose, CA, USA, 23–26 April 2019. [Google Scholar]
- Pankaj, P.; Shukla, P.; Kavousi, P.; Carr, T. Determining optimal well spacing in the Marcellus shale: A case study using an integrated workflow. In Proceedings of the SPE Argentina Exploration and Production of Unconventional Resources Symposium, Neuquen, Argentina, 14–16 August 2018. [Google Scholar]
- Wang, L. Frac Hit in Complex Tight Oil Reservoir in Ordos Basin: The Challenges, the Root Causes and the Cure. In Proceedings of the SPE Annual Technical Conference and Exhibition, Virtual, 5–7 October 2020. [Google Scholar]
- Ajani, A.; Kelkar, M. Interference study in shale plays. In Proceedings of the SPE Hydraulic Fracturing Technology Conference, The Woodlands, TX, USA, 6–8 February 2012. [Google Scholar]
- Magneres, R.D.; Castello, M.; Bertoldi, F.; Griffin, M. Vaca Muerta frac-hit occurrence and magnitude forecast methodology. In Proceedings of the Latin America Unconventional Resources Technology Conference, Buenos Aires, Argentina, 16–18 November 2020. [Google Scholar]
- Vincent, M. Restimulation of unconventional reservoirs: When are refracs beneficial? J. Can. Pet. Technol. 2011, 50, 36–52. [Google Scholar] [CrossRef]
- Barree, R.D.; Miskimins, J.L.; Svatek, K.J. Reservoir and Completion Considerations for the Refracturing of Horizontal Wells. SPE Prod. Oper. 2017, 33, 1–11. [Google Scholar]
- Gao, D.; Liu, Y.; Wang, D.; Han, G. Numerical Analysis of Transient Pressure Behaviors with Shale Gas MFHWs Interference. Energies 2019, 12, 262. [Google Scholar] [CrossRef]
- He, Y.; Barree, A. Shale Gas Production Evaluation Framework based on Data-driven Models. Pet. Sci. 2022. [Google Scholar] [CrossRef]
- Manchanda, R.; Hwang, J.; Bhardwaj, P.; Sharma, M.M.; Maguire, M.; Greenwald, J. Strategies for improving the performance of child wells in the permian basin. In Proceedings of the Unconventional Resources Technology Conference, Houston, TX, USA, 23–25 July 2018. [Google Scholar]
- Jia, C.; Sepehrnoori, K.; Huang, Z.; Yao, J. Modeling and Analysis of Carbonate Matrix Acidizing Using a New Two-Scale Continuum Model. SPE J. 2021, 26, 2570–2599. [Google Scholar] [CrossRef]
- Wei, Y.; Han, G. Optimization of shale gas well pattern and spacing. Nat. Gas Ind. 2022, 38, 129–137. [Google Scholar]
- Jacobs, T. In the Battle Against Frac Hits, Shale Producers Go to New Extremes. J. Pet. Technol. 2018, 70, 35–38. [Google Scholar] [CrossRef]
- Bommer, P.A.; Bayne, M.A. Active Well Defense in the Bakken: Case Study of a Ten-Well Frac Defense Project, McKenzie County, ND. In Proceedings of the SPE Hydraulic Fracturing Technology Conference and Exhibition, The Woodlands, TX, USA, 23 January 2018. [Google Scholar]
- Zheng, S.; Manchanda, R.; Gala, D.; Sharma, M. Preloading Depleted Parent Wells To Avoid Fracture Hits: Some Important Design Considerations. SPE Drill. Complet. 2020, 36, 170–187. [Google Scholar] [CrossRef]
- Gala, D.P.; Manchanda, R.; Sharma, M.M. Modeling of fluid injection in depleted parent wells to minimize damage due to frac-hits. In Proceedings of the SPE/AAPG/SEG Unconventional Resources Technology Conference, Houston, TX, USA, 23–25 July 2018. [Google Scholar]
- Swanson, C.; Hill, W.A.; Nilson, G.; Griman, C.; Hill, R.; Sullivan, P.; Aften, C.; Jimenez, J.C.; Pietrangeli, G.; Shedd, D.C.; et al. Post-frac-hit mitigation and well remediation of Woodford horizontal wells with solvent/surfactant chemistry blend. In Proceedings of the Unconventional Resources Technology Conference, Houston, TX, USA, 23–25 July 2018. [Google Scholar]
- Paryani, M.; Smaoui, R.; Poludasu, S.; Attia, B.; Umholtz, N.; Ahmed, I.; Ouenes, A. Adaptive fracturing to avoid frac hits and interference: A Wolfcamp shale case study. In Proceedings of the SPE Unconventional Resources Conference, Calgary, AB, Canada, 15–16 February 2017. [Google Scholar]
- Johnson, D.C.; Yeager, B.B.; Roberts, C.D.; Fowler, B.W. Offset fracture events made simple: An operator’s collaborative approach to observe parent child interactions, measure frac hit severity and test mitigation strategies. In Proceedings of the SPE Hydraulic Fracturing Technology Conference and Exhibition, The Woodlands, TX, USA, 4 February 2020. [Google Scholar]
- Shi, W.; Cheng, J.; Liu, Y.; Gao, M.; Tao, L.; Bai, J.; Zhu, Q. Pressure transient analysis of horizontal wells in multibranched fault-karst carbonate reservoirs: Model and application in SHB oilfield. J. Pet. Sci. Eng. 2023, 220, 111167. [Google Scholar] [CrossRef]
- Qin, J.-Z.; Zhong, Q.-H.; Tang, Y.; Yu, W.; Sepehrnoori, K. Well interference evaluation considering complex fracture networks through pressure and rate transient analysis in unconventional reservoirs. Pet. Sci. 2022. [Google Scholar] [CrossRef]
- Han, G.; Liu, Y.; Liu, W.; Gao, D. Investigation on Interference Test for Wells Connected by a Large Fracture. Appl. Sci. 2019, 9, 206. [Google Scholar] [CrossRef]
Disclaimer/Publisher’s Note: The statements, opinions and data contained in all publications are solely those of the individual author(s) and contributor(s) and not of MDPI and/or the editor(s). MDPI and/or the editor(s) disclaim responsibility for any injury to people or property resulting from any ideas, methods, instructions or products referred to in the content. |
© 2022 by the authors. Licensee MDPI, Basel, Switzerland. This article is an open access article distributed under the terms and conditions of the Creative Commons Attribution (CC BY) license (https://creativecommons.org/licenses/by/4.0/).