Abstract
The key to ensuring the economic feasibility of EGS mainly includes two points. On the one hand, it is necessary to ensure the connectivity of the artificial fracture network; on the other hand, it is necessary to determine the most efficient geothermal energy exploitation mode. Most previous studies have only focused on one of the points. To restitute the entire geothermal energy development process, the two parts should be combined to conduct research. In this study, a random fractured medium model was established based on the TOUGH2-BIOT simulation program and the whole process of reservoir stimulation was analyzed. According to the results of reservoir stimulation, different geothermal energy exploitation schemes are set up, and the heat transfer efficiency of the conventional double vertical wells, the horizontal wells, and the double-pipe heat exchange system are comparatively analyzed. The results show that reservoir reconstruction is mainly divided into three stages: In the first stage, the hydraulic aperture of the conducting fractures reaches the maximum value; in the second stage, the non-conductive fractures overcome the in situ stress and become conducting fractures; in the third stage, the rock in the reservoir undergoes shear failure, the fractures expand and connect, and finally, a fracture network is formed. After each stage, the volume of the enhanced permeability area is approximately 10,000, 21,000, and 33,000 m3, respectively. After 30 years of exploitation, the outlet temperature and thermal power output of conventional double vertical wells are the highest, while the horizontal wells have the highest heat extraction ratio. The temperature of a production well in the conventional double vertical wells model, horizontal wells, and double-pipe heat exchange system is 101 °C, 93.4 °C, and 91.6 °C, a decrease of 41.2%, 45.7%, and 46.7%, respectively. The thermal power output is 6.67 MW, 6.31 MW, and 6.1 MW, a decrease of 39.4%, 42.6%, and 44.5%, respectively. The heat extraction ratio of the horizontal wells is 2% higher than the double-pipe heat exchange system and 6.5% higher than the conventional double vertical wells.
1. Introduction
The energy structure dominated by traditional fossil energy has placed huge pressure on the environment [1]. Countries are always looking for environmentally friendly, energy-efficient, and, especially, renewable energy sources to reduce the proportion of fossil fuels in the energy structure [2]. Geothermal energy has received increasing attention with regard to its green and renewable resource with abundant reserve, and its commercial exploitation is believed to be an effective option to achieve the targets of “carbon peaks” and “carbon neutral” [3,4]. Therefore, the effective development of deep geothermal resources has become a research focus in the geothermal industry.
Hot dry rock (HDR) represents the largest portion of the geothermal energy reserve. According to statistics, the total HDR geothermal resources buried at 3–10 km is 2.5 × 1025 J (equivalent to 860 trillion tons of standard coal), with the energy contained equivalent to 30 times the energy contained in all the oil, gas, and coal in the world combined [5,6]. However, due to HDR being dense and hard, and the permeability extremely low, the degree of exploitation is the lowest among geothermal resources. Therefore, in the development and utilization of dry heat geothermal resources, hydraulic fracturing is required to form artificial fracture networks, with heat extracted by injecting flow in water injection wells, circulated in the fracture network, and collected in production wells to form an enhanced geothermal system (EGS) [7,8]. However, the development of HDR geothermal resources exploitation is an extremely complex process, generally expressed as a thermal-hydrological-mechanical (THM) coupling problem. Considering the difficulty of direct monitoring and research on deep underground space, a numerical simulation is an efficient way of solving multi-field coupling problems [9].
The key to ensuring the economic feasibility of EGS mainly includes two points. On the one hand, it is necessary to ensure the connectivity of the artificial fracture network. In the process of reservoir stimulation, the uncontrollability of fracture development is the main reason affecting the connectivity of artificial fracture networks [10]. The fracture system in EGS could be represented by two methods, namely, the discrete fracture network model and the equivalent continuous porous media model [11]. Based on these methods, many numerical models have been established to study the reservoir stimulation of EGS. By establishing a fractured porous media model, Rutqvistz et al. analyzed the effect of stress changes on fracture development in the process of reservoir stimulation [12]. Lei et al. analyzed the changes in pressure, temperature, and stress inside EGS in the stage of fracture development by establishing an equivalent porous media model [13]. Lu et al. and Ghassemi et al. proposed a fully coupled equivalent porous medium model of THM based on rock mass deformation, shear expansion, and fracture expansion when fluid seepage occurs inside fractures, which can quantitatively predict the complex fracture reconstruction process in the fracture system [14,15]. Saeed et al. developed stochastic discrete fracture networks (DFN) to mimic the reservoir permeability behavior based on experimental and field data [16,17].
On the other hand, after establishing the artificial fracture network, the exploitation efficiency of geothermal energy will be affected by different wellbore layouts. The heat transfer between the geothermal reservoir and fluid medium in the EGS is described by two models: local thermal equilibrium and local thermal non-equilibrium. Research shows that compared with other wellbore layout methods, the traditional double vertical wells have the highest outlet temperature, the horizontal wells have the highest heat power output and heat extraction rate, and the double-pipe heat exchange system has the lowest reservoir reconstruction cost and better fracture network connectivity [18,19,20,21,22].
Although the previous numerical simulation studies on EGS performance are extensive, fractures in the geothermal reservoir are randomly distributed, the dip angle and dip tendency of different fractures are different, and the directionality of the fractures needs to be considered when establishing the fractured medium model. Meanwhile, previous numerical simulation studies have only analyzed one wellbore layout method or compared the heat transfer efficiency of two wellbore layout methods, so it is difficult to analyze the advantages and disadvantages of multiple wellbore layout methods in geothermal energy production. Furthermore, HDR geothermal energy development includes two parts: reservoir reconstruction and thermal energy exploitation. Most previous studies only focus on one part. To restore the entire geothermal energy development process, the two parts should be combined to conduct research.
This paper takes geothermal field data from Matouying as a geological reference. Based on a numerical simulation performed with TOUGH2-BIOT, a random feature to distinguish the direction of the distribution of fractures during model creation is introduced, and based on the permeability tensor method, the porous medium is replaced by the fractured medium. The evolution characteristics of the seepage field during the reservoir stimulation process were analyzed to evaluate the fracturing effect. The wellbore layout position was set according to the reservoir reconstruction result, with the heat transfer efficiency of conventional double vertical wells, horizontal wells, and the double-pipe heat exchange system compared and analyzed. The simulation result was verified by analyzing the temperature field evolution characteristics of the geothermal reservoir after heat transfer.
2. Geothermal Data in the Matouying Geothermal Field
The Matouying uplift area is located in the eastern part of Hebei Province and is a low plain area with large tectonic subsidence, with the deep and large fractures in the field well developed [23]. The specific geographical location of the Matouying geothermal field is shown in Figure 1. The north side of the geothermal field is bounded by the Mabei fault, the west side is bounded by the Baigezhuang fault zone, and the south side is bounded by the Hongfangzhi fault zone [24].
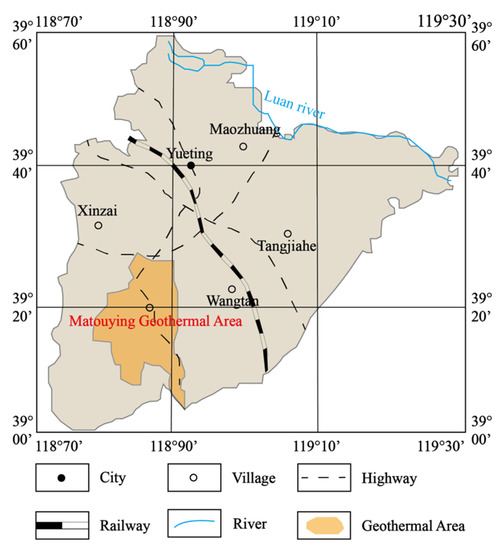
Figure 1.
Matouying geothermal field location.
To investigate the deep high-temperature geothermal resource, multiple exploration wells were drilled in the Matouying geothermal field. The temperature logs of exploration wells with the lithologic feature are shown in Figure 2. The measured results indicate that there is a certain degree of heterogeneity in the geothermal gradient in the area, which generally shows that the change is relatively slow in the north and relatively large in the south offshore area. The Cenozoic geothermal gradient in the study area is 3.0–5.0 °C/hm, and the deep geothermal gradient is 3.2 °C/hm, which actually reflects the influence of thermal conductivity on geothermal gradient, as the thermal conductivity of granite and granulite is obviously higher than that of sandstone, mudstone, and loose sediment, generally. In fact, this phenomenon can also be observed in the drilling data of other geothermal fields, such as the Guide EGS field in Qingha, China, and the Feton Hill EGS field in New Mexico, USA. The maximum temperature 4000 m underground can reach 200 °C and the area where the temperature exceeds 150 °C exceeds 600 km2 in the study area. The reservoir lithology of the geothermal area from top to bottom is Quaternary loose sediment, Neogene mudstone–sandstone mixture, and Taikoo Temple formation metamorphic monzonitic granite and biotite plagioclase granulite.
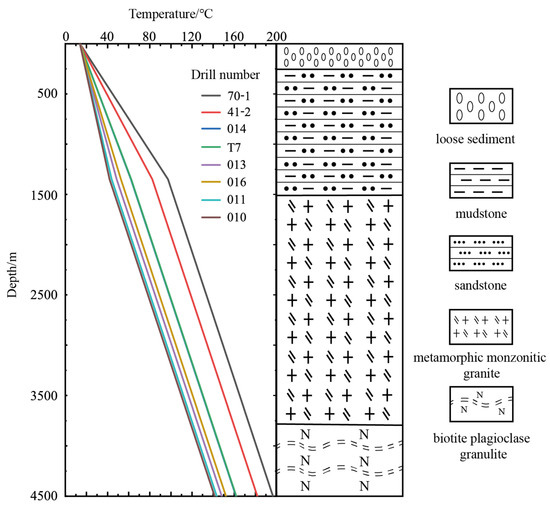
Figure 2.
Distributions of rock lithologic and temperature in the depth profile of the borehole in the Matouying uplift area.
From the XRMI televiewer survey in Figure 3, it can be seen that there are a large number of natural fractures at 4200–4500 m underground in the study area, with the density of the natural fracture 0.02–0.26 per/m, and the fracture width in the order of tens of microns. The direction of the maximum principal stress of the formation is SEE-NWW.
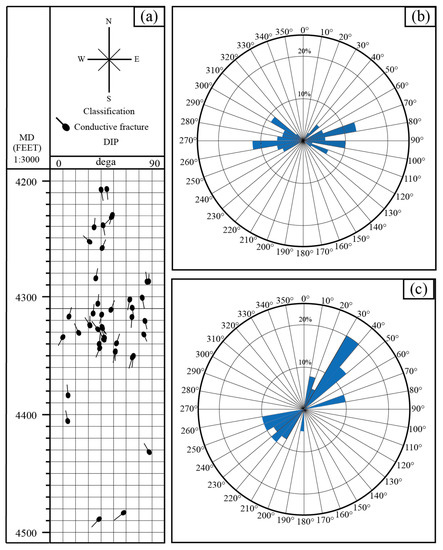
Figure 3.
Natural occurring fractures in well M-2: (a) tadpole diagram of identified fractures, (b) fracture population dip azimuths, and (c) fracture population dip strikes.
3. Numerical Models and Simulation Approach
3.1. Governing Equation for THM Process
The coupled THM analysis was conducted using TOUGH2-BIOT [25]. TOUGH2-BIOT does not require external data exchange; therefore, computing ability is more efficient. In addition, TOUGH2-BIOT can be easily extended for considering the THM coupled processes in fractured media [26]. In fact, TOUGHBIOT is an extended version for mechanical problems developed based on TOUGH2 V2.0, which is a well-accepted numerical simulator for solving multiphase fluid and heat flows, both in porous and fractured geological media [27]. The general formulations for multiphase flow, heat convection, and conduction processes are summarized in Table 1.

Table 1.
General mathematical model of coupled TH processes in TOUGH2 V2.0.
Table 1.
General mathematical model of coupled TH processes in TOUGH2 V2.0.
| Description | Governing Equation |
|---|---|
| Mass and energy conservation | |
| Mass accumulation | |
| Mass flux | |
| Energy accumulation | |
| Heat flux |
Where MK is the mass accumulation of component κ (kg/m3), V is the volume (m3), Γ is the surface area (m2), MK is the mass flux of component κ (kg/m3·s), qK is the sink/source of component κ (kg/m3), β = A, G are the aqueous and gaseous phase, respectively, φ is the porosity, Sβ is the saturation of phase β, ρβ is the density of phase β (kg/m3), is the mass fraction of component κ in phase β, k is the permeability (m2), krβ is the relative permeability of phase β, is the internal energy of phase β (J/kg), Pβ is the pressure of phase β (Pa), g is the gravitational acceleration vector (m/s2), is the energy accumulation (kg/m3), ρR is the density of rock grain (kg/m3), CR is the specific heat of rock grain (J/kg·°C), T is the temperature (°C), is the viscosity of phase β (Pa·s), is the energy flux (W/m2), is the average thermal conductivity (W/ °C·m), and is the specific enthalpy of phase β (J/kg·°C).
In mechanics, assuming rock as an elastic material and obeying the generalized Hooke’s law, then, based on the stress equilibrium equations, compatibility equations, and stress–strain relationships, the Biot consolidation model can be obtained by combining the effective stress law with stress and displacement as the main unknown variables [28], as shown in Table 2.
Table 2.
Three-dimensional extended Biot mechanical model.
Table 2.
Three-dimensional extended Biot mechanical model.
| Description | Governing Equations |
|---|---|
| Displacement | |
| Normal strain | |
| Effective stress |
Where G is the shear modulus (Pa), w is the displacement (m), βT is the thermal expansion coefficient (1/°C), is the bulk strain, is the normal stress (Pa), and is the normal strain.
3.2. Permeability Evolution of the Fractured Rock
In this study, the establishment of fractured reservoirs is mainly based on borehole imaging results; therefore, there are many imaginary fractures in each grid in the model. The permeability of fractures with different dip angles and dip tendencies are converted into a permeability tensor to represent the equivalent permeability of a group of fractures with the same dip angle and tendency, which is defined by Equation (1) [29].
where k is the permeability (µm2), b is the equivalent hydraulic fracture aperture (m), l is the distance between the fluid flow in the fracture (m), and β and γ are the fracture surface tendency and dip angles, respectively.
The stress state of the fracture surface determines its ability to generate shear failure. After calculating the stress state of each grid, it needs to be converted to the corresponding fracture surface. According to the mechanical balance method, the stress acting on a given fracture plane is calculated [30]. The stress has the following relationship:
where is the effective normal stress (Pa), τn is the shear stress (Pa), is the effective normal stress in x, y, z directions (Pa), and l, m, n are the direction cosines of the fracture plane normal with respect to the principal stress axes , , , respectively.
The Mohr–Coulomb failure criterion is used to define the shear strength of fractured rock, as follows [31]:
where Fc is the shear strength (Pa), μs is the Static friction coefficient, and c is the cohesion (Pa).
The shear displacement of fracture can be calculated from the stiffness coefficient and the excess shear stress [32], and is written as:
where d is the shear displacement (m), τex is the excess shear stress (Pa), Kf is the shear fracture stiffness (Pa/m), and μd is the dynamic friction coefficient.
The rock will experience the change of aperture, bending, and surface roughness after the shear failure. Meanwhile, under the action of overburden load, the rock will produce shear displacement, with the relationship between fracture permeability and related parameters shown in Equation (6).
where K = log10(k), ΔKmax = log10(kmax) − log10(kimi) is the maximum permeability enhancement, and d5 and d95 are the shear displacements corresponding to 95% and 5% of the maximum permeability enhancement, respectively.
4. Numerical Simulation of Reservoir Stimulation
4.1. Model Description
4.1.1. Model Geometry and Spatial Discretization
The random fractured medium model was developed based on information provided by borehole imaging results. The model geometry is 300 m × 300 m in the horizontal, with the top and bottom surfaces of the model 4200 m and 4500 m underground, respectively. The z-axis of the model coincides with the direction of the maximum principal stress, while the x-axis and y-axis coincide with the horizontal maximum principal stress and minimum principal stress, respectively. When dividing the grid, the center of the injection well is dense in the middle and the surrounding is sparse. The grid size of the central fracturing zone (100 m × 100 m × 100 m) is 10 m, the radius of the water injection well is 0.1 m, and it is located in the center of the fracturing zone; from the fracturing zone to the outside, the grid volume increases to 20 m and 30 m in turn.
4.1.2. Initial and Boundary Conditions
According to the geothermal gradient curve of the study area, the temperature of the reservoir top surface was set to 171 °C. According to the in situ stress formulation, the vertical stress gradient is 26.85 Mpa/km, the horizontal maximum principal stress gradient is 18.80 Mpa/km, and the horizontal minimum principal stress gradient is 16.11 Mpa/km.
The Dirichlet boundary conditions are applied to the injection well. Meanwhile, the frictional pressure loss along the wellbore is ignored, which can effectively conduct the wellhead high pressure to the fracturing point. The zero heat and mass flow boundary conditions are applied to the bottom boundary of the model, and the rest of the boundaries are constant temperature and constant pressure boundaries. To monitor the change of the stress field of the model in real-time, the displacements in the x and y directions of the top, bottom, and surrounding boundaries of the model, and the z-direction displacement of the bottom boundary, are limited.
4.1.3. Initial Permeability
The initial permeability of the fracture media model is based on borehole imaging results. To characterize the difference in fracture density in the vertical direction, the model is divided into five layers from top to bottom, as shown in Table 3. Based on Equation (1), the distribution of initial permeability kx, ky, and kz are calculated and shown in Figure 4. Under the action of the in situ stress field, the permeability in the kx direction is the best, followed by the ky direction, and the kz direction is the smallest, with the kx direction the optimal direction for reservoir stimulation.
Table 3.
Parameter values used for generating random fracture medium model.
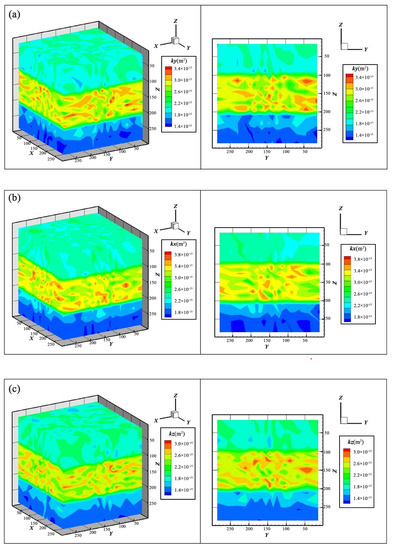
Figure 4.
Three-dimensional images display the spatial distribution of initial fracture permeability in the x, y, and z directions, respectively.
4.1.4. Reservoir Parameters
The main parameters of the reservoir are all measured by laboratory experiments, with the static and dynamic friction coefficients chosen concerning the experimental results of [33]. Based on Equations (5) and (6), shear fracture stiffness can be calculated from ΔKmax, with the parameter used in Equation (6) referencing the hydro-mechanical experimental results of Lee et al. [34]. The values of the main parameters of the THM model are shown in Table 4.
Table 4.
Parameter values used for generating in the THM model.
The temperature and pressure at the injection point location were estimated by the wellbore simulator T2WELL. As shown in Figure 5, the simulation results show that the temperature of the injected water fluid is stable at 35 °C after 1 day, and the temperature decreases slightly with the increase of the water injection time, but the decrease is small. The pressure in the well is defined as and the hydrostatic pressure at the bottom of the well is 41 MPa.
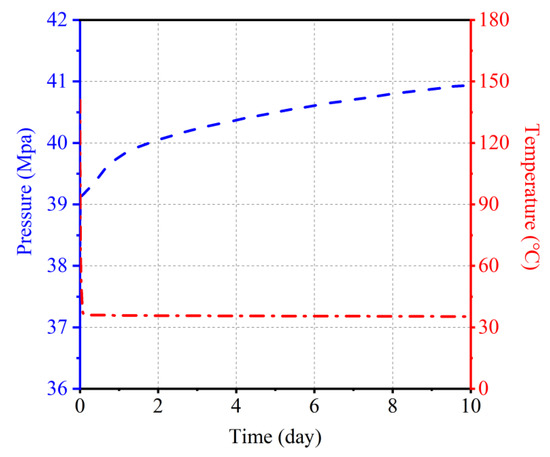
Figure 5.
Initial temperature and pressure values at the water injection point.
4.2. Model Calibration
In the random fractured media model, the generation of each fracture is random. In order to reduce this uncertainty, the dip tendency and dip angle of the fractures should not be changed as much as possible during model calibration, and the aperture of the fractures should be adjusted first. In the model calibration stage, the measured injection flow rate is used to simulate the changing trend of wellhead pressure during the reservoir reconstruction process, with the measured data and simulation results fitted by adjusting the fracture width. The adjustment range of each parameter was determined based on the relevant research results, to prevent excessive adjustment.
Reservoir fracturing mainly includes three stages; in the first stage, the water injection rate is 2.0–3.0 m3/min, which lasts for 2 days. As shown in Figure 6, the simulated curve is consistent with the measured head pressure curve. Within the first 7 h of the first day, the wellhead pressure was relatively stable, indicating at this stage that the hydraulic aperture of the conductive fractures in the reservoir gradually increased with the increase in water injection. However, in the eighth hour of the injection, the wellhead pressure showed an upward trend, and this trend continued to the end of the second day. It indicates that the hydraulic aperture of conductive fractures in the reservoir reaches the maximum under the action of in situ stress, but no new fractures are generated.
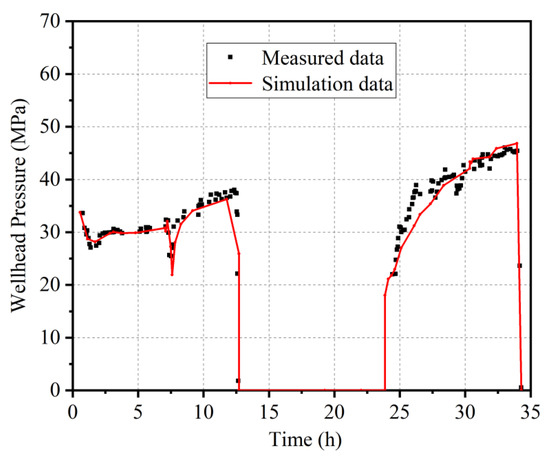
Figure 6.
Comparison of measured and simulated results of reservoir stimulation in the first stage.
In the second stage, the water injection rate is 4.0–5.5 m3/min, which lasts for 3 days. As shown in Figure 7, on the third and fourth days of fracturing and the first half of the fifth day, although the curve fluctuates, the wellhead pressure does not exceed the first stage, indicating that shear failure did not occur in this stage. The reason for this phenomenon is that the liquid pressure inside the fracture relieves the effect of in situ stress so that the non-conducting fractures in the reservoir become a conducting fracture. This trend is alleviated after the fracturing time is 100 h, and the wellhead pressure further increases.
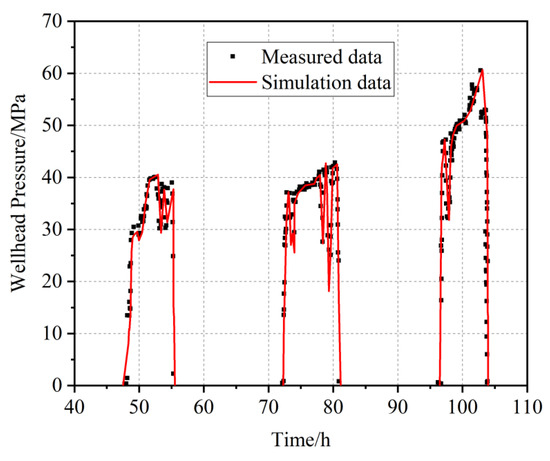
Figure 7.
Comparison of measured and simulated results of reservoir stimulation in the second stage.
In the third stage, the water injection rate is 6.0–7.0 m3/min, which lasts for 3 days. As shown in Figure 8, compared with the previous two stages, the wellhead pressure increased significantly in this stage, and compared with the second stage, the wellhead fluctuates more sharply, indicating that the hydraulic shear phenomenon occurred in this stage. On the seventh and eighth days of fracturing, the maximum value of wellhead pressure gradually decreased. The reason for this phenomenon is that due to the occurrence of hydraulic shear, the original fractures and new fractures of the reservoir are connected, and an artificial fracture network is gradually formed.
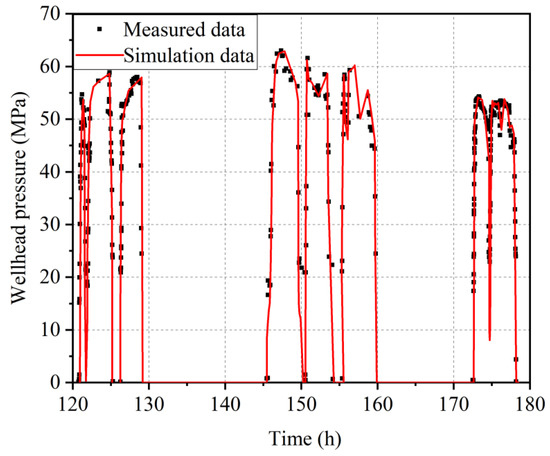
Figure 8.
Comparison of measured and simulated results of reservoir stimulation in the third stage.
4.3. Reservoir Reconstruction Results
The basic principle of reservoir reconstruction is to increase the liquid pressure in the reservoir or reduce the temperature of the reservoir, thereby reducing the effective stress of the rock body firmware, causing the rock to undergo shear slip, and thereby increasing its permeability. This can be represented by a Mohr diagram and the movement of stress circles to demonstrate such a physical process, as shown in Figure 9.
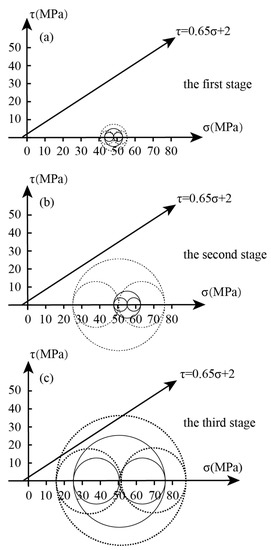
Figure 9.
Stress state of natural fracture around the fracturing point after each stage: (a) first stage; (b) second stage; (c) third stage.
After the first stage, the Mohr stress circle expands outward from the center of the circle. At this time, the Mohr stress circle is far from the failure envelope and no fractures are formed in the reservoir (Figure 9a). After the second stage, the center of the Mohr stress circle moves to the left and the diameter of the Mohr circle increases significantly. At this time, the distance between the Mohr circle and the failure envelope line is small (Figure 9b). After the third stage, the center of the Mohr stress circle continues to move to the left and, at the same time, its diameter further increases, and the Mohr stress circle intersects with the failure envelope. At this time, some rocks near the fracturing point suffered shear damage (Figure 9c).
The main purpose of reservoir reconstruction is to increase the connectivity of artificial fracture networks, that is, the permeability of fluid media in the fractures. Therefore, to reflect the reformation effect of this reservoir reconstruction, the permeability of the reservoir after the end of each stage was analyzed.
After the first stage, the permeability of the reservoir is enhanced in all directions. As shown in Figure 10, the enhancement effect of permeability along the x direction is the best, the enhancement range is 25 m, and the reservoir permeability at the water injection point is enhanced by 17 times; the enhancement range of permeability in the y direction is 18 m, and the reservoir permeability at the water injection point is enhanced by 7 times; the enhancement range of permeability in the z direction is 23 m, the reservoir permeability at the water injection point is enhanced by 16 times, and the volume of the enhanced permeability area is approximately 10,000 m3.
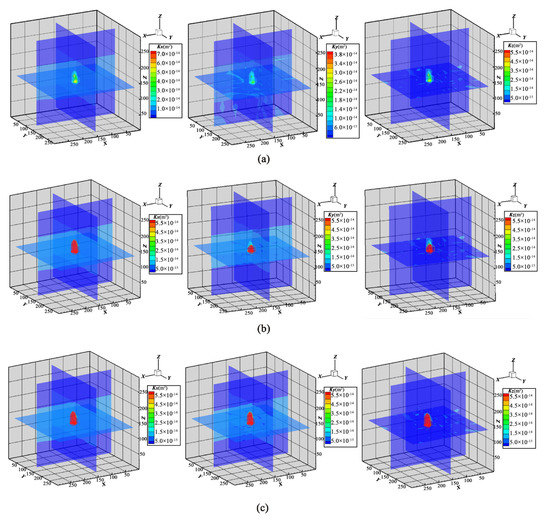
Figure 10.
Permeability of reservoir in x, y, z directions after: (a) first stage; (b) second stage; (c) third stage.
As shown in Figure 11, after the second stage, the enhancement range of the permeability in the x direction is 30 m, and the reservoir permeability at the water injection point is enhanced by 256 times; the enhancement range of the permeability in the y direction is 25 m, and the reservoir permeability at the water injection point is enhanced by 121 times; the enhancement range of the permeability in the z direction is 29 m, the reservoir permeability at the water injection point is enhanced by 221 times, and the volume of the enhanced permeability area is approximately 21,000 m3.
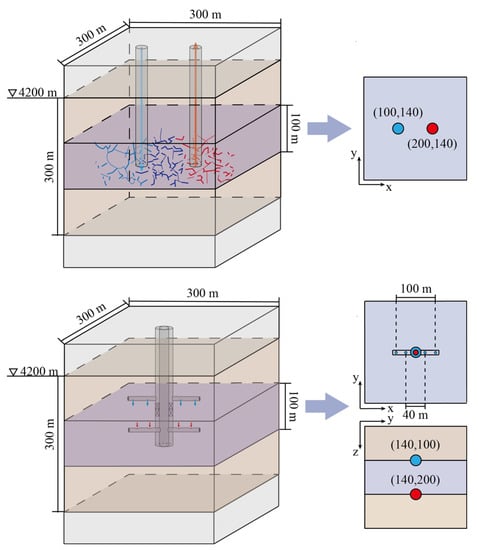
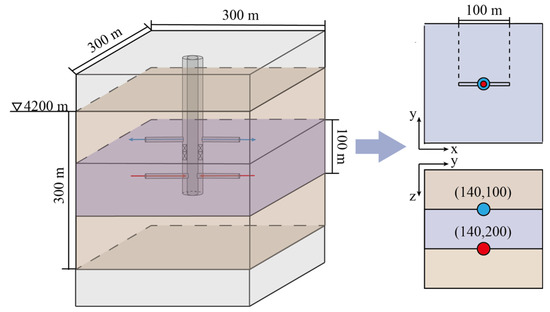
Figure 11.
Physical models of the conventional double vertical wells model, horizontal wells, and double-pipe heat exchange system.
As shown in Figure 12, after the third stage, the enhancement range of the permeability in the x direction is 34 m, and the reservoir permeability at the water injection point is enhanced by 818 times; the enhancement range of the permeability in the y direction is 30 m, and the reservoir permeability at the water injection point is enhanced by 312 times; the enhanced range of permeability in the z direction is 33 m, the reservoir permeability at the water injection point is enhanced by 777 times, and the volume of the enhanced permeability area is approximately 33,000 m3.
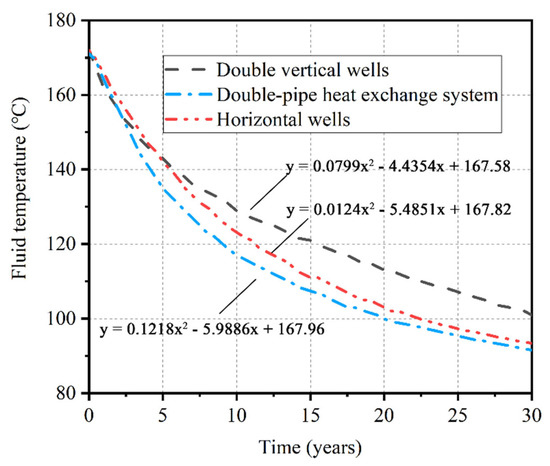
Figure 12.
Average production temperature curve.
4.4. Heat Exploitation Model Establish
Based on the results of reservoir stimulation, the conventional double vertical wells, horizontal wells, and double-pipe heat exchange system model were established and are shown in Figure 11. In order to prevent water leakage, according to the actual conditions of the reservoir, a layer of dense rock is set on the upper and lower parts of the model. The total water injection rate during the simulation was 15 kg/s and the total heat exploitation period is 30 years.
To facilitate the analyses and discussion, three parameters, namely, average production temperature, output thermal power, and heat extraction rate, are defined to characterize the heat exploitation performance of the EGS.
The average production temperature is defined as follows [20]:
where S is the perimeter of the production well (m) and T(t) is the temperature of the production well at time t (°C).
The output thermal power is calculated as follows:
where q is the average volume flow rate of the production well (m3/s), Tinj is the temperature of injection well (°C), Ρw is the density of water (kg/m3), and cw is the heat capacity of water (J/kg·°C).
The heat extraction rate is equal to the heat extracted divided by the heat energy stored in the simulated reservoir volume, written as:
where Ω is the simulated reservoir volume (m3).
5. Simulation Results and Analysis
5.1. Comparison of Heat Exploitation Performance
The simulation results based on the heat exploitation model are shown in Figure 12, Figure 13 and Figure 14; to further compare the heat extraction capabilities of different systems, the trend line equations in polynomial form were also included in the figure. Under the same reservoir condition, Figure 12 shows the temperature of a production well under different production models over 30 years. It can be observed that the average production temperature of the three exploitation models decreases gradually with time. After 30 years, the temperature of a production well in the conventional double vertical wells model, horizontal wells, and double-pipe heat exchange system is 101 °C, 93.4 °C, and 91.6 °C, a decrease of 41.2%, 45.7%, and 46.7%, respectively. In the process of geothermal energy exploitation, the outlet temperature of the double-pipe heat exchange system is always lower than the horizontal wells. After 2 years of exploitation, the outlet temperature of the conventional double vertical wells model is higher than the double-pipe heat exchange system and exceeds the horizontal well in the fifth year.
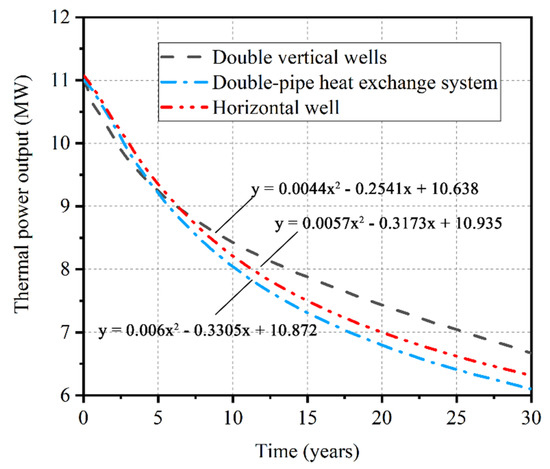
Figure 13.
Thermal power output curve.
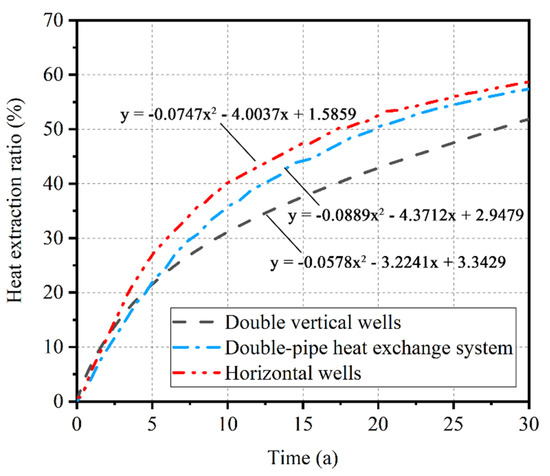
Figure 14.
Heat extraction ratio curve.
As shown in Figure 13, the thermal power output curve is highly similar to the fluid temperature curve. After 30 years, the thermal power output in the conventional double vertical wells model, horizontal wells, and double-pipe heat exchange system is 6.67 MW, 6.31 MW, and 6.1 MW, a decrease of 39.4%, 42.6%, and 44.5%, respectively. In the 30th year of heat exploitation, the thermal power of conventional double vertical wells is 6% higher than that of horizontal wells and 11% higher than the double-pipe heat exchange systems.
As shown in Figure 14, after 30 years of geothermal energy exploitation, the heat extraction ratio of the double-pipe heat exchange system is always lower than the horizontal wells. In the early stage of geothermal energy exploitation, the heat transfer efficiency of the conventional double vertical wells is higher, but as the exploitation progresses, it is gradually lower than that of the horizontal wells and the double-pipe heat exchange system. Additionally, in the 30th year of heat exploitation, the heat extraction ratio of the horizontal wells is 2% higher than the double-pipe heat exchange system and 6.5% higher than the conventional double vertical wells.
5.2. Analysis of the Temperature Field Results
The temperature field distribution under different exploitation models is shown in Figure 15, Figure 16 and Figure 17. In the early stage of geothermal energy exploitation, the conventional double vertical wells are centered on the injection point, the low-temperature area is approximately concentric circles, and the range of the low-temperature area is small and does not extend to the vicinity of the production well. Therefore, compared with other production models, the heat extraction rate of the double vertical wells system is higher at this stage. With the development of geothermal energy exploitation, the fluid medium flows continuously to the outlet point through the fracture network, the low-temperature area expanded to the outlet point. In the 20th year, the low-temperature area was extended to the water outlet point, the low-temperature area is in the shape of a droplet, and at this stage, the production efficiency of geothermal wells decreased significantly. In the 30th year, the low-temperature area spreads more below than above the water outlet. It is speculated that the reason for this phenomenon is that the fluid medium will flow downward due to the action of gravity. At the same time, compared with other production modes, the conventional double vertical production mode has only one water outlet. This will lead to untimely water output from the outlet point, and the sedimentary fluid medium continuously exchanges heat with the reservoir, which is also the reason why the water temperature and thermal power output of the double vertical wells are higher than in other heat extraction systems.
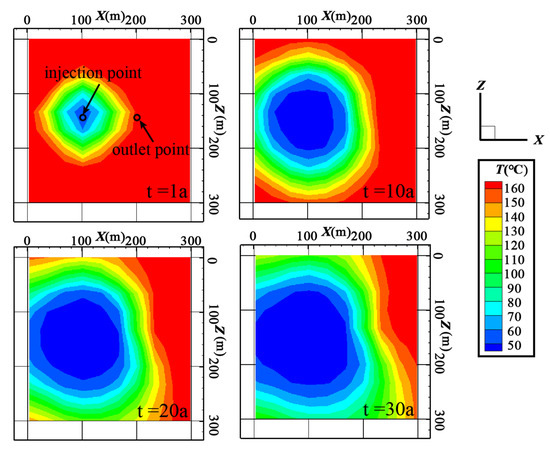
Figure 15.
Temperature distribution for the conventional double vertical wells.
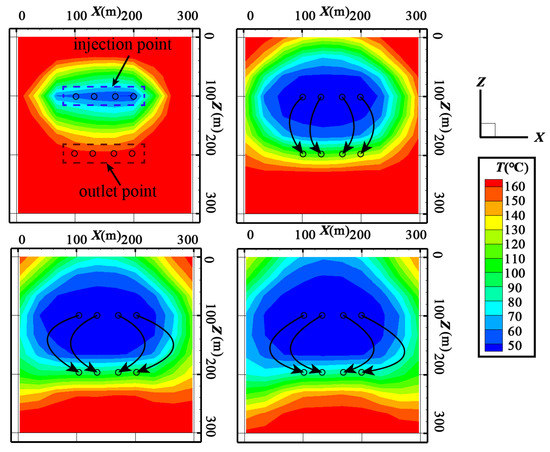
Figure 16.
Temperature distribution for the horizontal wells.
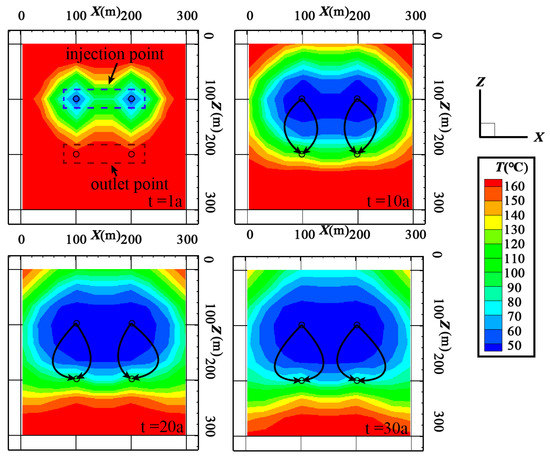
Figure 17.
Temperature distribution for the double-pipe heat exchange system.
In the early stage of geothermal energy exploitation, the temperature field of the horizontal wells model is an irregular ellipsoid with the well as the axis, and the closer to the direction of the x-axis, the larger the area of the low-temperature area. This is because the x direction is the dominant direction of the fluid medium. With the development of geothermal energy exploitation, the low-temperature area gradually extends to the production well, and the boundary of the low-temperature area near the water outlet is linear. This shows that under the condition of the same injection rate, the fluid medium in the horizontal well production system can be discharged from the outlet point in time. In addition, after 30 years, the leading edge of the low-temperature area reaches the top of the outlet point; however, the temperature of the reservoir below the outlet point is still high, so the production well still produces high-temperature fluids. Compared with traditional double vertical wells, the low-temperature area of horizontal wells is larger, which means that it has a greater heat extraction ratio.
The geothermal field characteristics of the double-pipe heat exchange system are similar to those of the horizontal wells, expanding to the outside with the injection well as the center. In contrast, the leading edge of the low-temperature area is wavy; this situation is similar to conventional double vertical wells. Compared with horizontal wells, the expansion area of the low-temperature area of the double-pipe heat exchange system is smaller, which indicates that its heat extraction efficiency is lower than that of horizontal wells. However, in this exploitation model, the temperature reduction of the reservoir is small, which is conducive to the continuous exploitation of geothermal energy.
5.3. Analysis of the Pressure Field Results
The pressure field distribution under different exploitation models is shown in Figure 18, Figure 19 and Figure 20. As shown in Figure 18, in the early stage of geothermal energy exploitation, it can be observed that the pressure around the injection point is the highest, while the pressure around the outlet point is the lowest. This is because the conventional double vertical wells use single-point water injection and single-point pumping. Compared with other heat transfer modes, the seepage path of the fluid medium in the fracture network is longer and the loss of wellhead pressure is larger. In this stage, the low-temperature area did not extend to the vicinity of the outlet point; as the water injection continues, the pores and fractures in the reservoir are filled with a fluid medium, and the reservoir pressure gradually increases with time. After 20 years of exploitation, the injection pressure increases and the production pressure decreases. In this stage, the low-temperature area extends to the vicinity of the outlet point. As the temperature of the reservoir decreases, the viscosity of the fluid medium increases, which leads to the wellhead pressure lost during the flow of the fluid increases, and the pressure difference between the water injection point and the outlet point increases.
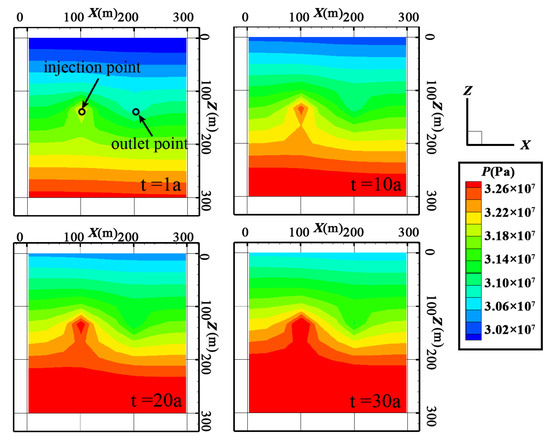
Figure 18.
Pressure distribution for the conventional double vertical wells.
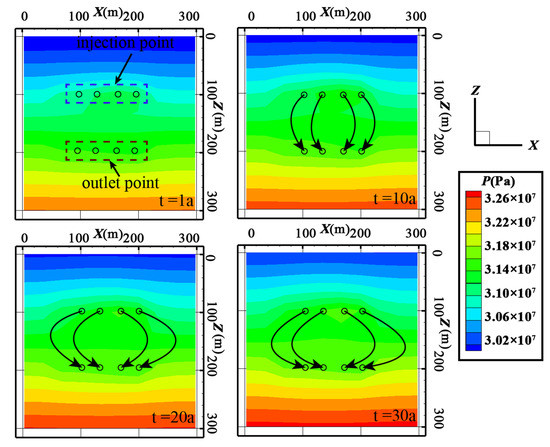
Figure 19.
Pressure distribution for the horizontal wells.
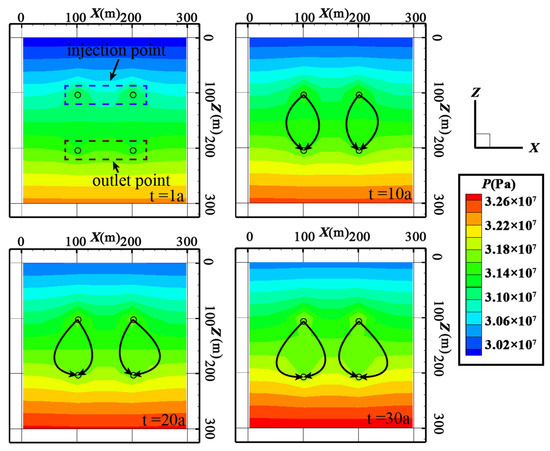
Figure 20.
Pressure distribution for the double-pipe heat exchange system.
As shown in Figure 19, compared with the conventional double vertical wells, after 30 years of horizontal wells exploitation, there is very little change in reservoir pressure. This is because there are many inlet points and outlet points in the horizontal wells; under the condition of the same total injection rate, the injection volume at each water inlet point is relatively small, resulting in a decrease in the water pressure at the inlet point. At the same time, when the water is pumped, the fluid medium can be continuously and efficiently pumped from the output point, with a small wellhead pressure decrease at the water outlet point. Therefore, the overall pressure of the reservoir increases with the increase of exploitation time. However, the dispersed water flow will take away more heat from the geothermal reservoir, which also leads to the expansion of the low-temperature area in the reservoir; during the heat transfer process, the wellhead pressure loss of the fluid medium increases, and there is an appearance of a low-pressure area near the outlet point.
As shown in Figure 20, compared to other thermal exploitation models, the change near the injection point and the outlet point is the most obvious in the double-pipe heat exchange system. This is because the number of injection points and outlet points is intermediate between the other two thermal exploitation modes. In the long-term heat generation process of up to 30 years, injection and production of heat exchange fluid will not lead to a significant or large-range increase in reservoir pressure; meanwhile, it will not cause the reservoir to cool down significantly due to the excessive dispersion of water injection. The internal pressure distribution of the reservoir at 30a is not significantly different from that at 20a. It can be seen that in the late production period, the pressure of the thermal reservoir has risen very slowly, and the reservoir pressure is nearly stable, which will not have a negative impact on the long-term stable operation of the geothermal well. In summary, using the double-pipe heat exchange system for geothermal exploitation has certain advantages.
6. Conclusions
In this paper, using the Matou Camp hot field data as a geological reference, a random fractured media model is established based on TOUGH2-BIOT which analyzes the evolution characteristics of the seepage field during the reservoir stimulation process and evaluates the fracturing effect. According to the results of reservoir stimulation, the wellbore layout position is set, and the heat transfer performance of the conventional double vertical well, horizontal well, and double tube heat exchange system is compared and analyzed. Based on the simulation results, the following conclusions are drawn from this study.
- (1)
- Reservoir reconstruction is mainly divided into three stages: In the first stage, the hydraulic aperture of the conducting fractures reaches the maximum value; in the second stage, the non-conductive fractures overcome the in situ stress and become conducting fractures; in the third stage, the rock in the reservoir undergoes shear failure, fractures expand and connect, and, finally, a fracture network is formed.
- (2)
- After the first stage, the enhancement ranges of kx, ky, and kz are 25, 18, and 23 m, respectively. Compared with the initial water injection point, the permeability at kx, ky, and kz is increased by 17, 18, and 16 times, respectively. After the second stage, the enhancement ranges of kx, ky, and kz are 30, 25, and 29 m, respectively. The permeability at kx, ky, and kz is increased by 256, 121, and 221 times, respectively. After the third stage, the enhancement ranges of kx, ky, and kz are 34, 30, and 33 m, respectively. The permeability at kx, ky, and kz is increased by 818, 312, and 777 times, respectively. After each stage, the volume of the enhanced permeability area is approximately 10,000, 21,000, and 33,000 m3, respectively.
- (3)
- In the process of geothermal energy exploitation, the outlet temperature and thermal power output of the double-pipe heat exchange system are always lower than the horizontal wells. After 5 years of exploitation, the outlet temperature and thermal power output of traditional double vertical wells gradually exceeded that of horizontal wells and double-pipe heat exchange systems. After 30 years, the temperature of a production well in the conventional double vertical wells model, horizontal wells, and double-pipe heat exchange system is 101 °C, 93.4 °C, and 91.6 °C, a decrease of 41.2%, 45.7%, and 46.7%, respectively. The thermal power output is 6.67 MW, 6.31 MW, and 6.1 MW, a decrease of 39.4%, 42.6%, and 44.5%, respectively.
- (4)
- The heat extraction ratio of the double-pipe heat exchange system is always lower than the horizontal wells. In the early stage of geothermal energy exploitation, the heat transfer efficiency of the conventional double vertical wells is higher, but as the exploitation progresses, it is gradually lower than that of the horizontal wells and the double-pipe heat exchange system. After 30 years, the heat extraction ratio of the horizontal wells is 2% higher than the double-pipe heat exchange system and 6.5% higher than the conventional double vertical wells.
- (5)
- The conventional double vertical production mode has only one water outlet, which will lead to untimely water output from the outlet point, while the sedimentary fluid medium continuously exchanges heat with the reservoir, which is also the reason why the water temperature and thermal power output of the double vertical wells are higher than other heat extraction systems. There are many water inlet and outlet points in horizontal wells. When the total water injection volume is the same, the dispersed water flow will transfer more heat from the geothermal reservoir, resulting in the expansion of the low-temperature area in the reservoir, which is also the main reason for the higher heat extraction rate to the horizontal wells than other exploitation modes. Compared with other production methods, although the heat exchange efficiency of the double-pipe heat exchange system is lower, the injected fluid will not generate a partial high-pressure area due to the excessive injection; meanwhile, it will not cause the reservoir to cool down significantly due to the excessive dispersion of water injection.
Author Contributions
Conceptualization, J.Z.; Methodology, B.F.; Investigation, H.R.; Writing—review & editing, Z.C.; Project administration, X.L. All authors have read and agreed to the published version of the manuscript.
Funding
This work was performed with the support of the National Key R&D Program of China (No. 2018YFB1501802), S&T Program of Hebei Provincial (No.20374201D), Chinese Academy of Geological Sciences Fund (No.SK202104), Jilin Provincial Department of Science and Technology (No.20200403147SF), Academician Workstation and Academician Cooperation Key Unit Construction of the Second Geological Team of Hebei Coal Geology Bureau (No.205A4101H), and “Research and application demonstration of single well heat recovery technology and ground comprehensive heat utilization technology for dry hot rock thermal energy” (No.19274102D).
Institutional Review Board Statement
Not applicable.
Informed Consent Statement
Not applicable.
Data Availability Statement
The original contributions presented in the study are included in the article. Further inquiries can be directed to the corresponding author.
Acknowledgments
The authors would like to thank the relevant institutions for financial and technical support.
Conflicts of Interest
The authors declare no conflict of interest.
References
- Moya, D.; Aldás, C.; Kaparaju, P. Geothermal energy: Power plant technology and direct heat applications. Renew. Sustain. Energy Rev. 2018, 94, 889–901. [Google Scholar] [CrossRef]
- Tester, J.W.; Livesay, B.; Anderson, B.J.; Moore, M.C.; Bathchelor, A.S.; Nichols, K.; Blackwell, D.D.; DiPippo, R.; Drake, E.M.; Garnish, J.; et al. The Future of Geothermal Energy: Impact of Enhanced Geothermal Systems (EGS) on the United States in the 21st Century; Massachusetts Institute of Technology: Cambridge, MA, USA, 2006. [Google Scholar]
- Gupta, H.; Roy, S. Geothermal Energy: An Alternative Resource for the 21 st Century; Elsevier: Amsterdam, The Netherlands, 2007. [Google Scholar]
- Tomasini-Montenegro, C.; Santoyo-Castelazo, E.; Gujba, H.; Romero, R.J.; Santoyo, E. Life cycle assessment of geothermal power generation technologies: An updated review. Appl. Therm. Eng. 2017, 114, 1119–1136. [Google Scholar] [CrossRef]
- Zhao, X.G.; Wan, G. Current situation and prospect of China’s geothermal resources. Renew. Sustain. Energy Rev. 2014, 32, 651–661. [Google Scholar] [CrossRef]
- Jiang, F.; Chen, J.; Huang, W.; Luo, L. A three-dimensional transient model for EGS subsurface thermo-hydraulic process. Energy 2014, 72, 300–310. [Google Scholar] [CrossRef]
- Ogino, F.; Yamamura, M.; Fukuda, T. Heat transfer from hot dry rock to water flowing through a circular fracture. Geothermics 1999, 28, 21–44. [Google Scholar] [CrossRef]
- Wan, Z.; Zhao, Y.; Dong, F.; Feng, Z.J.; Zhang, N.; Wu, J.W. Experimental study on mechanical characteristics of granite under high temperatures and triaxial stresses. J. Rock Mech. Eng. 2008, 27, 72–77. [Google Scholar]
- Klyuev, R.V.; Golik, V.I.; Bosikov, I.I. Comprehensive assessment of hydrogeological conditions for the formation of mineral water resources of the Nizhne-Karmadon deposit. Geo. Asset. Eng. 2021, 332, 206–218. [Google Scholar] [CrossRef]
- Brown, D.W.; Duchane, D.V. Scientific progress on the Fenton Hill HDR project since 1983. Geothermics 1999, 28, 591–601. [Google Scholar] [CrossRef]
- Niibori, H.Y. Numerical models of HDR geothermal reservoirs—A review of current thinking and progress. Geothermics 1999, 28, 507–518. [Google Scholar]
- Rutqvist, J.; Börgesson, L.; Chijimatsu, M.; Kobayashi, A.; Jing, L.; Nguyen, T.S.; Noorishad, J.; Tsang, C.-F. Thermohydromechanics of partially saturated geological media: Governing equations and formulation of four finite element models. Int. J. Rock Mech. Min. Sci. 2001, 38, 105–127. [Google Scholar] [CrossRef]
- Lei, H.W. Characteristics and Mechanism Analysis of Land Subsidence in XX City and Numerical Simulation Research. Ph.D. Thesis, China University of Geosciences, Wuhan, China, 2010. [Google Scholar]
- Lu, J.; Ghassemi, A. Coupled Thermo–Hydro–Mechanical–Seismic Modeling of EGS Collab Experiment 1. Energies 2021, 14, 446. [Google Scholar] [CrossRef]
- Mahmoodpour, S.; Singh, M.; Obaje, C.; Tangirala, S.K.; Reinecker, J.; Bär, K.; Sass, I. Hydrothermal Numerical Simulation of Injection Operations at United Downs, Cornwall, UK. Geoscience 2022, 12, 296. [Google Scholar] [CrossRef]
- Saeed, M.; Mrityunjay, S.; Ramin, M.; Sri, K.T.; Kristian, B.; Ingo, S. Direct numerical simulation of thermo-hydro-mechanical processes at Soultz-sous-Forêts. arXiv 2022, arXiv:2206.01830. [Google Scholar]
- Saeed, M.; Mrityunjay, S.; Ramin, M.; Sri, K.T.; Kristian, B.; Ingo, S. Impact of Well Placement in the Fractured Geothermal Reservoirs Based on Available Discrete Fractured System. Geosciences 2022, 12, 19. [Google Scholar]
- Gao, K.; Liu, W.; Ma, T.; Hu, Y.; Fang, T.; Ye, L. Numerical Simulation Study of a Novel Horizontally Layered Enhanced Geothermal System: A Case Study of the Qiabuqia Geothermal Area, Qinghai Province, China. J. Therm. Sci. 2021, 30, 1328–1340. [Google Scholar] [CrossRef]
- Cui, G.; Pei, S.; Rui, Z.; Dou, B.; Ning, F.; Wang, J. Whole process analysis of geothermal exploitation and power generation from a depleted high-temperature gas reservoir by recycling CO2. Energy 2021, 217, 119340. [Google Scholar] [CrossRef]
- Song, X.; Shi, Y.; Li, G.; Yang, R.; Wang, G.; Zheng, R.; Li, J.; Lyu, Z. Numerical simulation of heat extraction performance in enhanced geothermal system with multilateral wells. Appl. Energy 2018, 218, 325–337. [Google Scholar] [CrossRef]
- Mrityunjay, S.; Saeed, M.; Reza, E.; Mohamad, R.S.; Ingo, S. Numerical simulation of a comparative study on heat extraction from Soultz-sous-Forêts geothermal field using supercritical carbon dioxide and water as a working fluid. arXiv 2022, arXiv:2207.07514. [Google Scholar]
- Mahmoodpour, S.; Singh, M.; Turan, A.; Bär, K.; Sass, I. Hydro-Thermal Modeling for Geothermal Energy Extraction from Soultz-Sous-forêts, France. Geosciences 2021, 11, 464. [Google Scholar] [CrossRef]
- Cui, L.X.; Wang, L. A Study on Determination of Soil Moisture Content Based on Remote Sensing Images. J. Tangshan Univ. 2017, 30, 21–24. [Google Scholar]
- Qi, X.F.; ShangGuan, S.T.; Zhang, G.B. Site selection and developmental prospect of a hot dry rock resource project in the Matouying Uplift, Hebei Province. Earth Sci. Front. 2020, 27, 9. [Google Scholar]
- Lei, H.; Xu, T. TOUGH2-BIOT: A coupled thermal-hydrodynamic-mechanical model for geothermal development. Trans.-Geotherm. Resour. Counc. 2014, 38, 305–312. [Google Scholar]
- Lei, H.; Xu, T.; Jin, G. TOUGH2-BIOT–A simulator for coupled thermal–hydrodynamic–mechanical processes in subsurface flow systems: Application to CO2 geological storage and geothermal development. Comput. Geosci. 2015, 77, 8–19. [Google Scholar] [CrossRef]
- Pruess, K.; Oldenburg, C.M.; Moridis, G.J. TOUGH2 User’s Guide Version 2; Office of Scientific & Technical Information Technical Reports; Office of Scientific & Technical Information: Oak Ridge, TN, USA, 1999. [Google Scholar]
- Yuan, Y.; Xu, T.; Moore, J.; Lei, H.; Feng, B. Coupled Thermo–Hydro–Mechanical Modeling of Hydro-Shearing Stimulation in an Enhanced Geothermal System in the Raft River Geothermal Field, USA. Rock Mech. Rock Eng. 2020, 53. [Google Scholar] [CrossRef]
- Zhou, Z.F. Theory on Dynamics of Fuids in Fractured Medium; Higher Education Press: Beijing, China, 2007. [Google Scholar]
- Xie, L.; Min, K.B. Initiation and propagation of fracture shearing during hydraulic stimulation in enhanced geothermal system. Geothermics 2016, 59, 107–120. [Google Scholar] [CrossRef]
- Mcclure, M.W.; Horne, R.N. Investigation of injection-induced seismicity using a coupled fluid flow and rate/state friction model. Geophysics 2012, 76, 34–35. [Google Scholar] [CrossRef]
- Dempsey, D.; Kelkar, S.; Lewis, K.; Hickman, S.; Davatzes, N.; Moos, D.; Zemach, E. Modeling Shear Stimulation of the Desert Peak EGS Well 27-15 Using a Coupled Thermal-Hydrological-Mechanical Simulator. In Proceedings of the 47th US Rock Mechanics/Geomechanics Symposium, San Francisco, CA, USA, 23–26 June 2013. [Google Scholar]
- McGarr, A. On relating apparent stress to the stress causing earthquake fault slip. J. Geophys. Res. Solid Earth 1999, 104, 3003–3011. [Google Scholar] [CrossRef]
- Lee, H.S.; Cho, T.F. Hydraulic Characteristics of Rough Fractures in Linear Flow under Normal and Shear Load. Rock Mech. Rock Eng. 2002, 35, 299–318. [Google Scholar] [CrossRef]
Disclaimer/Publisher’s Note: The statements, opinions and data contained in all publications are solely those of the individual author(s) and contributor(s) and not of MDPI and/or the editor(s). MDPI and/or the editor(s) disclaim responsibility for any injury to people or property resulting from any ideas, methods, instructions or products referred to in the content. |
© 2022 by the authors. Licensee MDPI, Basel, Switzerland. This article is an open access article distributed under the terms and conditions of the Creative Commons Attribution (CC BY) license (https://creativecommons.org/licenses/by/4.0/).