Article

Preliminary Studies of Slag and Ash from Incinerated Municipal Waste for Prospective Applications

Strata Mechanics Research Institute of the Polish Academy of Sciences, Reymonta 27, 30-059 Kraków, Poland
*
Author to whom correspondence should be addressed.
Energies 2023, 16(1), 117; https://doi.org/10.3390/en16010117
Submission received: 23 November 2022 / Revised: 10 December 2022 / Accepted: 15 December 2022 / Published: 22 December 2022

Abstract

:
The assessment of the possibility of using incinerated municipal waste, which is classified as non-hazardous, is a priority of the European zero waste strategy. The aim of this work was to identify the properties of slag and ash to develop a simple, targeted way of using post-process waste. The material was analyzed by microscopic methods in terms of composition and internal structure. Gas and water permeability tests were carried out. Slag and ash texture was obtained using densimetric methods. BCR sequential extraction was carried out to assess the impacts of the waste on the water and soil environment. It was shown that individual fractions were characterized by different compositions and pore contents. The increase in the waste layer density resulted in porosity reduction of the slag and post-process ash, which had a significant impact on permeability. The increase in density index from 0.92 to 0.98 resulted in reduction of the filtration coefficient by two orders of magnitude. The obtained results showed that the division into fractions is important for prospective applications of incinerated municipal waste. With very low permeability and negligible leachability of heavy metals, the characteristics of slag and ash predispose them to support the needs of specialized hydrotechnical construction.

1. Introduction

Waste management is one of the key sectors of the modern world and an important element of the quality of life of societies. Highly developed countries with a high level of consumption bend under the weight of waste generated by the average citizen. Along with the growing social awareness and the increase in the degree of municipal waste segregation, other methods of disposal of such waste are sought, e.g., by using them for the production of concrete [1,2], and also as composites [3] or geopolymers [4,5]. Presently, huge amounts of municipal waste end up in landfills, and only some of this waste is selectively separated or composted. Such activities are related to the appropriate protection of the waste, its compression, and finally storage. In Poland, as much as about 75% of municipal waste (according to the data of the Central Statistical Office (GUS)), is still transferred to landfills. Therefore, the optimal solution to effectively reduce the amount of produced municipal waste is to subject it to the process of thermal conversion in waste incineration plants. This process includes several phases such as drying, degassing, combustion, gasification, and post-combustion. Each phase of the process is characterized by a different temperature, from 100 °C to even 1000 °C (according to [6]). In the process of municipal waste incineration, slag and bottom ash are produced, as well as boiler dust, fly ash, and solid flue gas cleaning residues [7,8]. As a result, the residue from the thermal conversion process accounts for about 25% of the mass of the input material in the form of municipal waste.
Already in the second half of the 19th century in England, the creators of the first incineration plant in the world noticed the advantages of the incineration method for reducing municipal waste amounts [9]. Today, modern and efficient waste incineration plants are being created. There are currently about 500 plants in Europe, of which eight are operating in Poland. More incinerators are being built, others have been planned for construction, and for some of the currently operating plants, expansion is planned. Incinerated municipal waste consists mainly of slag and bottom ash. They occur in the form of a dark ash-black, porous, and semi-flowing solid. They consist of non-flammable substances, water-insoluble silicates, and aluminum and iron oxides [9]. In addition, waste may be characterized by heterogeneity, seasonality of properties, and variability of compositions.
Slag and ash, as secondary products, may pose potential threats to the environment. Due to the applicable standards, this waste has limited reuse possibilities. In European countries, the residue from municipal waste incineration is used as a primer in the construction of roads, e.g., in Denmark, Germany, and Sweden. In Belgium, France, Great Britain, and Italy, slag and ash are used for construction purposes. Still, in countries such as Austria, Finland, the Czech Republic, Portugal, and Spain, solid waste from incineration processes is only stored in landfills [9,10]. Various activities are carried out in Poland to neutralize the municipal incinerated waste. Current regulations in Poland place great emphasis on a circular economy for which it becomes necessary to reduce the amount of waste and properly plan their development [11]. Slags and bottom ashes are stabilized with the addition of cement and polymers and then stored as waste in the so-called solidification process. According to some authors, such a procedure is improper because post-process residues have a much wider potential for use [9]. The method of ash and slag management is strictly dependent on the leaching of heavy metals from the waste into the environment, which enables the assessment of possible threats to the environment. According to Polish legal regulations, the degree of heavy metals leaching can differentiate waste as hazardous or non-hazardous. Currently, in accordance with the Regulation of the Minister of the Environment of 11 May 2015, slag and bottom ash may only be used for the foundations of roads and motorways. The regulation specifies the leachability parameter based on the PN-EN 12457-4:2006 standard [12], but it is not very sensitive. According to the studies of Wielgosiński [13], the PN-EN 12457-4:2006 standard should not be used because it does not show the actual content of heavy metals released into the environment. The same author recommends the method of sequential extraction according to the Tessier procedure [14] to study the leaching of heavy metals from slag and ash. In his work, the known methods of sequential extraction, among others the Tessier [15], the van Herck [16], and the BCR [17] methods as well as the Swiss standard TVA.SA.1991, were reviewed. It was indicated that correct analysis of the properties of secondary waste is decisive for further waste management.
Ash and slag particles occur in various shapes and sizes [18]. They are porous and have a small size and high pore density. These particles exhibit capillarity, which increases with decreases in pore size [19]. The surface of the slag and ash particles is generally hydrophobic; however, it is believed that water is either not absorbed into the particles or penetrates for a very long time. Currently, many issues remain unknown regarding the formation of waterways in bottom ash dumps [18]. The phenomenon of water absorption by slag and ash particles in terms of possible leachates and the stability of stored waste requires explanation. Research on the porosity and texture of waste from incineration plants, as well as the assessment of permeability to liquids and gas, will allow knowledge to expand in this area. It is worth supplementing the proposed research with microscopic analyses, which is recommended by several studies [20,21,22].
The article presents laboratory tests for the detailed evaluation of the materials obtained from one of the Polish municipal waste incineration plant. The research concerned technical, petrographic, and chemical analyses; gas permeability tests; and water filtration measurements. Recognition of the above physical features together with elements of the assessment of the impact of waste on the environment made it possible to identify the potential possibilities of using slag and post-process ash. The availability of these types of results on currently produced post-process waste material is limited. This research is an introduction to the problem of huge amounts of waste lying in landfills and the search for prospective ways to use them as part of the circular economy.

2. Materials and Methods
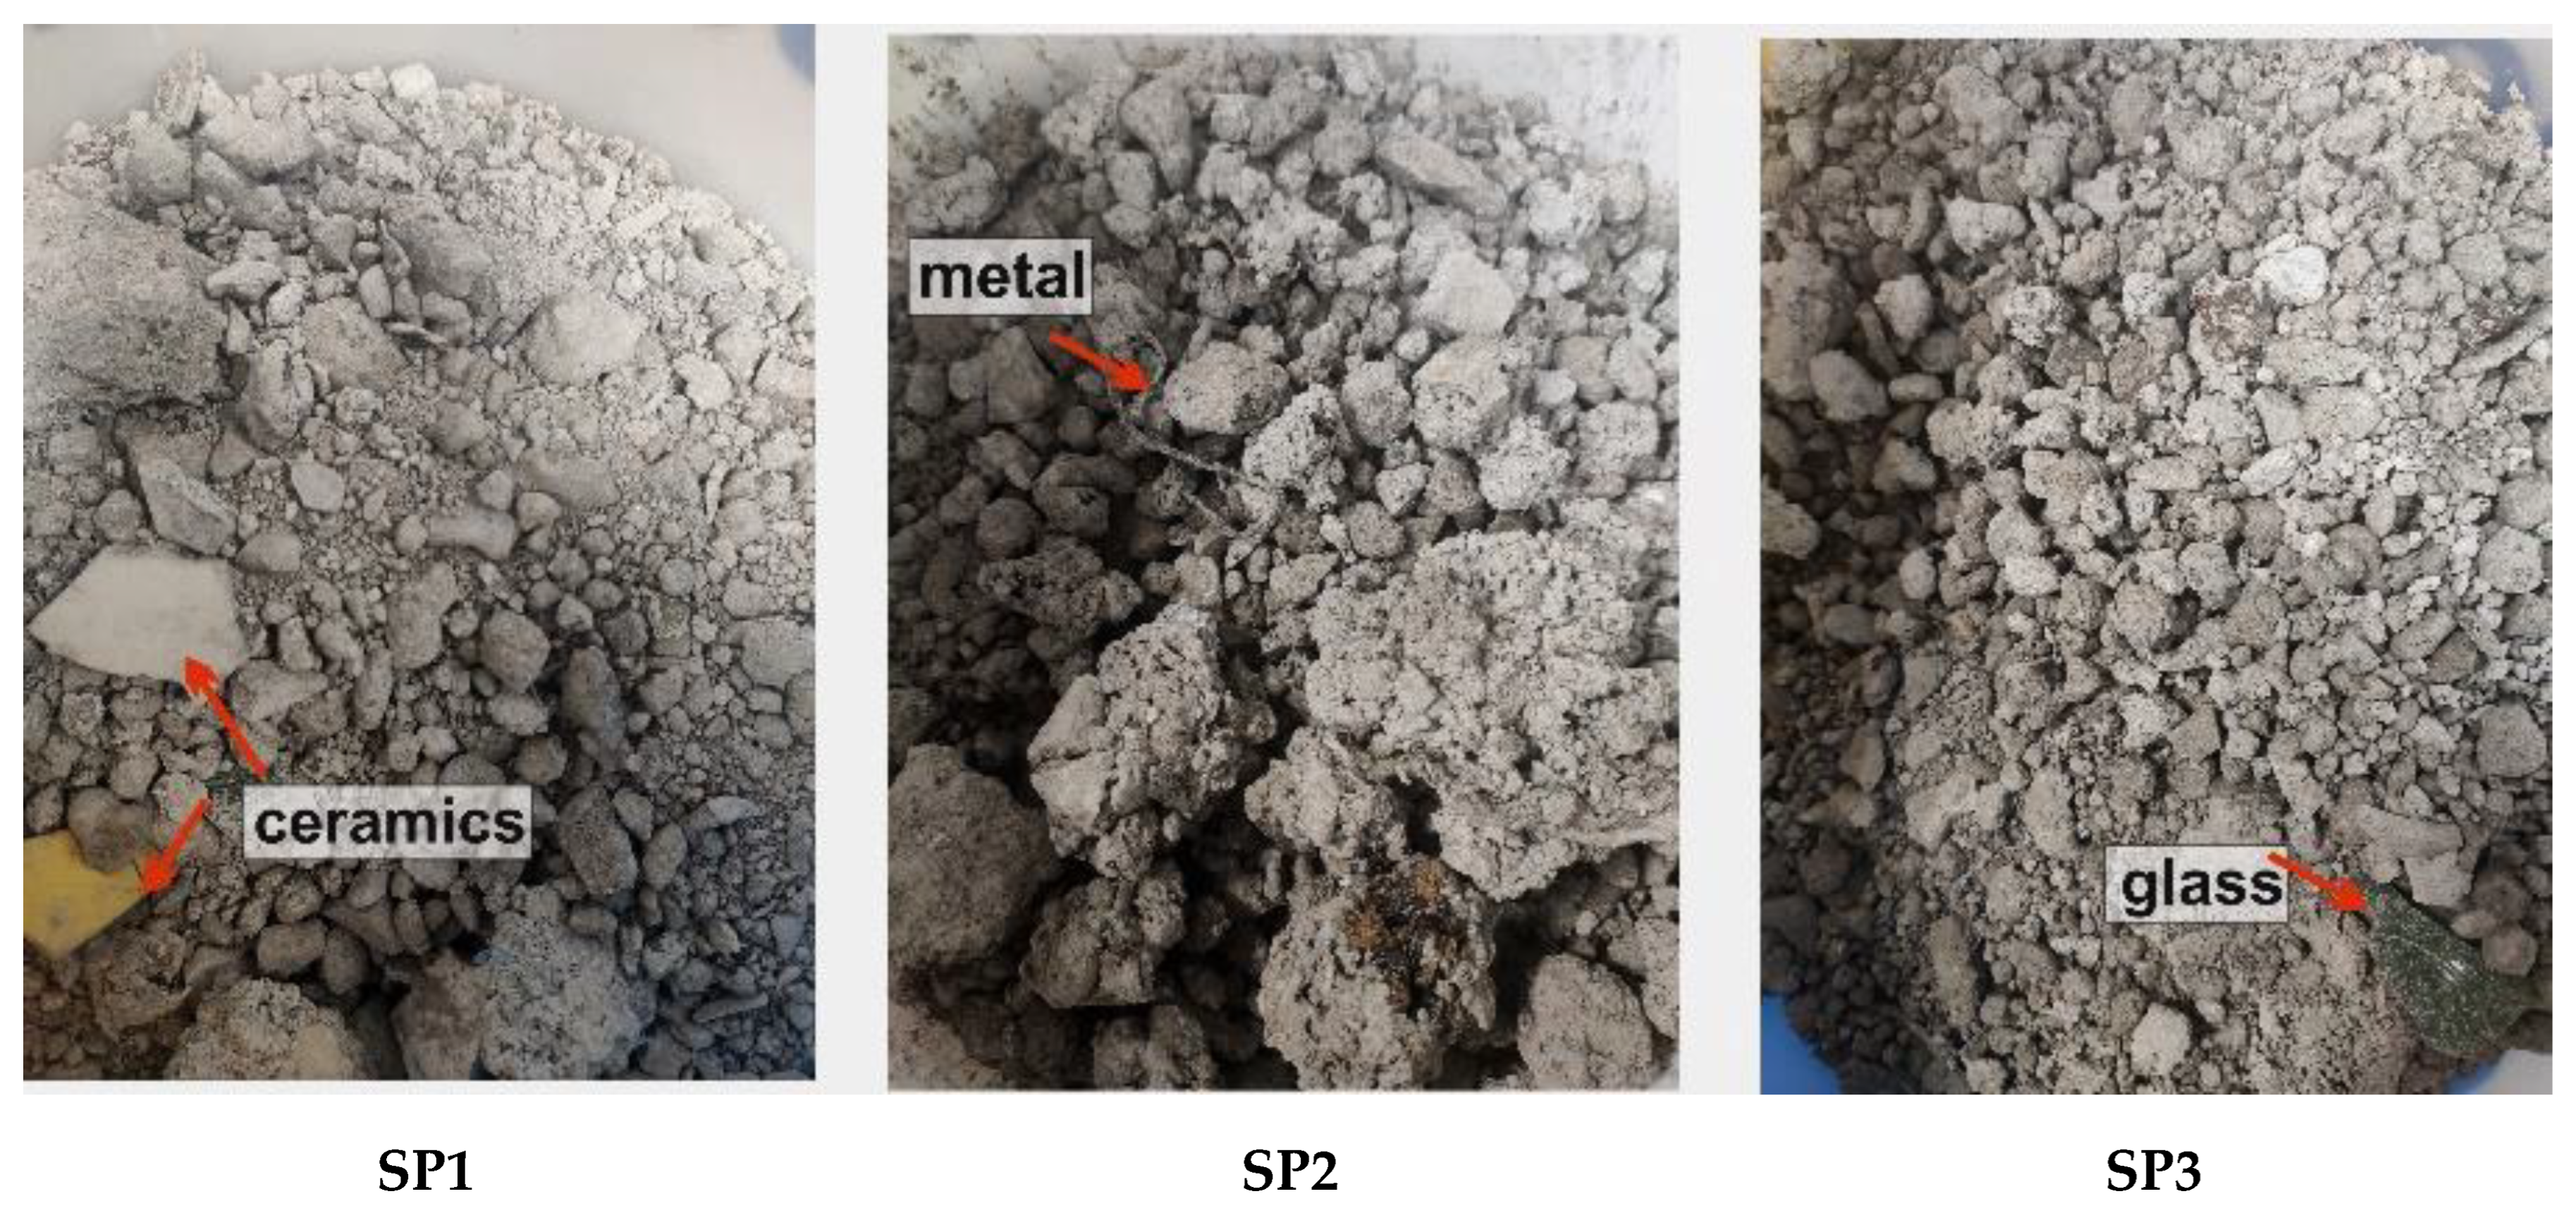
2.1. Waste Material

Material from a municipal waste incineration plant was collected to carry out the planned research. Slag and bottom ash, which according to [12] are classified as non-hazardous waste, were analyzed. These are the dominant types of waste produced by incineration plants, and for this reason, other possibilities for its use are sought. Three groups of slag and ash were collected at different time intervals for research purposes. The oldest material (SP1) was seasoned for over 9 months, the next (SP2) for about 4 months, and the latest (SP3), at the time it was obtained, for 1 month. Prior to sampling, the material was each time subjected to the process of initial crushing and recovery of ferrous and non-ferrous metals (the so-called valorization process). Macroscopically, the SP1, SP2, and SP3 material showed no significant differences. They were gray loose conglomerates of various grain sizes, in which fragments of ceramics, metals, and glass were sometimes visible (Figure 1). The average natural humidity of the delivered slag sample was 10.95%.

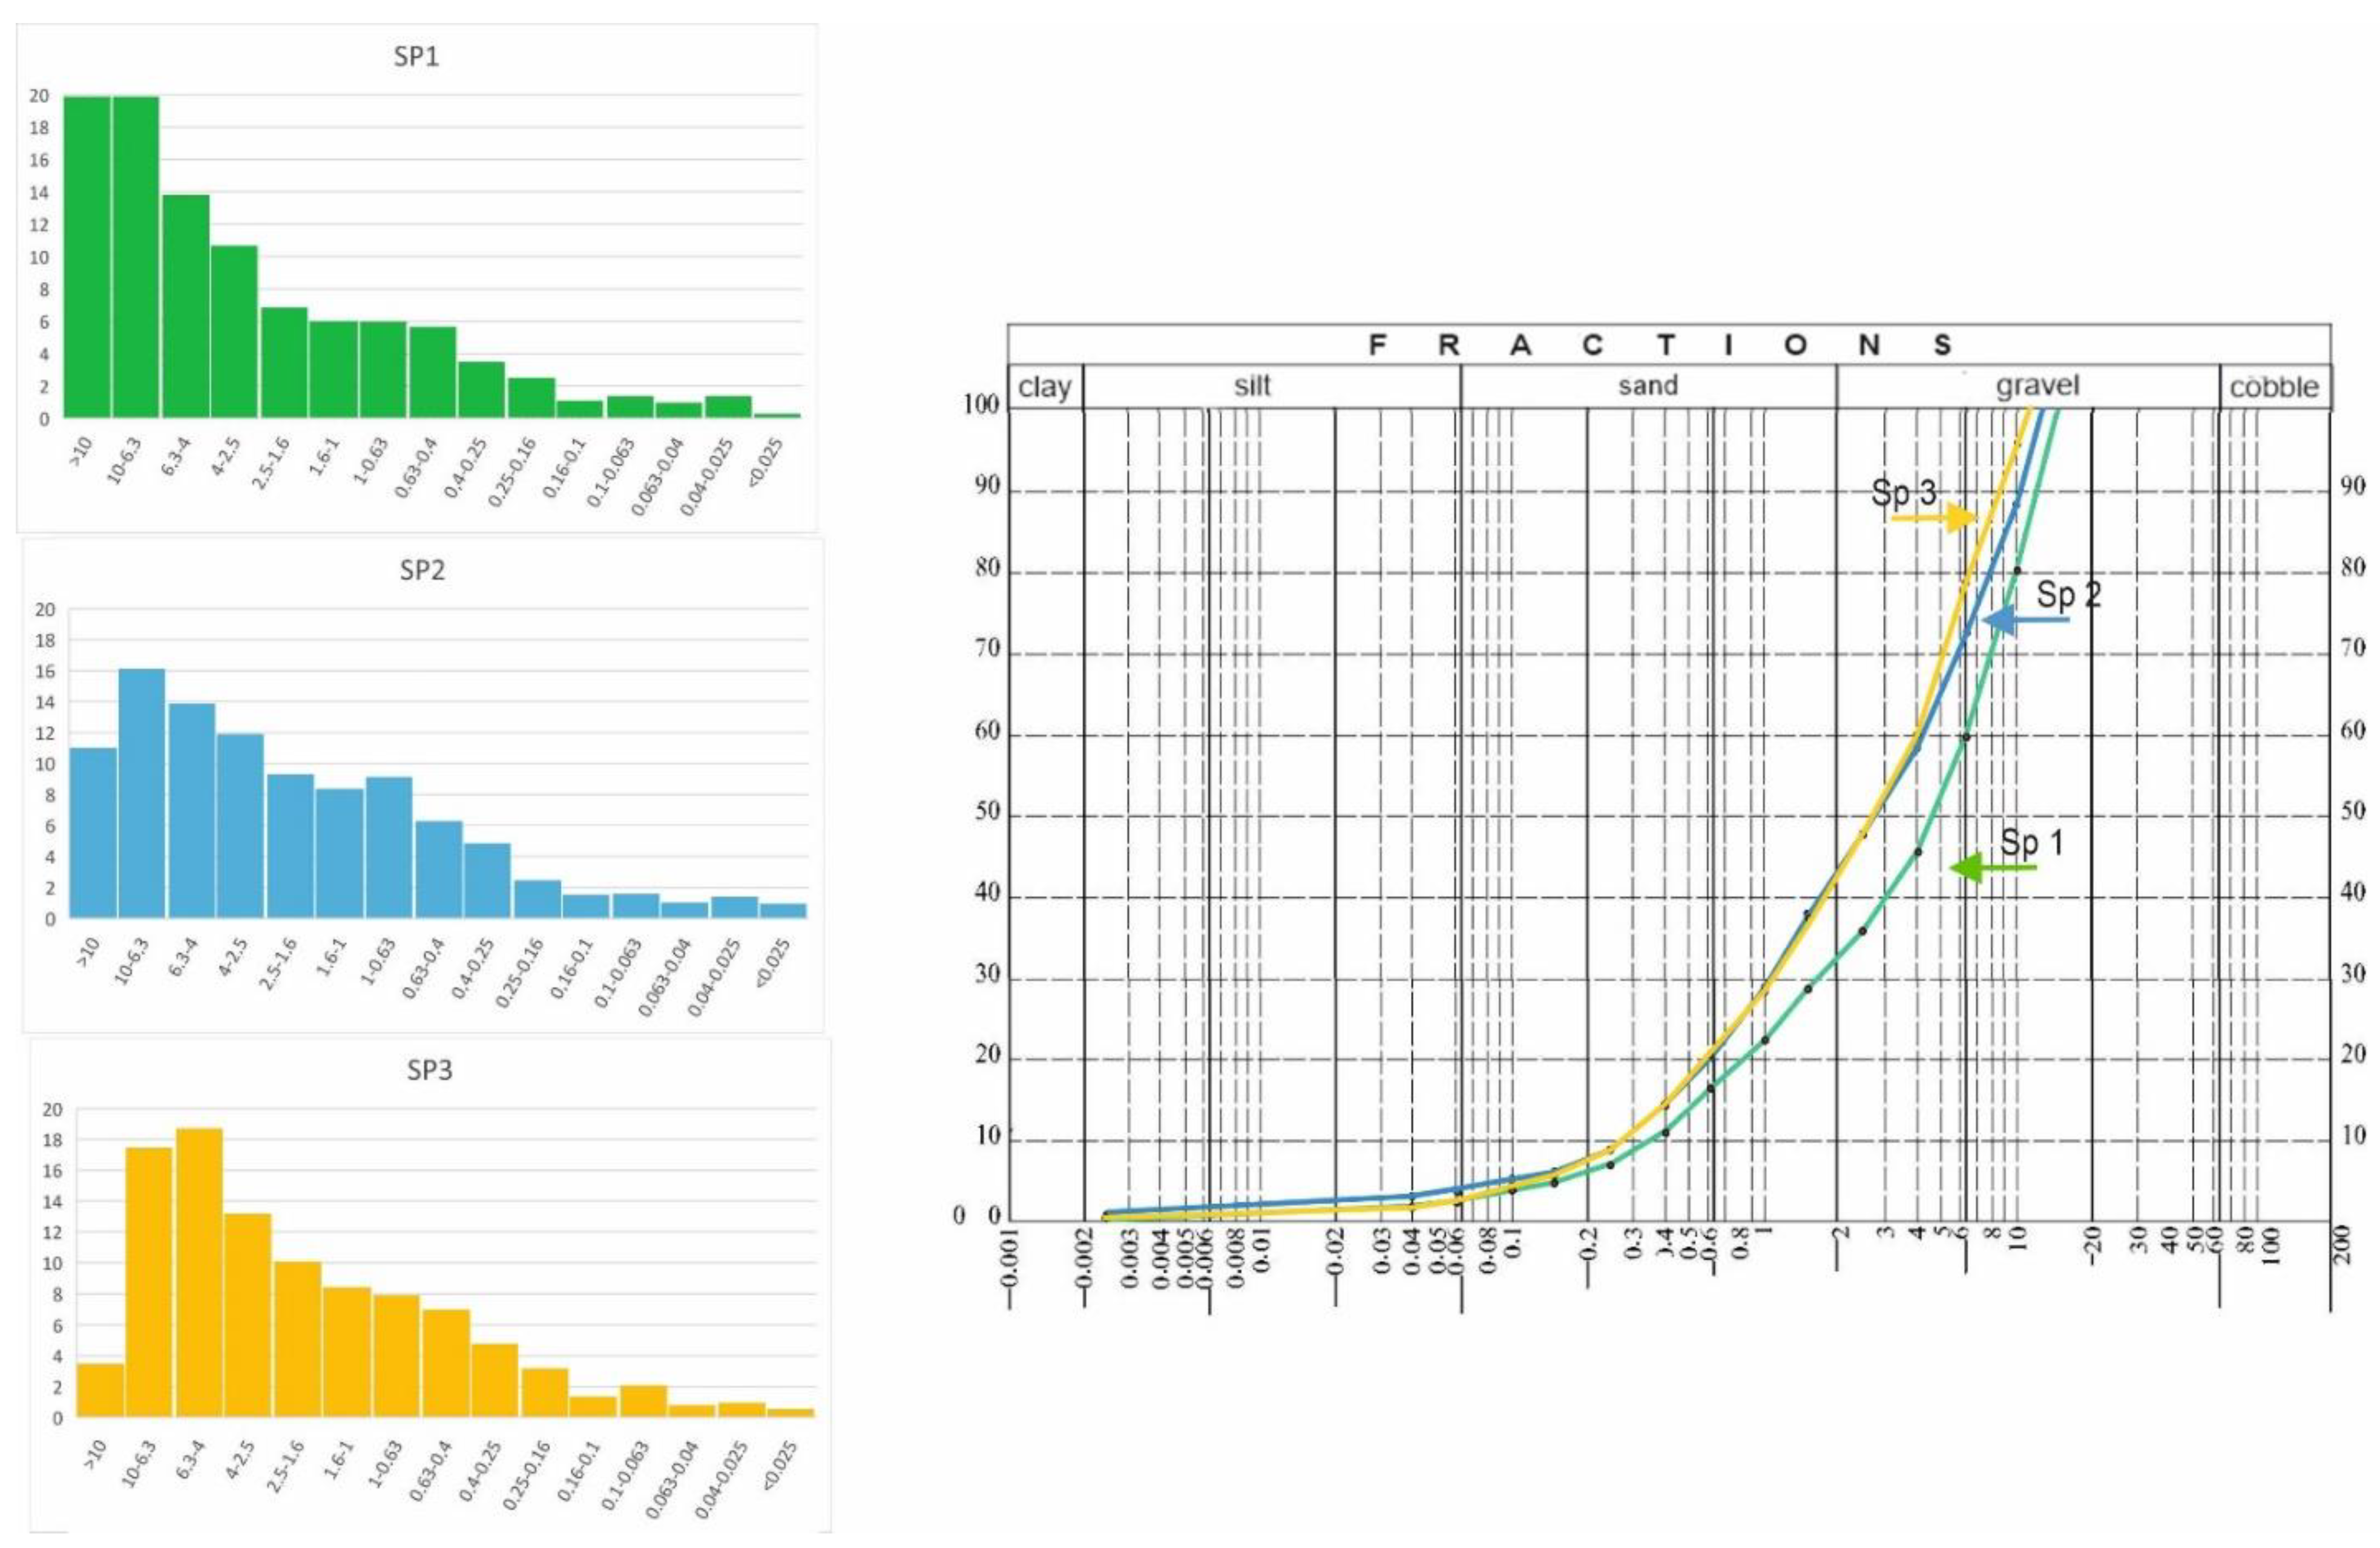
2.2. Granulometric Analysis

The obtained material was subjected to sieve analysis, on the basis of which histograms and particle size distribution curves were prepared. The material was separated into 15 fractions, sequentially >10; 10–6.3; 6.3–4.0; 4.0–2.5; 2.5–1.6; 1.6–1.0; 1.0–0.63; 0.63–0.4; 0.4–0.25; 0.25–0.16; 0.16–0.1; 0.1–0.063; 0.063–0.04; 0.04–0.025 and <0.025 mm, and weighed.

2.3. Microscopic Analysis

Microscopic preparations (thin cuts and microsections) were prepared from SP1 and SP3 waste. For SP2 preparations, seven grain fractions were used (0.16–0.25; 0.25–0.4; 0.4–0.63, 0.63–1.0, 1.0–1.6, 1.6–2.5, 2.5–4.0 mm). Qualitative and quantitative microscopic analyzes were carried out in transmitted and reflected light.
In order to characterize individual groups of slag, a description of characteristic features, microscopically identifiable, was made. An AXIOPLAN polarizing microscope by ZEISS and an XYZ computer-controlled mechanical stage were used for the analyses [23]. The image from the optical microscope was transmitted by a CCD camera to the monitor. Magnifications of 50, 100, and 200× were used. The tests were carried out in transmitted light (thin sections) and reflected light (polished sections and an auxiliary, also thin sections).
Microscopic analyses of the material originating from the thermal waste conversion began with the performance of qualitative analyses. The structures and forms of mineral and non-mineral phases were characterized. Thin cuts from three groups of slag were analyzed—SP1, SP2, and SP3). Then, point quantitative analyses were carried out to estimate the porosity of the waste. Porosity analyses were performed on microsections in the form of ground and polished rock fragments, observed in reflected light (total porosity). The polished, smooth surface of the rock showed the ability to reflect light, which was visible in the form of clearly visible fragments of various substances. Pore areas were not polished, so there was little reflection of light, which meant that dark gray or almost black areas appeared in the voids.
Quantitative analysis was carried out on microsections based on the Cavalieri–Hacquet principle according to which “the percentage content of a given phase in the volume of the alloy (here slag) on the grinding plane and the length of the straight line is the same”. Before starting the analyses using the point method (grid method using an integration table where the points are systematically distributed over the analyzed surface), the necessary number of measurement points was estimated.
The assumption of the method used was that the relative error of the analysis should not exceed γ = 0.1 with probability 1 − α = 0.8 (for α = 0.2). The coefficient uα = 1.281 determined by the Gaussian integral was read from the normal distribution tables. The least numerous fractions (Vv) were initially estimated at about 6%. Based on the above assumptions, the required number of measurement points for each sample (thin cut and microsection) was calculated according to the formula:
z = u α 2 ( 1 V V ) γ 2 V V = 1 . 281 2 ( 1 0.06 ) 0.1 2 0.06   2500
where:
  • z —number of measurement points;
  • u α —coefficient read from normal distribution tables;
  • γ —permissible relative error;
  • V V —the least numerous component of the analyzed phase (here: pore content).
On this basis, it was concluded that with the adopted assumptions, in order for the relative error of γ = 0.1 not to be exceeded with a probability of 1 − α = 0.8, we needed to adopt about 2500 measurement points in a square grid for the analyses. The absolute error of each measurement was determined from the formula:
δ = u α V V ( 1 V V ) z × 100 %
where δ —absolute measurement error (%).
Additionally, observations were carried out using a stereoscopic microscope (Nikon SMZ 1500). The observed magnifications ranged from about 10 to 100×.

2.4. BCR Sequential Extraction

A sequential four-stage BCR chemical extraction of the SP2 sample was performed for selected heavy metals, namely, Fe, Mn, Cd, Co, Cu, Cr, Ni, Pb, and Hg. The BCR method was developed by the European Community Bureau of References [24,25]. Sequential extraction allows one to determine the susceptibility to metal release of samples associated with the solid phase into the environment and their behavior in the water–soil environment as well as their handling. Sequential extraction consists of treating samples of slag and ash with aqueous solutions of increasing aggressiveness. The extraction solution isolates only one form of the element in the sample. In the sequential extraction process, exchangeable (F1), reducible (F2), oxidizable (F3), and residual (F4) fractions can be separated. The studies were preceded by the determination of the fraction (F0) as the content of the most labile metals bound very weakly in the structure of the solid phase, e.g., in pore solutions or water-soluble compounds using the leaching test according to [12]. The metals contained in F0–F2 fractions could be treated as mobile and with small changes in pH could be released into the water and soil environments. The metals in the F3 fraction belonged to the mobilizable fraction, which are very difficult to release into the environment, while the metals in the F4 fraction were bound in the structure of minerals.
The BCR analysis was performed for slag and ash SP2 samples, including one with natural grain sizes and three separated grain fractions (<0.025, 0.063–0.10, and 0.25–0.40 mm). The content of metals in the extraction solutions was analyzed by mass spectrometry with excitation in inductively coupled plasma ICP-OES (Optima 2000 DV Perkin Elmer spectrometer).

2.5. Densimetric Studies

Porosity, similarly to the fissure, is a property that allows for the presence and movement of liquids, water and gases in the tested material. The volume of voids determines the amount of water that can be stored in a given material, while the size and shape of voids determine the permeability of the rock. The pores contained in the waste sample can be divided into open, i.e., connected to the surface of the sample, and closed pores, which are fully surrounded by the solid phase of the sample. Accordingly, we distinguished effective open porosity ( ε O ), which allows fluid to flow through the porous material; closed porosity ( ε Z ), i.e., isolated; and total porosity ( ε ), which is the sum of open and isolated porosity.
The pore space of the delivered waste was assessed on the basis of the real and apparent density measurements using helium AccuPyc 1340 and quasi-liquid GeoPyc 1360 pycnometers (Micromeritics), respectively. It was possible to compare the textural features of individual 1 SP, 2 SP, and 3 SP waste, as well as six grain fractions separated from the SP2 sample, i.e., 6.3–10, 4.0–6.3, 2.5–4.0, 1.0–1.6, 0.63–1.0, and 0.25–0.4 mm. Samples dried at 105 °C were used. Pycnometric measurements were carried out at constant temperatures. The percentage content of the total porosity ε and the total pore volume V p were determined on the basis of the following formulas [26]:
ε = 100 ( 1 ρ p ρ r )
V p = 1 ρ p 1 ρ r  
where ρ r —real density; ρ p —apparent density.
The closed pore content ε Z was determined by microscopy while the open porosity ε O was determined as ε ε Z . The porosity was expressed as the ratio of the pore volume in the sample to the total volume of the sample.

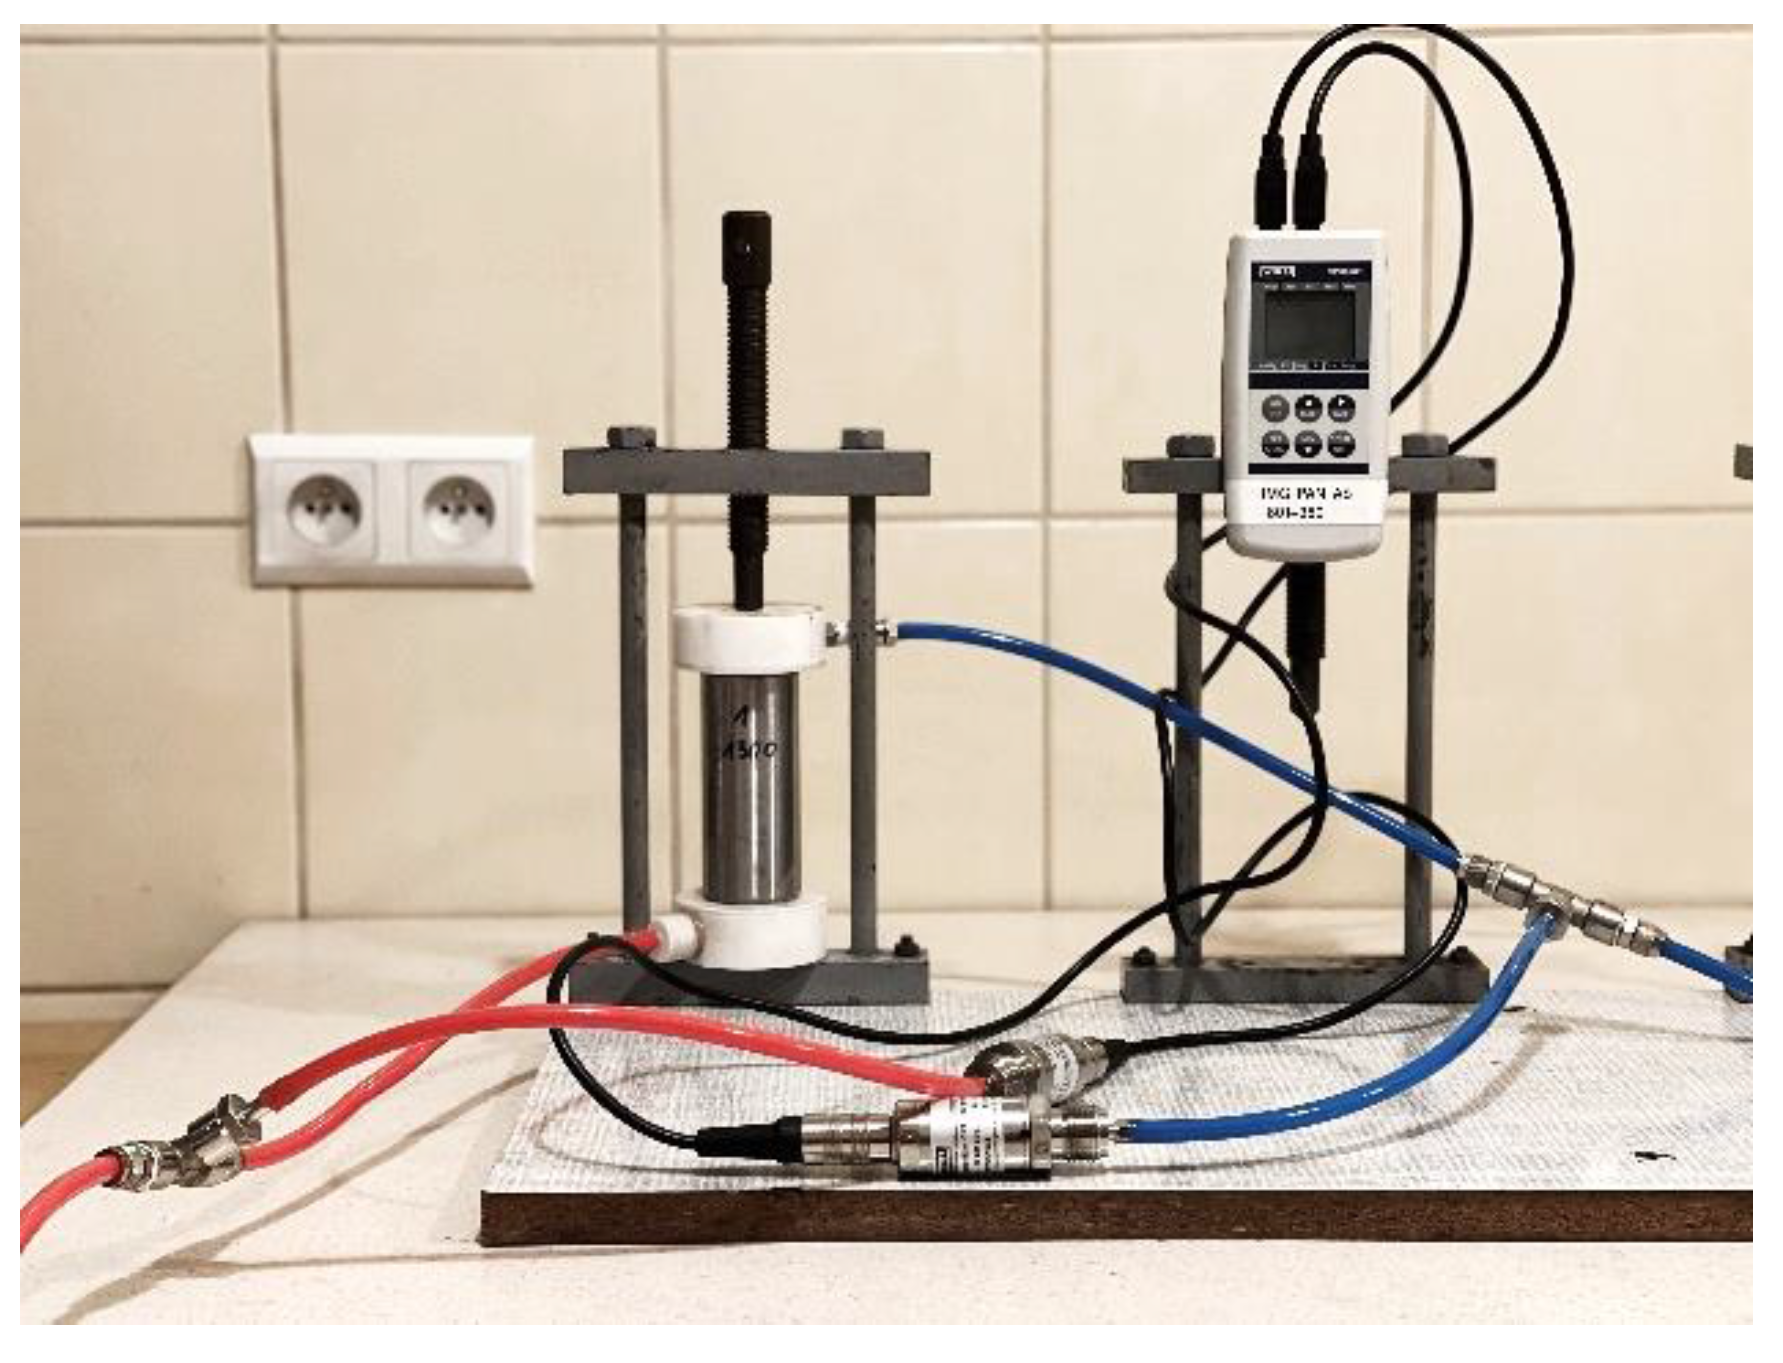
2.6. Gas Permeability Tests

Gas permeability is an important parameter for evaluating the transport properties of solid material. The permeability is directly affected by stress [27] induced by the force consolidating the layer. In order to determine the gas permeability of slag and ash, nitrogen filtration tests were carried out at room temperature. Samples were prepared from approximately 88 g of dry, averaged SP2 material. They were formed in a steel cylinder by pressing with a different force. Subsequent consolidation forces were 500, 1000, 1300, 2600 and 4000 [kg] which corresponded to stresses of 6.7, 13.5, 17.5, 35, and 53 [MPa], respectively. The maximum grain size was selected to be about 25% of the cylinder inner diameter. SP2 samples of ca. ϕ 3.1 cm × h = 13 cm dimensions, subjected to different consolidation forces, simulated the effect of stress on the gas permeability of the studied waste layers. Stress state can be correlated with depth [28]. Permeability tests were carried out in setup designed and built for the purpose of examining the post-process slag and ash (Figure 2) with the possibility of recording the data. The measurement system consisted of a sample enclosed in a steel column through which nitrogen was flowed, the nitrogen supply cylinder, a differential pressure gauge and a simple flow meter system.
Gas permeability was determined on the basis on a constant pressure test. Nitrogen pressure P1 supplied to the sample at the inlet and nitrogen pressure P0 received at the sample’s outlet were measured. Darcy’s law for compressible fluids was used to determine the nitrogen permeability k of the waste sample:
k = 2 P 0 · Q μ L A ( P 1 2 P 0 2 ) [ m 2 ]
where:
  • P1—pressure at the inlet of the sample, Pa;
  • P0—pressure at the outlet of the sample, Pa;
  • Q—gas flow rate, m3/s;
  • μ —gas viscosity coefficient, Pa·s;
  • L—sample length, m;
  • A—ample cross-sectional area, m2.
Reduction of the nitrogen pressure P1 at the inlet to the sample caused changes in the outlet pressure P0 and a corresponding change in the flow rate Q. Permeability coefficient k was determined at a constant flow rate value. The gas flow rate through the consolidated waste layer was measured using the inverted flask method.

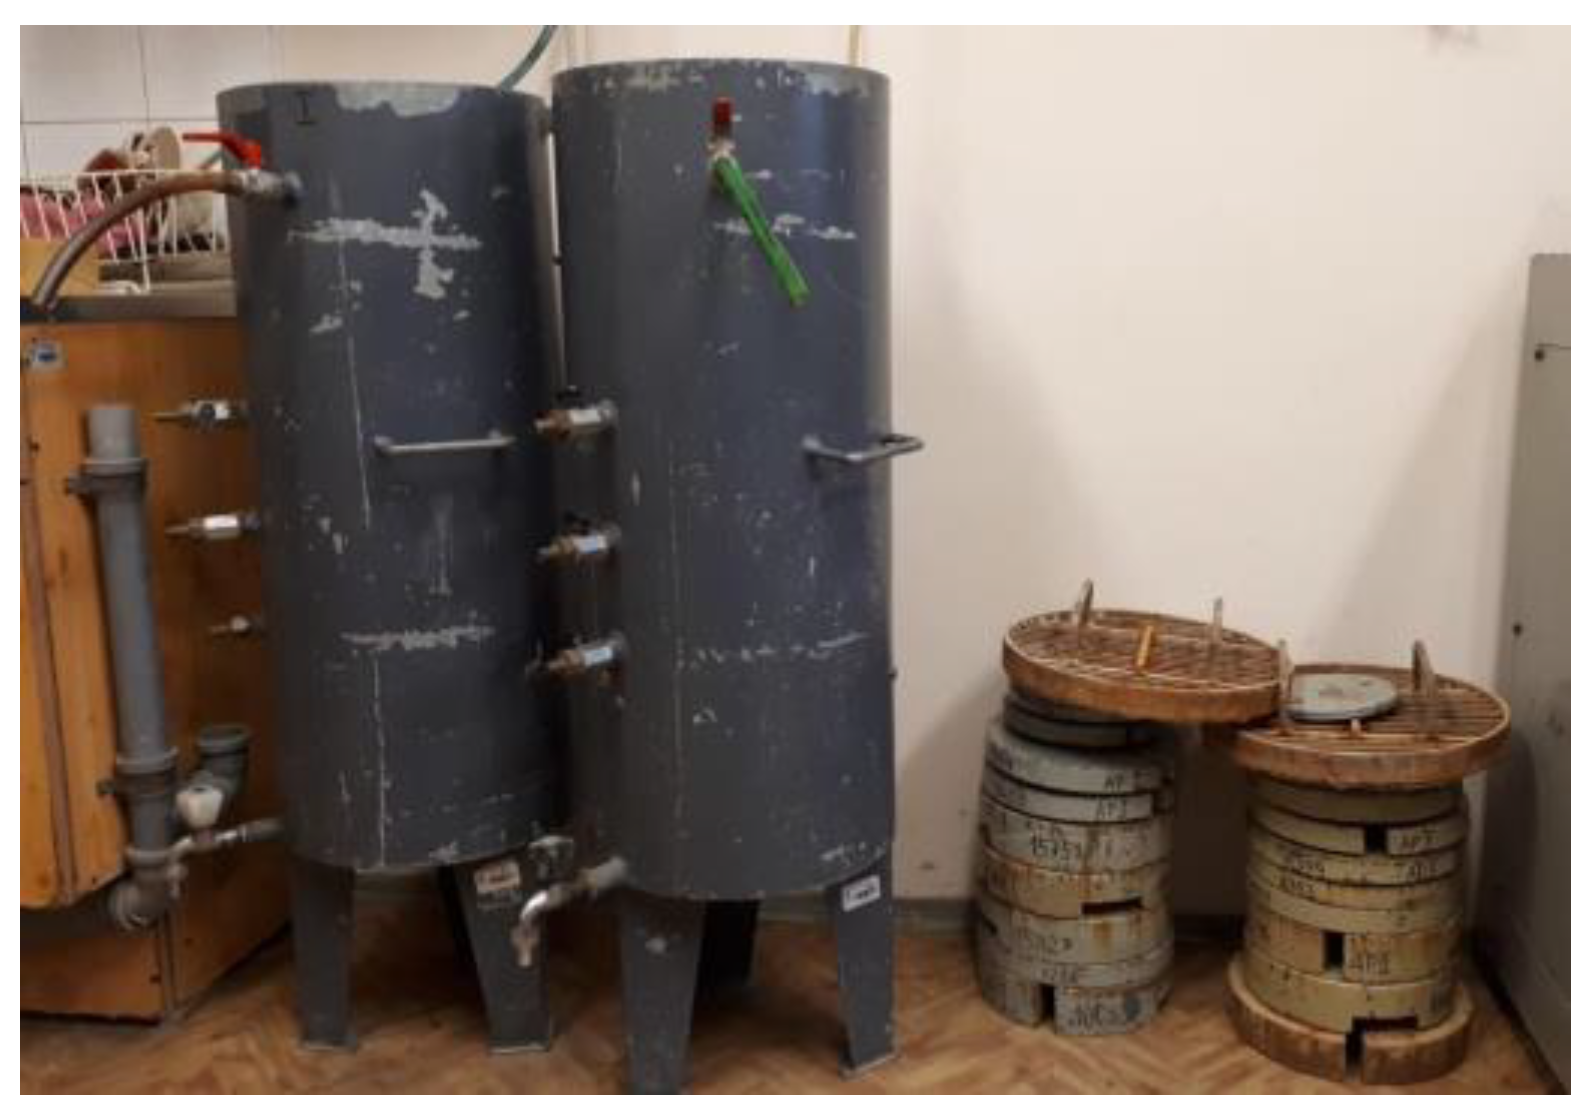
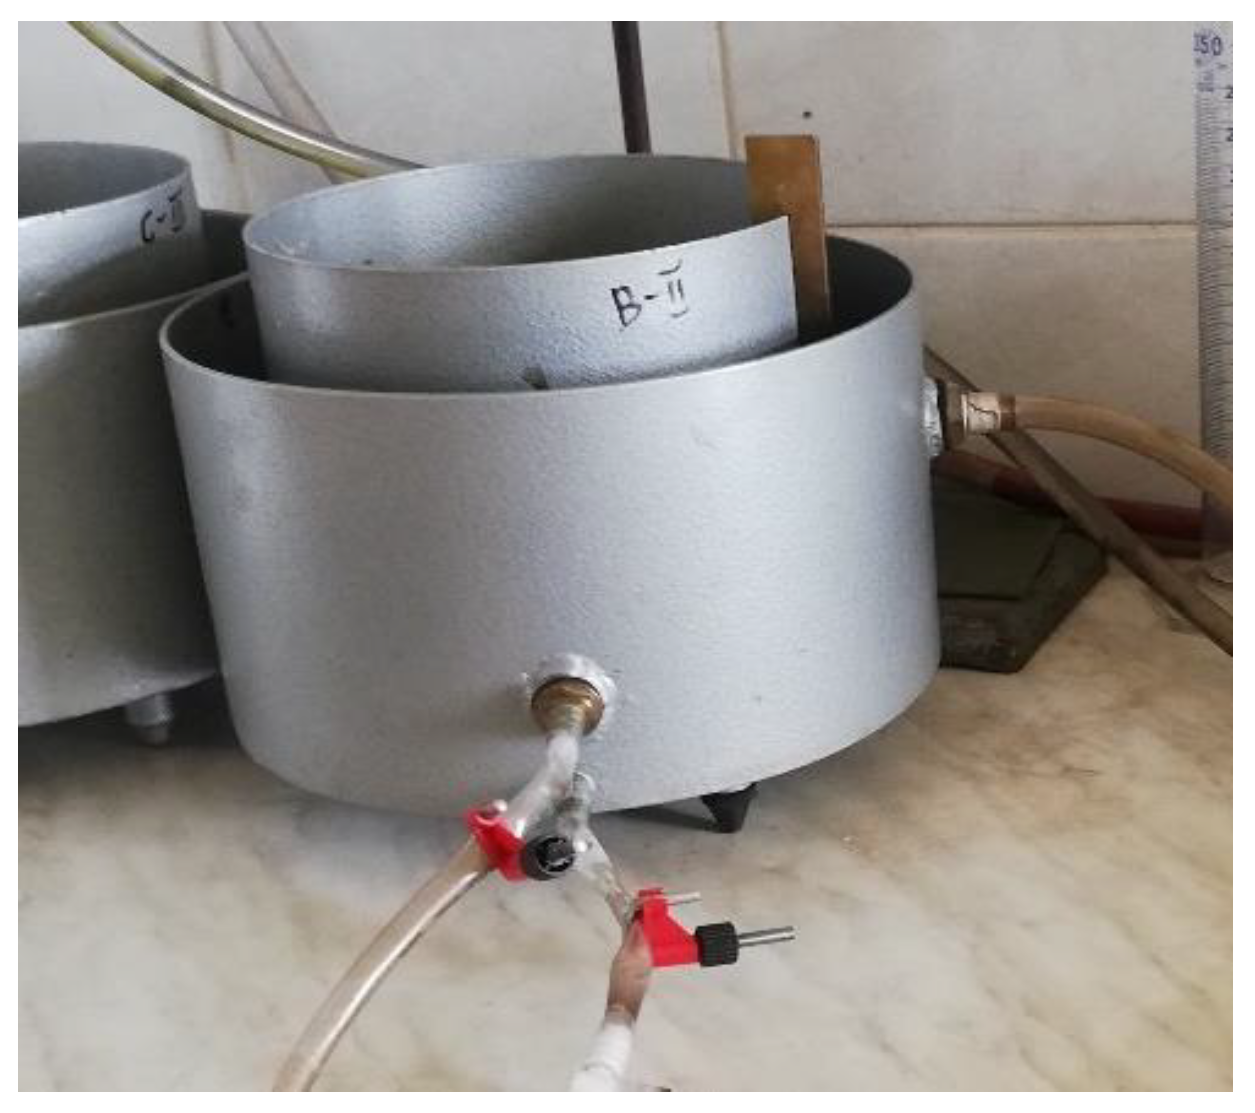
2.7. Water Permeability Tests

Water filtration properties of slag and ash generated in the process of thermal waste conversion were determined. The scope of the studies included determination of compaction parameters, i.e., maximum bulk density of the skeleton and optimal humidity. Tests were carried out on SP2 sample with natural grain size in a standard Proctor apparatus (PN-EN 13286-2:2010).
Filtration coefficient was measured using the constant gradient method, i.e., in a medium-sized permeameter (Figure 3) and in an ITB ZW K2 apparatus (Figure 4). In addition, SP2 waste samples with different seasoning periods of 3, 6, and 11 months, respectively, were tested on the ITB ZW K2 apparatus.
The value of the filtration coefficient was determined as follows:
-
In the medium-size permeameter (Figure 3) with density indices IS = 0.92 and 0.98 using samples with a diameter of 36.2 cm and a height of 12.4 cm;
-
In the ITB ZW K2 apparatus (Figure 4) with density indices IS = 0.92, 0.95, and 0.98 using samples with a diameter of 11.3 cm and a height of 6 cm.
Permeability tests consisted in determining the water amount that would filter through a sample with a cross-section A in time t at the hydraulic gradient i. The filtration coefficient (kt) was calculated according to the following formula:
k t = Q A · i · t [ m s 1 ]
where:
  • Q—filtration output, m3;
  • A—sample cross-sectional area, m2;
  • i—hydraulic gradient;
  • t—measurement time, s.
Permeability tests were carried out with two vertical directions of water flow through the sample, i.e., “bottom-up” and “top-down”. Measurements were made after filtering the water through the sample and stabilizing the flow with a constant hydraulic gradient at regular intervals. During the measurements, water temperature and differences in water levels in the piezometric tubes were controlled. The value of the filtration coefficient was assumed as the arithmetic mean of the measurement results obtained for both directions of water flow through the sample. The obtained filtration coefficients (kt) from both devices were converted to the conventional temperature of 10 °C (k10).

3. Results

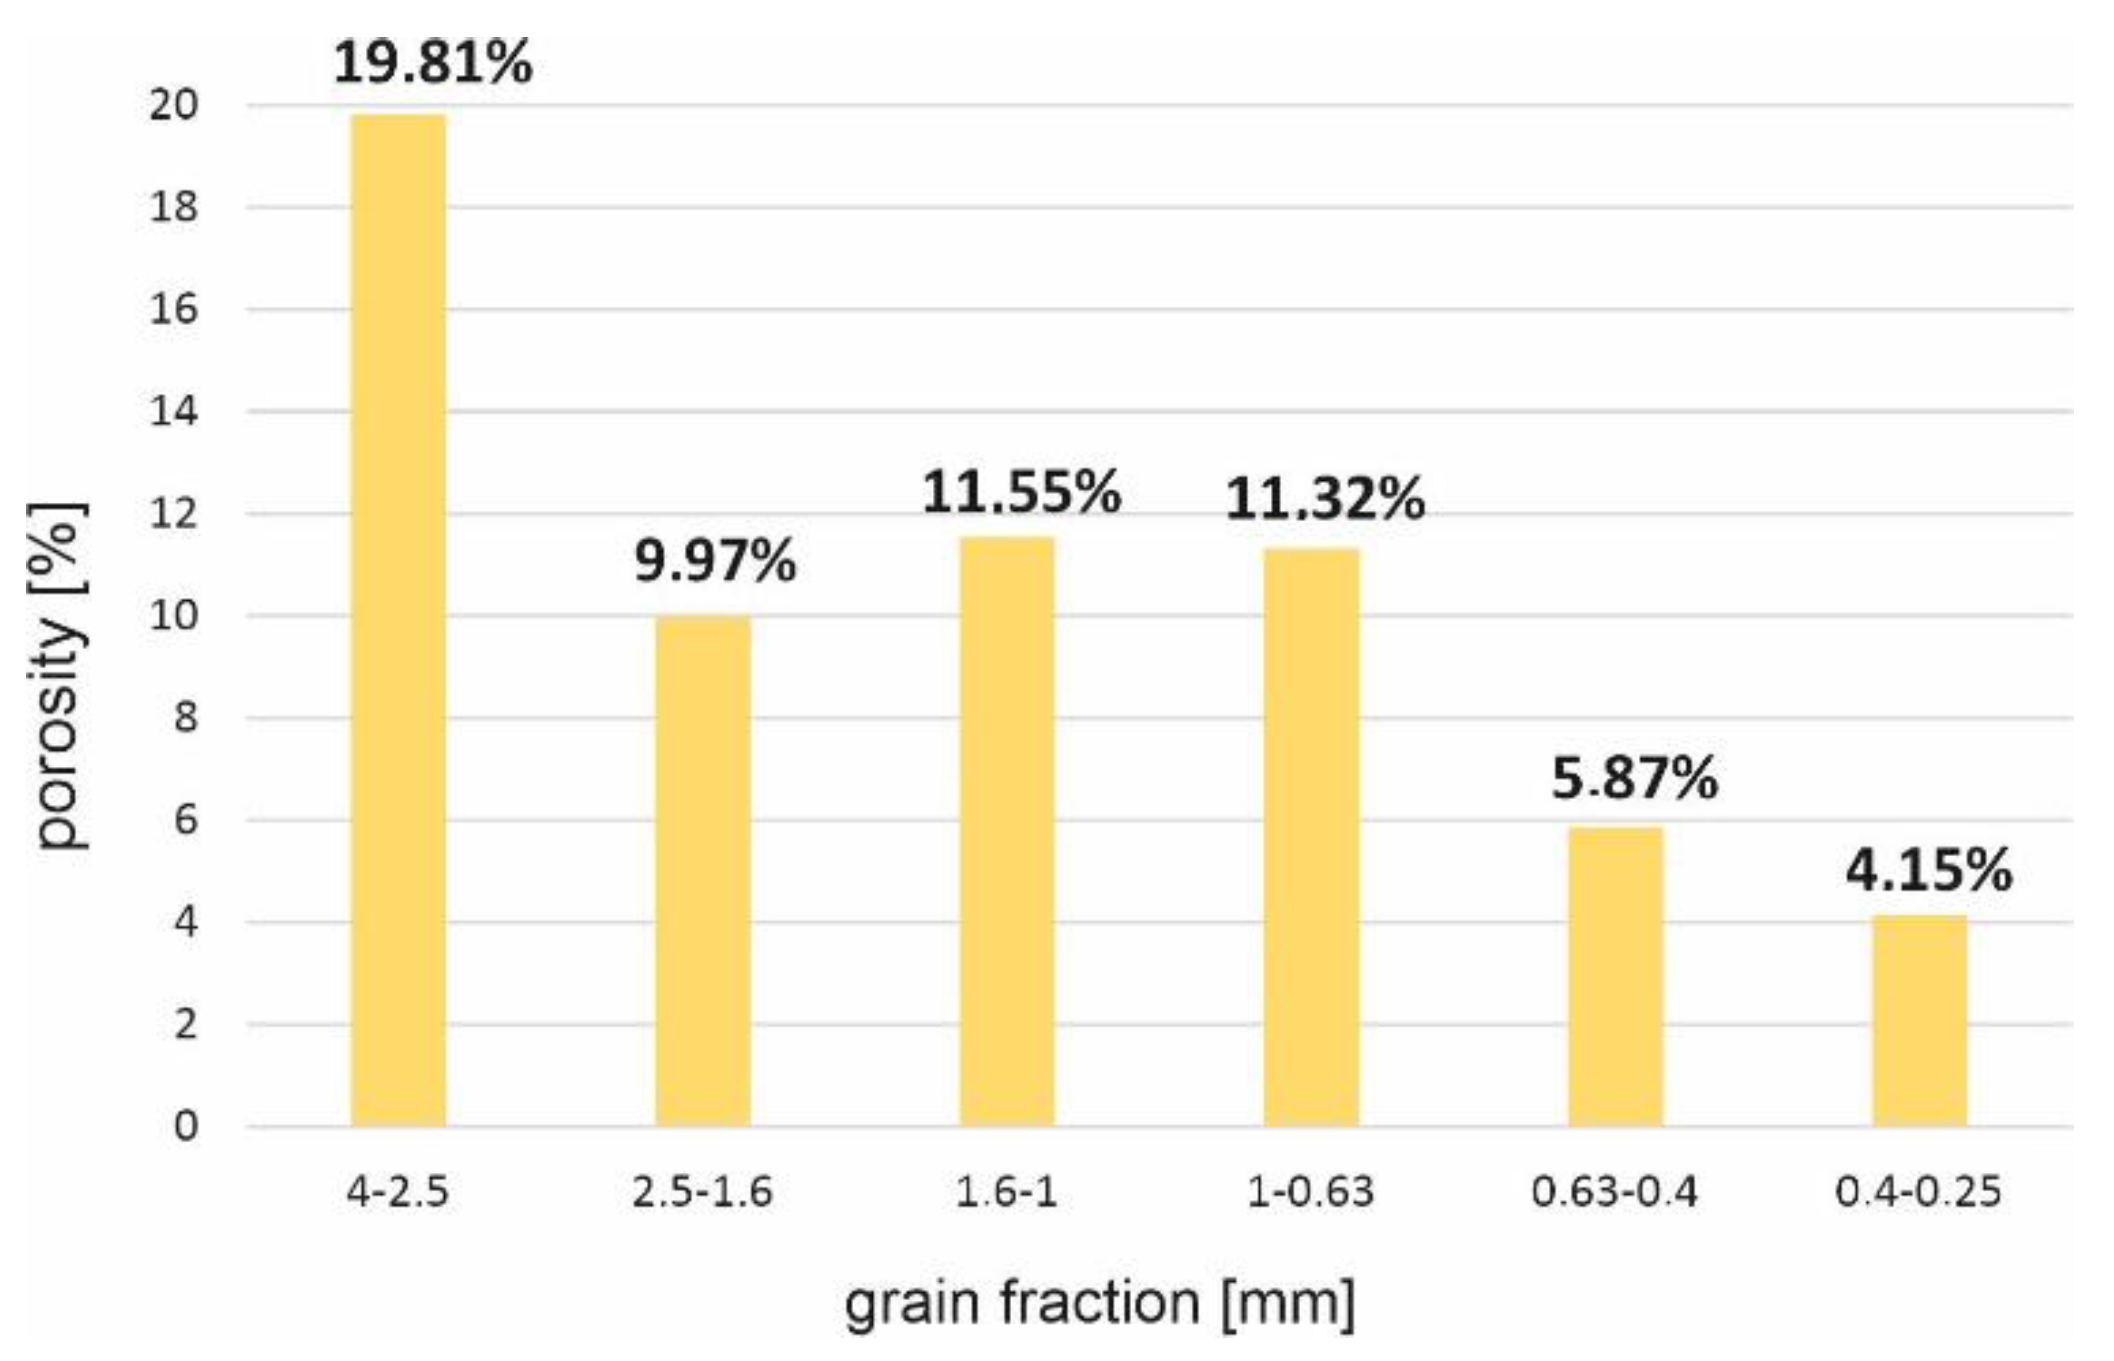
3.1. Granulometric Analysis

Figure 5 shows histograms and particle size distribution curves. It was shown, in all analyzed materials, that the gravel fraction dominated, followed by the sand fraction, while the dust fraction had the smallest share in the structure of waste material (Figure 5). Together with seasoning time, the material had a higher percentage of the gravel fraction. The largest amount of material above 10 mm was found in SP1, i.e., the oldest tested slag (20%); in SP2 it was about 11%, and in the youngest, SP3, it was only 3.5%. Although the material showed similar properties, there was a visible relationship between the seasoning time and the content of the thickest fraction. This feature was most likely the effect of caking of the material along with the lengthening of the slag and ash seasoning time. The seasoning process consists of penetration of moisture contained in the air into slag grains, where hydration processes take place. On the other hand, the hydration process consists of joining water to anhydrous compounds contained in slag grains (e.g., transition of CaSO4 into CaSO4 × 2H2O).

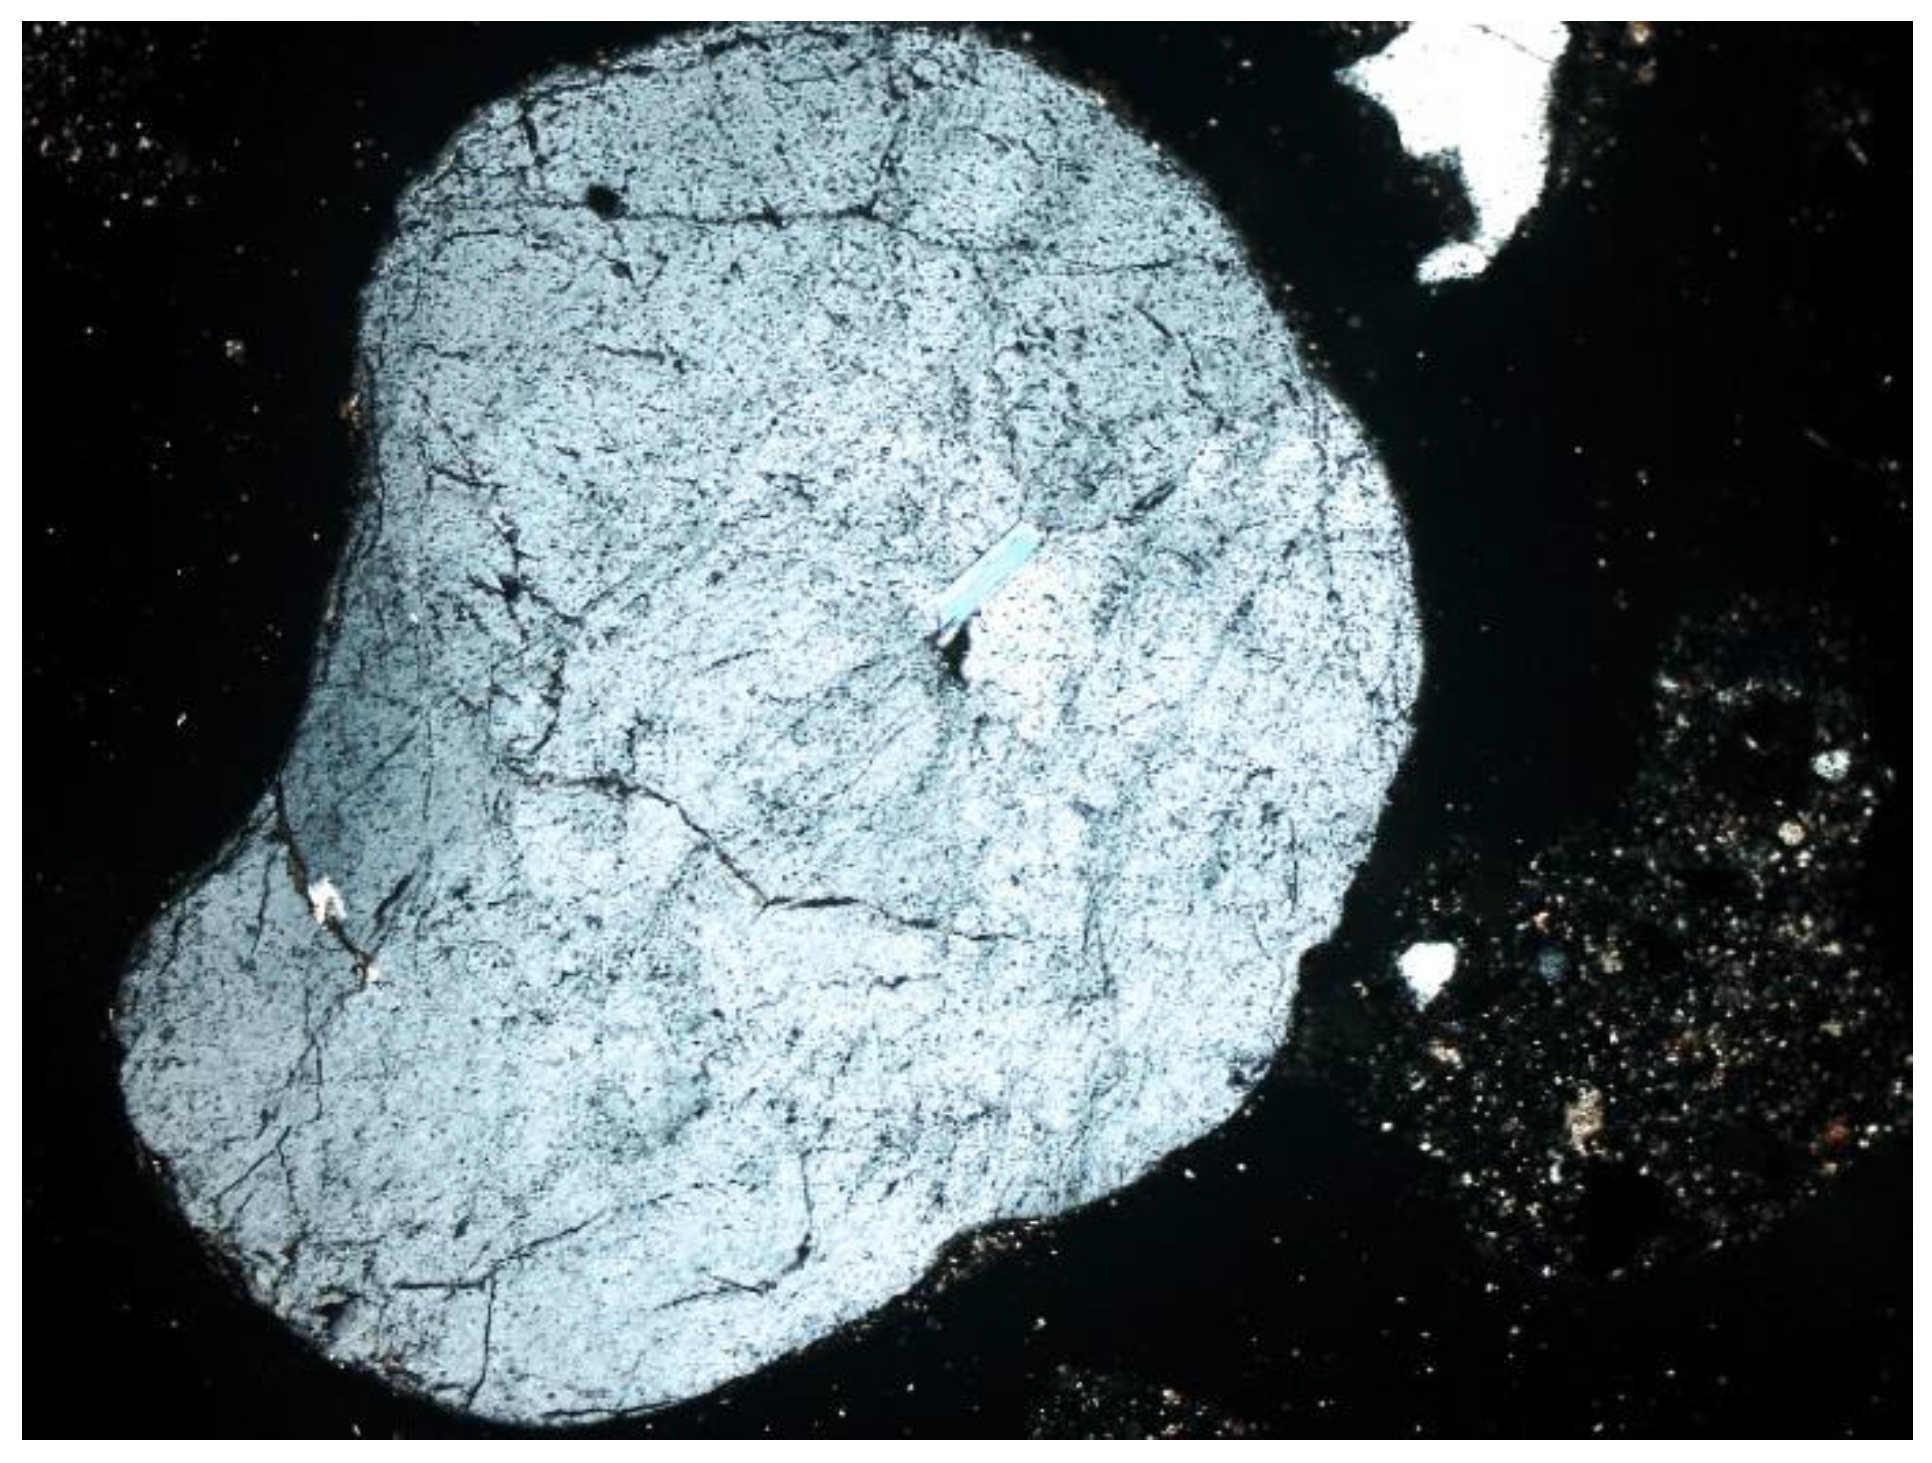
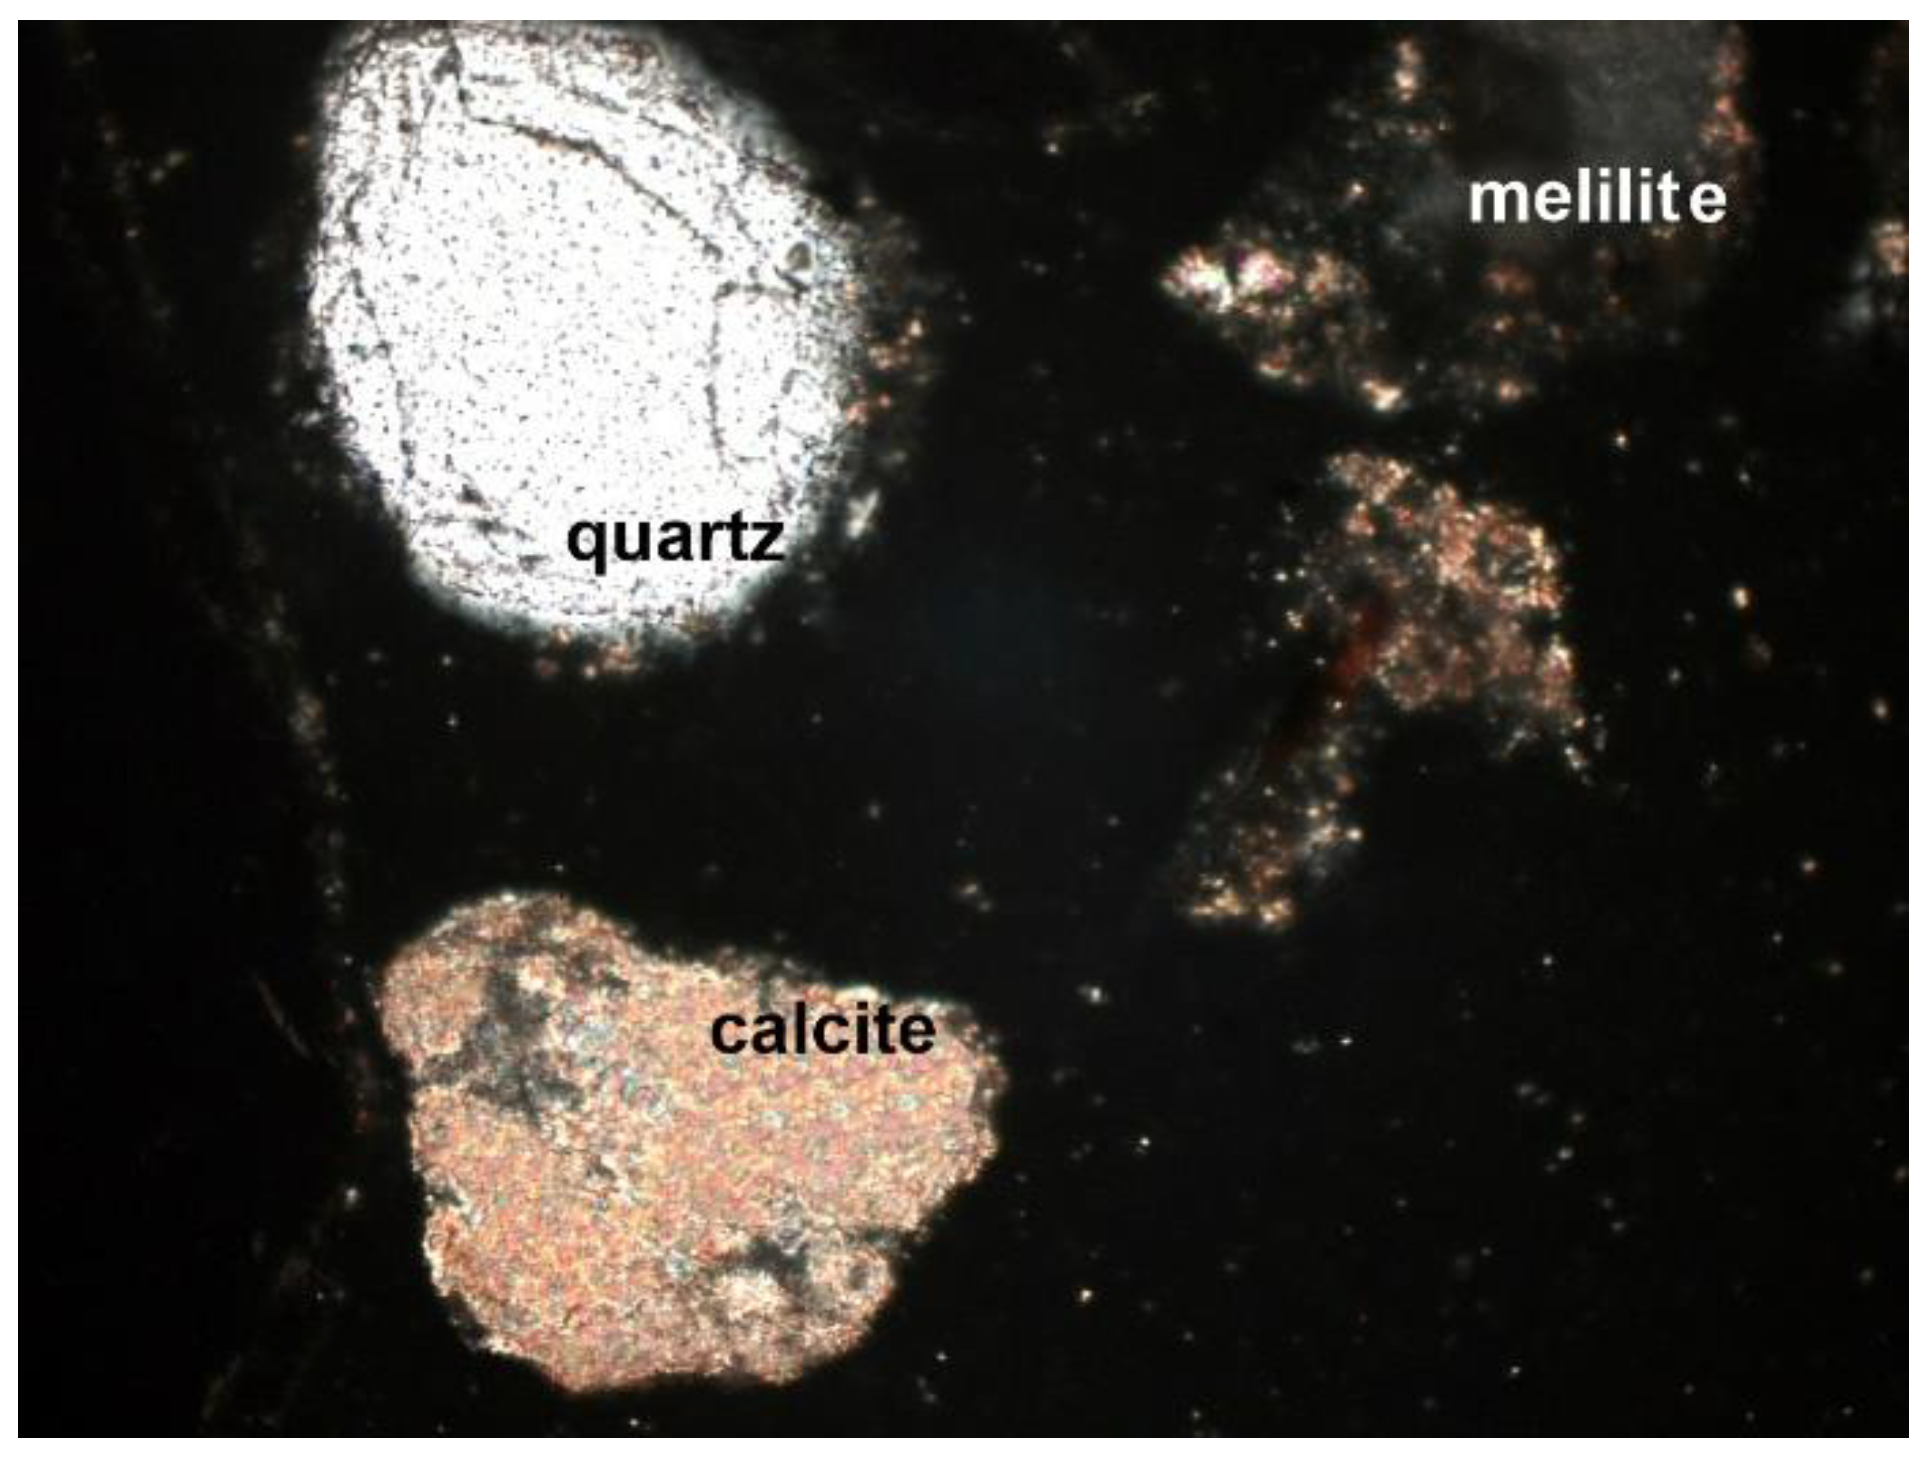
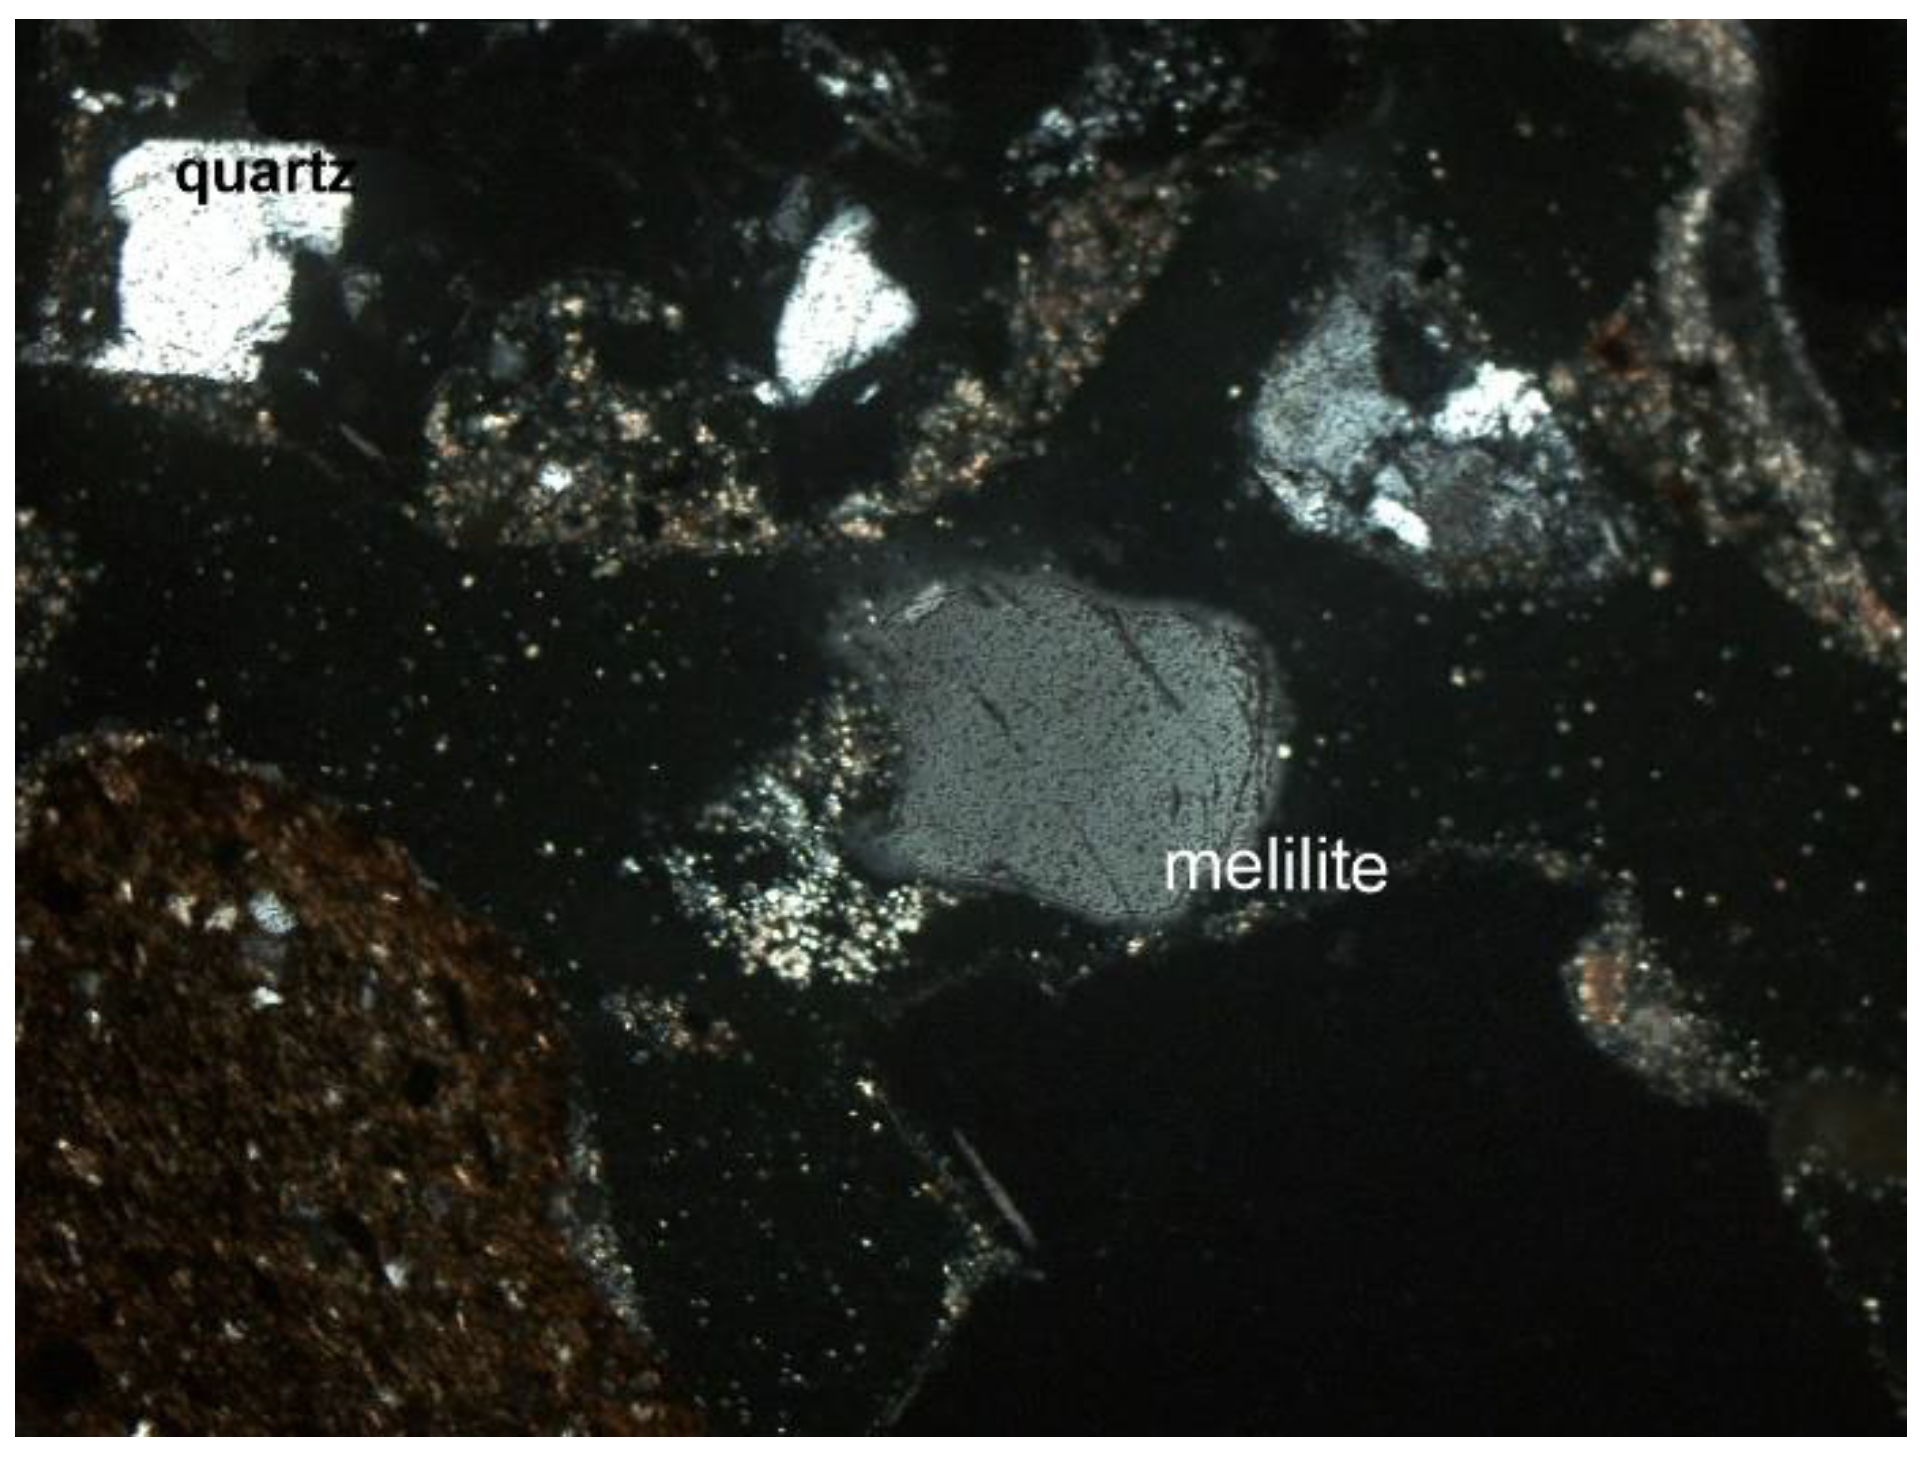
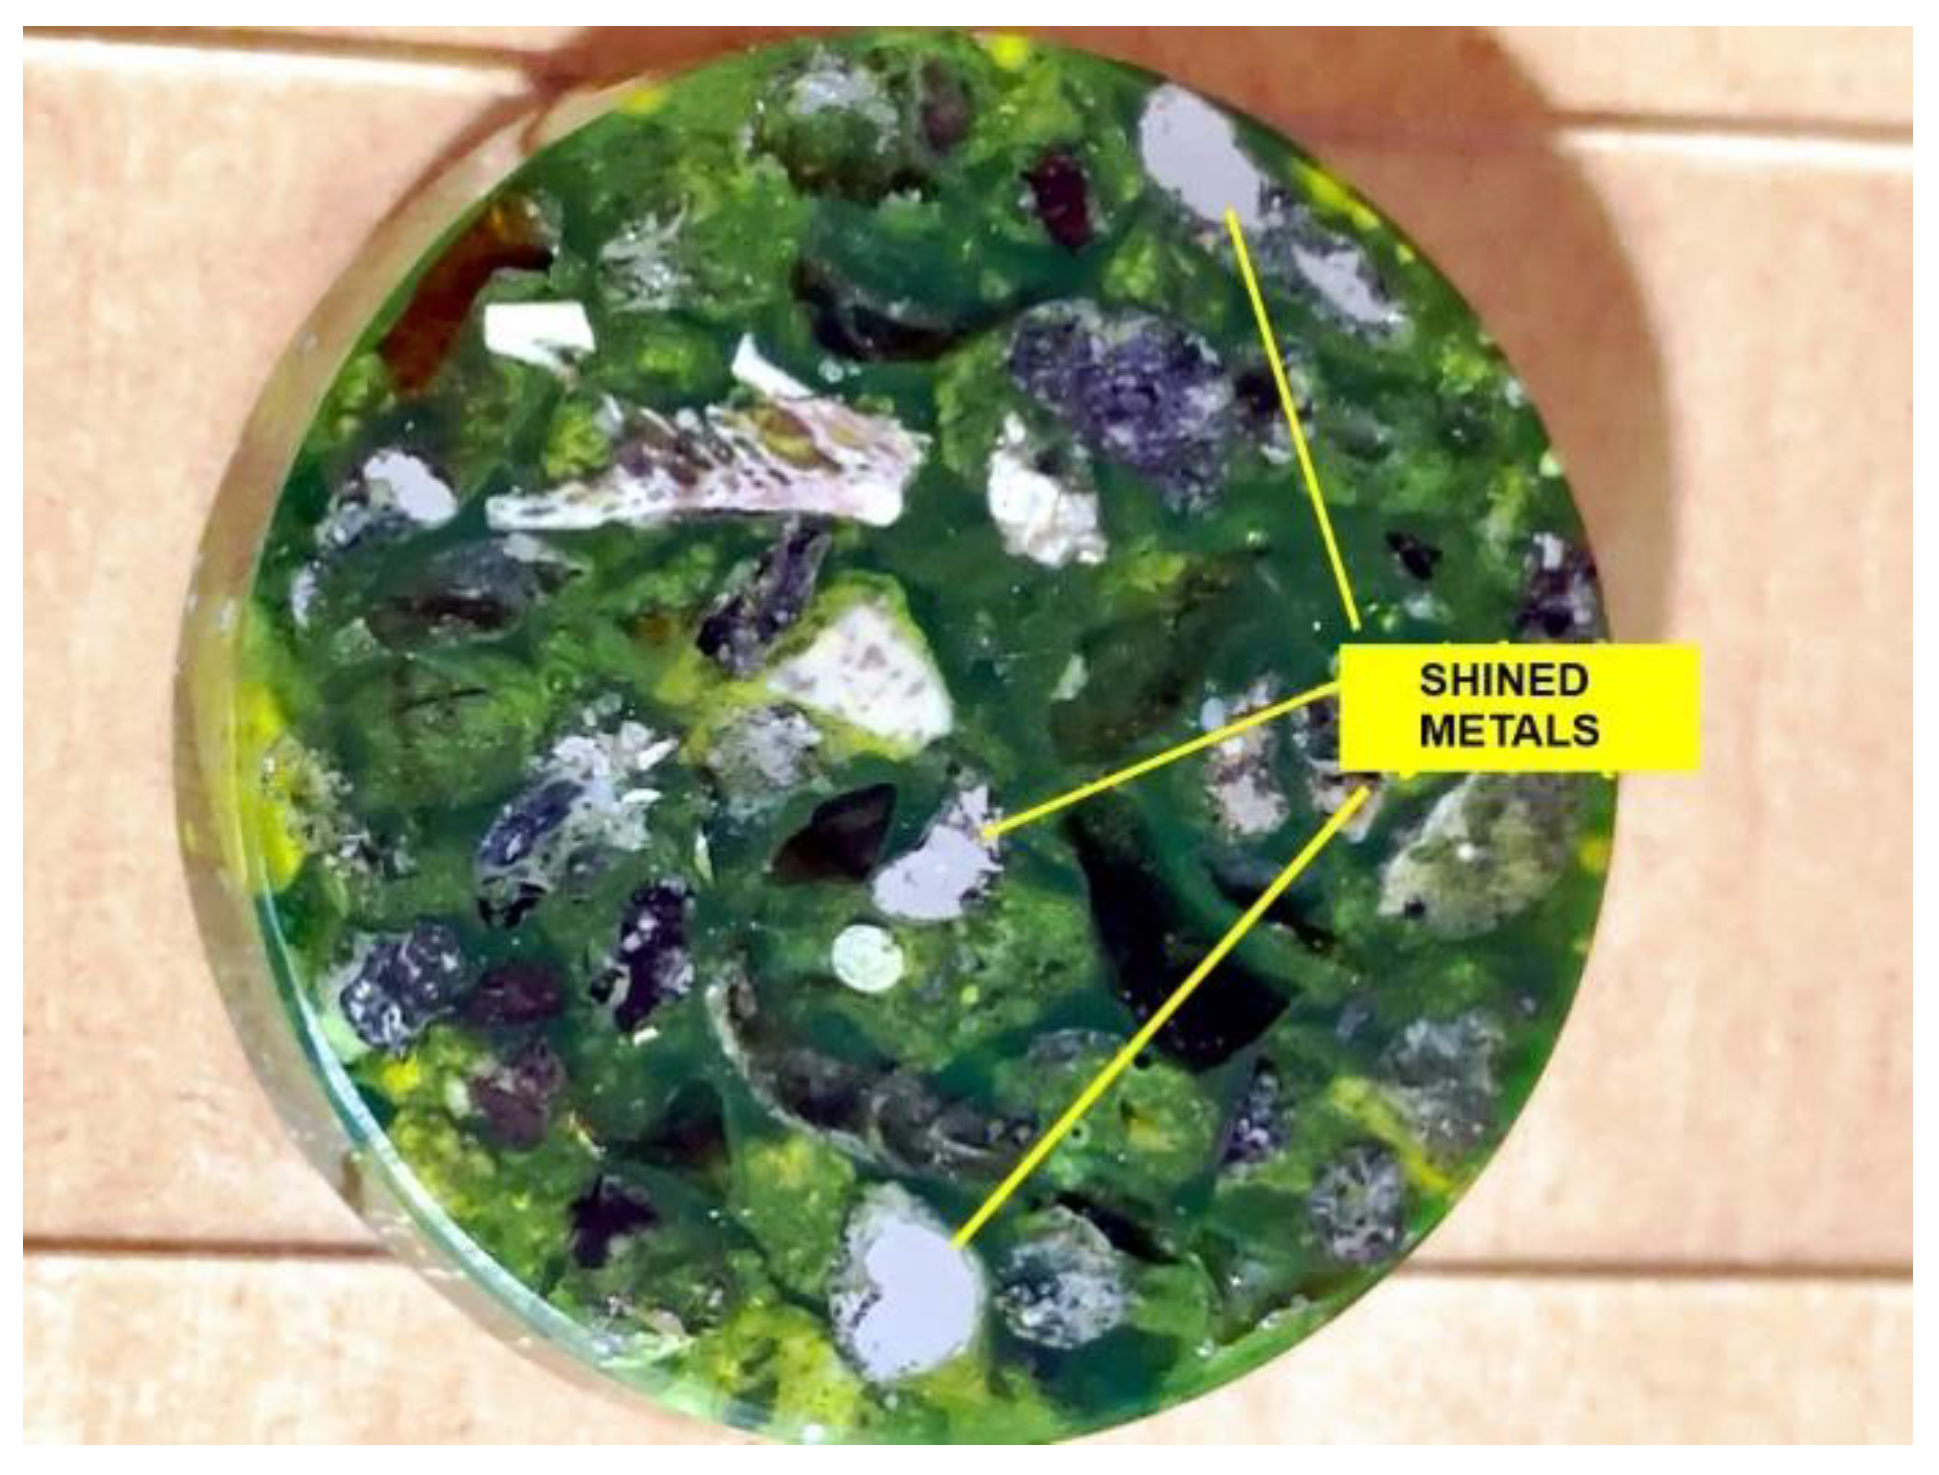
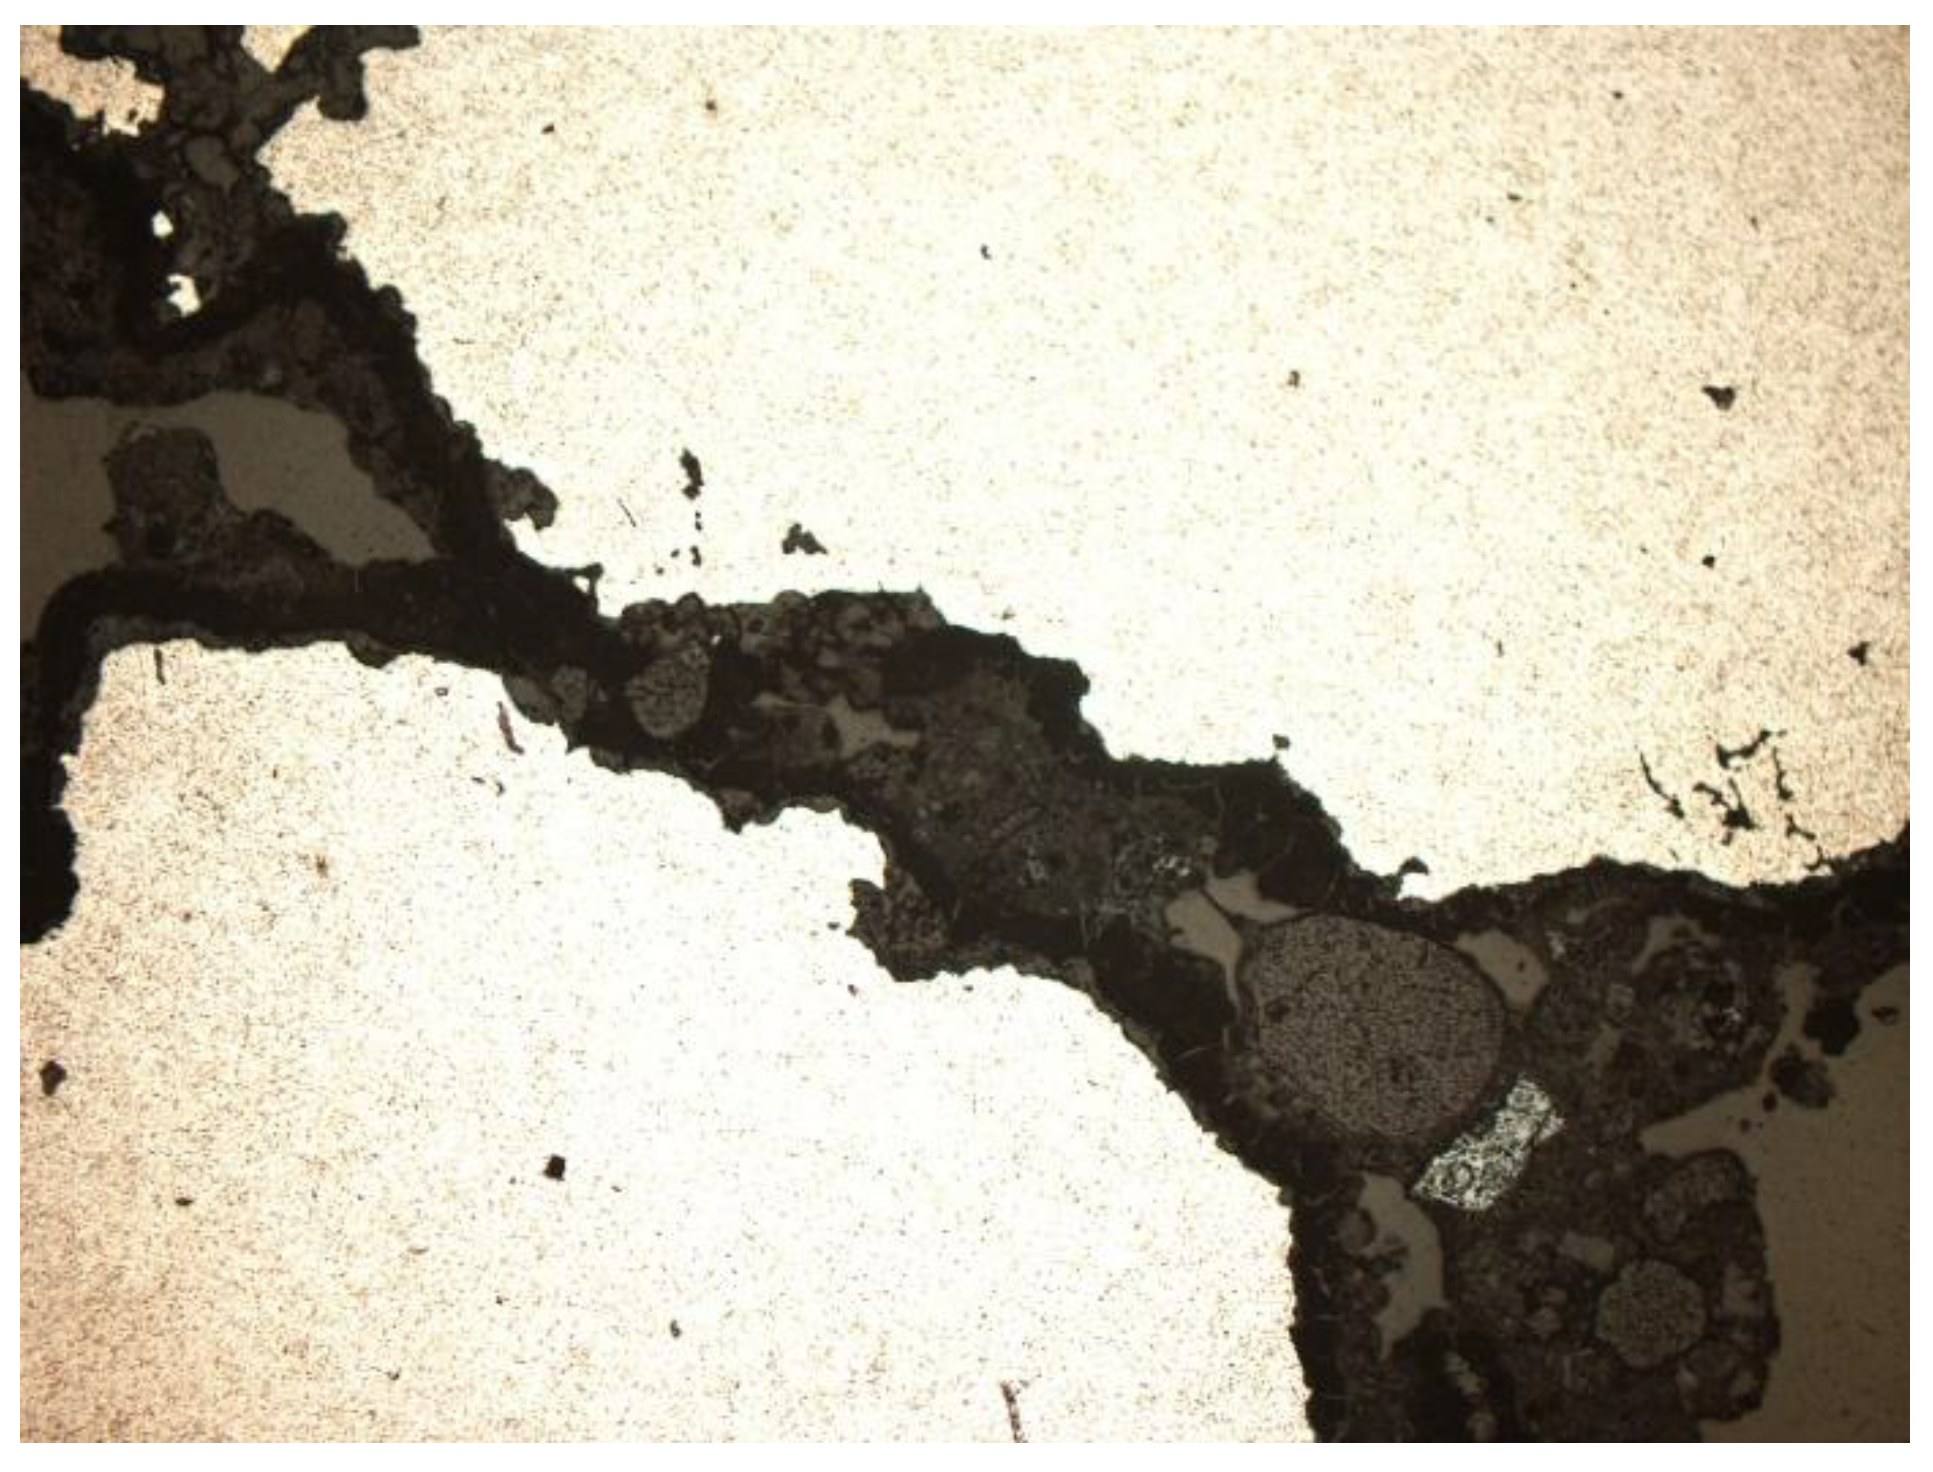
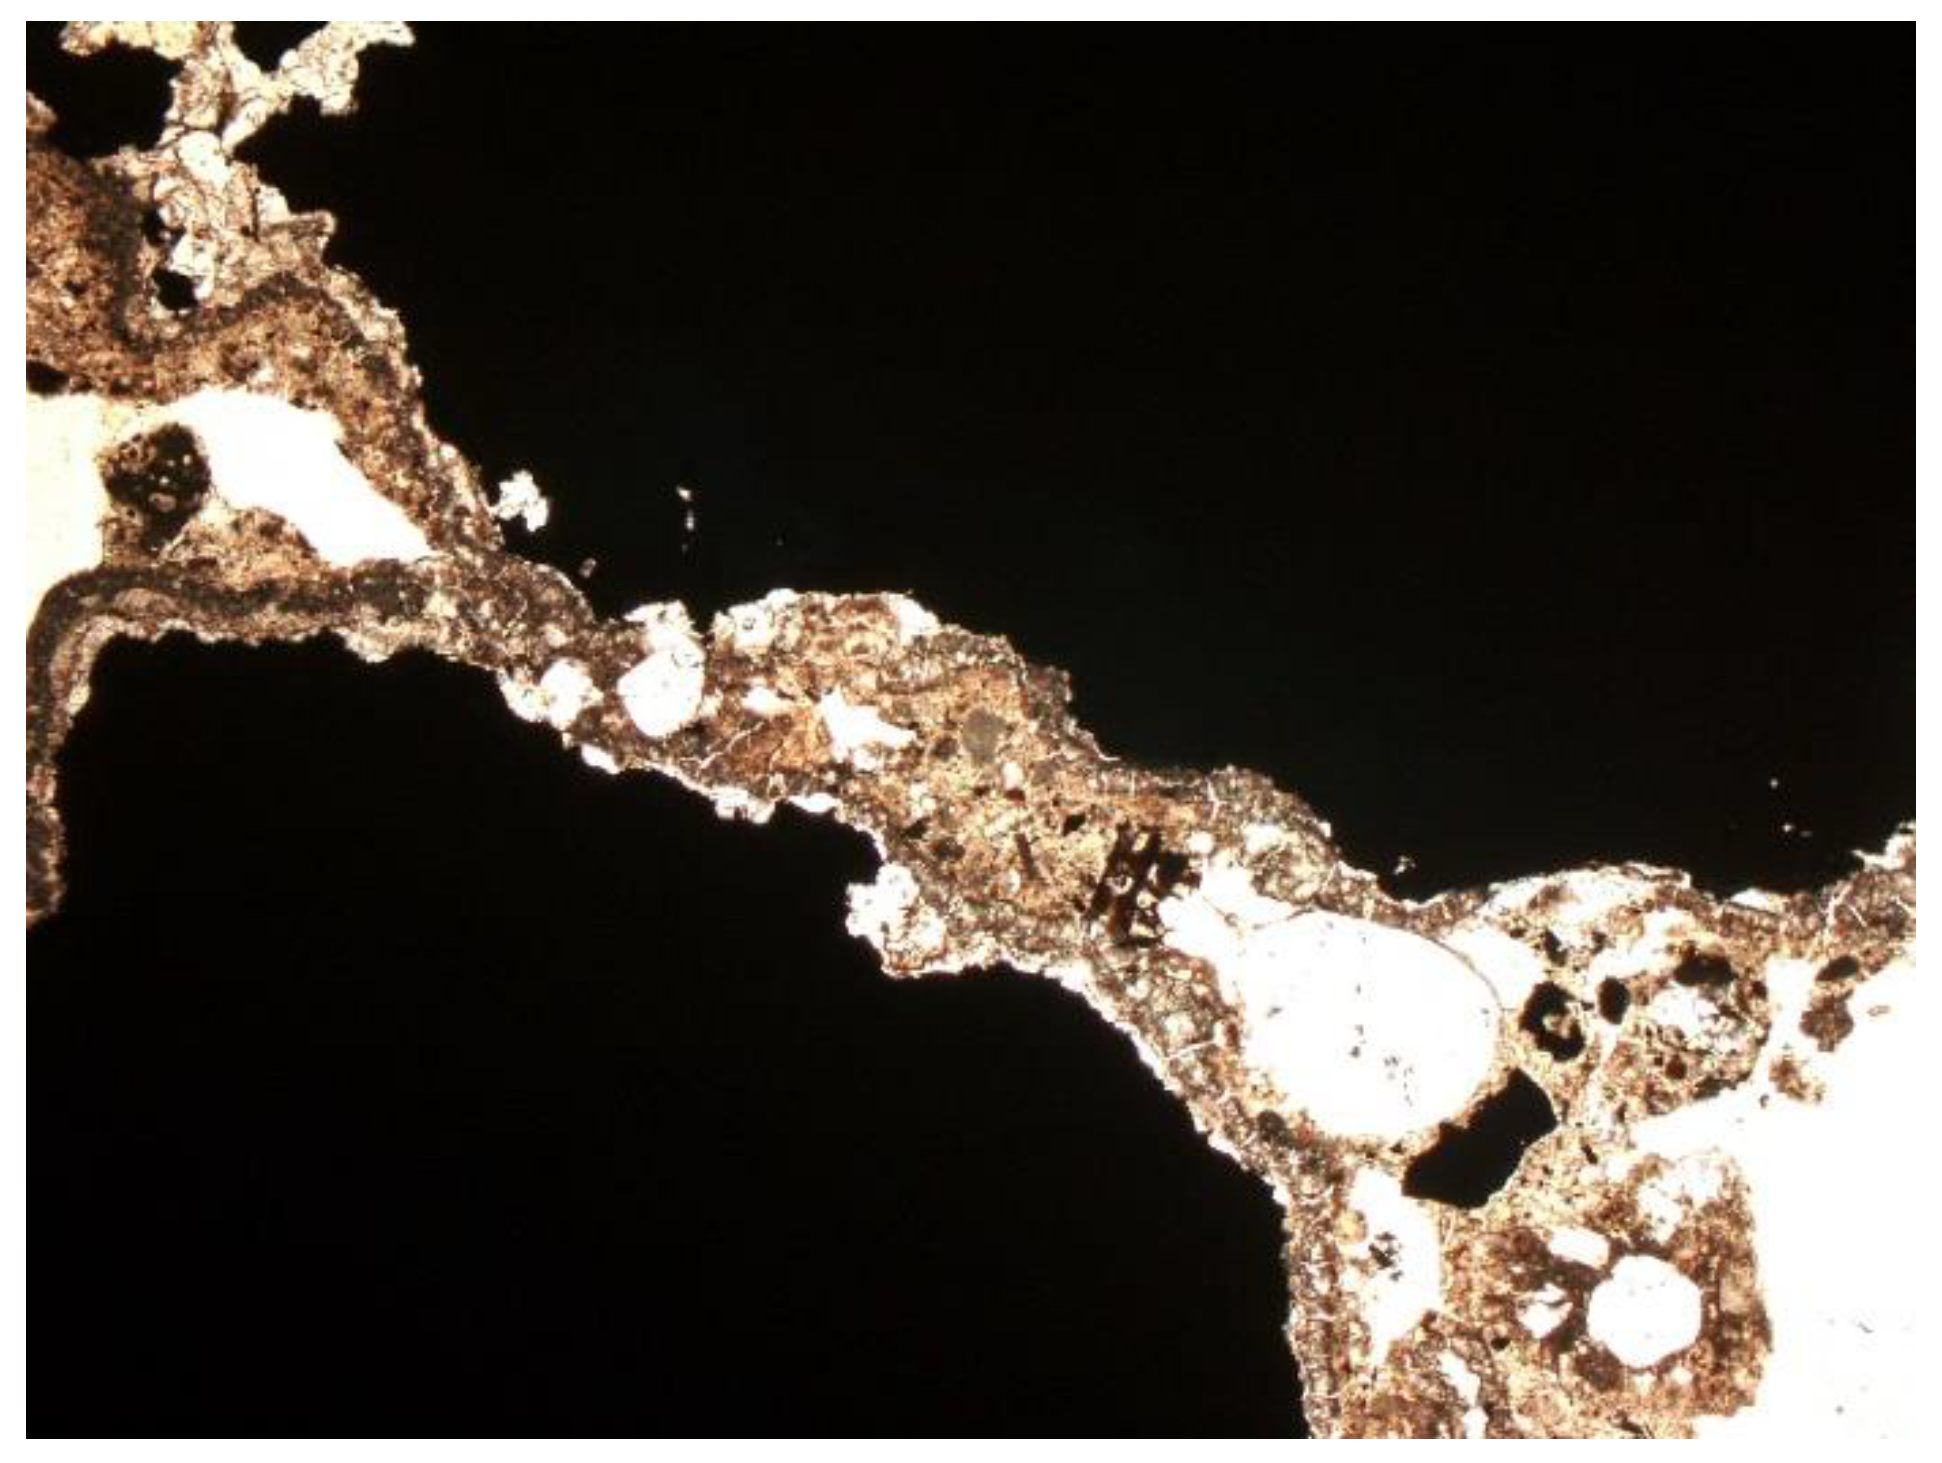
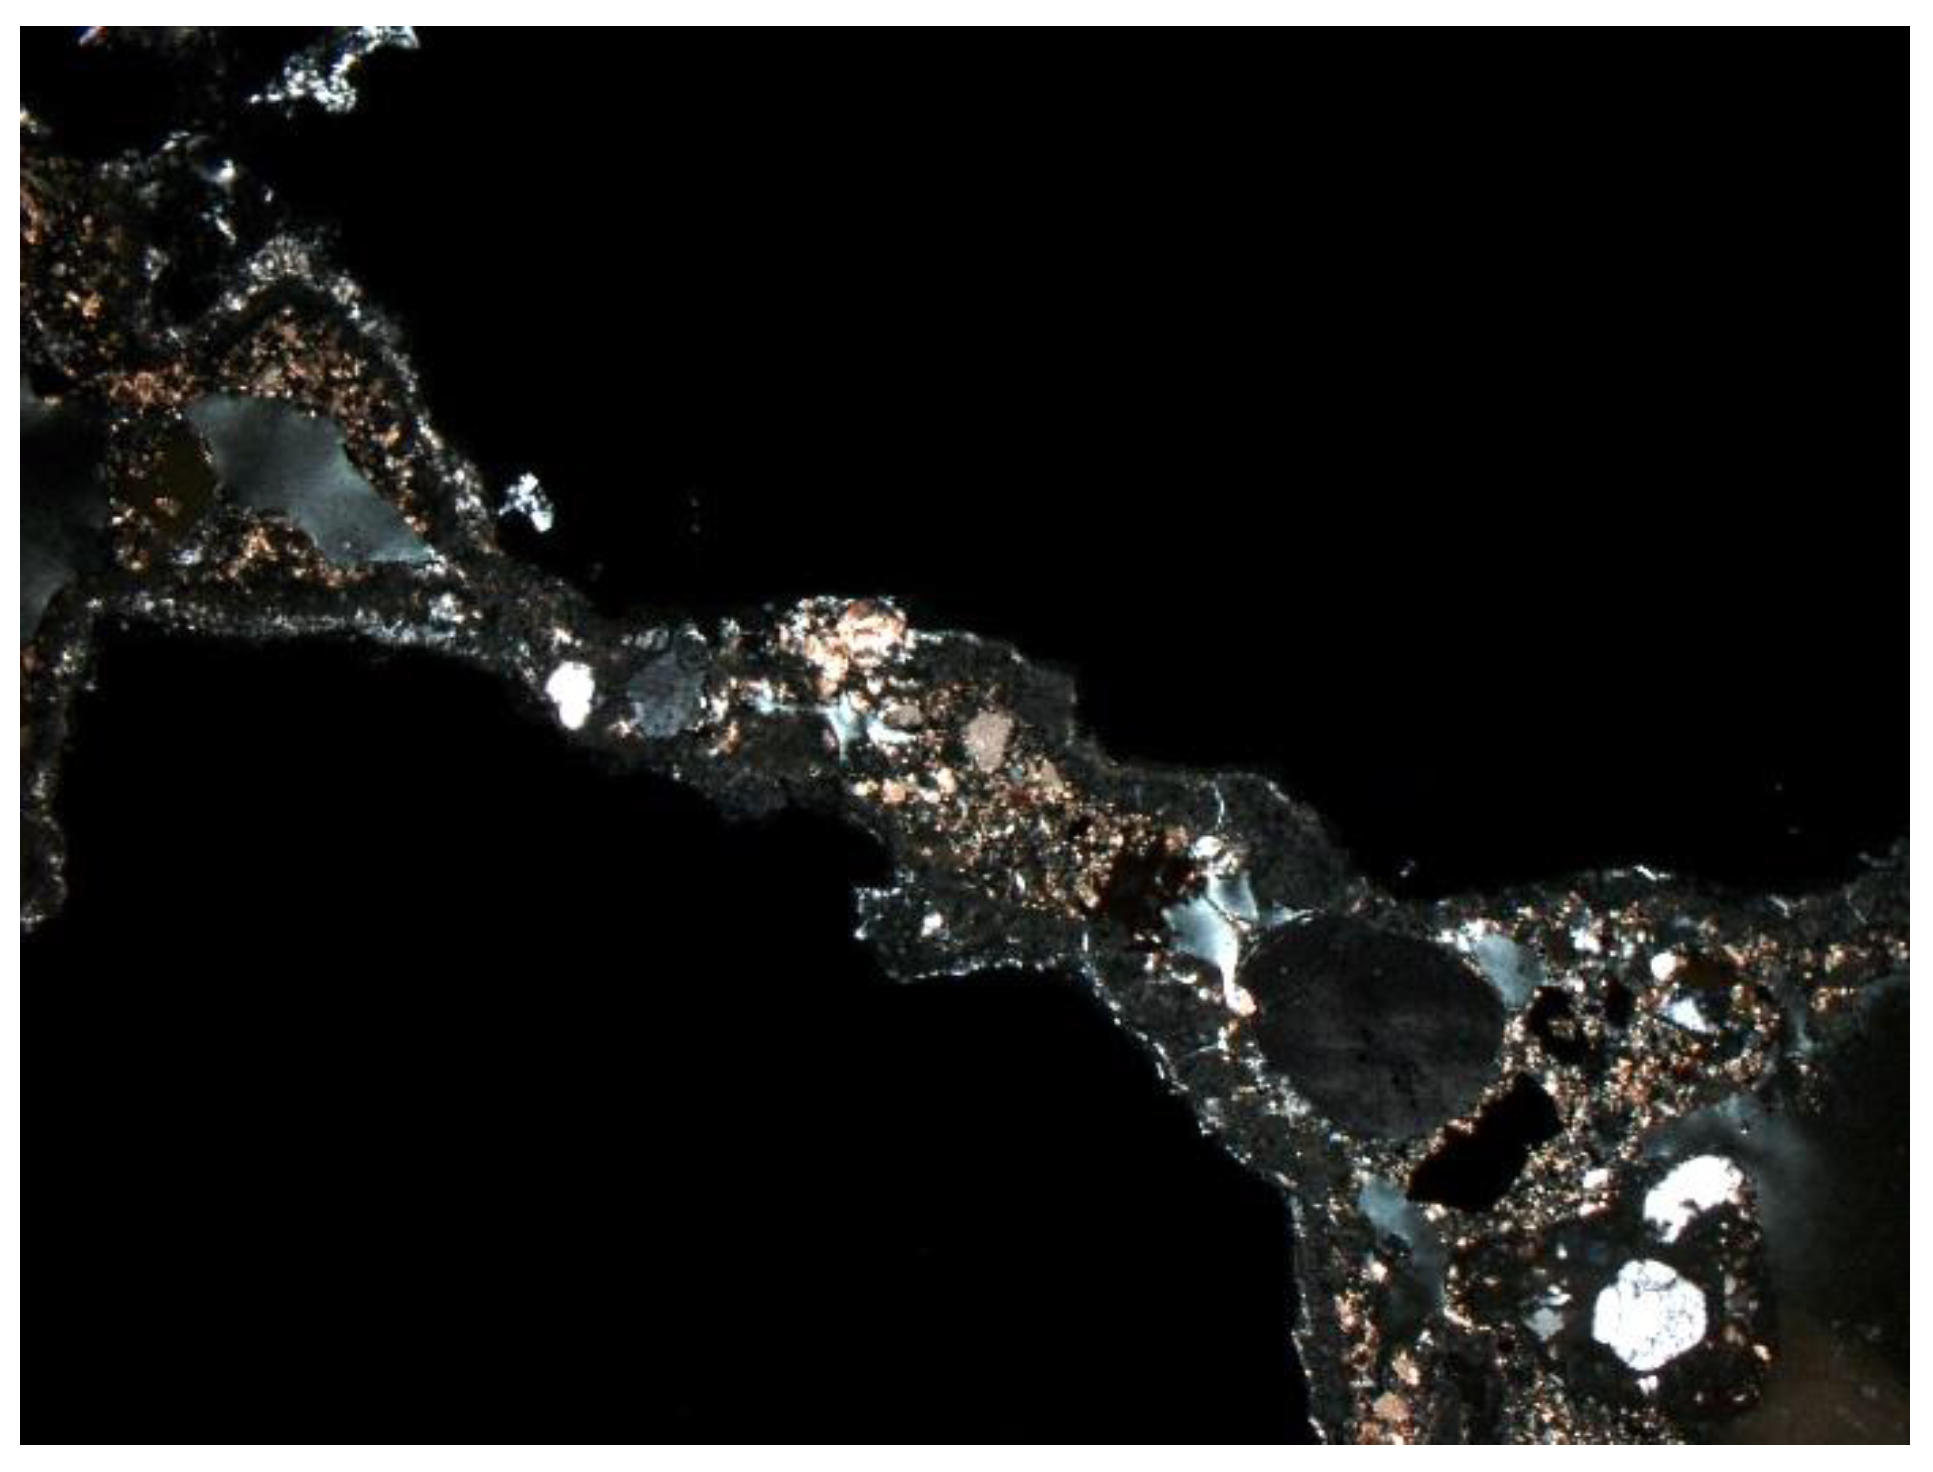
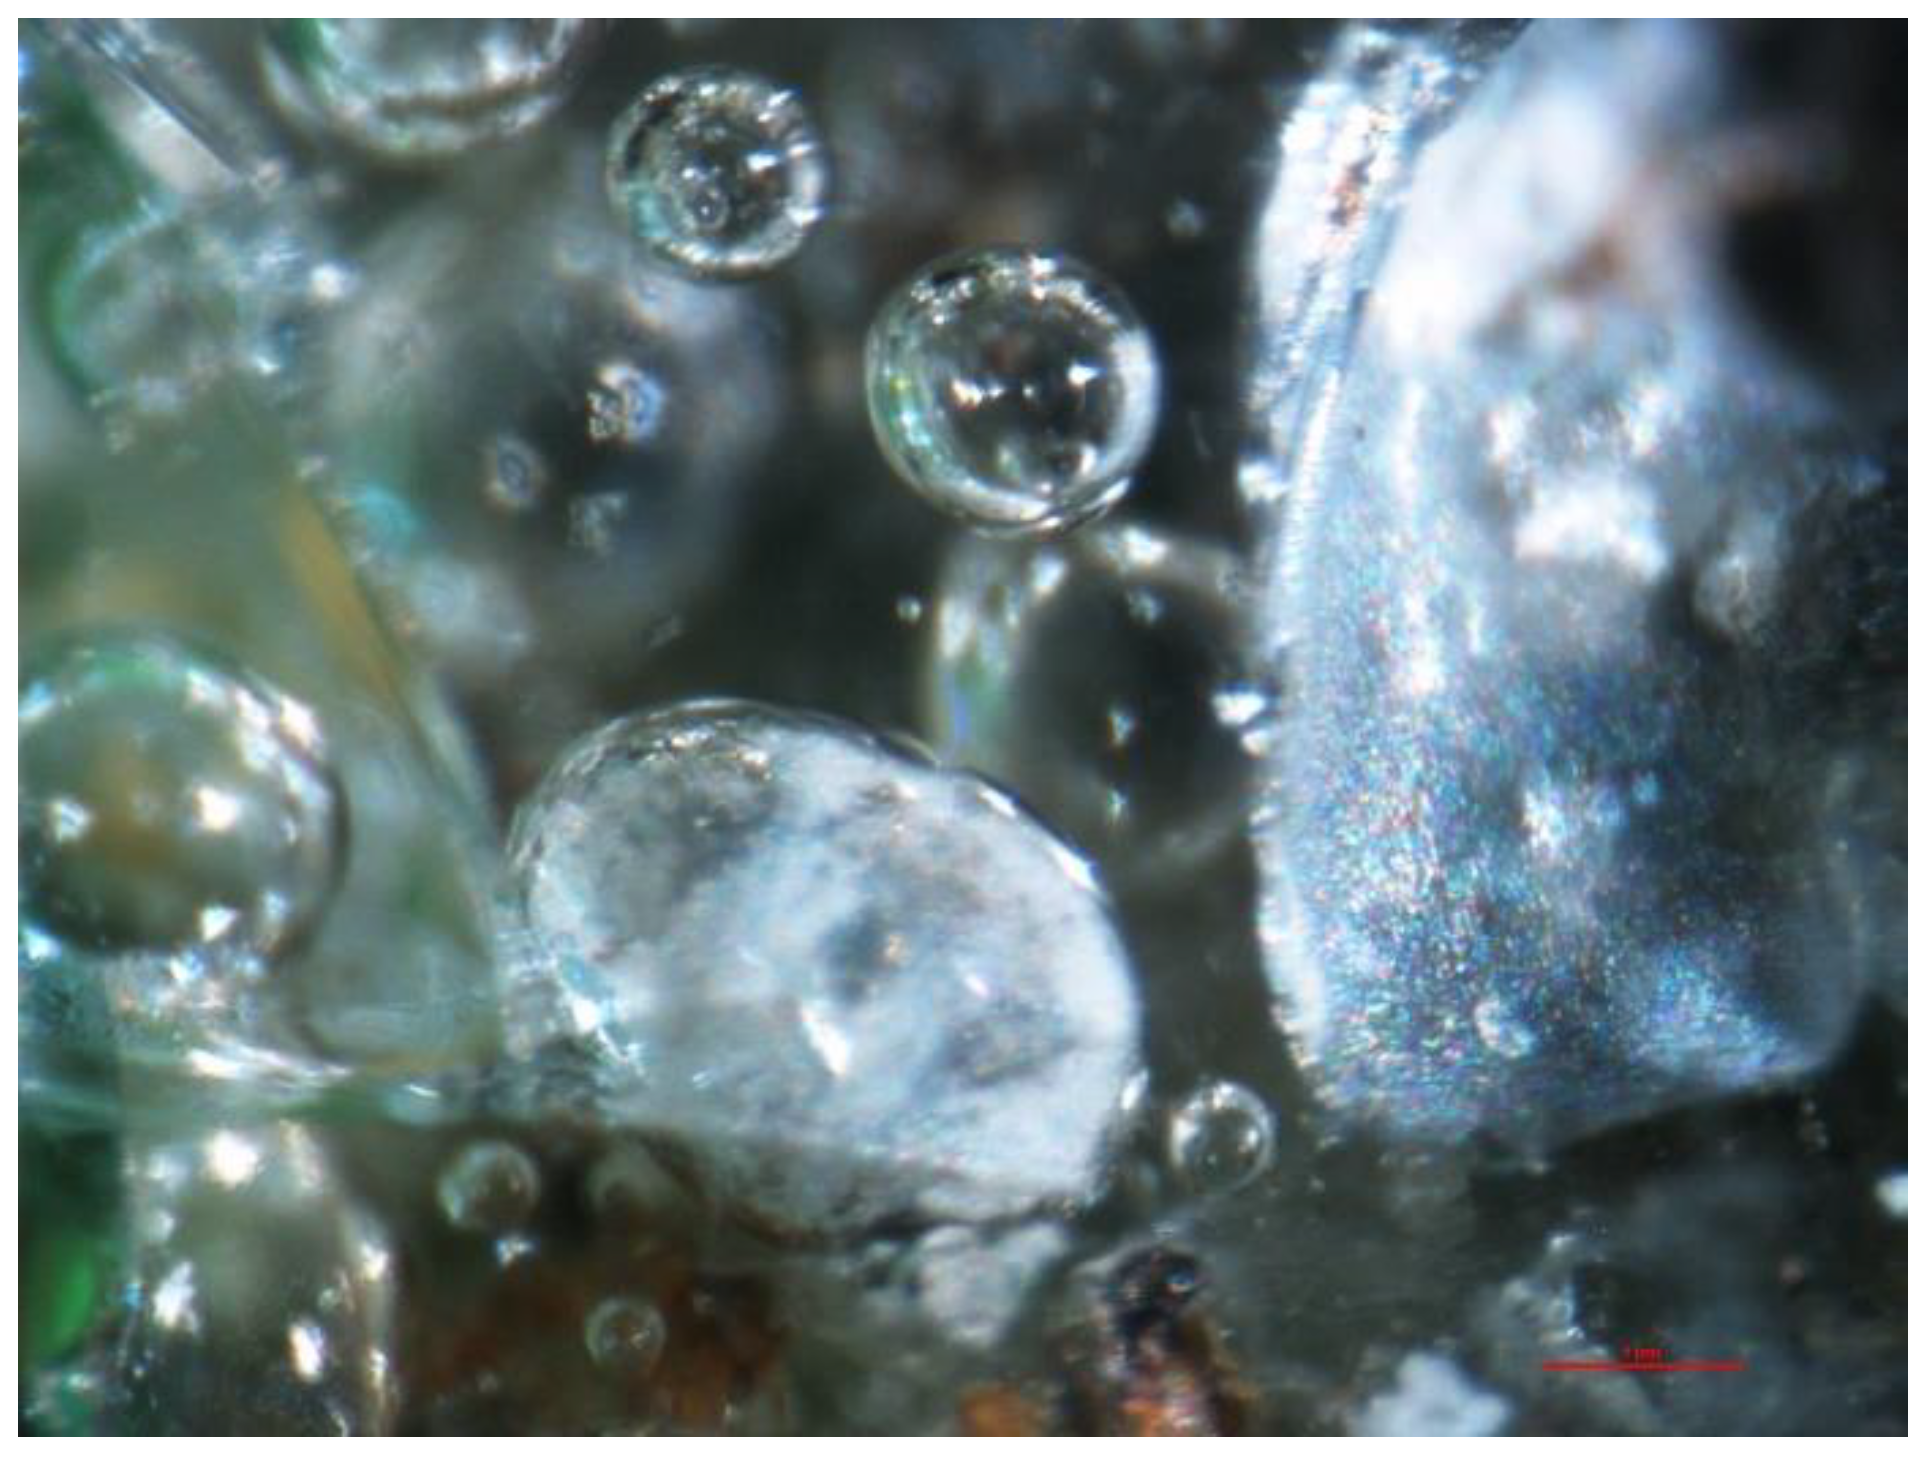
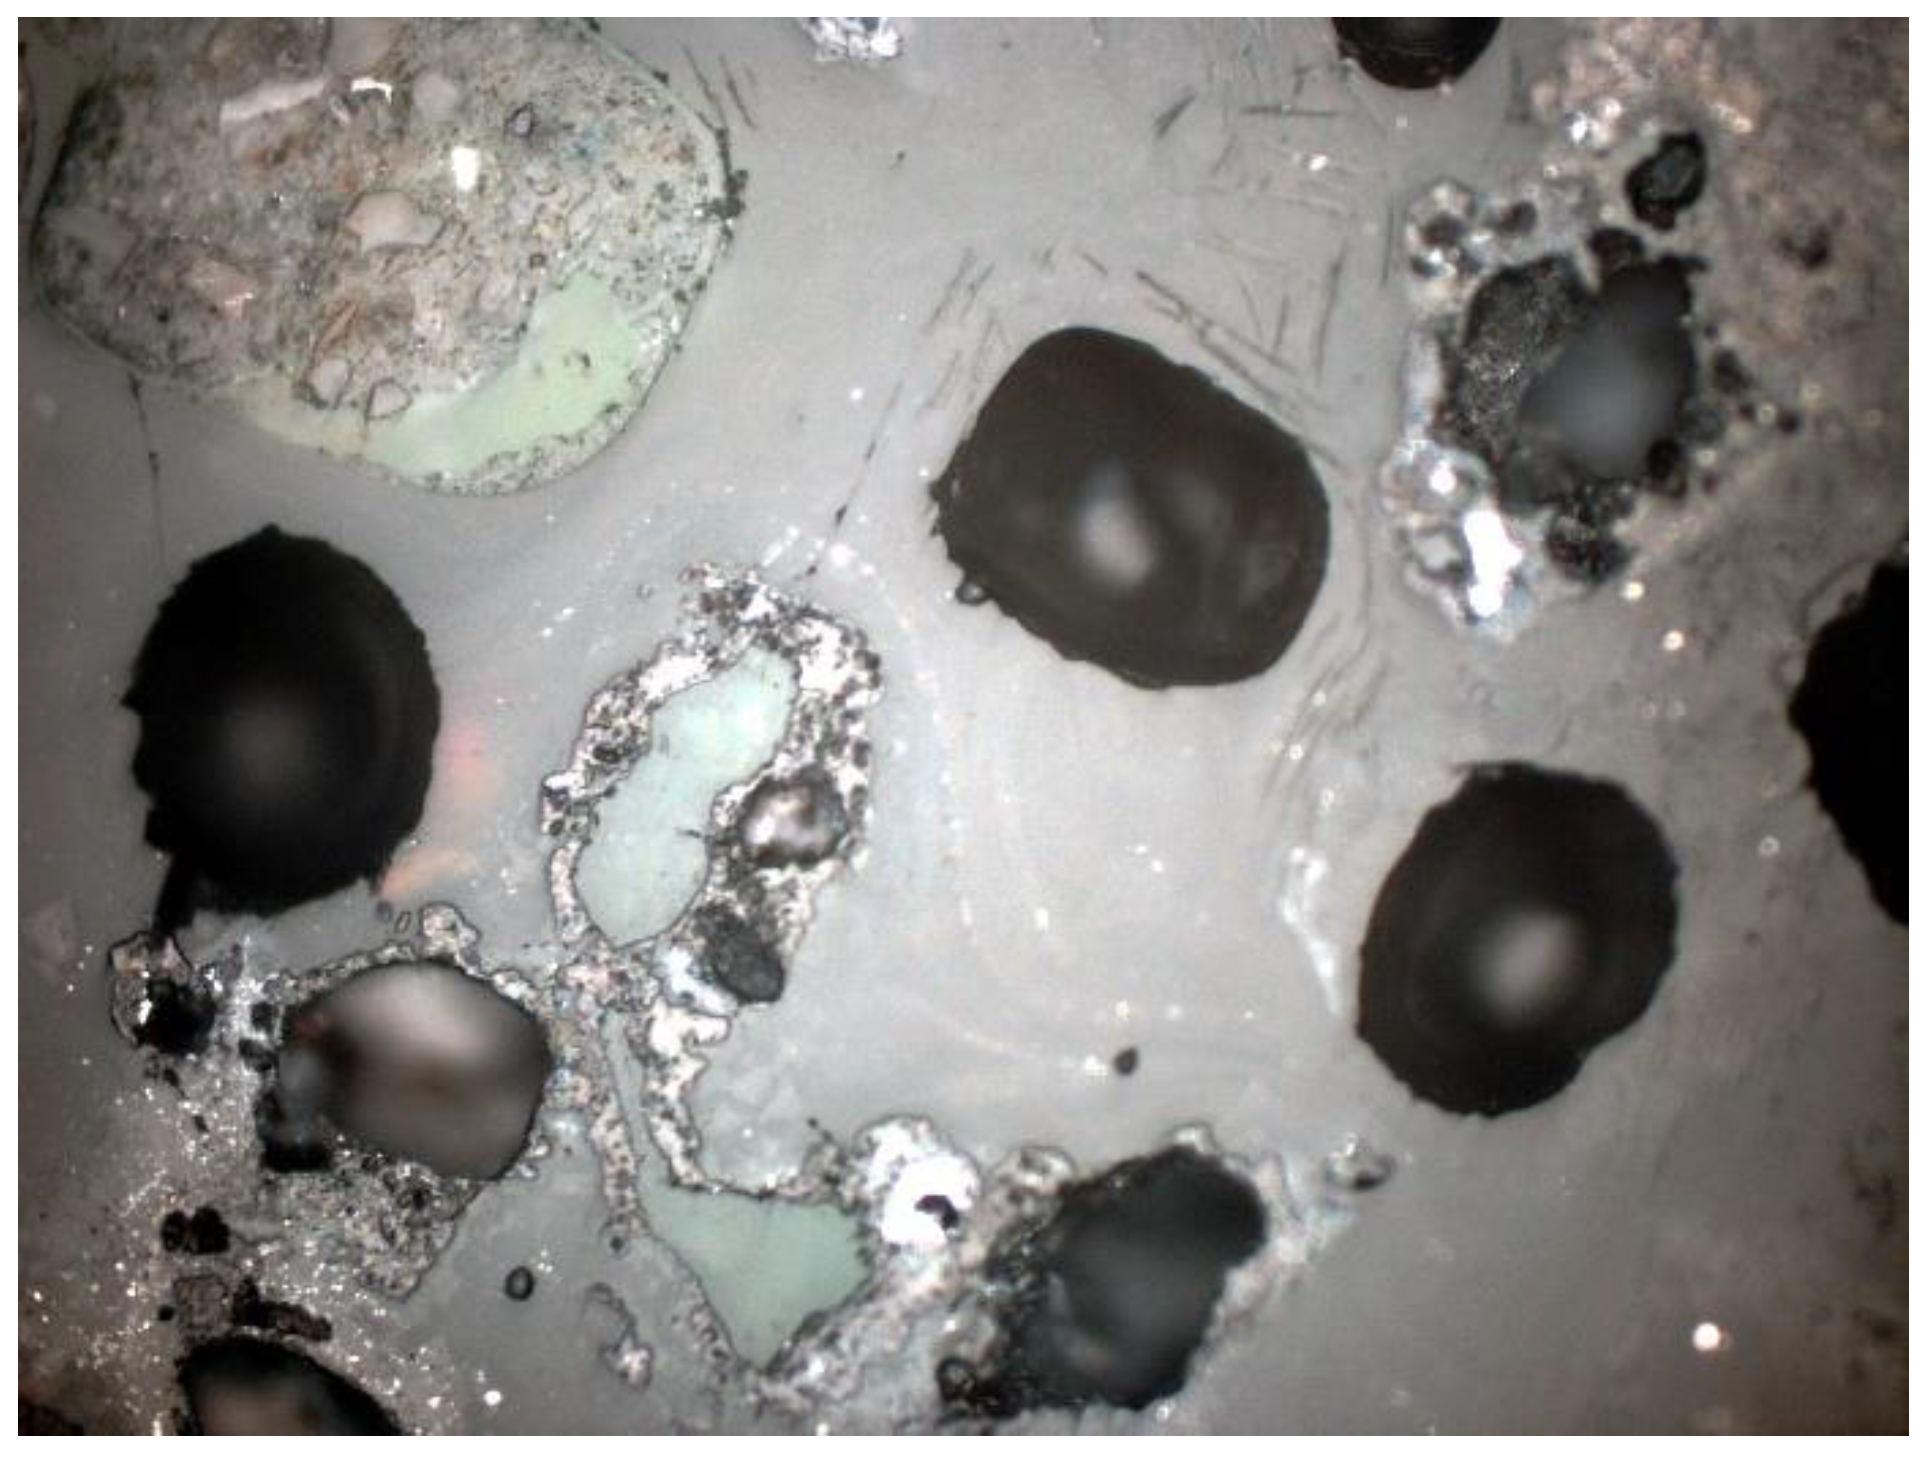
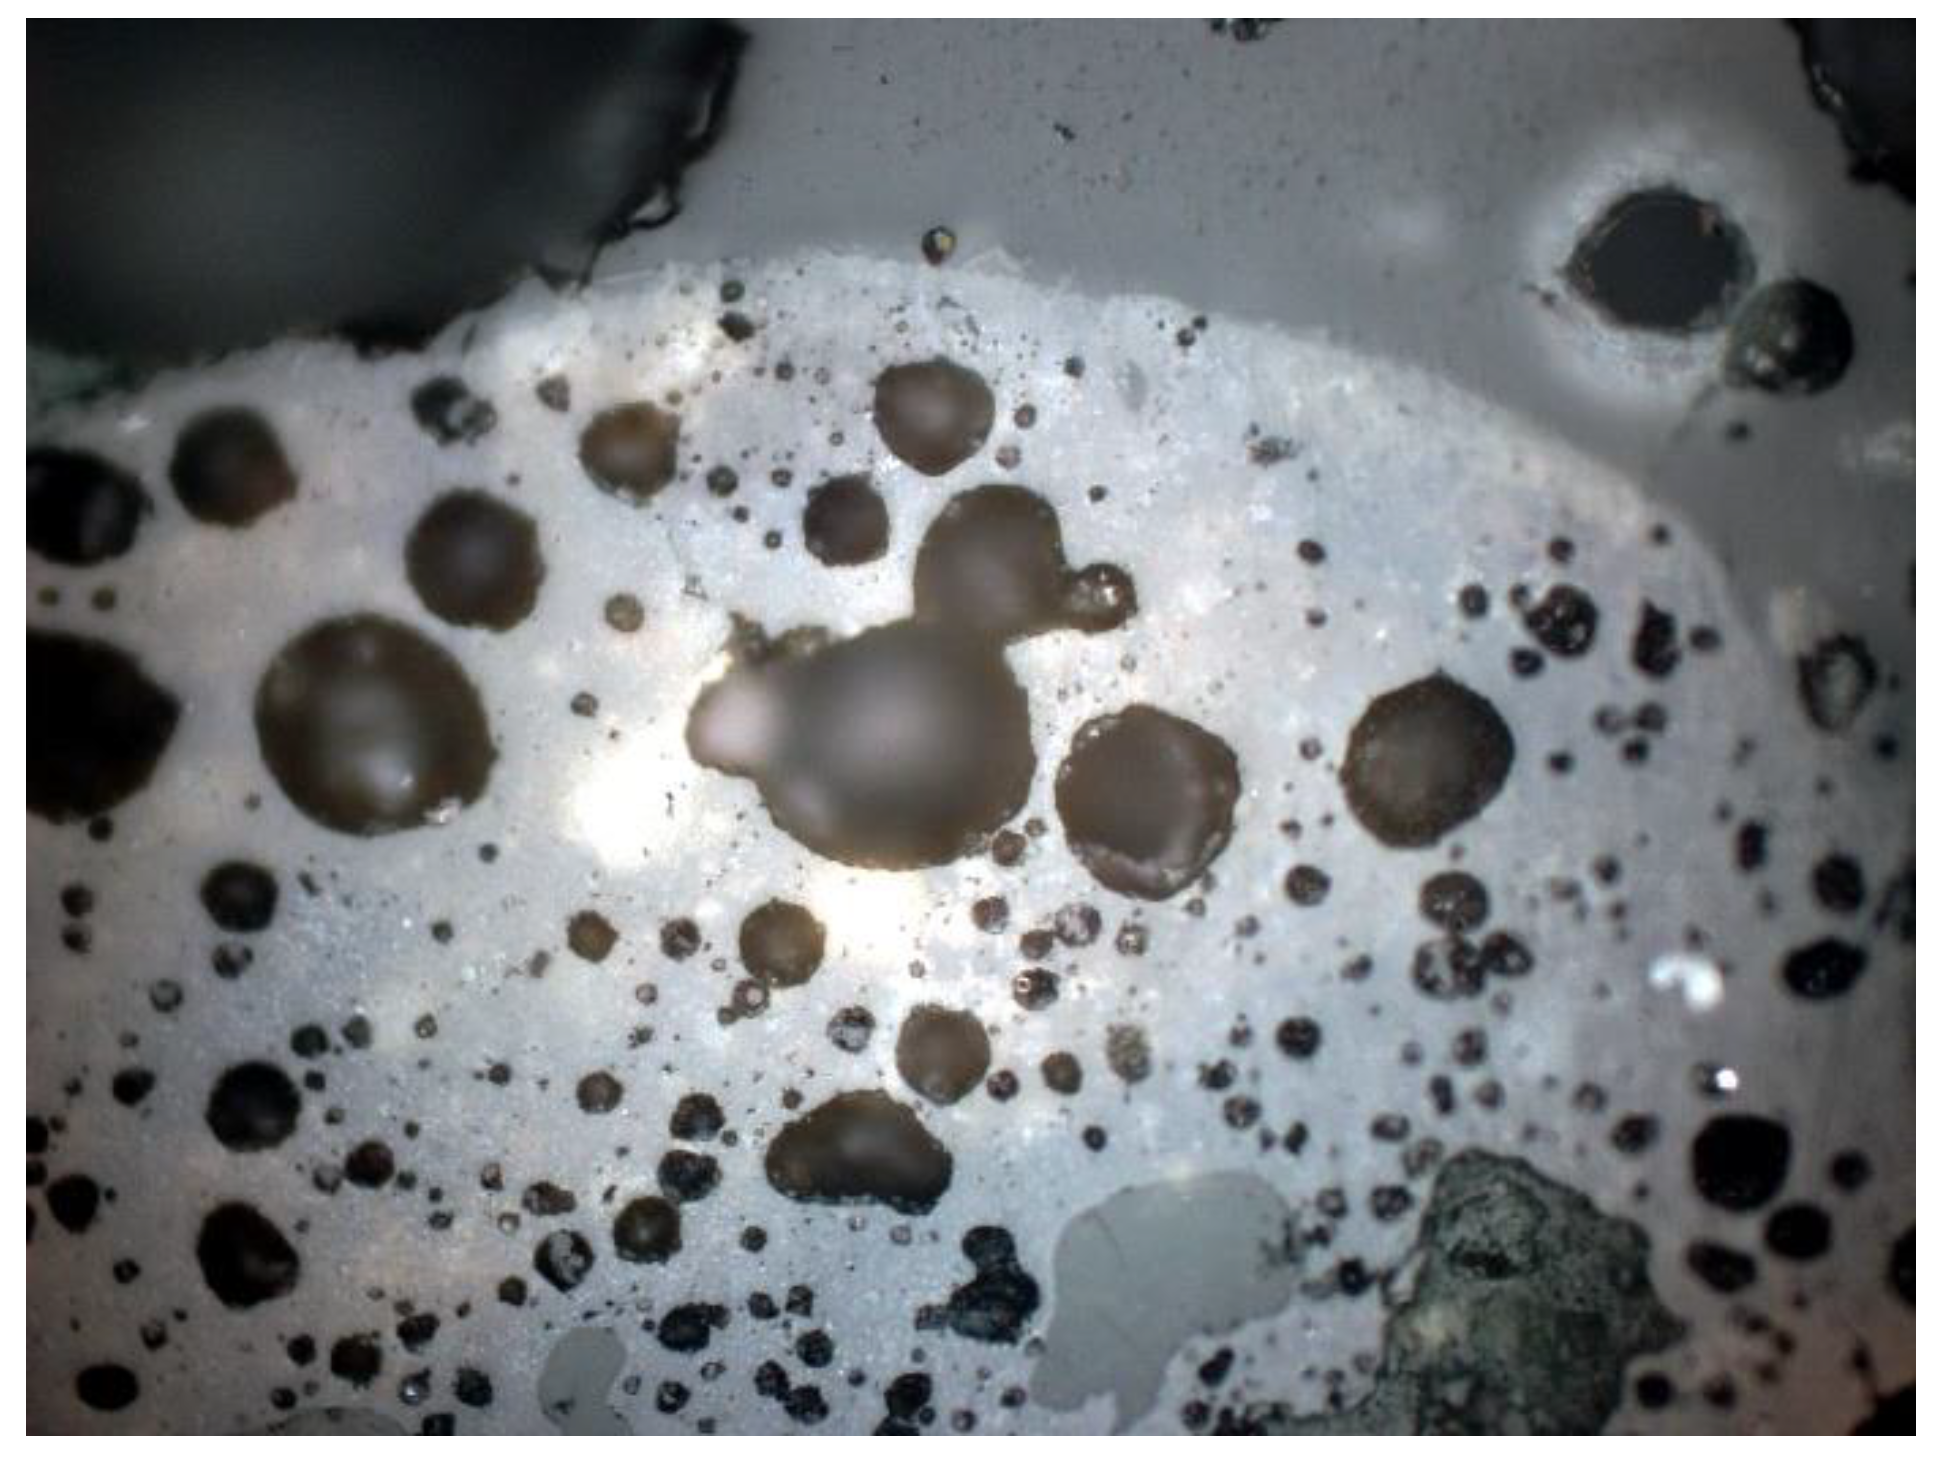
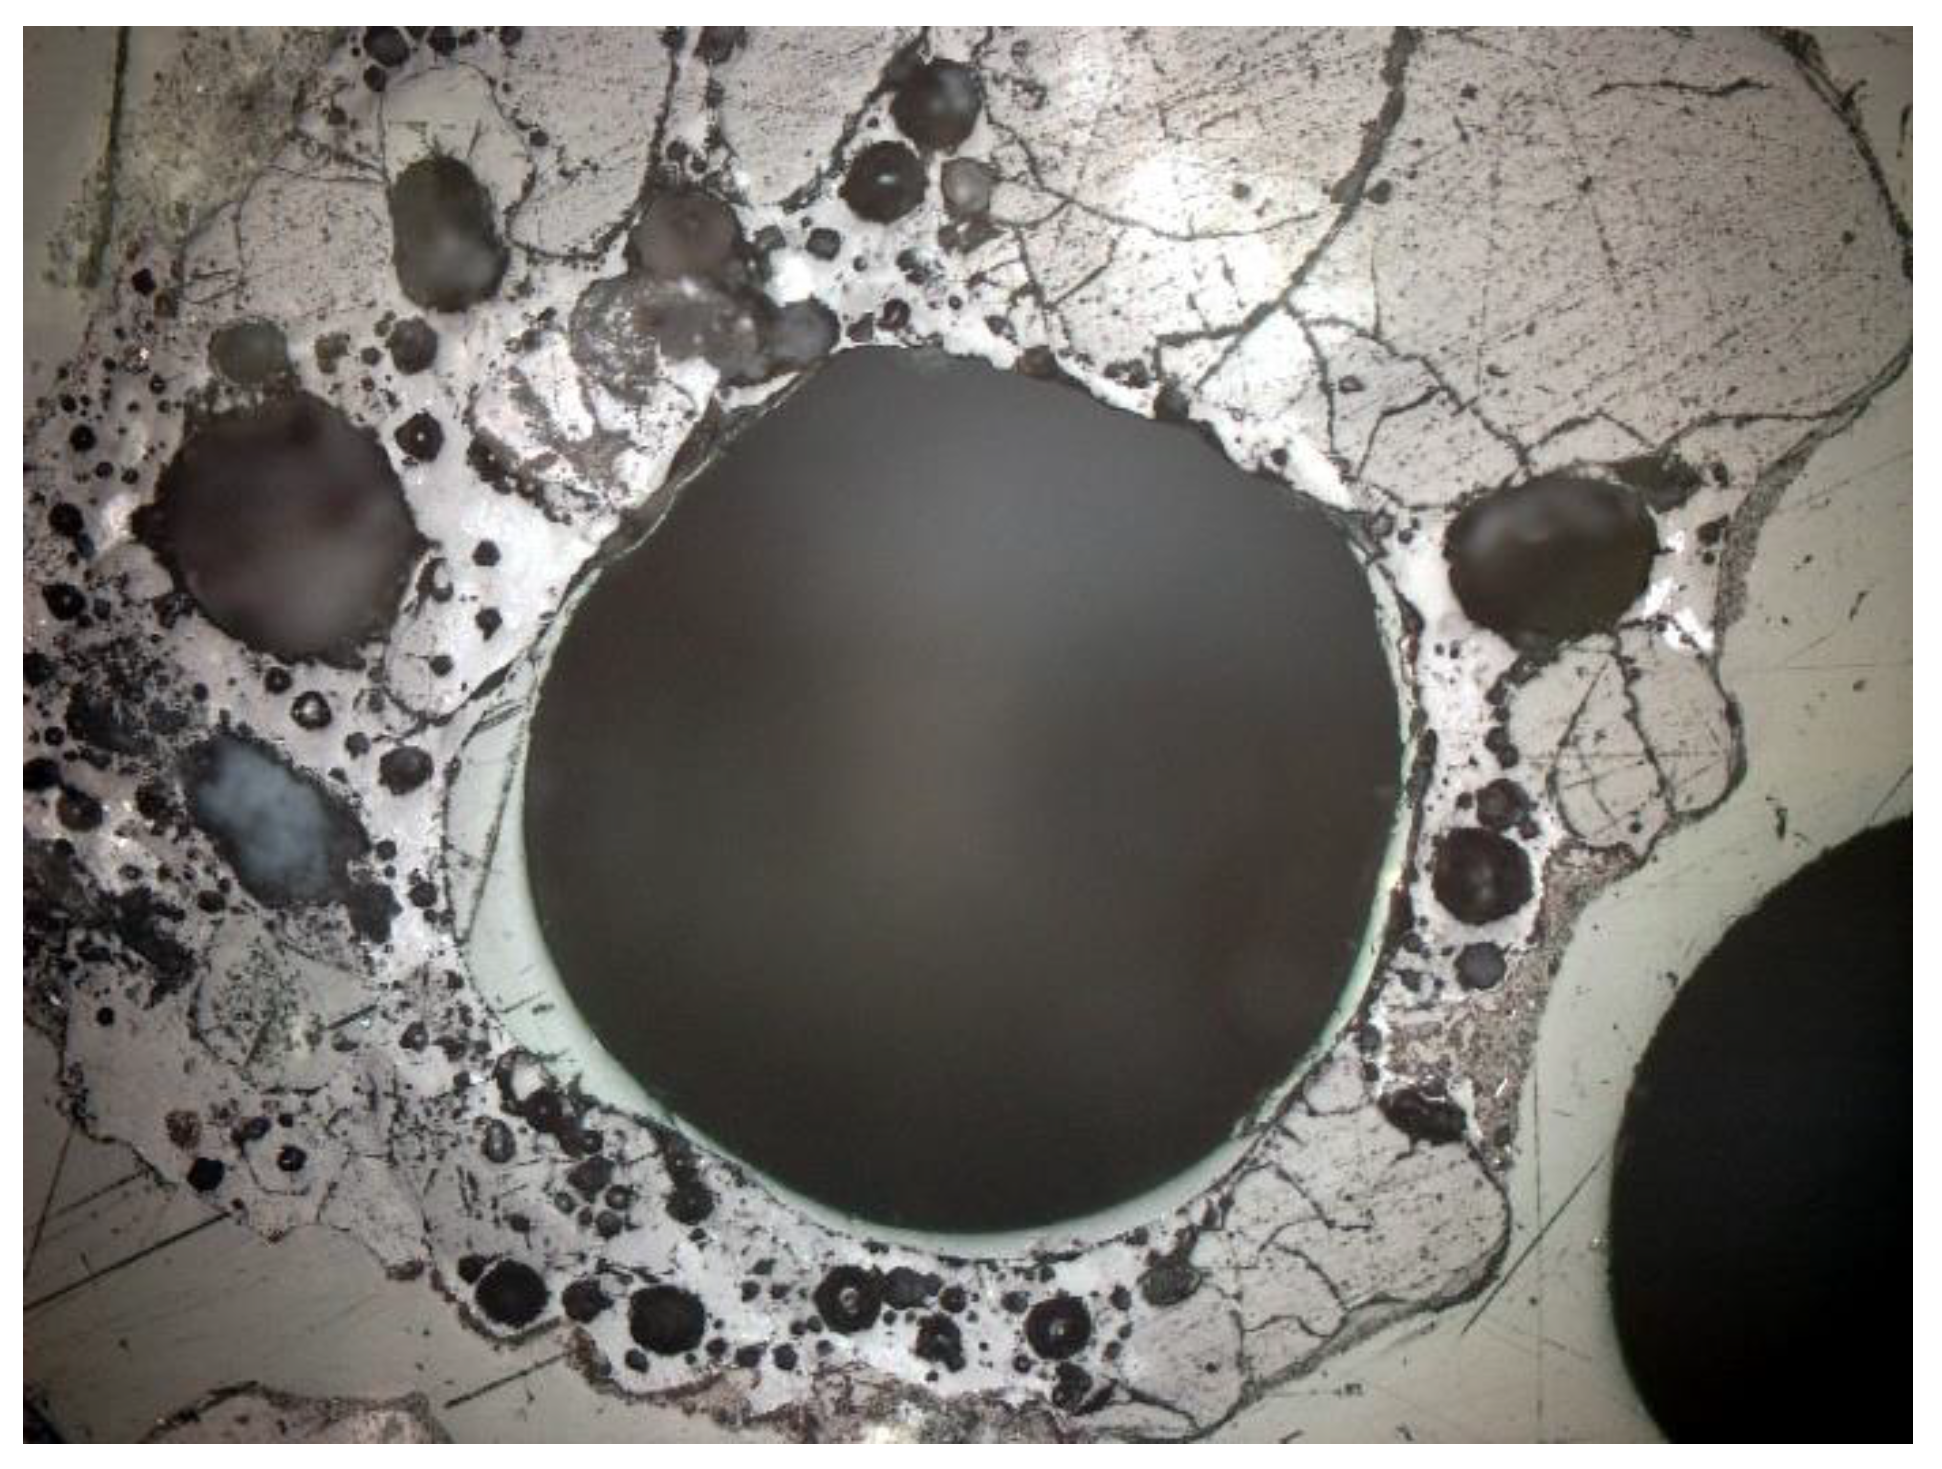
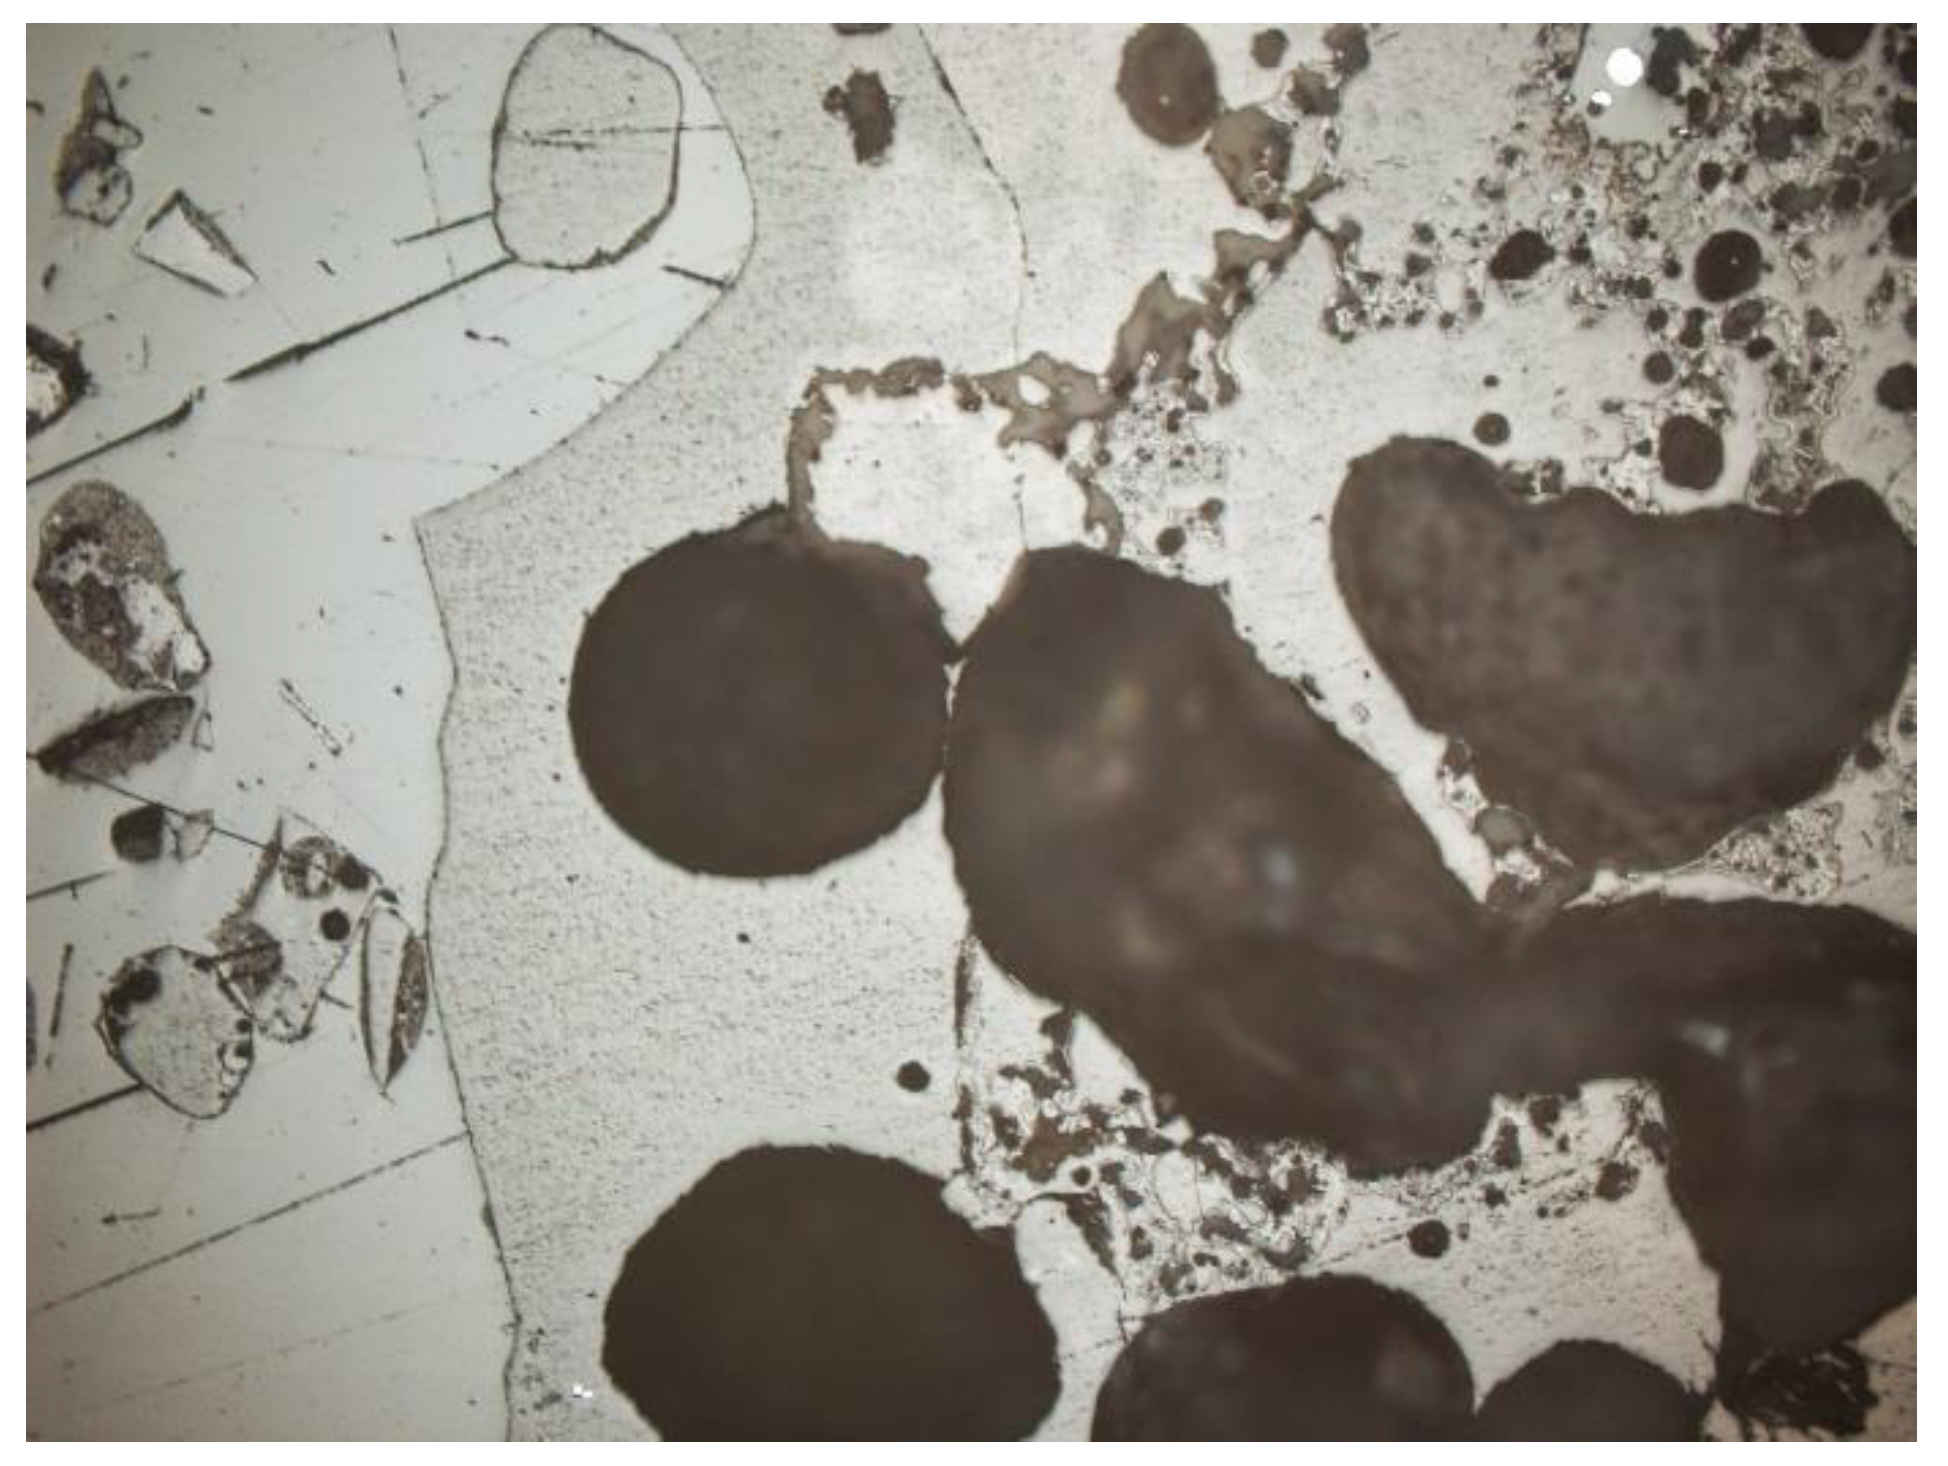
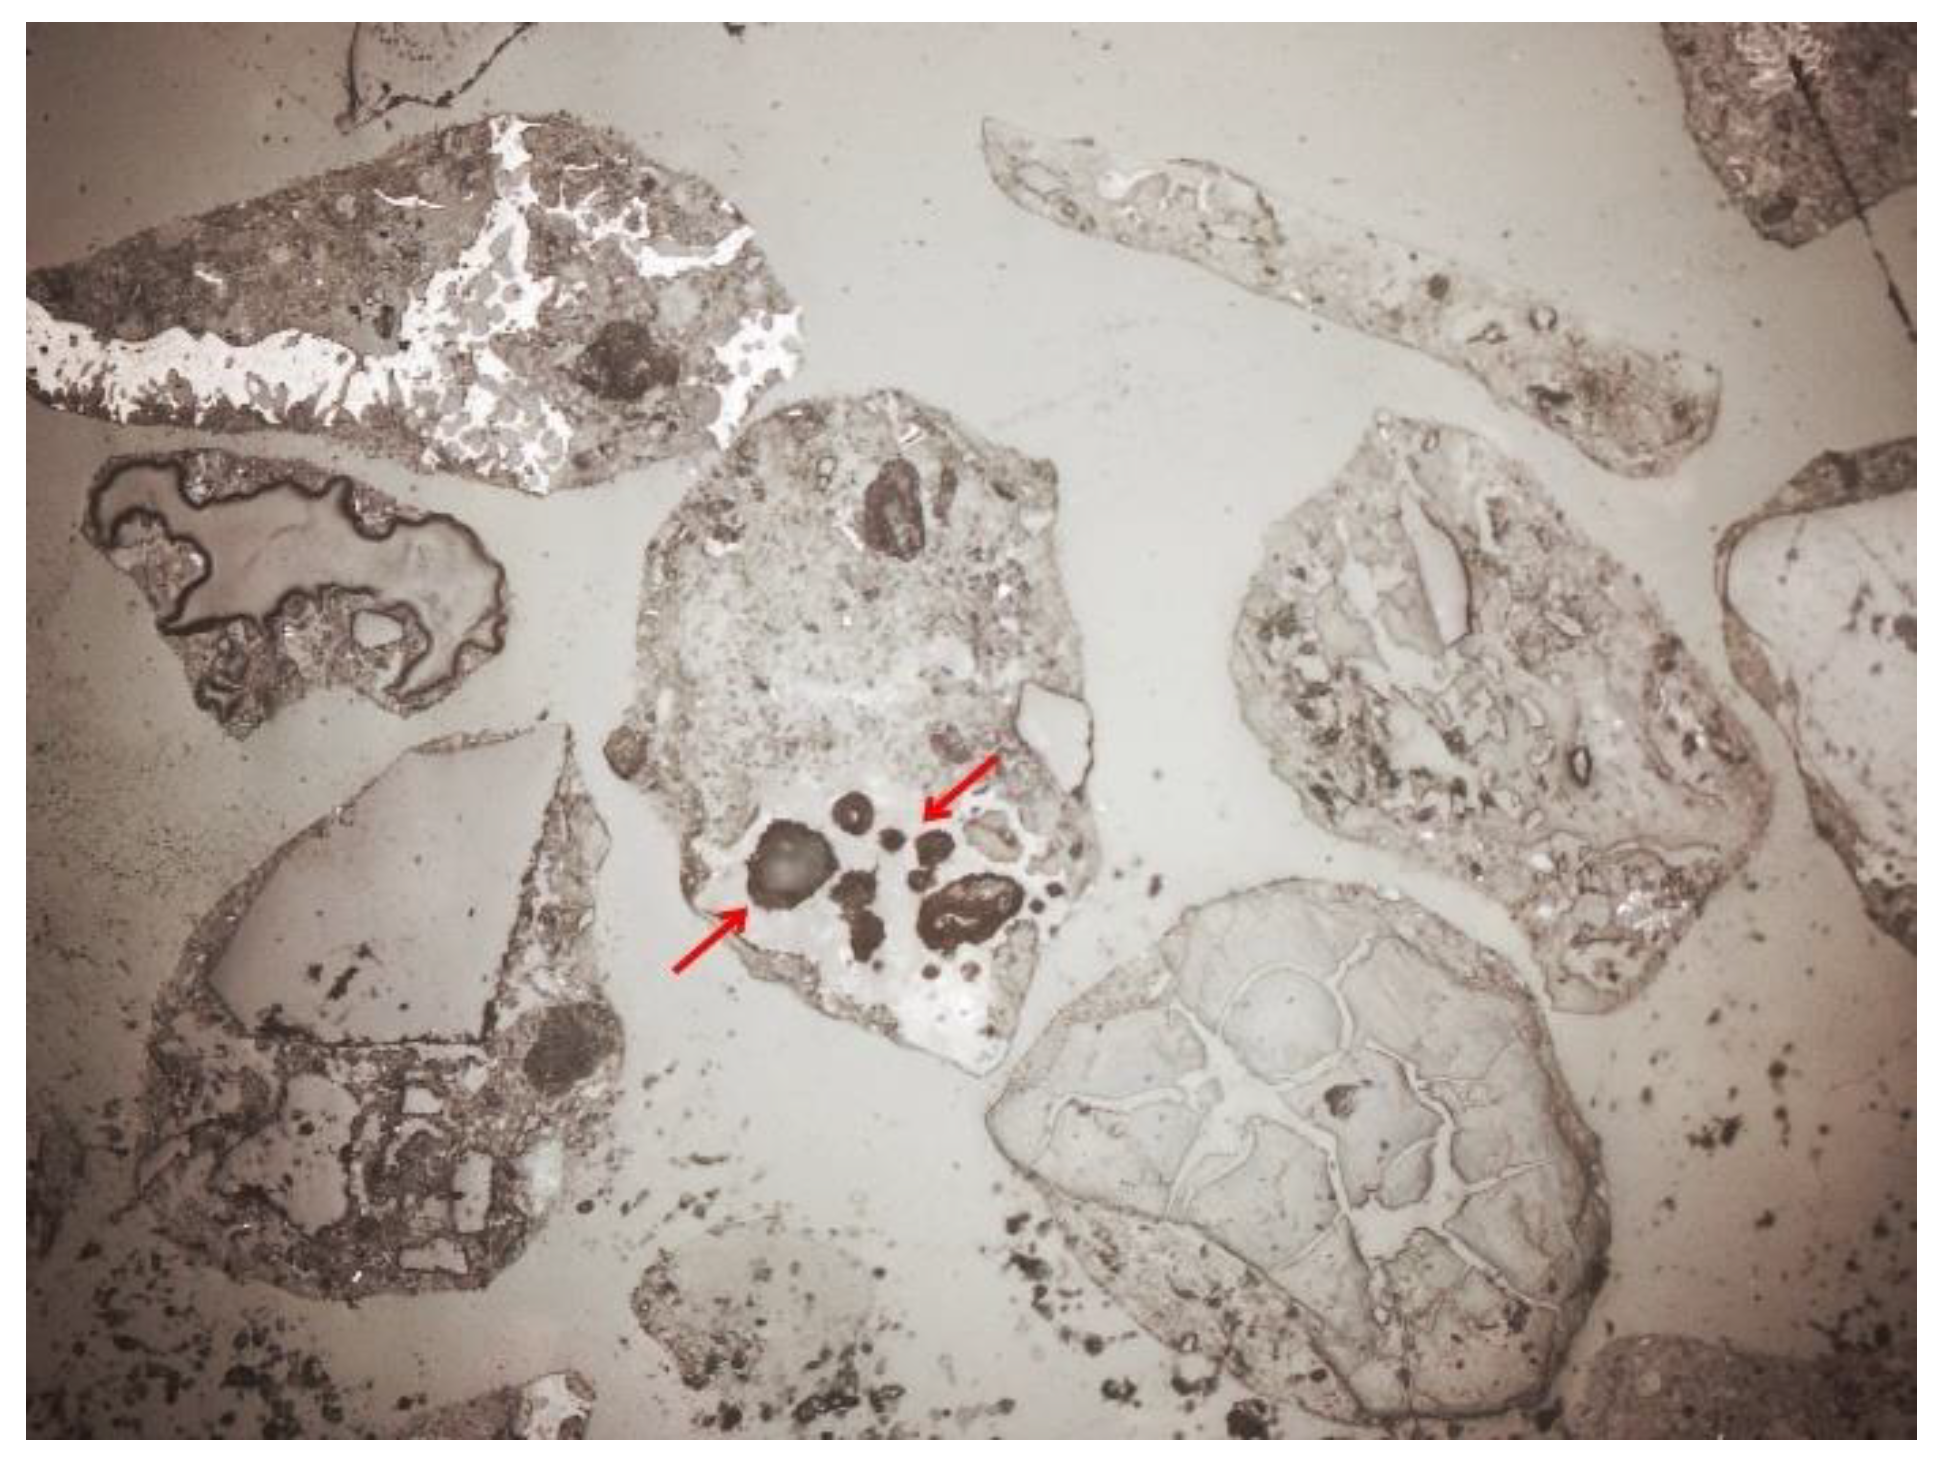
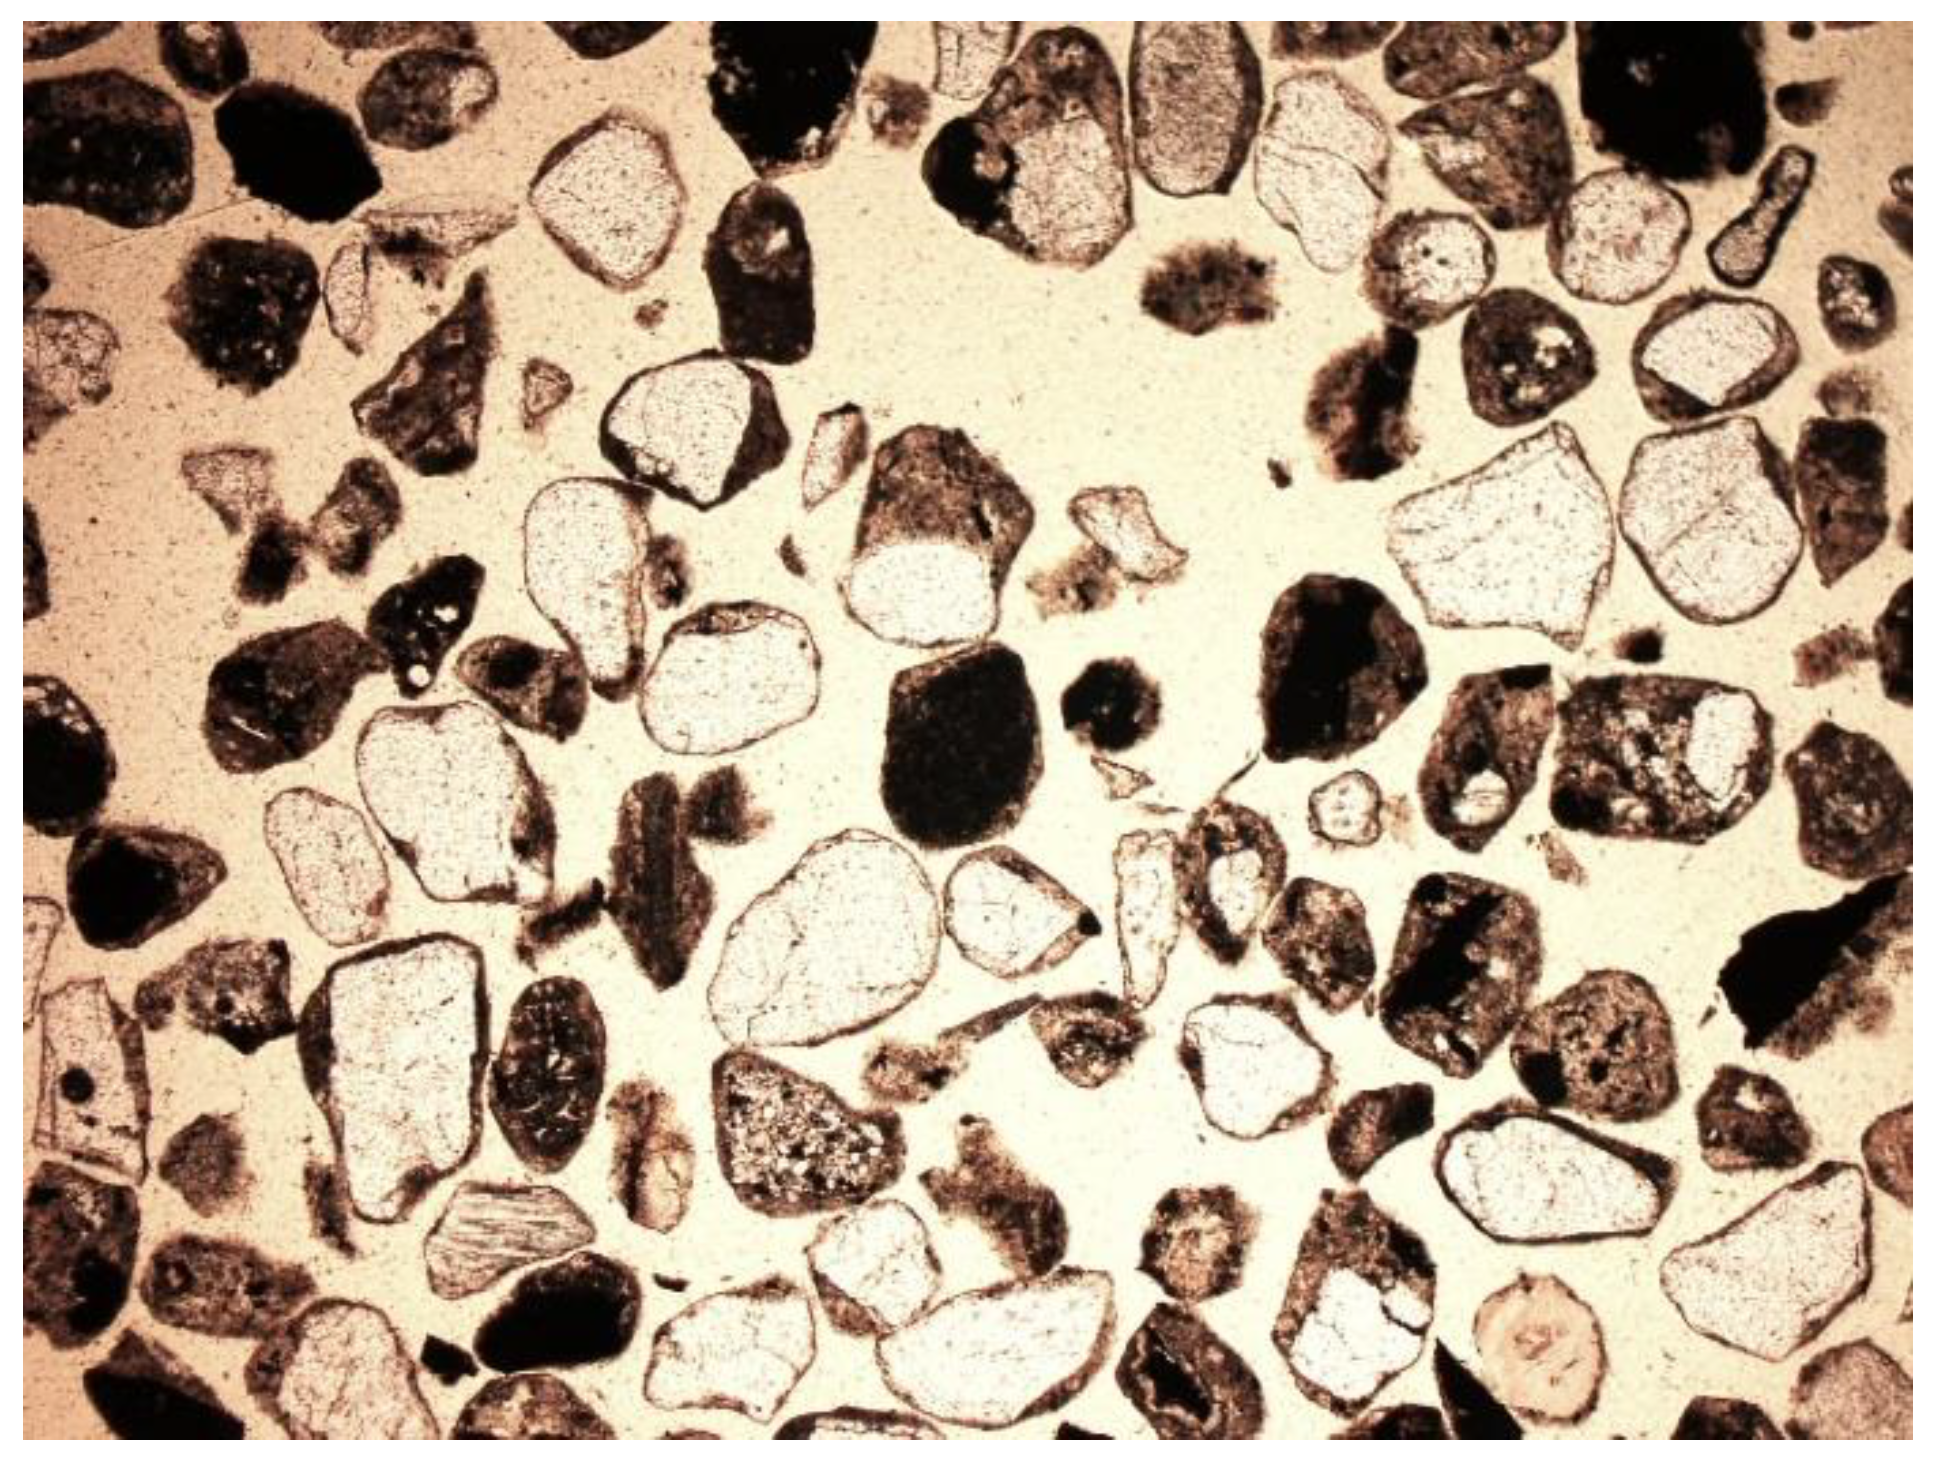
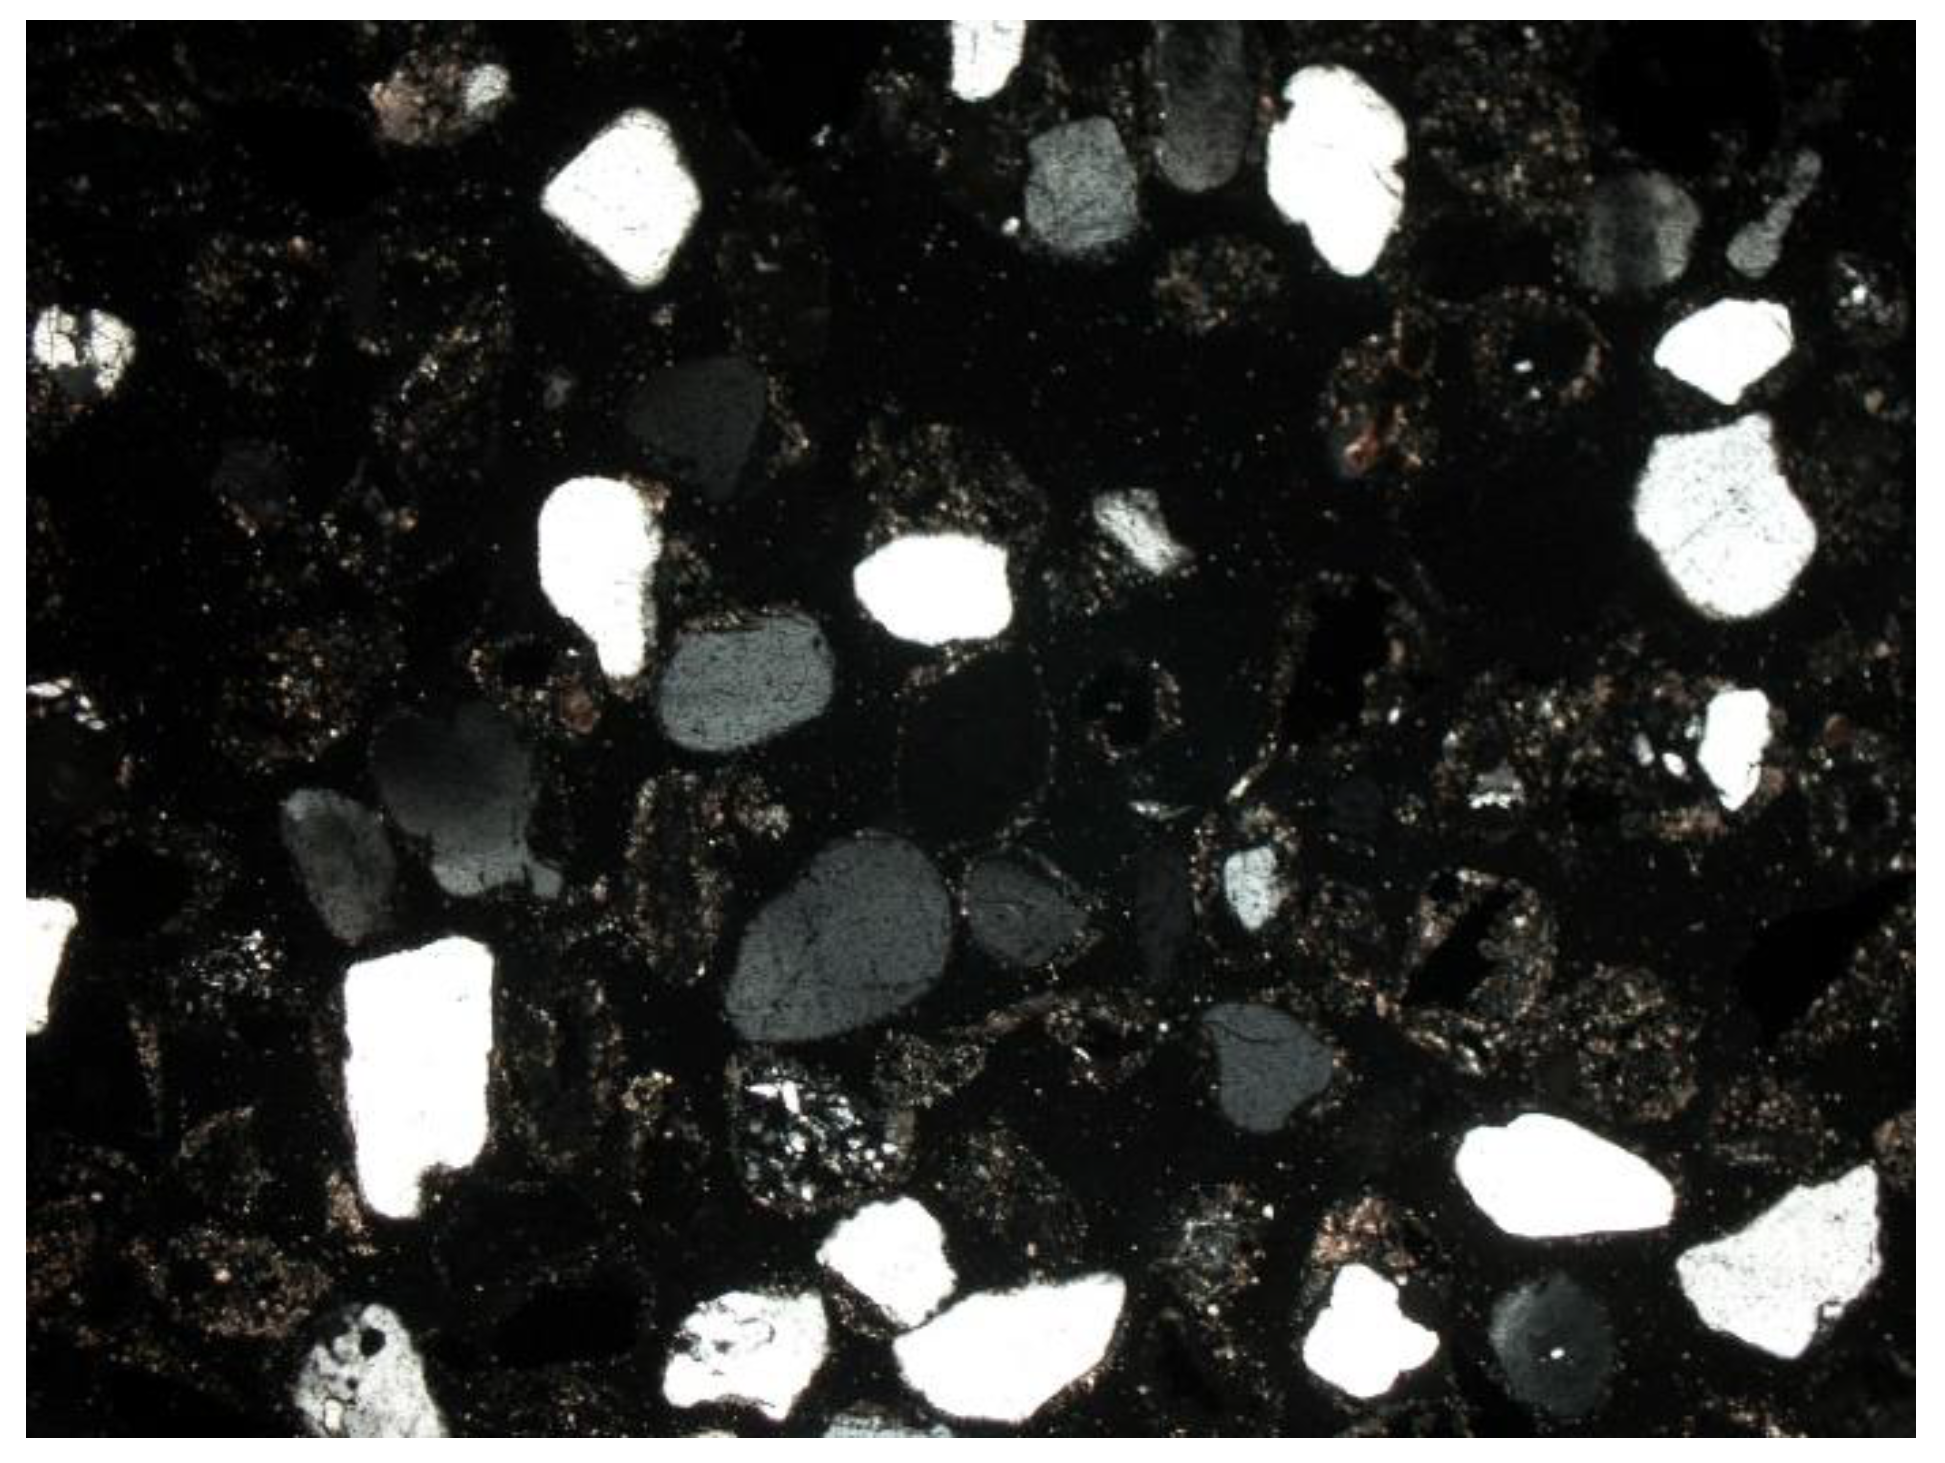
3.2. Microscopic Analysis—Qualitative Description

On the basis of the conducted microscopic observations, it was found that all groups of slag and ash (SP1, SP2, and SP3) had similar characteristics in terms of structure, formation, textual features and composition. Moreover, all samples were rich in the amorphous phase. The main mineral components of municipal slag were:
-
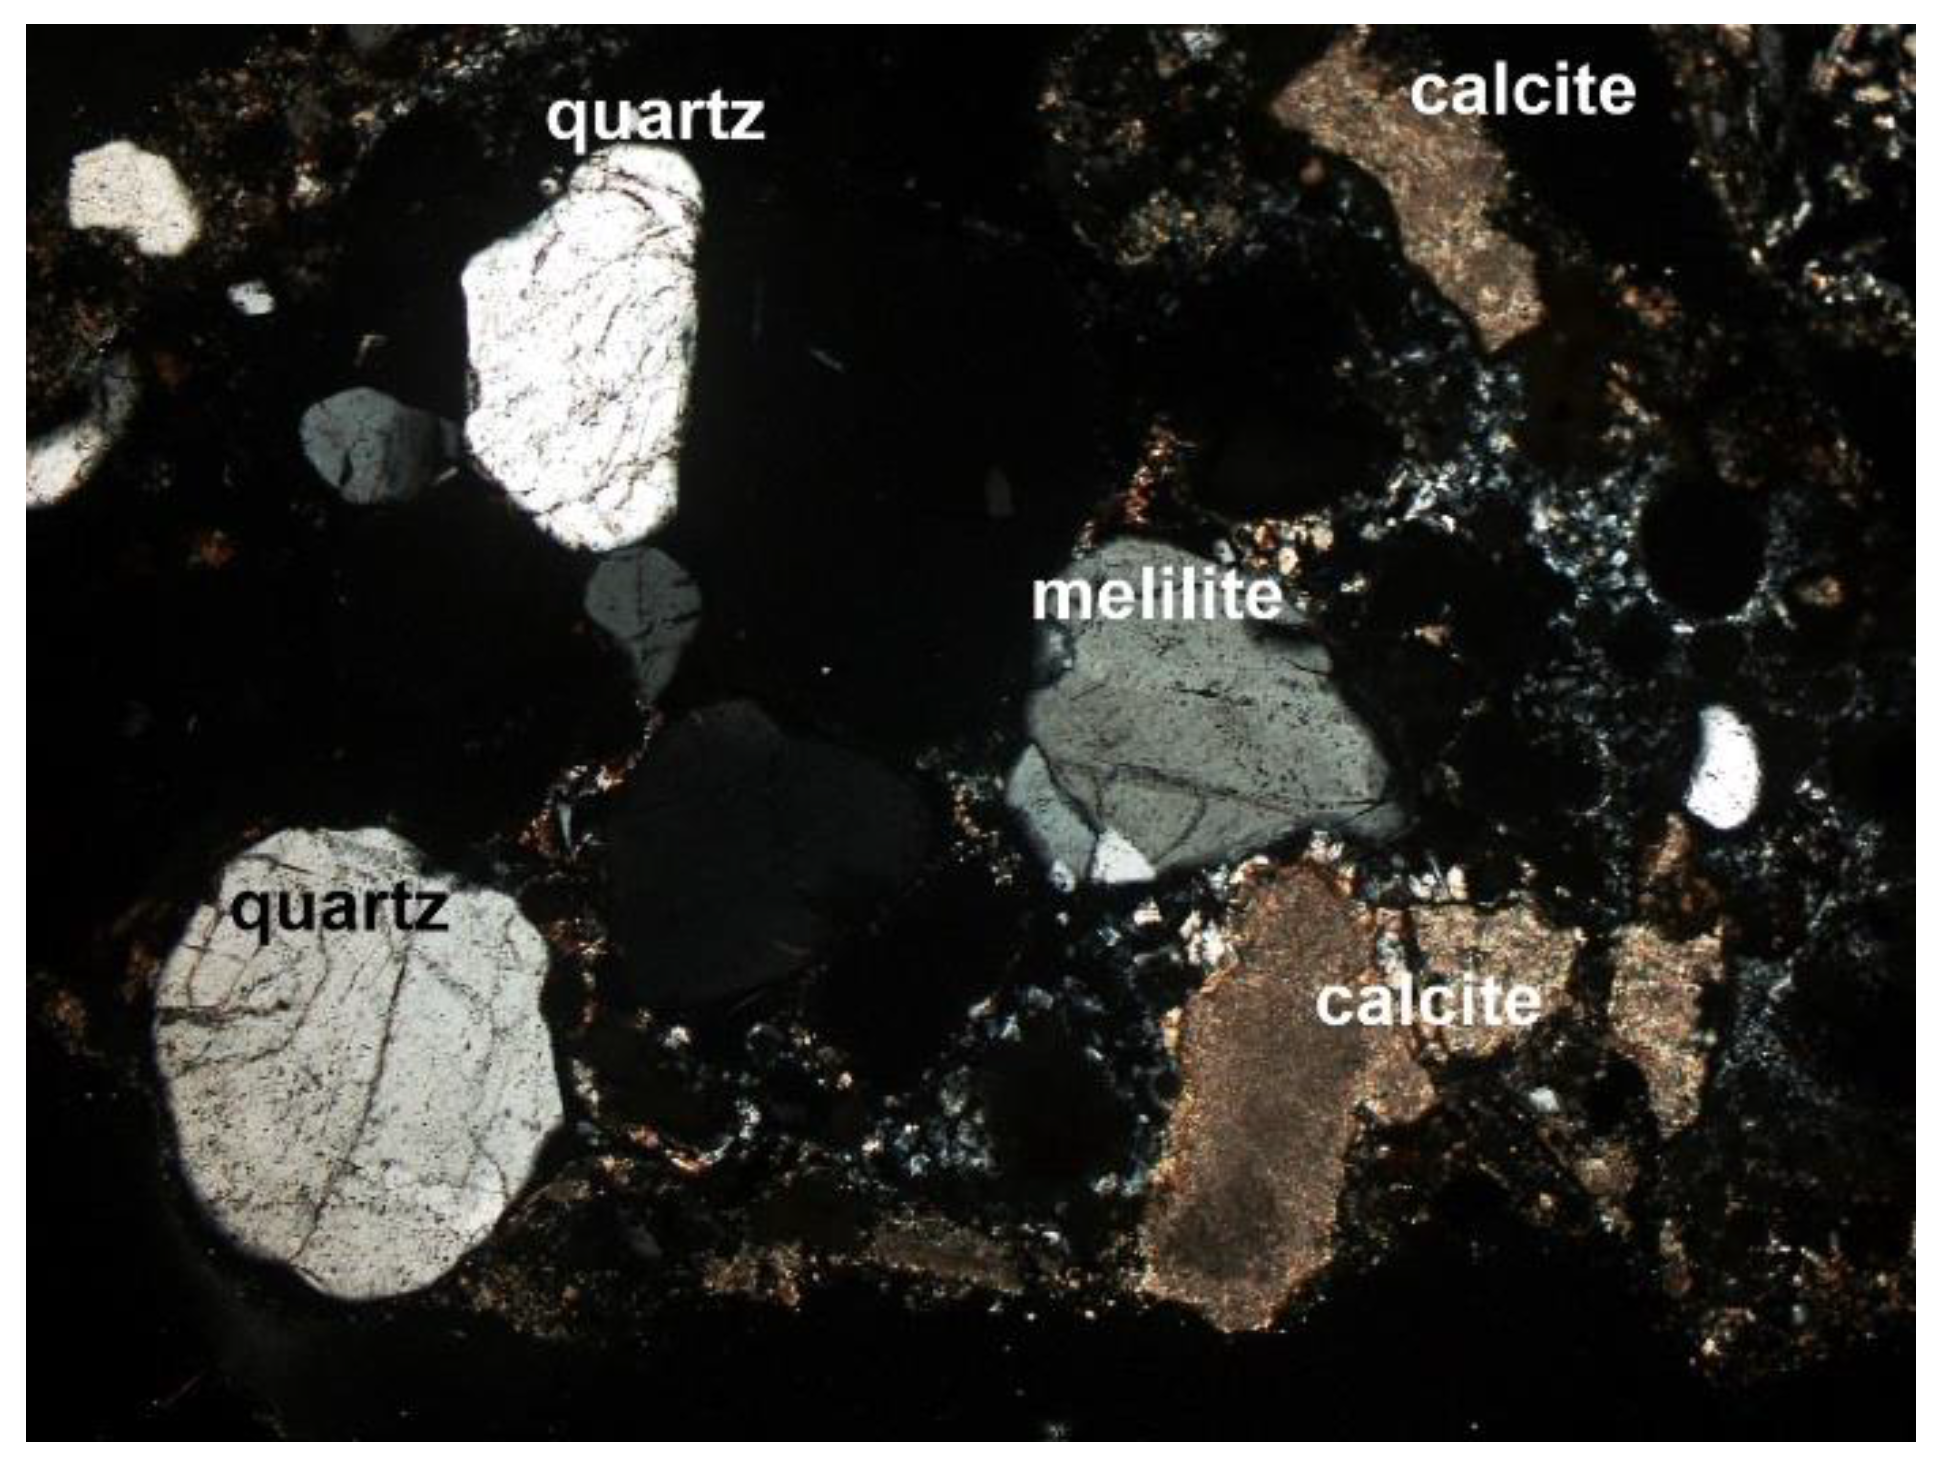
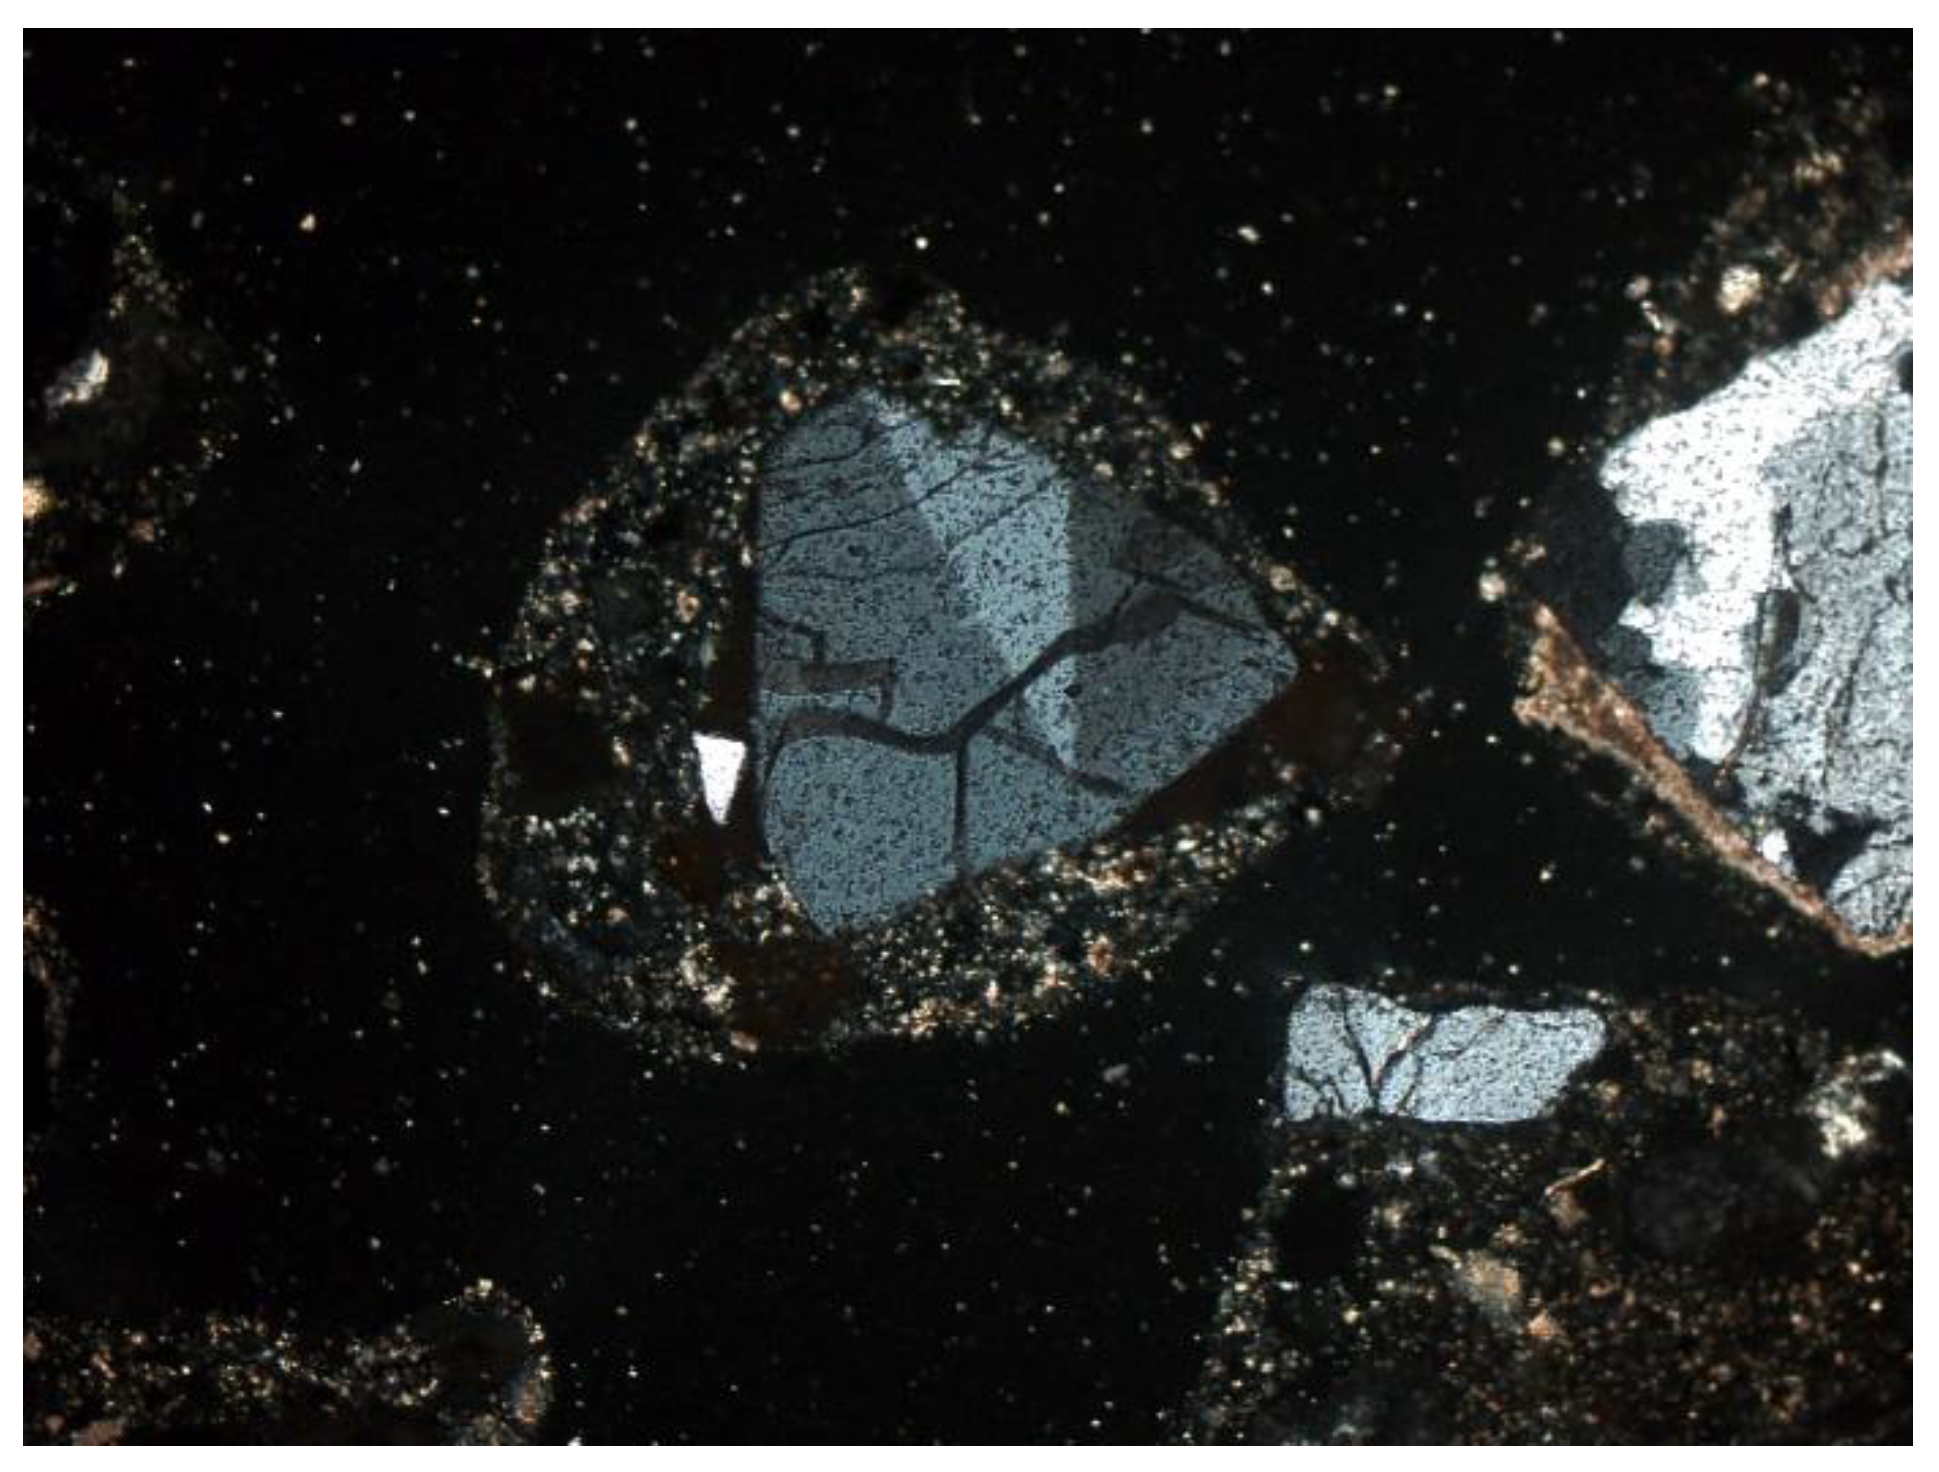
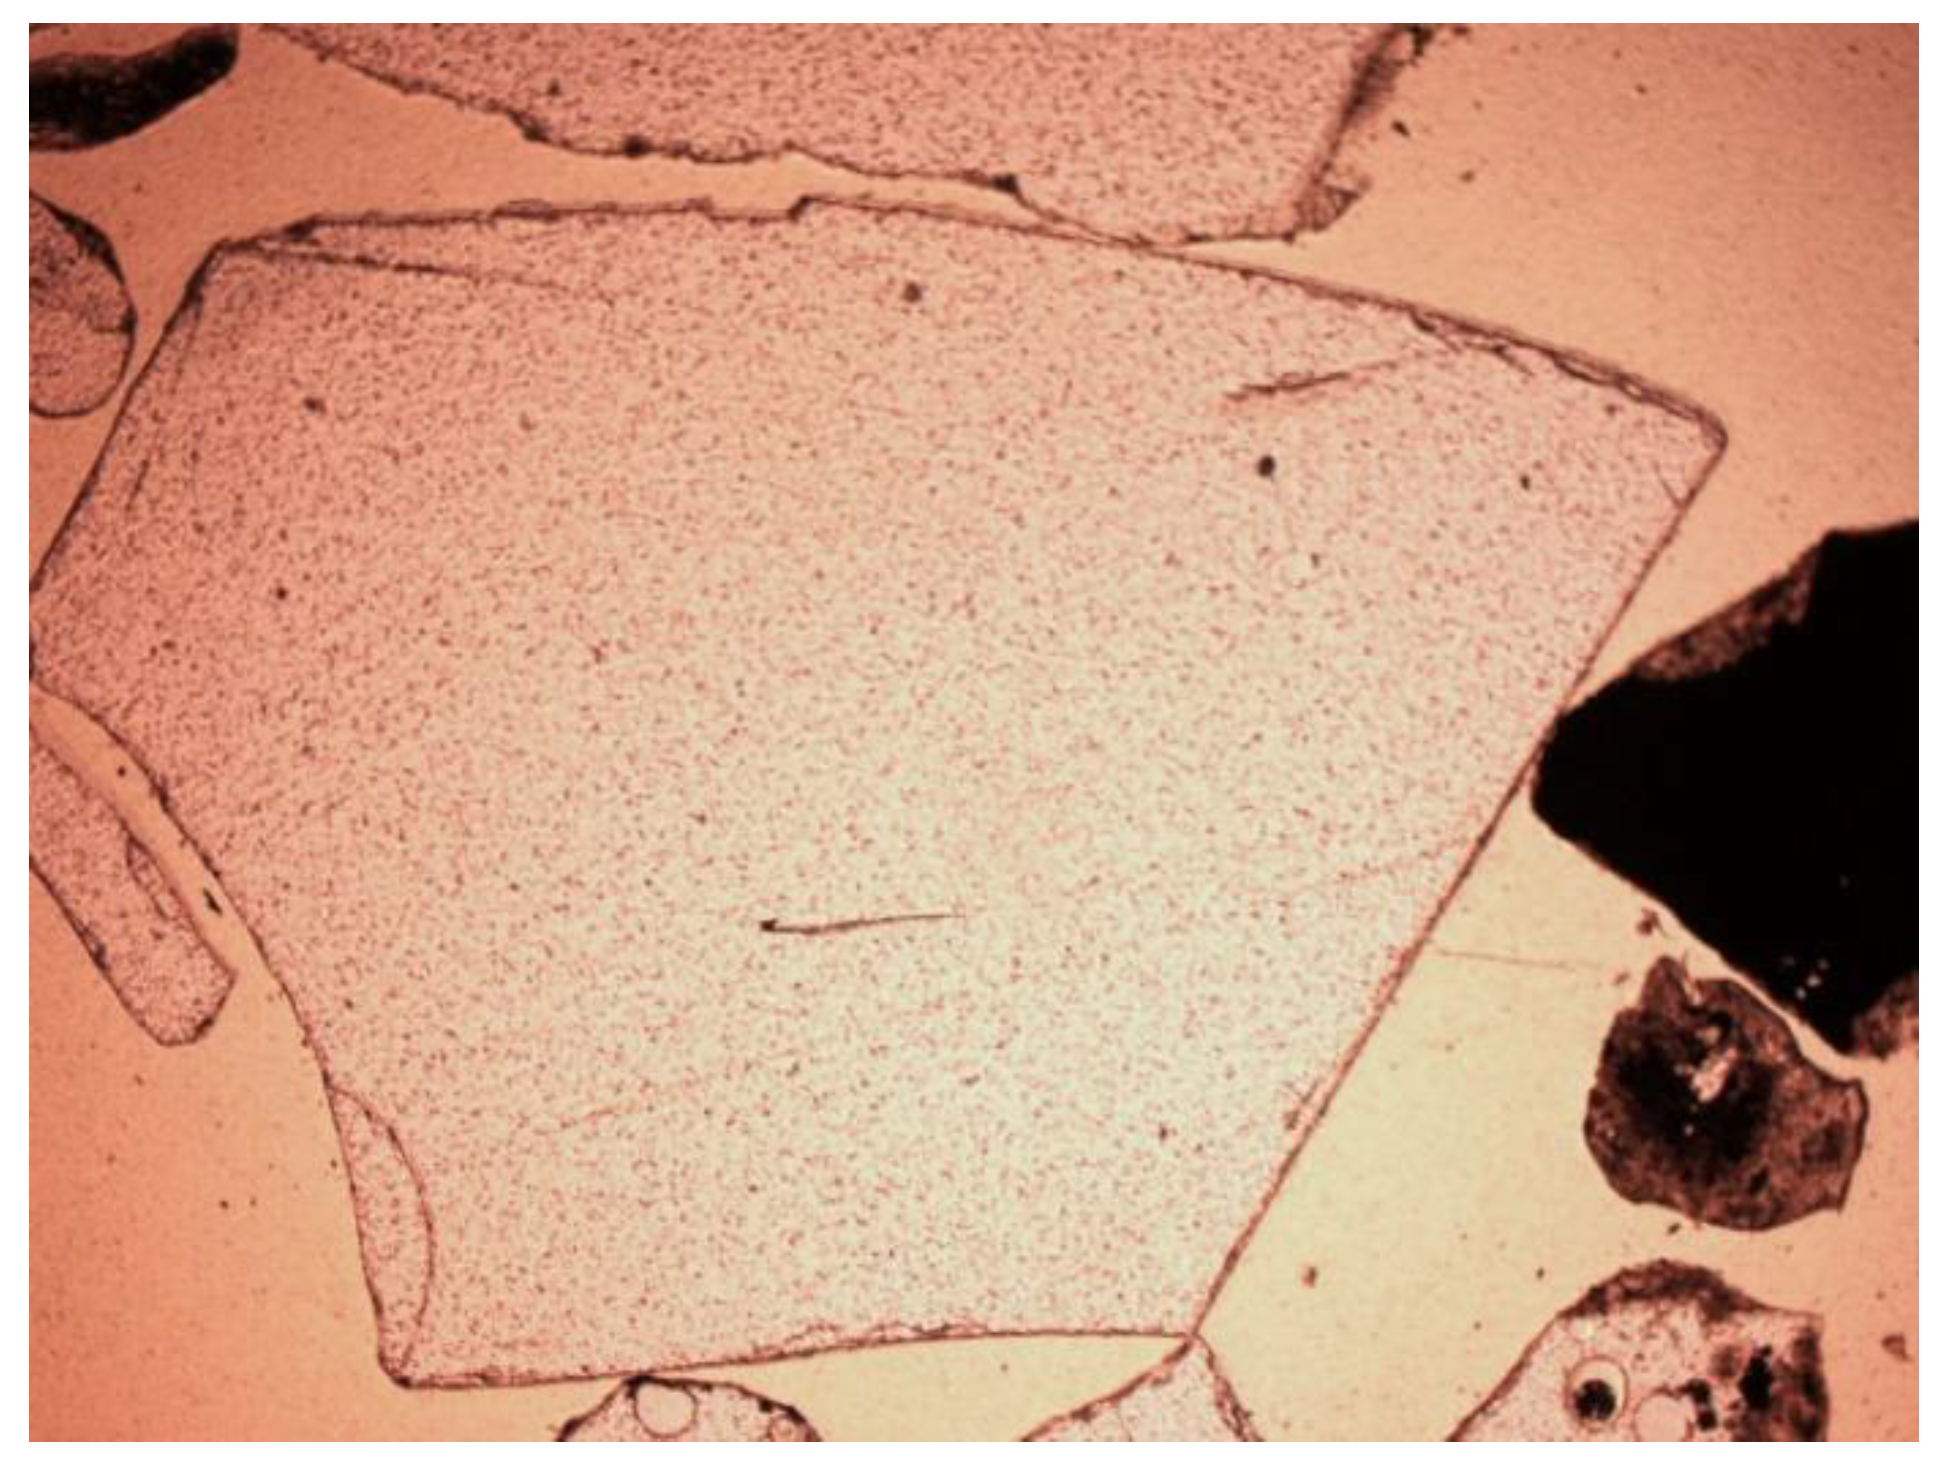
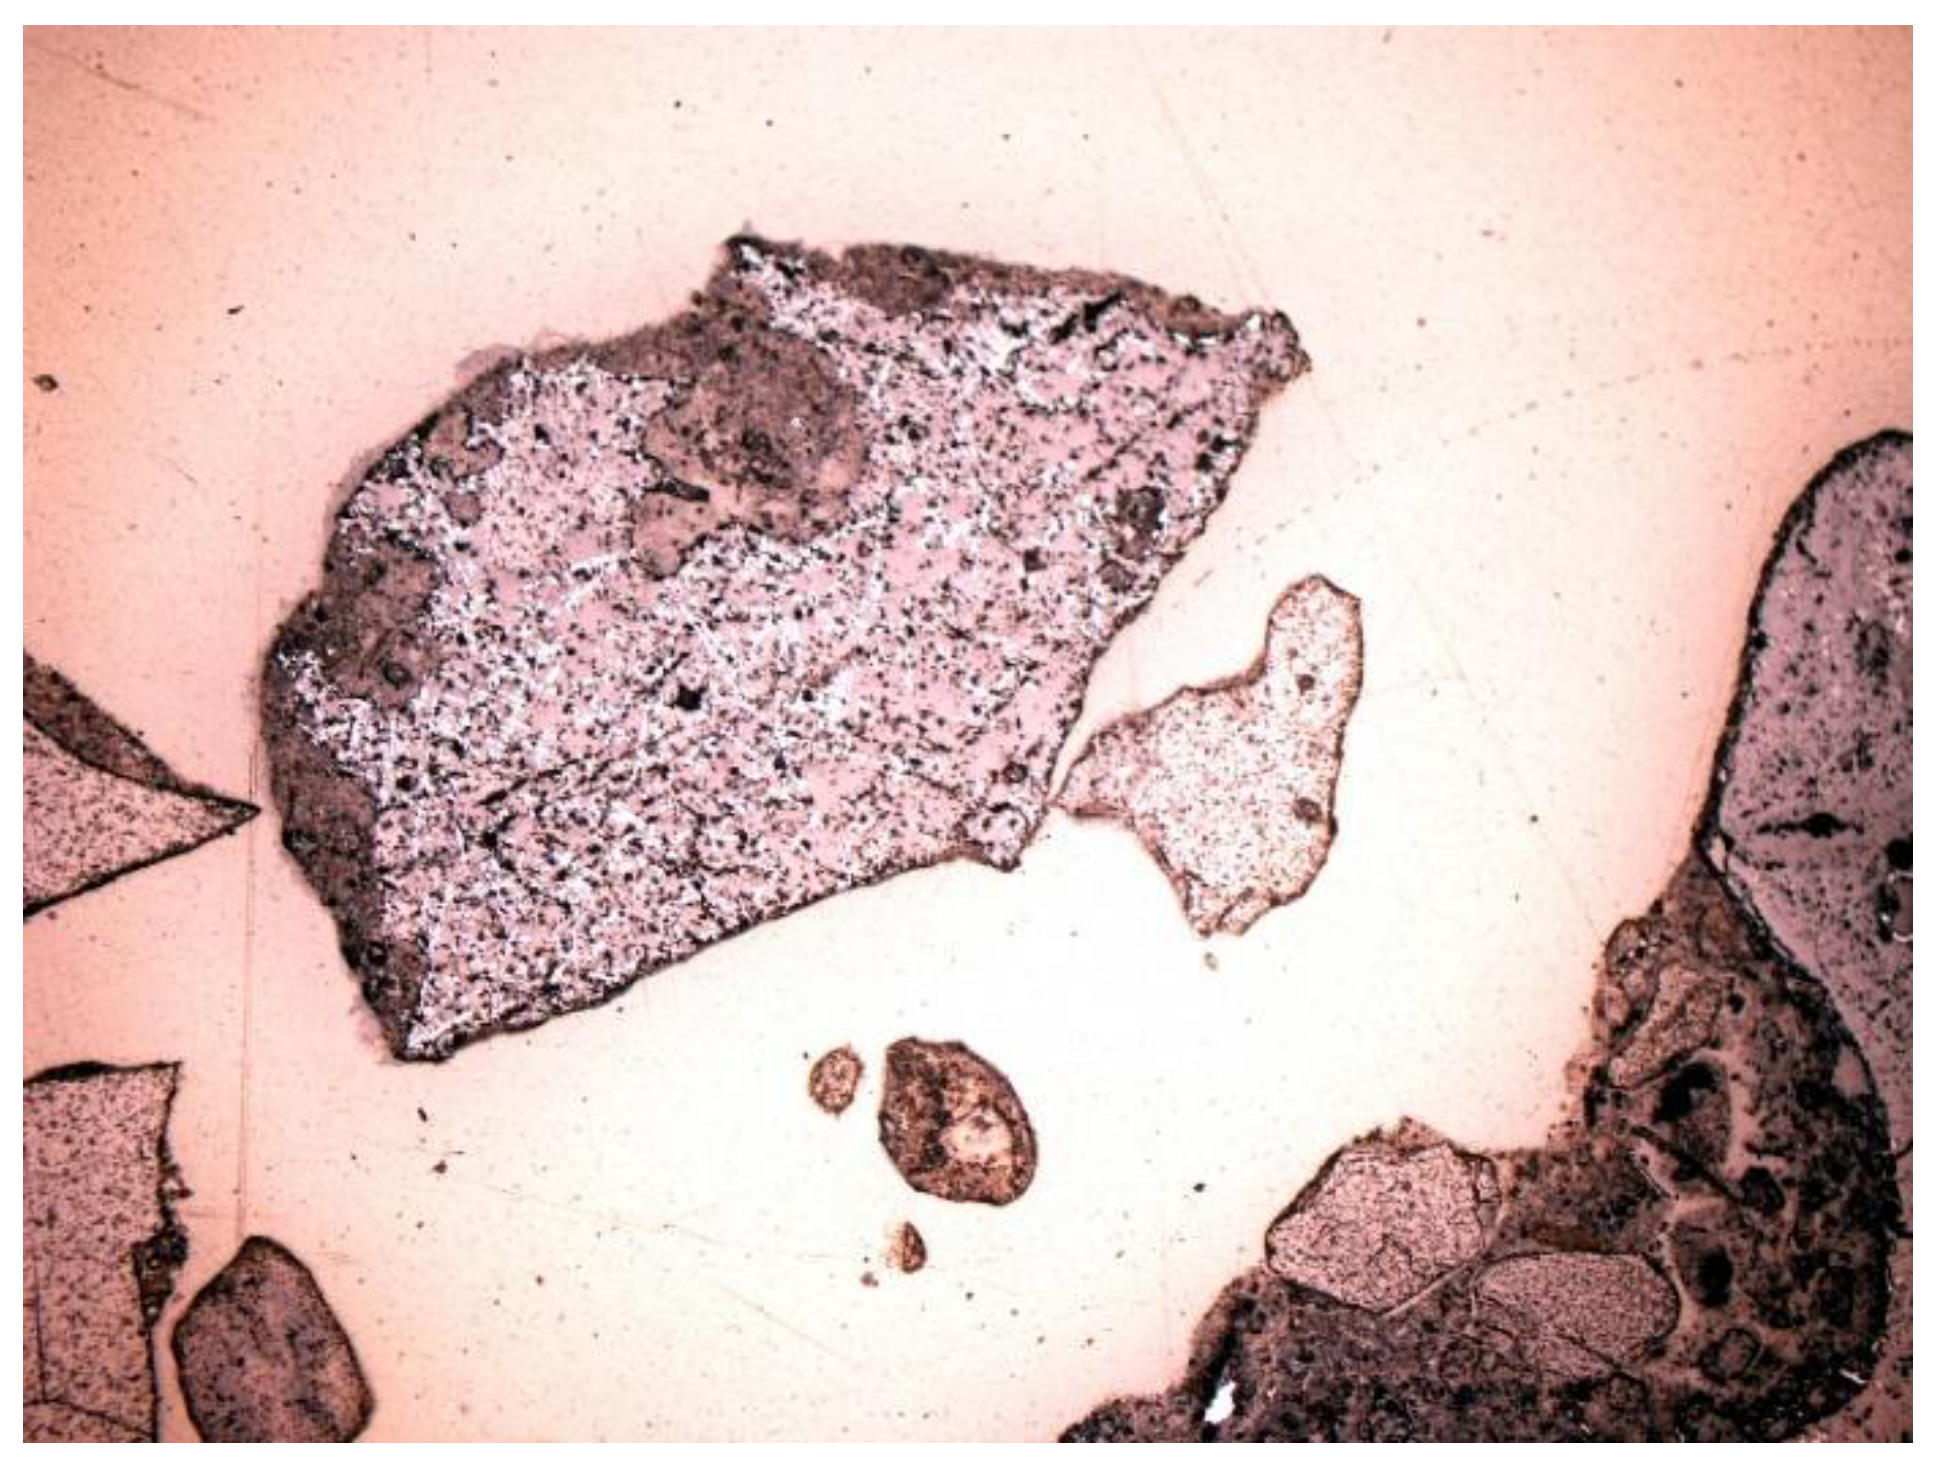
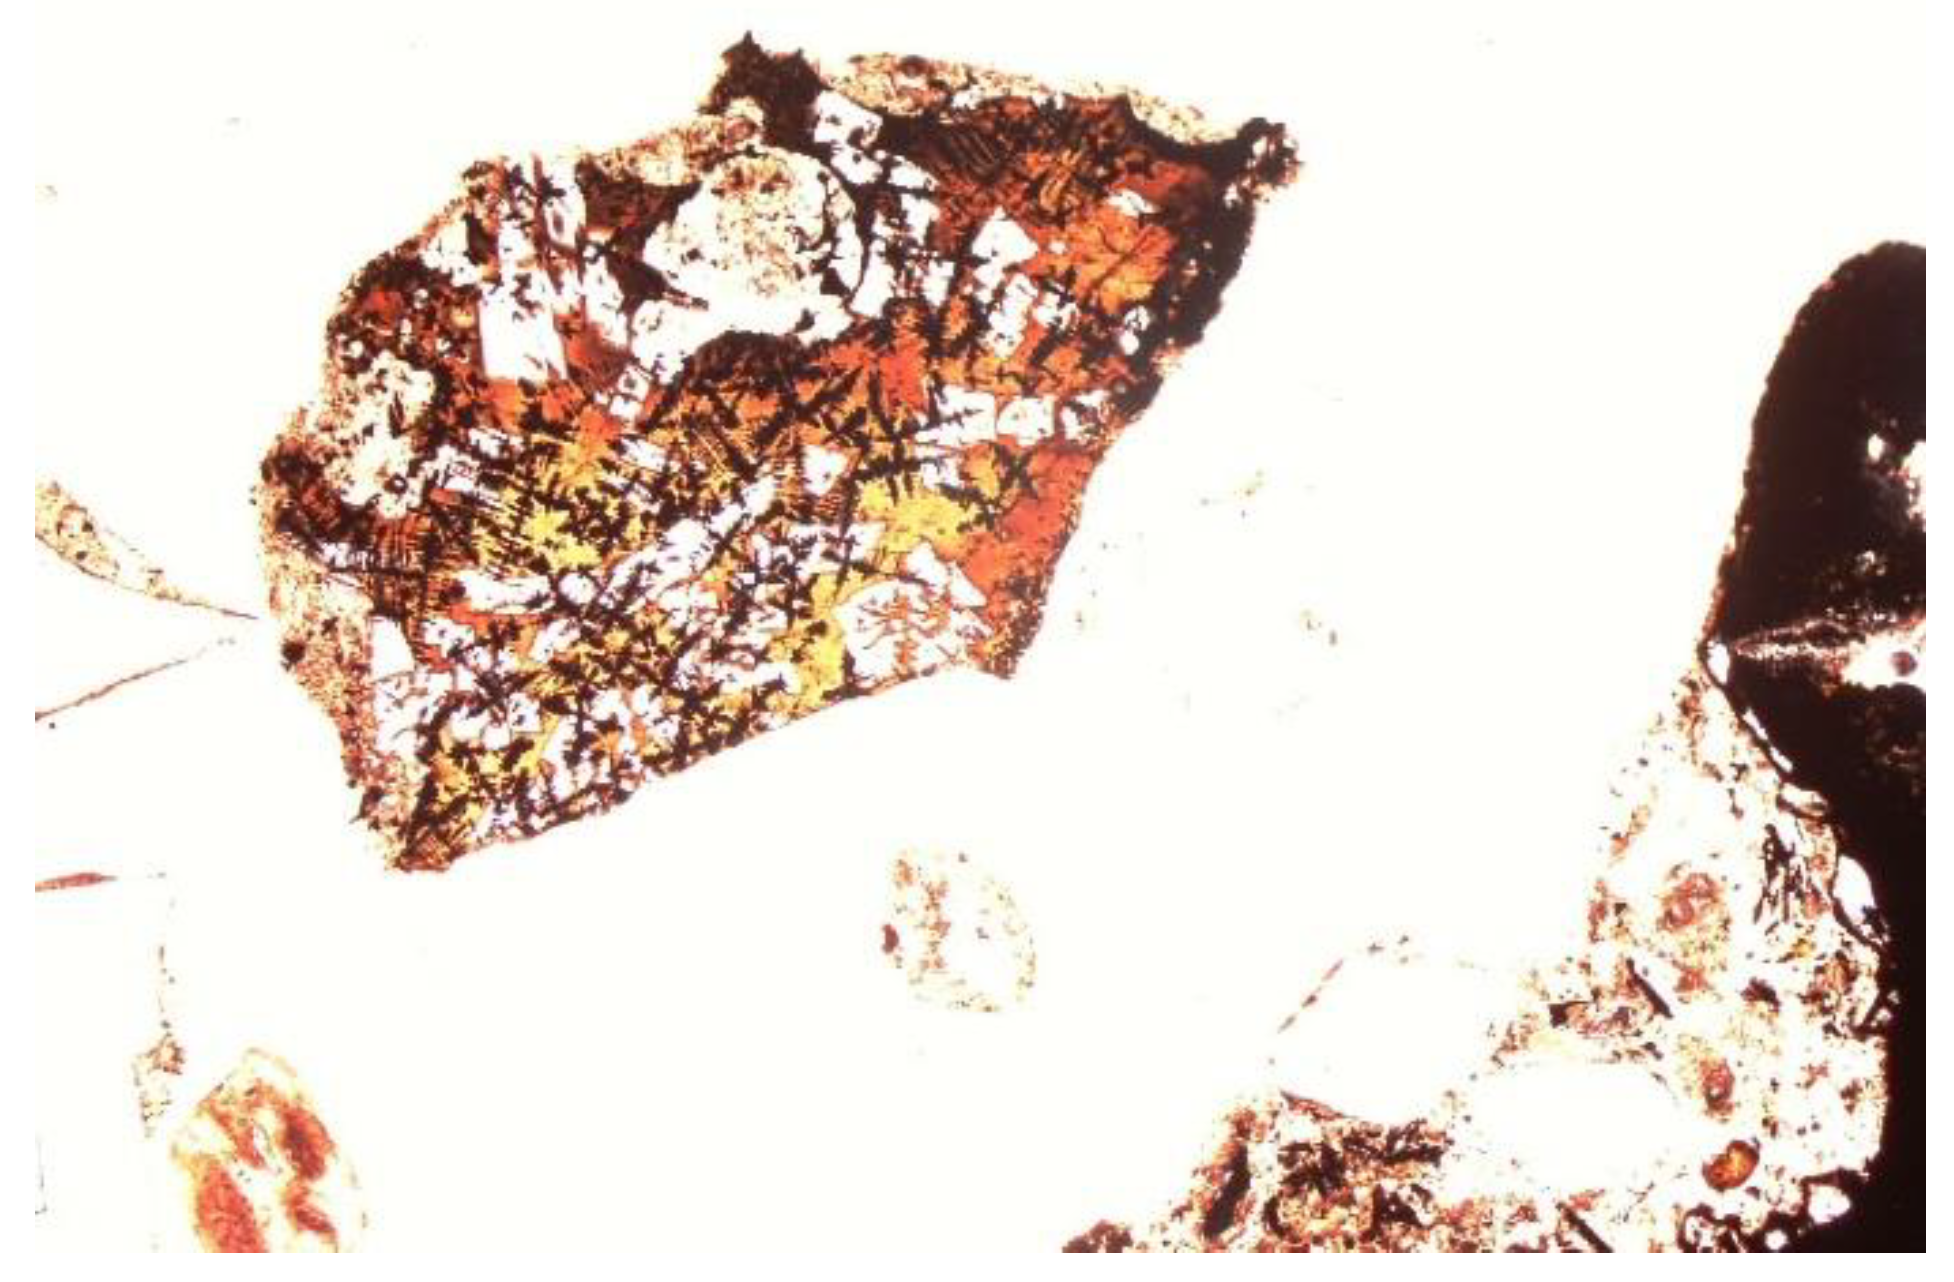
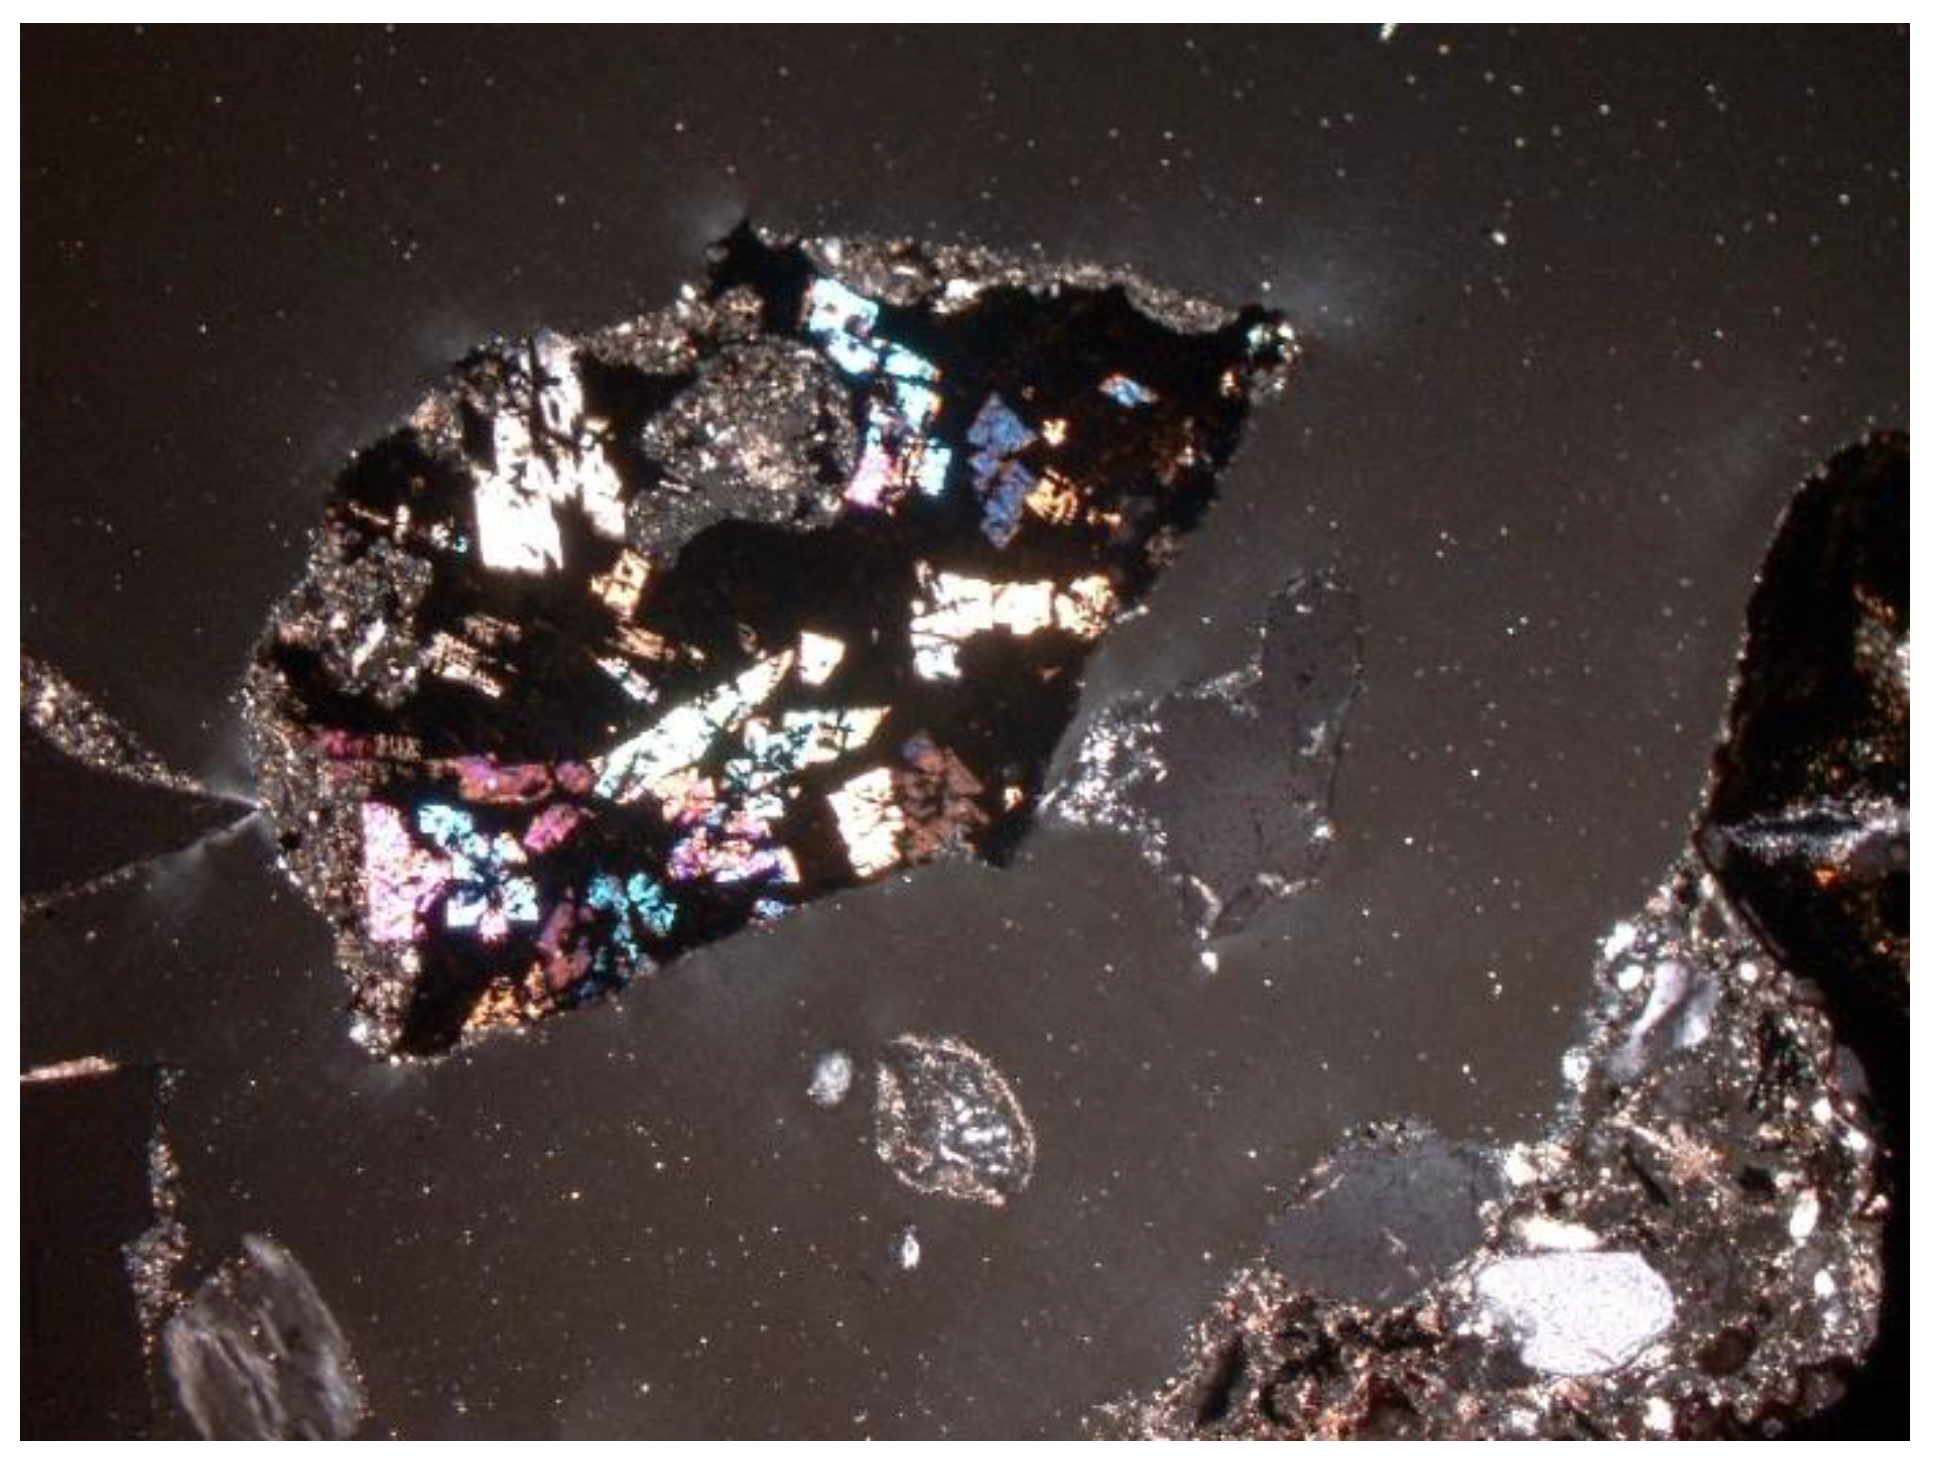
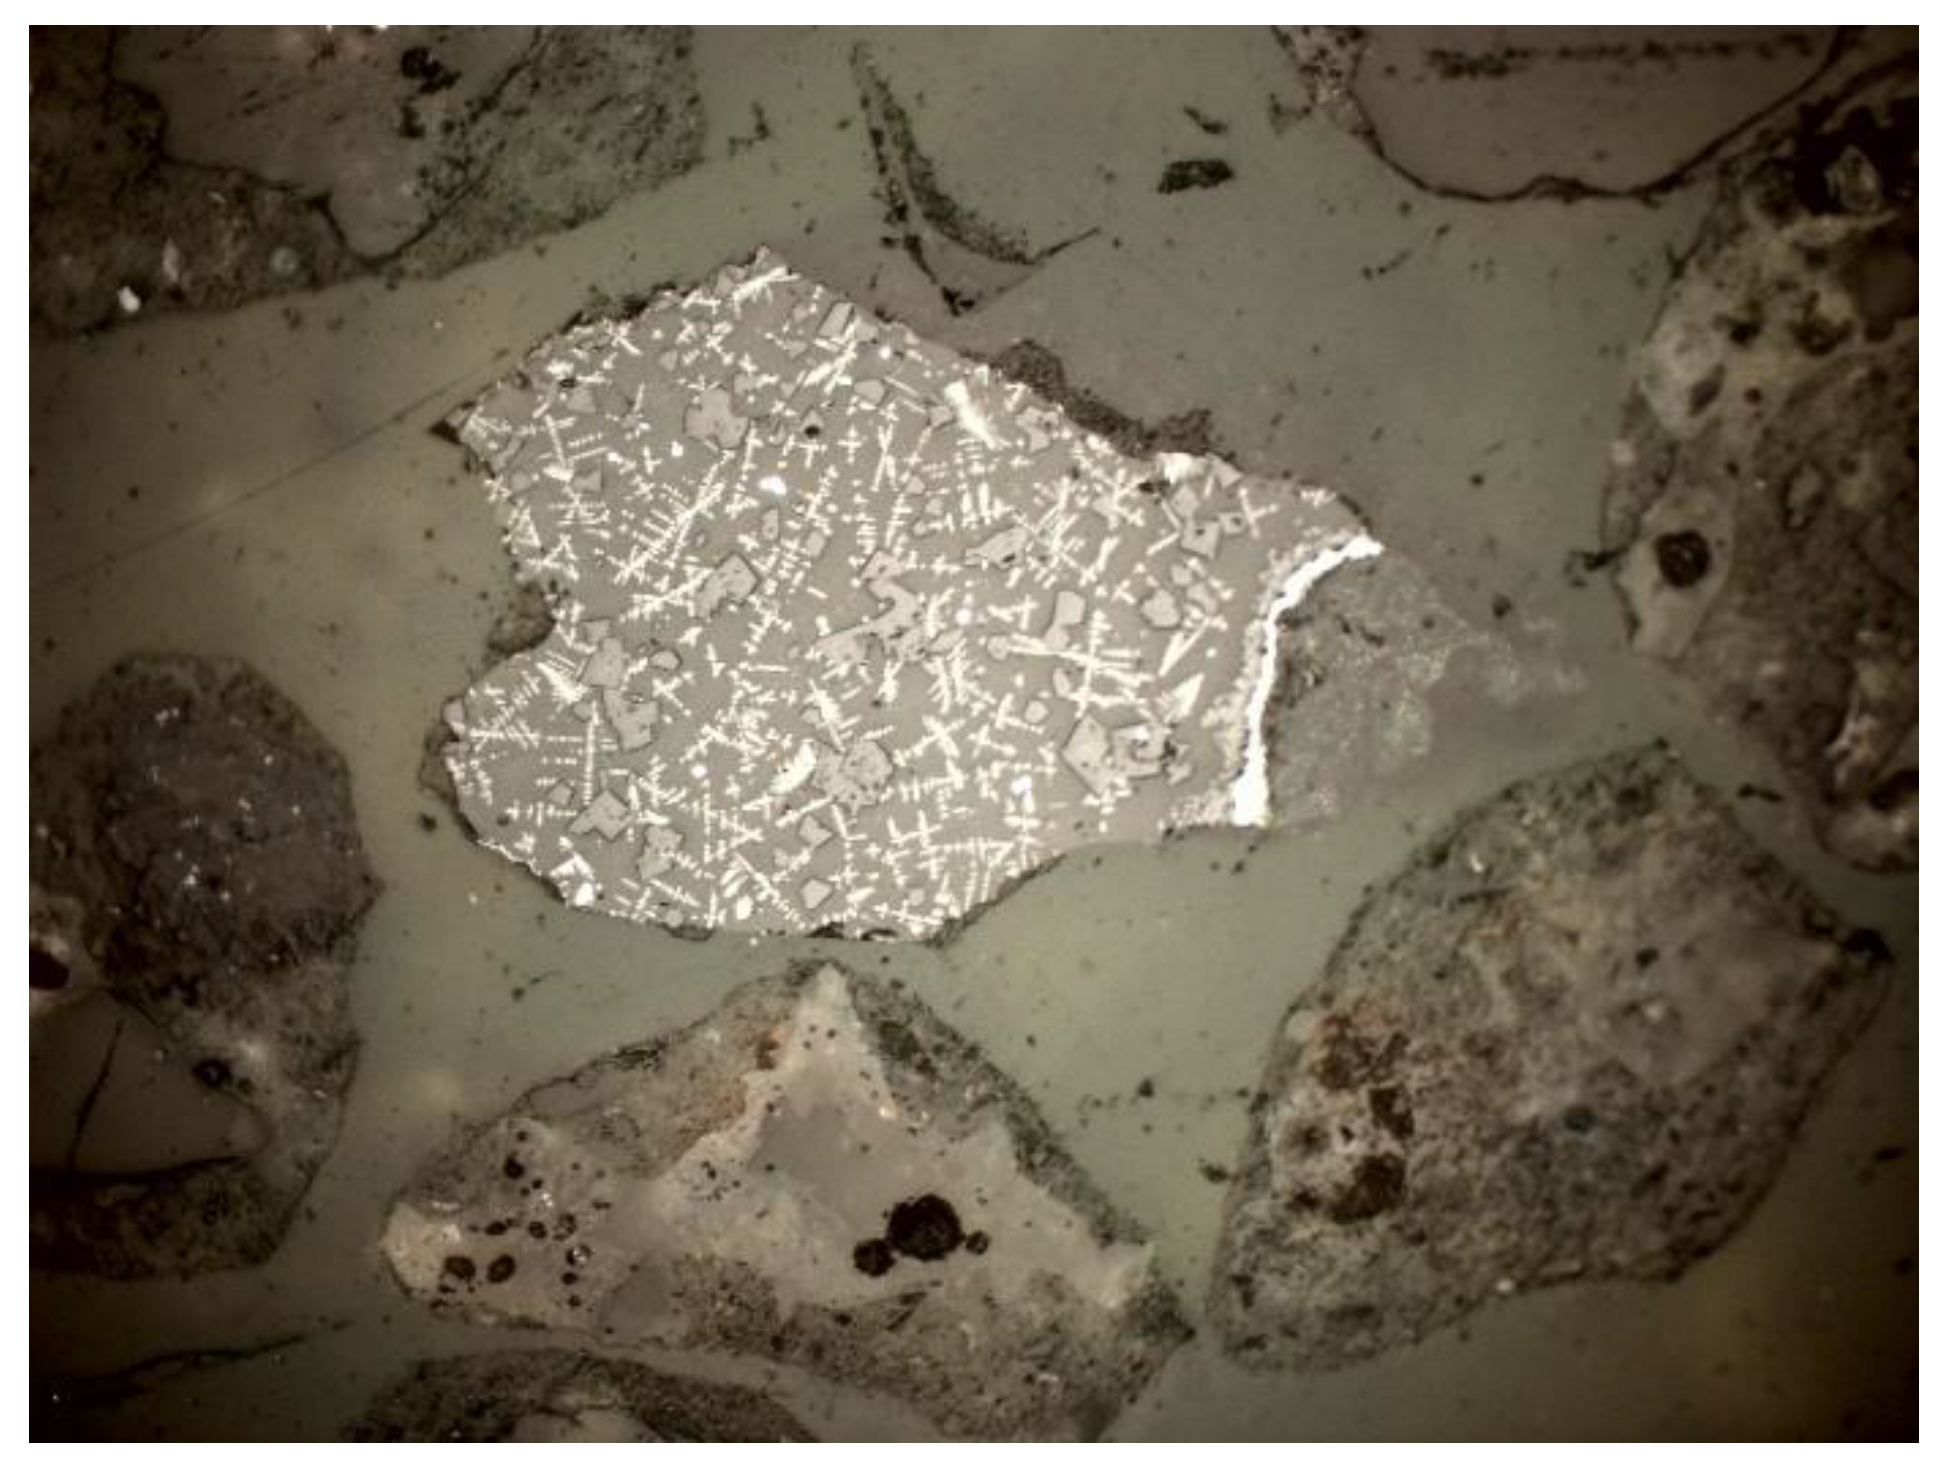
Quartz (SiO2): the dominant component of the mineral phase in each sample. It was in the form of oval, rounded, slightly cracked grains (Figure 6, Figure 7, Figure 8 and Figure 9). It showed gray interference colors of the first order. This mineral, due to the action of high temperature, showed wavy dimming.
-
Melilite: Ca2Mg and Ca2Al group silicates. The extreme links of the melilite series were akermanite Ca2Mg[Si2O7] and gehlenite Ca2Al[(SiAl)2O7]. Minerals formed at high temperature, found in all samples (Figure 7, Figure 8 and Figure 9). The mineral interference colors were low of the first order. There was an oblique dimming, and the surface was cracked, with little cleavage. This mineral is usually irregular or slightly oval in shape.
-
Calcite (CaCO3)—inherent admixture of almost all samples. It appeared in the form of fine sparite, microsparite, and even micrite clusters. It was characterized by third-order interference colors (Figure 7 and Figure 9).
-
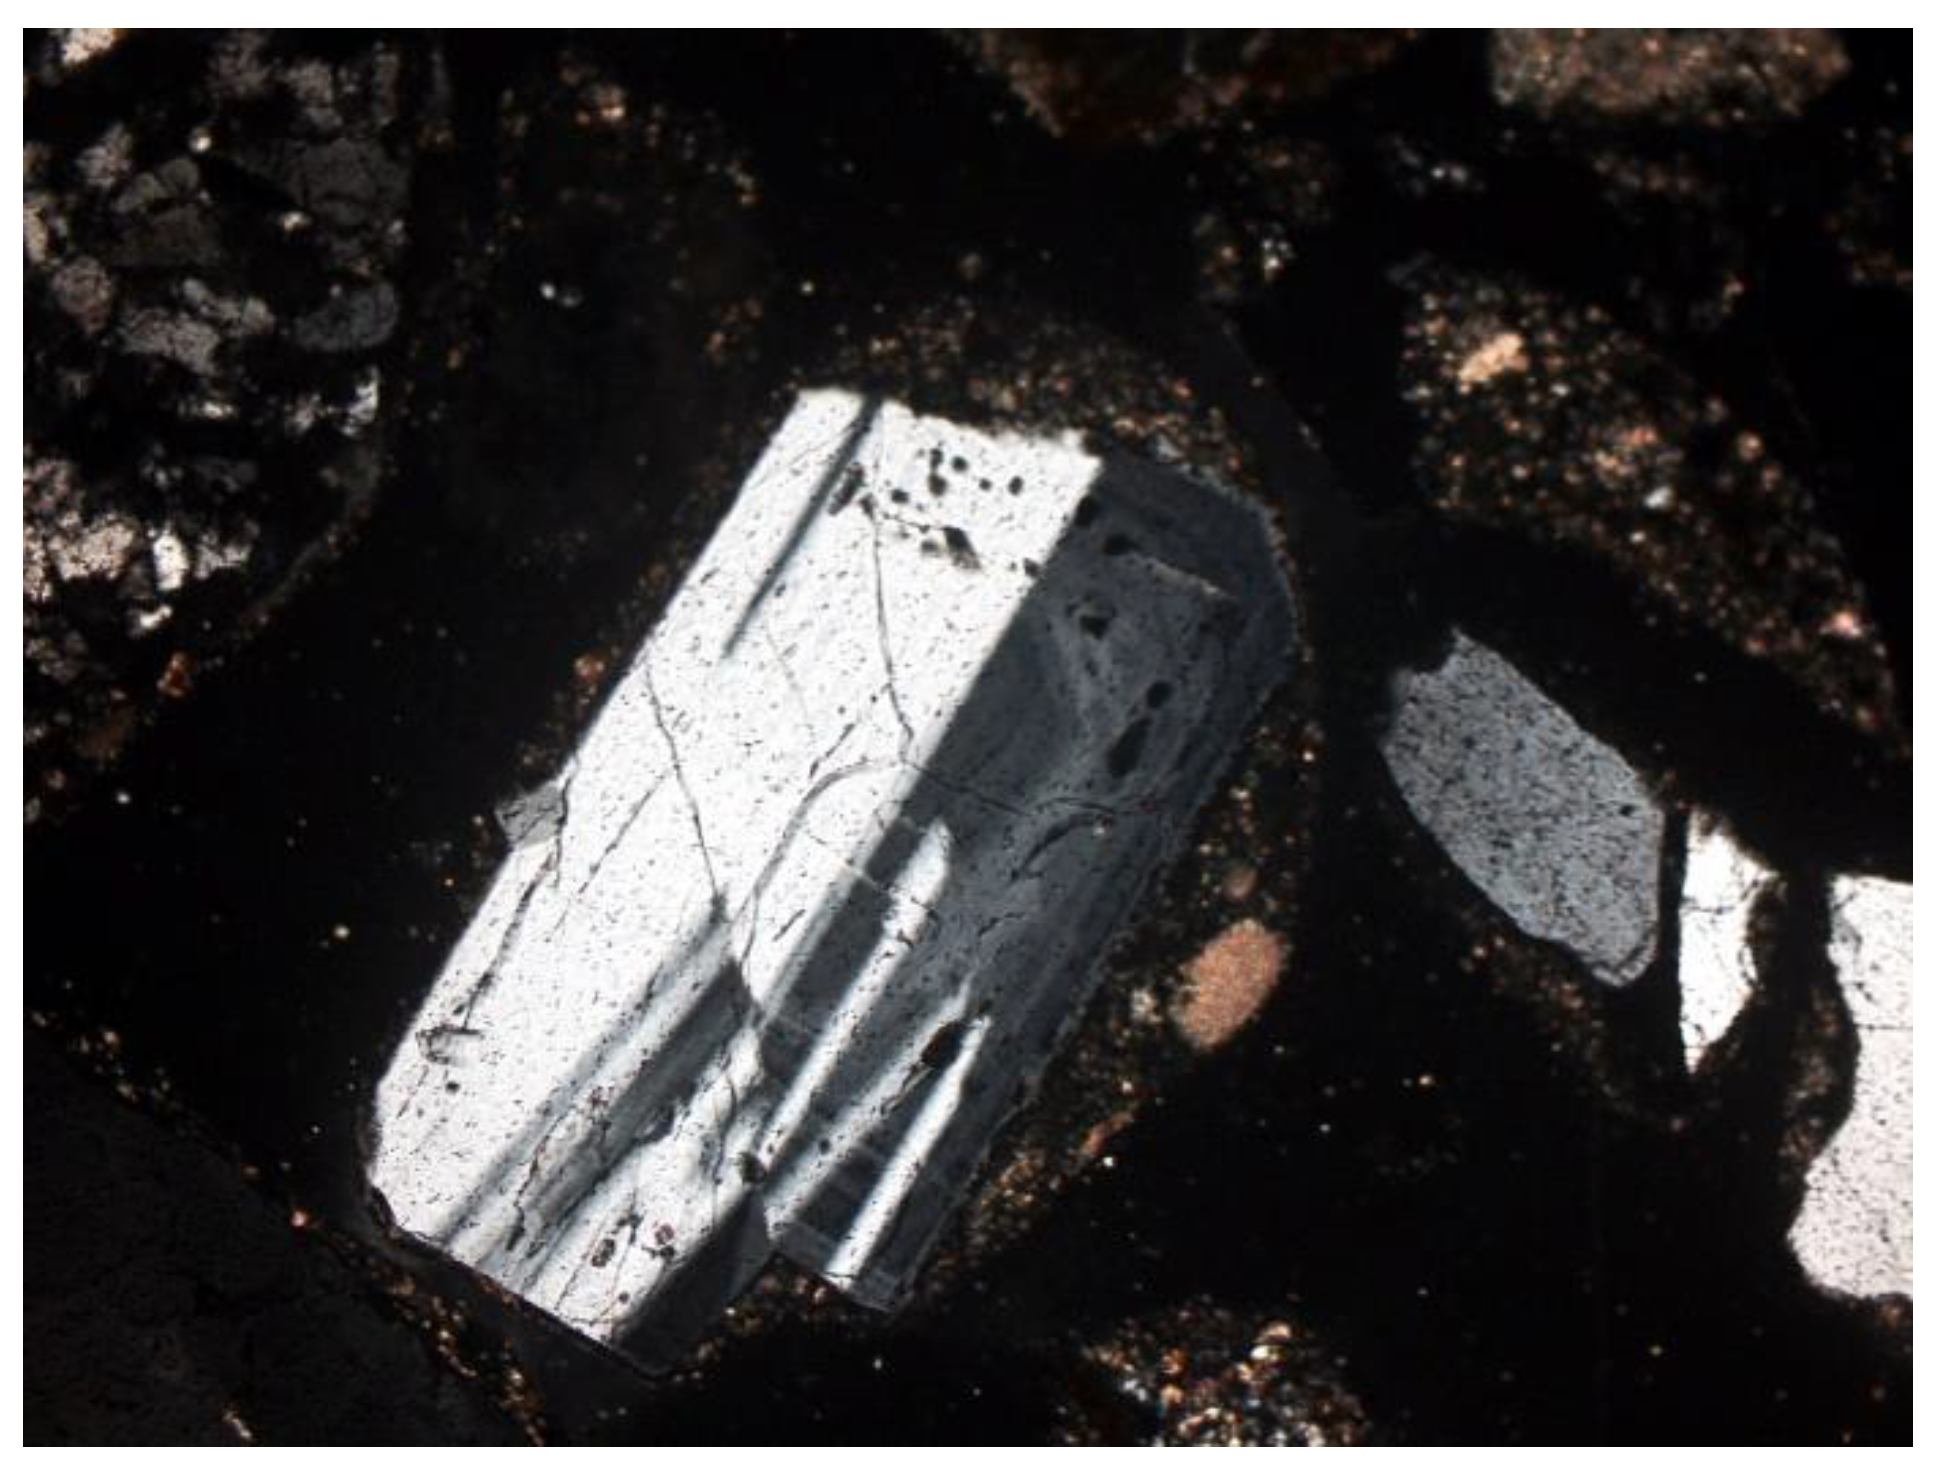
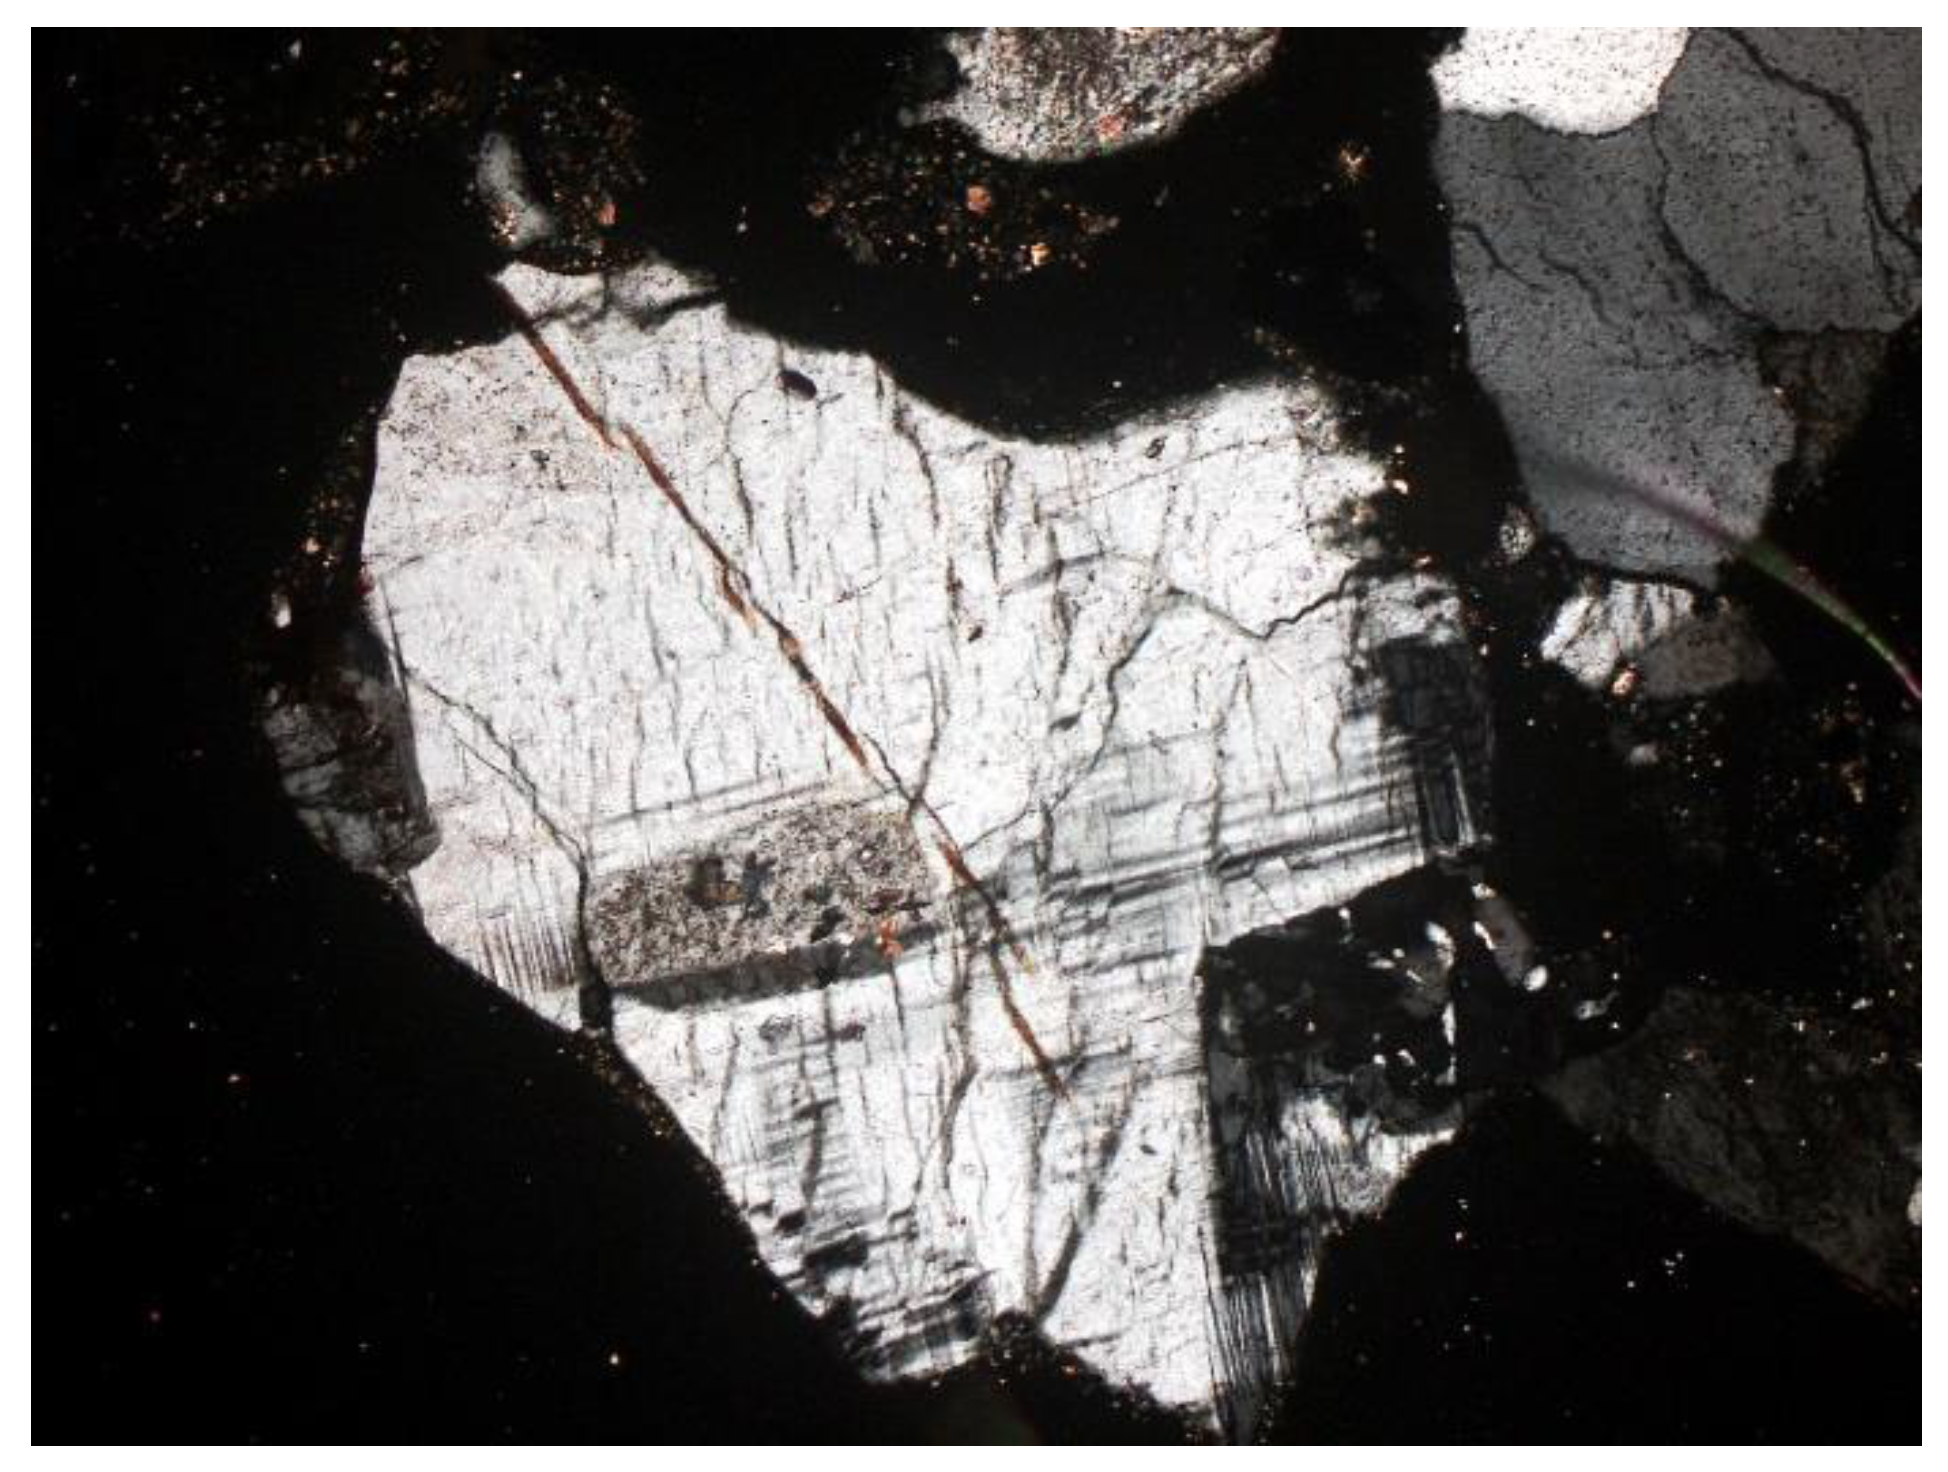
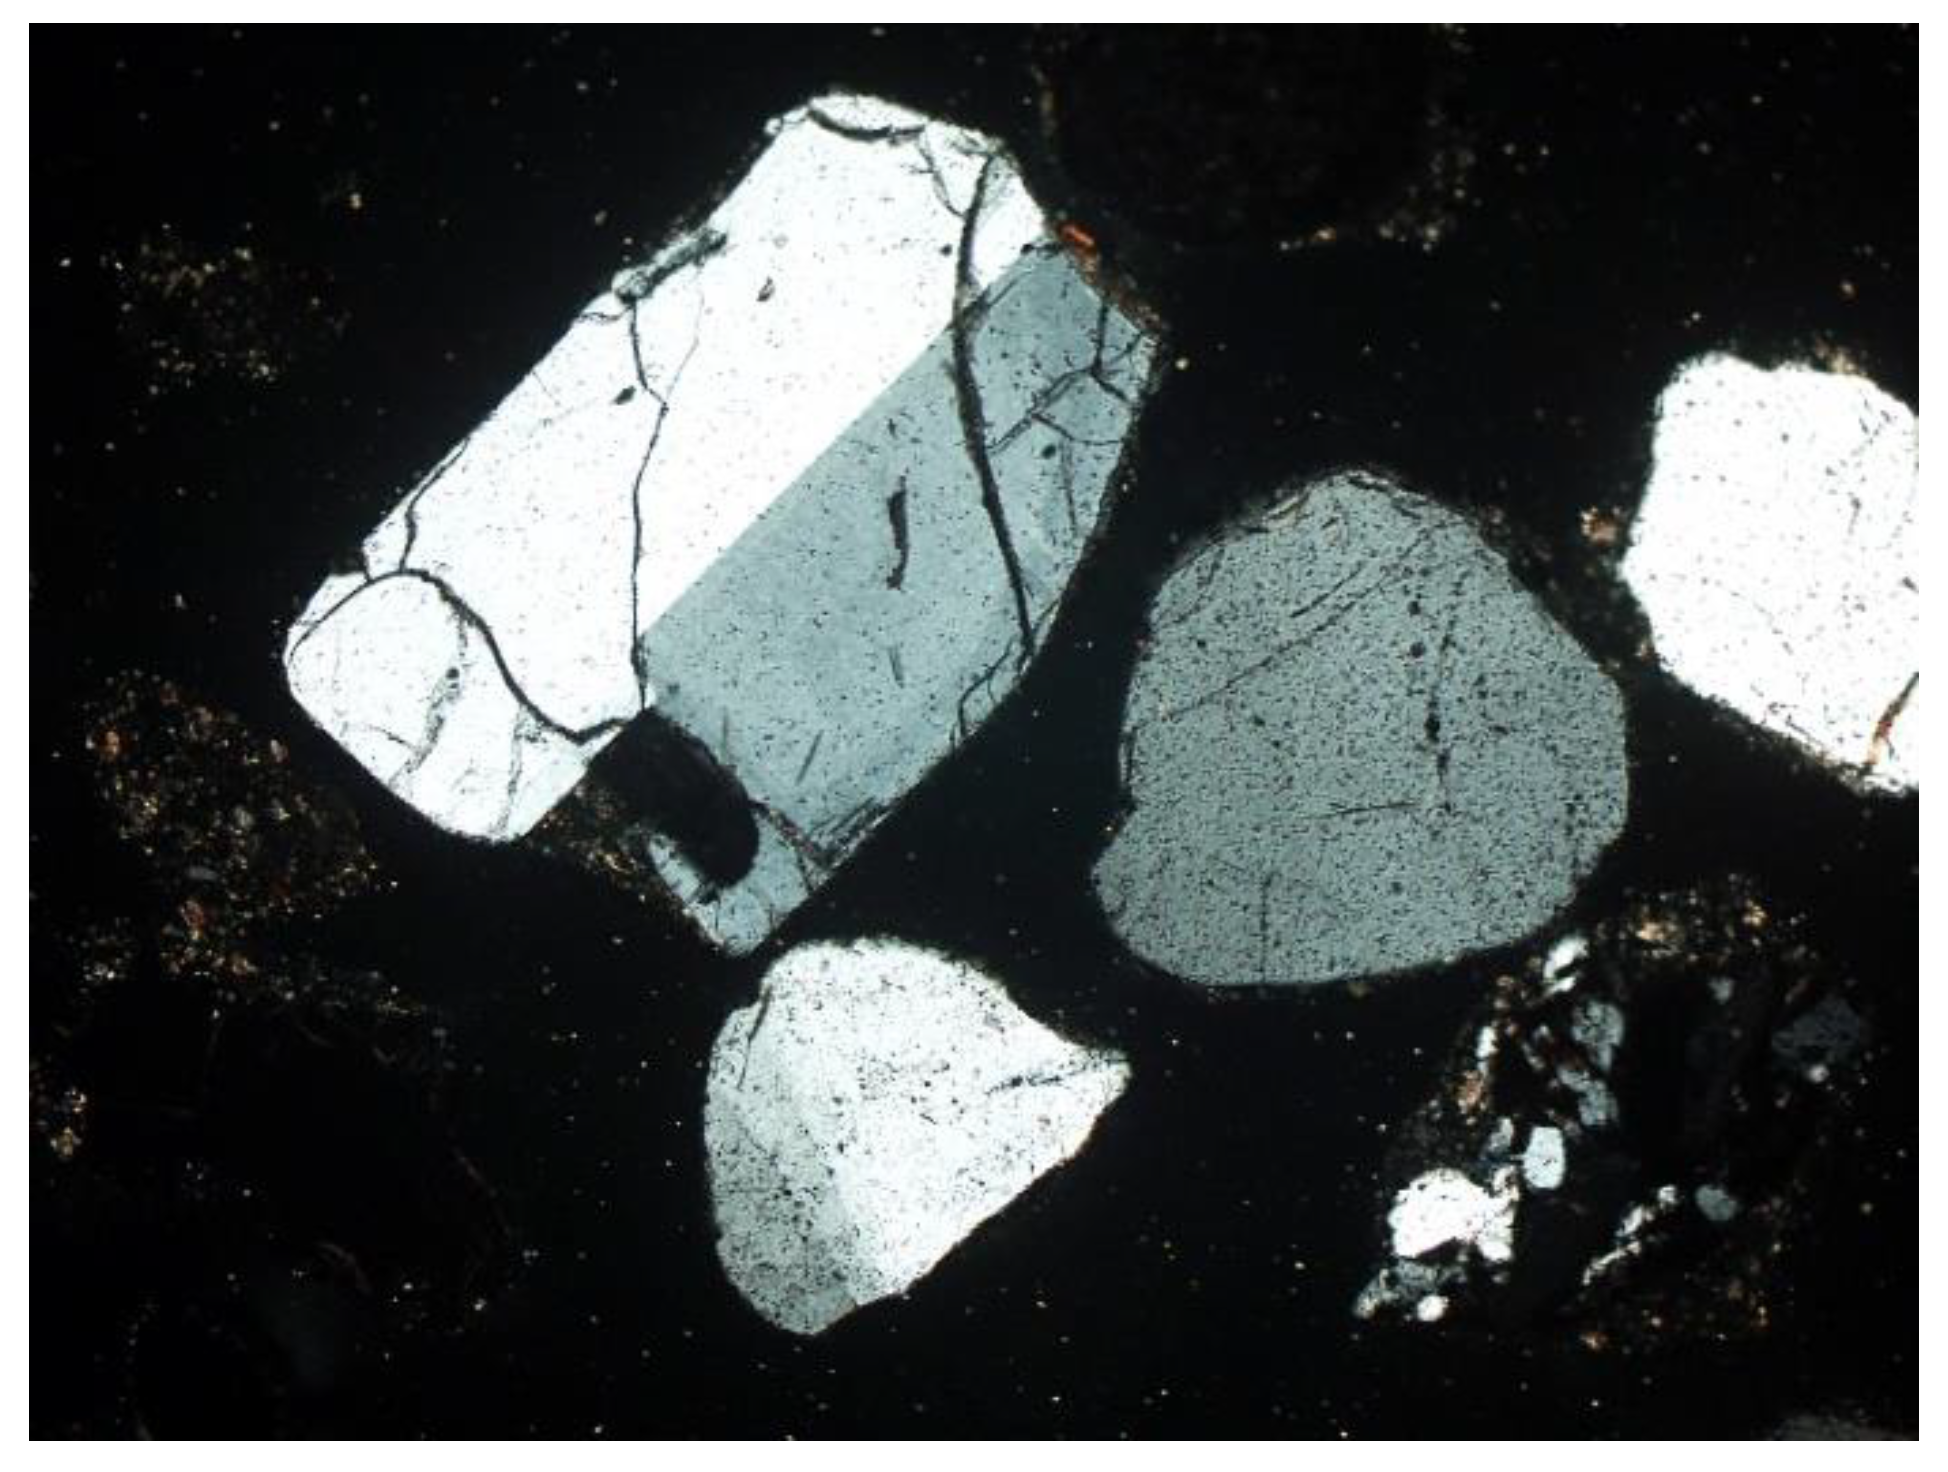
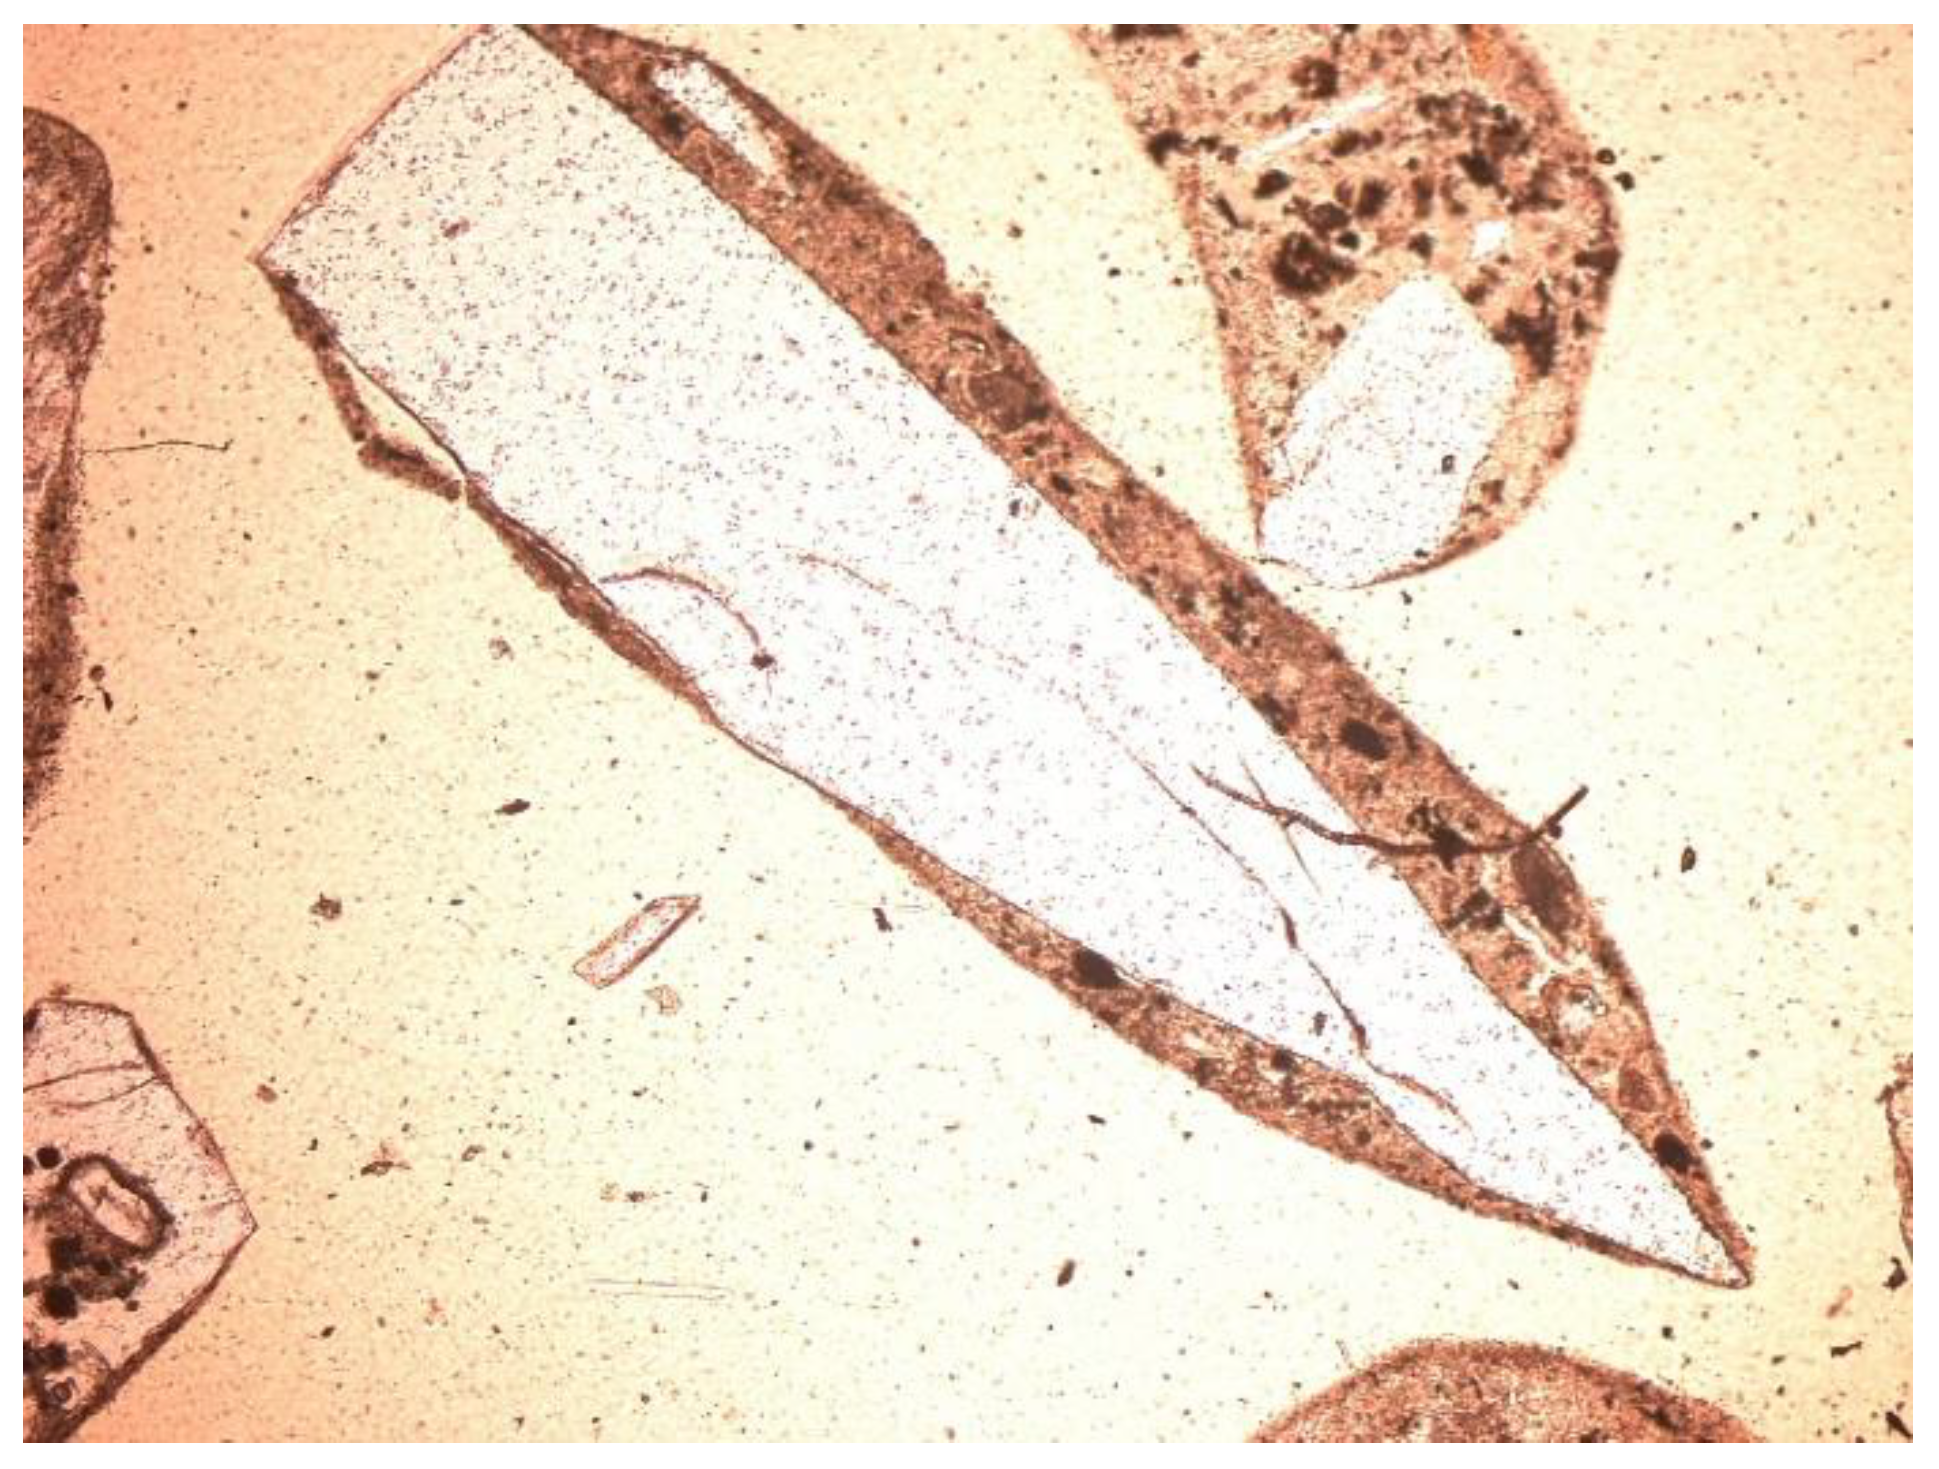
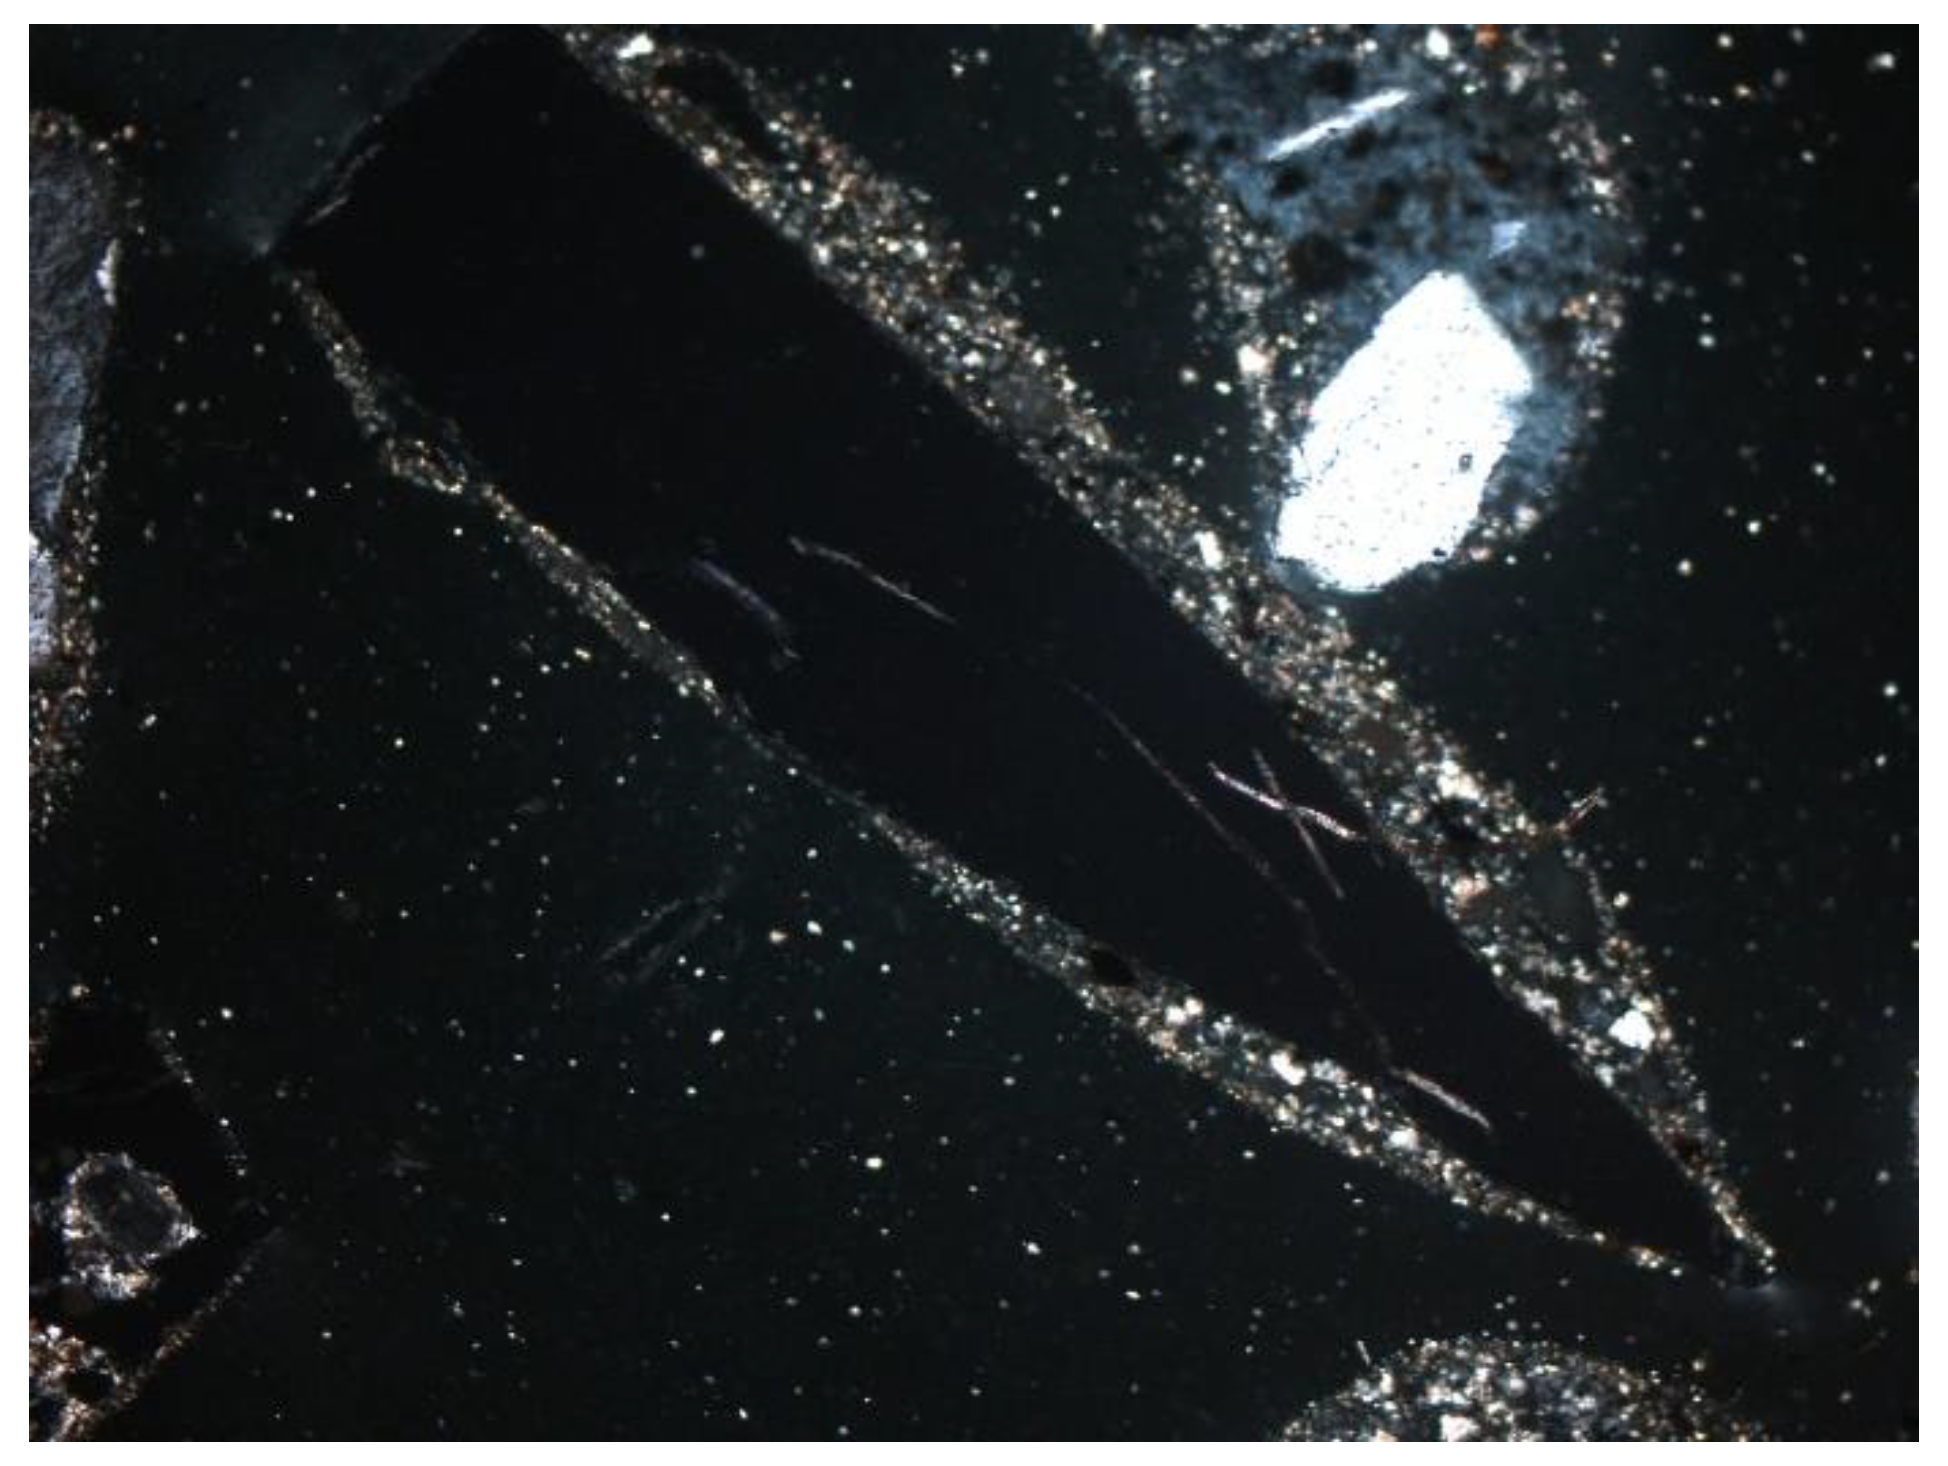
Feldspars—spatial aluminosilicates of K, Na, and Ca, and less often Ba. Numerous grains of potassium feldspar and plagioclase were found in the samples. All feldspars had gray, low first-order interference colors, visible cleavage, and multiple or singly twinned crystals. The group of feldspars includes a number of minerals with different chemical compositions and different forms of crystals. In the analyzed slag and ash samples, sometimes numerous grains of potassium feldspars and plagioclases were found. The crystal habit was often subhedral, tabular. The material showed, for example, multiple twinned plagioclases (Figure 10) and potassium feldspars—microcline (Figure 11) and orthoclase (Figure 12 and Figure 13).
Other minerals were also found in the slag and ash, such as apatite, anhydrite or gypsum, and wollastonite. As for the amorphous phase, each sample contained a significant amount of anthropogenic materials unchanged in the combustion process, which have not been completely burned. These are mainly fragments of glass, which were observed even with the naked eye (Figure 1). Fragments of glass or enamel in polarized light are optically isotropic (they completely extinguish the light) (Figure 14, Figure 15, Figure 16 and Figure 17). In addition, a significant content of the metallic phase was found, composed of shiny fragments of various metallic substances not separated in the recovery process (Figure 18, Figure 19, Figure 20 and Figure 21). These substances were opaque and isotropic in the transmitted light microscopic analysis (Figure 20 and Figure 21). Fragments of metals originated from cans (Figure 22, Figure 23 and Figure 24) and various unidentified, not fully burnt fragments (Figure 25) were shown.

3.3. Microscopic Analysis—Quantitative Description

Quantitative analysis of the material, aimed at determining the porosity of individual waste samples, showed that the pores on the preparations were usually oval and closed, and their size sometimes reached about 1 mm (Figure 26, Figure 27, Figure 28 and Figure 29). The results of the quantitative analysis of samples obtained from SP1, SP2, and SP3, respectively, are presented in Table 1.
It was shown that the seasoning time of the sample may cause some variability in the pore content. The lowest porosity was found in the longest seasoned material. This could be related to the reduction of porosity due to the secondary build-up of pores by diagenetic processes. Probably, like in rocks, the rebuilding of the pore, intragrain, and intergrain space could have occurred.
Quantitative analysis results, aimed at examining the effect of material porosity depending on the analyzed fraction, are presented in Table 2 and in Figure 30.
It was noticed that the percentage of pores in the slag and ash changed depending on the analyzed grain size. The thickest analyzed fractions were characterized by large, numerous pores (Figure 31). The porosity in the thickest fraction reached almost 20%, while in the smallest analyzed fraction the porosity was significantly reduced to about 4%. Moreover, the maximum observed pore diameters in the smallest fractions did not exceed 0.15 mm (Figure 32).
Depending on the analyzed fraction, differences were observed not only in porosity, but also in the phase composition of the material itself. The thicker fractions were dominated by amorphous substance (Figure 14 and Figure 15). There was a lot of glass and other slag fragments that were difficult to identify microscopically, but there was relatively little mineral substance. As the fraction decreased, microscopic analyses revealed an increase in the mineral substance in which quartz was definitely dominant (Figure 33 and Figure 34).

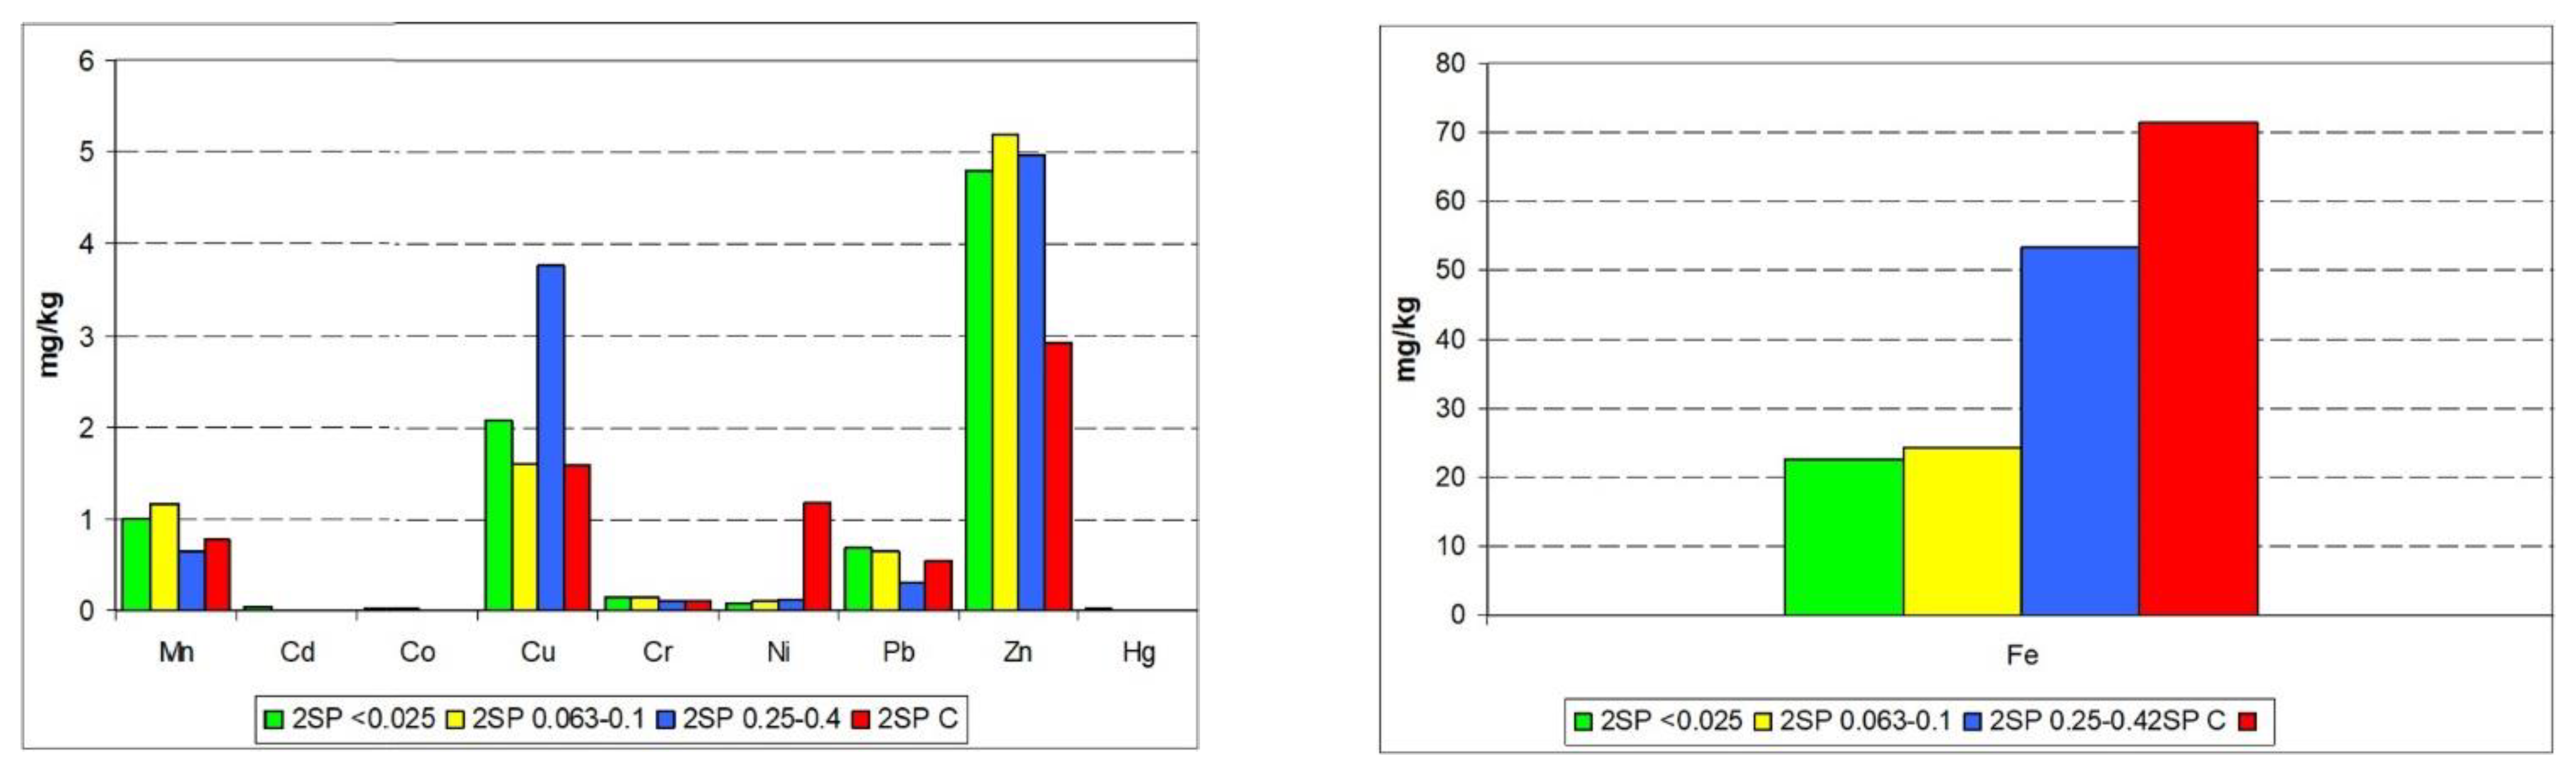
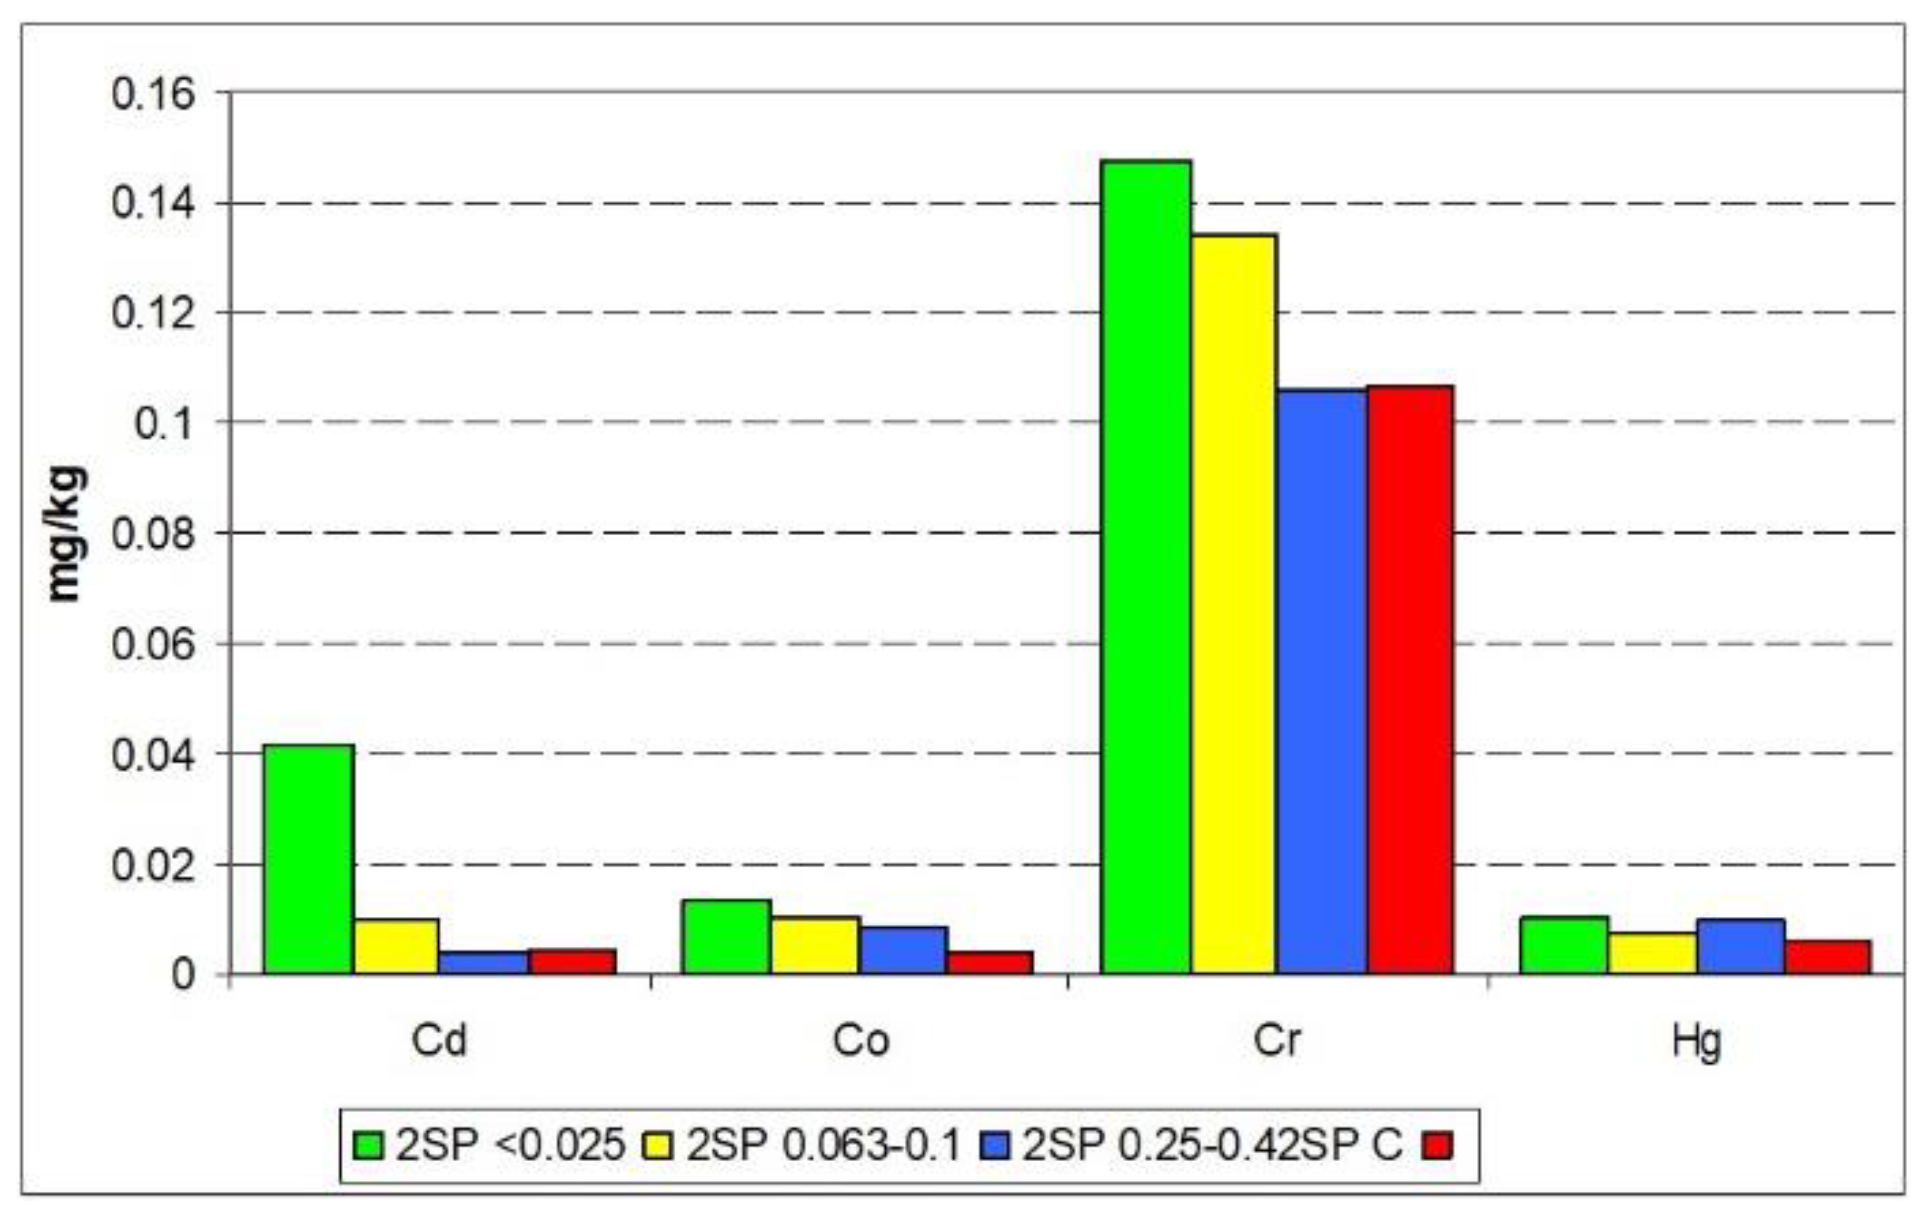
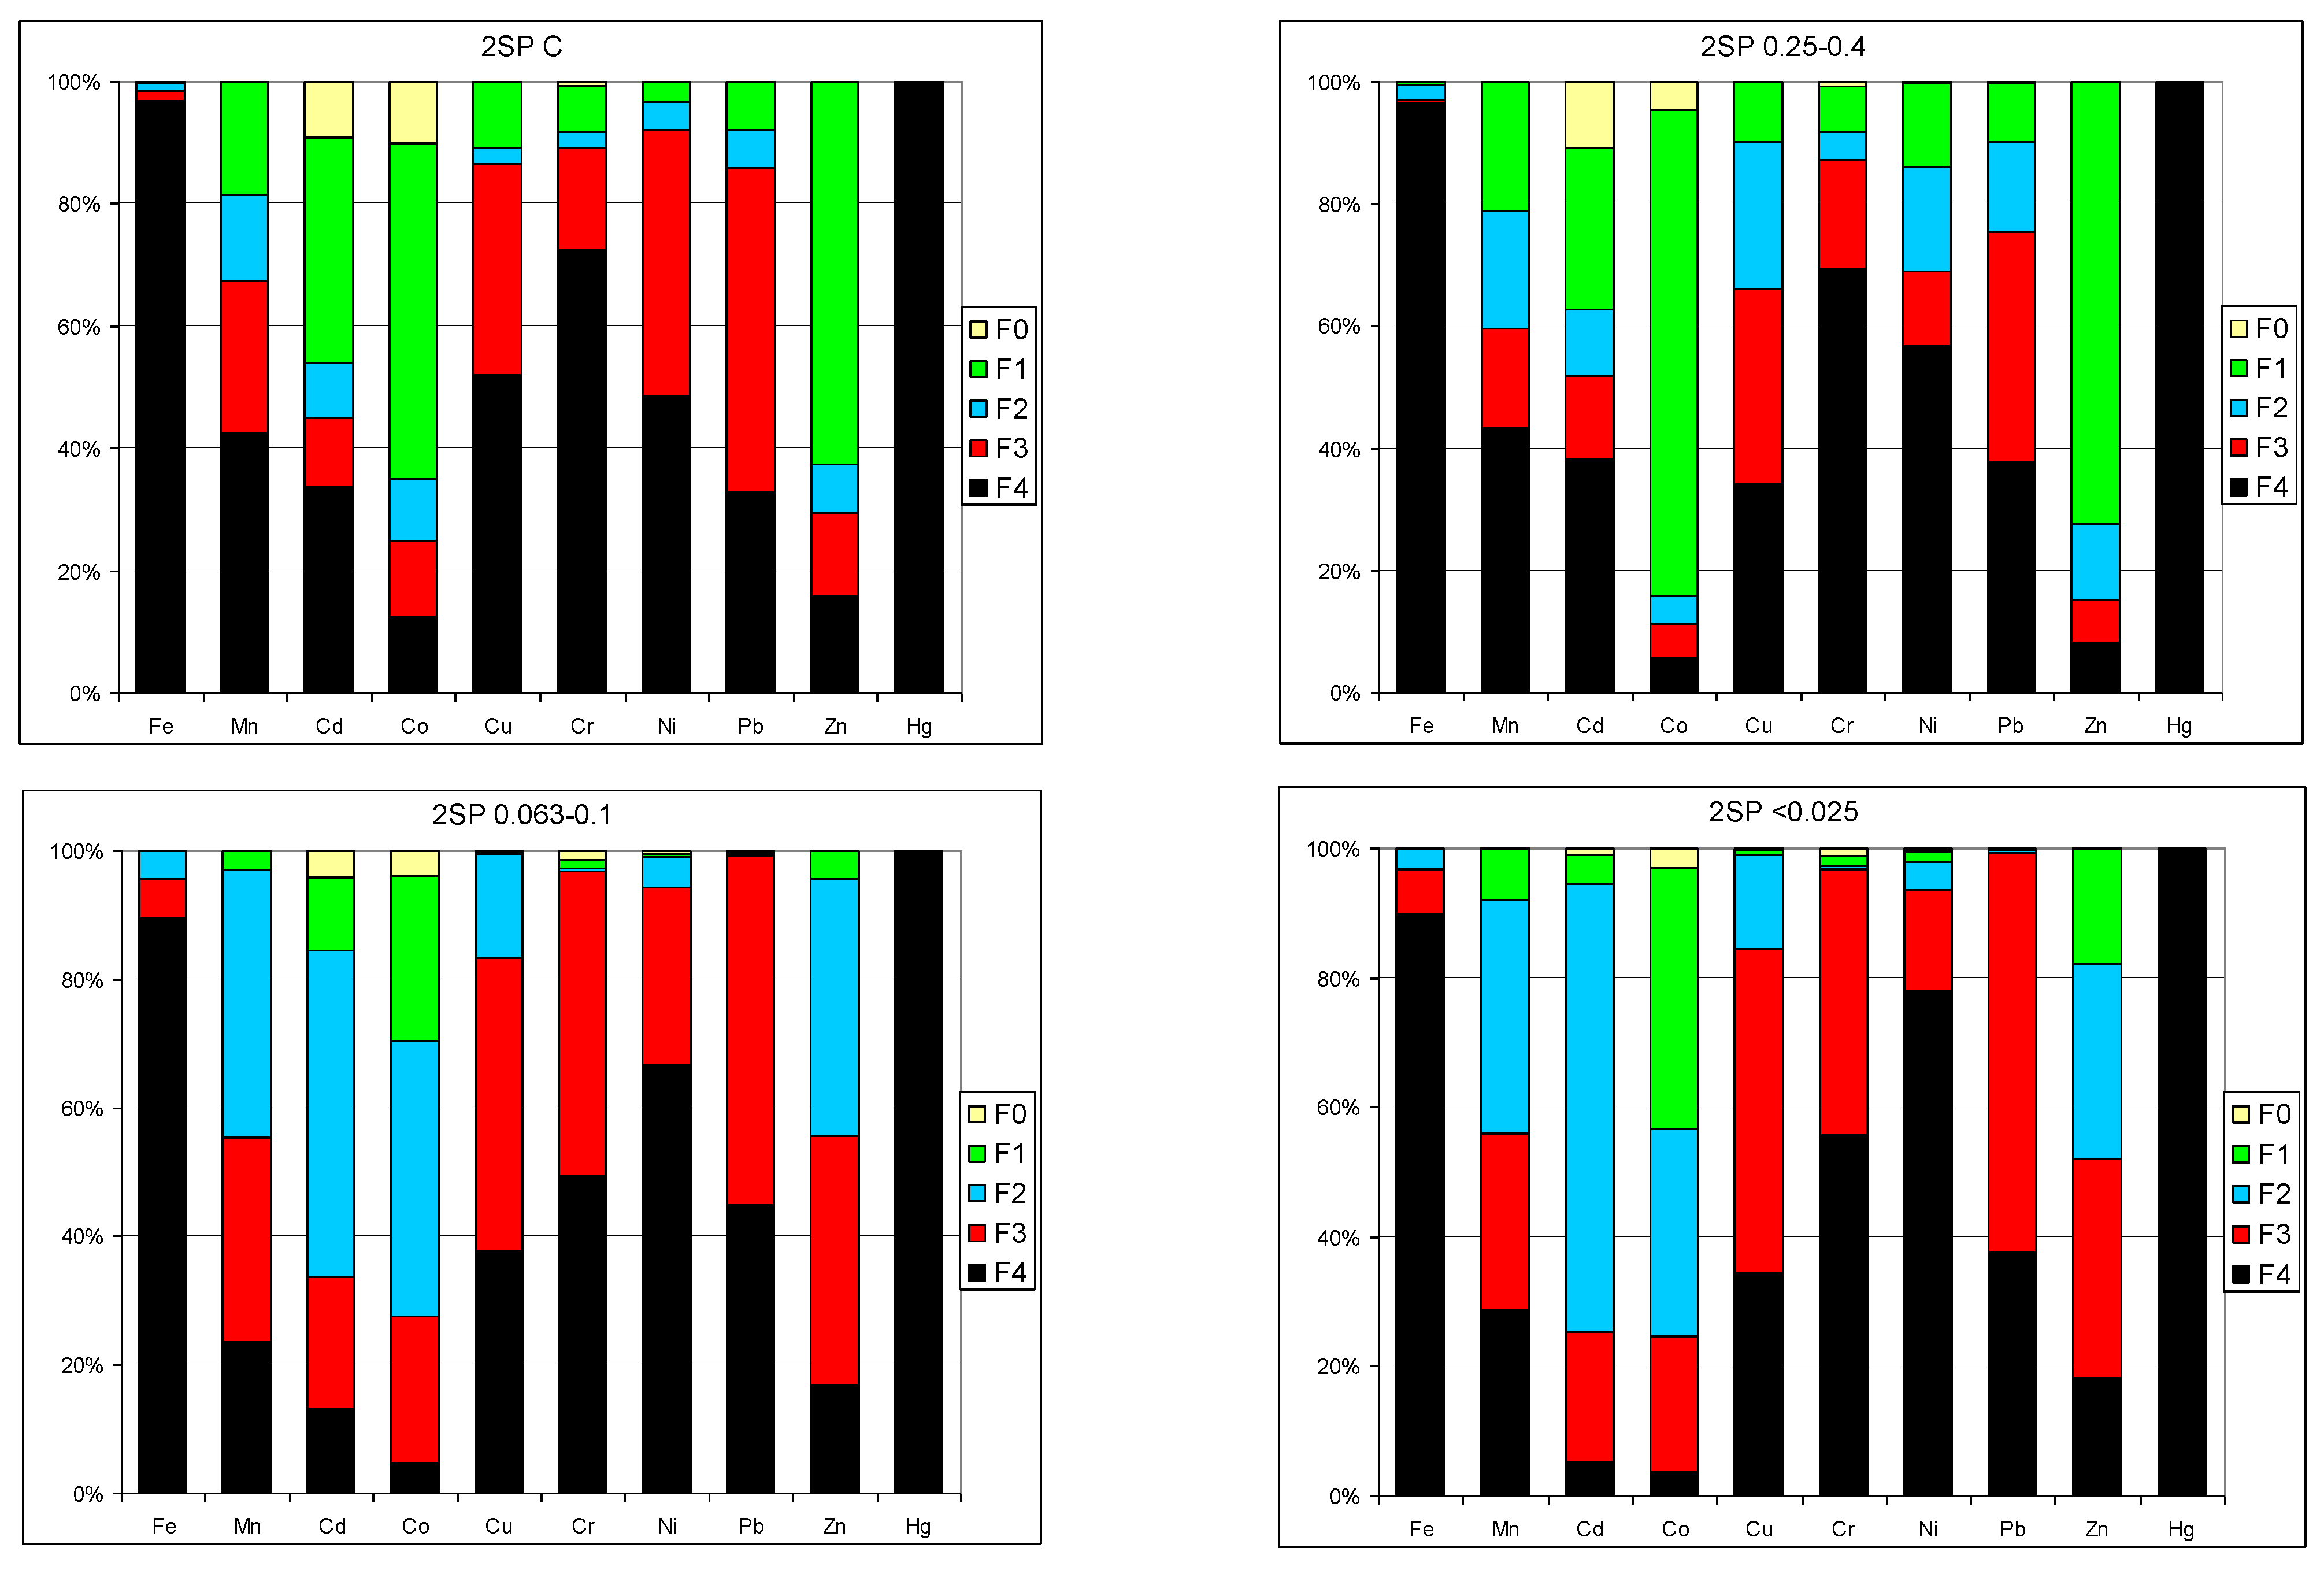
3.4. Sequential Extraction

The approximate total content of selected metals in the studied waste samples was determined (Figure 35). Alike in SP2 sample and in the grain fractions separated from it, metals were present at a very low level. With the exception of Co, Cd, and Cr, there was no relationship between the grain size and the content of metals. The Fe content was the highest in the primary sample SP2. There was no significant relationship between Fe content in the samples and the metal content in them. The exception was Ni.
Results of the release susceptibility studies indicated that only Co and Zn showed high mobility in all samples, as well as Cd in the SP2 (0.063–0.1 mm) and SP2 (<0.025 mm) samples (Figure 36). It was also found that the distribution profile of metals in the fractions for the SP2 samples was similar to that of SP2 (0.25–0.4 mm) as well as SP2 (<0.025 mm) to SP2 (0.063–1.0 mm). Very low values of metals in the samples as well as their strong binding to the solid phase means that metals do not pose a threat to the water and soil environment.

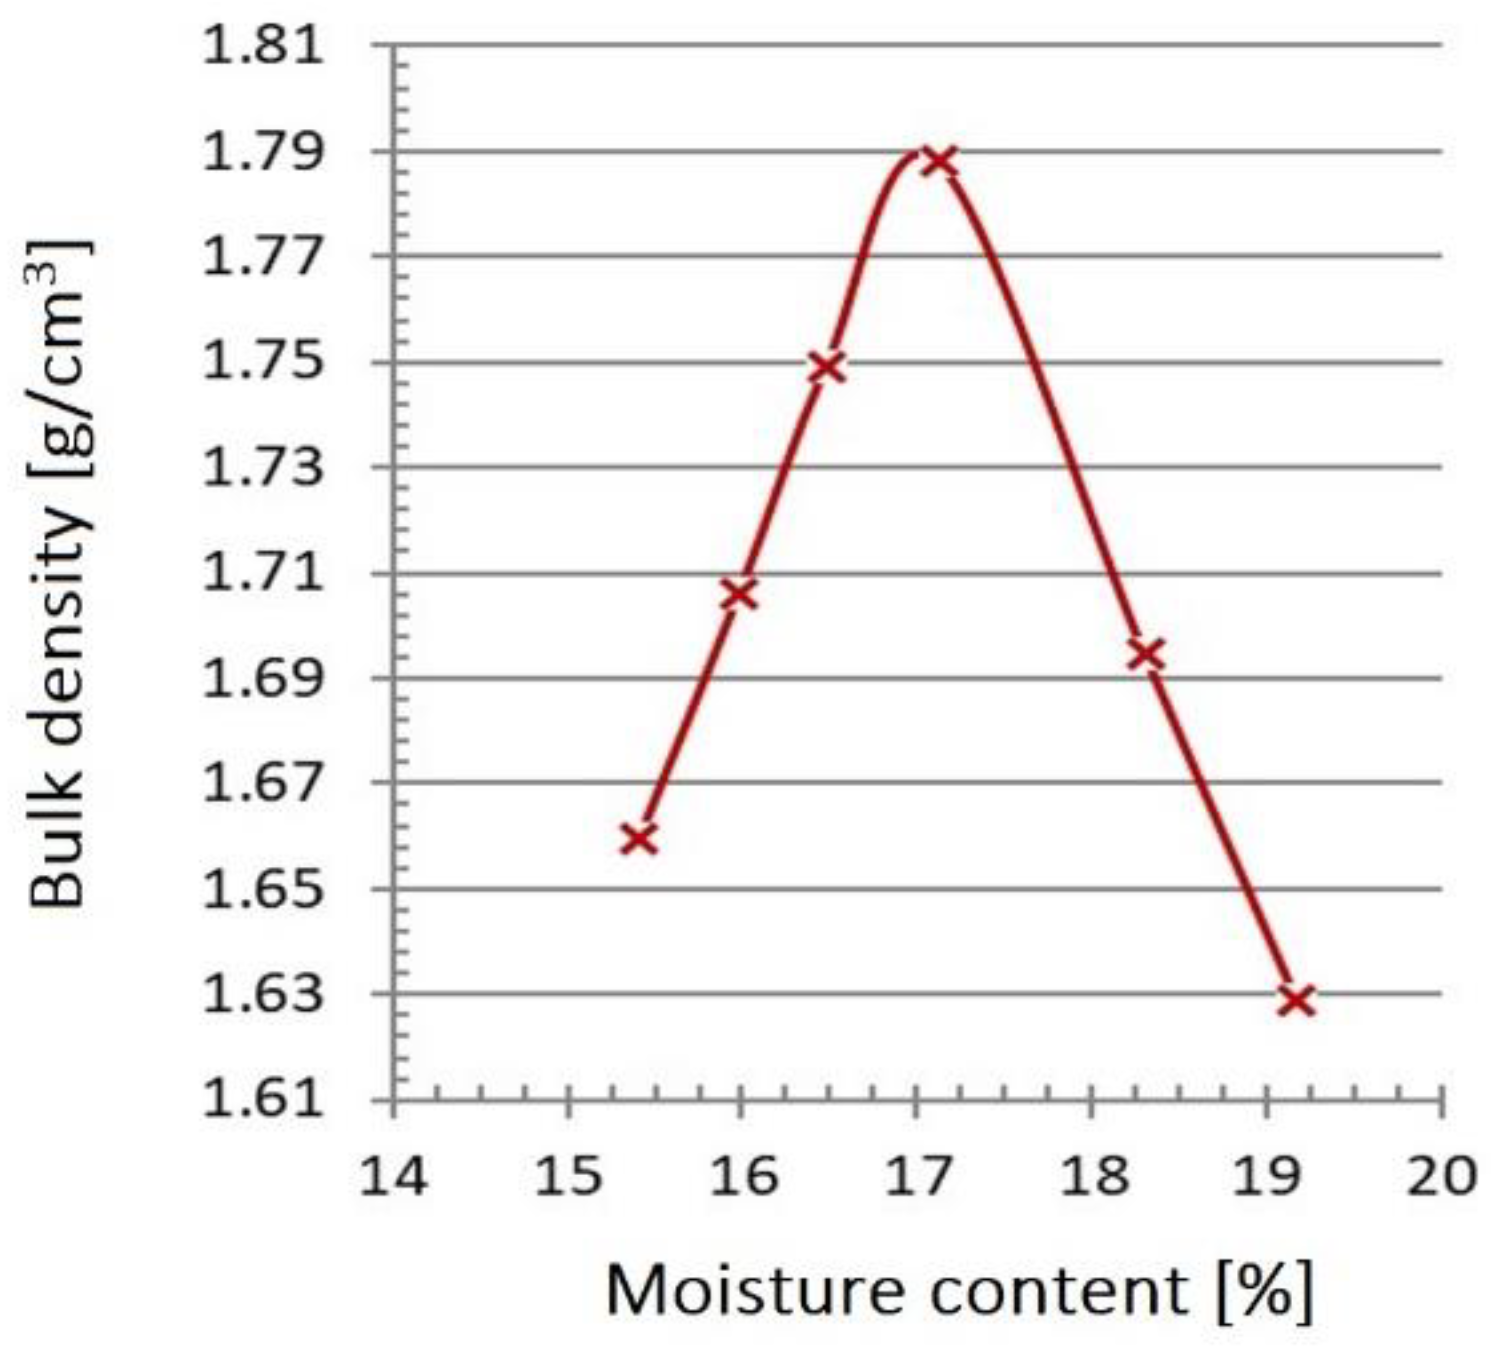
3.5. Densimetric Studies

Table 3 presents the values of real and apparent density obtained by pycnometric methods, calculated porosity and total pore volume of SP1, SP2, and SP3 waste samples, respectively. As it may be seen in Table 3, the real density of the studied samples was similar and amounted to 2.56 g/cm3. However, an increase in the apparent density of slag and post-process ash seasoned for a longer time was observed. This can probably be related to the ability of the material to clumping. The total porosity of the averaged samples SP1, SP2, and SP3 was 23.9%, 23.4%, and 23.3%, respectively, with the pore volume at the level of 0.12 cm3/g (Table 3). In the averaged samples, closed porosity dominated, the content of which could be determined at 20%, while the remaining 3–4% could be attributed to open porosity.
The impact of the SP2 sample separation on waste density and porosity is presented in Table 4. As it can be seen, the finer fractions were characterized by a higher grain density. The total porosity of the finer fractions also increased together with the pore volume increase. The porosity of individual grain fractions of SP2 sample was different than the porosity of the averaged sample.
According to Table 4, passing from the thicker SP2 fraction (>6.3 mm) towards the finer fraction, the share of closed pores decreased, and the share of open pores increased in the total porosity of the sample. The reduction in the size of the sieved fraction was associated with a transition from macropores, which were typical for fractions >6.3 mm, towards equal shares of closed and open pores in the 1.0–2.5 mm and 0.63–1 mm fractions, to a dominant share of micropores in the 0.25–0.63 mm grain fraction. The sample with the finest grains had the lowest percentage of closed pores.
As was shown, the share of open and closed porosity in the total porosity of the tested waste changed depending on the separated fraction. Thus, the properties of the waste did not remain homogeneous, and the sieving process allowed for the waste separation into components with different structures and different textural properties.

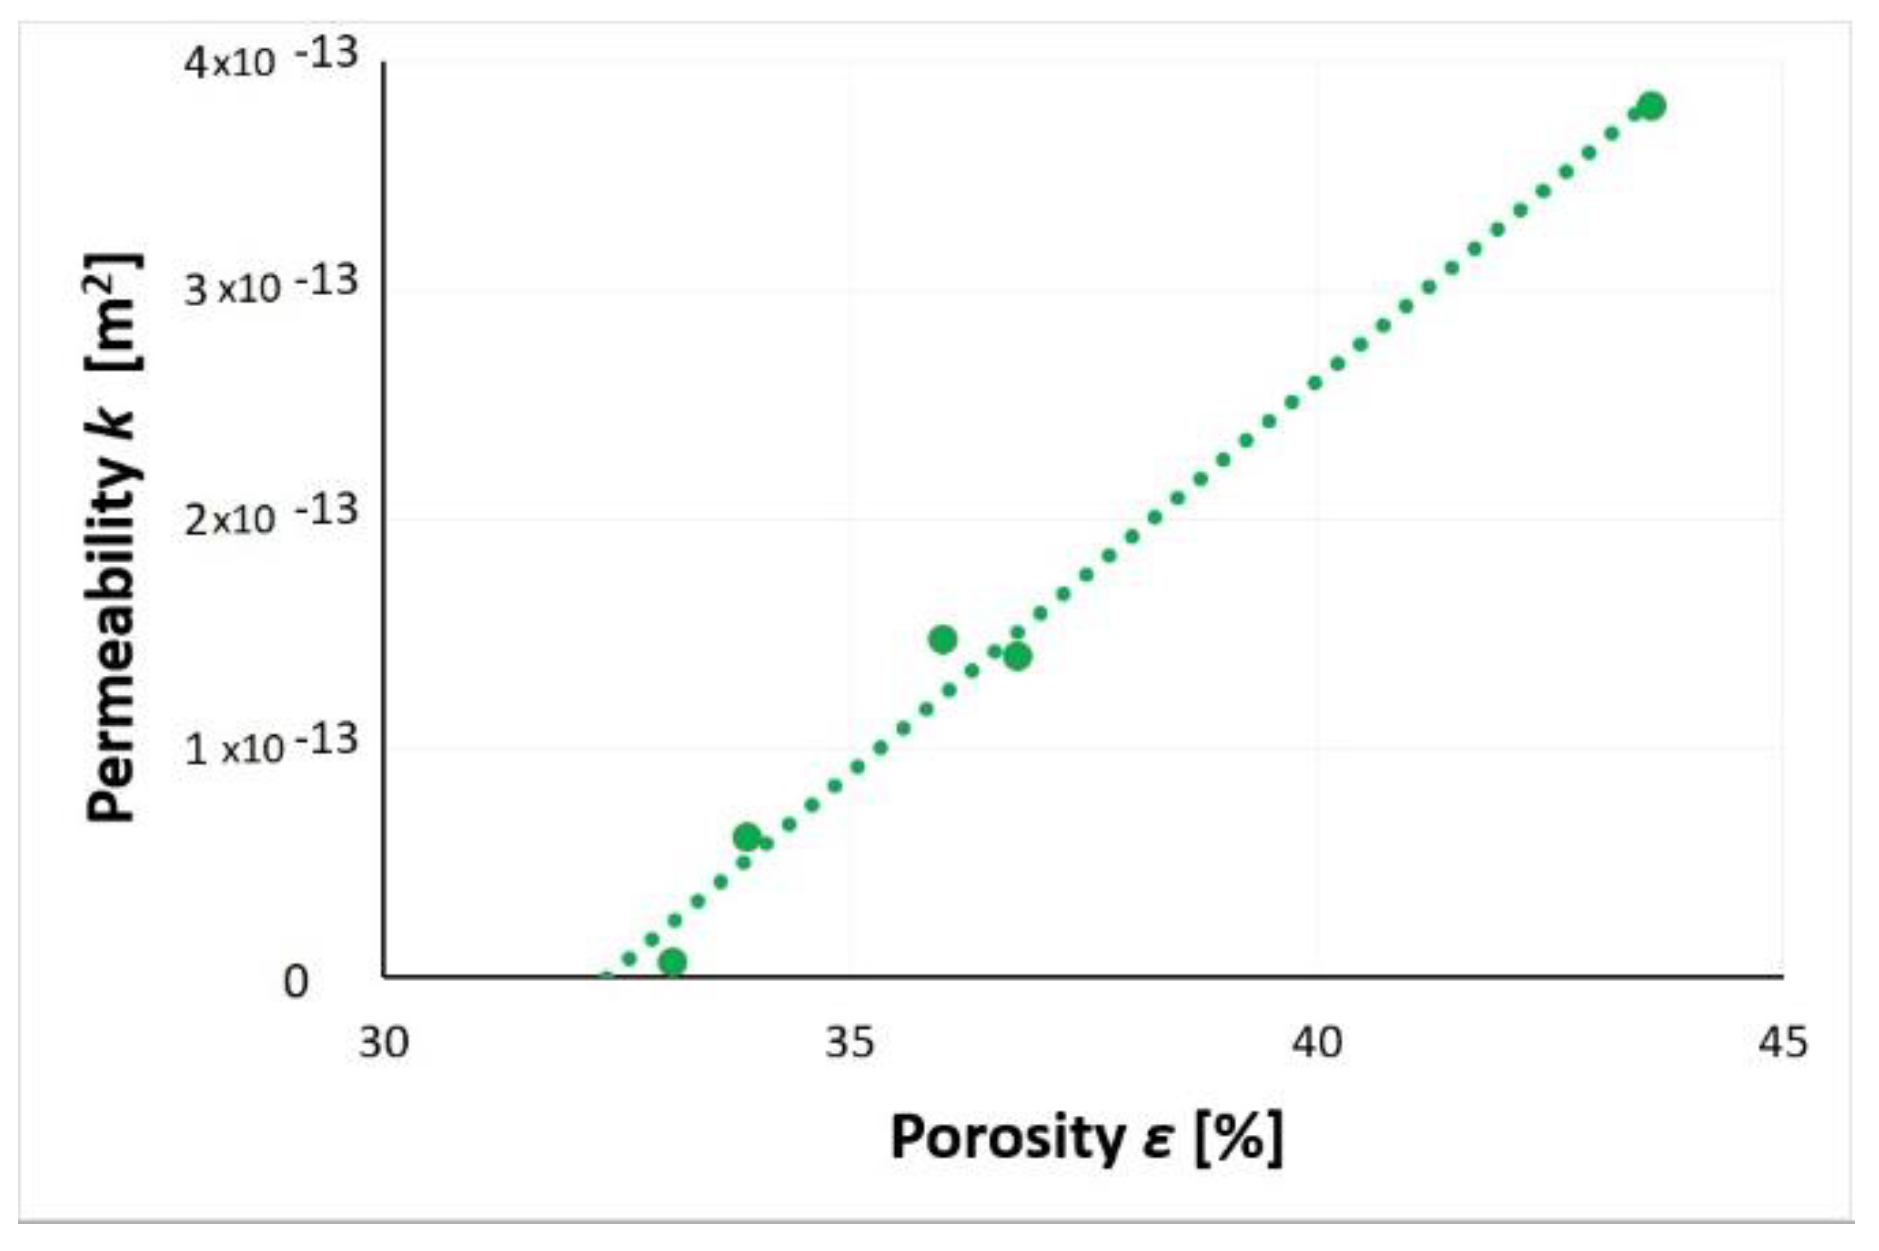
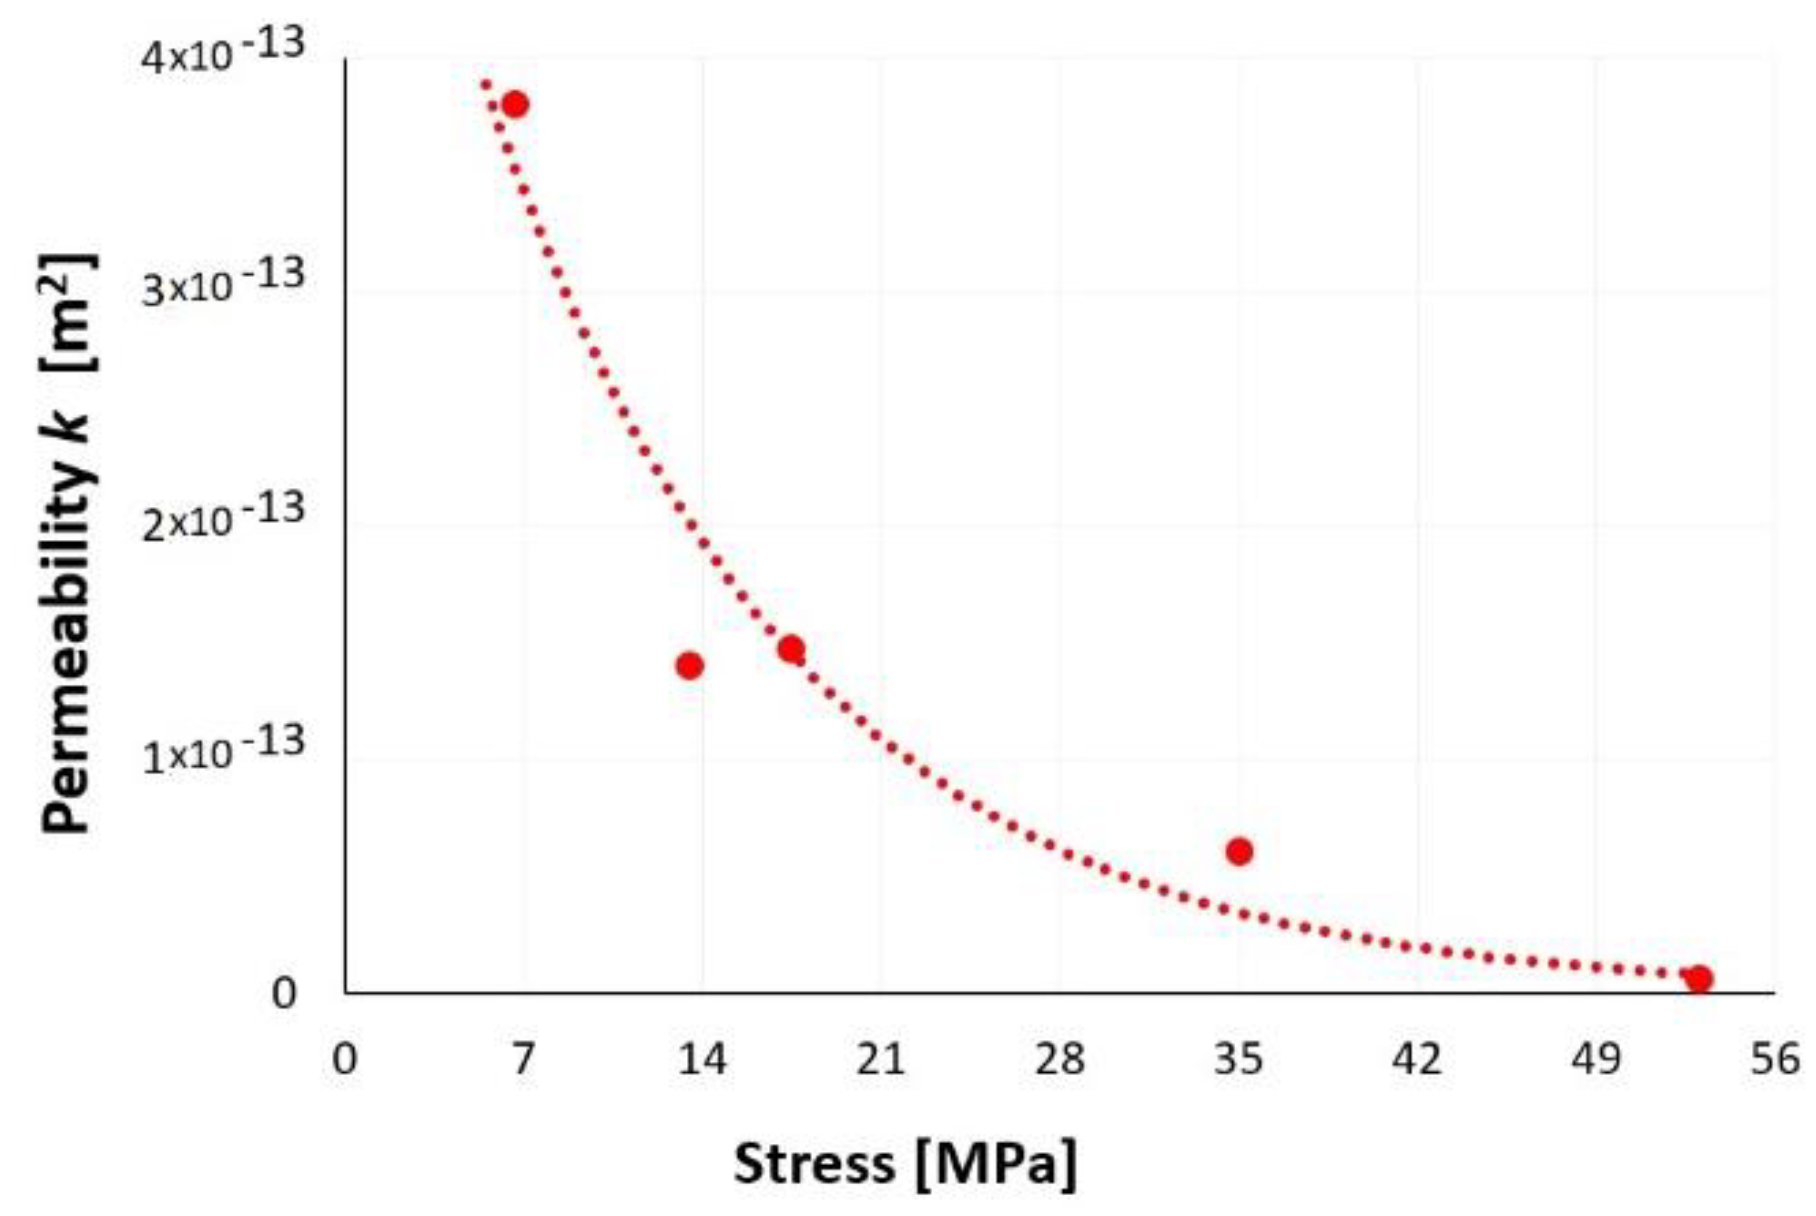
3.6. Gas Permeability

Table 5 presents changes in parameters obtained for five samples prepared by different consolidation of SP2 waste. As it can be seen from Table 5, as the consolidating force was increased, the density of the sample rose from 1.44 g/cm3, for the initially formed by 500 kg material, to 1.71 g/cm3 for the sample consolidated with a maximum force of 4000 kg. Using different consolidation forces, it was possible to obtain layers of post-process waste with different porosities (Table 5). It can be also seen from Table 5, the relationship between density and porosity of the formed layers was inversely proportional, with the other waste parameters such as moisture remaining constant.
Figure 37 presents the influence of the waste layer porosity on its gas permeability. The obtained dependence showed the proportionality of the analyzed parameters. The increase in porosity resulted in an increase of the slag and ash permeability to nitrogen. A significant reduction in waste porosity was associated with a significant reduction in permeability. By reducing the porosity of the waste layer to 33%, the material’s initial permeability of 3.8 × 10⁻¹³ m2 was reduced by two orders of magnitude to 5.8 × 10⁻¹⁵ m2. The slag and ash can be regarded as material with a very low permeability to nitrogen. A simple test confirmed that the porosity of SP2 layer had a dominant influence on the possibility of gas penetration through the soil medium.
Figure 38 presents the results of the nitrogen permeability tests performed. The average gas permeability k of the studied waste was 1.5 × 10⁻¹³ m2. The increase in stress applied to the sample resulted in a denser and less porous waste layers that contributed to the reduction of the slag and ash permeability. At 53 MPa, waste permeability was negligible and significantly limited by the stress state. The trend presented in Figure 38 shows that an increase in the stress exerted on the sample lead to a reduction of the nitrogen permeability or total impermeability of the waste layer. This issue requires further research.
The conducted permeability studies showed the applied stress reduced slag and ash porosity and thus significantly reduced permeability of the waste layer. Through the appropriate selection of the consolidation force, the final porosity of the waste layer can be designed and its permeability controlled.

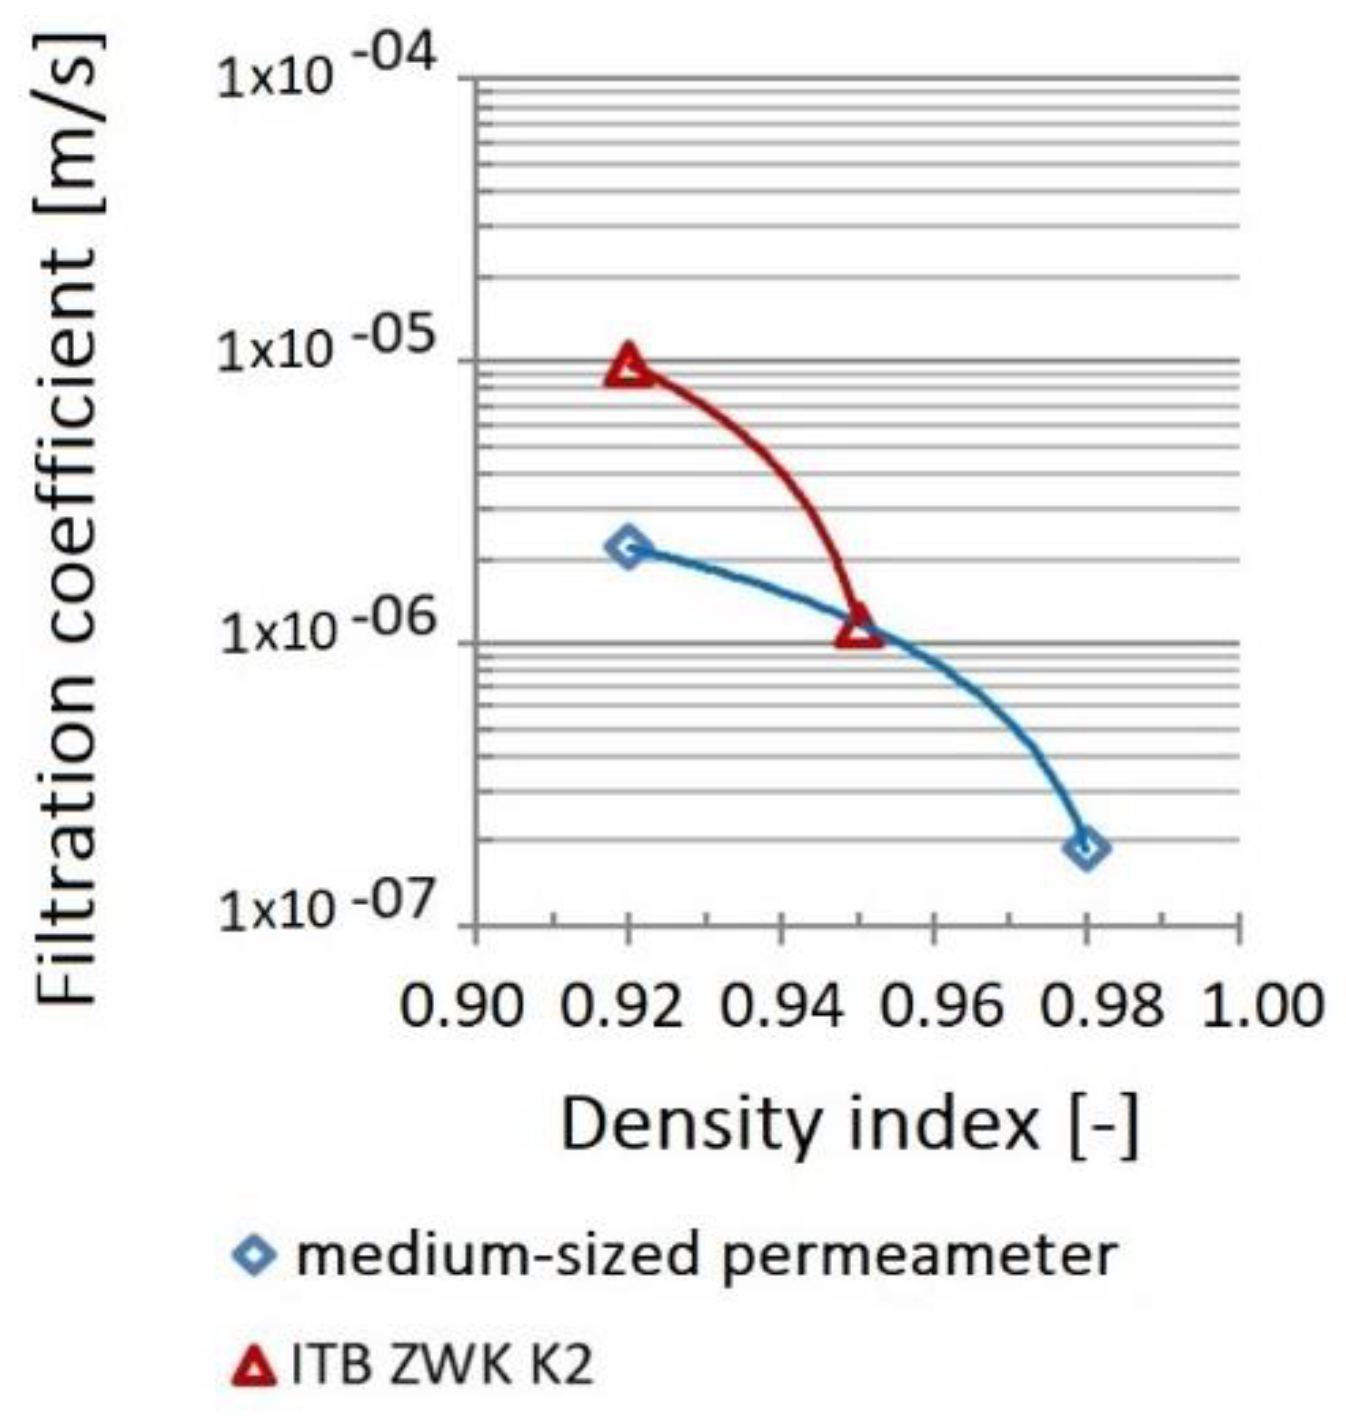
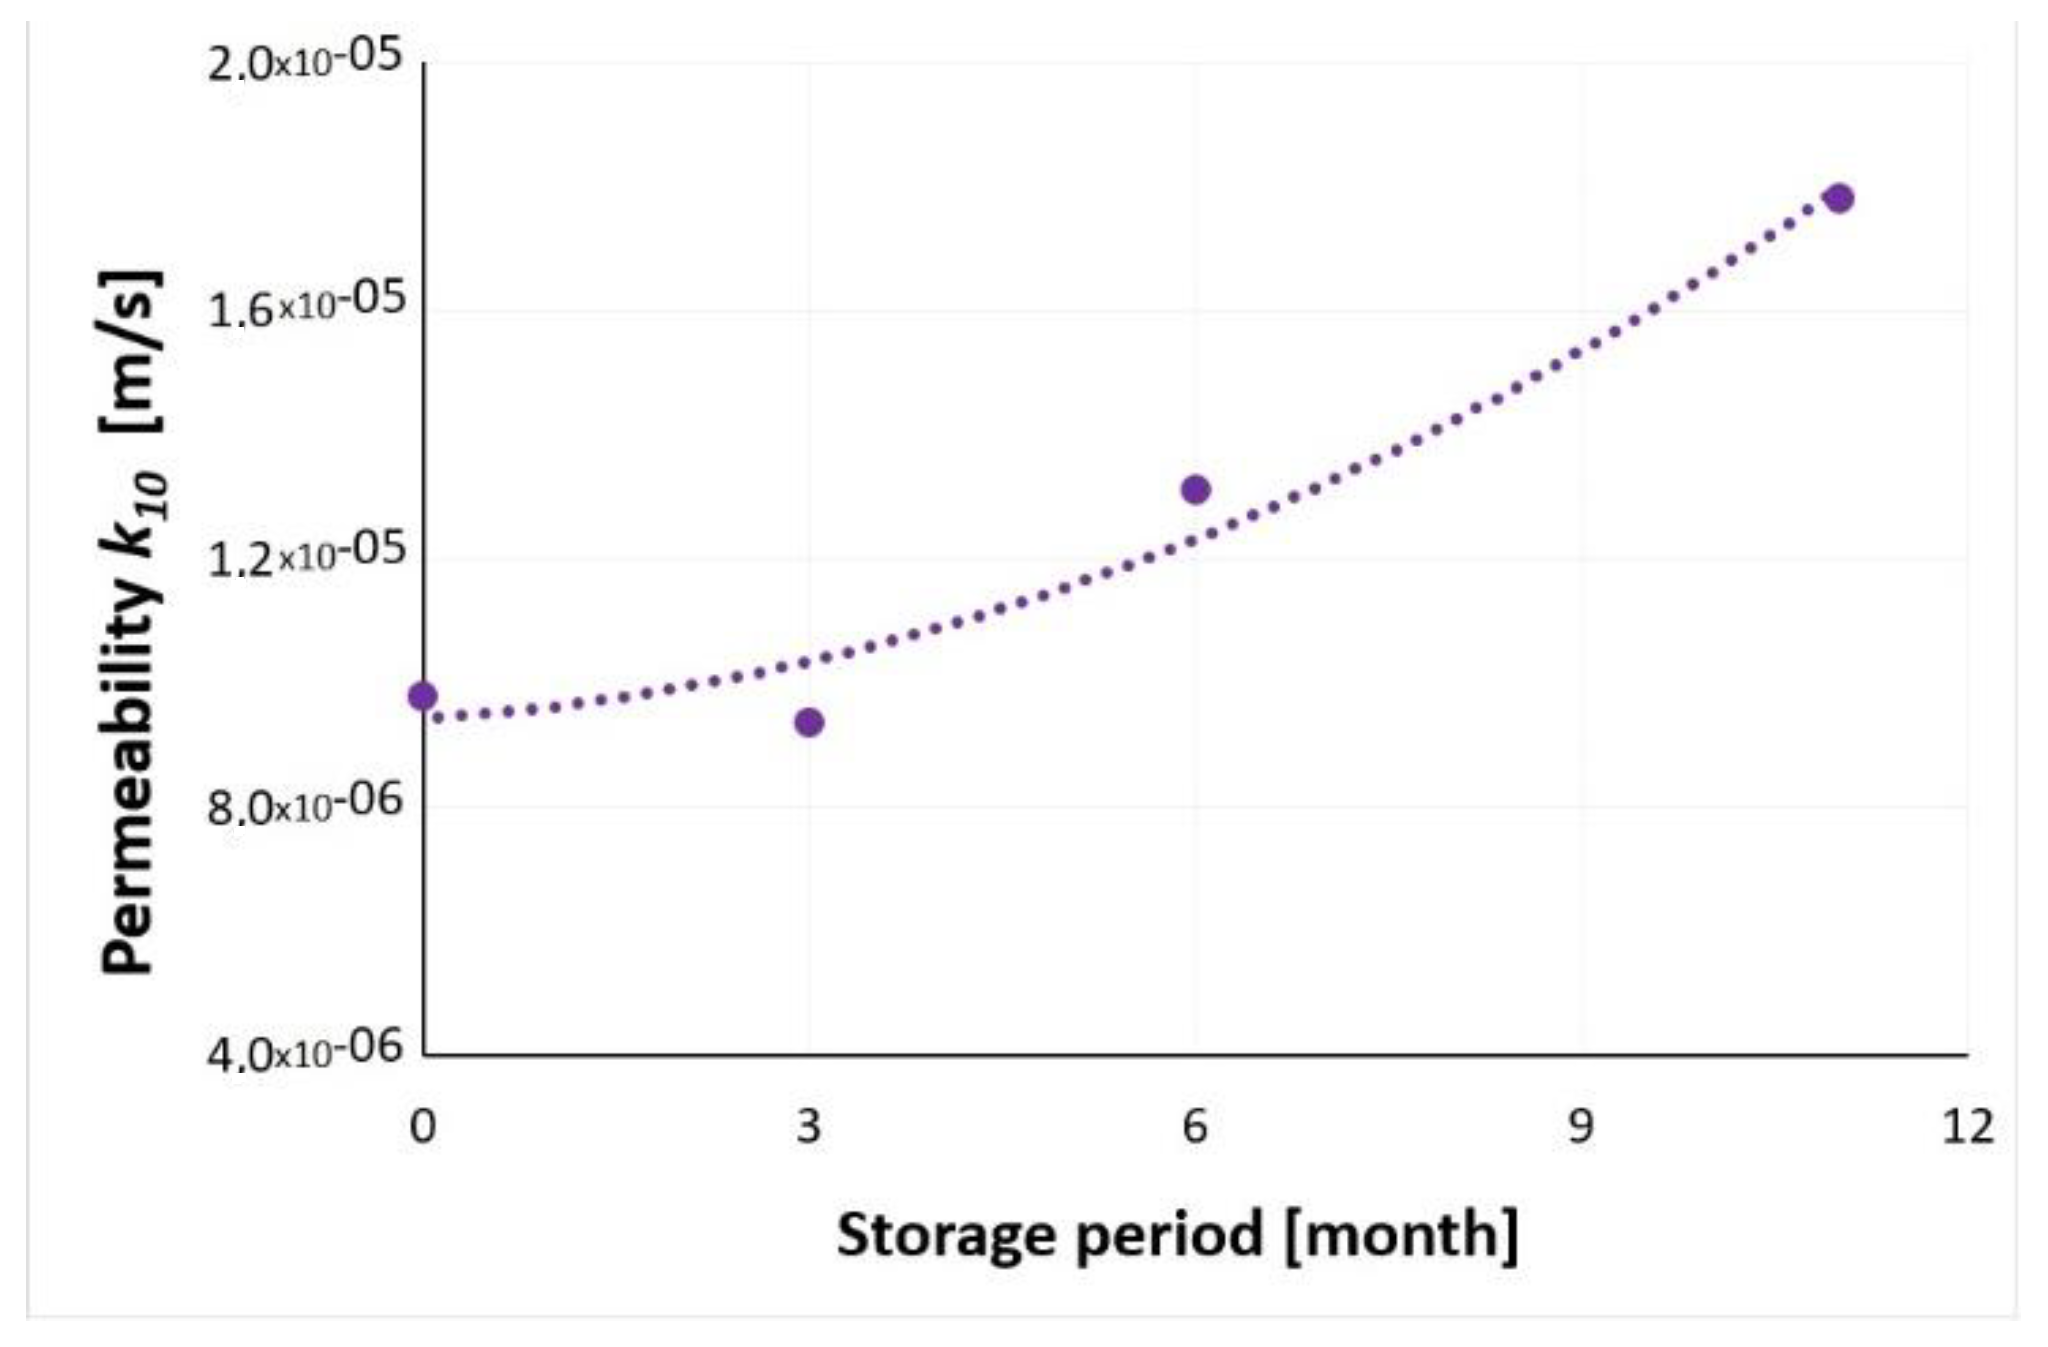
3.7. Water Permeability

Figure 39 shows the density curve of slag and post-process ash. The value of the maximum bulk density was 1.79 g/cm3, with an optimum humidity of 17.1%. Table 6 presents a summary of the obtained results of the slag and ash filtration coefficient tests immediately after incineration and, respectively, after 3, 6, and 11 months of storage [29].
Figure 40 shows the variability of the filtration coefficient of the tested waste samples depending on the density index obtained with the use of individual apparatuses. For the tests performed in the medium-sized permeameter, with an increase in the density index from IS = 0.92 to 0.98, the value of the filtration coefficient k10 decreased by one order of magnitude, from 2.20 × 10⁻⁶ to 1.88 × 10⁻⁷ m/s (Figure 40).
A similar relationship was obtained during measurements with the ITB ZW K2 apparatus. With density index increase from IS = 0.92 to 0.95, the value of the filtration coefficient decreased from 1.40 × 10⁻⁶ to 1.18 × 10⁻⁶ m/s. Tests with IS = 0.98 index could not be carried out for technical reasons (measuring range of the apparatus was exceeded).
The values of the filtration coefficient of slag and ash samples after 3, 6, and 11 months of seasoning, tested on the ITB ZW K2 apparatus, fluctuated in a small range and ranged from 1.78 × 10⁻⁵ to 9.37 × 10⁻⁶ m/s. However, as the period of waste storage was extended, an increase in the filtration coefficient was observed (Figure 41). Such a trend could result from the properties of the incinerated municipal waste, which tended to clump with the extension of the time spent in the landfill.

4. Conclusions

The analyzed slag and ash from the municipal waste incineration plant was characterized by specific properties. It was dominated by the gravel fraction, followed by the sand fraction, and the dust fraction had the smallest share in the structure of this material. It was noticed that with increasing time of seasoning, the material showed a higher percentage of the gravel fraction. This feature is most likely the effect of caking of the material along with the lengthening of the slag seasoning time. The seasoning process consists of the penetration of moisture contained in the air into the slag and ash grains, where hydration processes take place. Hydration consists of attaching water to anhydrous compounds contained in slag grains (e.g., transition of CaSO4 into CaSO4 × 2H2O).
On the basis of microscopic observations, it was found that all groups of slag and ash had similar features identifiable under microscopic magnifications. The main mineral components of municipal slag were quartz, melilite, calcite, feldspars, apatite, anhydrite or gypsum, and wollastonite. In each sample there was a significant content of anthropogenic materials unchanged in the combustion process, which did not undergo complete combustion. The seasoning time of the sample affected the variability of the pore content. Changes in the waste porosity were also observed in relation to the size of the analyzed grains. The individual fractions differed in the phase composition of the material. It was therefore shown that the division into fractions is important for the use of incinerated municipal waste.
The increase in stress applied resulted in a reduction of waste layer porosity and thus a significant decrease in gas permeability. The results of the water permeability tests showed the tendency of the material to clamp with increasing compaction force. With a density index of IS = 0.98, the ITB ZW K2 device failed to “push through” the water, which indicated that the waste was very poorly permeable. In the case of the medium-dimensional device, the experiment with the density index IS = 0.98 was finished, but the filtration was on the verge of measurability. As a result, heavy metals contained in the waste will not be able to migrate freely and with a high probability, regardless of the chemical composition, and the stressed waste will become neutral to the environment. With negligible leachability of heavy metals, the features of the incinerated municipal waste predispose them for the purposes of specialized hydrotechnical construction.
Finally, there is a sad conclusion. Despite the obligation to waste segregation, municipal waste sorted by citizens and sent to incineration plants contain a very large amount of material suitable for recycling. After the thermal conversion process of municipal waste, ferrous and non-ferrous metals are recovered on the premises of the plant (approximately 2% of metals are recovered from the total burnt substance). The post-process slag and ash, subject to further seasoning, which was examined in this work, showed a significant percentage of glass and metal content. Unfortunately, this is the result of improper segregation of waste by residents, and due to the fault of citizens, too much waste is sent to the incineration plant.

Author Contributions

Conceptualization, K.G. and B.D.; methodology, K.G. and B.D.; software, K.G.; validation, B.D.; formal analysis, B.D. and K.G.; investigation, B.D. and K.G.; writing—original draft preparation, B.D. and K.G.; writing—review and editing, K.G. and B.D.; visualization, K.G. and B.D.; funding acquisition, K.G. and B.D. All authors have read and agreed to the published version of the manuscript.

Funding

This research was funded by the Ministry of Science and Higher Education in Poland through the statutory research fund of the Polish Academy of Sciences.

Acknowledgments

The presented work was supported financially by the Ministry of Science and Higher Education (Poland) through the statutory research fund of the Polish Academy of Sciences. The financing concerned a project implemented as a part of the Internal Competition for Supporting Scientific Research of the Strata Mechanics Research Institute.

Conflicts of Interest

The authors declare no conflict of interest.

References

  1. Mądrawski, J.; Kostrzewski, W.; Smoczkiewicz-Wojciechowska, A. Problematyka wykorzystania odpadów typu żużle ze spalarni śmieci komunalnych do produkcji betonów. Przegląd. Bud. 2017, 88, 105–107. [Google Scholar]
  2. de Lorena Diniz Chaves, G.; Ribeiro Siman, R.; Mattos Ribeiro, G.; Chang, N.-B. Synergizing environmental, social, and economic sustainability factors for refuse derived fuel use in cement industry: A case study in Espirito Santo, Brazil. J. Environ. Manag. 2021, 288, 112401. [Google Scholar] [CrossRef] [PubMed]
  3. Musiał, M.; Pękala, A. Functioning of Heat Accumulating Composites of Carbon Recyclate and Phase Change Material. Materials 2022, 15, 2331. [Google Scholar] [CrossRef] [PubMed]
  4. Baran, P.; Nazarko, M.; Włosińska, E.; Kanciruk, A.; Zarębska, K. Synthesis of geopolymers derived from fly ash with an addition of perlite. J. Clean. Prod. 2021, 293, 126112. [Google Scholar] [CrossRef]
  5. Zarębska, K.; Zabierowski, P.; Gazda-Grzywacz, M.; Czuma, N.; Baran, P. Fly ash-based geopolymers with refractoriness properties. Clean Technol. Environ. Policy 2022, 24, 2161–2175. [Google Scholar] [CrossRef]
  6. 2021. Available online: https://khk.krakow.pl (accessed on 23 October 2022).
  7. Gluzińska, J.; Walawska, B.; Łuczkowska, D.; Pajdak, A. Properties of waste fly ash as a hard coal combustion by-product after the application of dry sodium sorbents to purify flue gases. Trans. Strat. Mech. Res. Inst. 2016, 18, 83–91. [Google Scholar]
  8. Pajdak, A.; Szymanek, A. The characteristics and the concept of the utilisation of post-production calcareous waste deposited in landfills. Mineralogia 2017, 48, 167–179. [Google Scholar] [CrossRef] [Green Version]
  9. Wielgosinski, G. Termiczne przekształcanie odpadów. Wydawnictwo Nowa Energia. 2020. Available online: https://nowa-energia.com.pl/wydawnictwa-ksiazkowe/ (accessed on 23 October 2022).
  10. Vehlow, J.; Bergfeldt, B.; Wilen, C.; Ran-ta, J.; Schwaiger, H.; Visser, H.J.M.; Gu, S.; Gyftopoulou, E.; Brammer, J. Management of Solid Residues in Waste-to-Energy and Biomass Systems. Forschungszentrum Karlsruhe (FZKA 7347), Karlsruhe. 2007. Available online: https://cris.vtt.fi/en/publications/management-of-solid-residues-in-waste-to-energy-and-biomass-syste (accessed on 23 October 2022).
  11. Blajer, M.; Stopkowicz, A.; Adamczyk, J.; Cała, M. The preliminary research of the physico-mechanical properties of aggregates based on the colliery shale, supplemented by fly ash. Arch. Min. Sci. 2019, 64, 21–34. [Google Scholar]
  12. PN-EN 12457-(1–4). Charakteryzowanie Odpadów. Wymywanie. Badanie Zgodności w Odniesieniu do Wymywania Ziarnistych Materiałów Odpadowych i Osadów. 2006. Available online: https://sklep.pkn.pl/pn-en-12457-4-2006p.html (accessed on 23 October 2022).
  13. Wielgosiński, G.; Wasiak, D. Politechnika Łódzka Wydział Inżynierii Procesowej i Ochrony Środowiska. 2014. Available online: https://sdr.gdos.gov.pl/Documents/GO/Spotkanie%2029.04.2014/WIELGOSINSKI---Badania.pdf (accessed on 23 October 2022).
  14. Tessier, A.; Campbell, P.; Bisson, M. Sequential extraction procedure for the speciation of particulate trace metal. Anal. Chem. Acta 1979, 286, 423–442. [Google Scholar] [CrossRef]
  15. Wielgosiński, G.; Wasiak, D.; Zawadzka, A. The Use of Sequential Extraction for Assessing Environmental Risks of Waste Incineration Bottom Ash. Ecol. Chem. Eng. S 2014, 21, 413–423. [Google Scholar] [CrossRef] [Green Version]
  16. van Herck, P.; Vandecasteele, C. Evaluation of the use of a sequential extraction procedure for the characterization and treatment of metal containing solid waste. Waste Manag. 2001, 21, 685–694. [Google Scholar] [CrossRef]
  17. Sutherland, R.A. BCR®-701: A review of 10-years of sequential extraction analyses. Anal. Chim. Acta 2010, 680, 10–20. [Google Scholar] [CrossRef]
  18. Sakita, S.; Nishimoto, J.; Nishimura, K. Porous Structure of Municipal Solid Waste Incineration Bottom Ash in Initial Stage of Landfill. J. Geosci. Environ. Prot. 2017, 5, 9–20. [Google Scholar] [CrossRef]
  19. Ritzkowski, M.; Stegmann, R. Landfill Aeration within the Scope of Post-Closure Care and Its Completion. Waste Manag. 2013, 33, 2074–2082. [Google Scholar] [CrossRef]
  20. Pfrang-Stotz, G.; Schneider, J. Comparative studies of waste combustion bottom ashes from various grate and firing systems, conducted with respect to mineralogical and geochemical methods of examination. Waste Manag. Res. 1995, 13, 273–292. [Google Scholar] [CrossRef]
  21. Eusden, J.D.; Eighmy, T.T.; Hockert, K.; Holland, E.; Marsella, K. Petrogenesis of municipal solid waste combustion bottom ash. Appl. Geochem. 1999, 14, 1073–1091. [Google Scholar] [CrossRef]
  22. Bayuseno, A.P.; Schmahl, W.W. Understanding the chemical and mineralogical properties of the inorganic portion of MSWI bottom ash. Waste Manag. 2010, 30, 1509–1520. [Google Scholar] [CrossRef]
  23. Dutka, B.; Godyń, K. Coalification as a process determining the methane adsorption ability of coal seams. Arch. Min. Sci. 2021, 66, 181–195. [Google Scholar]
  24. Nowak-Winiarska, K.; Wrobel, S.; Sienkiewicz-Cholewa, U. Application of sequential analysis with the BCR method in the estimation of effects of chemical remediation of soil polluted with copper. Chem. Spec. Bioavailab. 2012, 24, 53. [Google Scholar] [CrossRef]
  25. Sutherland, R.A.; Tack, F.M.G. Determination of Al, Cu, Fe, Mn, Pb and Zn in certified reference materials using the optimized BCR sequential extraction procedure. Anal. Chim. Acta 2002, 454, 249. [Google Scholar] [CrossRef]
  26. Godyń, K.; Dutka, B.; Chuchro, M.; Młynarczuk, M. Synergy of parameters determining the optimal properties of coal as a natural sorbent. Energies 2020, 13, 1967. [Google Scholar] [CrossRef]
  27. Zeng, G.; Liu, L.; Xue, Q.; Wan, Y.; Ma, J.; Zhao, Y. Experimental study of the porosity and permeability of municipal solid waste. Environ. Prog. Sustain. Energy 2017, 36, 1694–1699. [Google Scholar] [CrossRef]
  28. Dutka, B. Effect of depth on the sorption capacity of coals affected by outburst hazard. Fuel 2021, 306, 121611. [Google Scholar] [CrossRef]
  29. Godyń, K.; Dutka, B. Slags and ashes generated in the process of incineration of municipal waste as one of the cogs of the circular economy. In Proceedings of SEEP 2022; Brunel University: London, UK, 2022; pp. 12–15. [Google Scholar]
Figure 1. Macrophotographs of raw slag samples with visible, unburnt fragments of municipal waste.
Energies 16 00117 g001
Figure 2. Original setup for gas permeability testing of post-process waste: red line is nitrogen inlet; blue line is nitrogen outlet (B. Dutka).
Energies 16 00117 g002
Figure 3. Cylinders of a medium-size permeameter for filtration coefficient testing (A. Gruchot).
Energies 16 00117 g003
Figure 4. General view of the ITB-ZW-K2 apparatus for the filtration coefficient measurement (A. Gruchot).
Energies 16 00117 g004
Figure 5. Cumulative curves and histograms on the basis of grain size analysis from three groups of slag.
Energies 16 00117 g005
Figure 6. Quartz grain with embedded apatite (SP1 sample), thin section, 2P, 200×, transmitted light.
Energies 16 00117 g006
Figure 7. Grain of quartz, melilite, and carbonates (calcite) (SP2 sample), thin section, 2P, 100×, transmitted light.
Energies 16 00117 g007
Figure 8. Melilite and quartz grains (SP1 sample), thin section, 2P, 100×, transmitted light.
Energies 16 00117 g008
Figure 9. Quartz, calcite, and melilite in the SP2 sample, thin section, 2P, 100×, transmitted light.
Energies 16 00117 g009
Figure 10. Plagioclase—visible multiple twinning and residual zonal structure. SP3 sample, thin section, 2P, 100×, transmitted light.
Energies 16 00117 g010
Figure 11. Microcline (K-feldspar) with visible twinning in two directions. SP3 sample, thin section, 2P, 200×, transmitted light.
Energies 16 00117 g011
Figure 12. Potassium feldspar, double twinned (orthoclase) surrounded by quartz grains. SP2 sample, thin section, 2P, 200×, transmitted light.
Energies 16 00117 g012
Figure 13. Potassium feldspar, and quartz, SP2 sample, thin section, 2P, 100×, transmitted light.
Energies 16 00117 g013
Figure 14. Glass in SP2 slag and ash sample, thin section, 1P, 200×, transmitted light.
Energies 16 00117 g014
Figure 15. Glass in SP2 slag and ash sample, thin section, 1P, 200×,transmitted light.
Energies 16 00117 g015
Figure 16. Glass in SP3 slag and ash sample, thin section, 1P, 100×, transmitted light.
Energies 16 00117 g016
Figure 17. Glass in SP3 slag and ash sample, thin section, 2P, 100×, transmitted light.
Energies 16 00117 g017
Figure 18. Metallic substance, shiny. SP2 sample, macrophotograph of the polished section prepared for microscopic analysis.
Energies 16 00117 g018
Figure 19. Metallic substance, shiny. SP2 sample, thin section, 1P, 200×, reflected light.
Energies 16 00117 g019
Figure 20. Metallic substance, shiny. SP2 sample, thin section, 1P, 100×, transmitted light.
Energies 16 00117 g020
Figure 21. Metallic substance, shiny. SP2 sample, thin section, 2P, 100×, transmitted light.
Energies 16 00117 g021
Figure 22. Metallic substance. Unburned fragment of anthropogenic origin. SP2 sample, thin section, 1P, 100×, reflected light.
Energies 16 00117 g022
Figure 23. Metallic substance. Unburned fragment of anthropogenic origin. SP2 sample, thin section, 1P, 100×, transmitted light.
Energies 16 00117 g023
Figure 24. Metallic substance. Unburned fragment of anthropogenic origin. SP2 sample, thin section, 2P, 100×, transmitted light.
Energies 16 00117 g024
Figure 25. Metallic substance. Unburned fragment of anthropogenic origin. SP3 sample, thin section, 2P, 100×, reflected light.
Energies 16 00117 g025
Figure 26. Pores visible under a stereomicroscope, SP1 sample, magnification 100×.
Energies 16 00117 g026
Figure 27. Closed pores visible under a petrographic microscope, SP1 sample, polished section, 1P, 100×, reflected light.
Energies 16 00117 g027
Figure 28. Closed pores visible under a petrographic microscope, polished section, 1P, 100×, reflected light.
Energies 16 00117 g028
Figure 29. Closed pores visible under a petrographic microscope, polished section, 1P, 100×, reflected light.
Energies 16 00117 g029
Figure 30. Porosity dependence on the analyzed grain fraction (SP2 sample).
Energies 16 00117 g030
Figure 31. Oval, large (about 0.6 mm) pores in the slag, fraction above 4 mm, SP2 sample, magnification 100×, reflected light, section.
Energies 16 00117 g031
Figure 32. Oval, small (up to about 0.1 mm) pores in the slag, fraction below 0.63 mm, SP2 sample, magnification 100×, reflected light, section.
Energies 16 00117 g032
Figure 33. Mineral and non-mineral grains, SP2 sample, 0.4–0.25 mm fraction, fine cut, magnification 50×, 1N, transmitted light.
Energies 16 00117 g033
Figure 34. Quartz grains of white–gray colors, SP2 sample, 0.4–0.25 mm fraction, fine cut, magnification 50×, NX, transmitted light.
Energies 16 00117 g034
Figure 35. Total metal content in the studied waste samples.
Energies 16 00117 g035aEnergies 16 00117 g035b
Figure 36. Distribution of metals in particular fractions and susceptibility to release increasing from F4 to F0.
Energies 16 00117 g036
Figure 37. Relationship between layer porosity and gas permeability of SP2 slag and ash.
Energies 16 00117 g037
Figure 38. Effect of stress on SP2 gas permeability.
Energies 16 00117 g038
Figure 39. Compactability (Proctor) curve of the tested slag and ash sample.
Energies 16 00117 g039
Figure 40. Dependence of the filtration coefficient on compaction.
Energies 16 00117 g040
Figure 41. The dependence of the filtration coefficient on the time of waste storage.
Energies 16 00117 g041
Table 1. Porosity of slag and ash samples determined by microscopic point analysis (Figure 26, Figure 27, Figure 28 and Figure 29).
Waste SampleSP1SP2SP3
Porosity (%)9.0712.9212.74
Table 2. Porosity of individual grain fractions (SP2 sample).
Sample fraction (mm)4–2.52.5–1.61.6–11–0.630.63–0.40.4–0.25
Porosity (%)19.819.9711.5511.325.874.15
Table 3. Results of densimetric studies of waste with different seasoning times.
Slag and Ash ρ r ,   g / cm 3 ρ p ,   g / cm 3 ε, %Vp, cm3/g
SP1C2.5641.95123.90.123
SP2C2.5551.95723.40.120
SP3C2.5621.96523.30.119
Table 4. Influence of the SP2 sample separation on density and porosity.
Sample Fraction (mm) ρ r ,   g / cm 3 ρ p ,   g / cm 3 ε ,   % Vp, cm3/g ε Z ,   % ε O = ε ε Z ,   %
2 SP > 6.32.4681.95720.70.1120.00.7
2 SP > 42.52122.40.1420.02.4
2 SP > 2.52.52722.60.1619.82.8
2 SP > 1.02.59524.60.2111.613.0
2 SP > 0.632.56423.70.1811.312.4
2 SP > 0.252.58524.30.204.220.1
Table 5. Samples for gas permeability testing.
Waste SampleSP2
Consolidation force (kg)5001000130026004000
Stress (MPa)6.713.517.535.053.0
Layer density (g/cm3)1.441.621.631.691.71
Porosity (%)43.636.836.033.933.1
Permeability (m2)3.8 × 10−131.4 × 10−131.5 × 10−136.0 × 10−145.8 × 10⁻¹⁵
Table 6. Summary of the filtration coefficient of the tested slag and ash.
Density IndexApparatusStorage Time
Without Storage3 Months6 Months11 Months
Filtration Coefficient, k10 [m/s]
IS = 0.92Medium-dimensional permeameter2.20 × 10−6
IS = 0.981.88 × 10−7
IS = 0.92ITB ZW K29.79 × 10−69.37 × 10−61.31 × 10−51.78 × 10⁻⁵
IS = 0.959.46 × 10−6
IS = 0.98Water flow was not obtained
Disclaimer/Publisher’s Note: The statements, opinions and data contained in all publications are solely those of the individual author(s) and contributor(s) and not of MDPI and/or the editor(s). MDPI and/or the editor(s) disclaim responsibility for any injury to people or property resulting from any ideas, methods, instructions or products referred to in the content.

