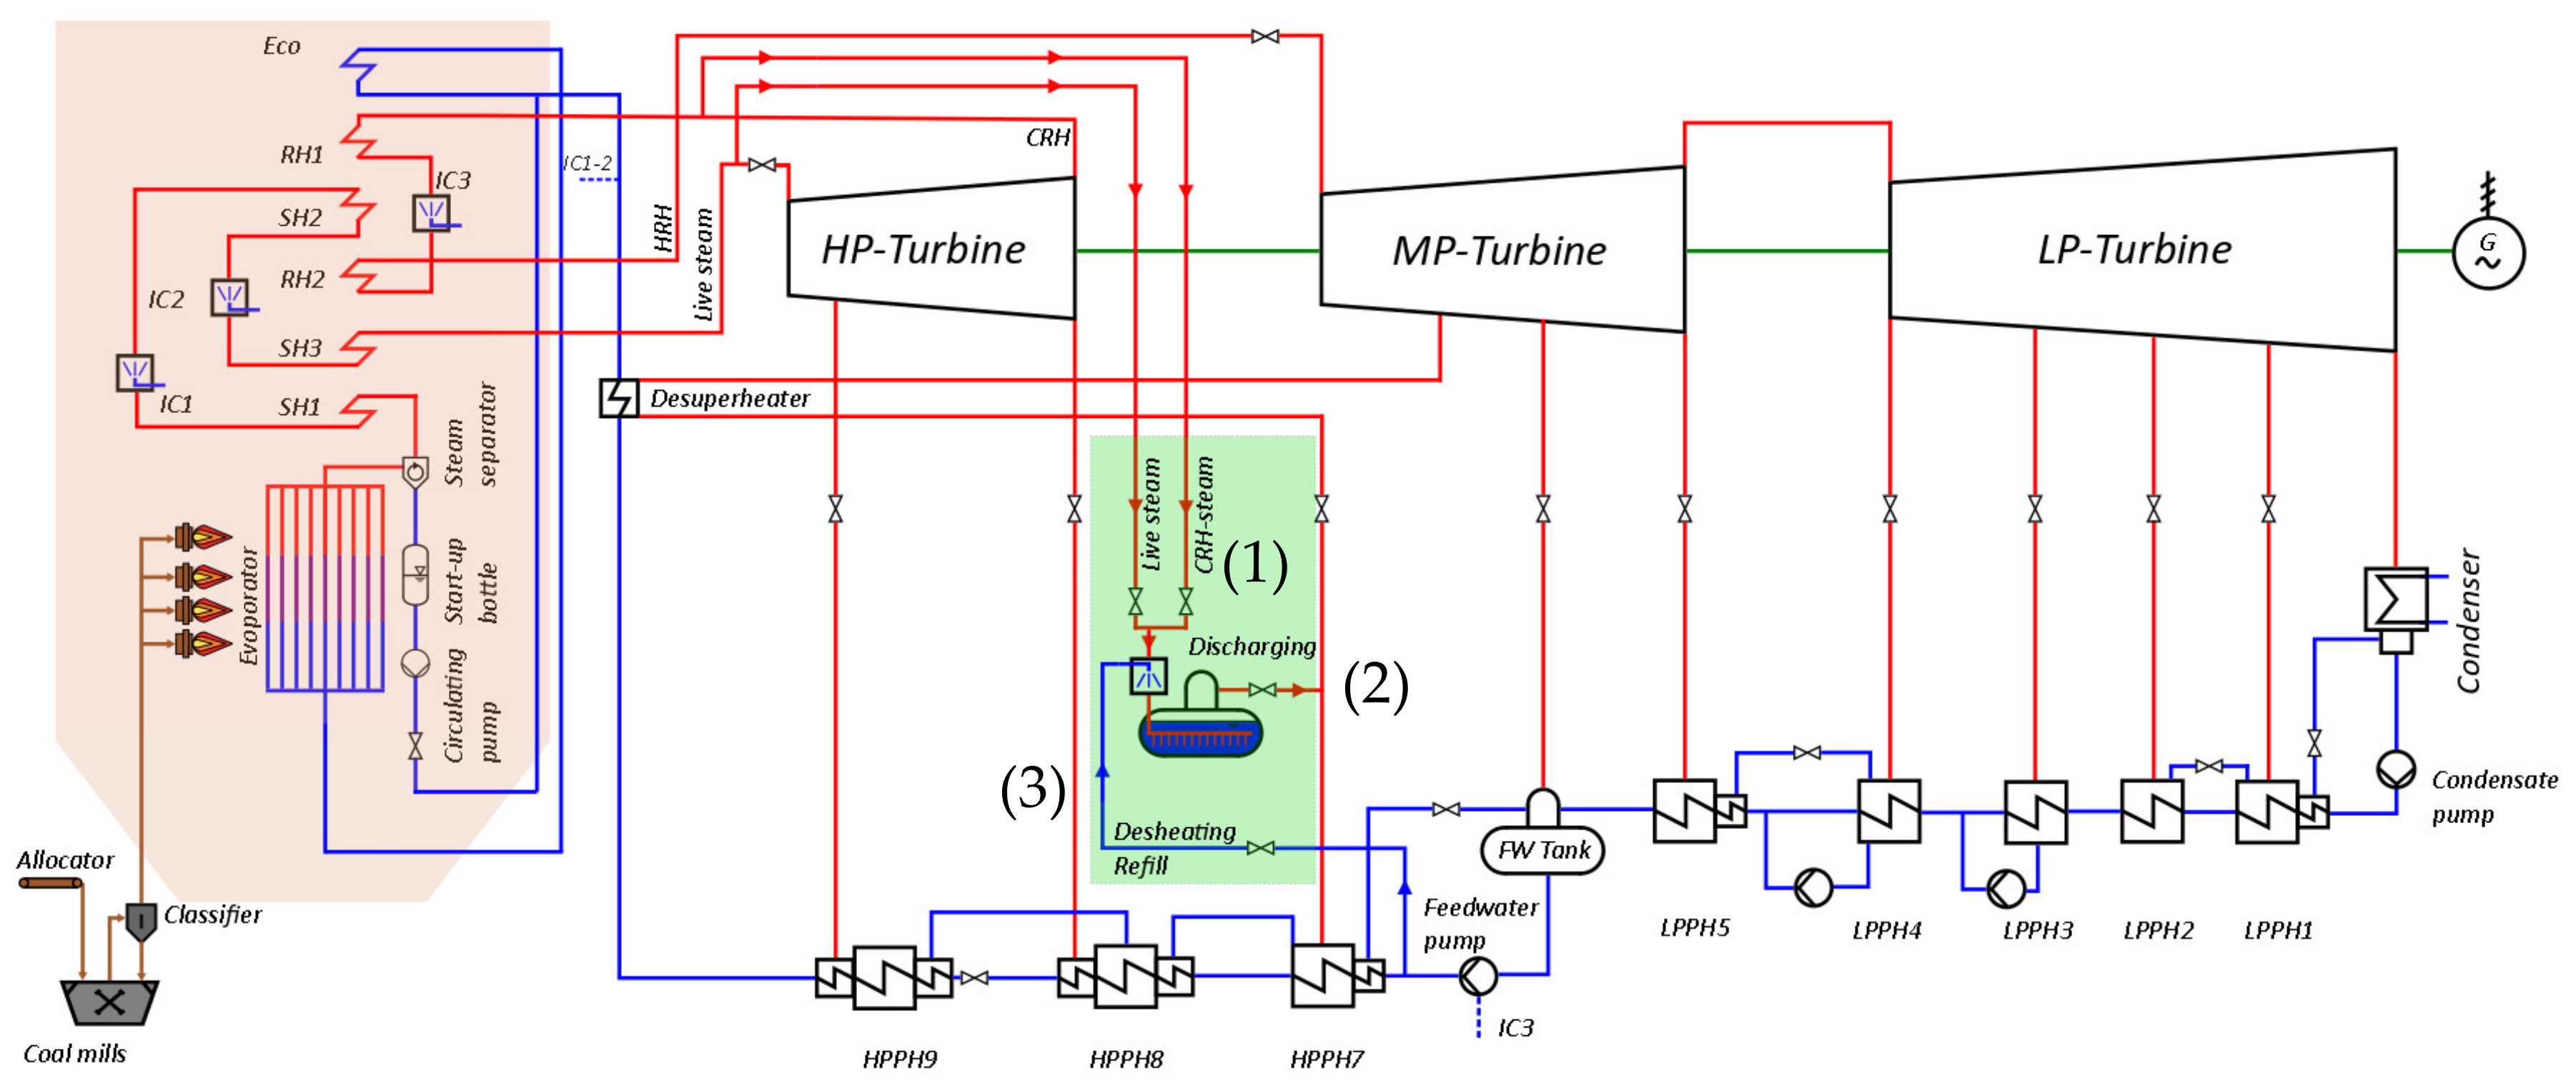
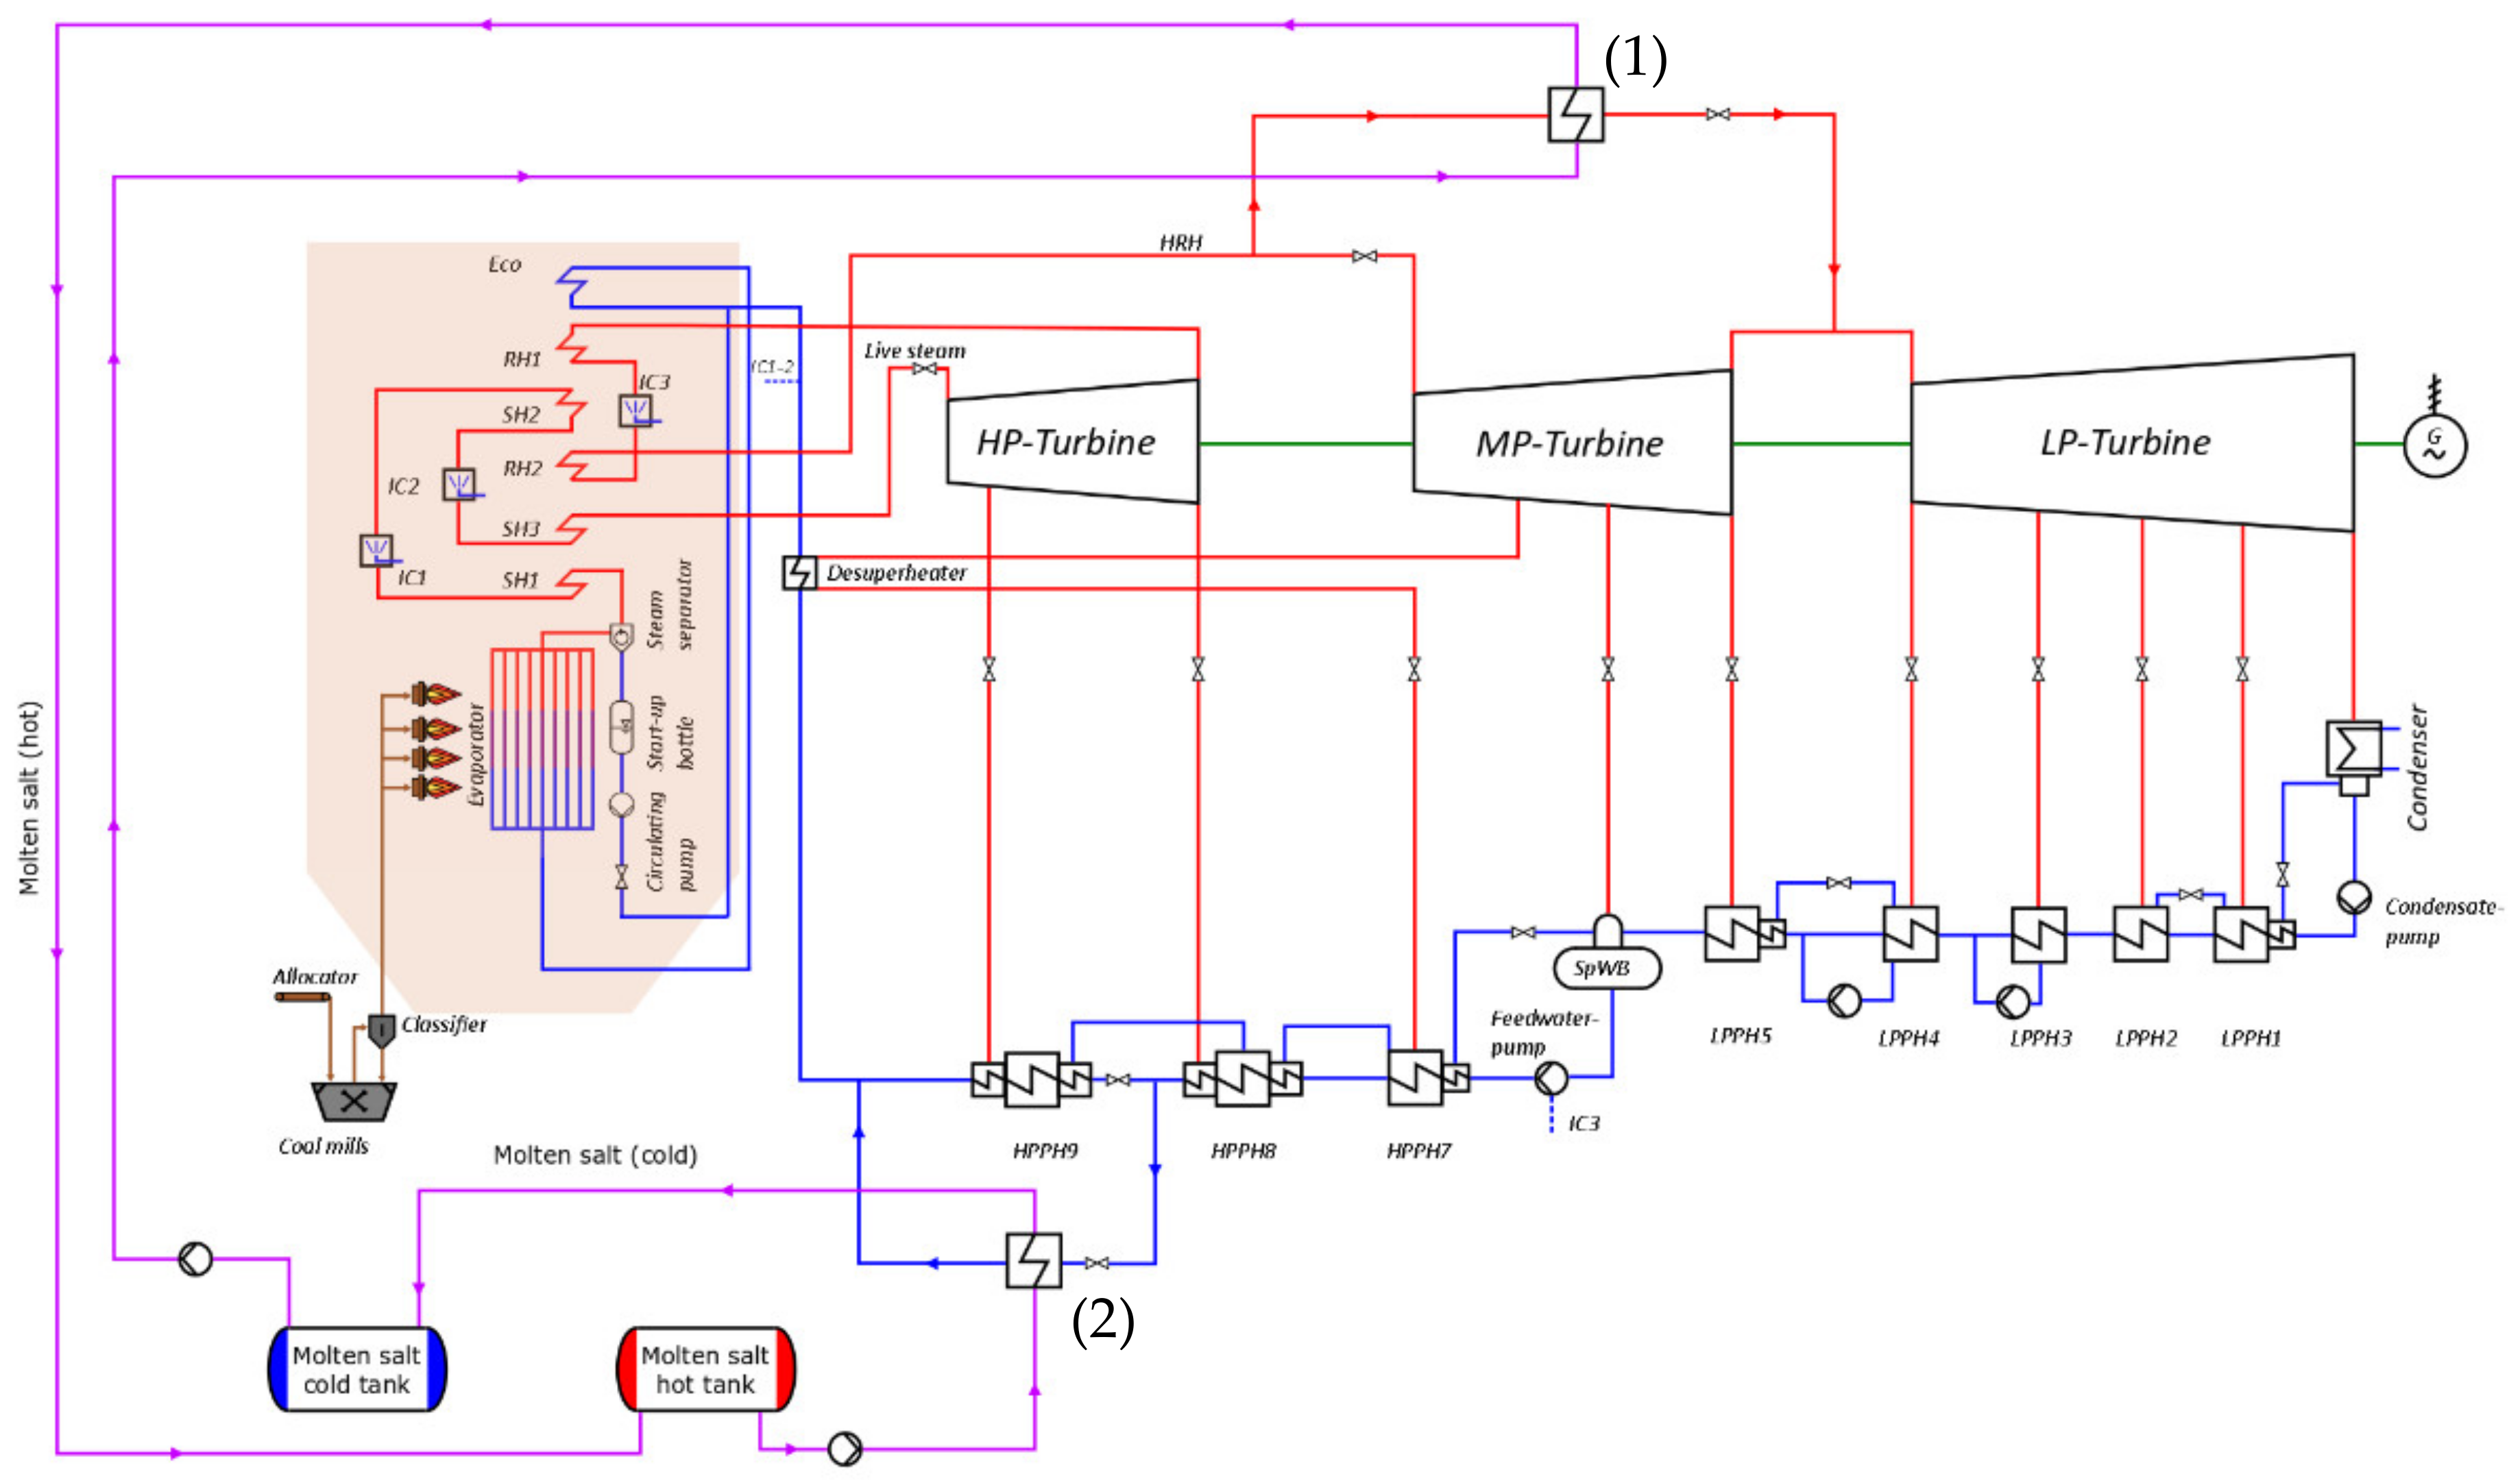
Figure 1.
Thermal circuit diagram of an 800-MW power plant with molten salt storage (concept HRH-HPPH9_indirectly).
Figure 1.
Thermal circuit diagram of an 800-MW power plant with molten salt storage (concept HRH-HPPH9_indirectly).
Figure 2.
Thermal circuit diagram of an 800-MW power plant with Ruths storage (concept CRH/LS-HPPH7_directly).
Figure 2.
Thermal circuit diagram of an 800-MW power plant with Ruths storage (concept CRH/LS-HPPH7_directly).
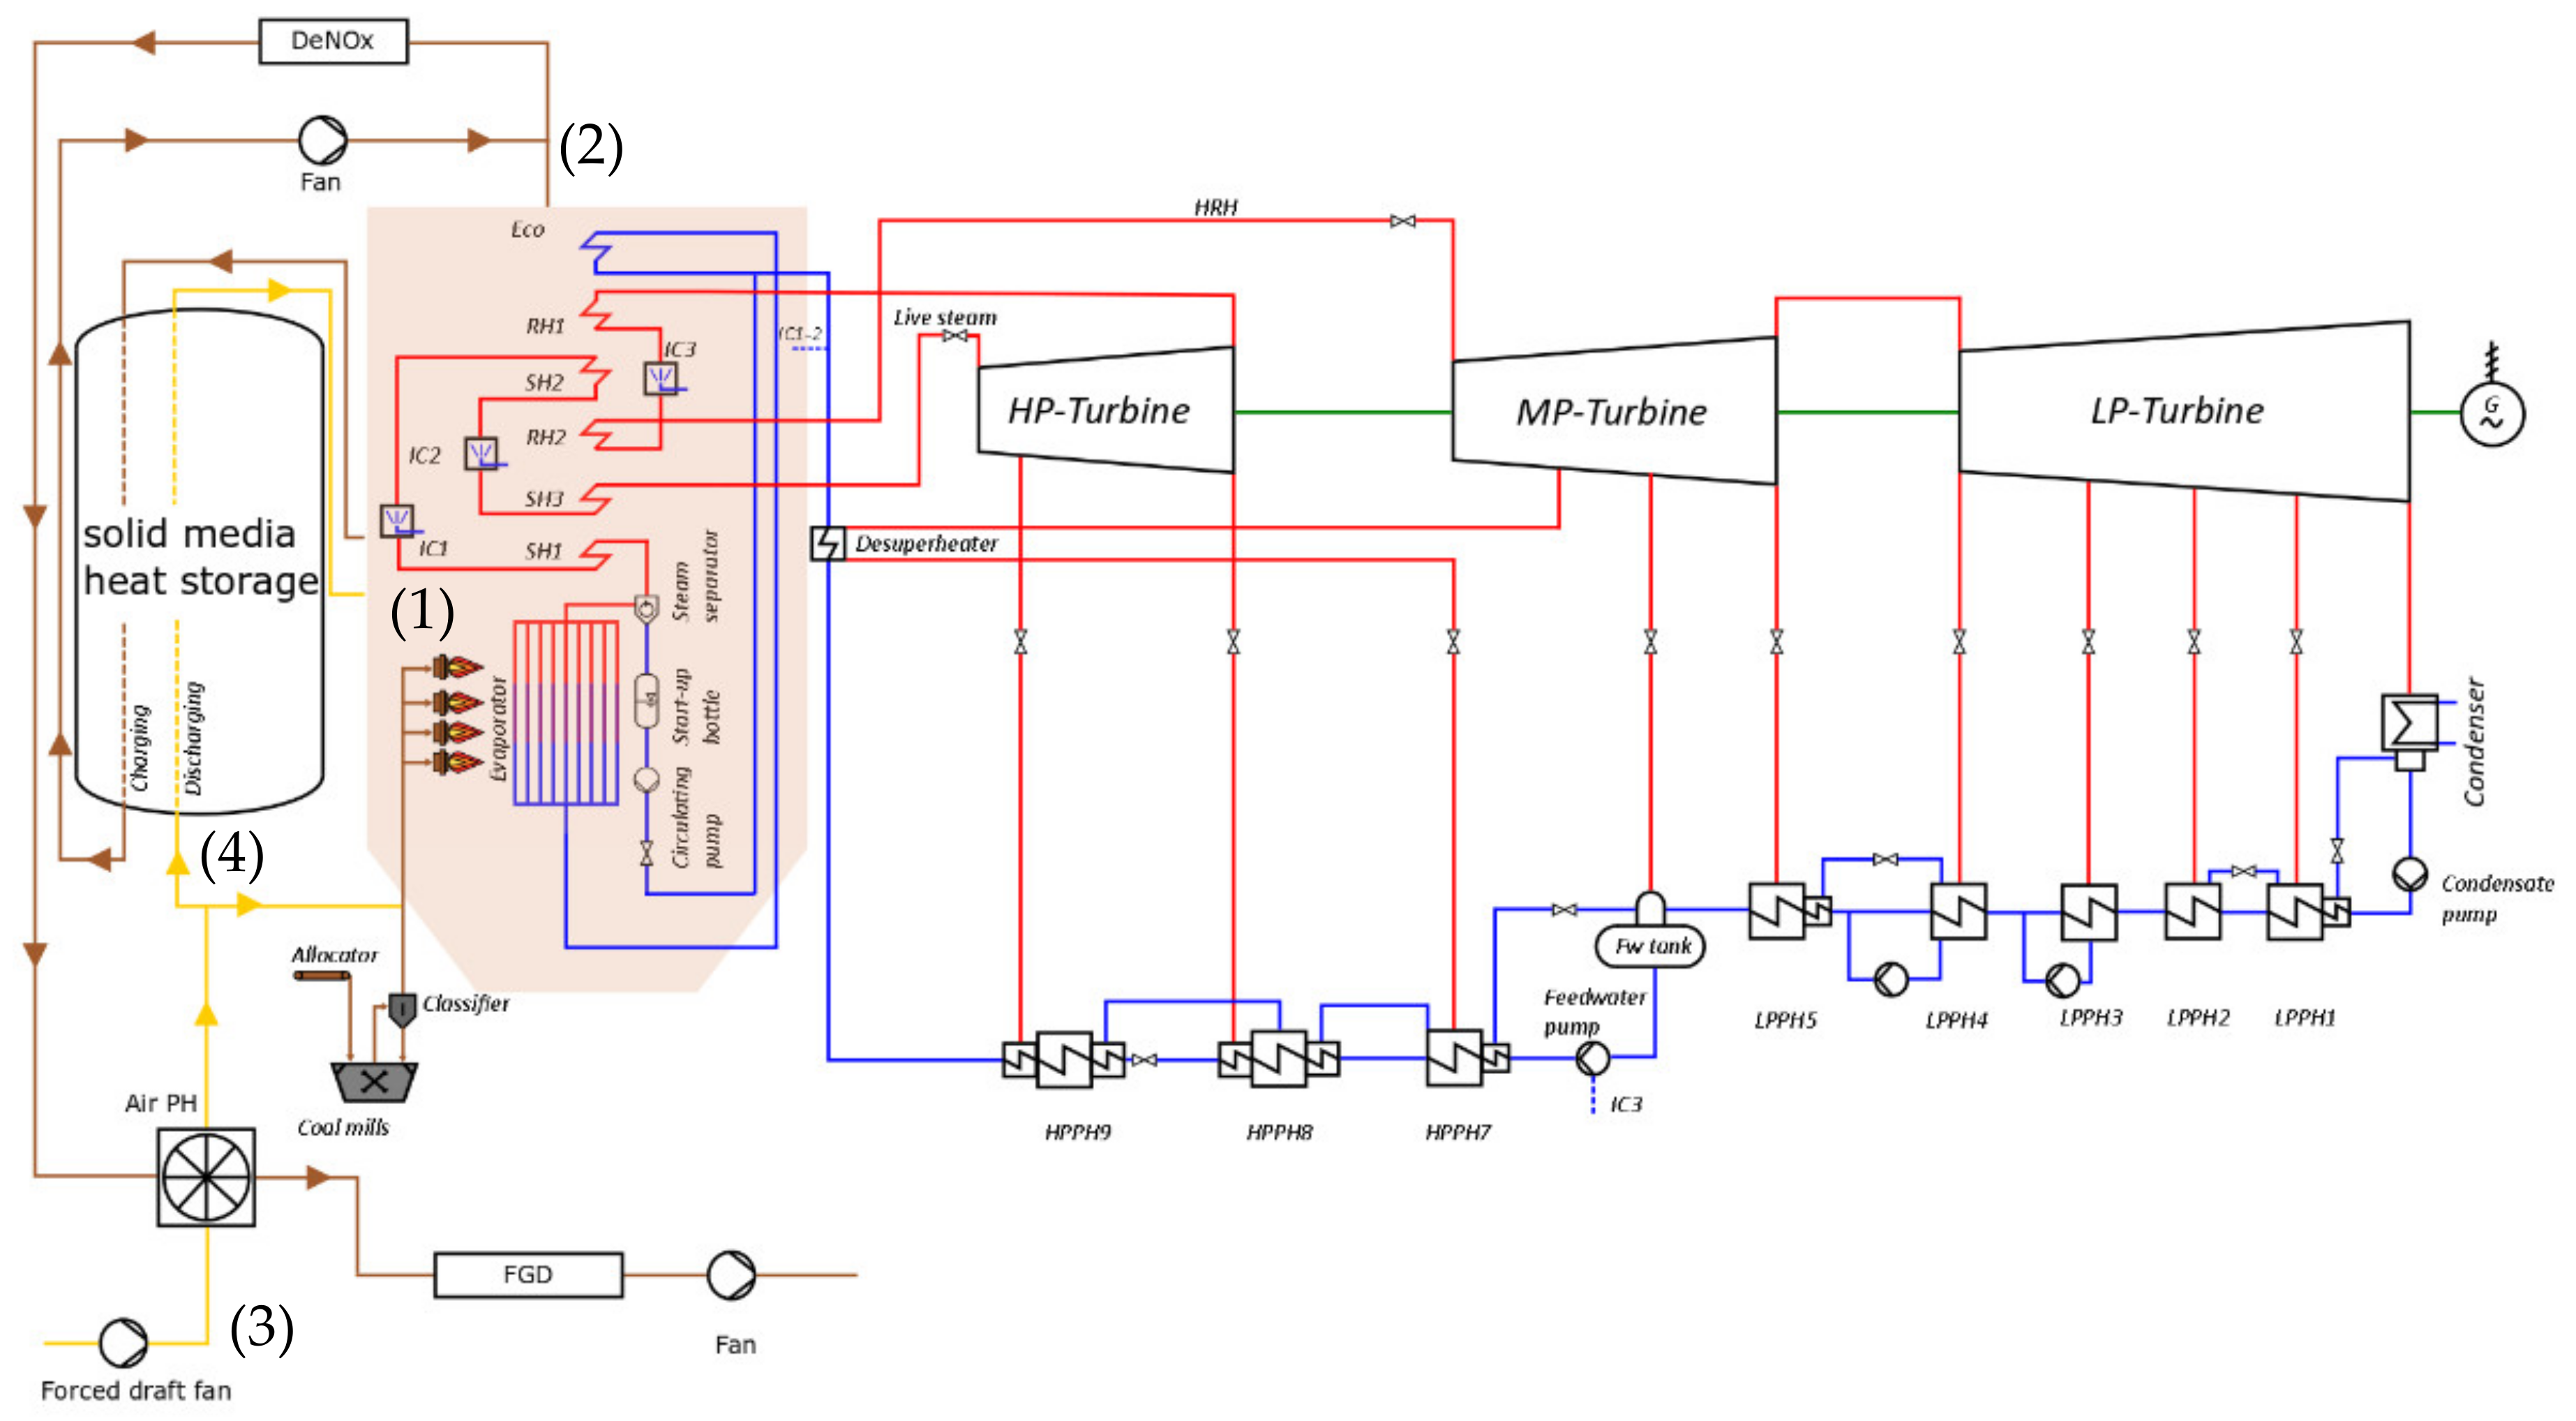
Figure 3.
Thermal circuit diagram of an 800-MW power plant with solid media heat storage (concept Flue gas-Air_indirectly).
Figure 3.
Thermal circuit diagram of an 800-MW power plant with solid media heat storage (concept Flue gas-Air_indirectly).
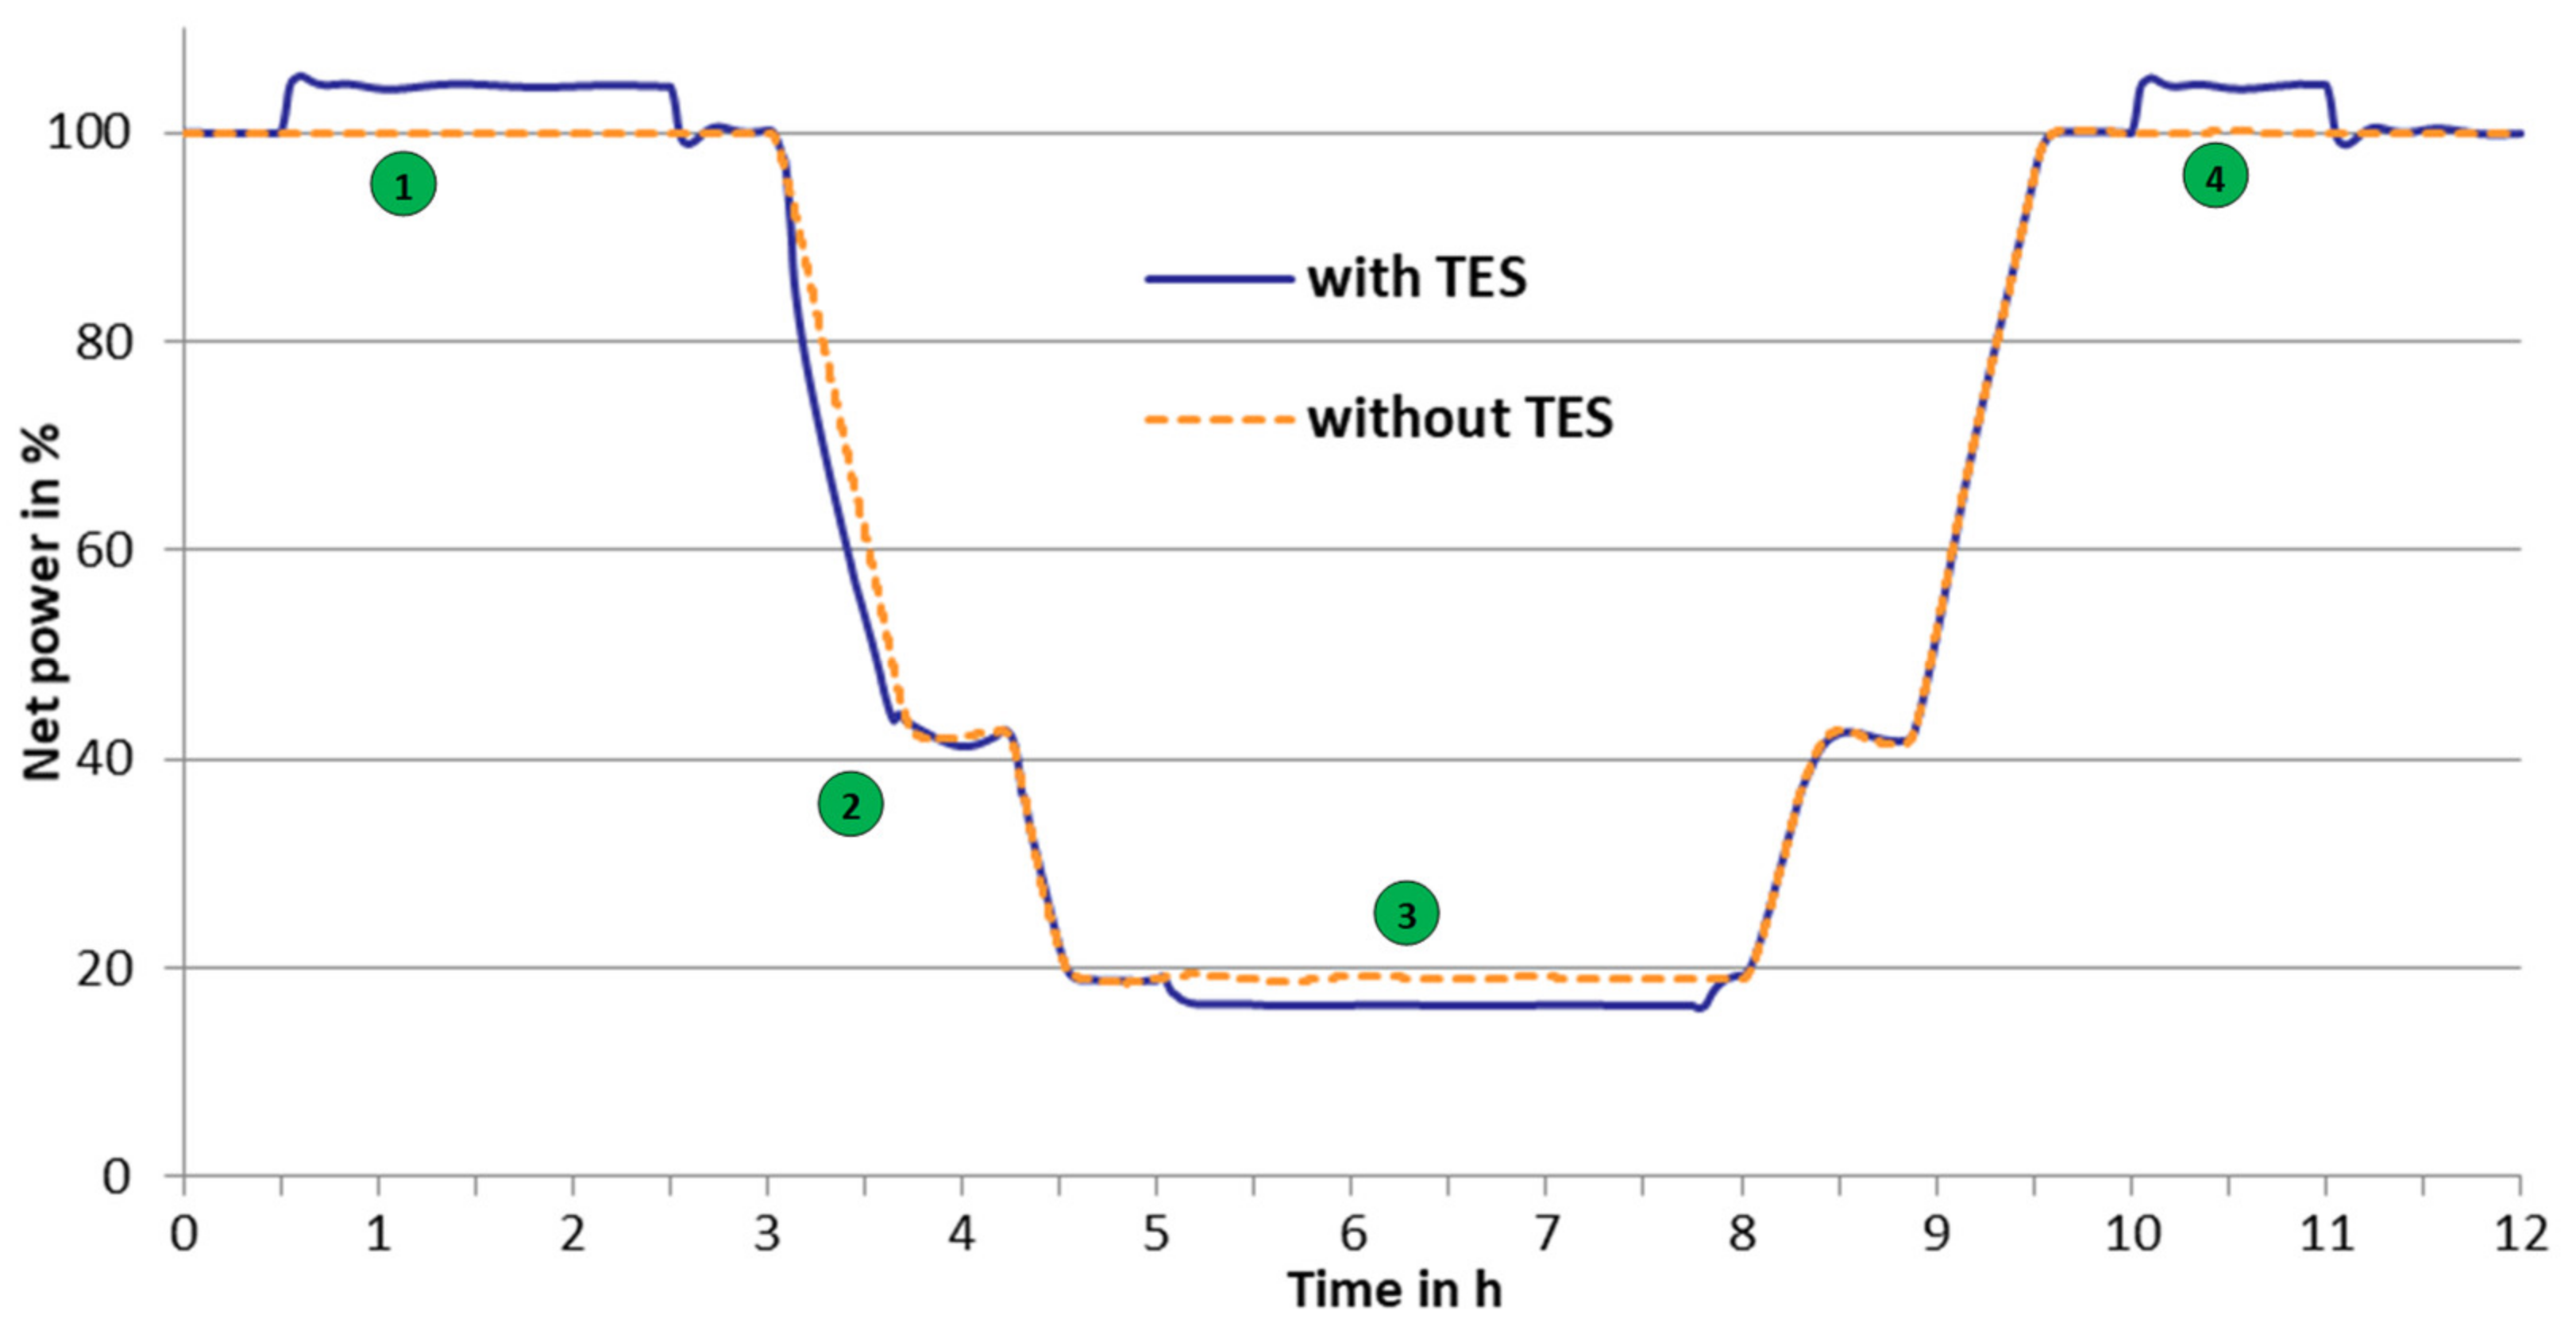
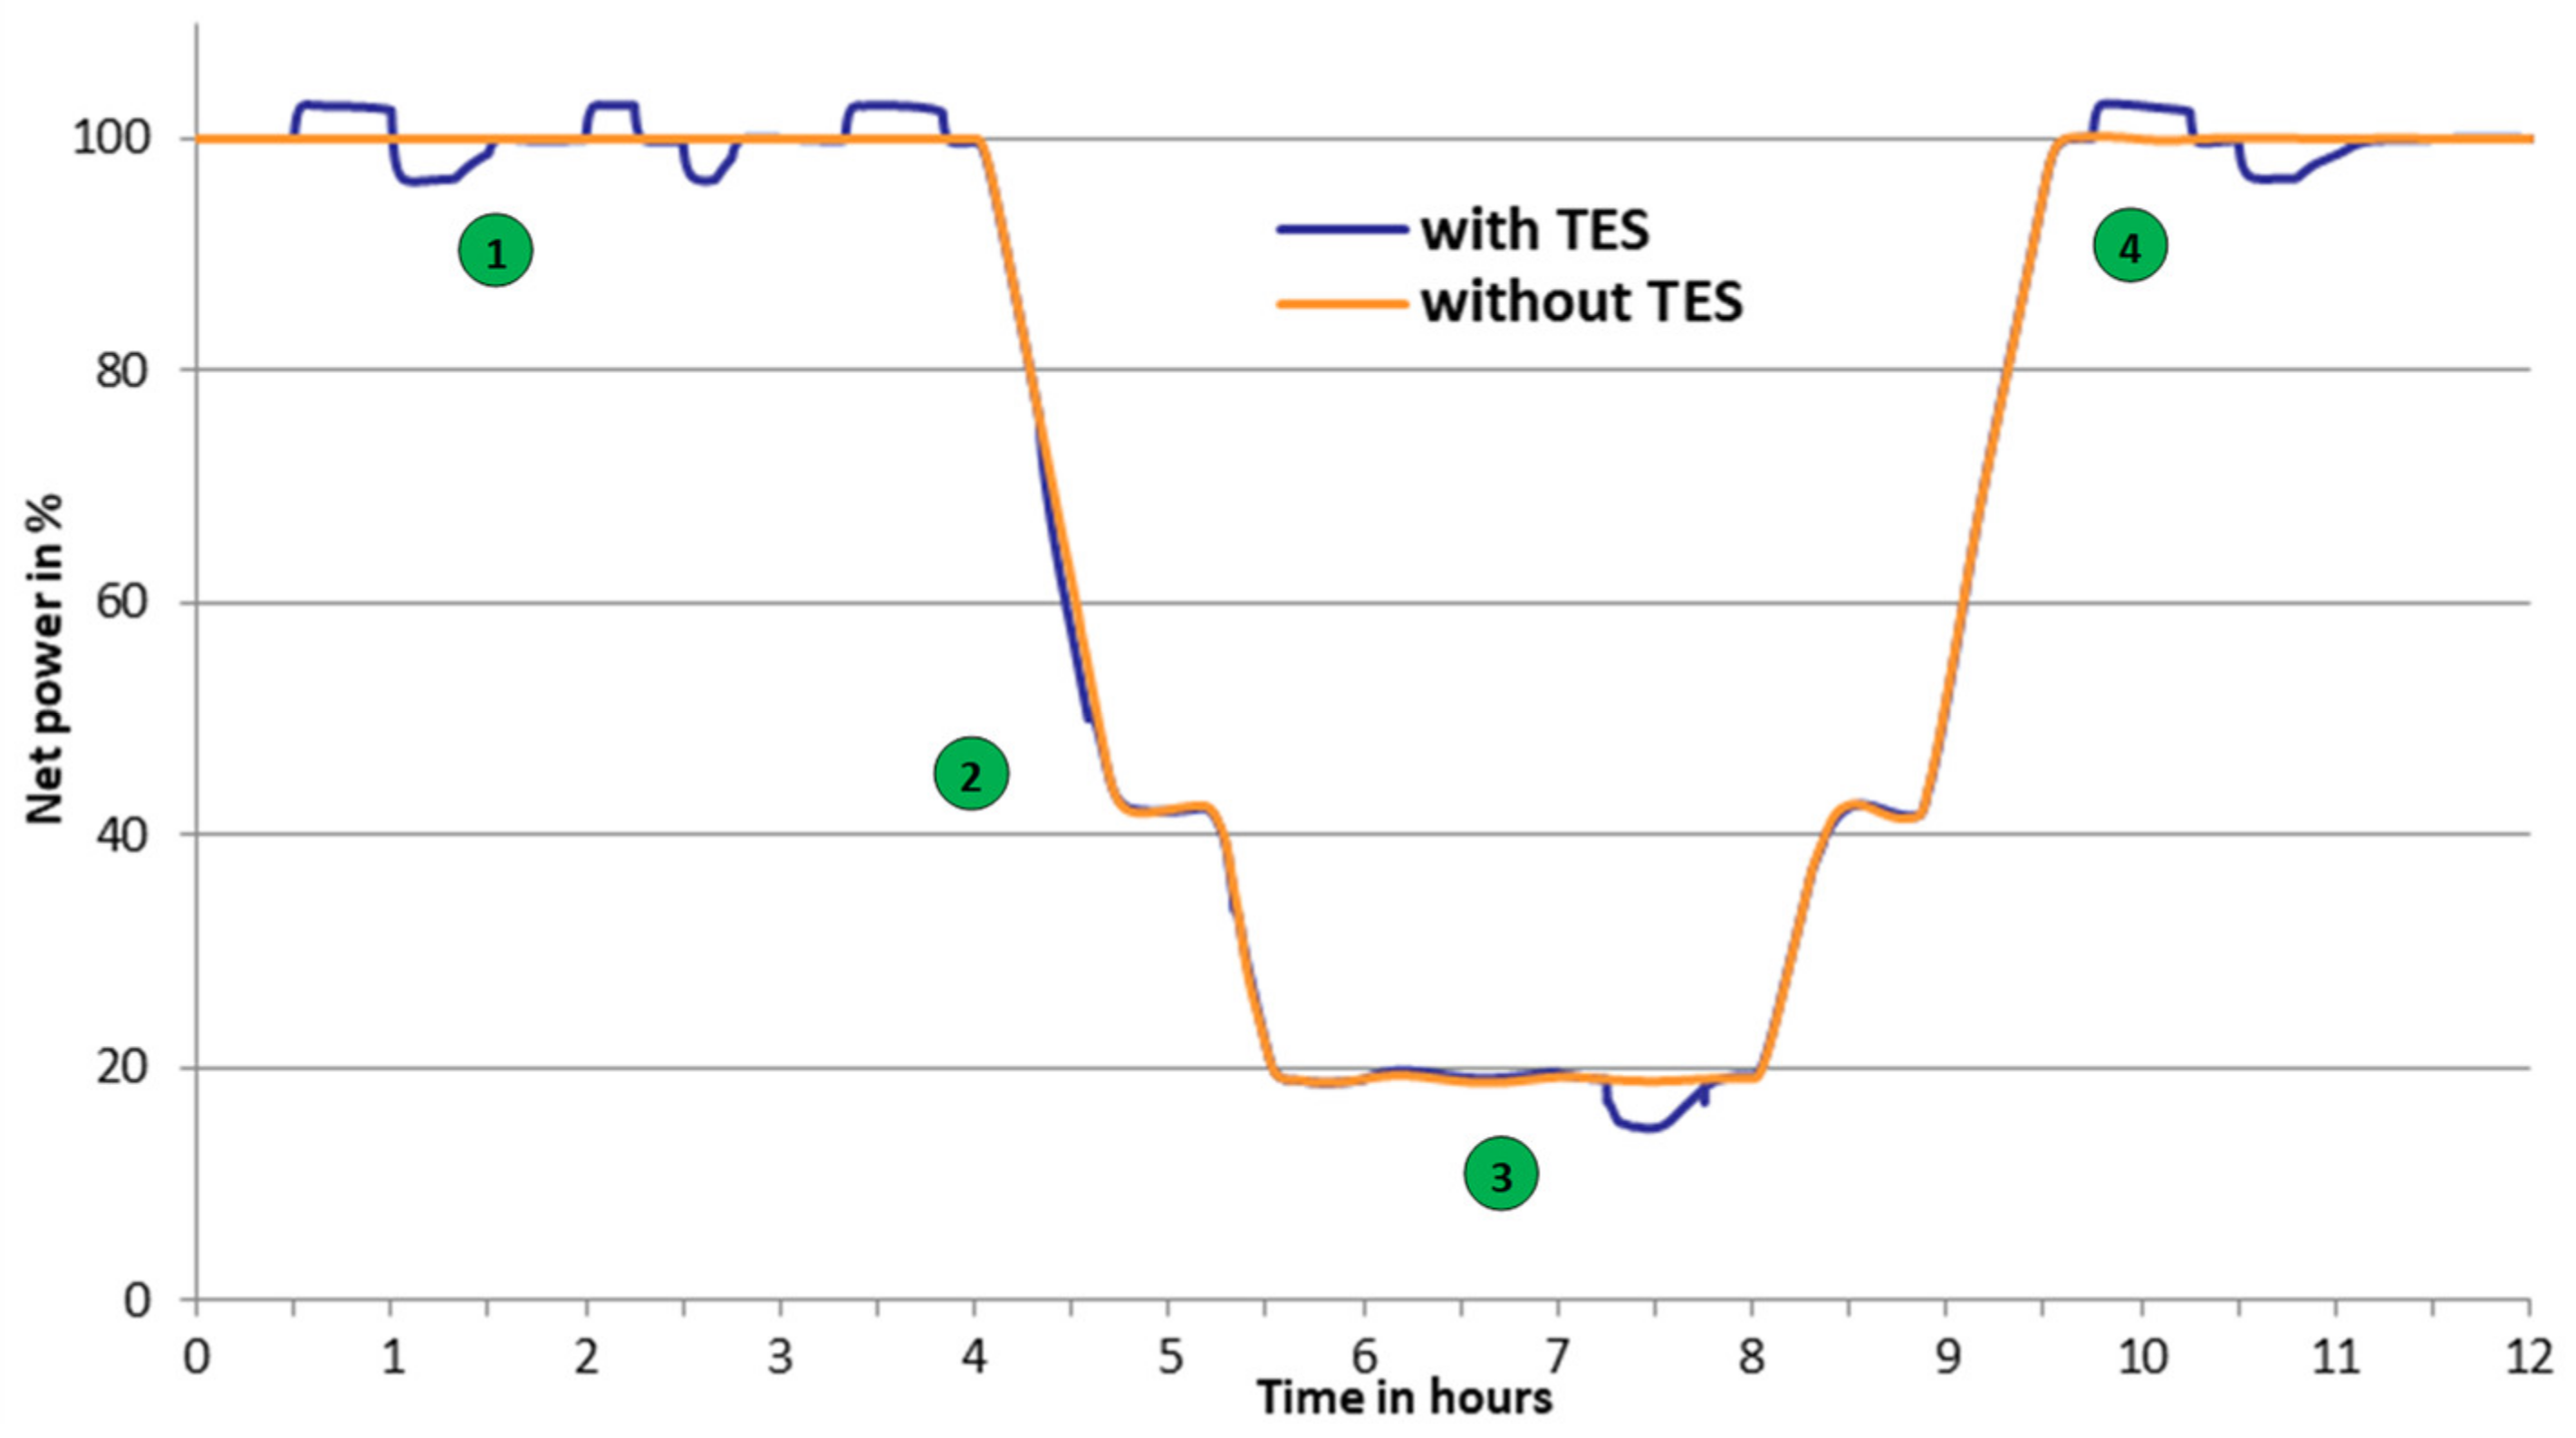
Figure 4.
Course of net power over the entire simulation period (concept HRH-HPPH9_indirectly).
Figure 4.
Course of net power over the entire simulation period (concept HRH-HPPH9_indirectly).
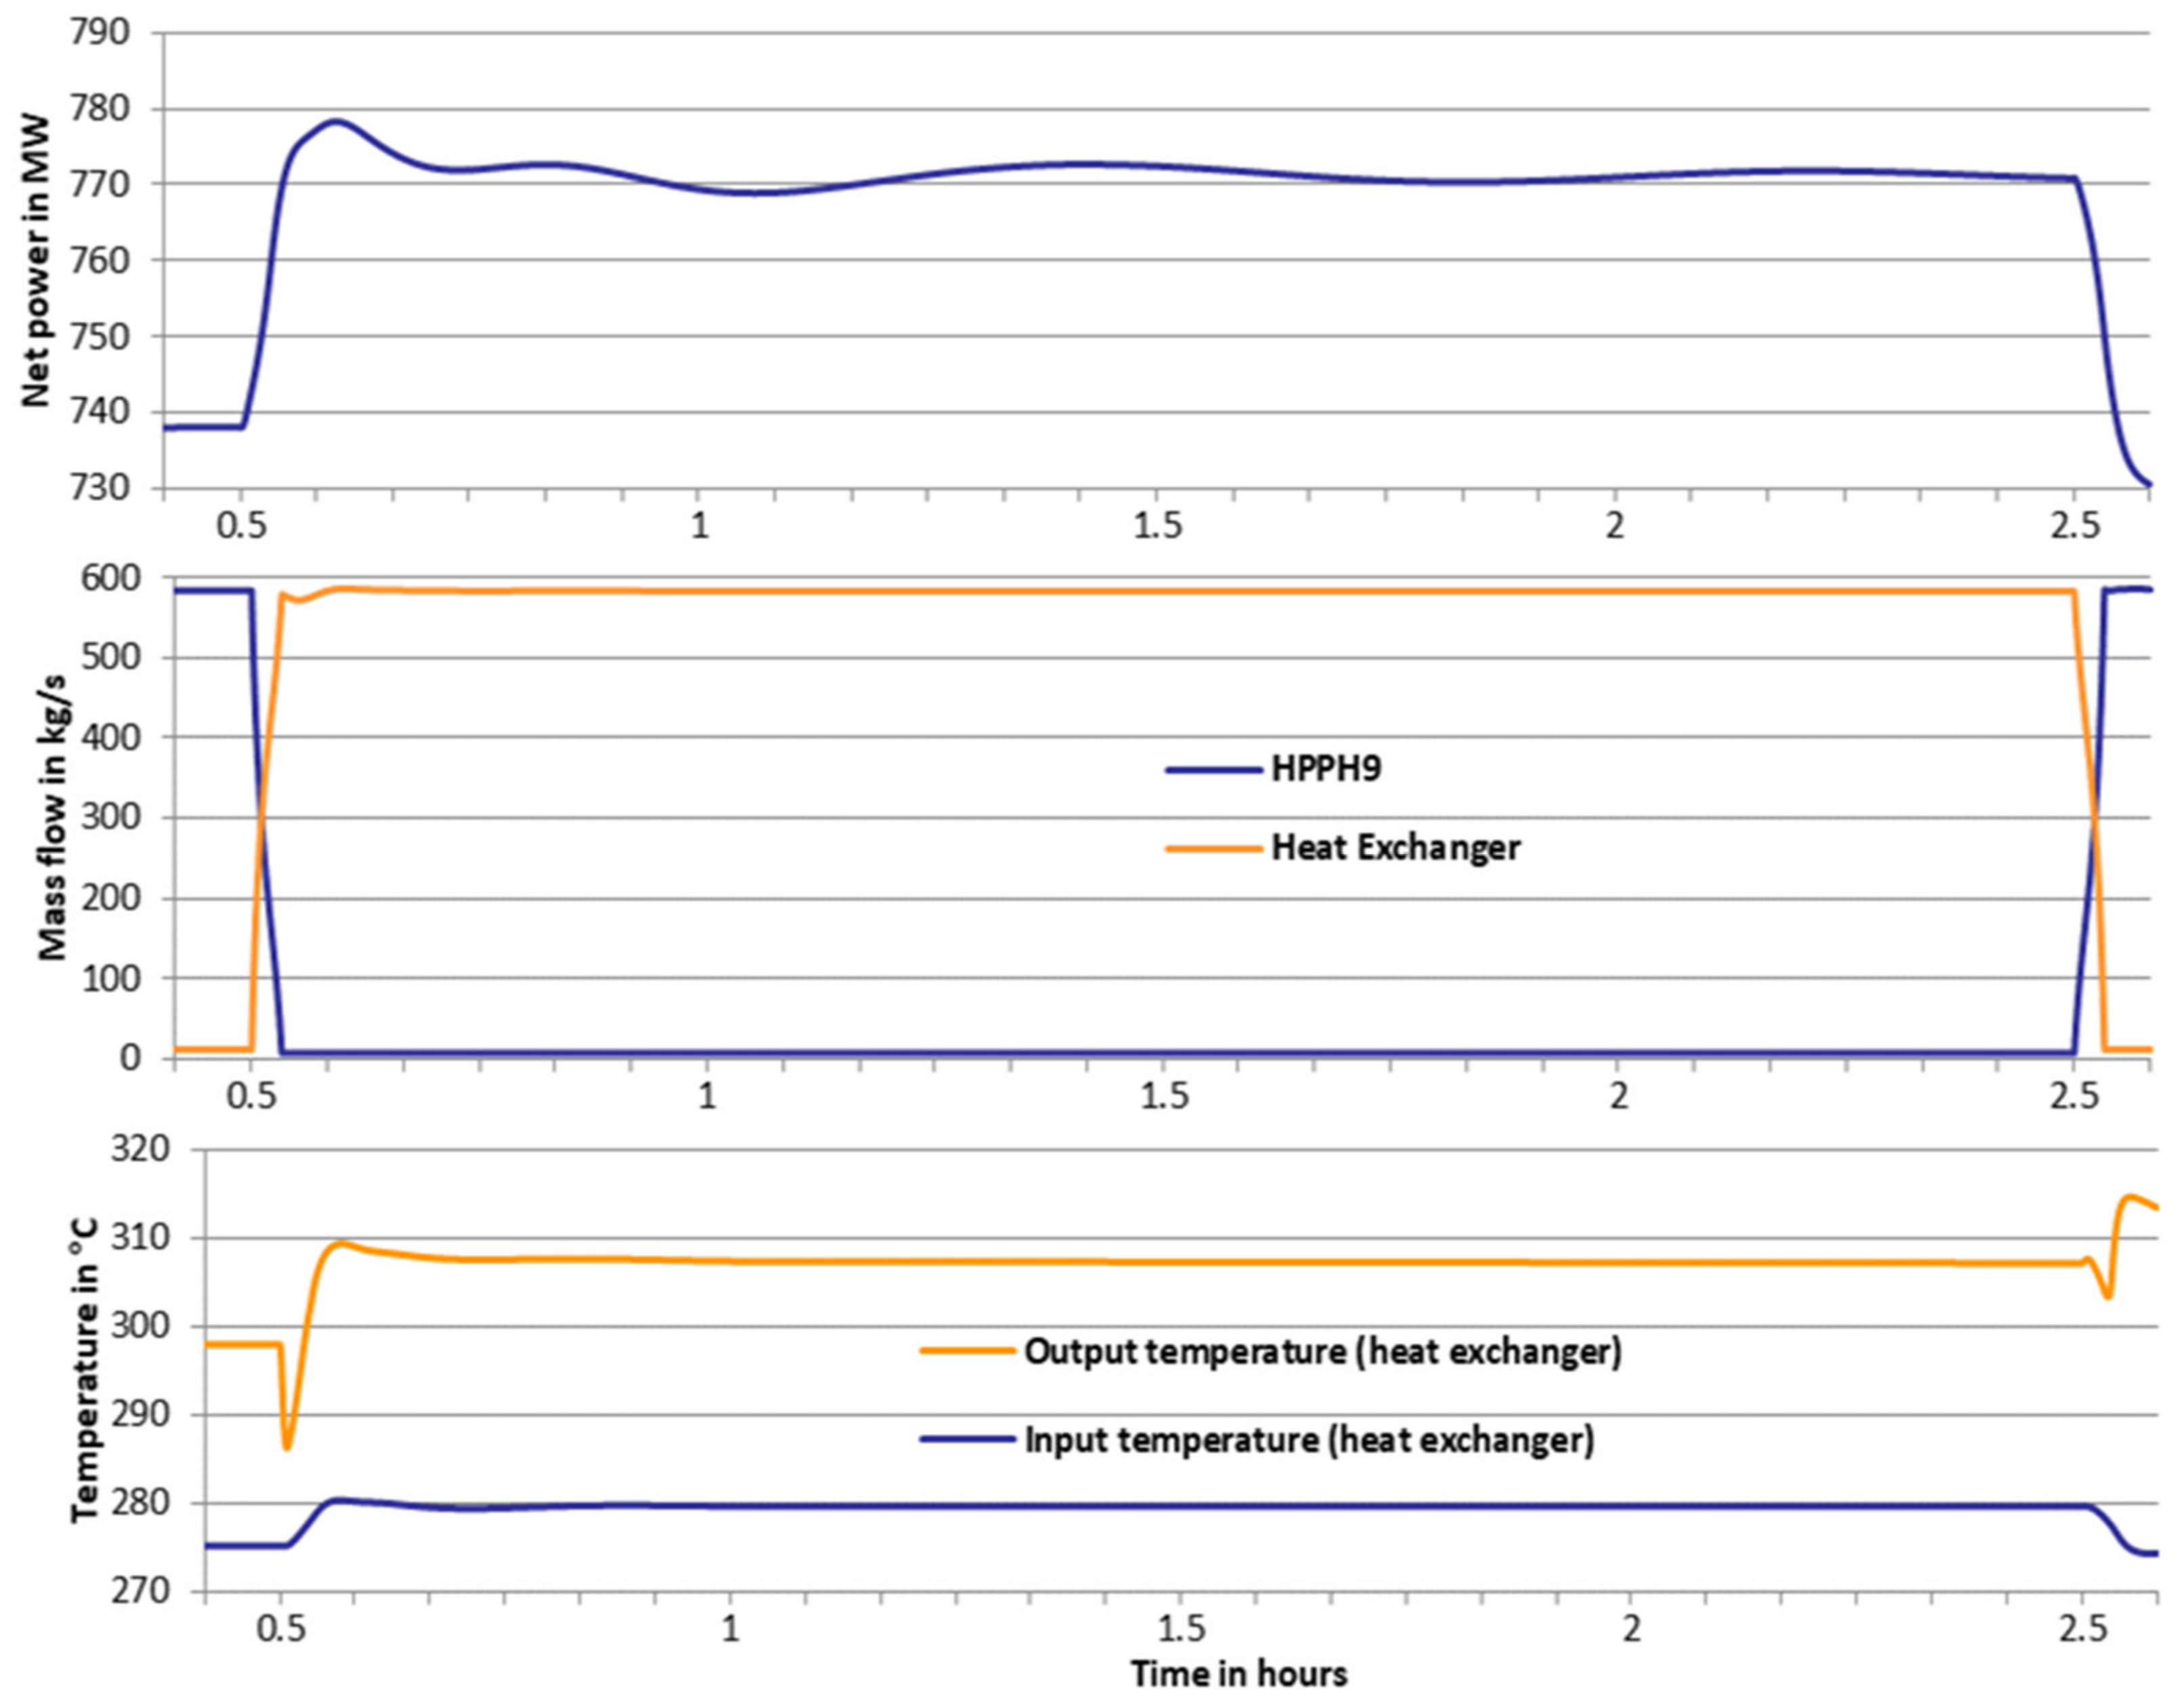
Figure 5.
Curves of important process variables during the first discharge process (concept HRH-HPPH9_indirectly).
Figure 5.
Curves of important process variables during the first discharge process (concept HRH-HPPH9_indirectly).
Figure 6.
Course of net power over the entire simulation period (CRH/LS-HPPH7_directly concept).
Figure 6.
Course of net power over the entire simulation period (CRH/LS-HPPH7_directly concept).
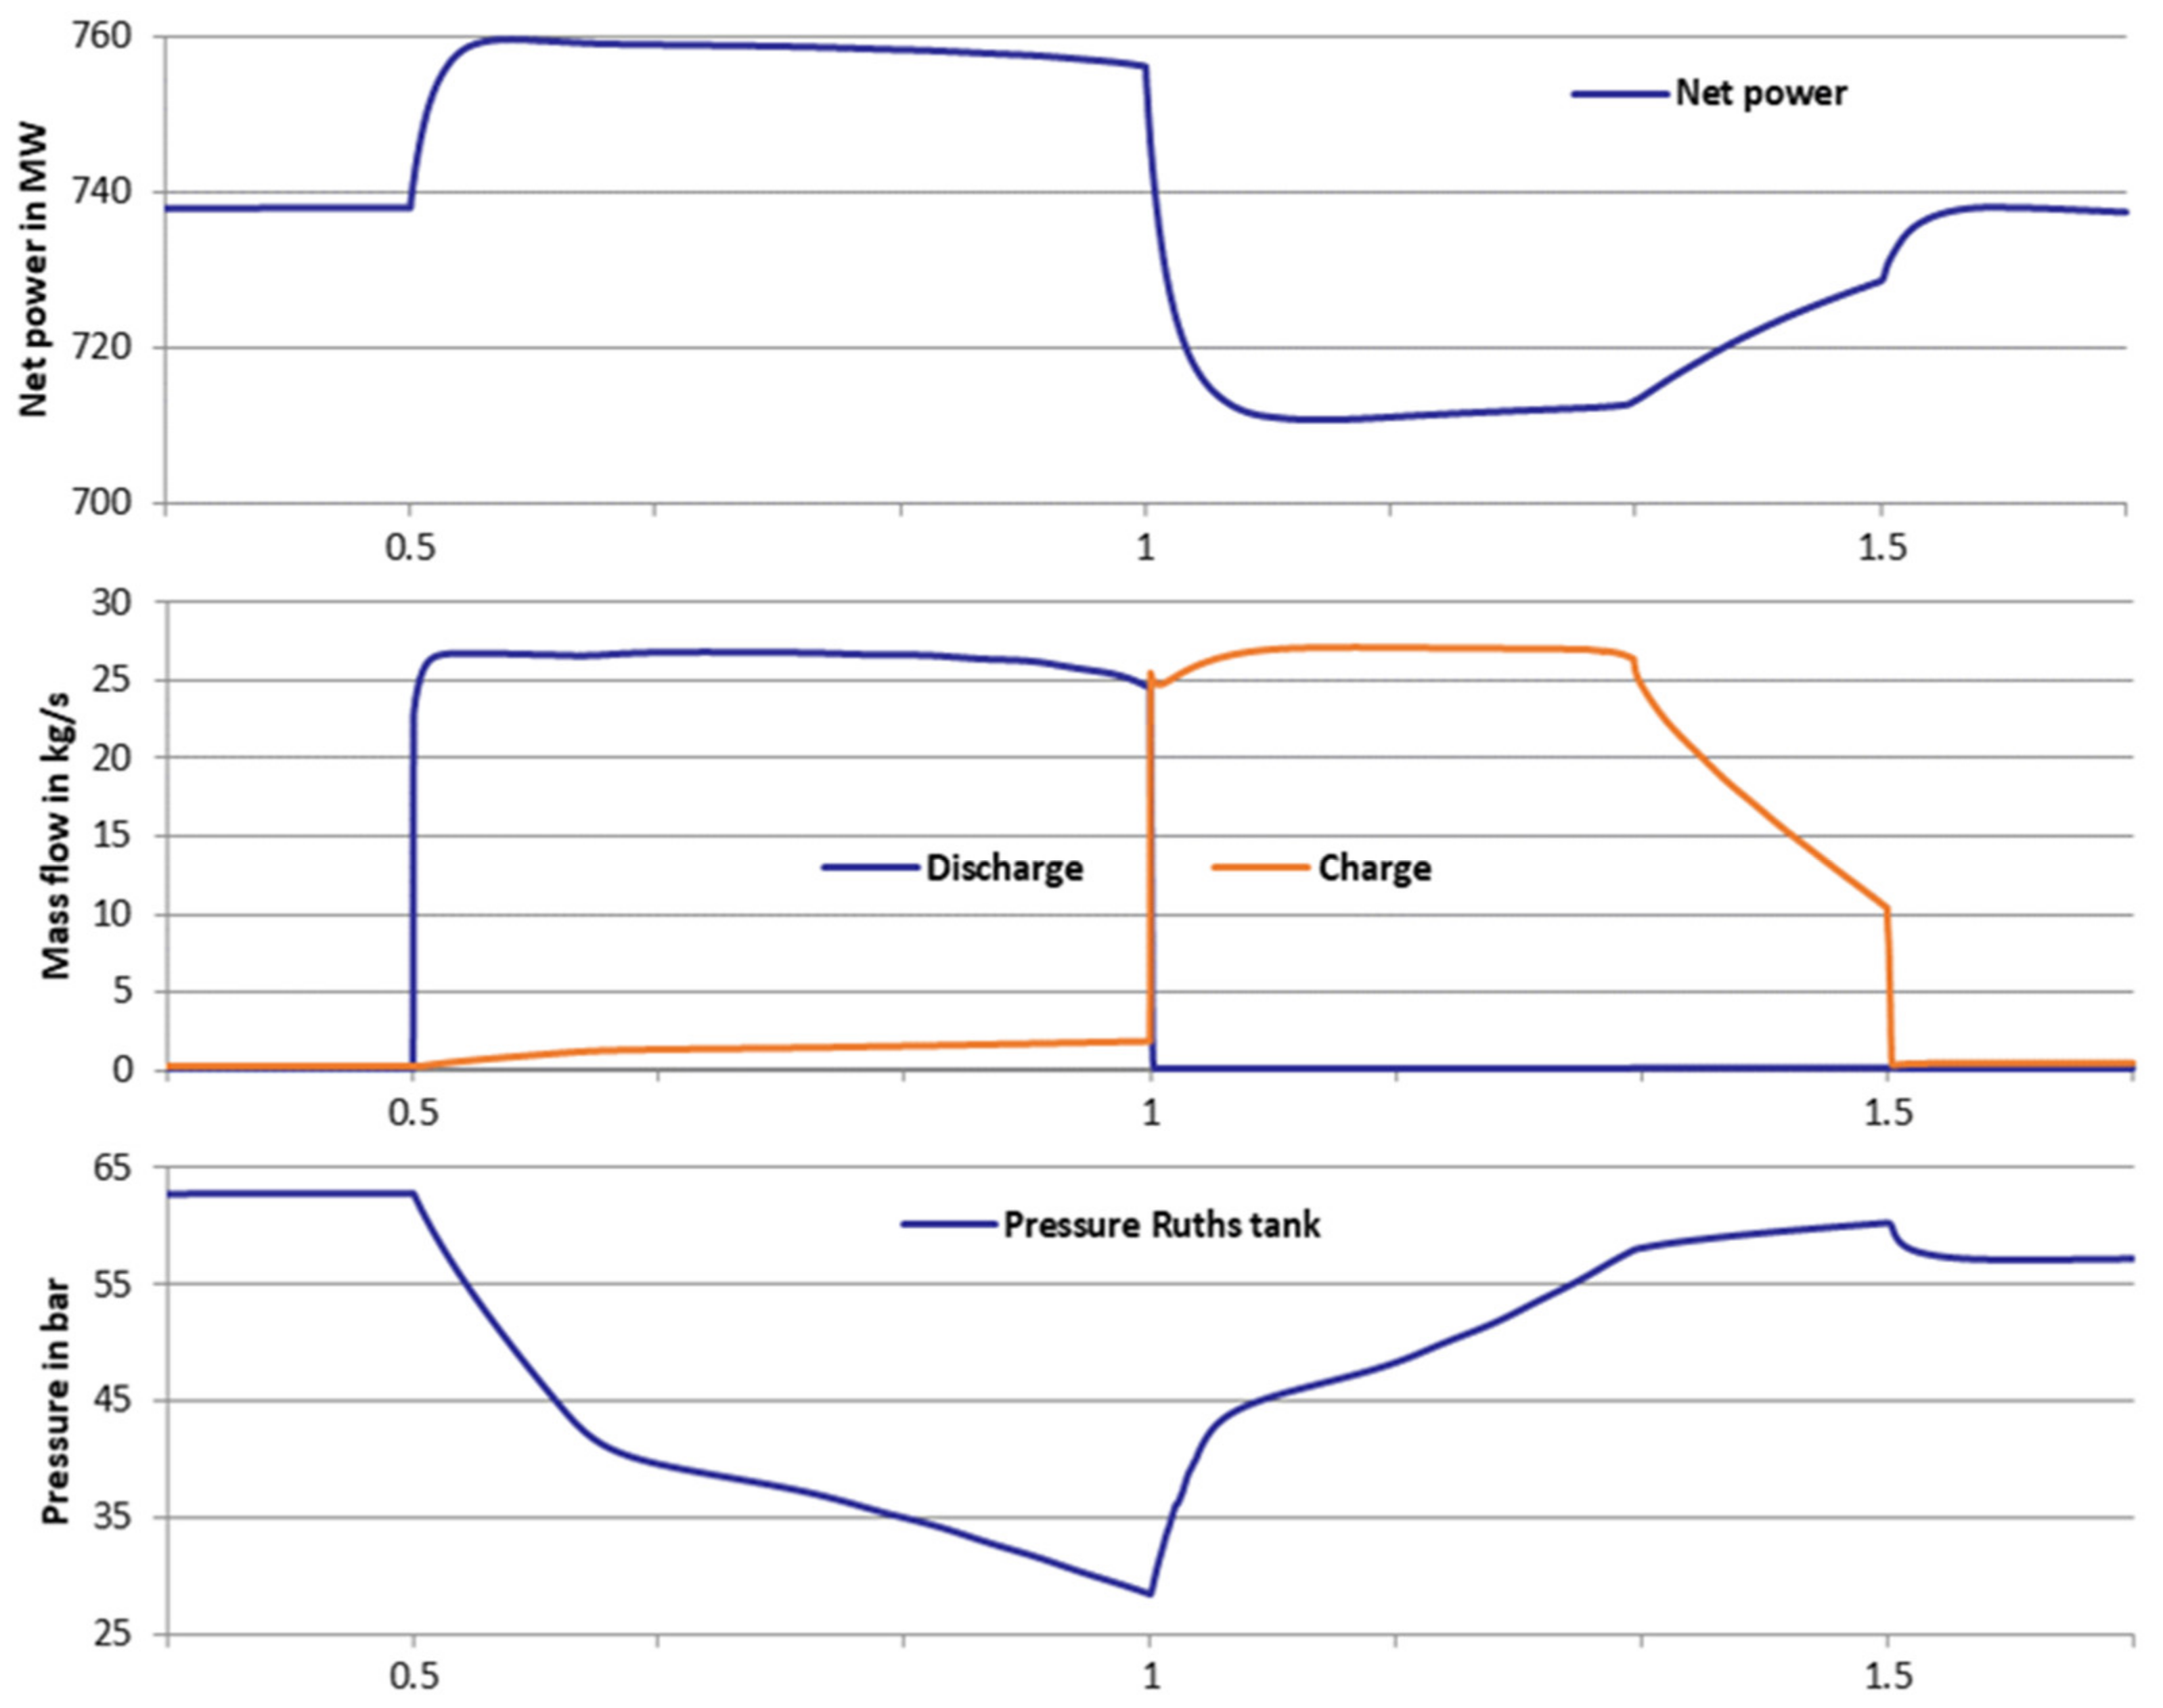
Figure 7.
Characteristics of the essential parameters during the discharging and charging process (CRH/LS-HPPH7_directly concept).
Figure 7.
Characteristics of the essential parameters during the discharging and charging process (CRH/LS-HPPH7_directly concept).
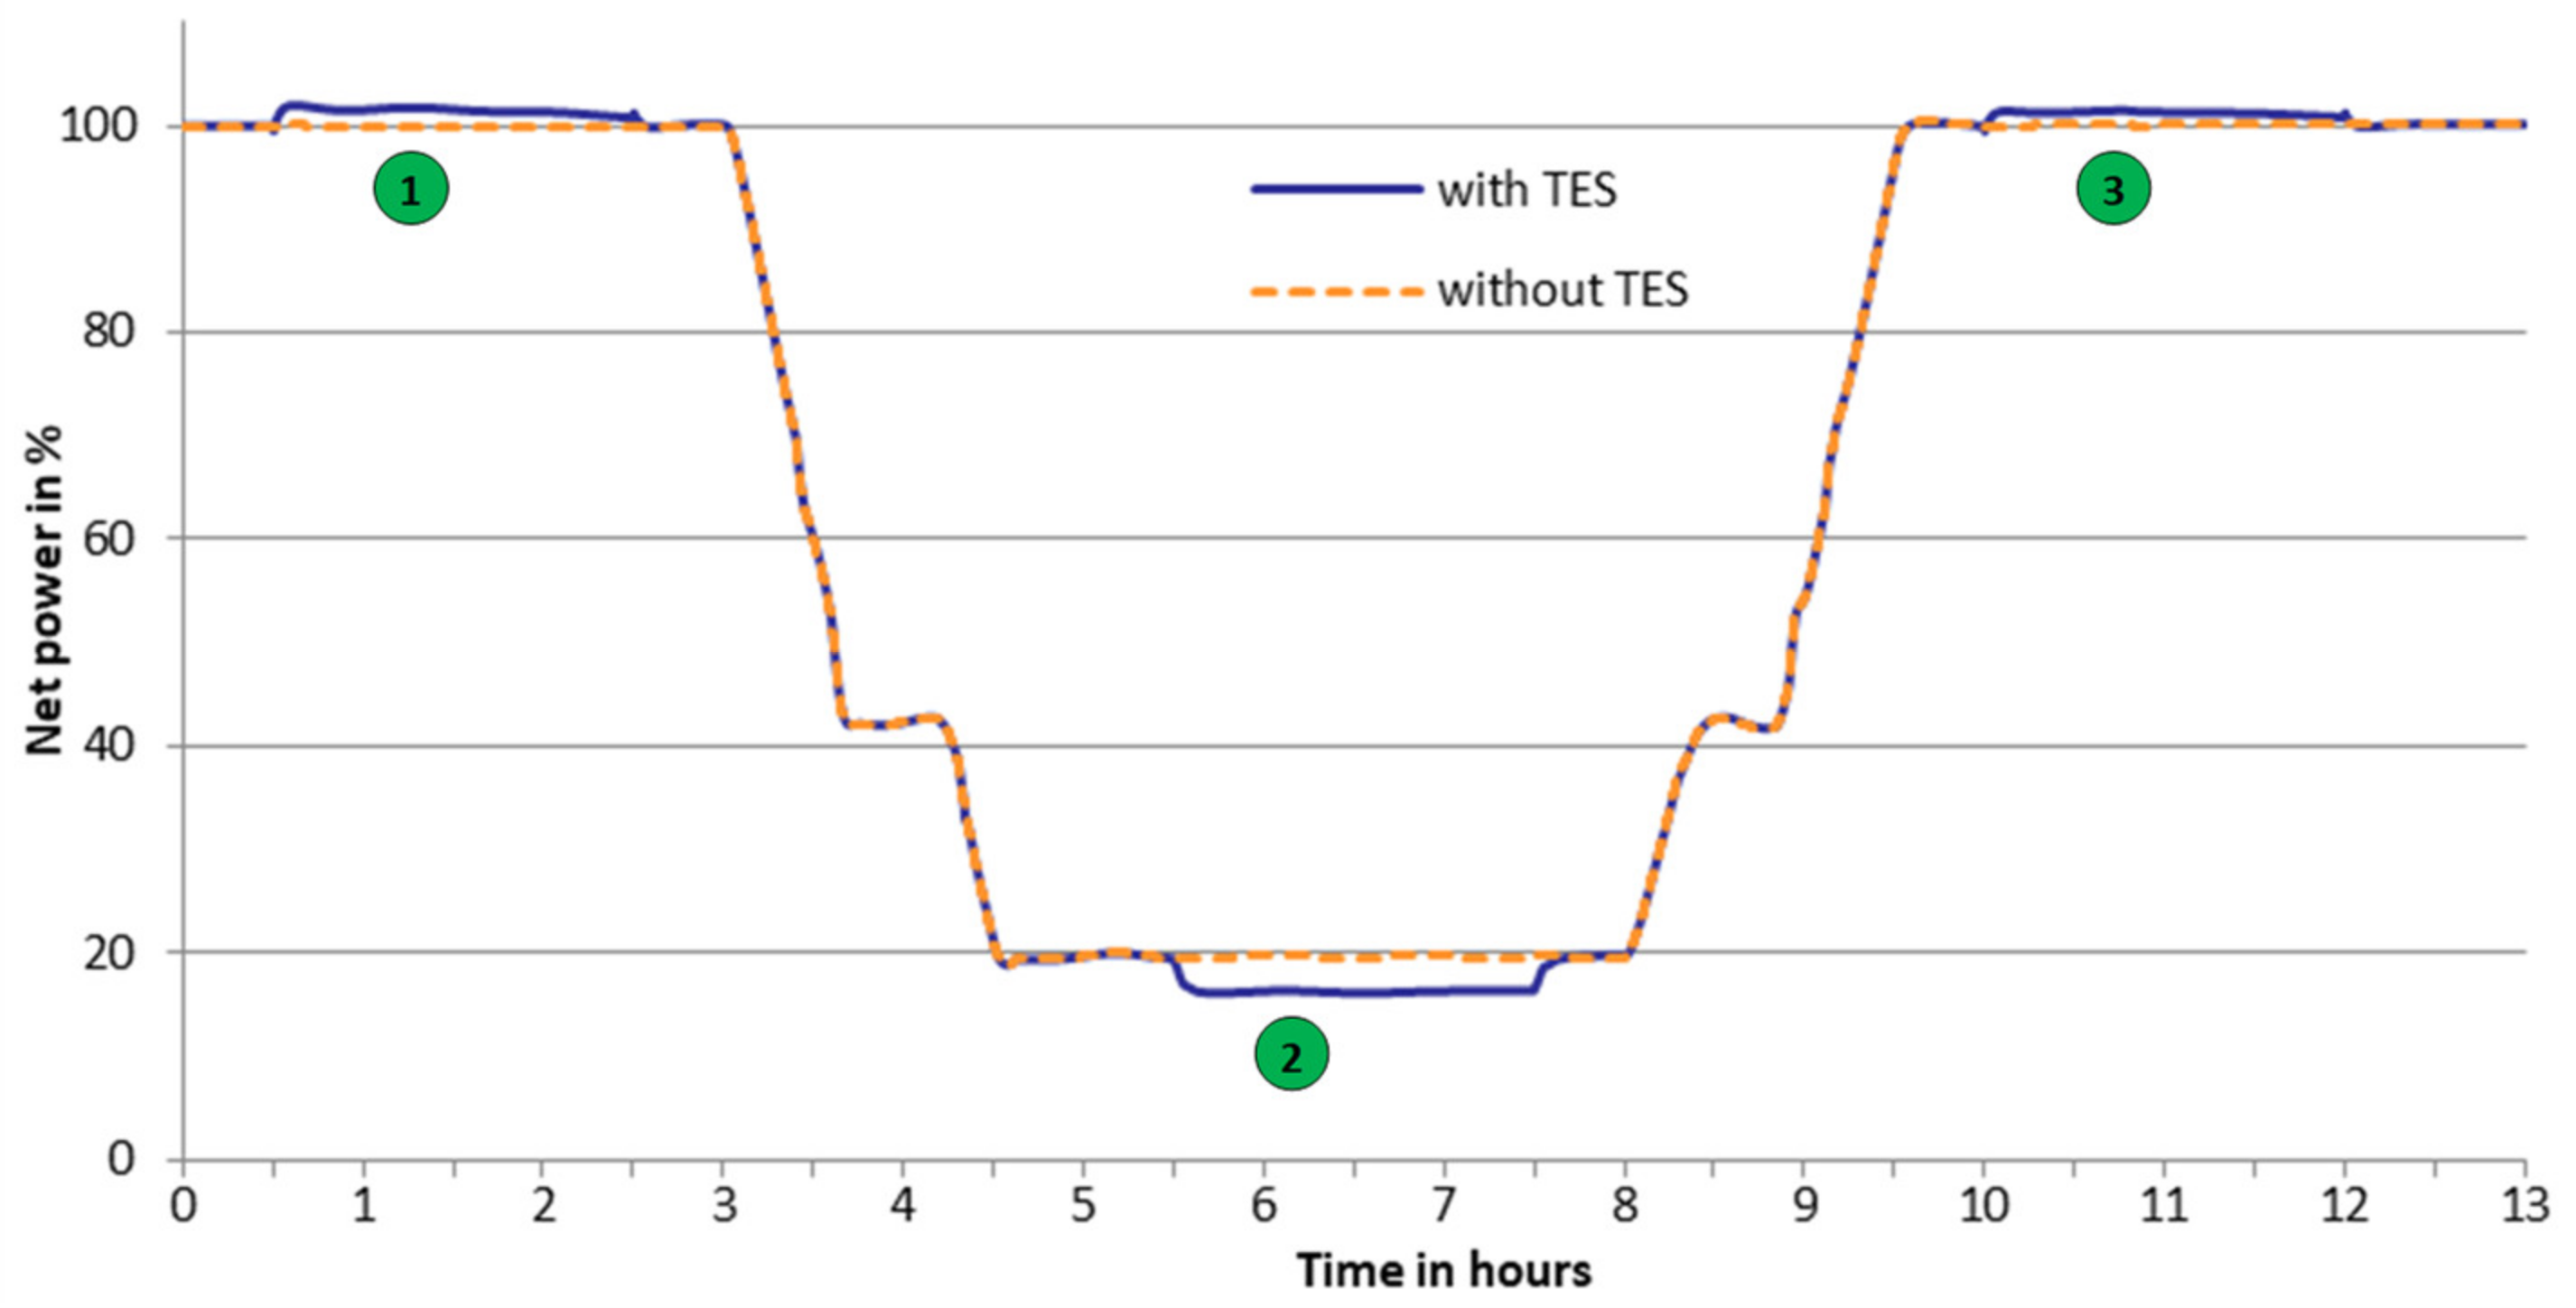
Figure 8.
Course of net power over the entire simulation period (Flue gas-Air_indirectly concept).
Figure 8.
Course of net power over the entire simulation period (Flue gas-Air_indirectly concept).
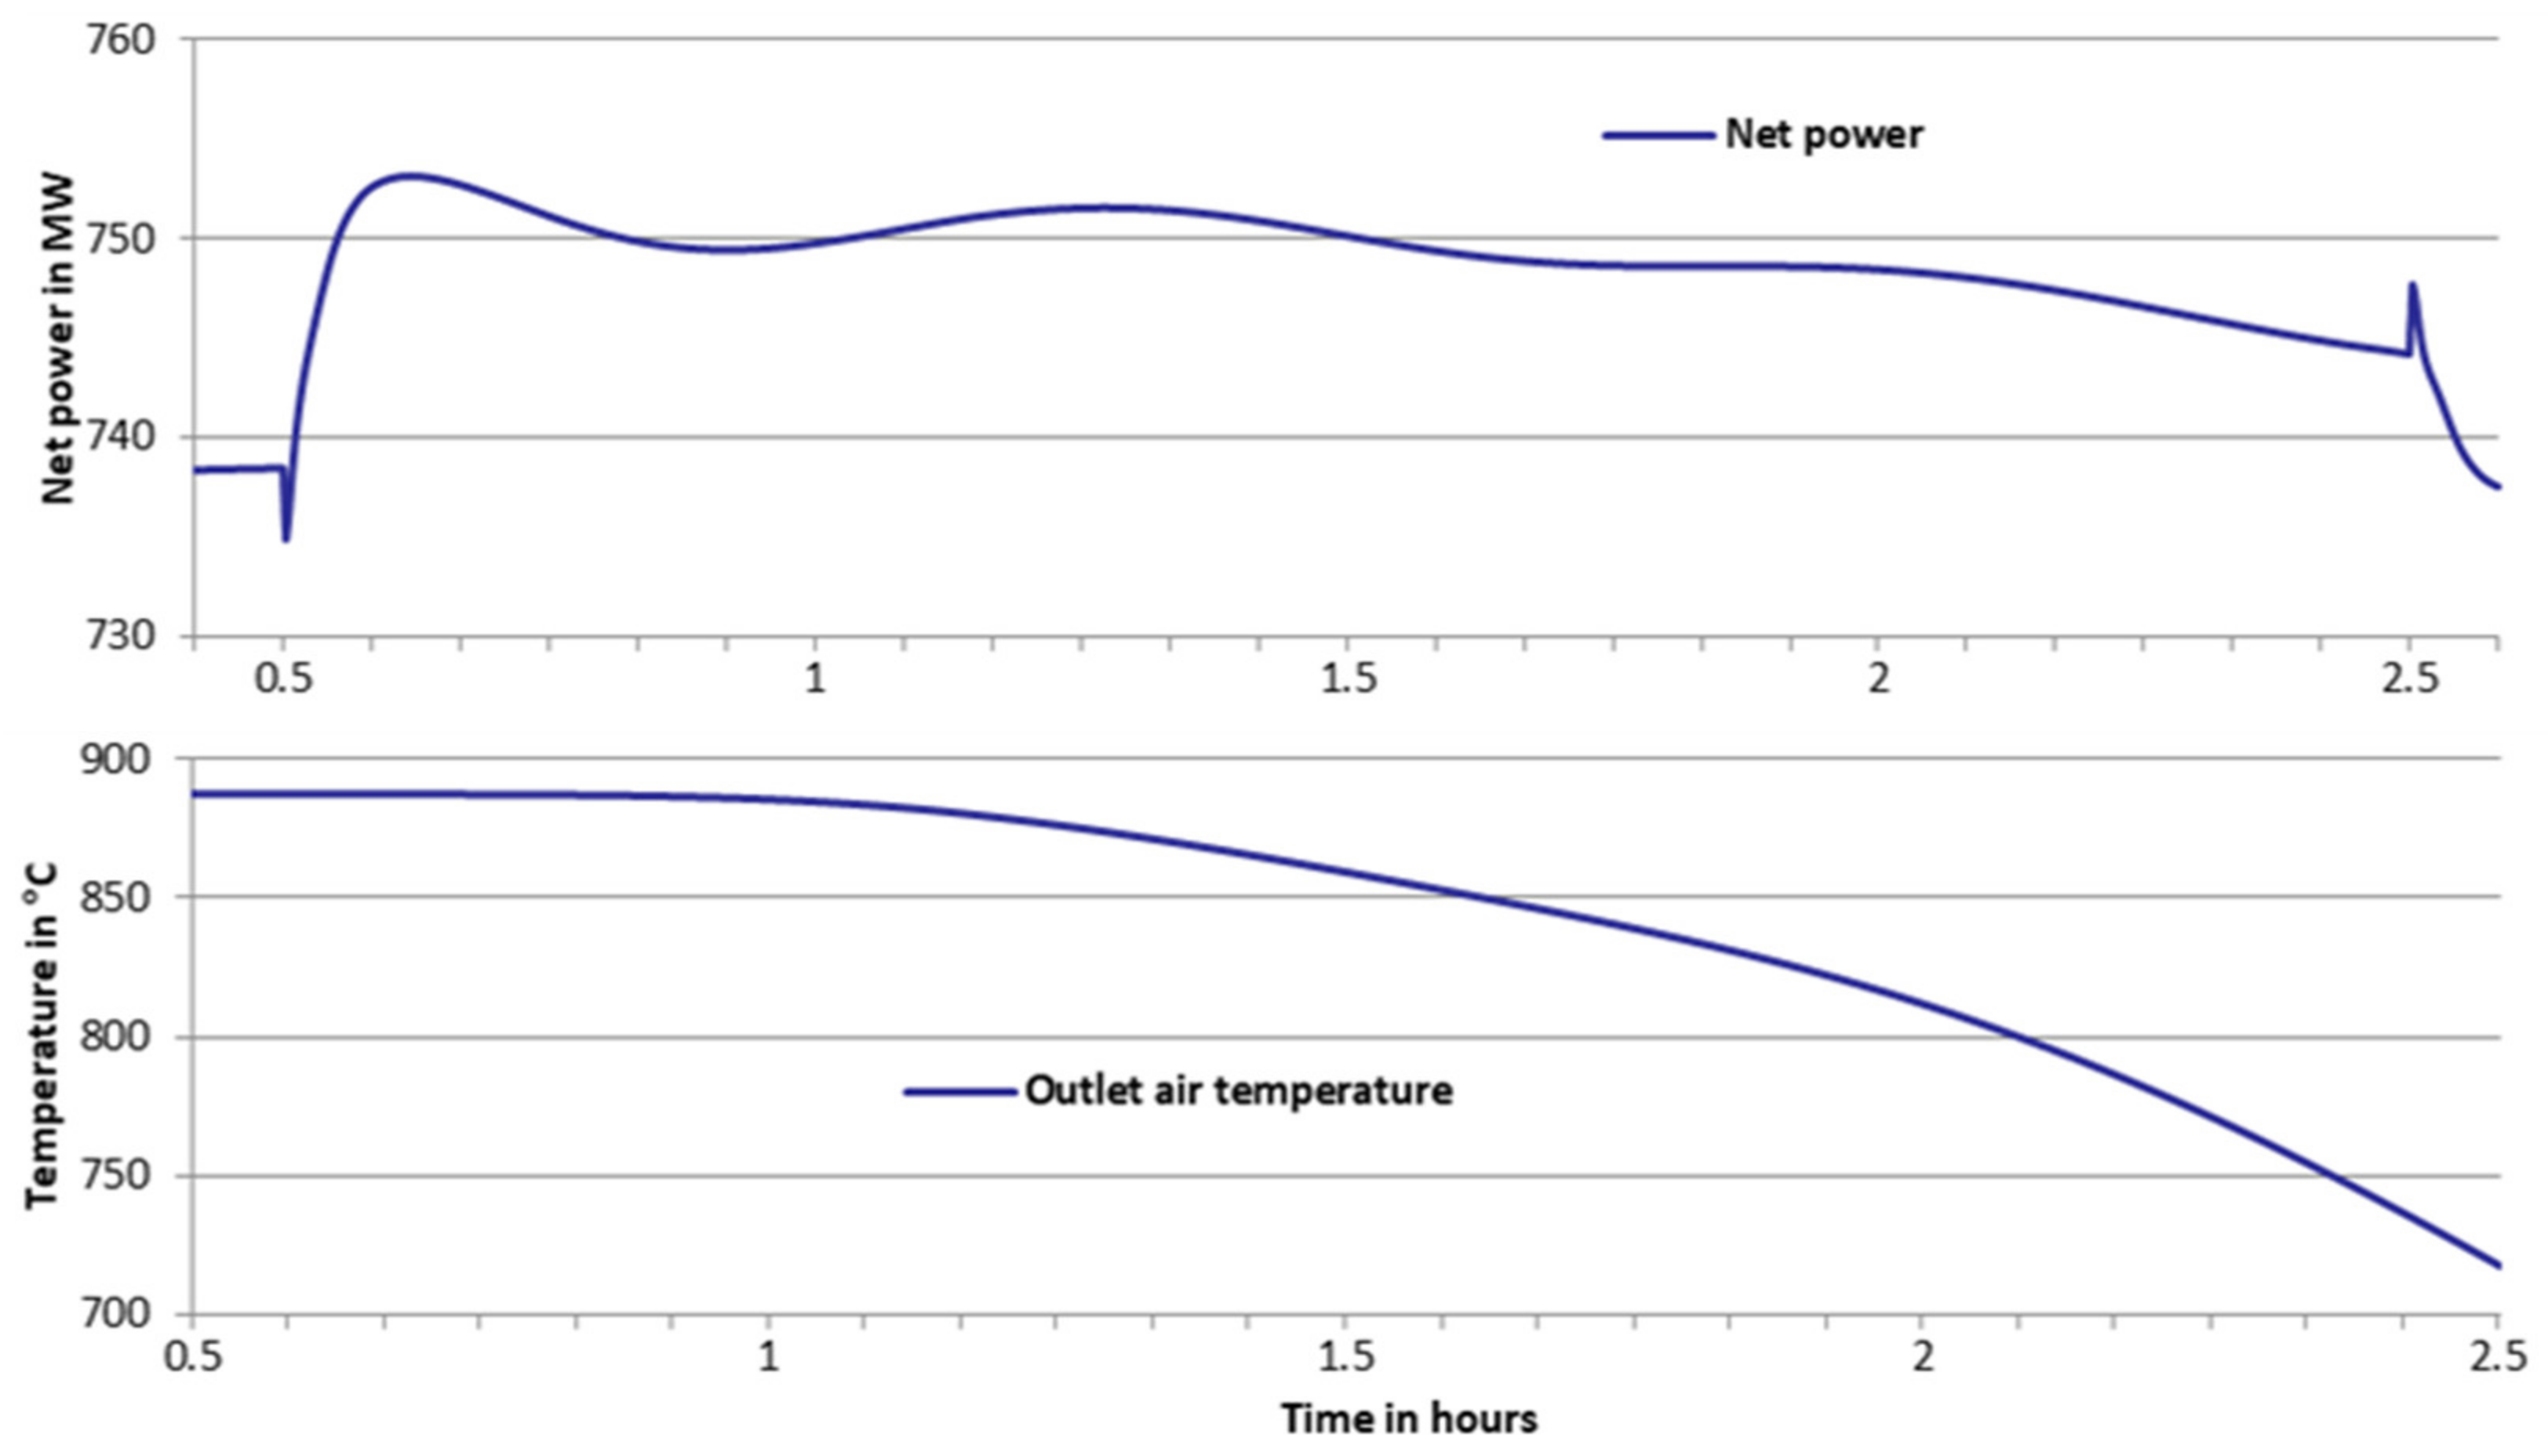
Figure 9.
Characteristics of the selected variables during the discharge process (Flue gas-Air_indirectly concept).
Figure 9.
Characteristics of the selected variables during the discharge process (Flue gas-Air_indirectly concept).
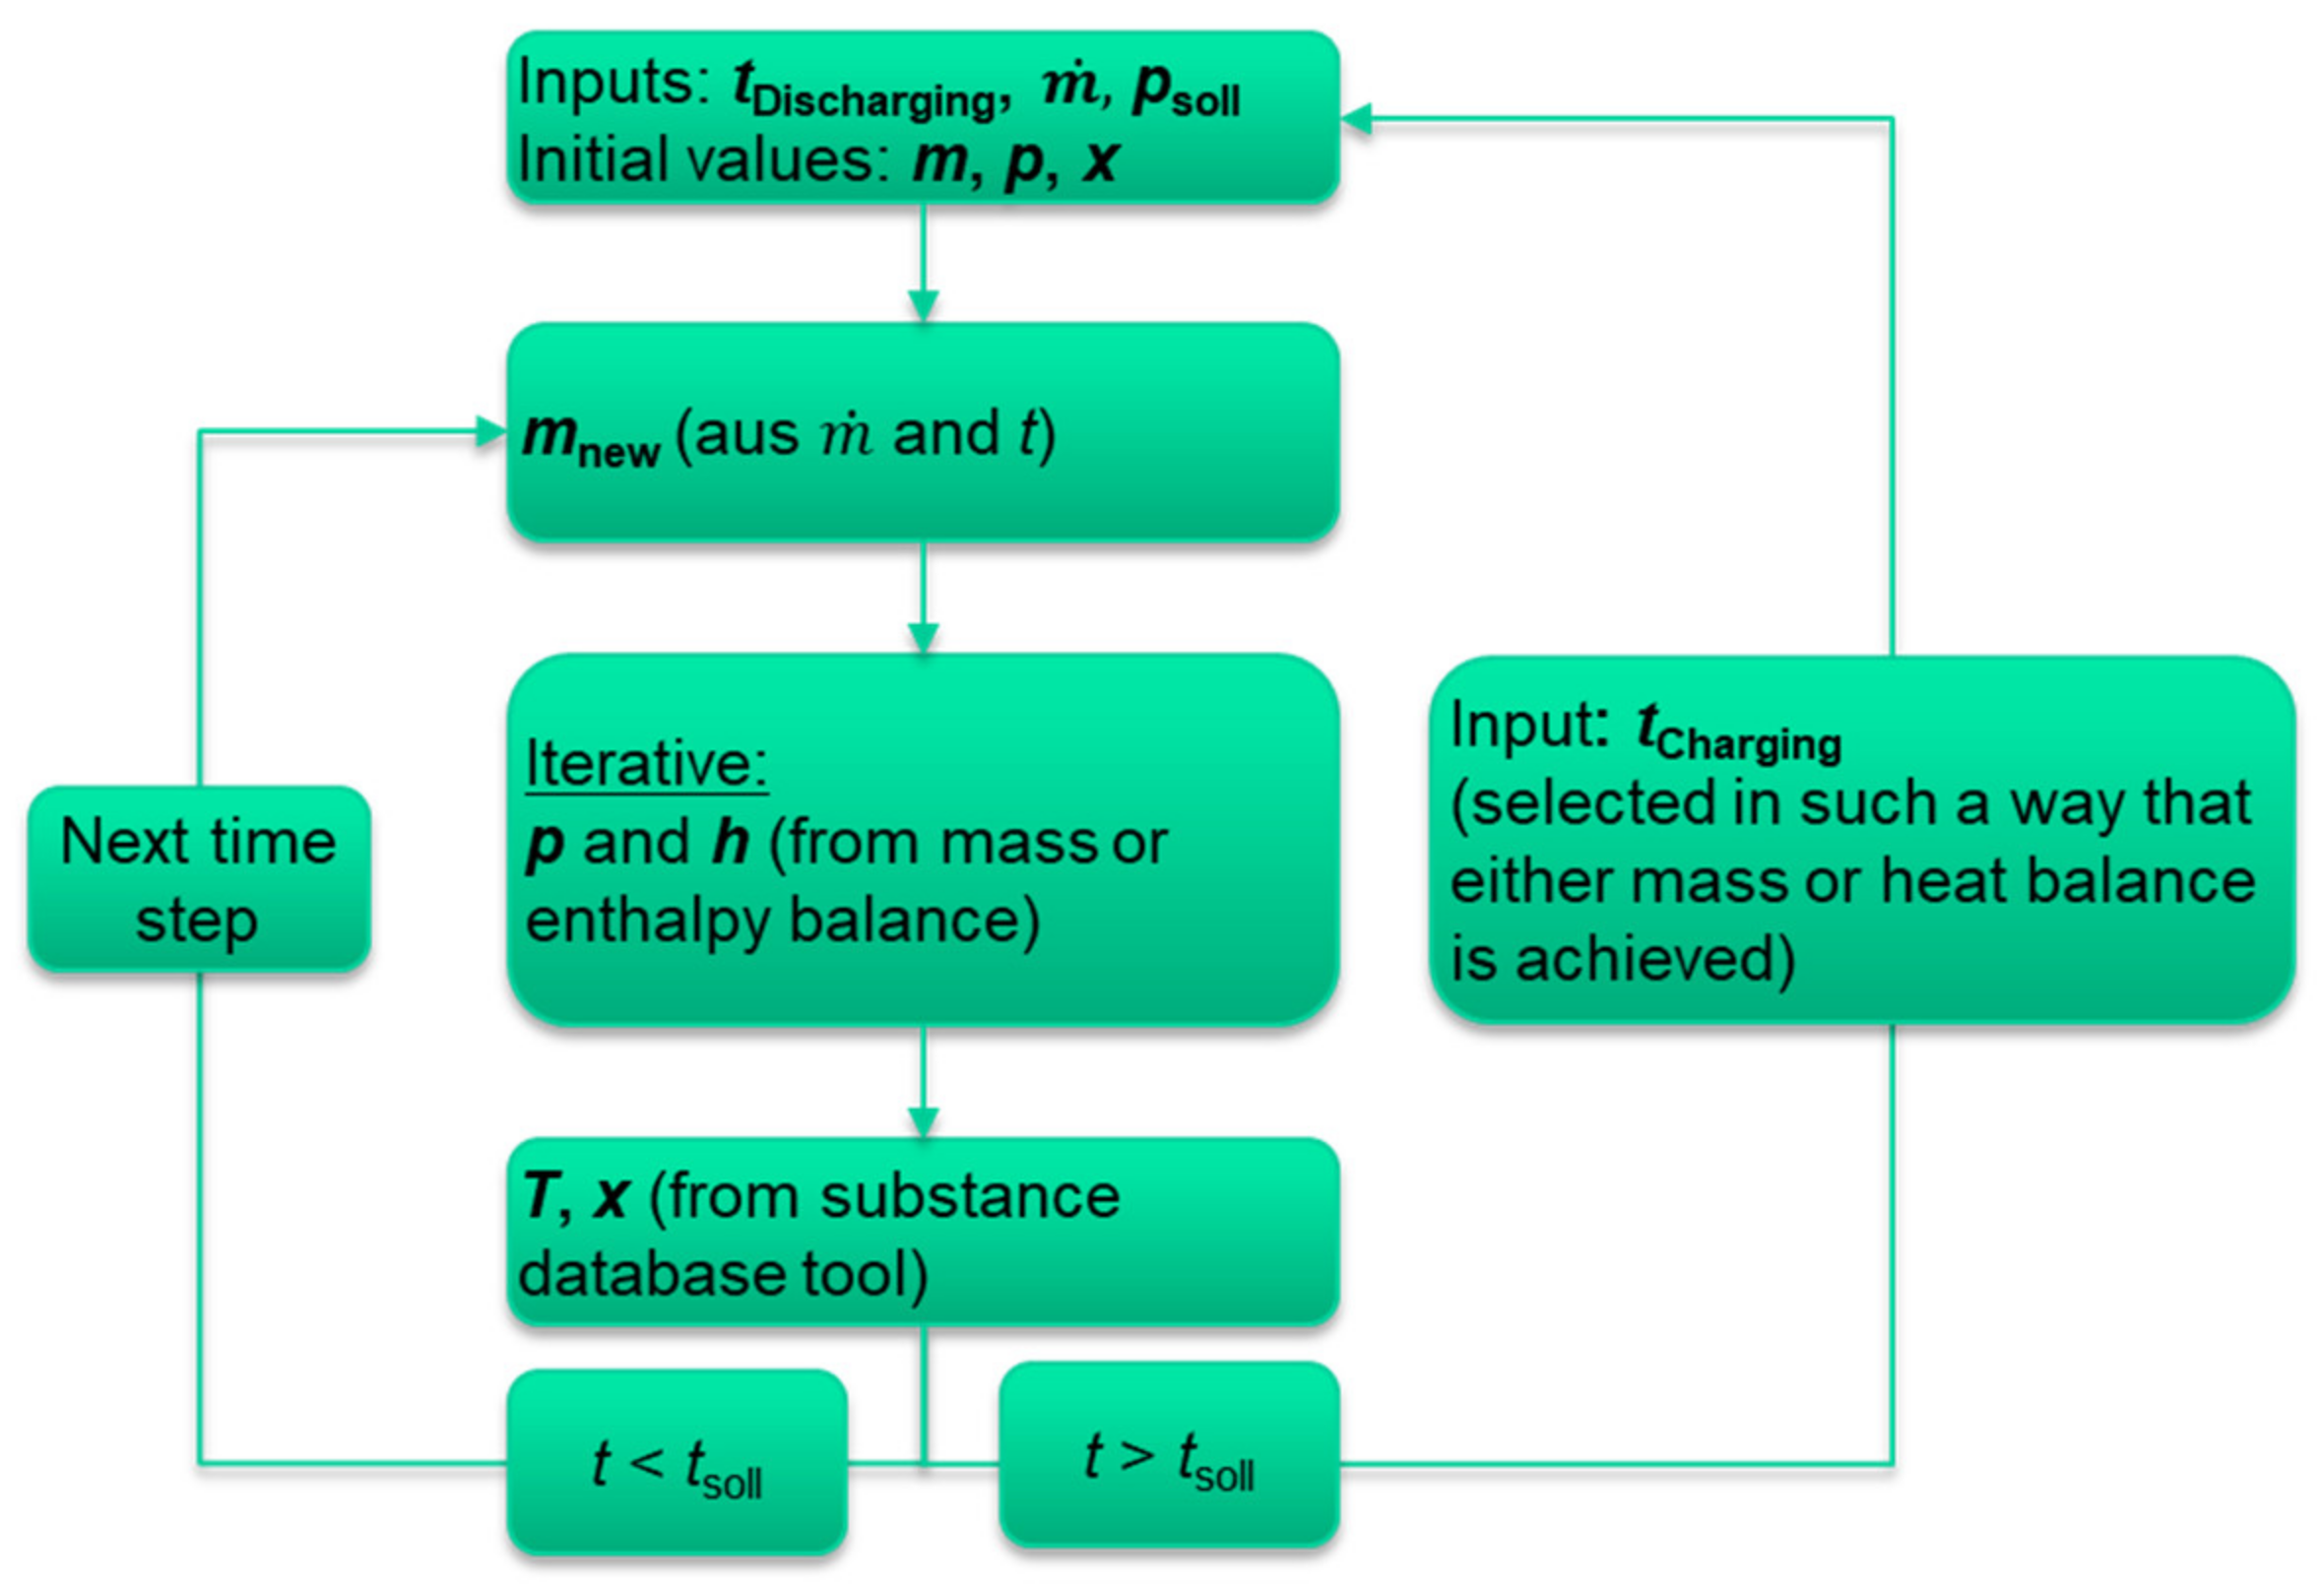
Figure 10.
Iterative calculation scheme for the thermodynamic description of the storage state of a Ruths storage tank.
Figure 10.
Iterative calculation scheme for the thermodynamic description of the storage state of a Ruths storage tank.
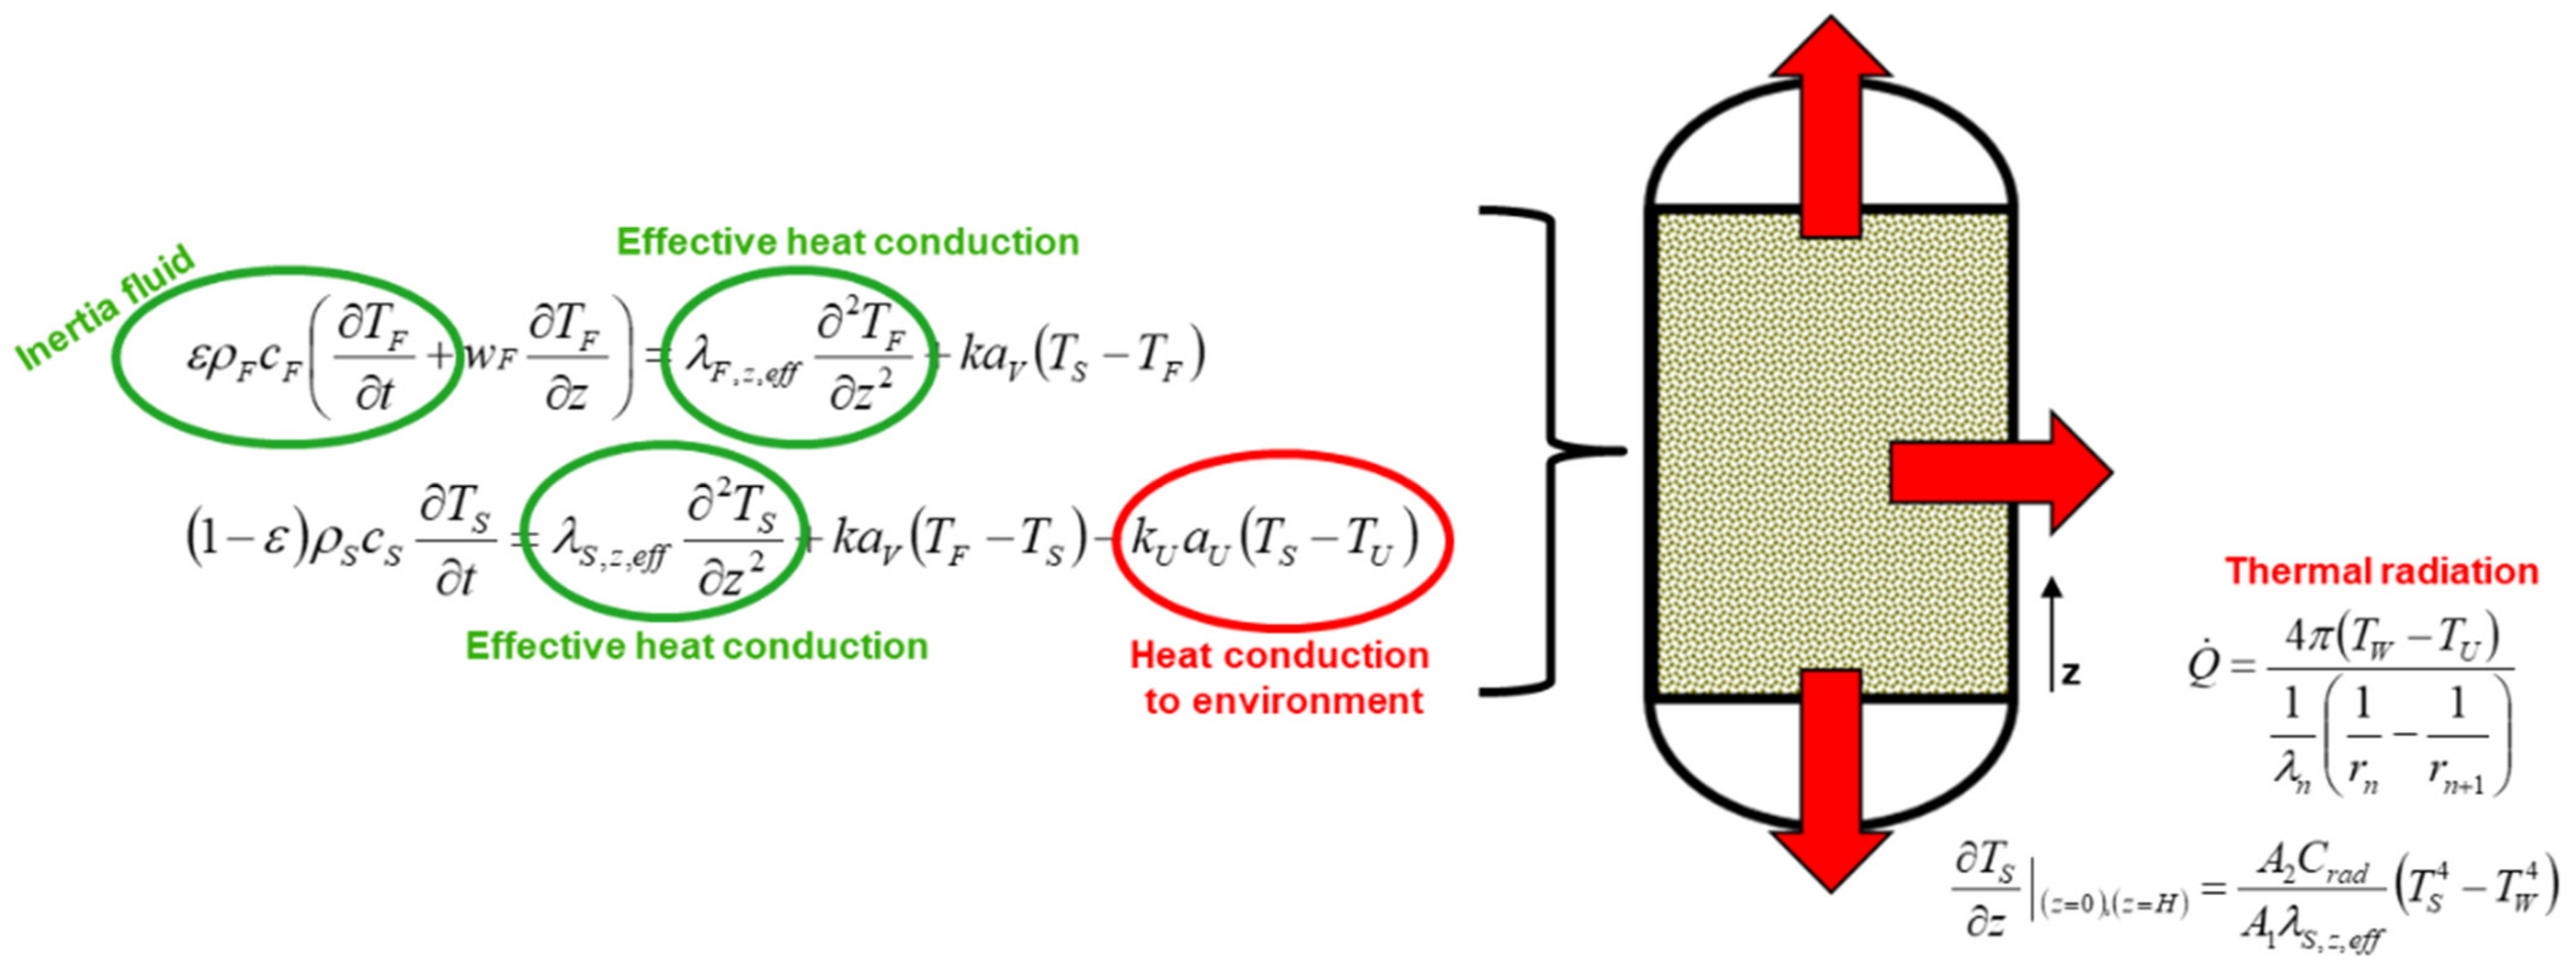
Figure 11.
Model extension to include heat loss effects and inertias for solid media heat storage.
Figure 11.
Model extension to include heat loss effects and inertias for solid media heat storage.
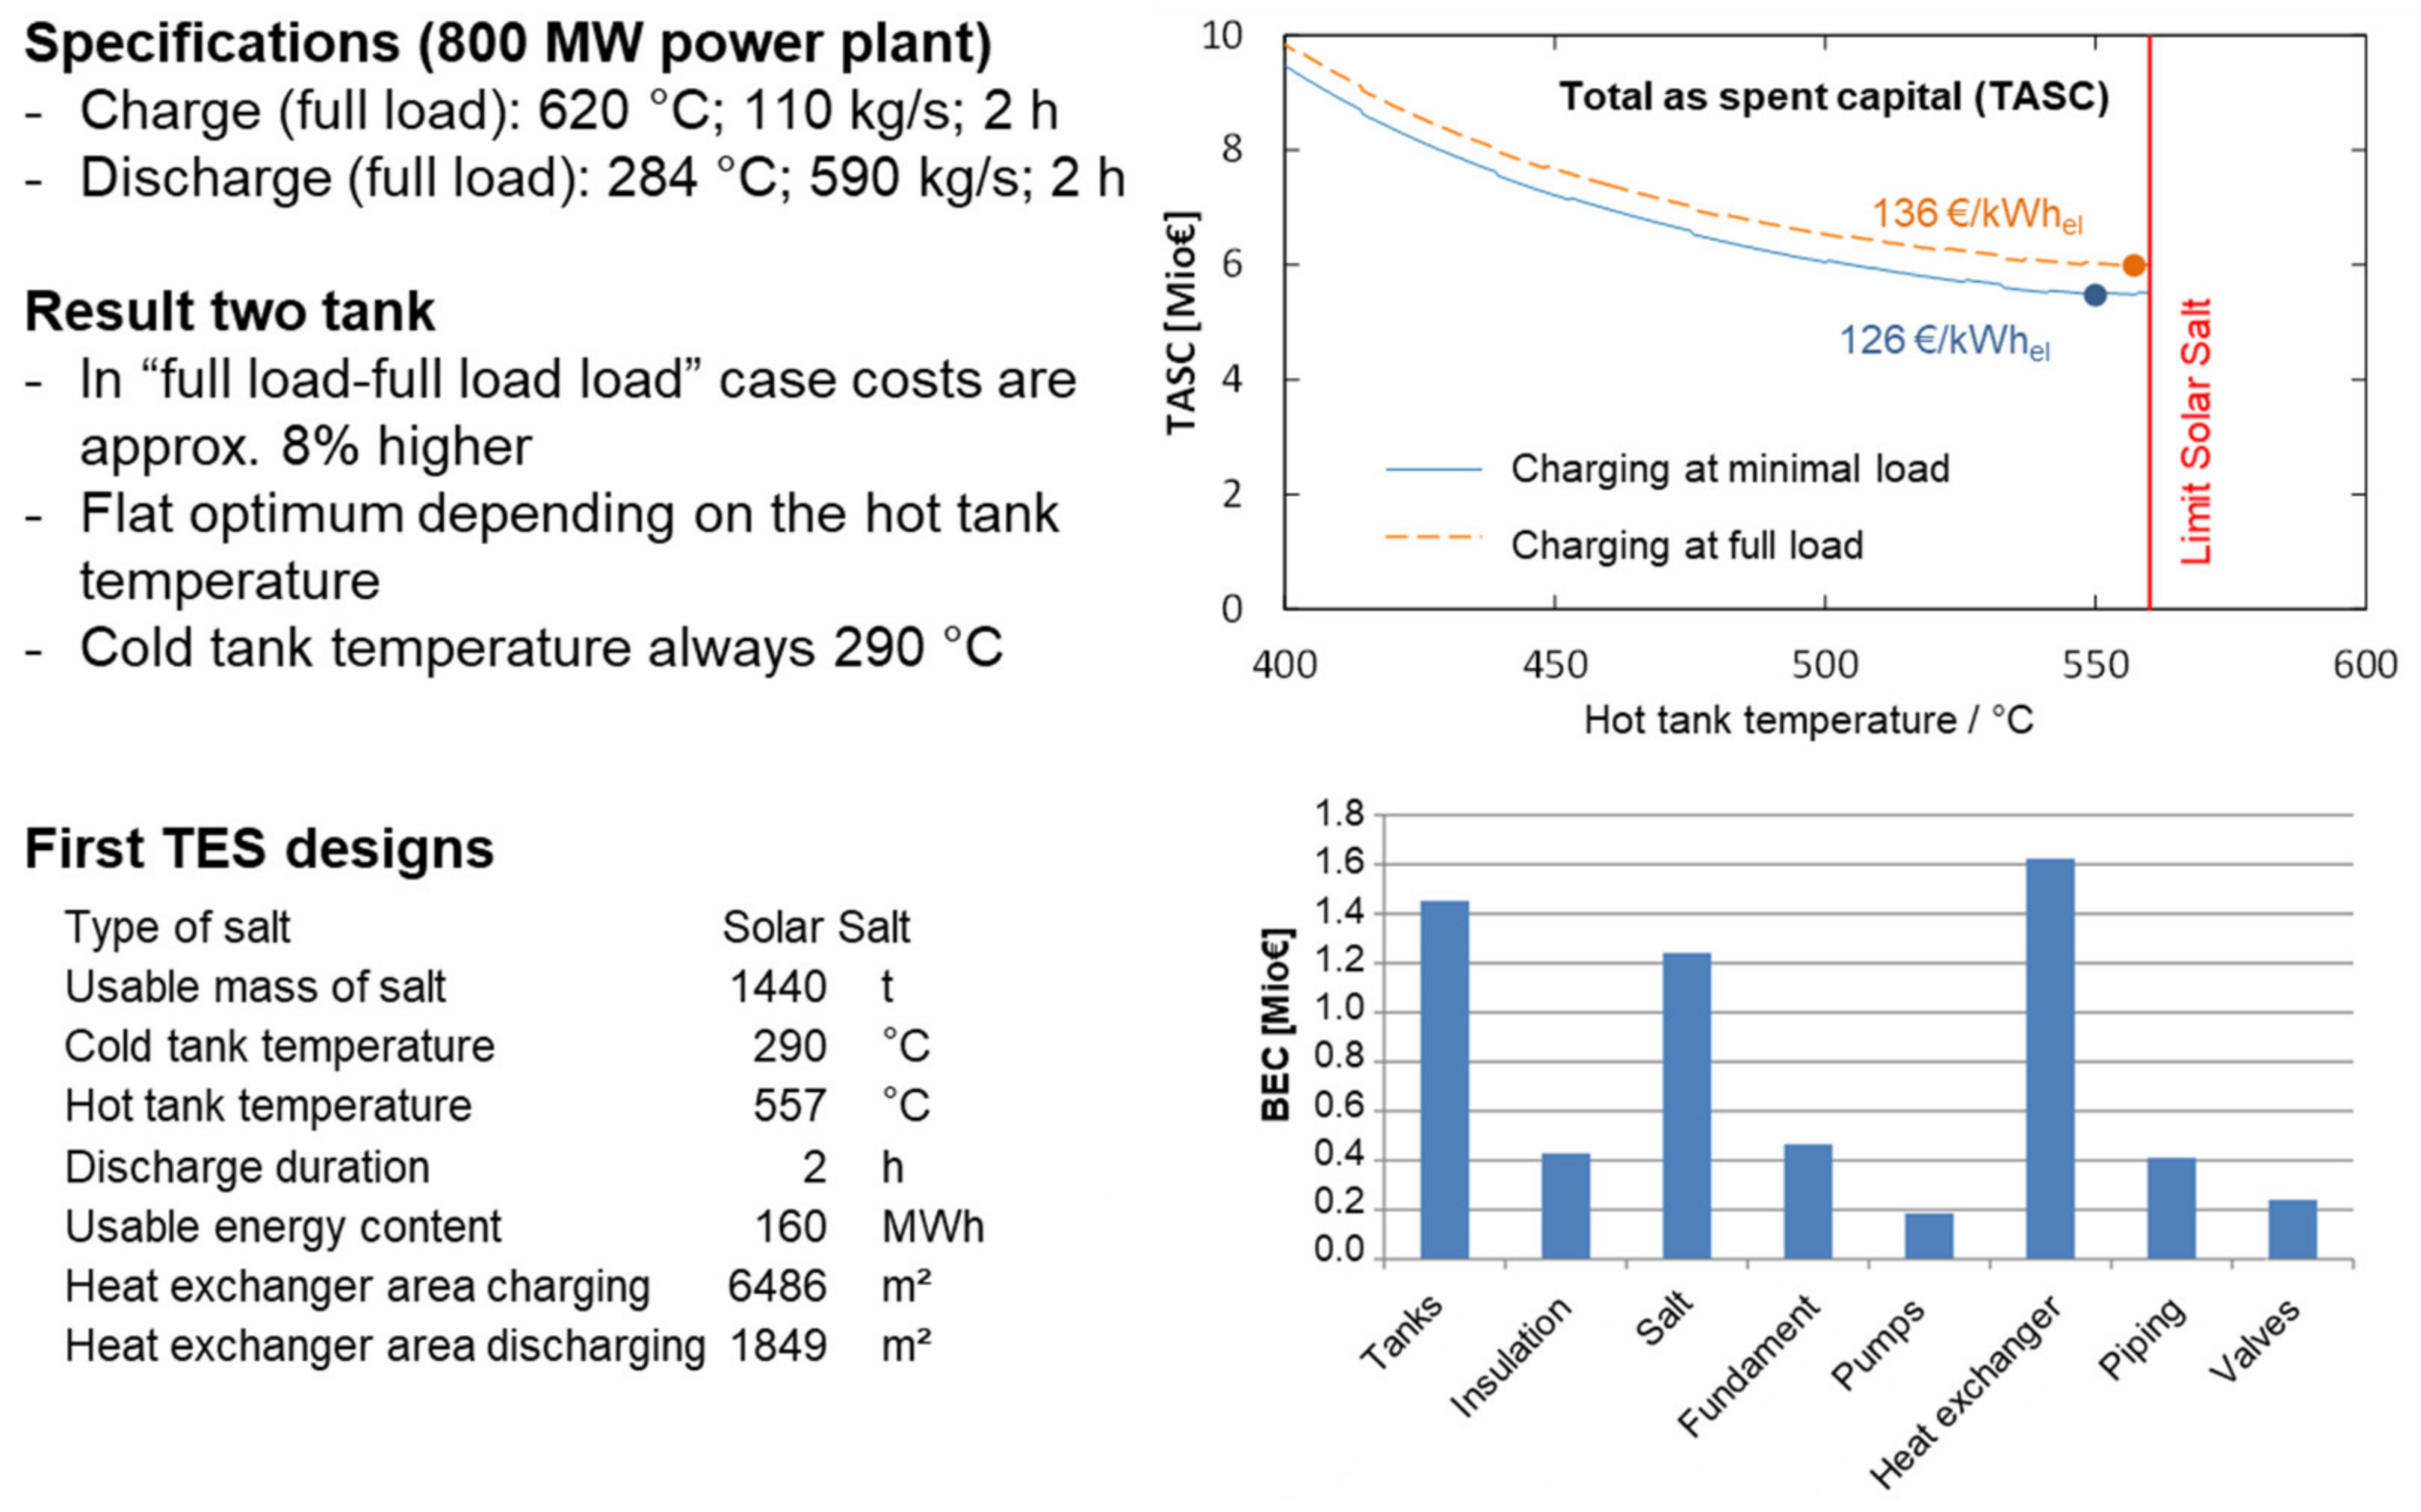
Figure 12.
Detailed variation calculations for the storage option “molten salt” (concept HRH-HPPH9_indirectly).
Figure 12.
Detailed variation calculations for the storage option “molten salt” (concept HRH-HPPH9_indirectly).
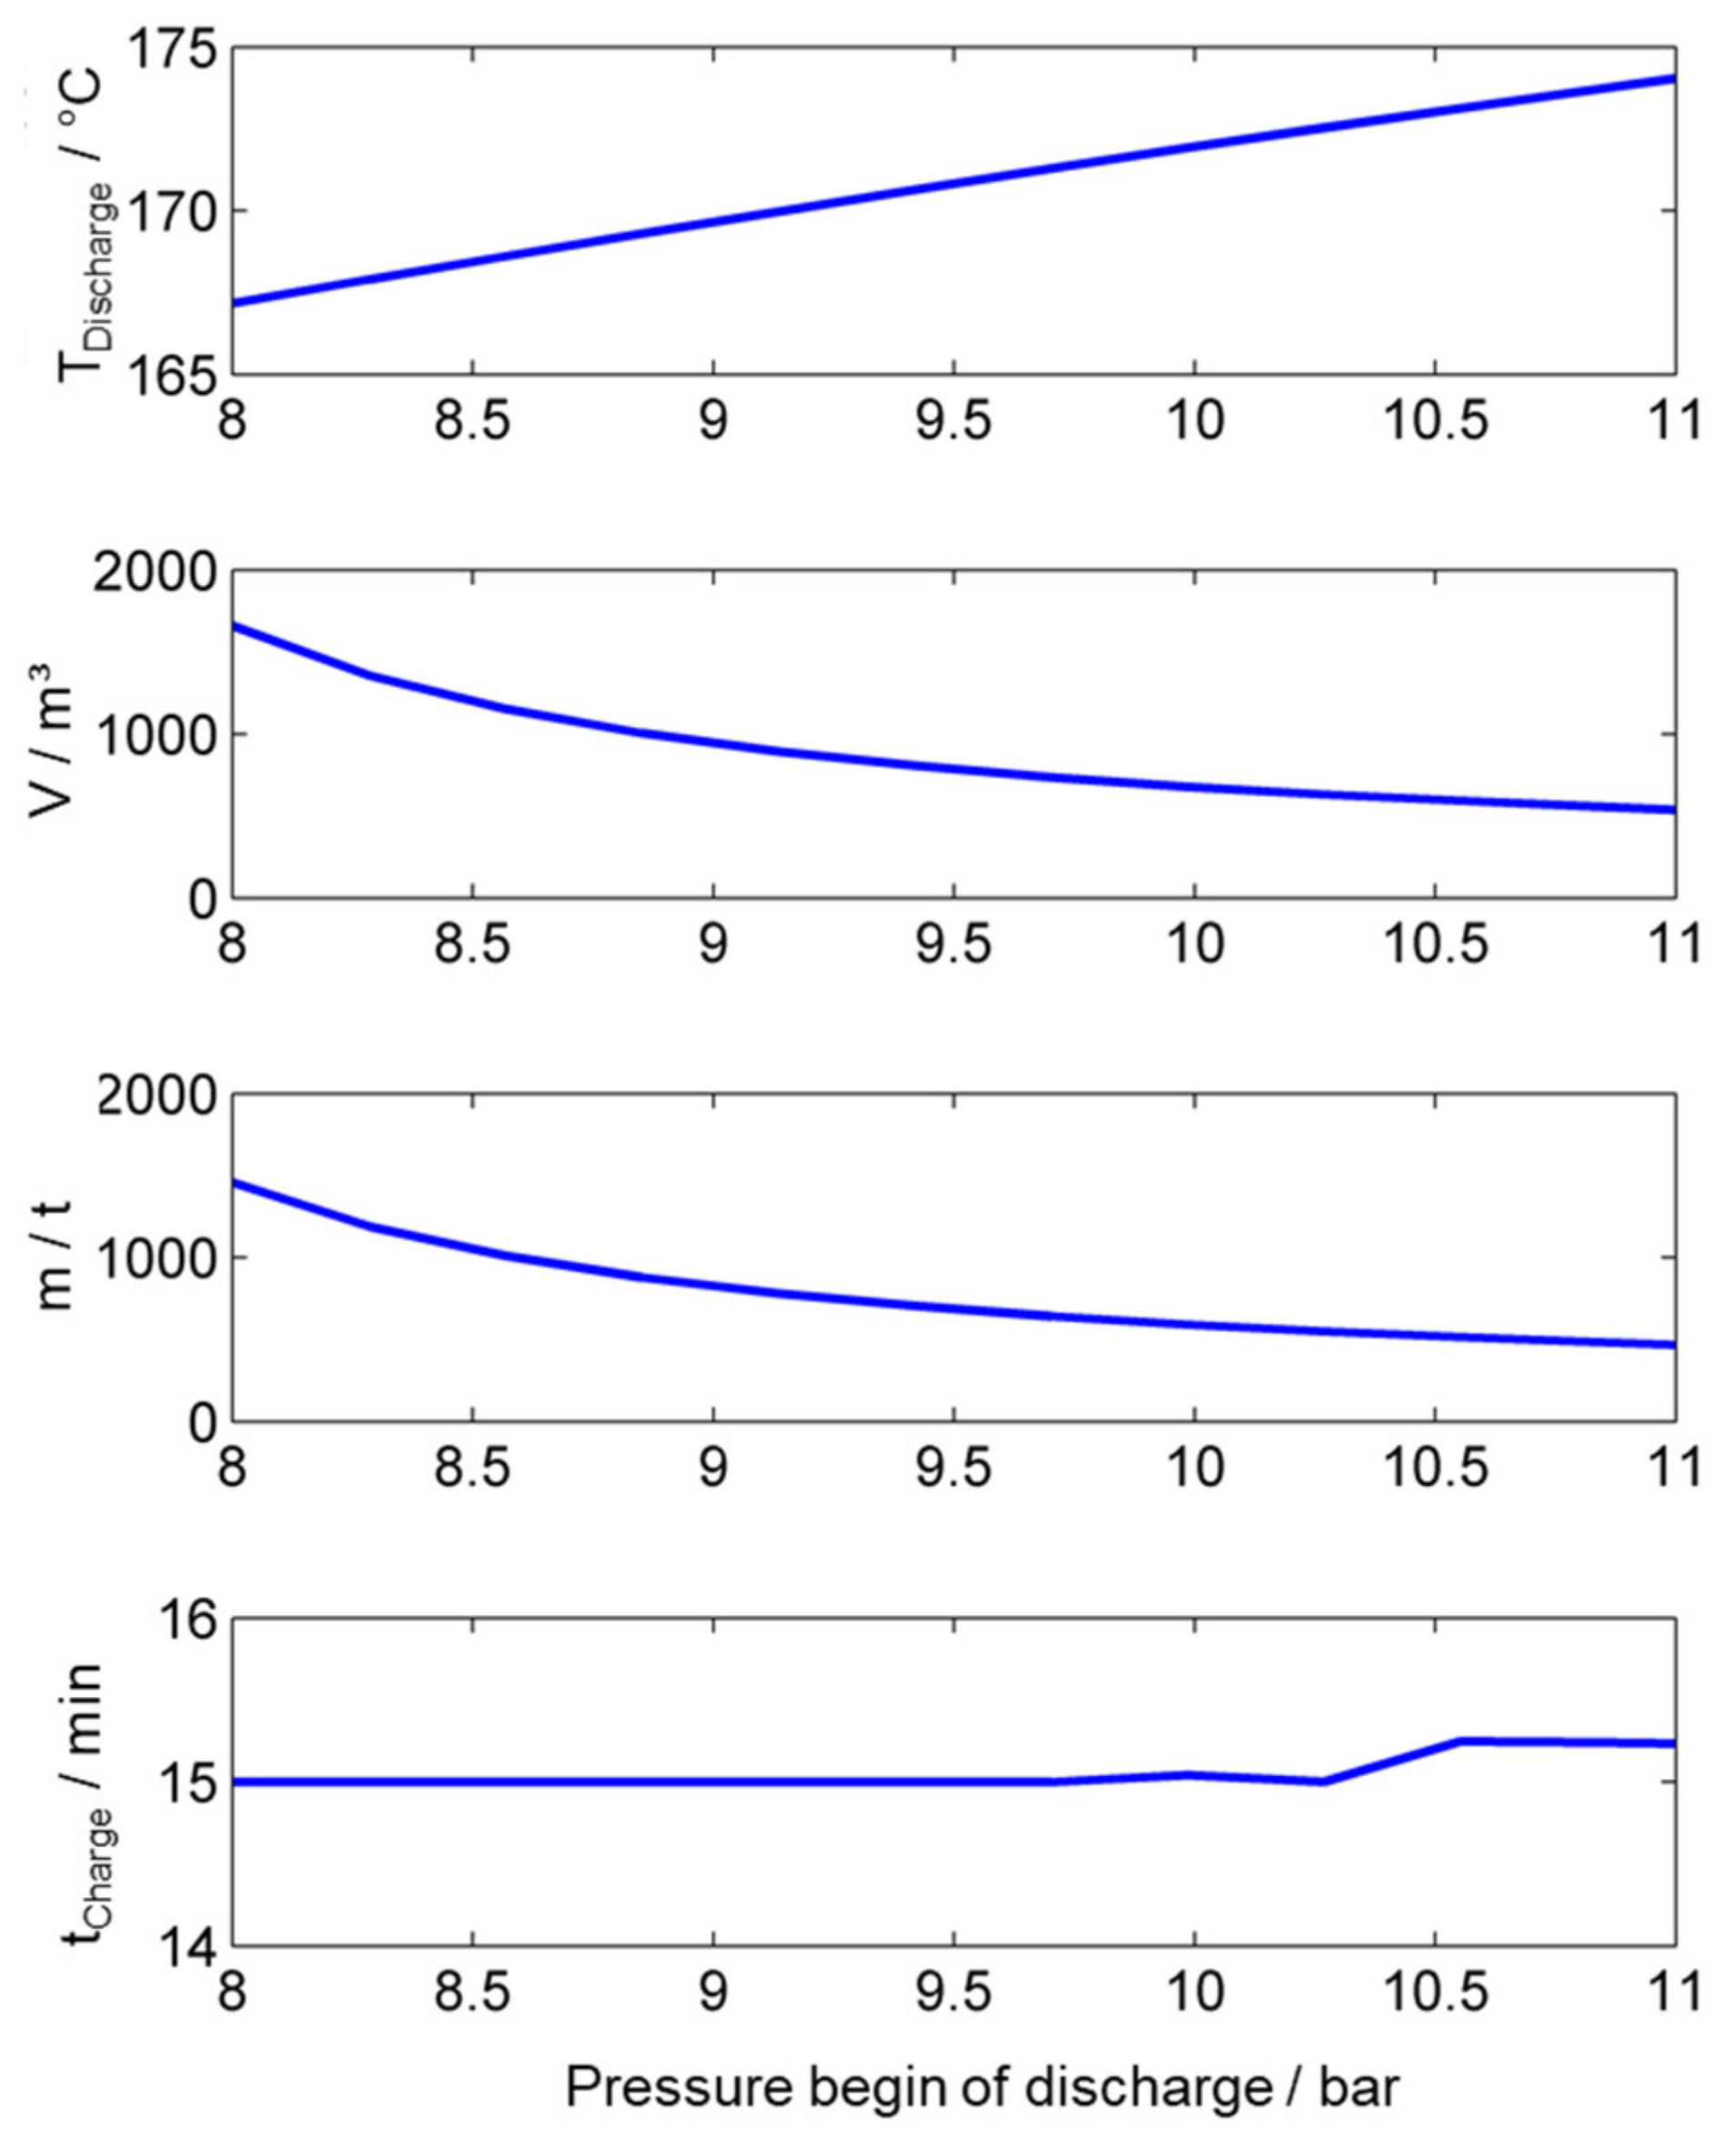
Figure 13.
Storage tank temperature, volume, mass as a function of discharge pressure.
Figure 13.
Storage tank temperature, volume, mass as a function of discharge pressure.
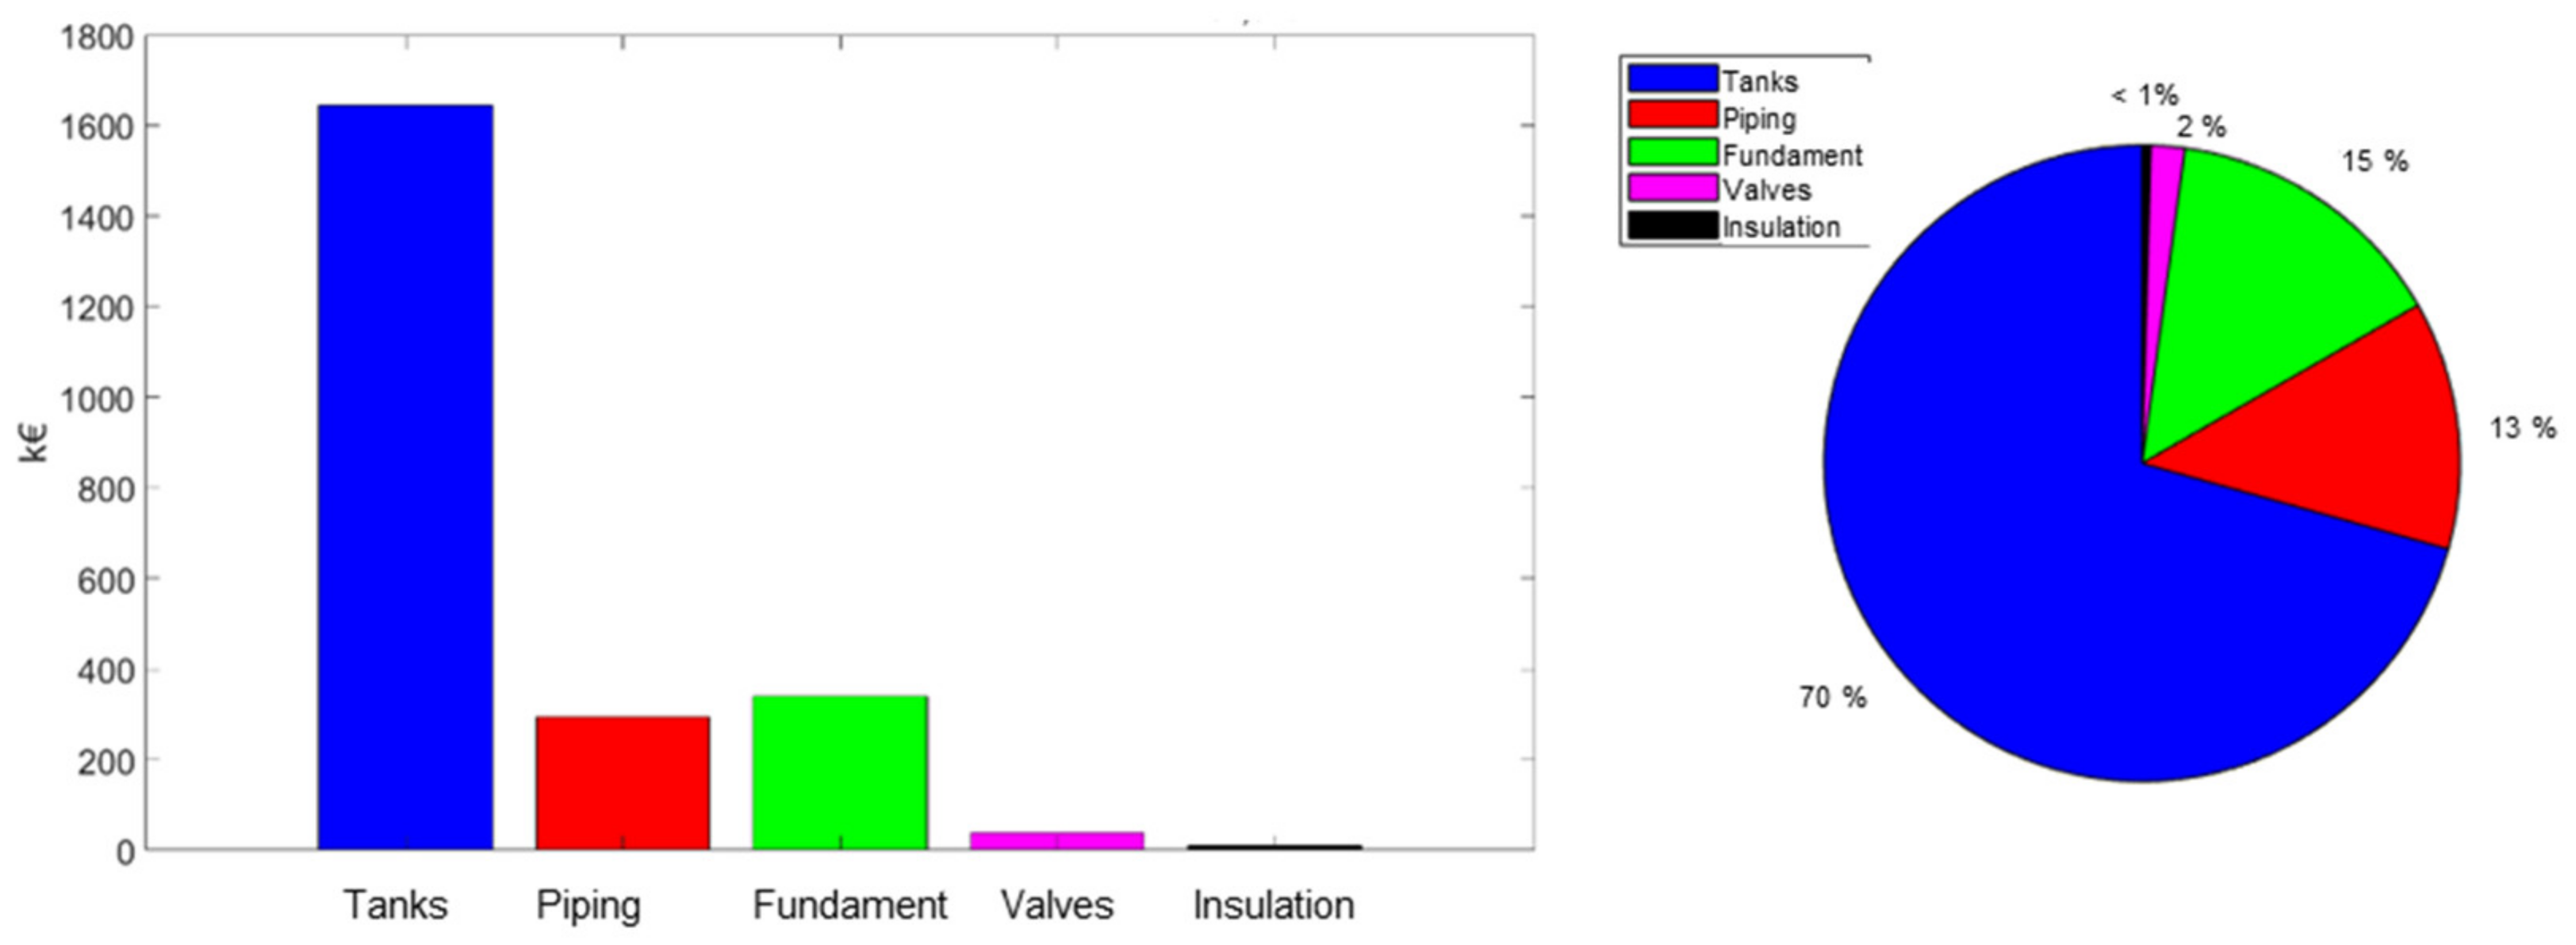
Figure 14.
Cost of the entire storage system.
Figure 14.
Cost of the entire storage system.
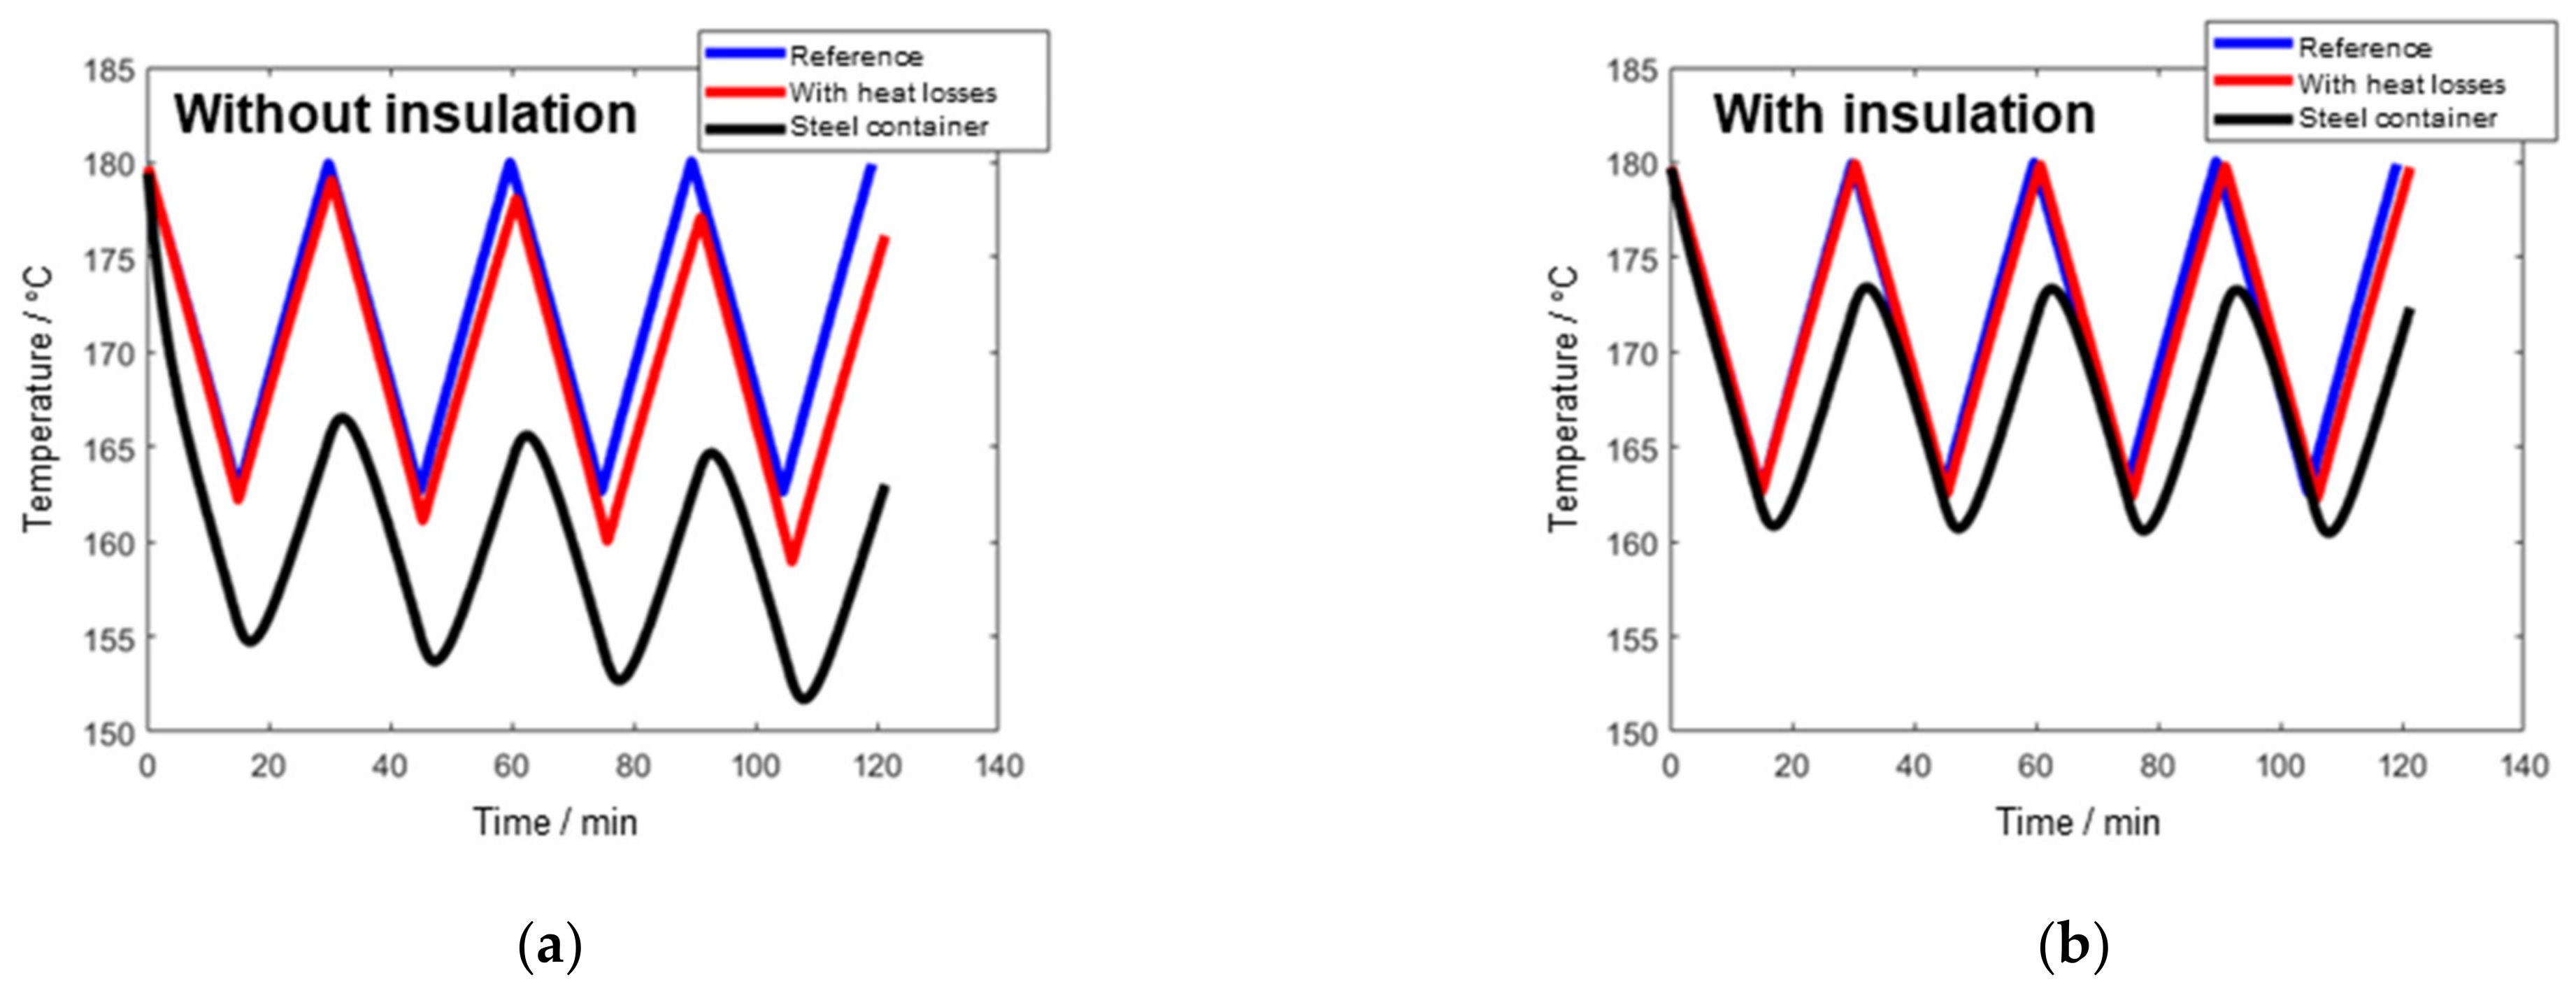
Figure 15.
Cyclic temperature curves with different configurations: (a) Without insulation; (b) With insulation.
Figure 15.
Cyclic temperature curves with different configurations: (a) Without insulation; (b) With insulation.
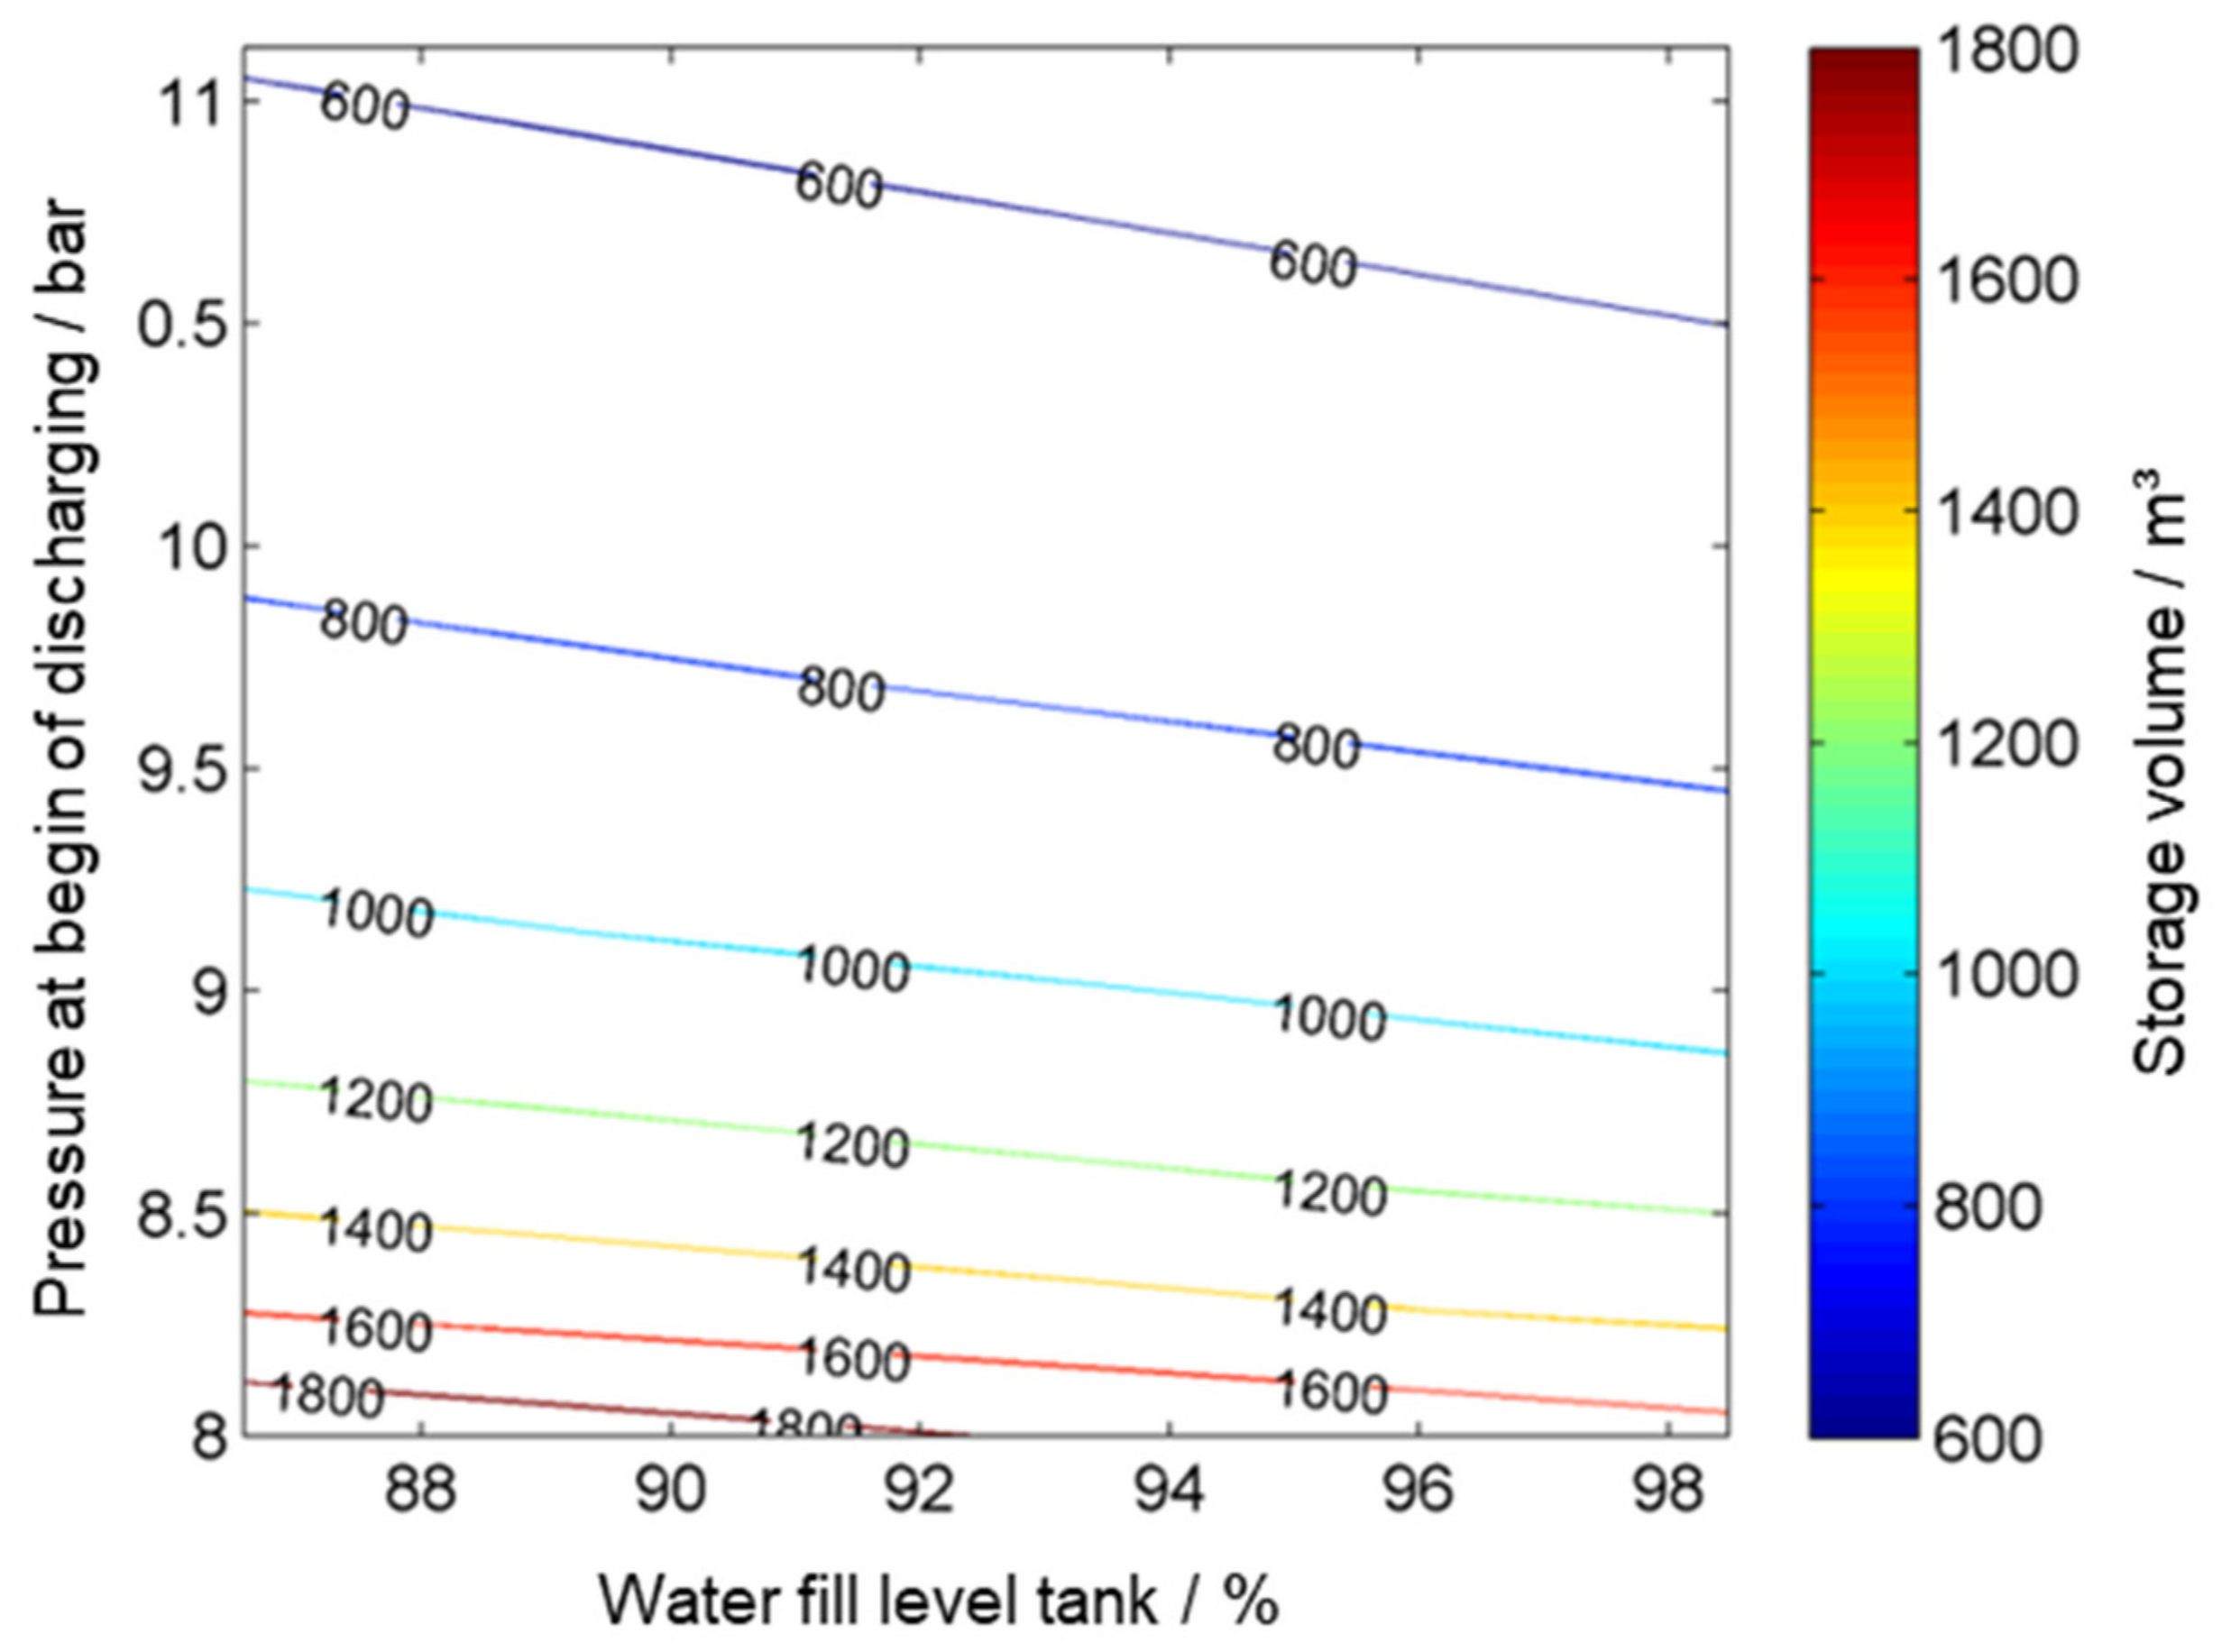
Figure 16.
Relationship between water level and storage volume.
Figure 16.
Relationship between water level and storage volume.
Figure 17.
Detailed variation calculations for the storage option “solid media heat storage” (concept Flue gas-Air_indirectly) (1).
Figure 17.
Detailed variation calculations for the storage option “solid media heat storage” (concept Flue gas-Air_indirectly) (1).
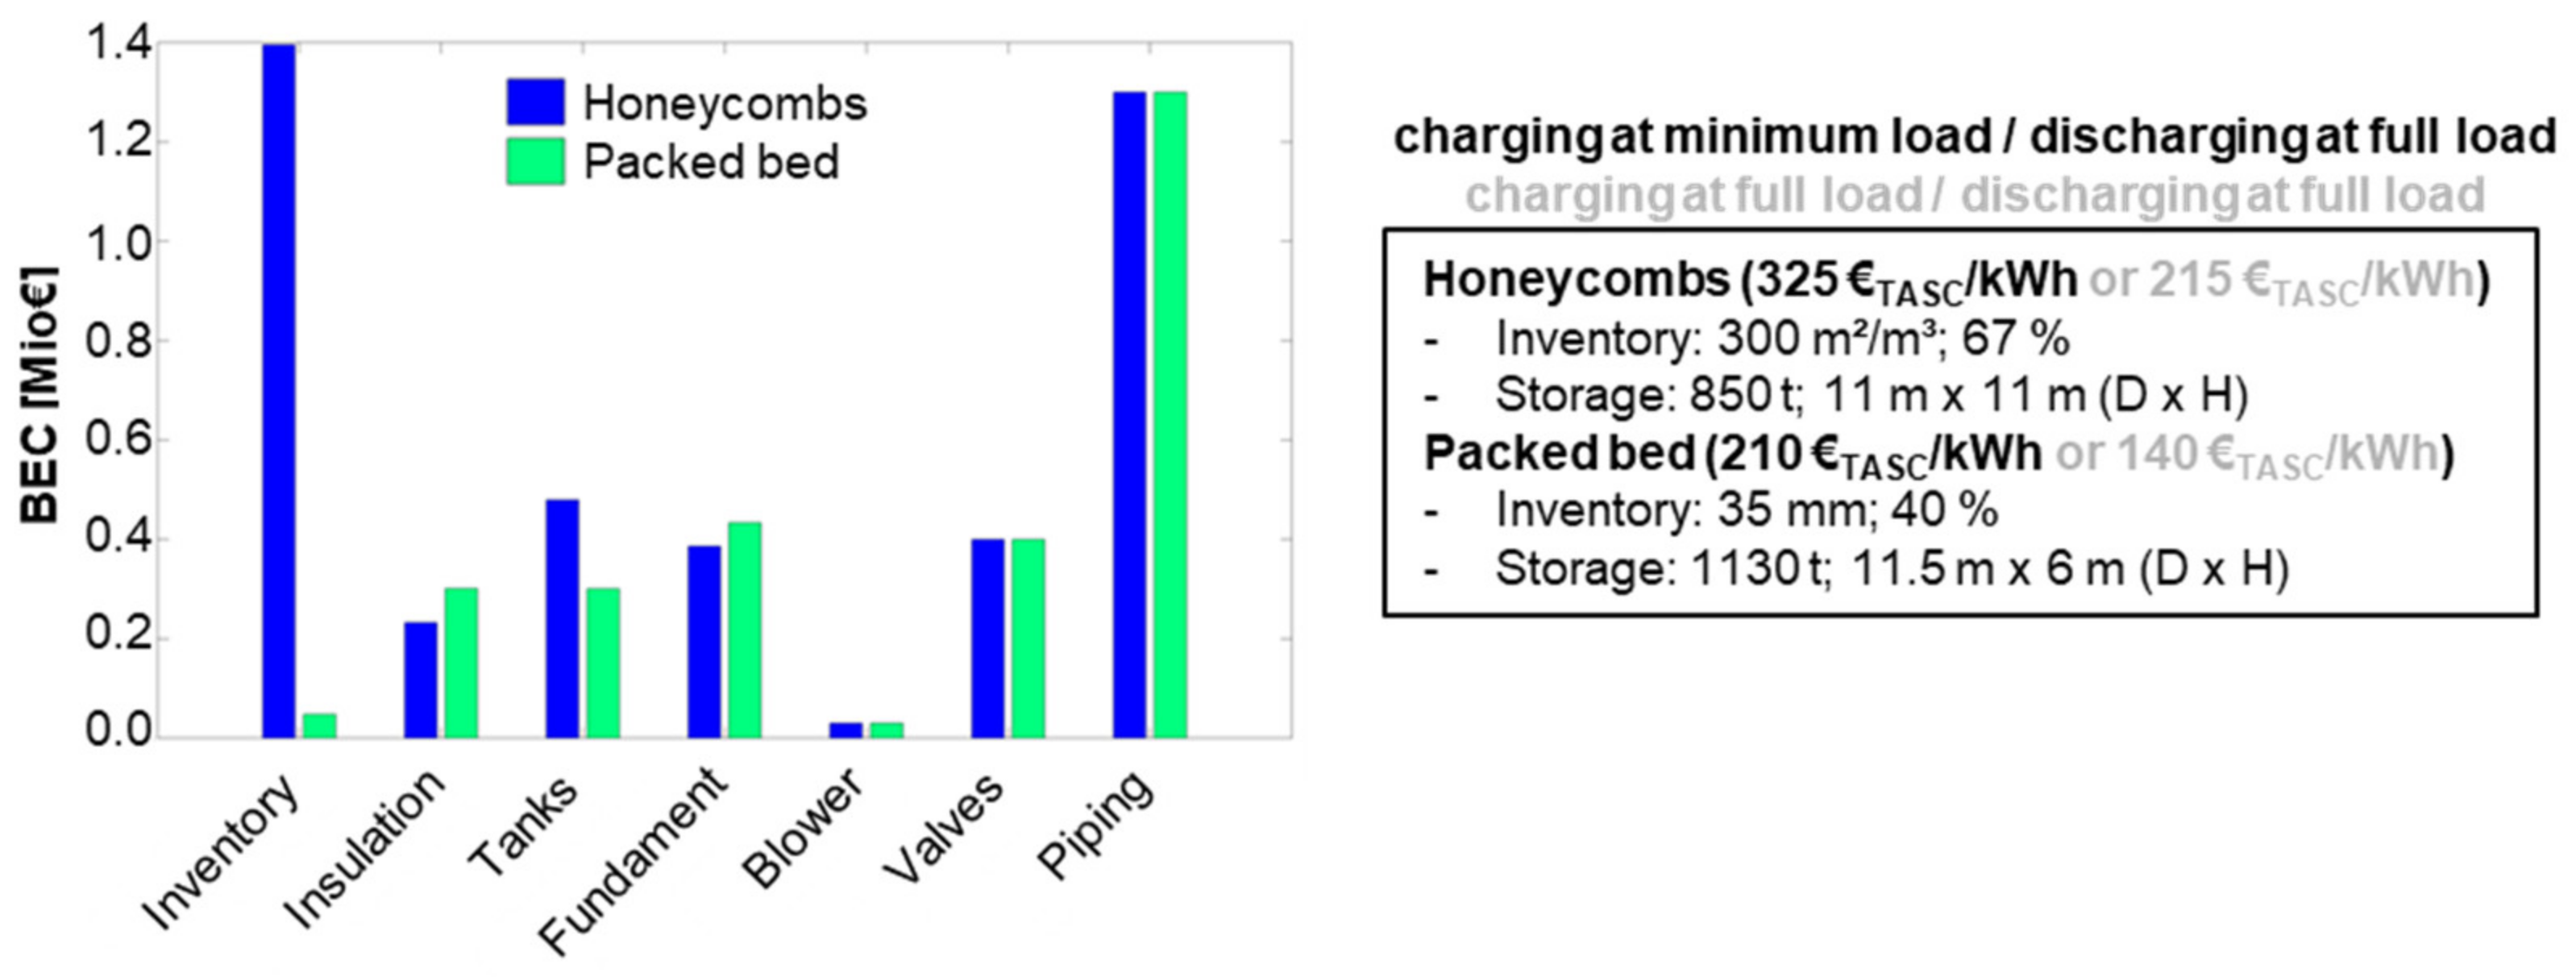
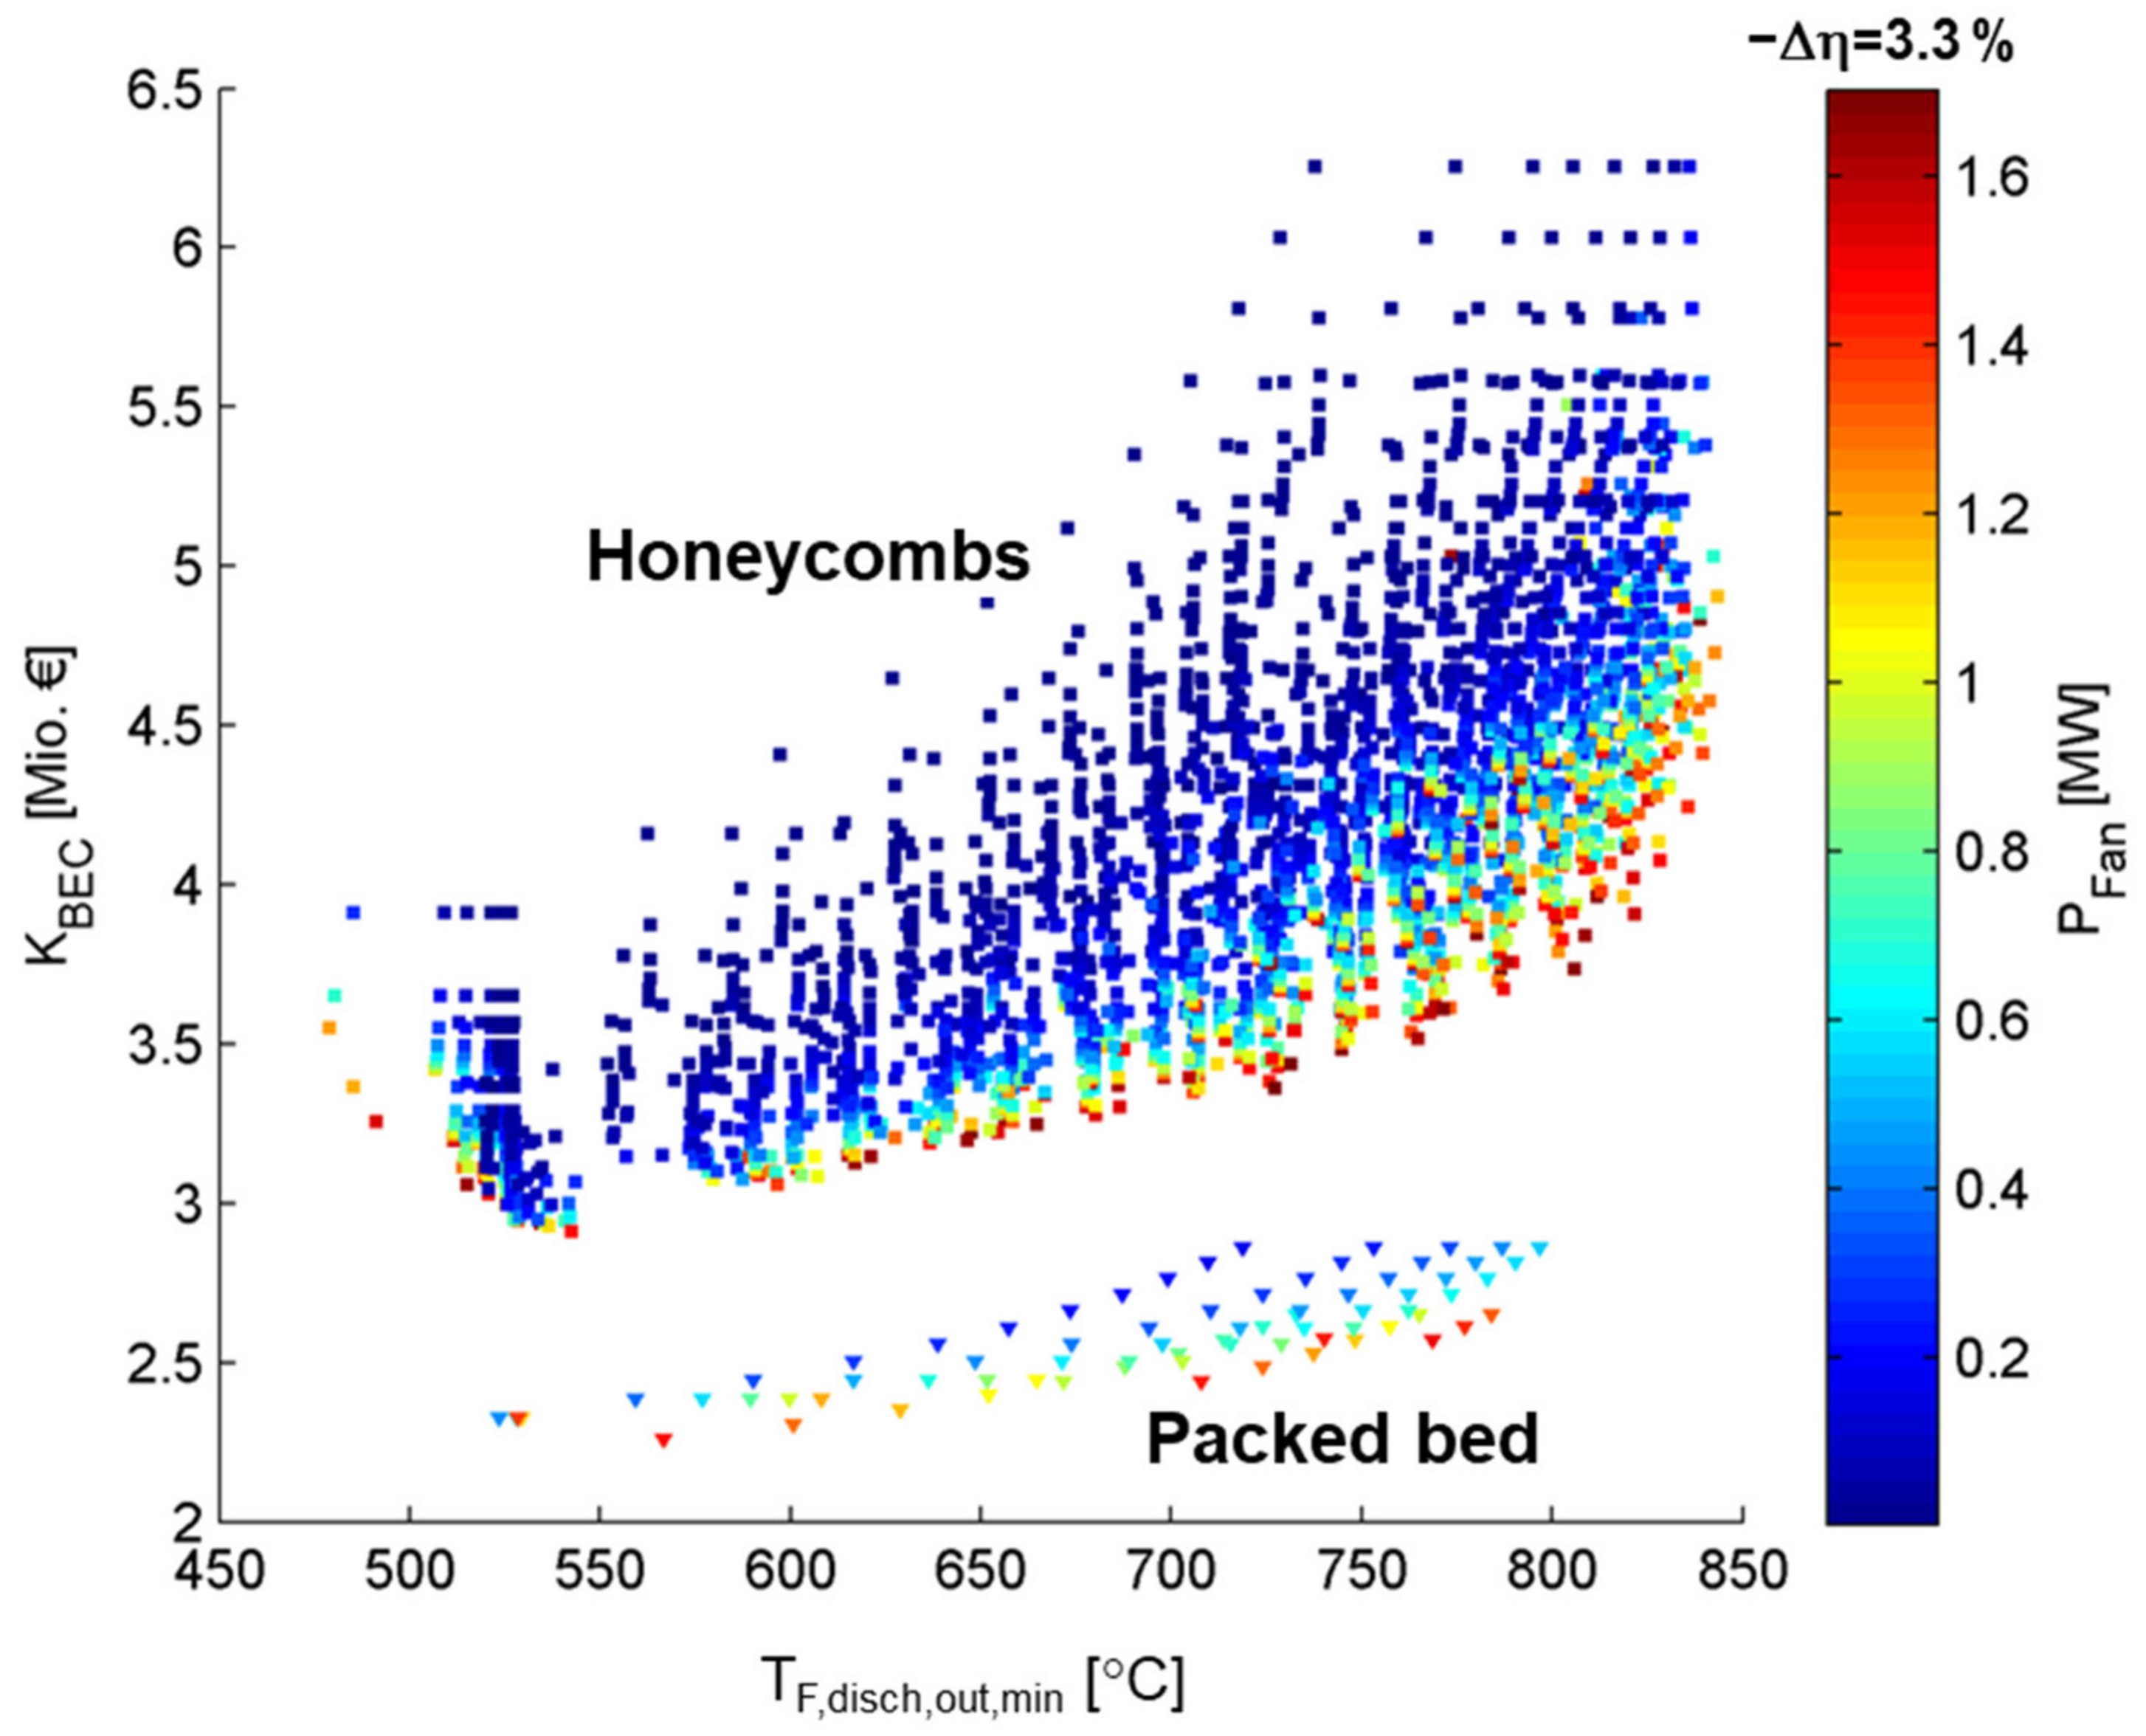
Figure 18.
Detailed variation calculations for the storage option “solid media heat storage” (concept Flue gas-Air_indirectly) (2).
Figure 18.
Detailed variation calculations for the storage option “solid media heat storage” (concept Flue gas-Air_indirectly) (2).
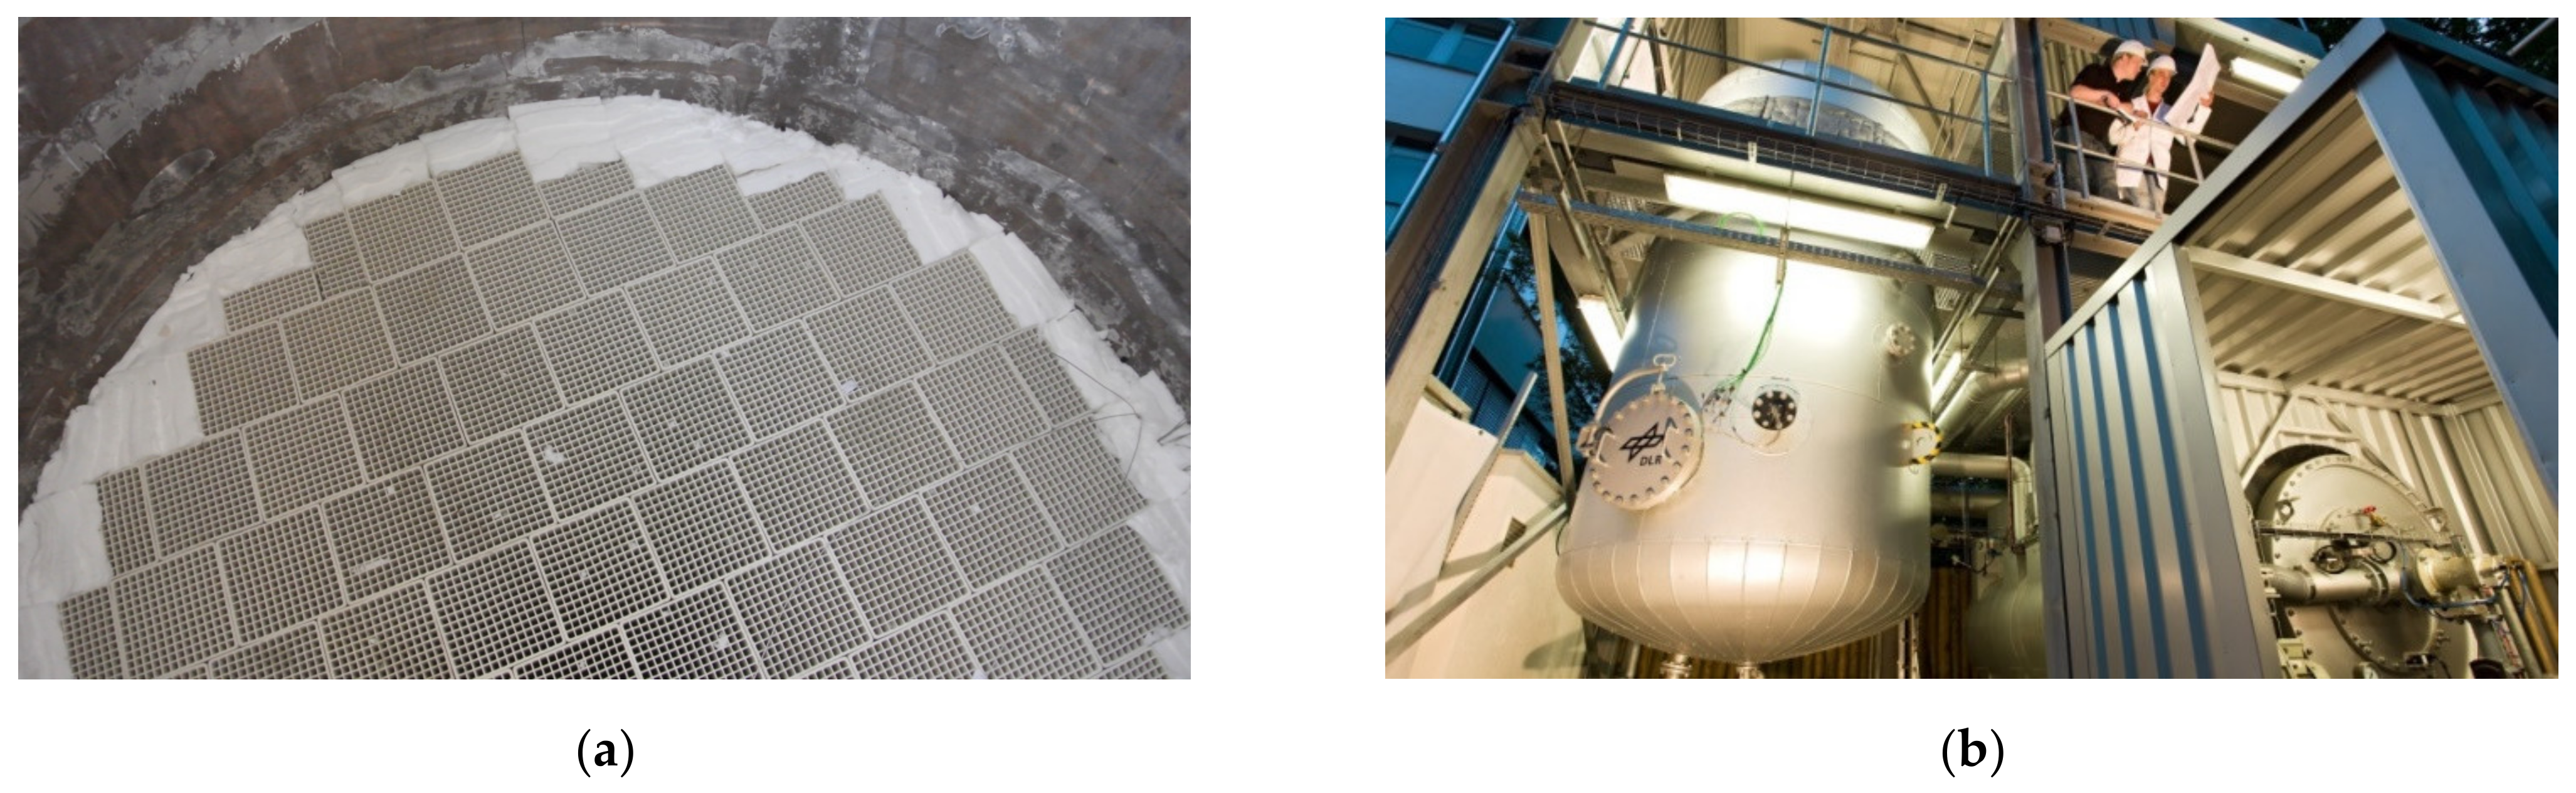
Figure 19.
Experimental setup: (a) honeycomb inventory and insulation; (b) HOTREG test facility.
Figure 19.
Experimental setup: (a) honeycomb inventory and insulation; (b) HOTREG test facility.
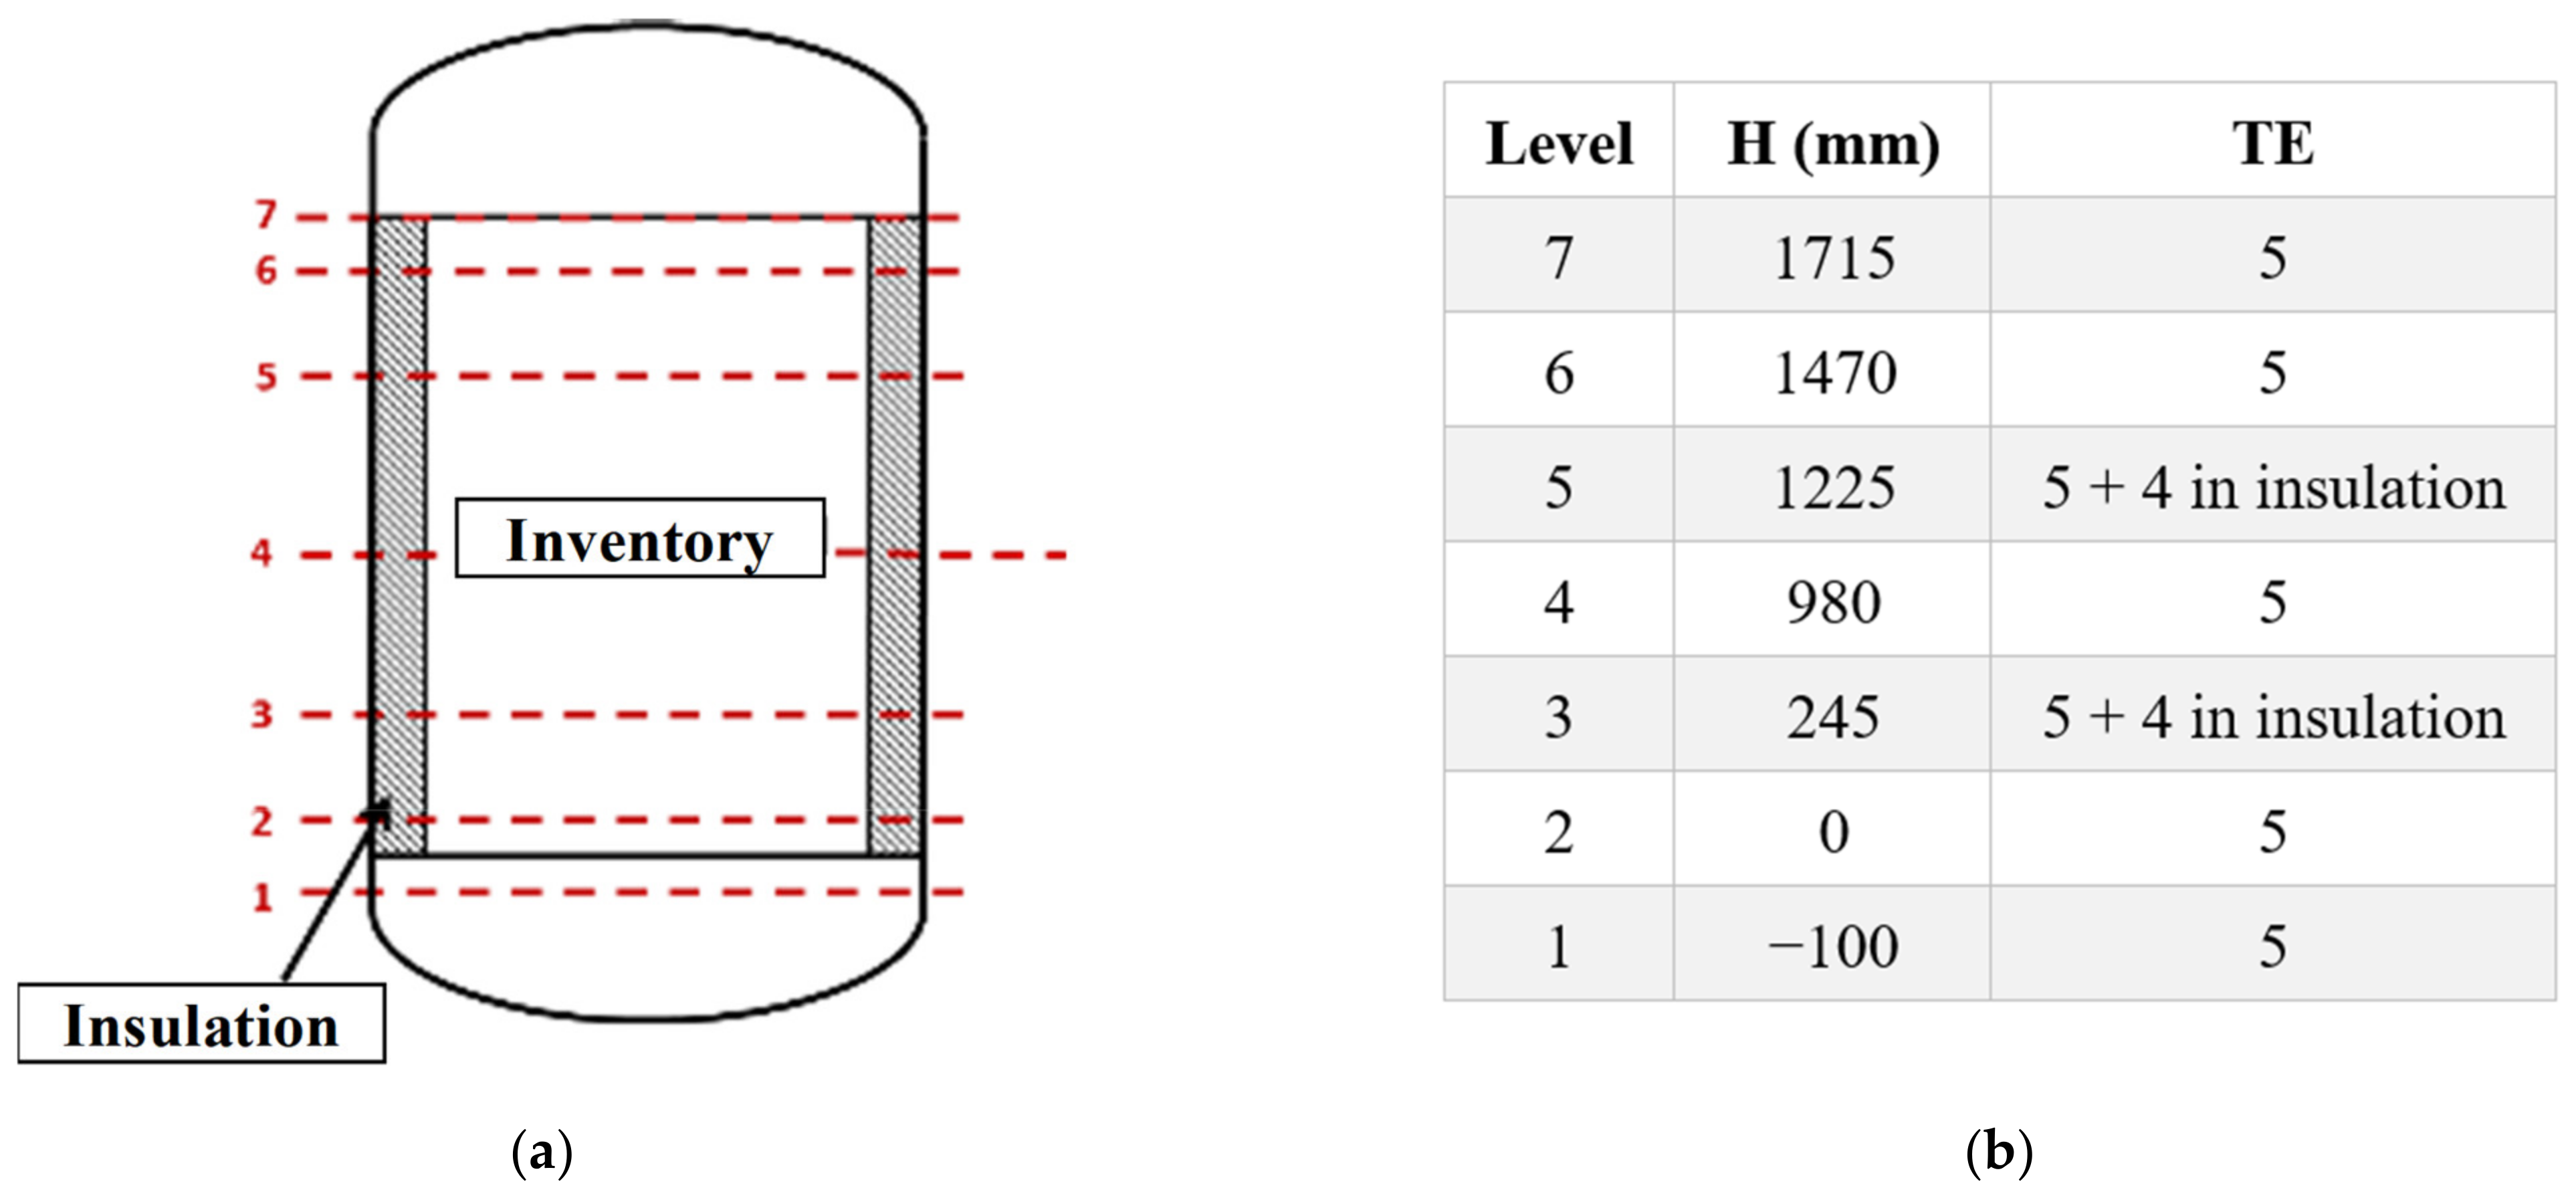
Figure 20.
Measurement setup: (a) measurement levels in the drawing; (b) positions and number of thermocouples.
Figure 20.
Measurement setup: (a) measurement levels in the drawing; (b) positions and number of thermocouples.
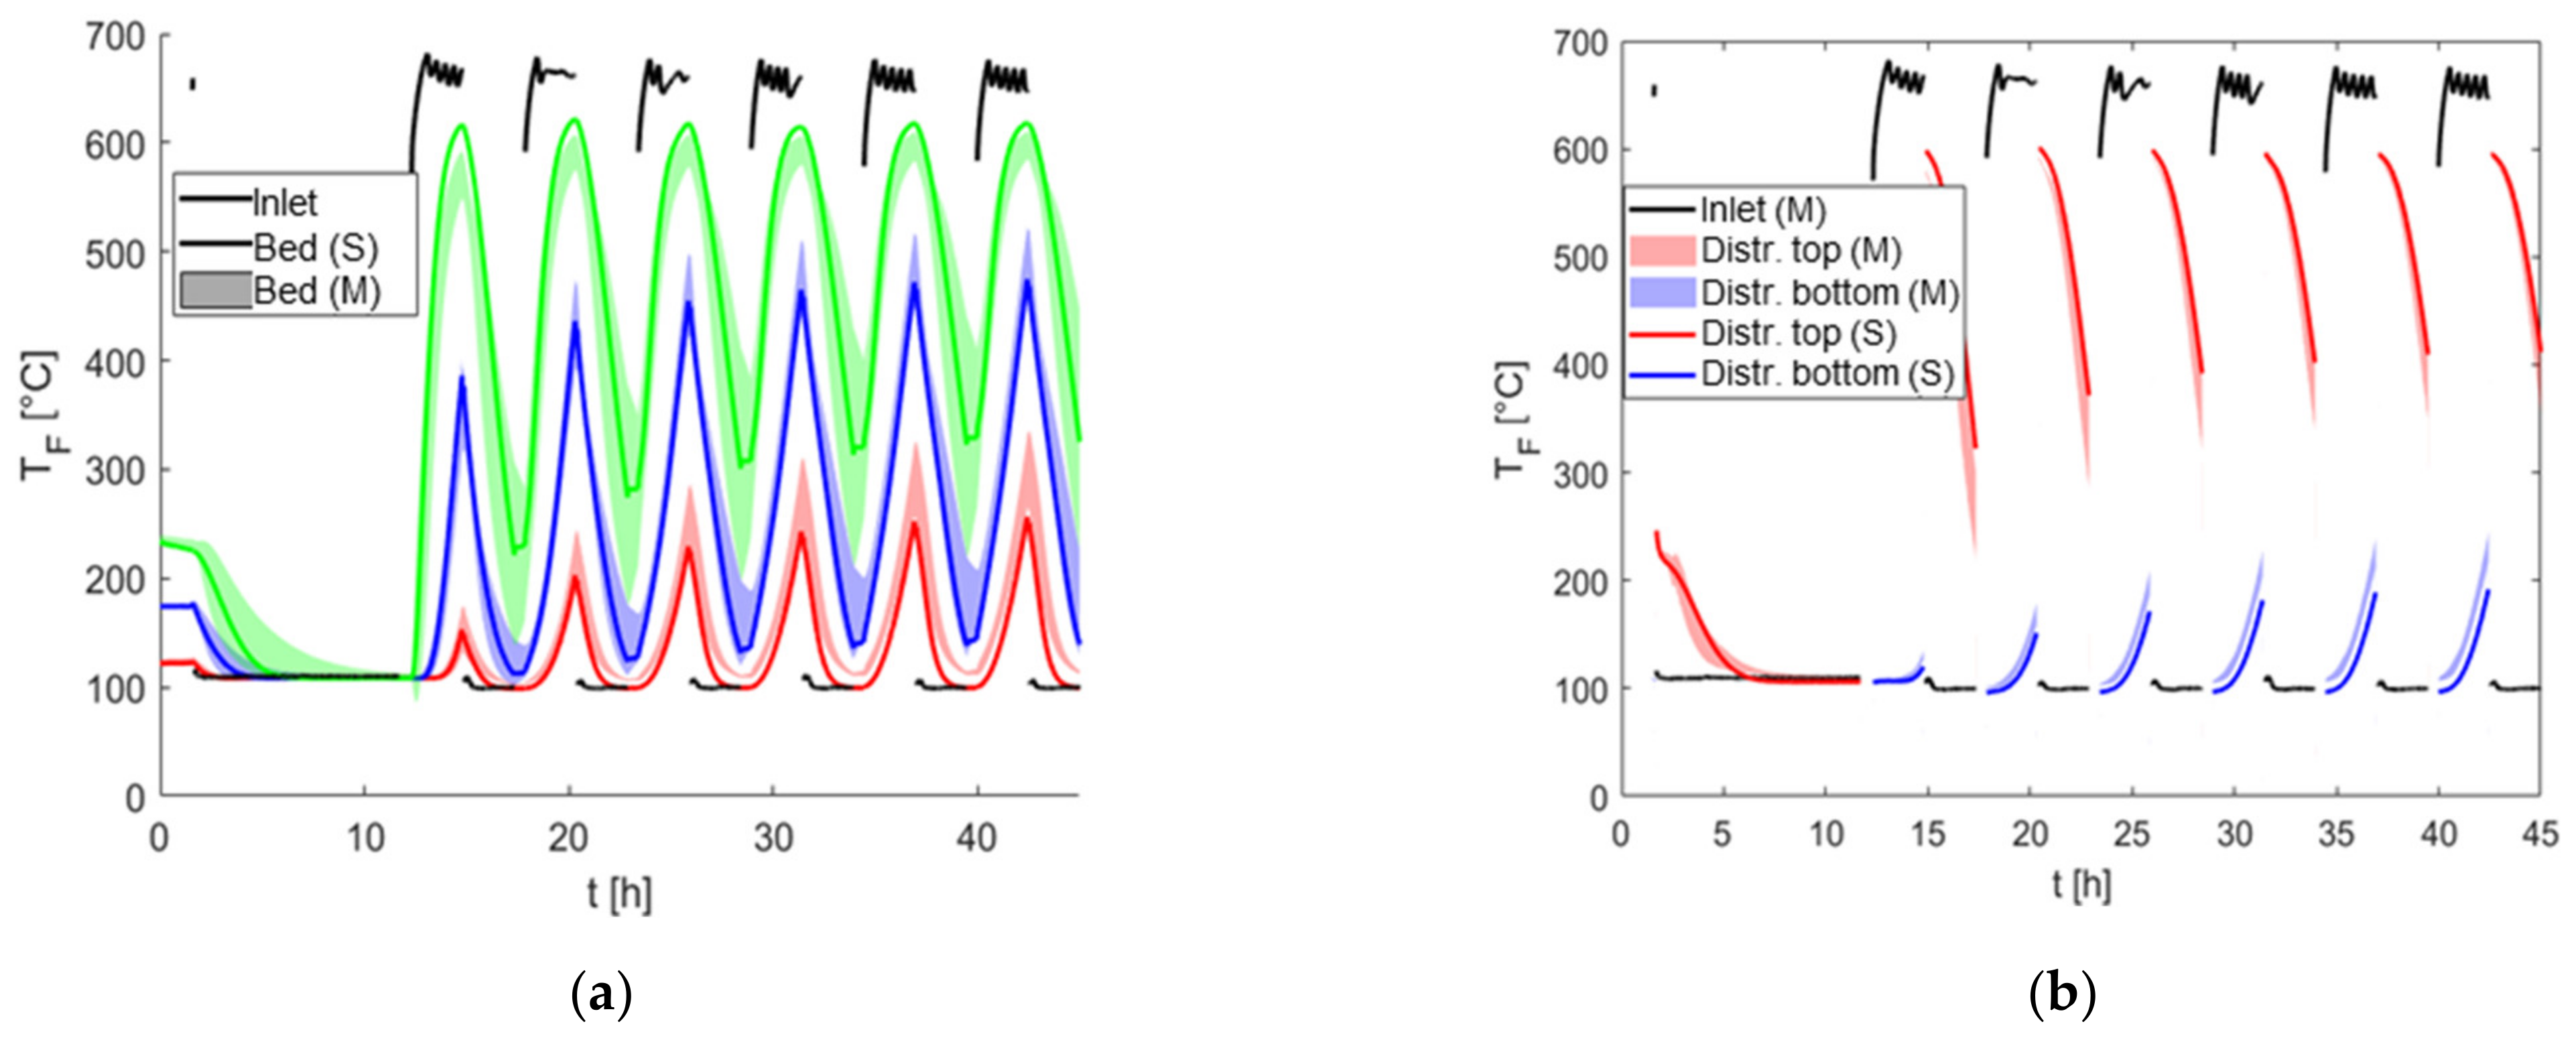
Figure 21.
Test T1—Fluid temperature (TF), measurement (M), simulation (S): (a) temperature at bed height 0.3 m (red), 0.9 m (blue), 1.5 m (green); (b) temperature in the hot-side (top)/cold-side (bottom) manifold.
Figure 21.
Test T1—Fluid temperature (TF), measurement (M), simulation (S): (a) temperature at bed height 0.3 m (red), 0.9 m (blue), 1.5 m (green); (b) temperature in the hot-side (top)/cold-side (bottom) manifold.
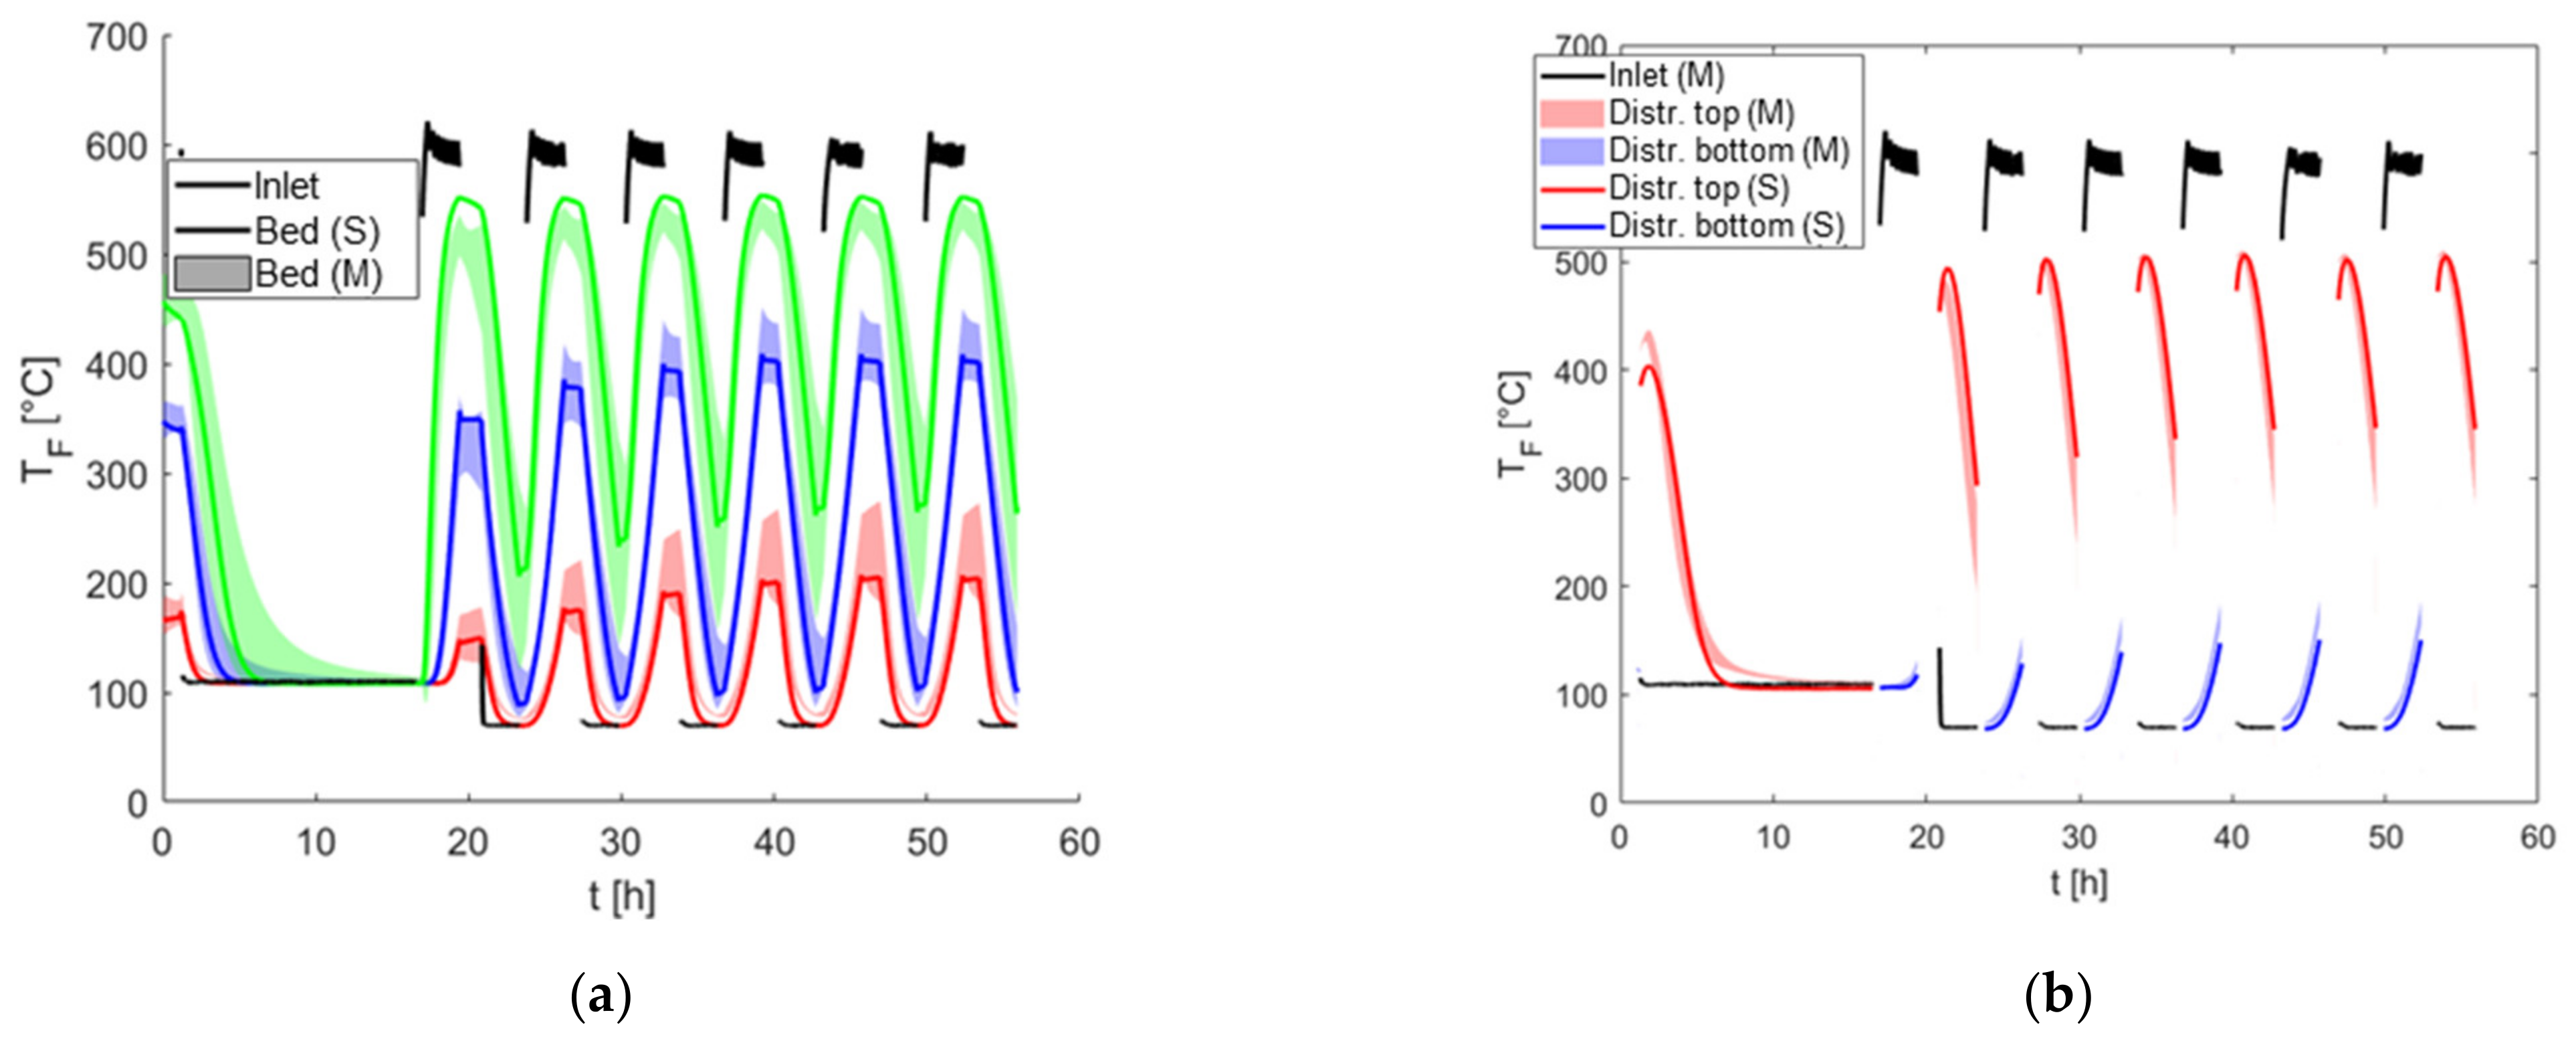
Figure 22.
Test T2—Fluid temperature (TF), measurement (M), simulation (S): (a) temperature at bed height 0.3 m (red), 0.9 m (blue), 1.5 m (green); (b) temperature in the hot-side (top)/cold-side (bottom) manifold.
Figure 22.
Test T2—Fluid temperature (TF), measurement (M), simulation (S): (a) temperature at bed height 0.3 m (red), 0.9 m (blue), 1.5 m (green); (b) temperature in the hot-side (top)/cold-side (bottom) manifold.
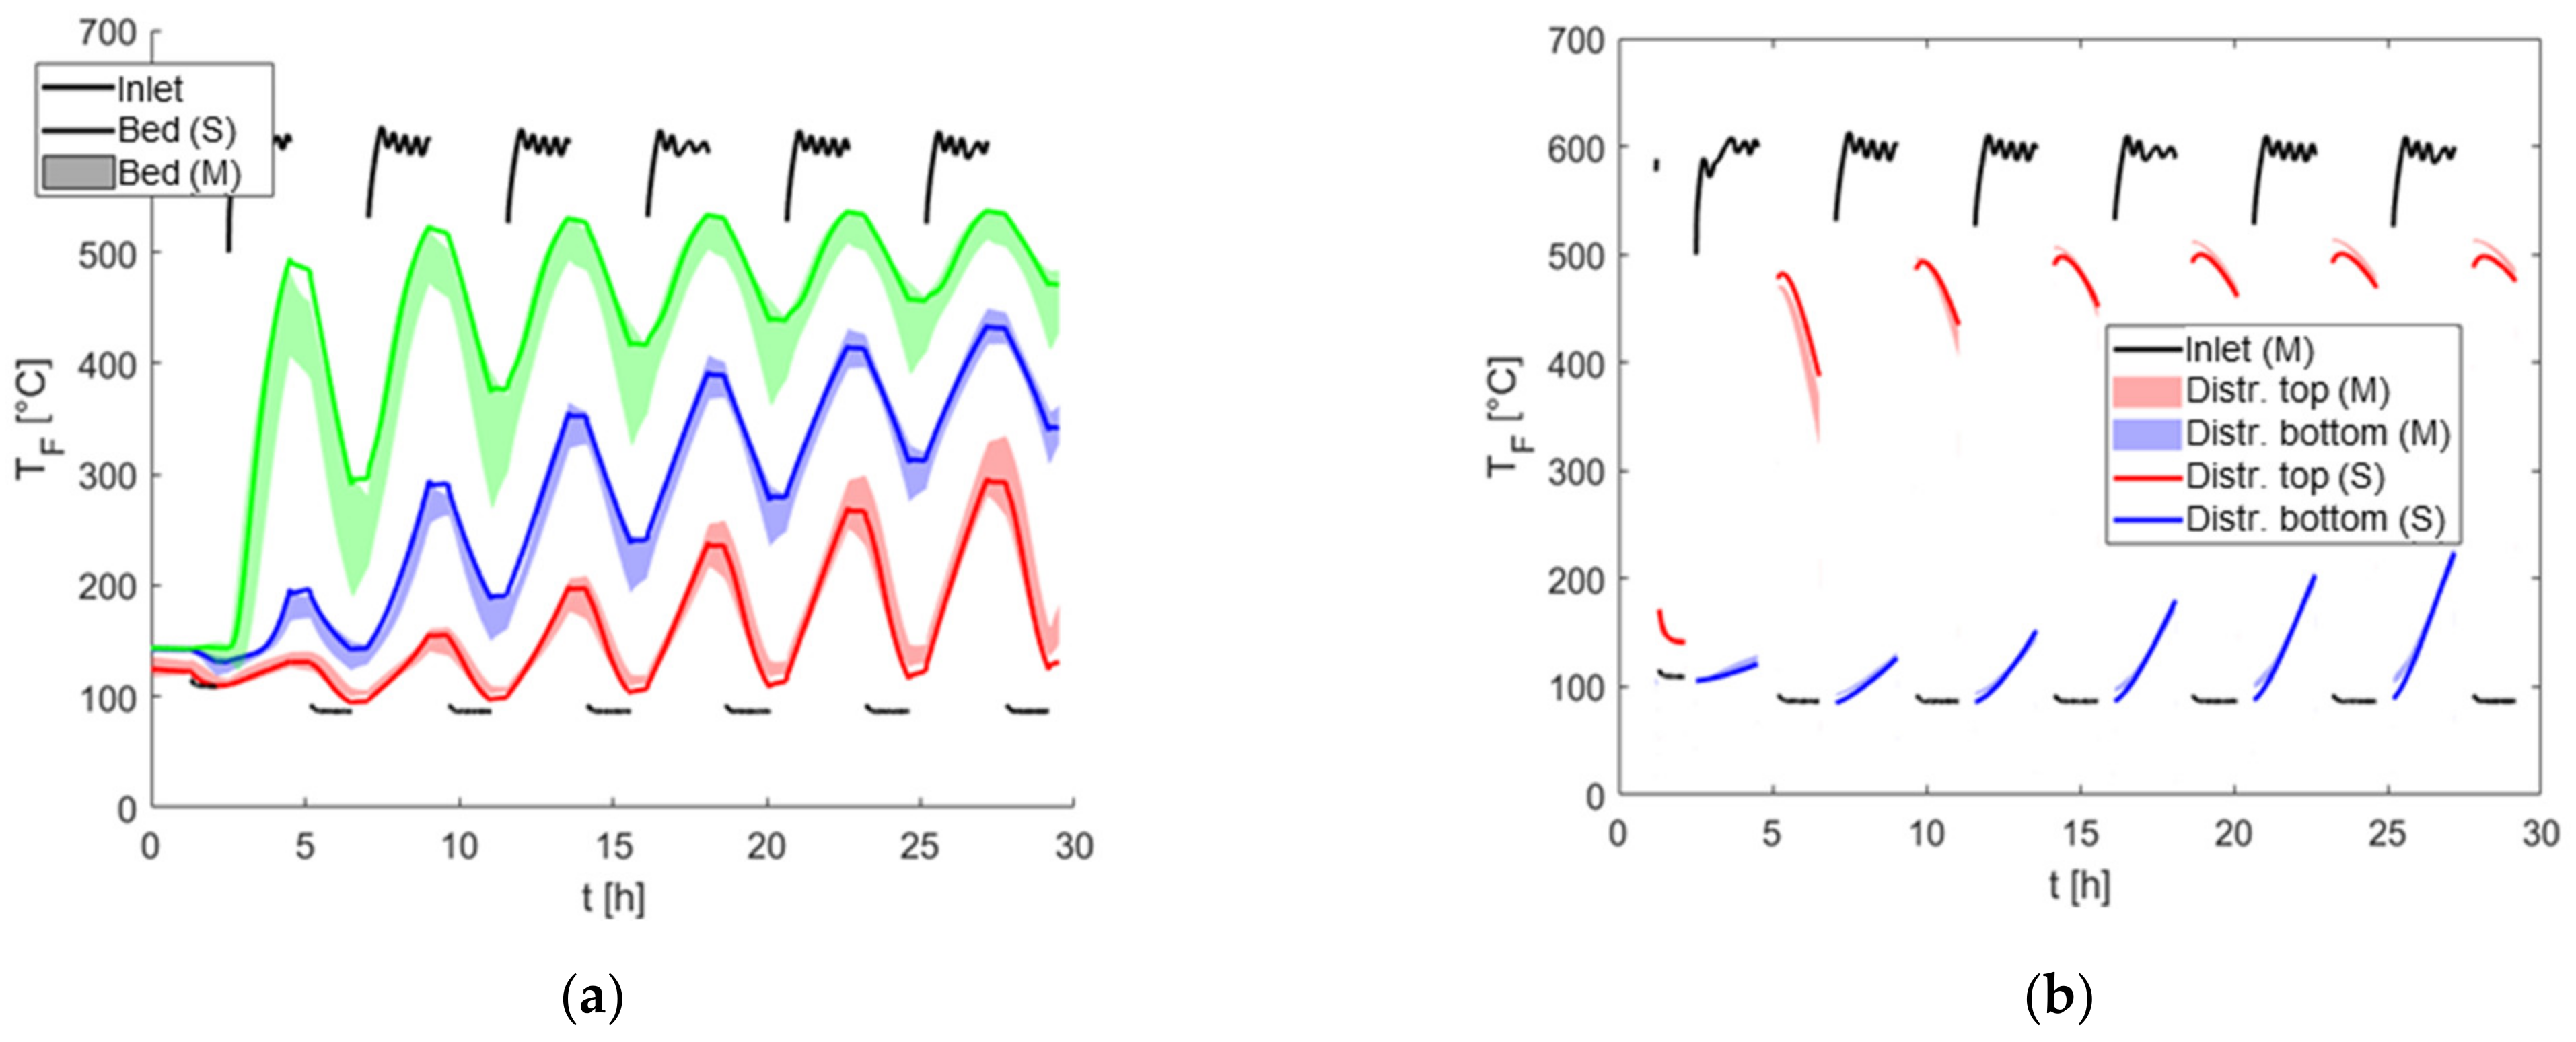
Figure 23.
Test T3—Fluid temperature (TF), measurement (M), simulation (S): (a) temperature at bed height 0.3 m (red), 0.9 m (blue), 1.5 m (green); (b) temperature in the hot-side (top)/cold-side (bottom) manifold.
Figure 23.
Test T3—Fluid temperature (TF), measurement (M), simulation (S): (a) temperature at bed height 0.3 m (red), 0.9 m (blue), 1.5 m (green); (b) temperature in the hot-side (top)/cold-side (bottom) manifold.
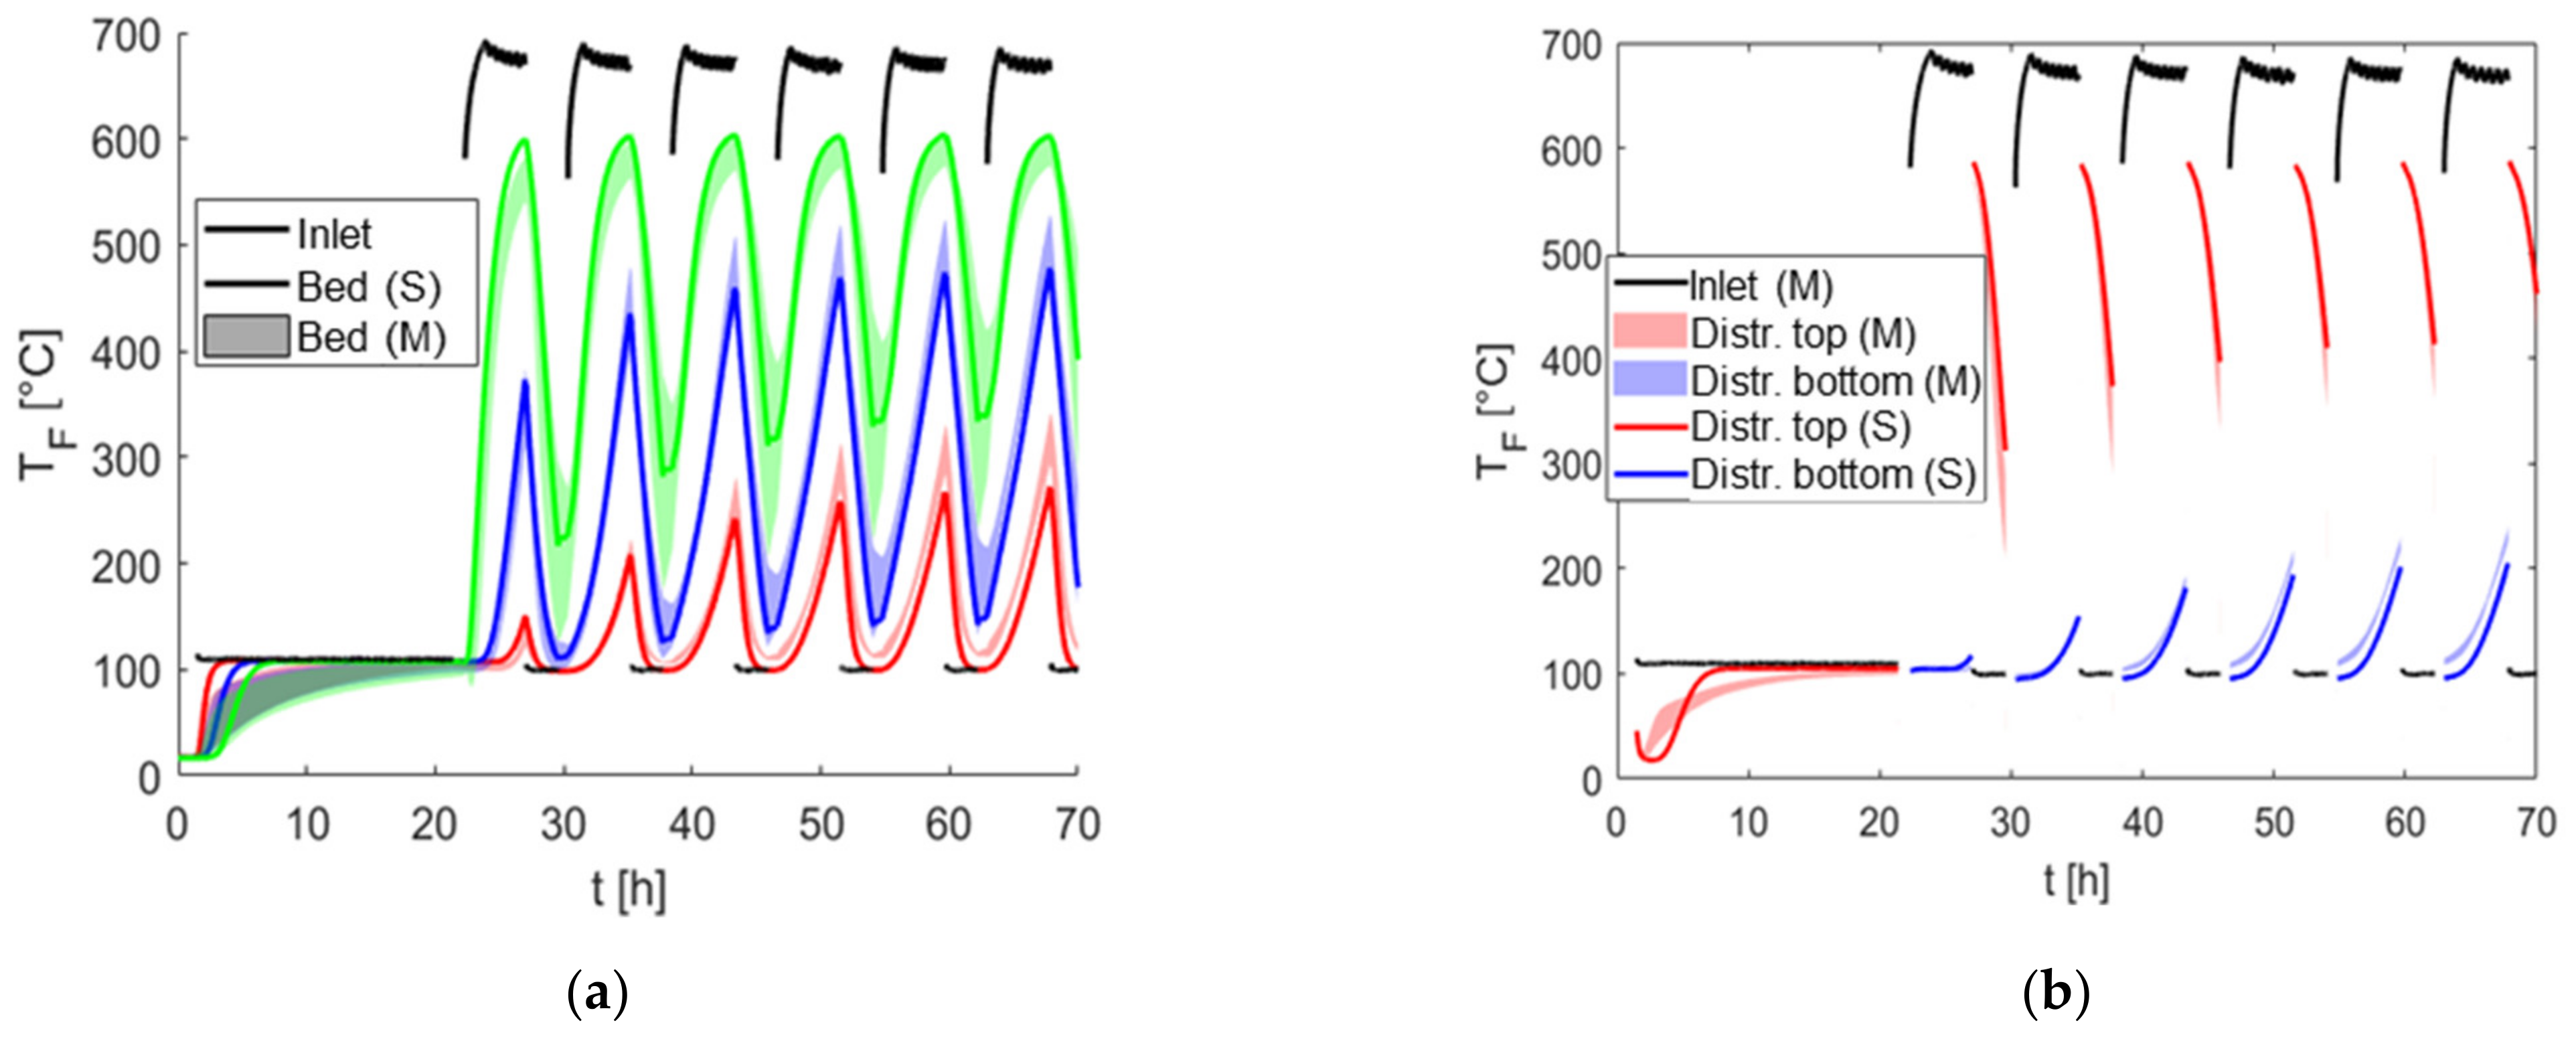
Figure 24.
Test T4—Fluid temperature (TF), measurement (M), simulation (S): (a) temperature at bed height 0.3 m (red), 0.9 m (blue), 1.5 m (green); (b) temperature in the hot-side (top)/cold-side (bottom) manifold.
Figure 24.
Test T4—Fluid temperature (TF), measurement (M), simulation (S): (a) temperature at bed height 0.3 m (red), 0.9 m (blue), 1.5 m (green); (b) temperature in the hot-side (top)/cold-side (bottom) manifold.
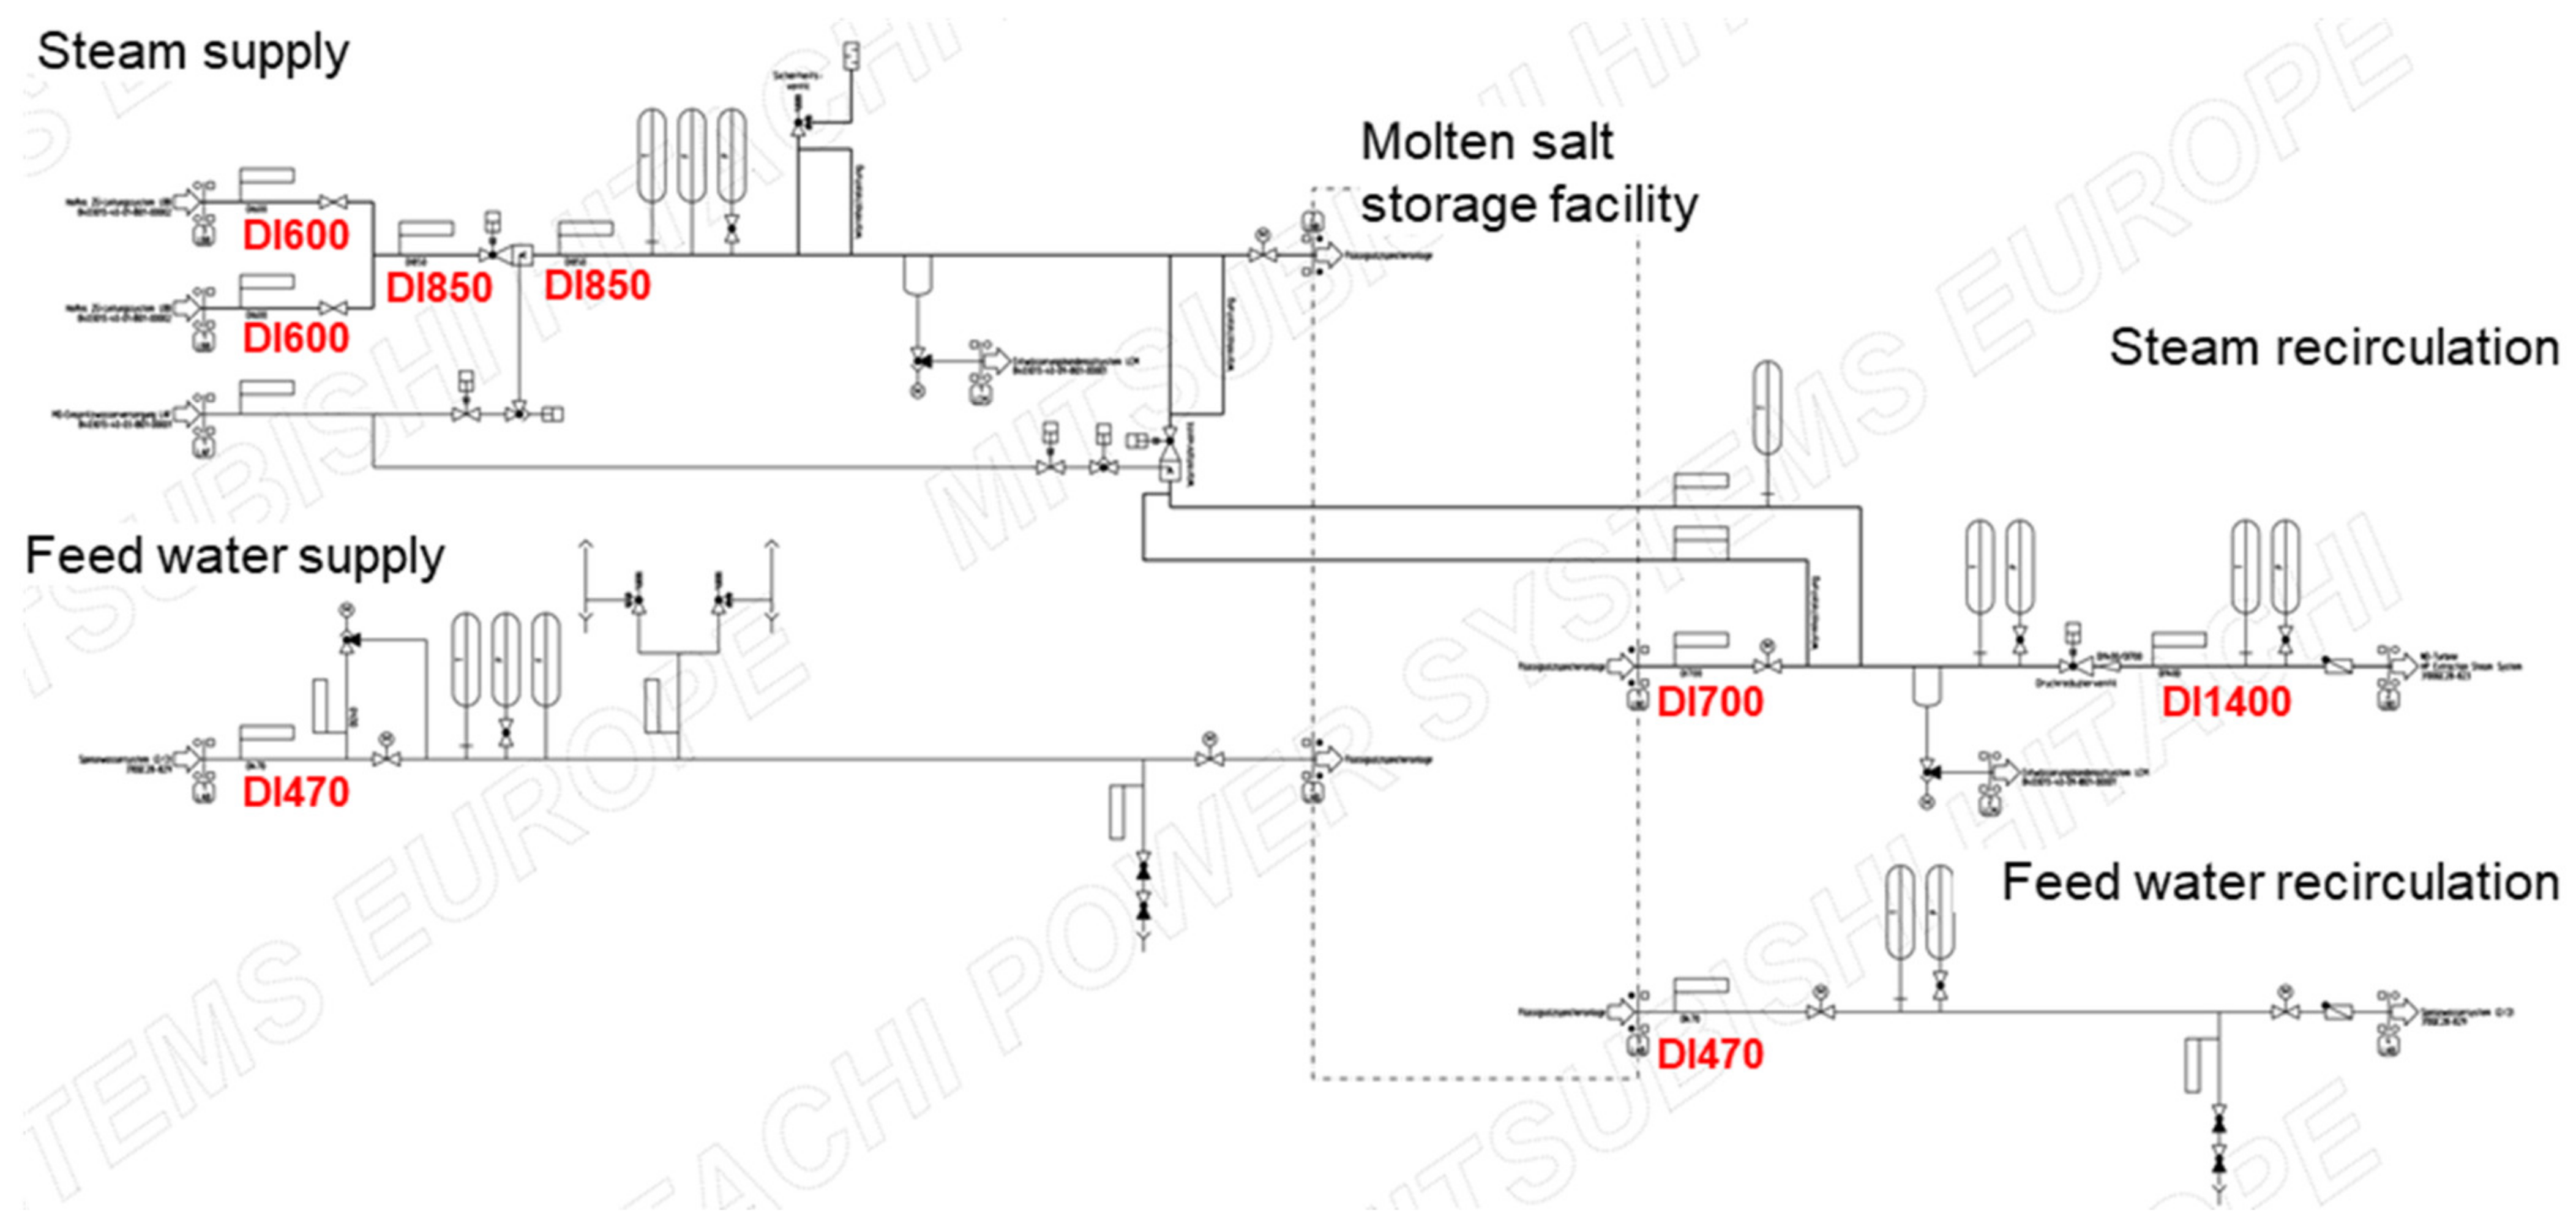
Figure 25.
Process flow diagram connecting piping systems (concept HRH-HPPH9_indirectly).
Figure 25.
Process flow diagram connecting piping systems (concept HRH-HPPH9_indirectly).
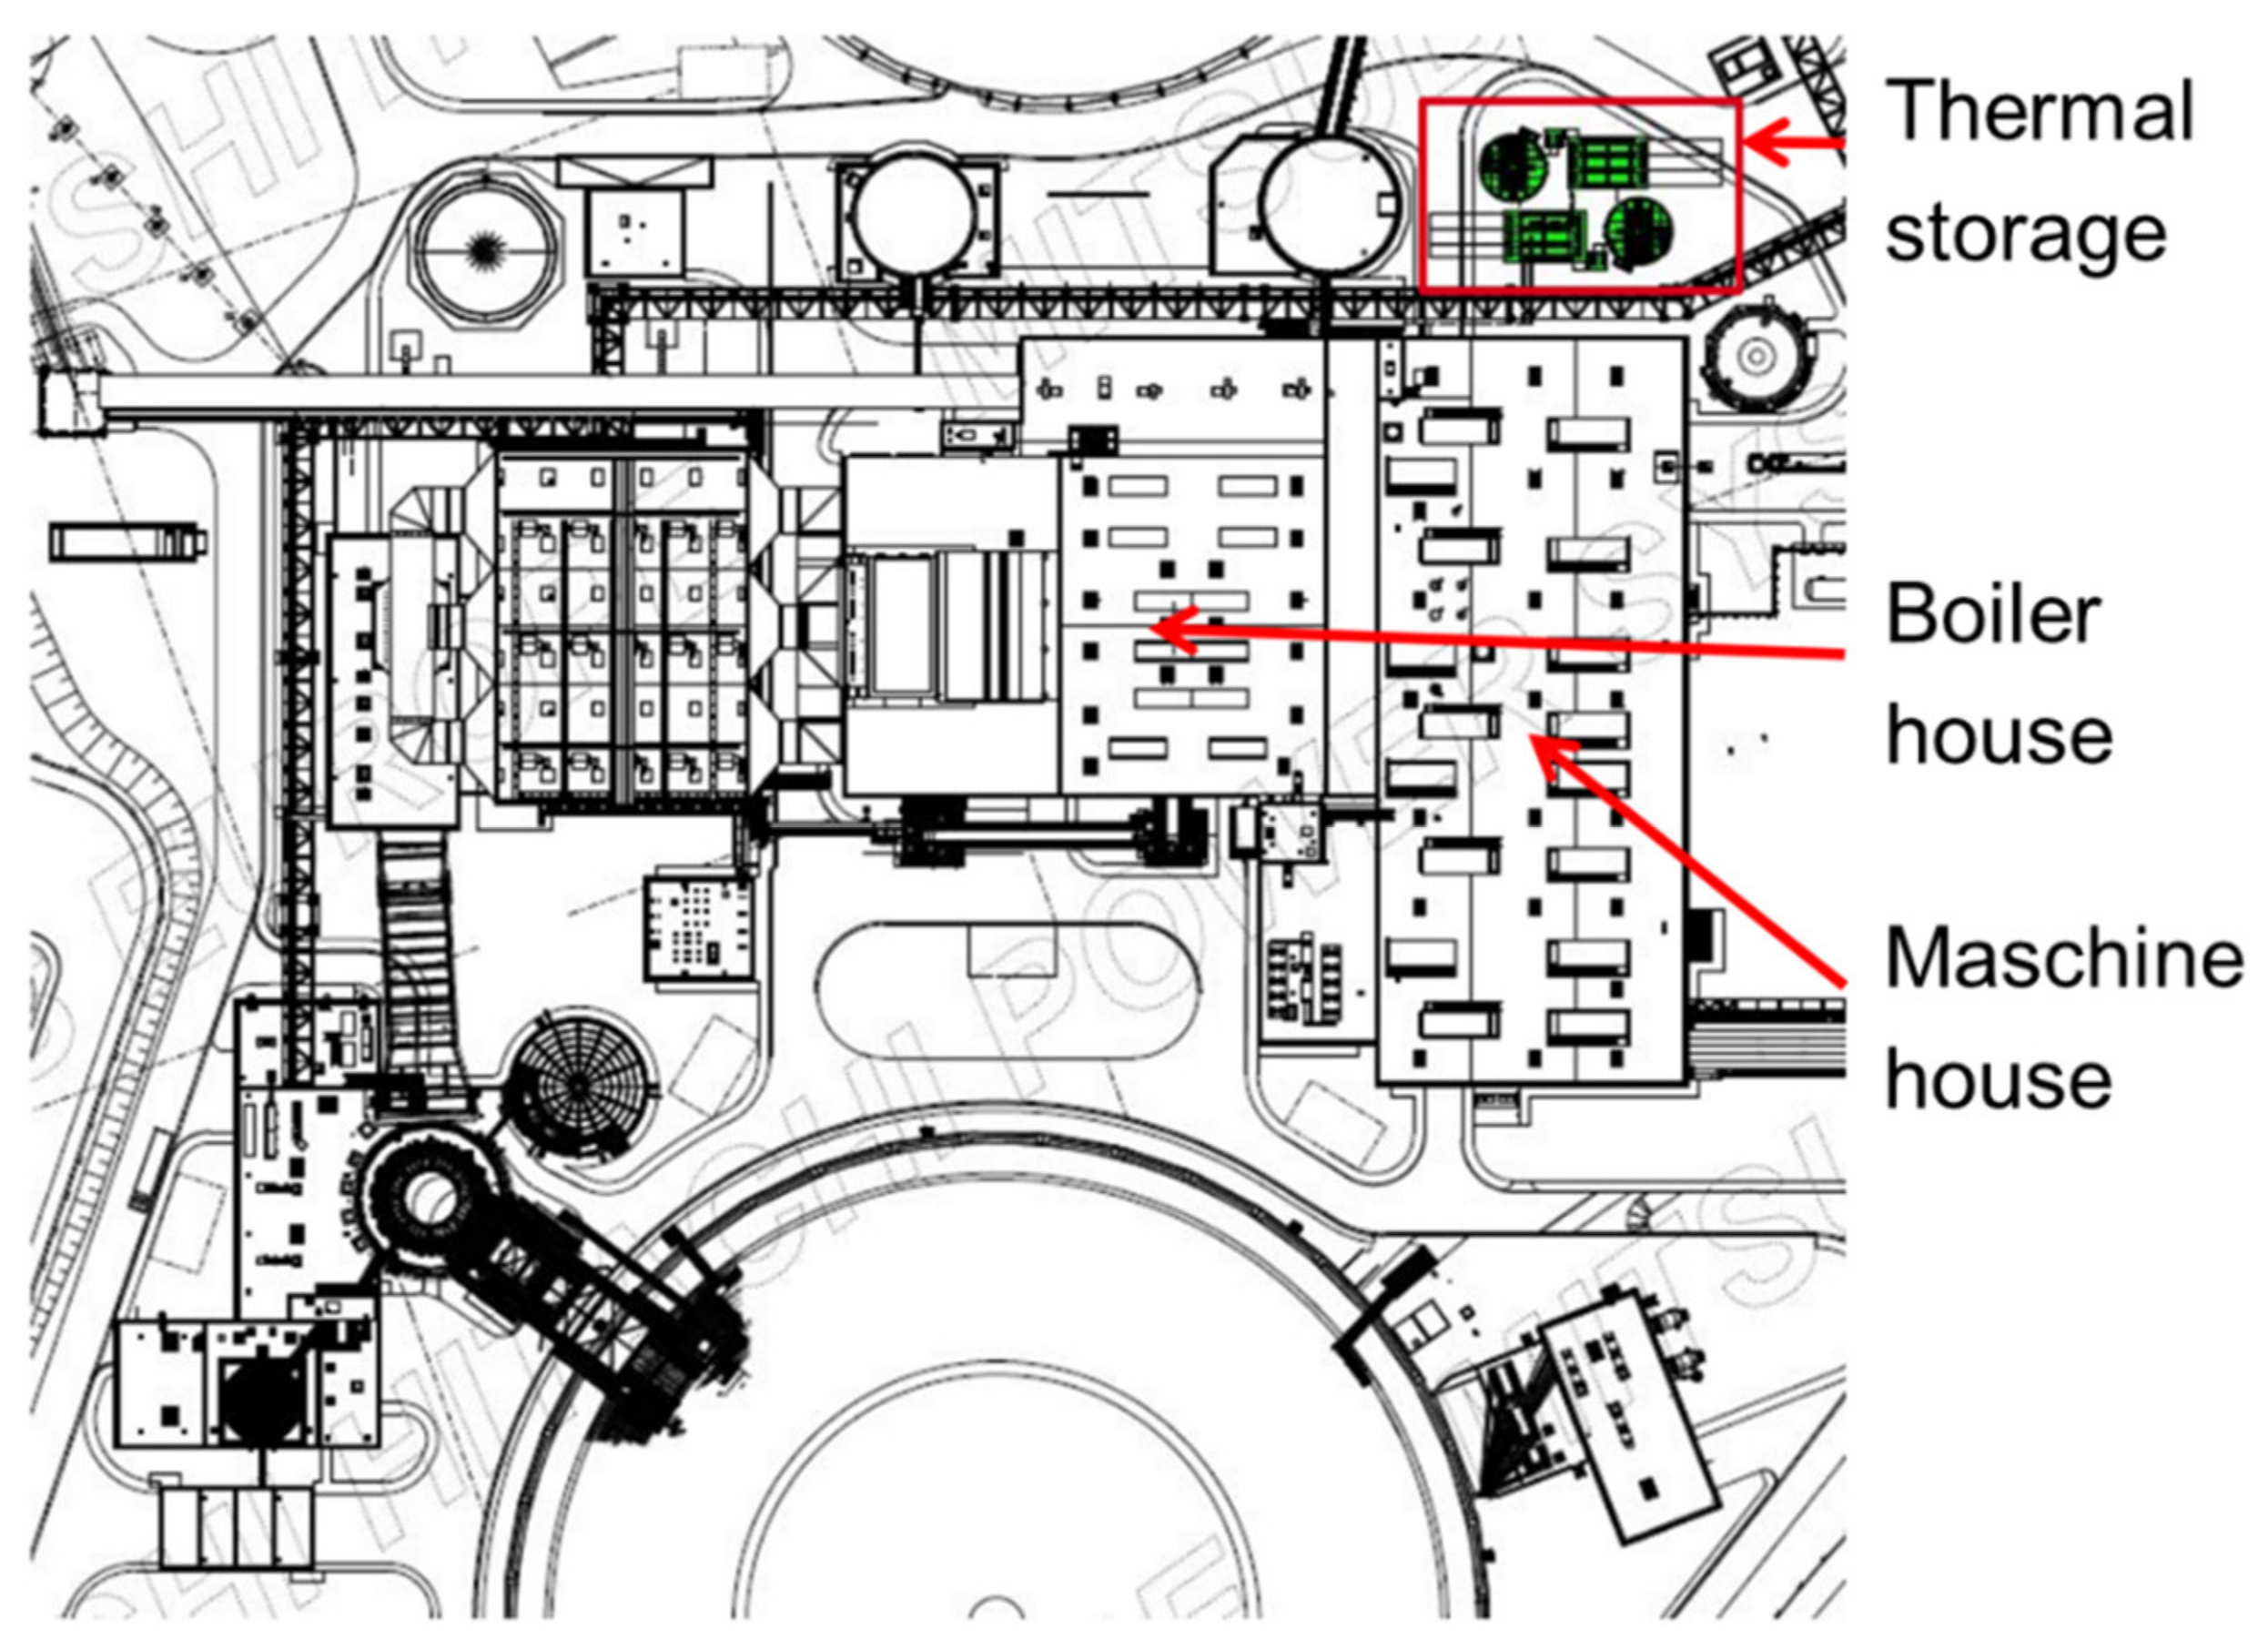
Figure 26.
Layout planning concept HRH-HPPH9_indirectly—Site plan.
Figure 26.
Layout planning concept HRH-HPPH9_indirectly—Site plan.
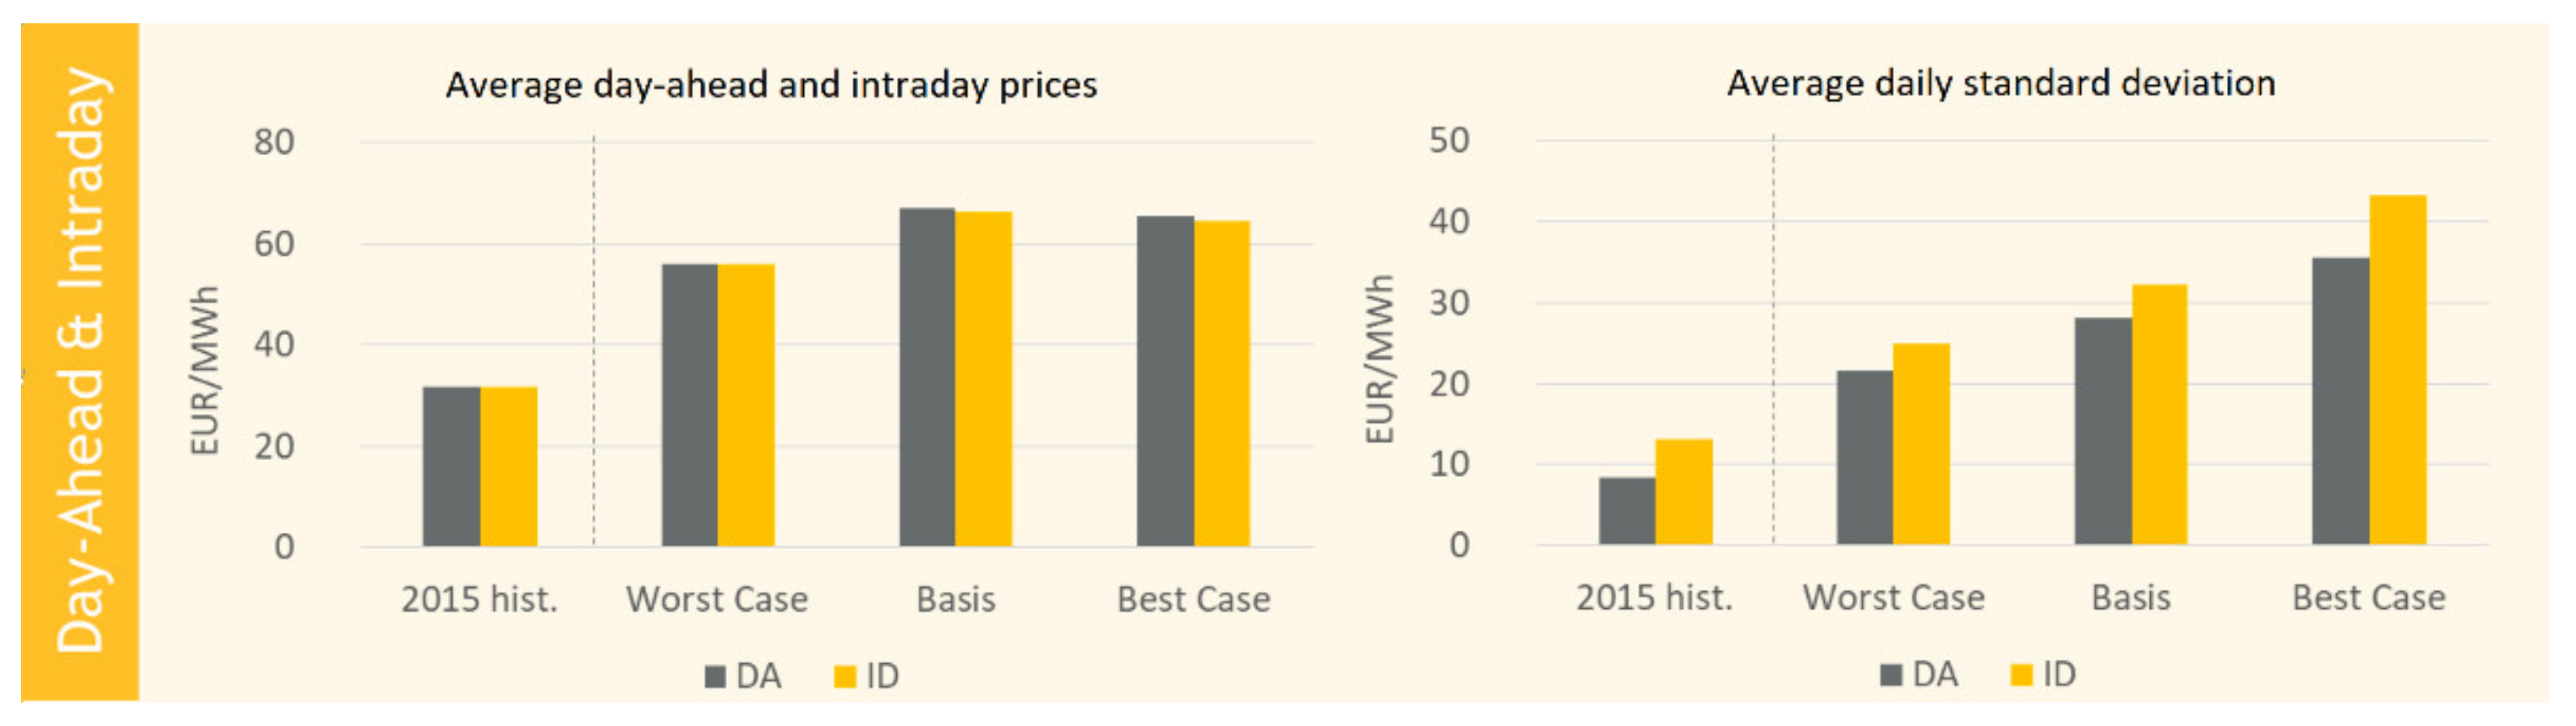
Figure 27.
Day-Ahead and Intraday prices in Germany in 2030.
Figure 27.
Day-Ahead and Intraday prices in Germany in 2030.
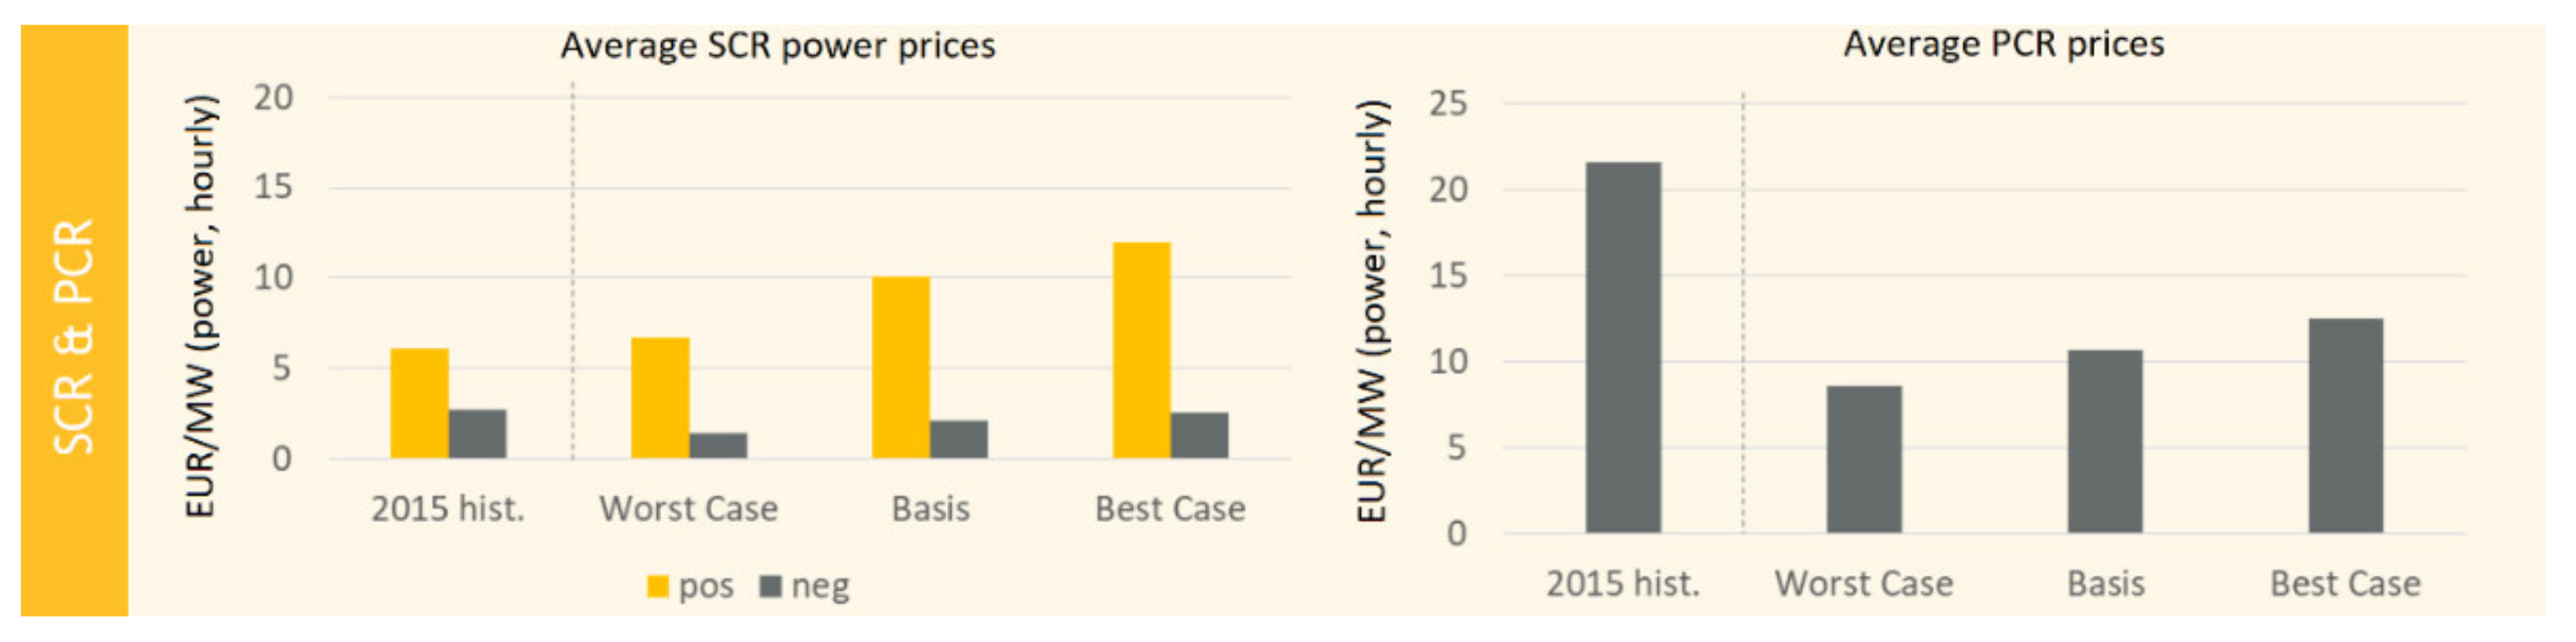
Figure 28.
SCR and PCR prices in Germany in 2030.
Figure 28.
SCR and PCR prices in Germany in 2030.
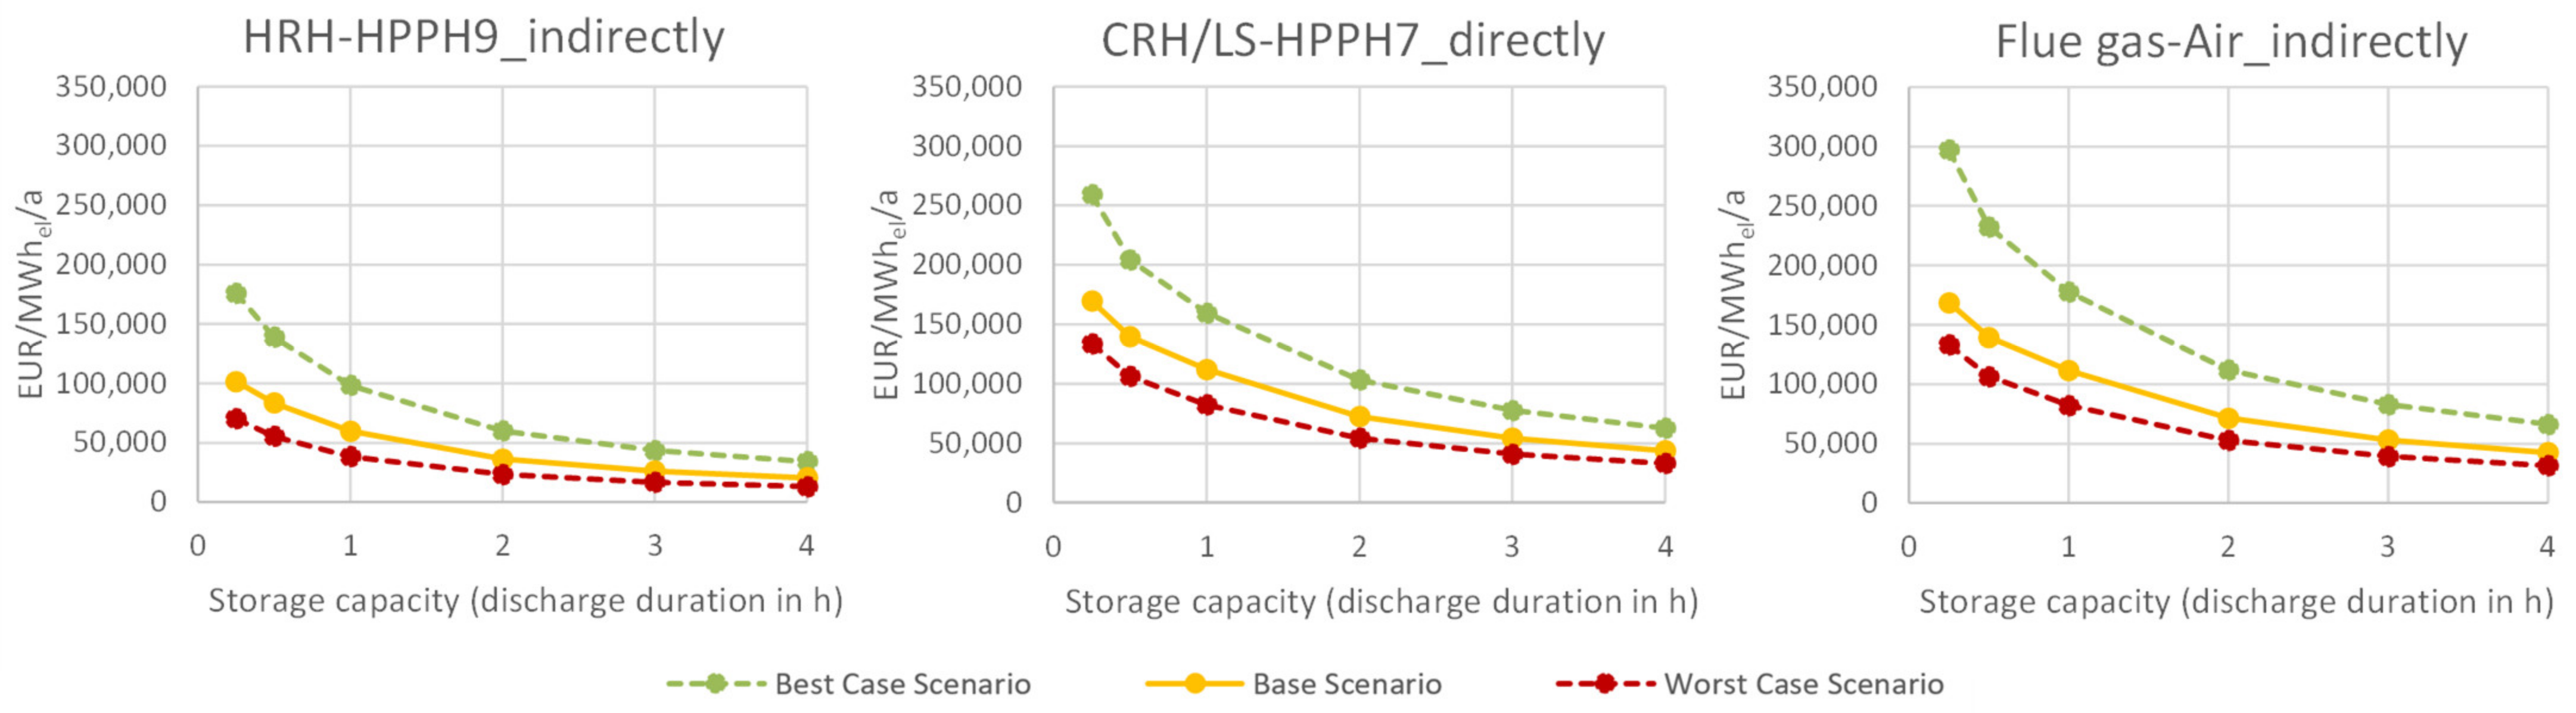
Figure 29.
Specific profits through TES per year for different storage sizes (worst-case scenario in red, baseline scenarios in yellow, best-case scenario in green).
Figure 29.
Specific profits through TES per year for different storage sizes (worst-case scenario in red, baseline scenarios in yellow, best-case scenario in green).
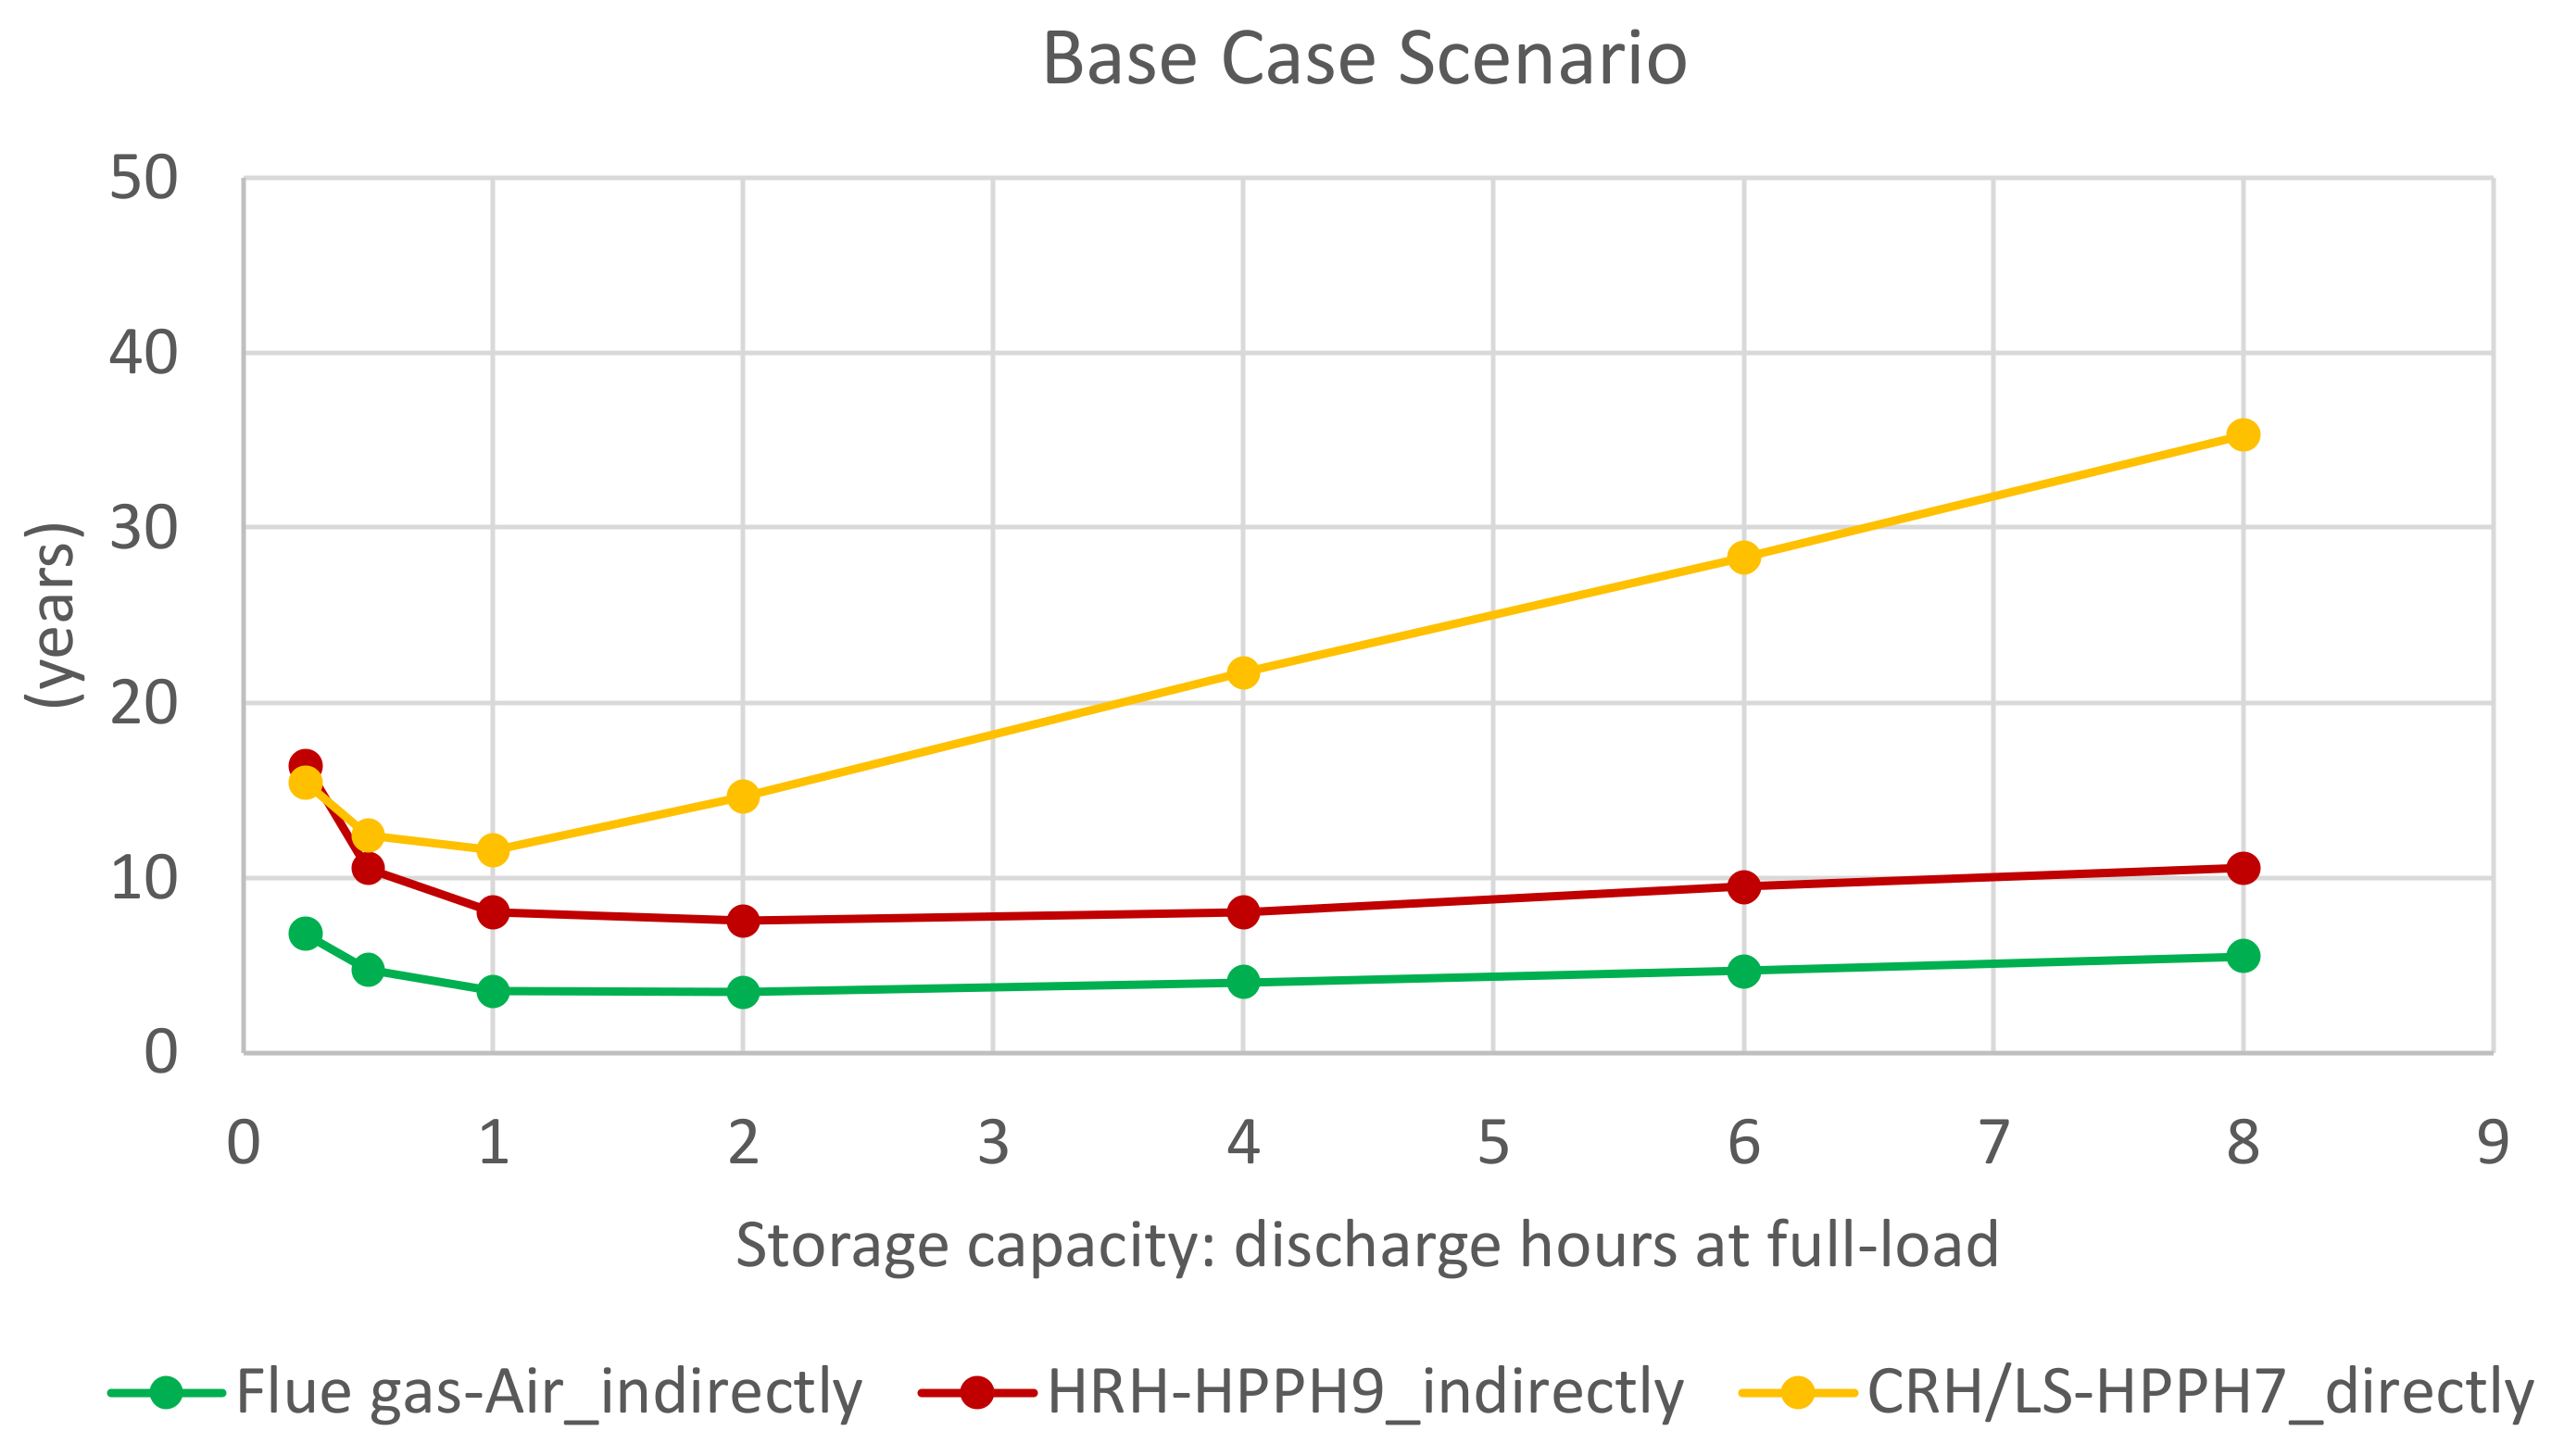
Figure 30.
Payback period in years (payback period, not discounted).
Figure 30.
Payback period in years (payback period, not discounted).
Table 1.
Test series.
| T | Charging | Discharging |
|---|
| Mass Flow | Temperature | Duration (max.) | Mass Flow | Temperature | Duration (max.) |
|---|
| 1 | 675 kg/h | 580 °C | 148 min | 720 kg/h | 100 °C | 148 min |
| 2 | 675 kg/h | 645 °C | 148 min | 720 kg/h | 100 °C | 148 min |
| 3 | 509 kg/h | 580 °C | 120 min | 509 kg/h | 87 °C | 120 min |
| 4 | 360 kg/h | 645 °C | 296 min | 720 kg/h | 100 °C | 148 min |
Table 2.
Resulting pipeline lengths for concept HRH-HPPH9_indirectly.
Table 2.
Resulting pipeline lengths for concept HRH-HPPH9_indirectly.
| Concept HRH-HPPH9_indirectly | Di [mm] | Medium | Length [m] | Material |
|---|
| Feed-water inlet | 470 | Feed-water | ~19.8 | 15NiCuMoNb5-6-4 |
| Feed-water outlet | 470 | Feed-water | ~38.7 | 15NiCuMoNb5-6-4 |
| Steam inlet | 600 | RH Steam | ~41.0 | X10CrWMoVNb9-2 |
| Steam inlet | 850 | RH Steam | ~66.5 | X10CrWMoVNb9-2 |
| Bypass | 500 | RH Steam | ~8.0 | X10CrWMoVNb9-2 |
| Steam outlet | 700 | RH Steam | ~59.1 | X10CrWMoVNb9-2 |
| Steam outlet | 1400 | RH Steam | ~15.0 | X10CrWMoVNb9-2 |
Table 3.
Integration costs.
Table 3.
Integration costs.
| Concept | Process Engineering
(BEC Mill. EUR) | Electrotechnical/Control Technology
(BEC Mill. EUR) | Addition Civil Engineering (BEC Mill. EUR) | TASC
(Mill. EUR) |
|---|
| HRH-HPPH9_indirectly | 4.45 | 1.08 | 0.7 | 9.5 |
| CRH/LS-HPPH7_directly | | | | 7.65 |
Table 4.
Input parameters for the reference power plant.
Table 4.
Input parameters for the reference power plant.
| Full load | 739 | MWel |
| Minimum load | 148 | MWel |
| Efficiency at full load | 46 | % |
| Efficiency at minimum load | 36.8 | % |
| Start-up time | 3 | h |
| Shutdown time | 2.5 | h |
| Start-up costs | 142,500 | EUR |
| Variable costs | Base and Best: 21.89 | EUR/MWhth |
| Worst: 22.20 |
| Positive load gradient | 1.35 | %/min (9.97 MW/min) |
| Negative load gradient | 1.35 | %/min (9.97 MW/min) |
Table 5.
Calculation of variable costs from the scenario fuel assumptions (shown for baseline 2030).
Table 5.
Calculation of variable costs from the scenario fuel assumptions (shown for baseline 2030).
| Thermal Coal Price | 80.50 | EUR/t |
| conversion to EUR/tce | 93.92 | EUR/tce |
+12 EUR/tce
domestic transport costs | 105.90 | EUR/tce |
| conversion to EUR/MWhth | 13.04 | EUR/MWhth |
| CO2-price | 26.30 | EUR/t CO2 |
| CO2 emissions | 0.337 | tCO2/MWhth |
| CO2 costs | 8.853 | EUR/MWhth |
| Total variable costs | 21.89 | EUR/MWhth |
Table 6.
Annual operating results of the power plant without TES.
Table 6.
Annual operating results of the power plant without TES.
| | Profits
(Mil. EUR/a) | Full-Load-Hours (h/a) | Number of Startups/a |
|---|
| 2030 Worst-Case Scenario | 66.1 | 5720 | 13 |
| 2030 Baseline Scenario | 131.4 | 6466 | 7 |
| 2030 Best-Case Scenario | 134.2 | 6041 | 9 |
Table 7.
Parameters of the lead concepts.
Table 7.
Parameters of the lead concepts.
| TES-Concepts | Plant Load Level | Max. Charging Power (MWel) | Max. Discharging Power (MWel) | TES-Efficiency |
|---|
| HRH-HPPH9_indirectly | 20% | 19.5 | 1.4 | 45.90% |
| 100% | 66.4 | 33.2 |
| CRH/LS-HPPH7_directly | 20% | 27.4 | 2.7 | 76.10% |
| 100% | 22.3 | 18.4 |
| Flue gas-Air_indirectly | 20% | 20.4 | 16 | 63.30% |
| 100% | 23.1 | 11.5 |
Table 8.
Absolute profits in relation to the storage size in million EUR/a (baseline).
Table 8.
Absolute profits in relation to the storage size in million EUR/a (baseline).
| Storage Capacity (h) | HRH-HPPH9_indirectly | CRH/LS-HPPH7_directly | Flue Gas-Air_indirectly |
|---|
| 0.25 | 0.84 | 0.78 | 0.49 |
| 0.5 | 1.39 | 1.29 | 0.80 |
| 1 | 1.98 | 2.06 | 1.28 |
| 2 | 2.40 | 2.67 | 1.64 |
| 3 | 2.60 | 3.00 | 1.83 |
| 4 | 2.72 | 3.22 | 1.96 |
| 6 | 2.85 | 3.49 | 2.1 |
| 8 | 2.91 | 3.64 | 2.18 |
Table 9.
Investment costs in relation to storage size (discharge hours at full load) in EUR million.
Table 9.
Investment costs in relation to storage size (discharge hours at full load) in EUR million.
| Storage Capacity (h) | HRH-HPPH9_indirectly | CRH/LS-HPPH7_directly | Flue Gas-Air_indirectly |
|---|
| 0.25 | 4.3 | 4.4 | 3.3 |
| 0.5 | 5.1 | 8.3 | 3.8 |
| 1 | 6.4 | 16.2 | 4.5 |
| 2 | 8.6 | 31.4 | 5.7 |
| 4 | 12.4 | 62.2 | 7.9 |
| 6 | 17.5 | 91.1 | 9.8 |
| 8 | 21.2 | 120.7 | 12 |
Table 10.
Total costs in relation to storage size (discharge hours at full load) in EUR million.
Table 10.
Total costs in relation to storage size (discharge hours at full load) in EUR million.
| Storage Capacity (h) | HRH-HPPH9_indirectly | CRH/LS-HPPH7_directly |
|---|
| 0.25 | 13.8 | 12.05 |
| 0.5 | 14.6 | 15.95 |
| 1 | 15.9 | 23.85 |
| 2 | 18.1 | 39.05 |
| 4 | 21.9 | 69.85 |
| 6 | 27.0 | 98.75 |
| 8 | 30.7 | 128.35 |
Table 11.
TES Total costs for the selected optimal storage sizes.
Table 11.
TES Total costs for the selected optimal storage sizes.
| | Discharge Power | Discharge Duration | Investment Costs | Integration Costs | Total |
|---|
| | (MWel) | (h) | (Mil. €) | (Mil. €) | (Mil. €) |
|---|
| HRH-HPPH9_indirectly | 33.2 | 2 | 8.6 | 9.5 | 18.1 |
| CRH/LS-HPPH7_directly | 18.4 | 1 | 16.2 | 7.65 | 23.85 |
| Flue gas-Air_indirectly * | 11.5 | 2 | 5.7 | | |
Table 12.
Payback period in years for investment costs (without integration costs).
Table 12.
Payback period in years for investment costs (without integration costs).
| | Payback Period | Discounted Payback Period (4%) | Discounted Payback Period (8%) |
|---|
| | Worst Case | Base | Best Case | Worst Case | Base | Best Case | Worst Case | Base | Best Case |
|---|
| HRH-HPPH9_indirectly | 5.6 | 3.6 | 2.2 | 6.4 | 3.9 | 2.3 | 7.7 | 4.4 | 2.5 |
| CRH/LS-HPPH7_directly | 10.7 | 7.9 | 5.5 | 14.2 | 9.6 | 6.4 | 25.1 | 12.9 | 7.6 |
| Flue gas-Air_indirectly | 4.7 | 3.5 | 2.2 | 5.3 | 3.8 | 2.4 | 6.1 | 4.2 | 2.5 |
Table 13.
Payback period in years for total costs.
Table 13.
Payback period in years for total costs.
| | Payback Period | Discounted Payback Period (4%) | Discounted Payback Period (8%) |
|---|
| | Worst Case | Base | Best Case | Worst Case | Base | Best Case | Worst Case | Base | Best Case |
|---|
| HRH-HPPH9_indirectly | 11.7 | 7.5 | 4.6 | 16.2 | 9.1 | 5.1 | 36.5 | 12.0 | 5.9 |
| CRH/LS-HPPH7_directly | 15.7 | 11.6 | 8.1 | 25.3 | 15.8 | 10.0 | >80 | 33.7 | 13.6 |
| Flue gas-Air_indirectly * | | | | | | | | | |


 ,
, 


