Article

Technical Development and Economic Evaluation of the Integration of Thermal Energy Storage in Steam Power Plants

1
Institute of Engineering Thermodynamics, German Aerospace Centre (DLR), 70569 Stuttgart, Germany
2
Chair of Environmental Process Engineering and Plant Design (LUAT), University of Duisburg-Essen, 45141 Essen, Germany
3
Institute of Energy Economics at the University of Cologne (EWI), 50827 Cologne, Germany
4
STEAG Energy Services GmbH, 45128 Essen, Germany
5
VGB PowerTech e.V. (VGB), 45257 Essen, Germany
6
Institute of Engineering Thermodynamics, German Aerospace Centre (DLR), 51147 Cologne, Germany
*
Author to whom correspondence should be addressed.
Energies 2022, 15(9), 3388; https://doi.org/10.3390/en15093388
Submission received: 6 April 2022 / Revised: 28 April 2022 / Accepted: 29 April 2022 / Published: 6 May 2022

Abstract

:
Grid-compliant integration of renewable energies will in future require considerable increases in flexibility in the operation of conventional power plants. The integration of thermal energy storage systems (TES) into the power plant process can create considerable improvements, for example, in the speed of load change and partial load behavior. In the case of existing plants, there are thus good prospects of upgrading for more flexible operation, which promises improvements in the energy system that can be achieved in the relatively short term. The aim of this publication is, therefore, to identify integration options for TES in coal-fired power plants which would enable the desired high flexibility potentials and, at the same time, include cost-efficient solutions. By means of an iterative approach between future scenarios of the energy market, the power plant process, and the TES component, favored configurations were developed from a wide range of integration concepts. For this purpose, thermodynamic simulation studies were performed, operating concepts were developed, economic assessments were made, design calculations were performed, and experimental investigations on different TES options were realized. The results obtained can serve as a basis for the demonstration of a promising TES technology in an existing hard coal-fired power plant.

1. Introduction

A key measure for making coal-fired power plants more flexible, which has not been a component of conventional coal-fired power plants to date, is the effective integration of heat storage systems into the power plant process. In contrast to current research projects on the flexibilization of coal-fired power plants, such as DYNSTART [1], the FLEXI-TES project focuses on this measure, as it has proven to be particularly efficient and effective in the power plant sector. The FleGs [2] and TESIN [3] projects in the area of natural gas-fired power plants with heat extraction should be mentioned here, for example.
Heat storage technologies realized in coal-fired power plants in the past exclusively concern isolated solutions, such as the steam storage in the Charlottenburg power plant in the Berlin district of Charlottenburg-Wilmersdorf [4,5], or special supply conditions, such as the high-pressure storage in the Simmering power plant in the 11th district of Simmering in Vienna [5,6]. Even at this time, the integration of storage was aimed at increasing the flexibility of coal-fired power plants.
The literature contained examples of direct and indirect heat extraction in the feedwater area as well as high-pressure and low-pressure storage in the steam area of power plants. An example by Jentsch et al. [7] proposed displacement storage, which is arranged parallel to the high-pressure preheating section. As another example, Li and Wang [8] reported simulative studies on the flexibilization of supercritical coal-fired power plants by integrating a cascaded latent heat storage system with different charging and discharging strategies as part of the UK Engineering and Physical Sciences Research Council (EPSRC) funded project “Flexible and Efficient Power Plant: Flex-E-Plant”, in which three charging strategies and two discharging strategies were investigated. Simulation results show that it is possible to extract thermal energy from the water–steam cycle for storage during off-peak periods and return the stored thermal energy to steam during a peak demand period to boost power generation. According to the authors, the general feasibility of the proposed strategies emerges from the steady-state simulations. However, the limitations of the strategies are also illustrated. For example, in the charging process, the amount of steam extraction must be limited to a feasible range to maintain stable power output. The reduction in power output is a maximum of 13.3% for 1 of the 3 charging strategies and only half or one-third of that for the other 2. The discharge strategies yield a power increase of 7.4% and 5.7%, respectively. The storage efficiency is reported to be around 43%. With storage integration, the supercritical coal plant shows faster dynamic responses to changes in load demand and better performance in grid frequency services. However, a techno-economic evaluation was not performed in the paper. As a third example, Cao et al. [9] report on high-temperature heat storage by an additional Rankine cycle fed by the boiler of the coal-fired power plant. A power increase of 6.2% during the discharge process is achieved. The storage efficiency is reported to be about 44%. A techno-economic evaluation was not made in the publication. A fourth but more distant example, would be Sun et al. [10], who compare the flexibility potentials of drying low-grade coal with those by integrating hot water storage in the water-steam cycle.
However, there were also studies that proposed innovative power plant concepts with storage. The conceptual solutions mentioned there concern heat storage as a separation of firing and steam generation [11] and an IGCC power plant with indirect steam generation via a heat storage system [11]. Apart from district heating storage projects in Mannheim [12], Berlin [13], Vienna [14], and Hamburg [15], however, there were no publicly funded projects investigating the integration of heat storage in coal-fired power plants at the start of the project.
The joint project “Partner Steam Power Plant” [16], which was completed in 2015 and funded by the BMWi, represented the current state of the art regarding flexibility measures for coal-fired power plants at the start of the project. The work carried out there supported the grid-compatible integration of electricity from fluctuating energy sources. The partners reporting here were involved in the project, which was funded by the Federal Ministry of Economics within the COORETEC research program. After completion of the project, the results achieved were to be implemented in existing and new hard coal and lignite-fired power plants in order to stabilize the security of the supply of electricity generation. Therefore, a number of technical challenges had to be solved, such as improving the start-up and shut-down behavior, reducing the minimum load, and providing control energy by increasing the speed of load changes. As one measure to fulfill these goals, the integration of heat storage systems was considered. A total of 19 concepts were considered, their key operational data recorded, and their technical feasibility systematically evaluated in the project consortium. The seven most promising options envisage thermal energy storage in the high-temperature steam range as well as in the high-temperature flue gas path. After additional investigations on different storage options and thermodynamic restrictions, a lead concept and two alternative concepts were identified. The concepts for the high-temperature flue gas path could not be processed in the project due to the limited resources and were not pursued further at that time. The evaluation of the concepts considered further was carried out on three parallel levels: system, storage integration, and storage technology. At the system level, the influence of the storage integration concept on the operating behavior of the reference coal-fired power plant in Voerde, Germany, was estimated with the help of process simulation software. For the comparative evaluation of the developed storage integration concepts on the other two levels, a method based on Quality Function Deployment (QFD) was chosen. As a result, a preferred variant was defined, namely a concept with heat storage that is charged with heat from the main steam train and whose heat is used to generate reheated steam. Furthermore, two alternative concepts were identified. Namely, alternative concept 1 with charging by cold reheat steam with charging outlet into the feedwater tank and discharge into low pressure preheating, and alternative concept 2 with charging by hot reheat steam with charging outlet into the condenser and discharge to high pressure (HP) preheating.
For the selected integration concepts, different storage technologies were selected according to thermodynamic and technical aspects, and the resulting technical expenditure was estimated. For this purpose, the required storage masses for different inventories were calculated using simplifying assumptions, and initial cost estimates were determined on this basis. The focus was on the feasibility of integration. The results showed that efficient and cost-effective setups are possible with commercial heat storage technologies. Molten salt and solid media heat storage systems proved to be promising options for extracting high-temperature heat from the water–steam cycle and efficiently recoupling it. The integration of energy storage systems showed great potential for improving operational flexibility by reducing the minimum load and improving plant dynamics.
Open questions regarding the design as well as potentials for techno-economic optimization lay in the further development of the storage system consisting of heat storage and heat exchanger, in the use of alternative storage materials for solid media storage, in the combination of different storage technologies, as well as in the further elaboration of integration issues, such as the consideration of the multiple use of the storage system for different system tasks.
In the “FLEXI-TES” project, the preferred variant identified in the “Partner Steam Power Plant” project and the two alternative concepts, as well as the concepts in the high-temperature flue gas system that have not been worked on, should be worked out in detail on the basis of concrete target values and specifications and evaluated in comparison with each other, and the questions that remain open should be clarified.
For the targeted development of integration concepts, the project was divided into two phases. In the first phase, the concepts were first identified, elaborated with a simplified level of detail, comparatively evaluated, and finally, lead concepts were defined. This first phase is described in detail in [17]. An overview of the storage technologies used, their simplified modeling, the stationary power plant simulations, and the evaluation process are also provided in detail. However, the defined lead concepts to be developed in the second phase are only briefly explained in the contribution mentioned. This will be explained in more detail in this paper, which deals with the results of the now completed second project phase, where the focus was on the detailed investigation and further development of the lead concepts selected in the first project phase on the levels of system, storage components, reference power plant, and economic efficiency.
After the lead concepts are described in detail, the results of dynamic system simulation studies for storage integration are presented. This is followed by a description of the results of the investigations of the storage components, focusing on the results of detailed variation calculations and experimental investigations. After that, the results of the study on the transferability of the technical results to a reference power plant are presented. Finally, the results of the economic feasibility studies are reported, with a focus on the results of the economic evaluation and techno-economic target determination.
The contributions made here are widely applicable. They can be used to assess the technical and economic advantages that one of the three integration measures of a thermal storage system into a coal-fired power plant may have and what implications it may have at a specific site.
The results of the studies presented here are particularly relevant if many countries want to phase out coal-fired power generation, as was decided at the UN Climate Change Conference in Glasgow 2021 (COP 26) since this was based on coal-fired power plants of the latest design in the 800 MW class, which will continue to be operated for the longest time, and can make a significant contribution to the energy transition through the operating flexibility gained by retrofitting thermal storage systems.

2. Lead Concepts Investigated

2.1. HRH-HPPH9_indirectly (Molten Salt Storage)

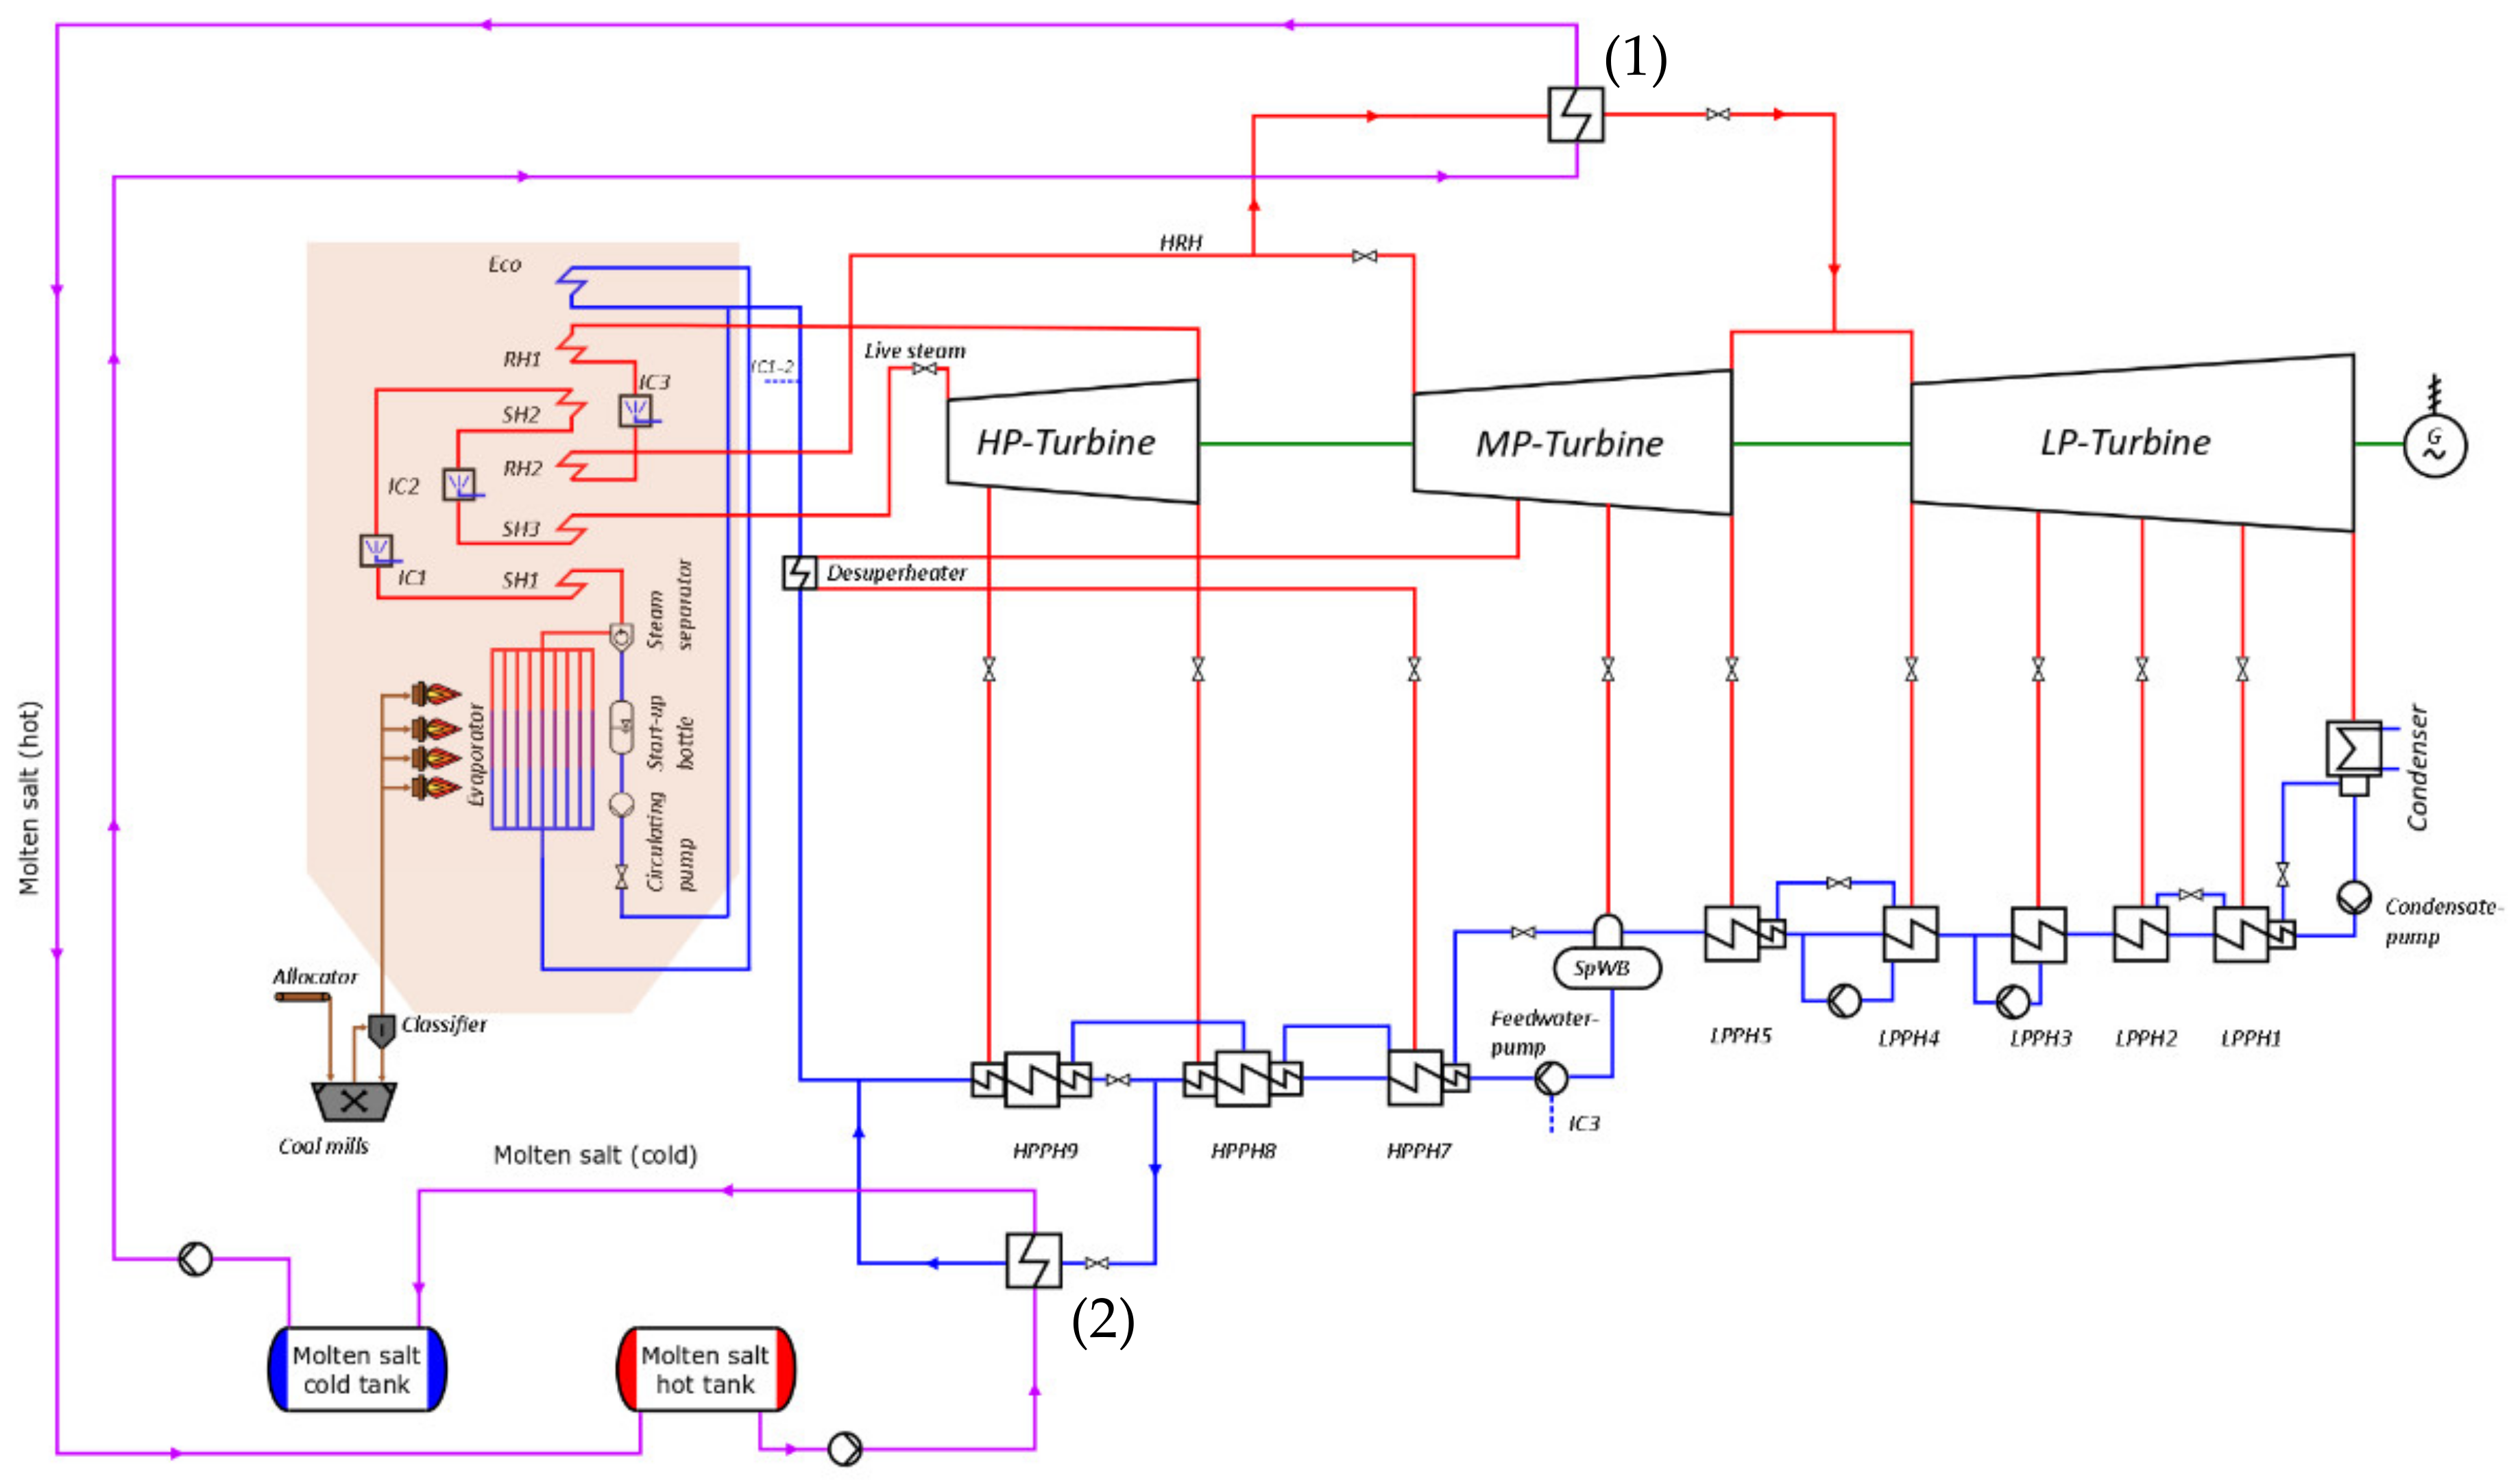
The HRH-HPPH9_indirectly concept includes a heat storage system based on two molten salt tanks (hot tank and cold tank), each with a pump and integrated via two heat exchangers in the water-steam section of the power plant, see Figure 1. Accordingly, it is an indirect storage system.
The charging is performed by taking steam from the hot reheat (HRH) line (1). The heat is transferred to the salt, which is pumped from the cold tank via the heat exchanger into the hot tank. After heat transfer, the cooled steam is fed into the overflow line between the medium-pressure turbine (MPT) and the low-pressure turbine (LPT). The reduction of the HRH steam mass flow leads to a lower flow through the MPT, accompanied by a decrease in the net power. During discharging, the heat temporarily stored in the hot salt tank is used to realize high pressure preheating (HPPH) via an additional heat exchanger (2). By bypassing the last HP preheater (HPPH9), no or a lower tapped steam mass flow is required at the first tap on the high-pressure turbine (HPT). An additional steam mass flow, therefore, flows in the downstream turbine stages of the HPT, MPT, and LPT, generating additional electrical power. On the salt side, this time, the hot salt is pumped via the heat exchanger into the cold tank.
When designing the molten salt storage, sensitivity studies were carried out on different hot and cold tank temperatures under given boundary conditions and optimized with regard to minimum investment costs.

2.2. CRH/LS-HPPH7_directly Concept (Ruths Storage)

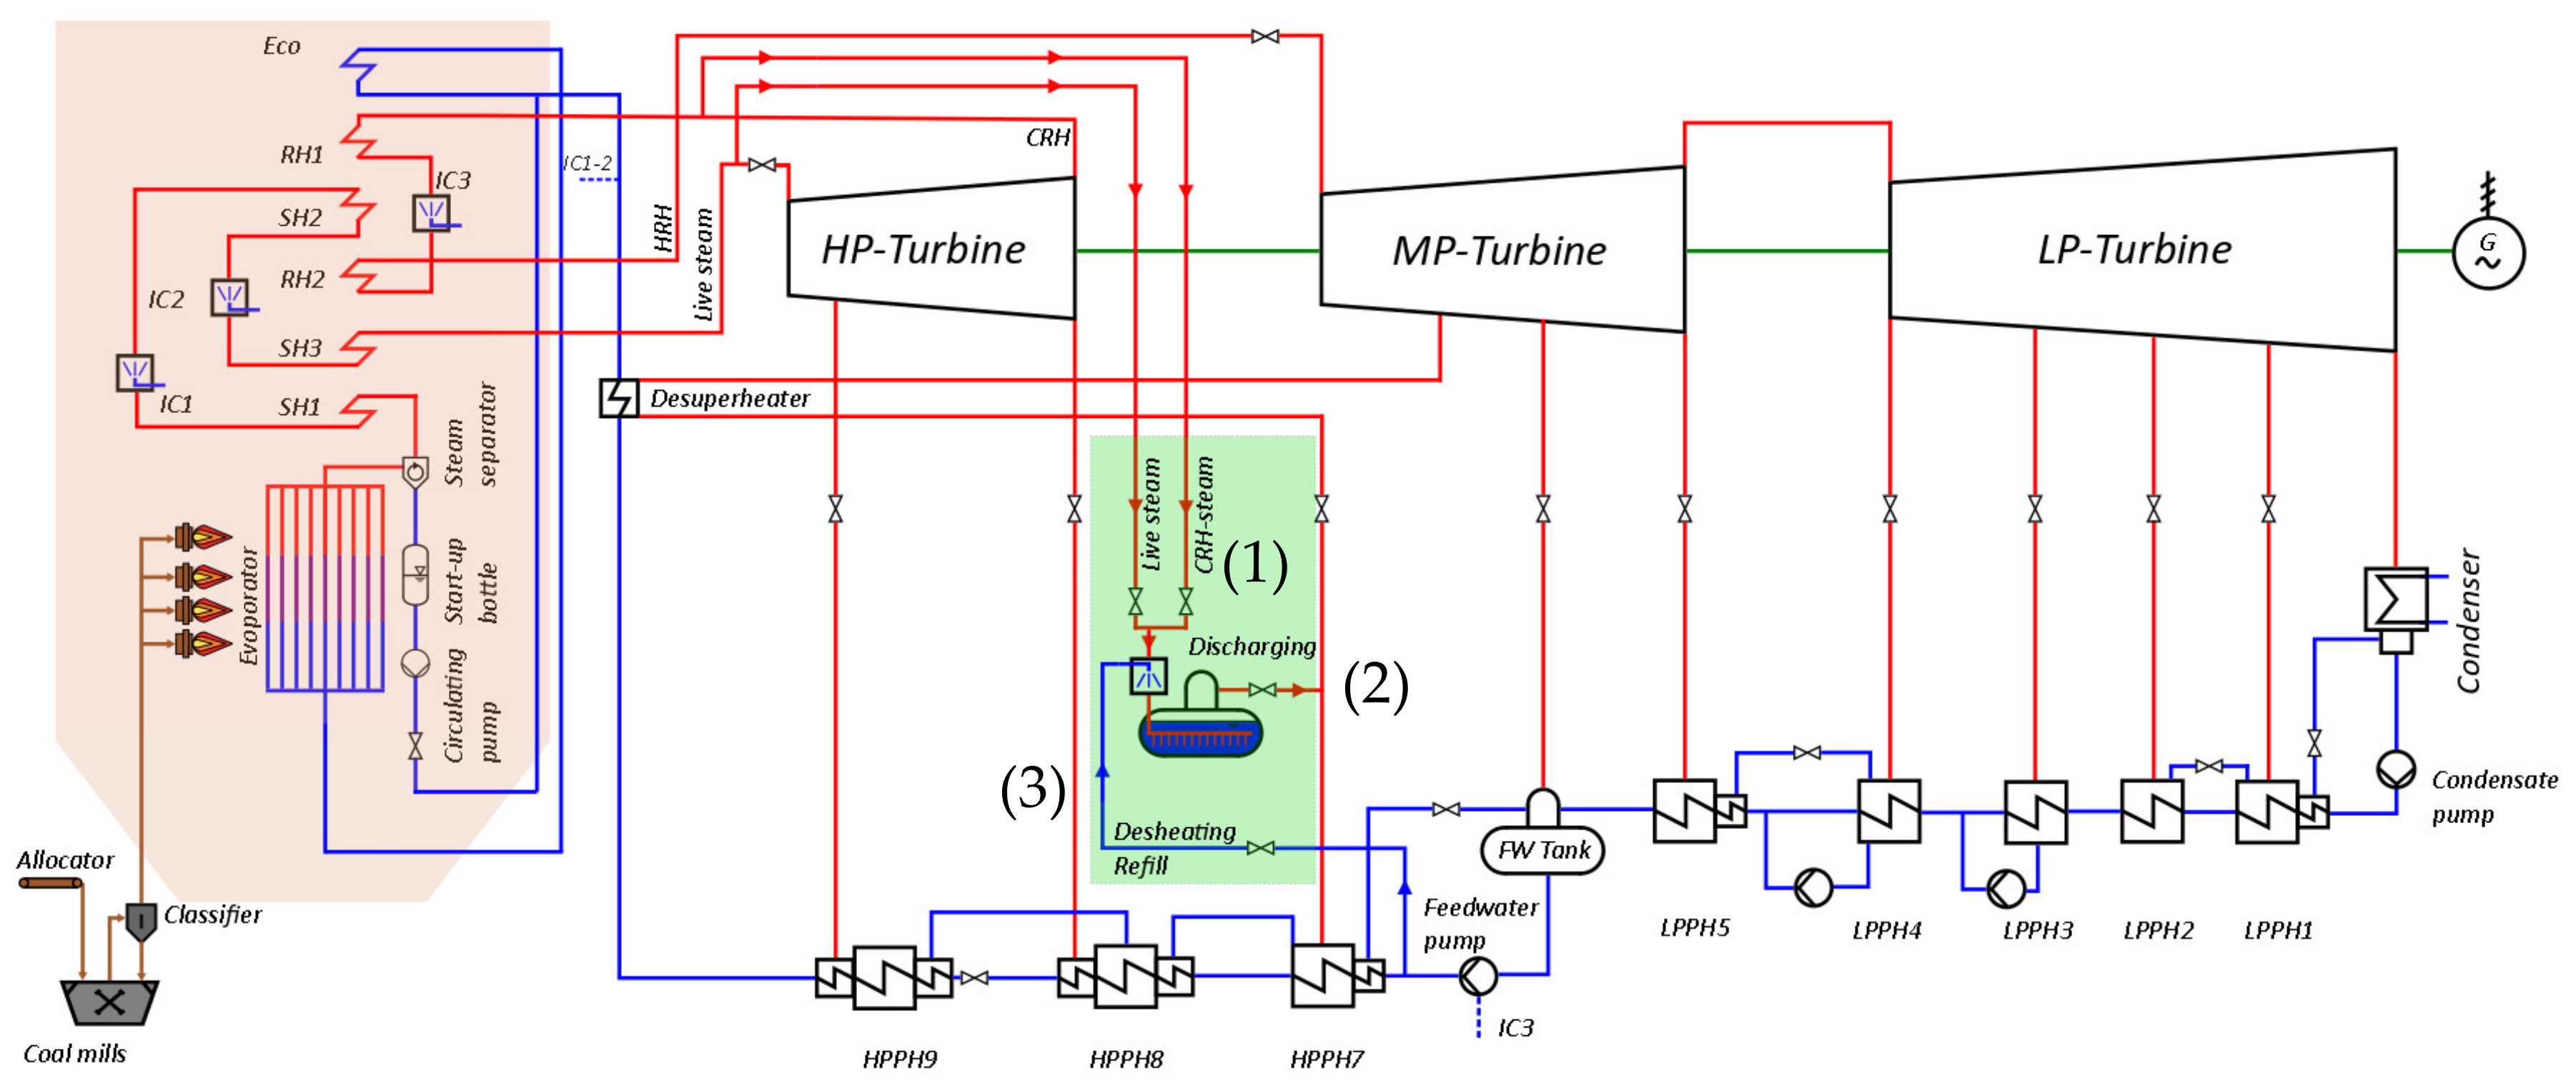
The CRH/LS-HPPH7_directly concept includes a Ruths storage tank, which is directly integrated into the water-steam section of the power plant, see Figure 2.
In this concept, charging takes place in the upper load range of the power plant by taking steam from the cold reheat (CRH) line (1). The extracted steam is fed to a Ruths storage tank, in which the pressure, the (saturated steam) temperature, and the filling level increase during charging. The reduction of the CRH steam mass flow leads to a lower flow through MPT and LPT, accompanied by a decrease in net power. Due to the pressure dropping with the partial load, an additional charging with live steam is planned in the lower load range (fixed pressure operation of the steam generator in load points <40%). Without this additional integration point, an operating strategy “charging at minimum load followed by discharging at full load” is not possible. During discharging, saturated steam is stored out of the Ruths storage (2). This replaces the original tap on the MPT for the first HP preheater (HPPH7). As a result, there is an additional steam mass flow in the rear part of the MPT and in the NPT, accompanied by an increase in net power.
The storage system is based on a Ruths storage. Since the working medium of the power plant process is stored in or out, it is a direct storage system. Due to the charging with superheated steam, a further integration point is necessary for desuperheating and level control (3). By spraying the entering steam to saturated steam conditions, it is achieved that the initial filling level is reached again after one storage cycle. The charging and discharging lines must each be equipped with a control valve.
The pressure vessel was designed for the pressure range between the CRH (approx. 60 bar) and the tapping to the HPPH7 (approx. 25 bar).

2.3. Flue Gas-Air_indirectly (Solid Media Heat Storage)

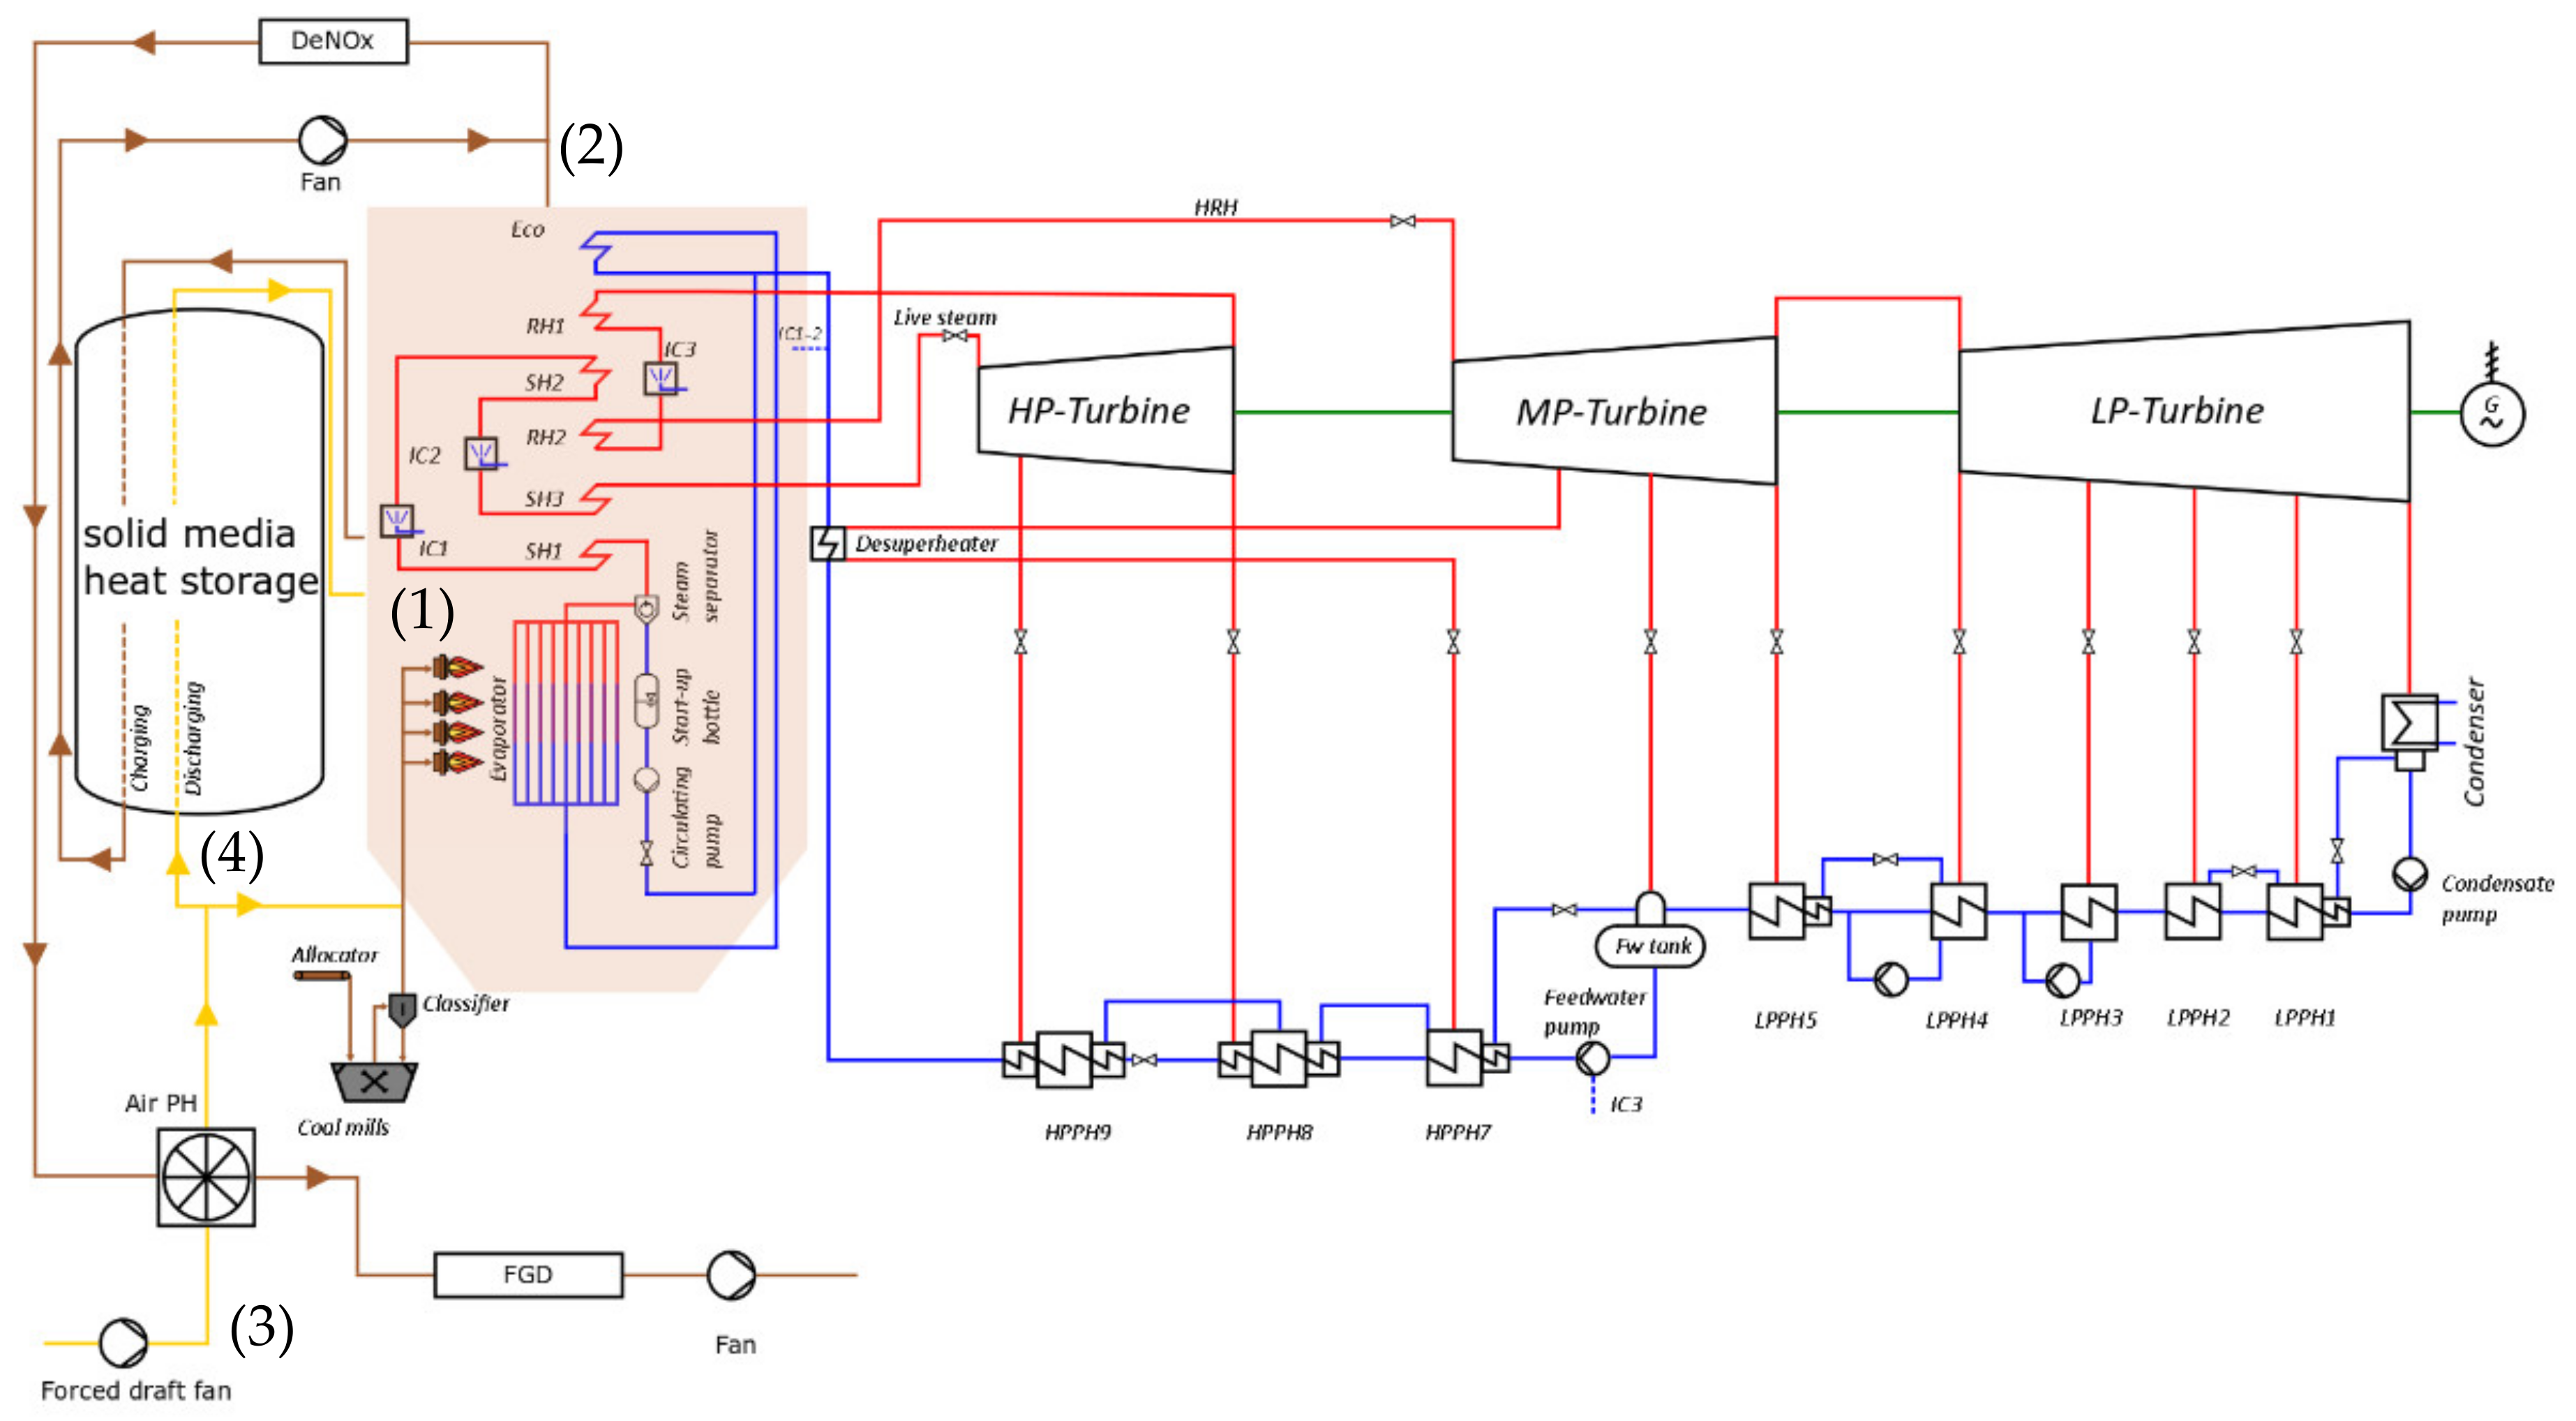
The Flue gas-Air_indirectly concept includes a solid media heat storage, which is integrated into the flue gas path of the power plant, see Figure 3.
In this concept, charging takes place by extracting hot flue gas at the end of the evaporator respectively above the radiation zone (1). The heat of the hot flue gas is then transferred almost isobarically to the heat storage. The cooled flue gas leaving the heat storage system is then returned to the main stream before flue gas cleaning (2). During discharge, air is heated via the heat storage system and coupled to the steam generator at the end of the evaporator respectively above the radiation zone (1). For this purpose, an additional air mass flow is drawn in from the surroundings (e.g., by the fresh air fan) and preheated by the flue gas air preheater (3). This additional air mass flow is then further heated by the heat storage (4) and fed to the steam generator. Due to the additional thermal output of the flue gas flow within the tube bundle heating surfaces, higher live steam mass flows and thus higher electrical outputs can be achieved.
In this concept, ducts with large cross-sections must be connected to the steam generator by passing them through the outer wall and evaporator tubes into the interior. Due to the usual compact design of steam generators, this is only possible in new plants where these connections are already planned.
The storage system is based on a solid media heat storage. In addition, control elements are necessary for the extraction and feedback of flue gas or air. Due to the pressure losses that occur, an additional blower is also considered. This is needed during charging, as the pressure loss between the two integration points is only a few mbar.
During the design of the solid media heat storage, extensive variation studies were carried out on various parameters such as material (bricks made of refractory materials, honeycombs, and spheres made of ceramics) and geometries of the storage materials (different specific heat areas and void fractions) and the tanks (different height-to-diameter ratios) under specified boundary conditions (inlet temperature, pressure, and mass flow) and optimized with regard to minimum investment costs.

3. System Simulations

This section presents the results of the dynamic simulation studies carried out for storage integration. The aim was to evaluate the effects of the storage integrations, to work out the multiple benefits, and, if necessary, to develop suggestions for improvement.
With regard to load shifting through the use of TES, simulation studies were carried out for each control concept over a period of 12 to 13 h. The power plant is at full load at the beginning of the simulations. During the entire simulation period, charging and discharging processes take place at both full and minimum load, depending on the concept. In addition, there is one positive and one negative load change per simulation. The results generated in Modelica/Dymola® were then exported to Microsoft Excel® and evaluated in the minute range. For the evaluations, time curves of important process variables were generated and displayed graphically. Results for the three lead concepts described above are presented below. These were obtained with a dynamic power plant model of the 800 MWel class. Instead of a single power plant, the modern 800 MWel power plant class was generically defined as the reference power plant type and thus as the basis for the investigations in Section 5. Power plants that can be assigned to this type include Wilhelmshaven, Moorburg A,B, Walsum 10, and RDK 8. This approach takes into account that in Germany, the focus will be on retrofitting thermal storage facilities, and therefore, power plants that can be considered for retrofitting are predominantly to be assigned to the “modern power plant” category.

3.1. HRH-HPPH9_indirectly (Molten Salt Storage)

The results described here are based on the thermal circuit diagram of the 800 MW class model with the integration of the molten salt storage shown in Figure 1.
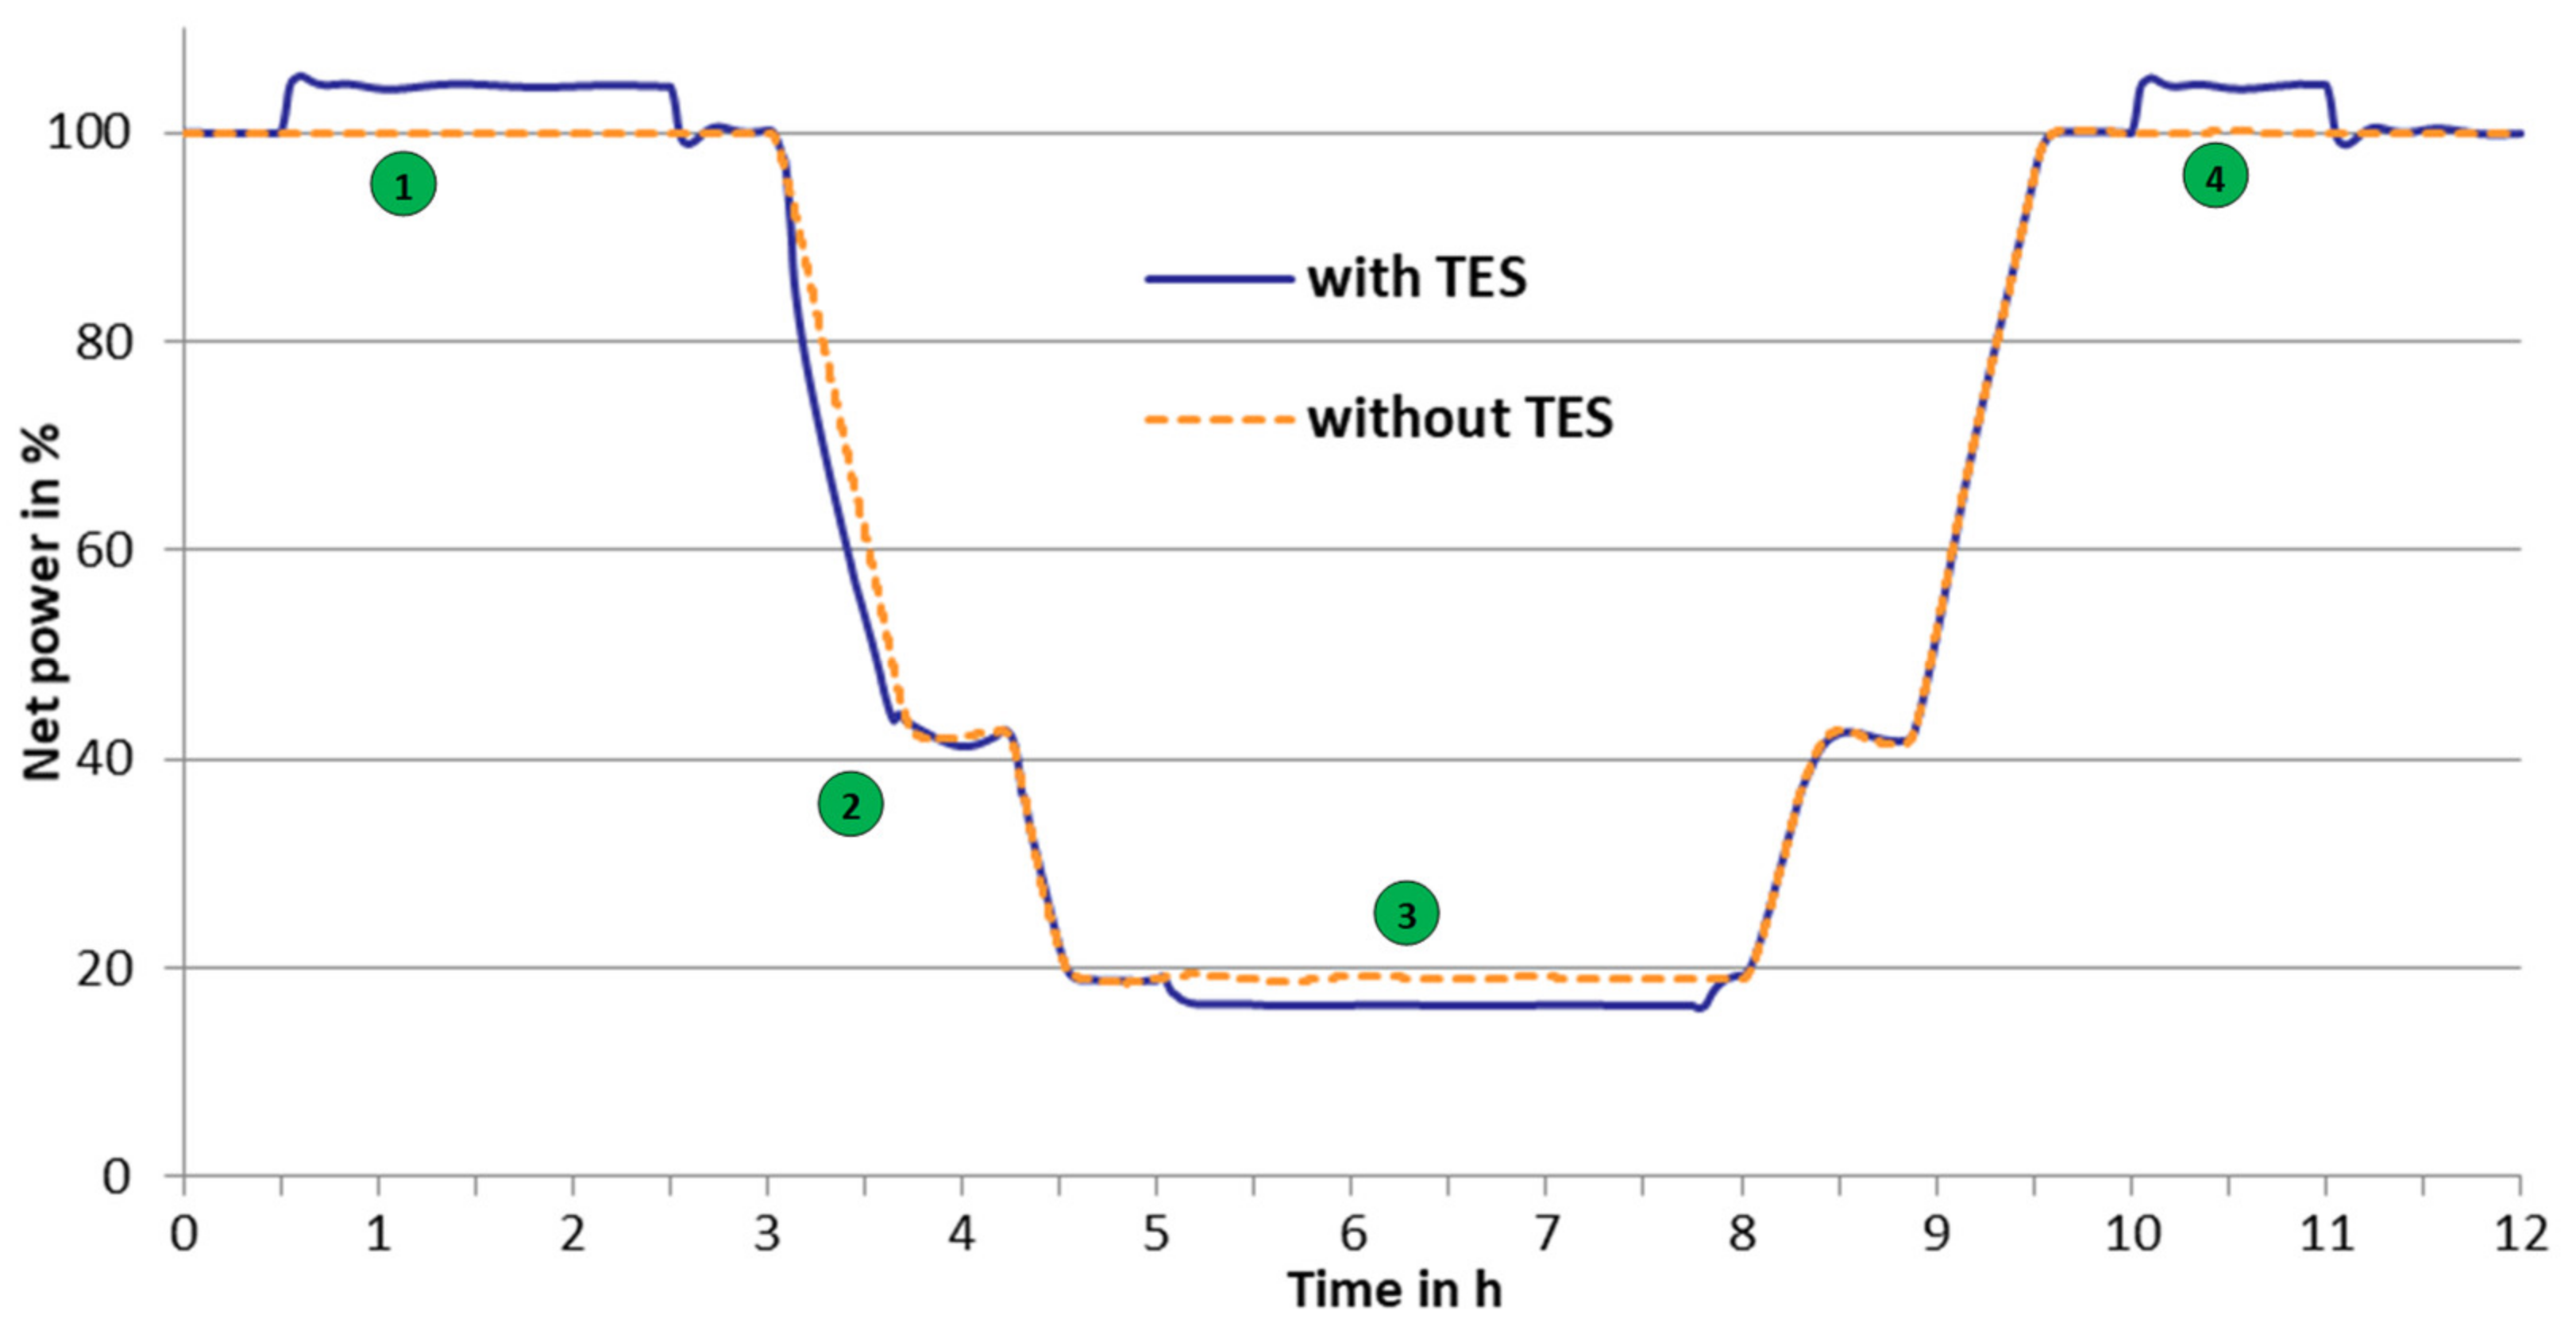
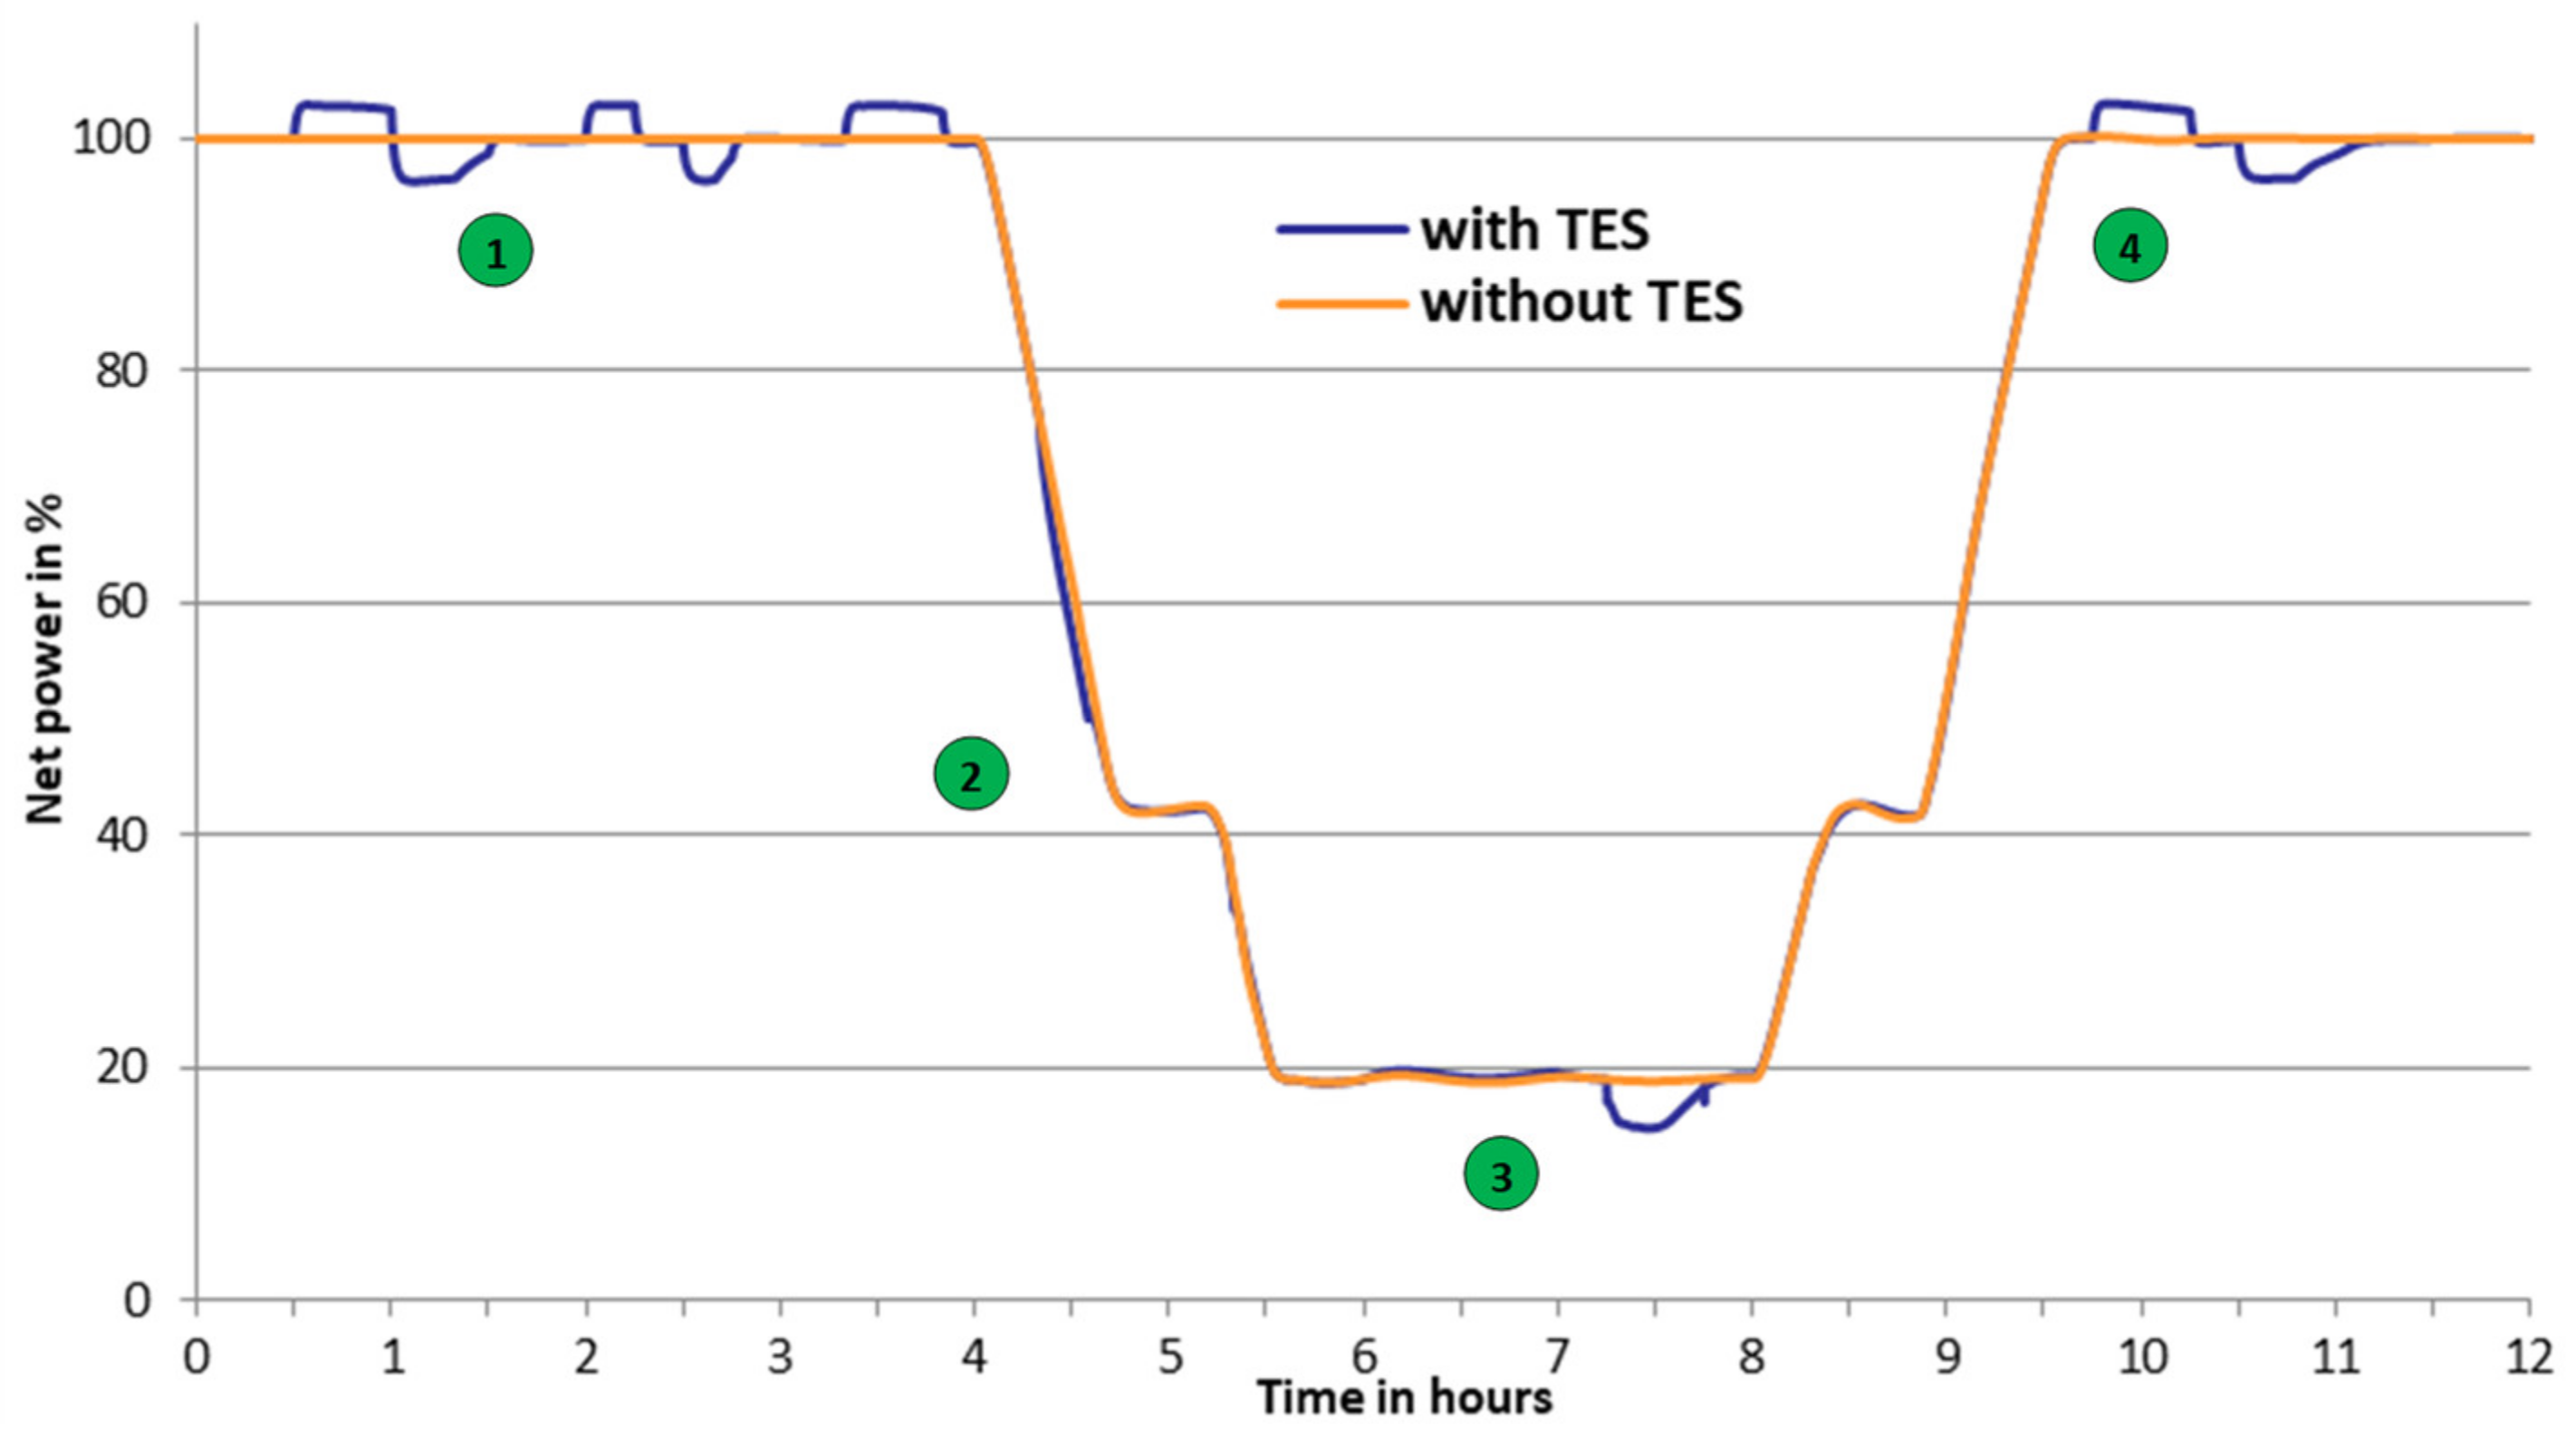
Figure 4 shows the time curves of the net power for the HRH-HPPH9_indirectly concept over a simulation period of 12 h. The blue line shows the course of the actual net power with the use of TES, while the dashed orange line shows the course without the use of storage. At the beginning of the simulation, the power plant is in full-load operation, and the storage is in a fully charged state. After a short time, there is a discharge and thus an increase in load for about 2 h (1). Shortly afterward, the load changes to 40%. It is noticeable that the blue line reaches 40% somewhat faster (2). The reason for this is that a higher rate of load change is achieved by charging the storage. The power plant then moves into the minimum load range, where a charging process takes place over 2.5 h (3). In the further course, the power plant moves back into the full load range, where the storage is discharged for a duration of 1 h towards the end of the simulation (4). It can thus be seen that the integration of the molten salt storage and the implementation of the necessary control structures were successful. During a simulation process, it is possible to charge or discharge the storage several times regardless of the power plant load. Multiple-use has also been tested in this case. The storage unit can generate additional revenues in the market through positive load shifts. In addition, it is able to increase the rate of load change when the load changes or reduce the minimum load.
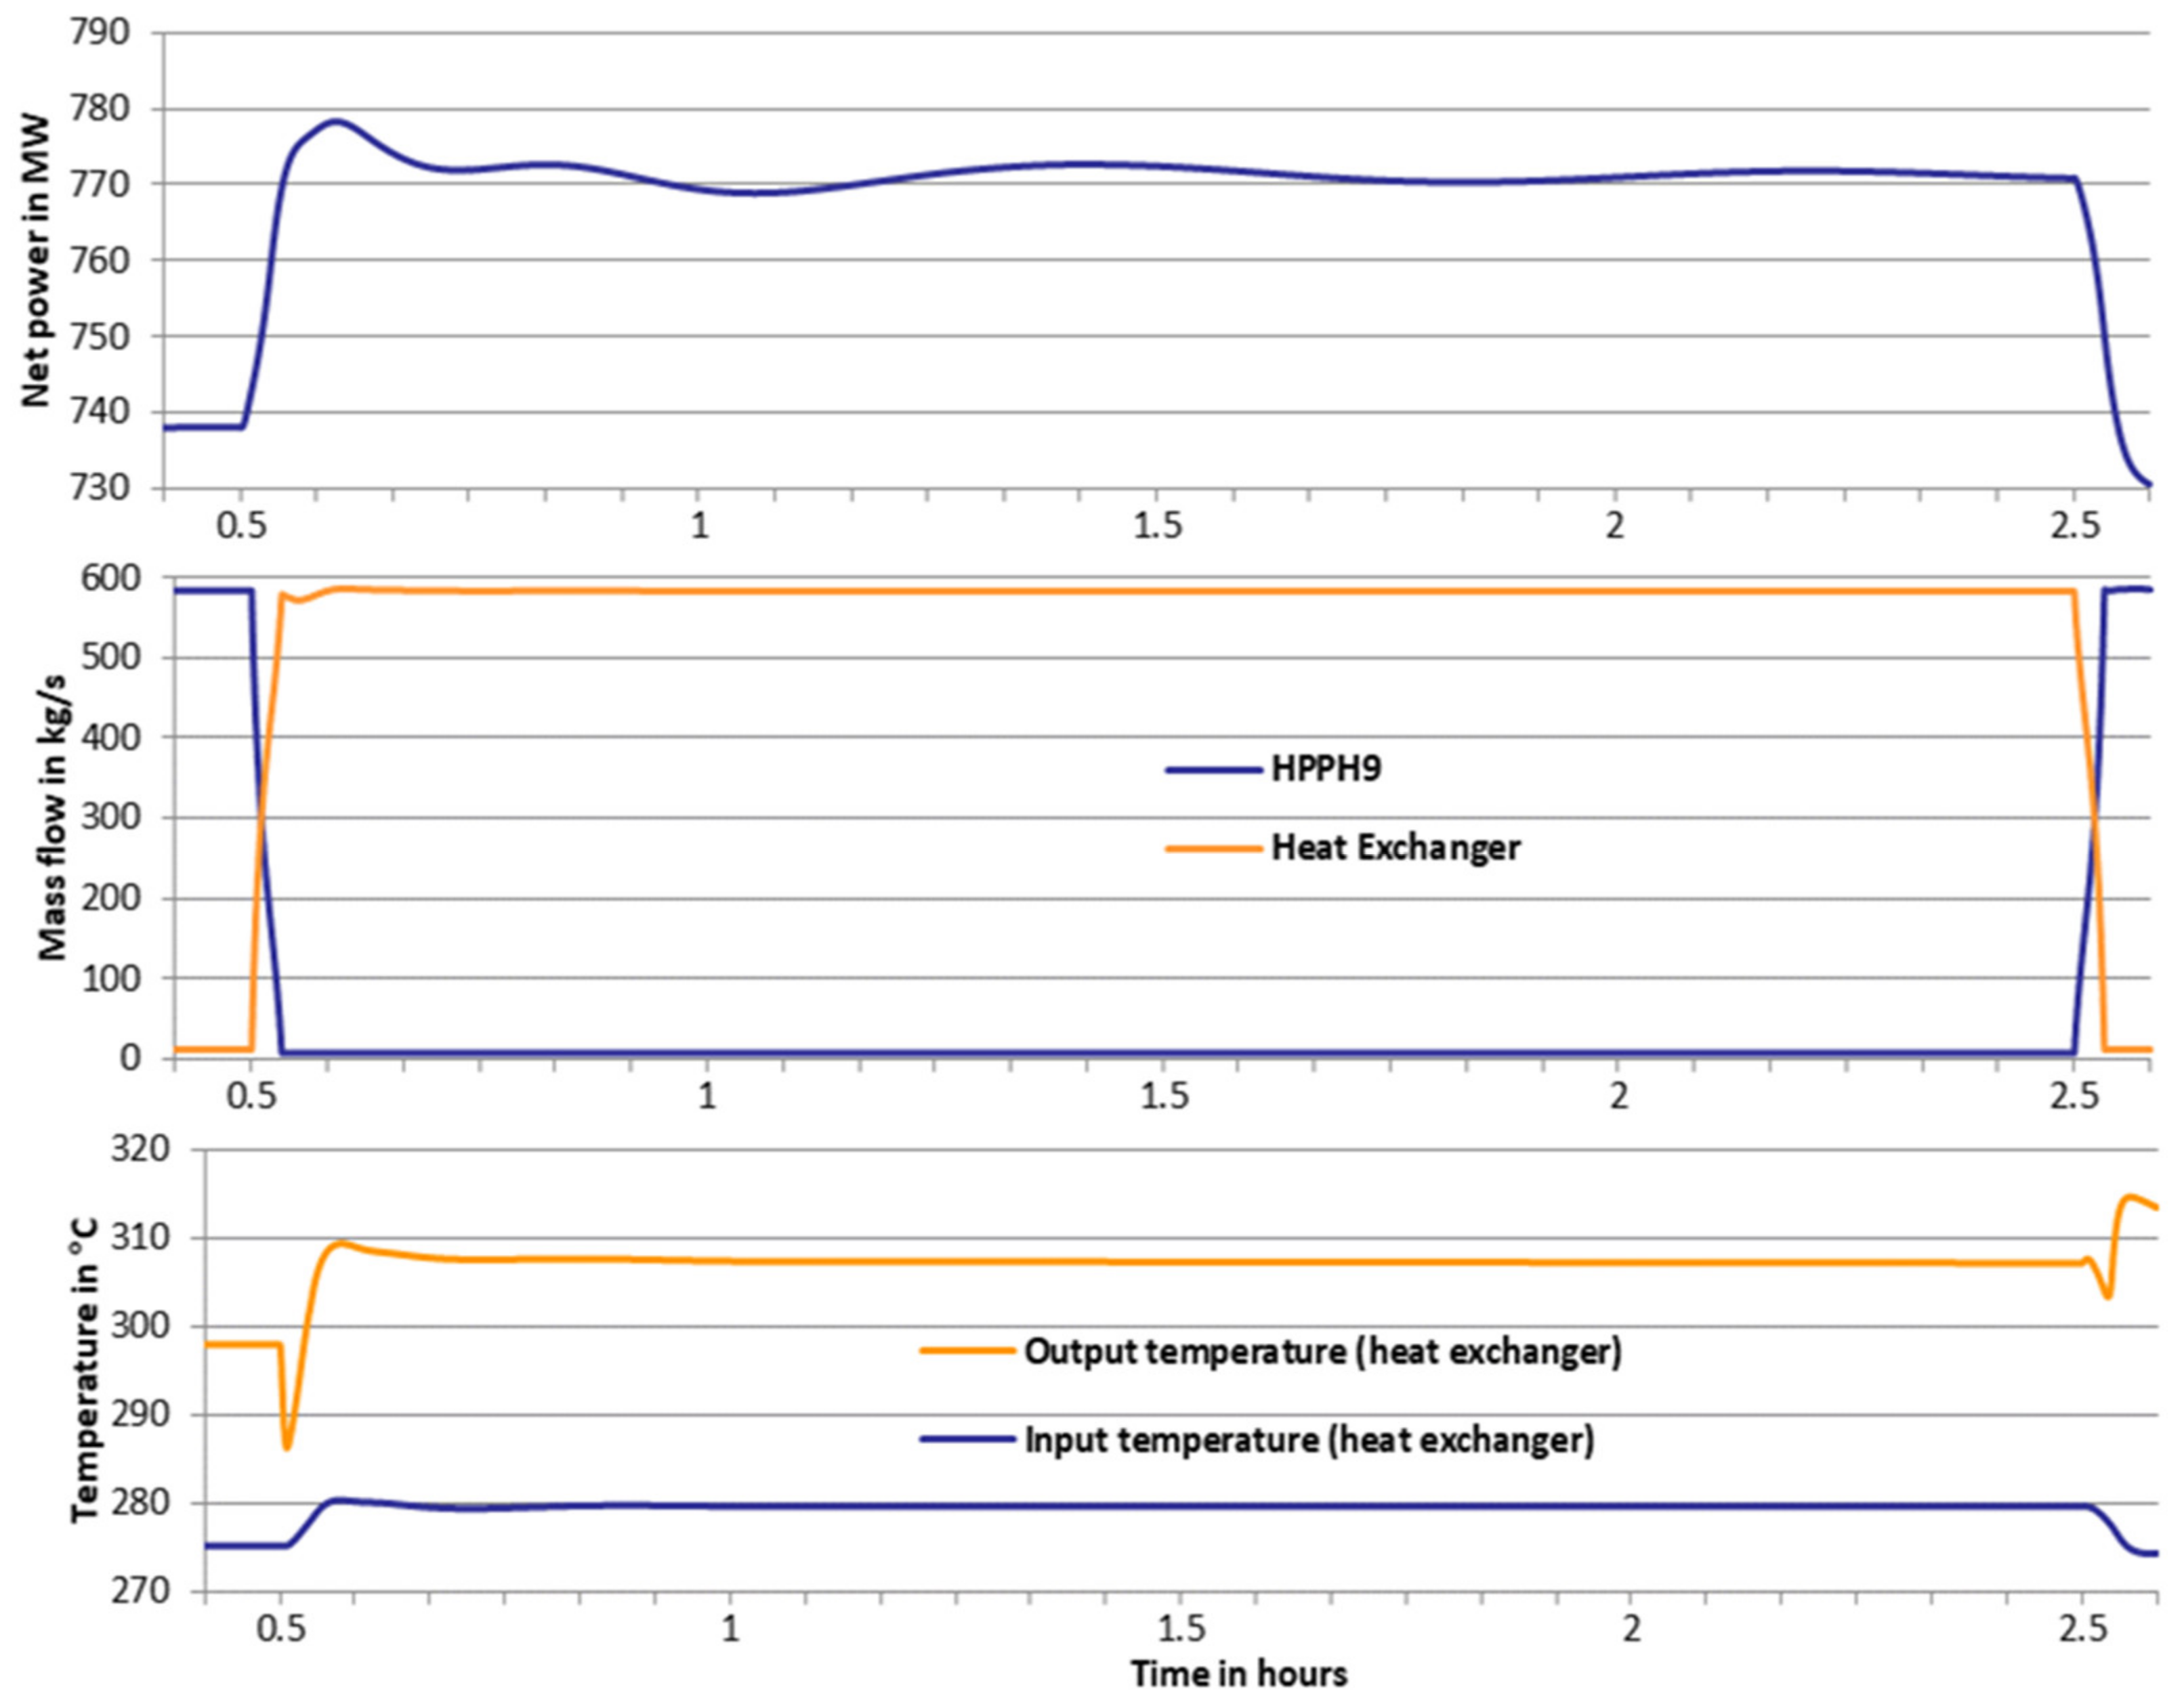
Next, an evaluation is carried out in the minute range. Figure 5 below shows the curves of important process variables during the first discharge process. The upper diagram shows the change in net power during discharge. Due to the inertia of the indirect storage system, the power potential is only reached after about 2 min. The power is thereby increased by about 34 MWel during the entire discharge time. No large oscillations occur during the load change or the discharge process. The middle diagram shows the course of the feedwater mass flow, which flows through the HPPH9 (blue) or the molten salt/water heat exchanger (orange). At time 0.5 h, the start of the discharge process, the switchover takes place, which lasts about 2 min. After the changeover, the entire feedwater mass flow is routed via the newly integrated heat exchanger and thus bypasses the last HP preheater. The tapped steam mass flow that is, therefore, no longer required flows through the downstream turbine stages, generating the additional electrical power shown in Figure 4. From this point on, the feed water is heated further by the hot salt, which is pumped into the cold tank via the heat exchanger. The third diagram shows the temperature curve of the feed water before and after the outlet of the heat exchanger. At the beginning of the changeover, a sharp drop can be seen. This is caused by the cold walls of the heat exchanger. To avoid such a drop, the heat exchangers would have to be either heated electrically or occasionally flown through with hot salt during standstill.

3.2. CRH/LS-HPPH7_directly (Ruth)

The results described here are based on the thermal schematic of the 800 MW class model shown in Figure 2 with the integration of the Ruths storage.
In order to check the integration and use of the storage, dynamic simulation studies were also carried out for this simulation model for the CRH/LS-HPPH7_directly concept. In Figure 6, the course of the net power with TES use in blue is compared to the course of the net power without TES use in orange. The simulation duration, in this case, is also 12 h. At the beginning of the simulation, the power plant is in full-load operation, and the storage tank is in a fully charged state. Then there is a discharging process for 30 min, followed by a direct charging process, also for 30 min. After a short break, the storage tank is first discharged for 15 min and then charged after a 15-min break (1). A renewed discharge is then followed by a load change of the power plant. In this concept, charging is also tested during load changes to increase the rate of load change (2). In minimum load operation, the storage unit then continues to be charged (3) so that a discharging and charging process takes place after a renewed load change (4). The testing of the integration of the Ruths storage unit was thus also successful. With the help of the implemented control structures, it is possible to charge or discharge the storage unit several times in all power plant loads. The storage unit can also be used in this case for load shifting, for increasing the rate of load change, or for lowering the minimum load.
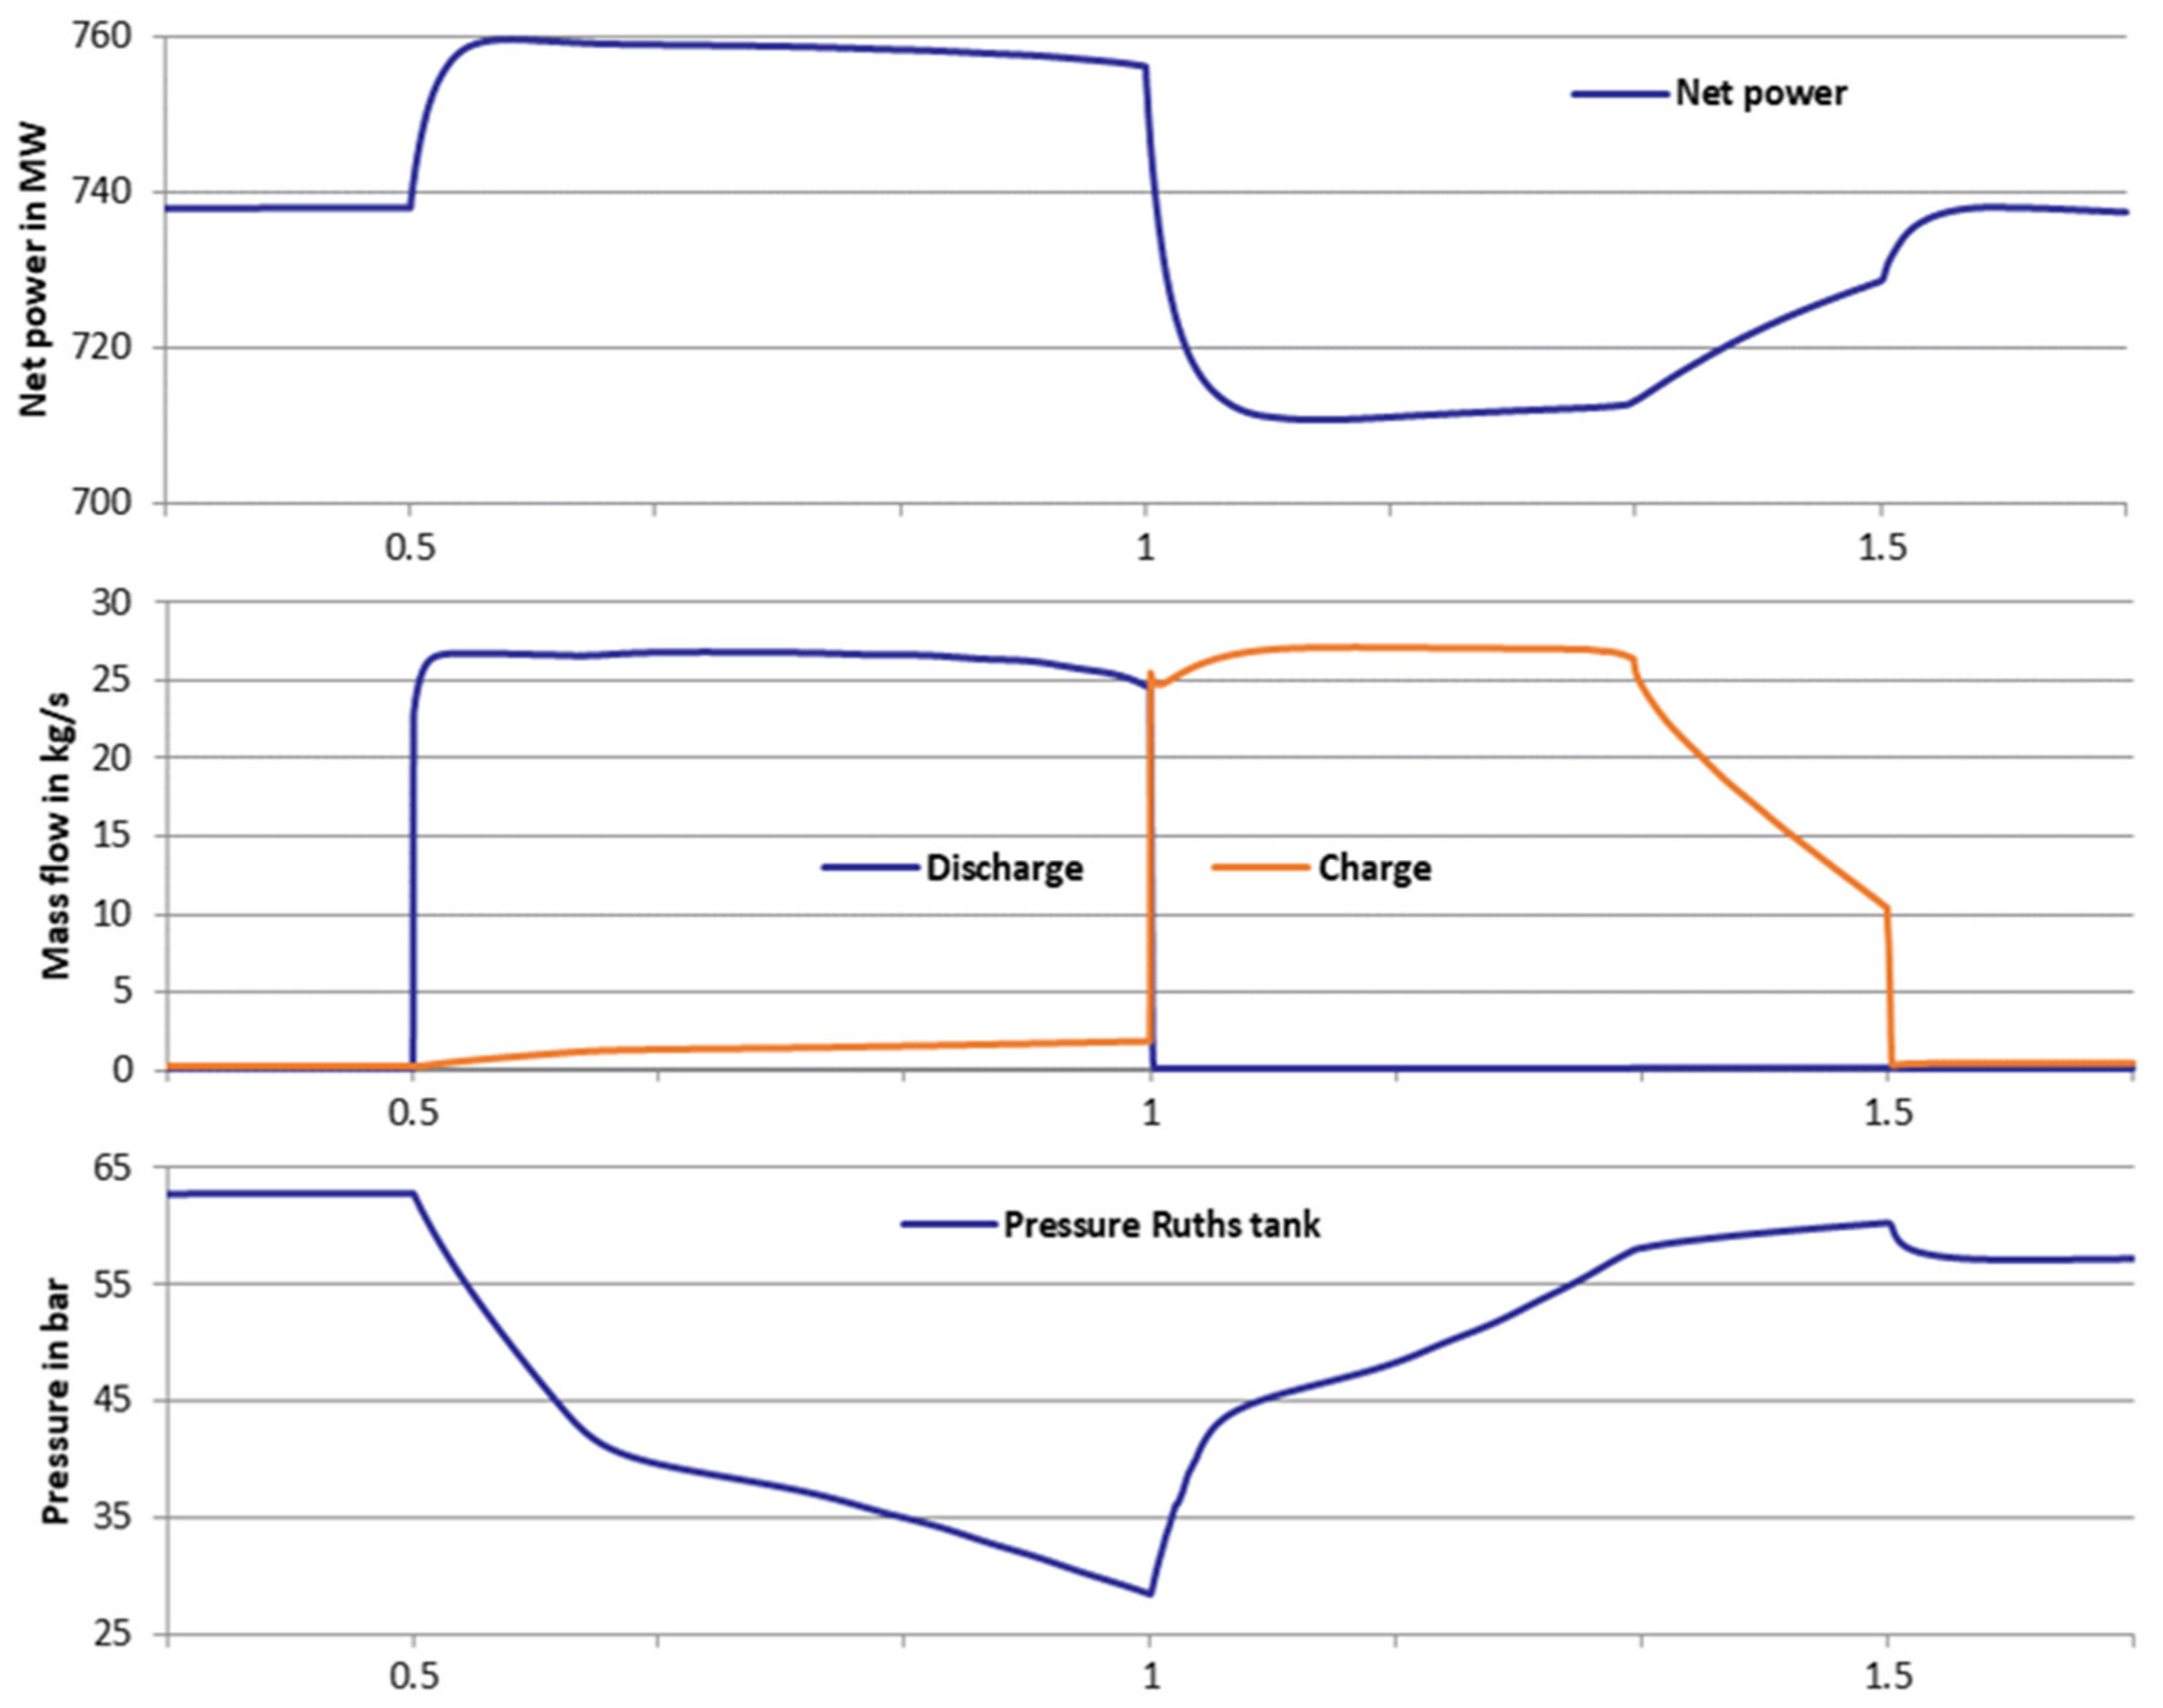
The following diagrams in Figure 7 show the time courses of the most important parameters during the first discharging process with a direct charging process at the beginning of the simulation. A time window of 80 min is considered. The top diagram shows the change in net electrical power during these processes. With this concept, a very rapid change in net power can be seen when a TES operation is called up, because this is direct storage. A very fast dynamic behavior can also be observed during a direct change from a discharging process to a charging process. In addition, an increase in net power can be seen at the end of the charging process. The reason for this is that with a design of 30 min, the entire storage capacity cannot be utilized. At the end, there is only a very small pressure difference between the integration point and the Ruths storage tank, which is why the stored mass flow falls below the desired potential. This effect can be seen in the second diagram from the top, where the mass flows in and out of storage can be seen. The blue line shows the mass flow leaving the Ruths storage during the discharging process of 30 min, and the orange line shows the mass flow entering during the charging process of 30 min. It can be seen that the incoming mass flow is the same as the outgoing mass flow. However, the mass flow drops sharply towards the end of the charging process. As already mentioned, the pressure in the Ruths storage reaches the pressure at the integration point (about 62 bar) at this stage (after about 20 min of charging). This effect is shown in the third diagram, in which the course of the pressure in the Ruths storage can be observed. As expected, the pressure decreases during the discharging process because the storage tank is discharged during the 30 min. During the direct charging process, the pressure rises again until the pressure of the incoming steam is reached.

3.3. Flue Gas-Air_indirectly (Solid Media Heat Storage)

The results described here are based on the thermal schematic of the 800 MW class model with the integration of a solid media heat storage shown in Figure 3.
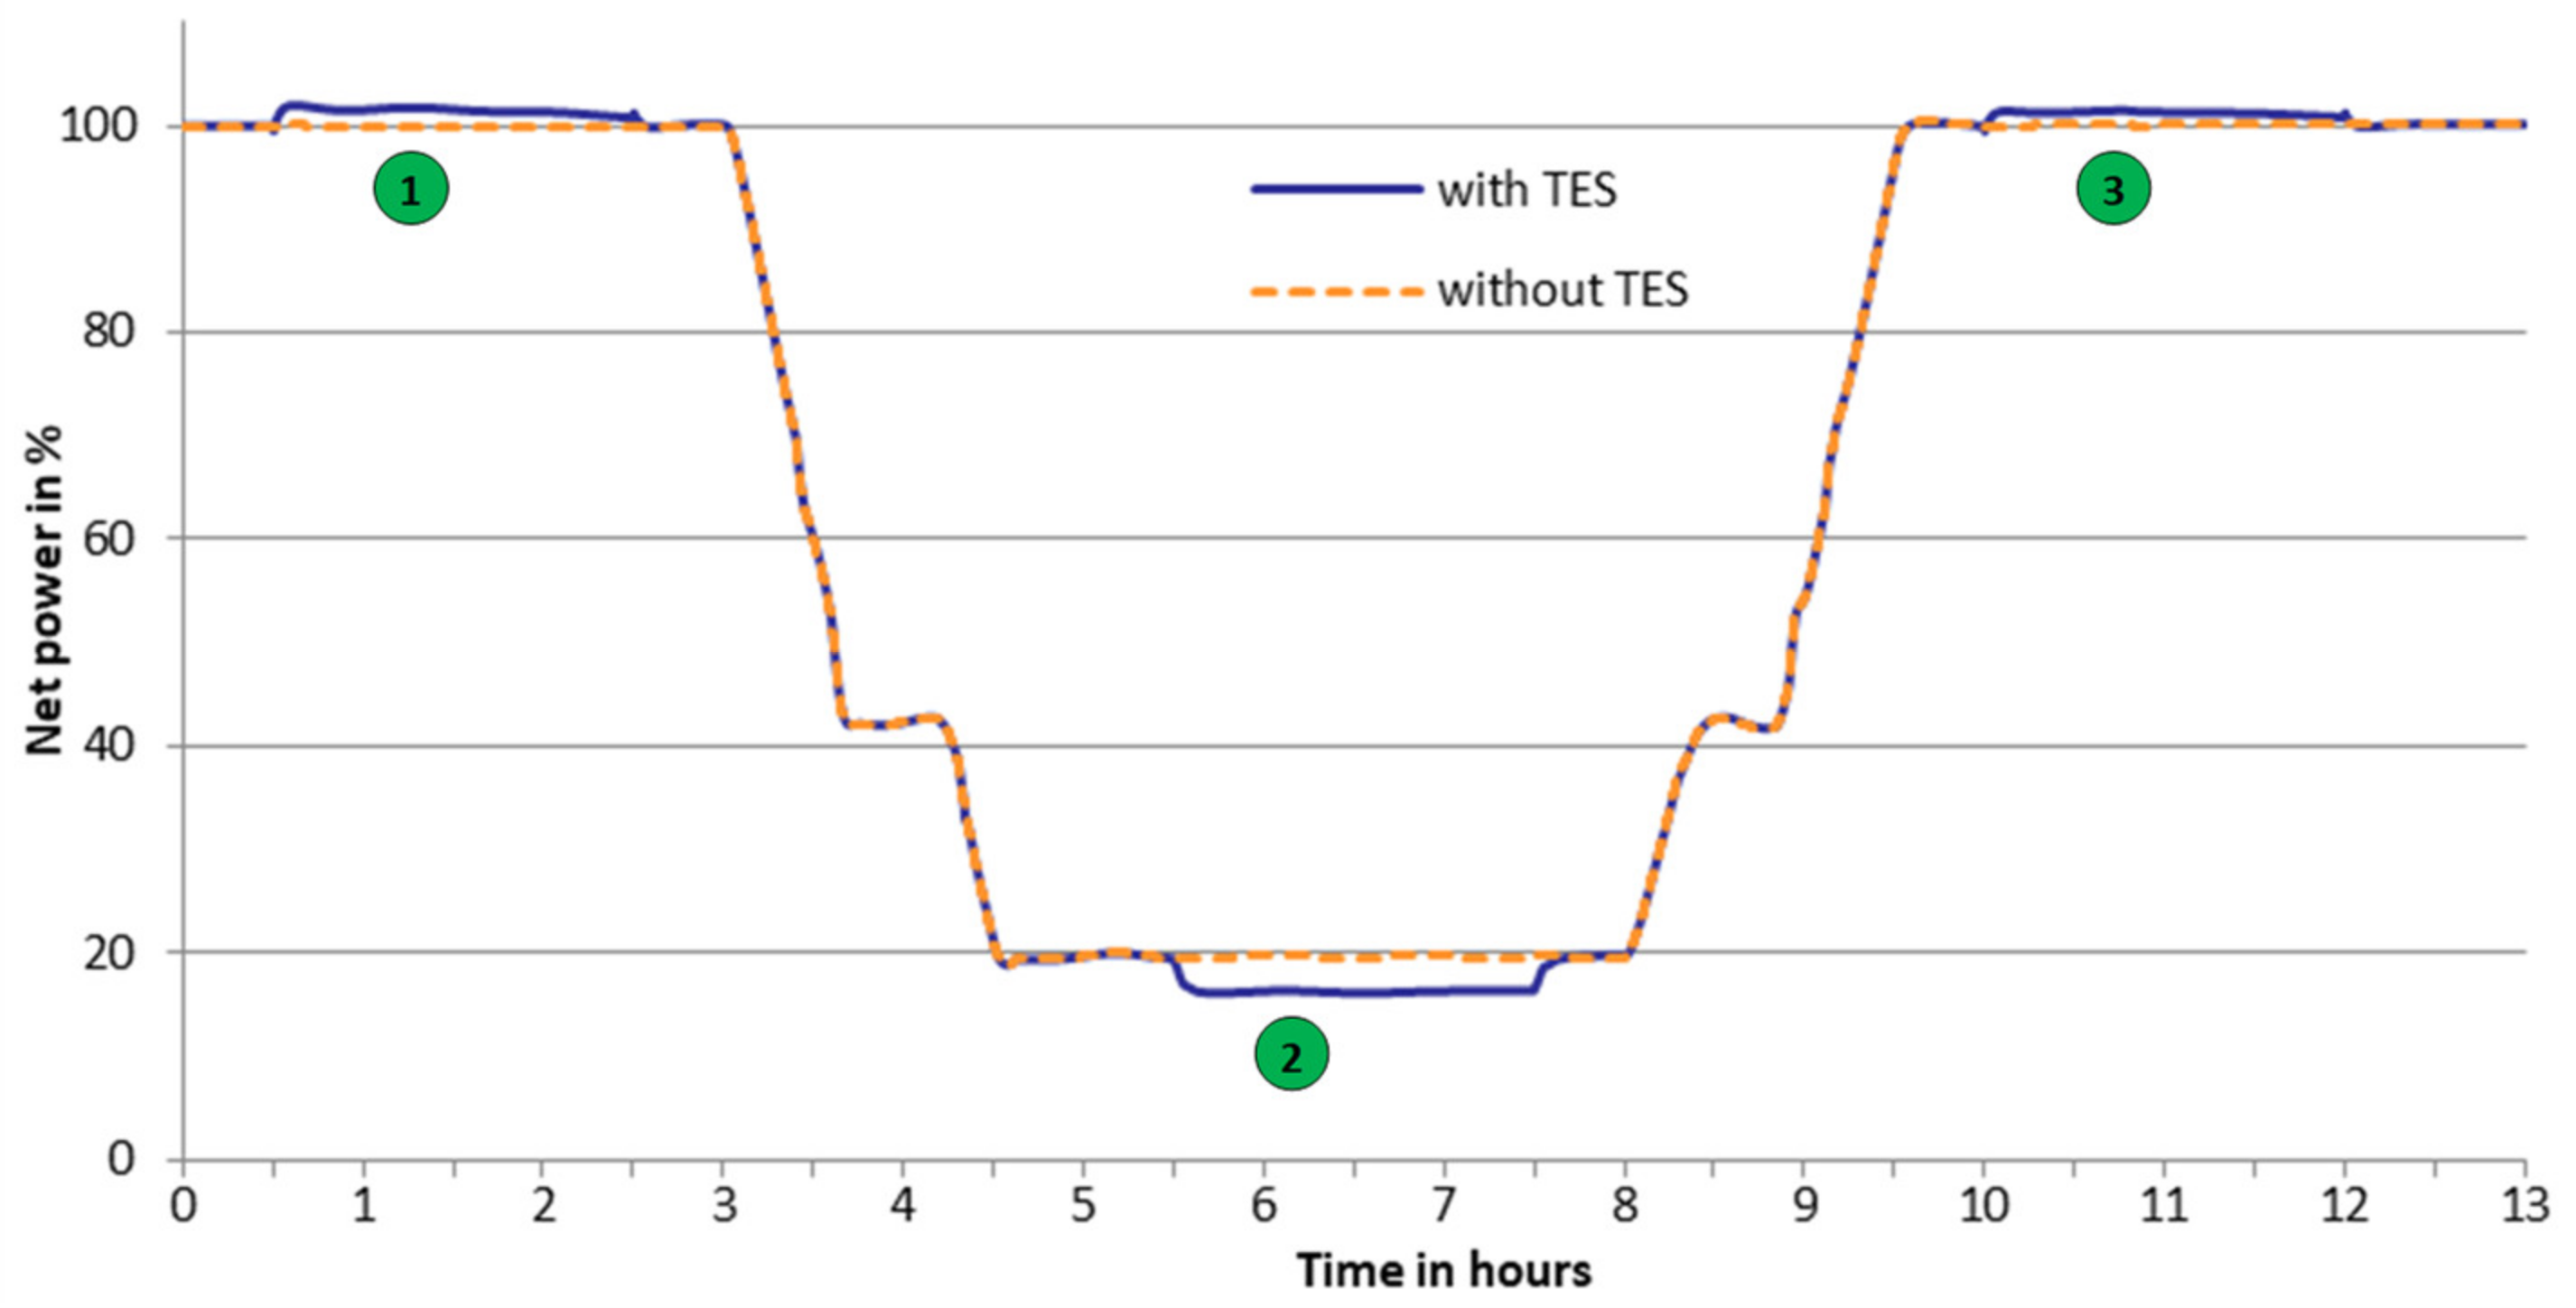
Figure 8 shows the course of the net power over a simulation period of 13 h, whereby the blue line indicates the course with a TES operation and the orange line indicates the course without the operation of TES. At the beginning of the simulation, the storage is in a charged state, and the power plant is in full load operation. First, discharging takes place for 2 h (1). In the next step, the power plant is driven to the minimum load state. During minimum load operation, the storage is charged for 2 h (2), and thus, the minimum load is reduced. Afterward, the power plant reaches full load operation again, and the storage is discharged (3). The functionality of the integrated storage was thus also successfully tested with this concept. Over a long simulation period, it is possible to use the storage unit several times without any problems.
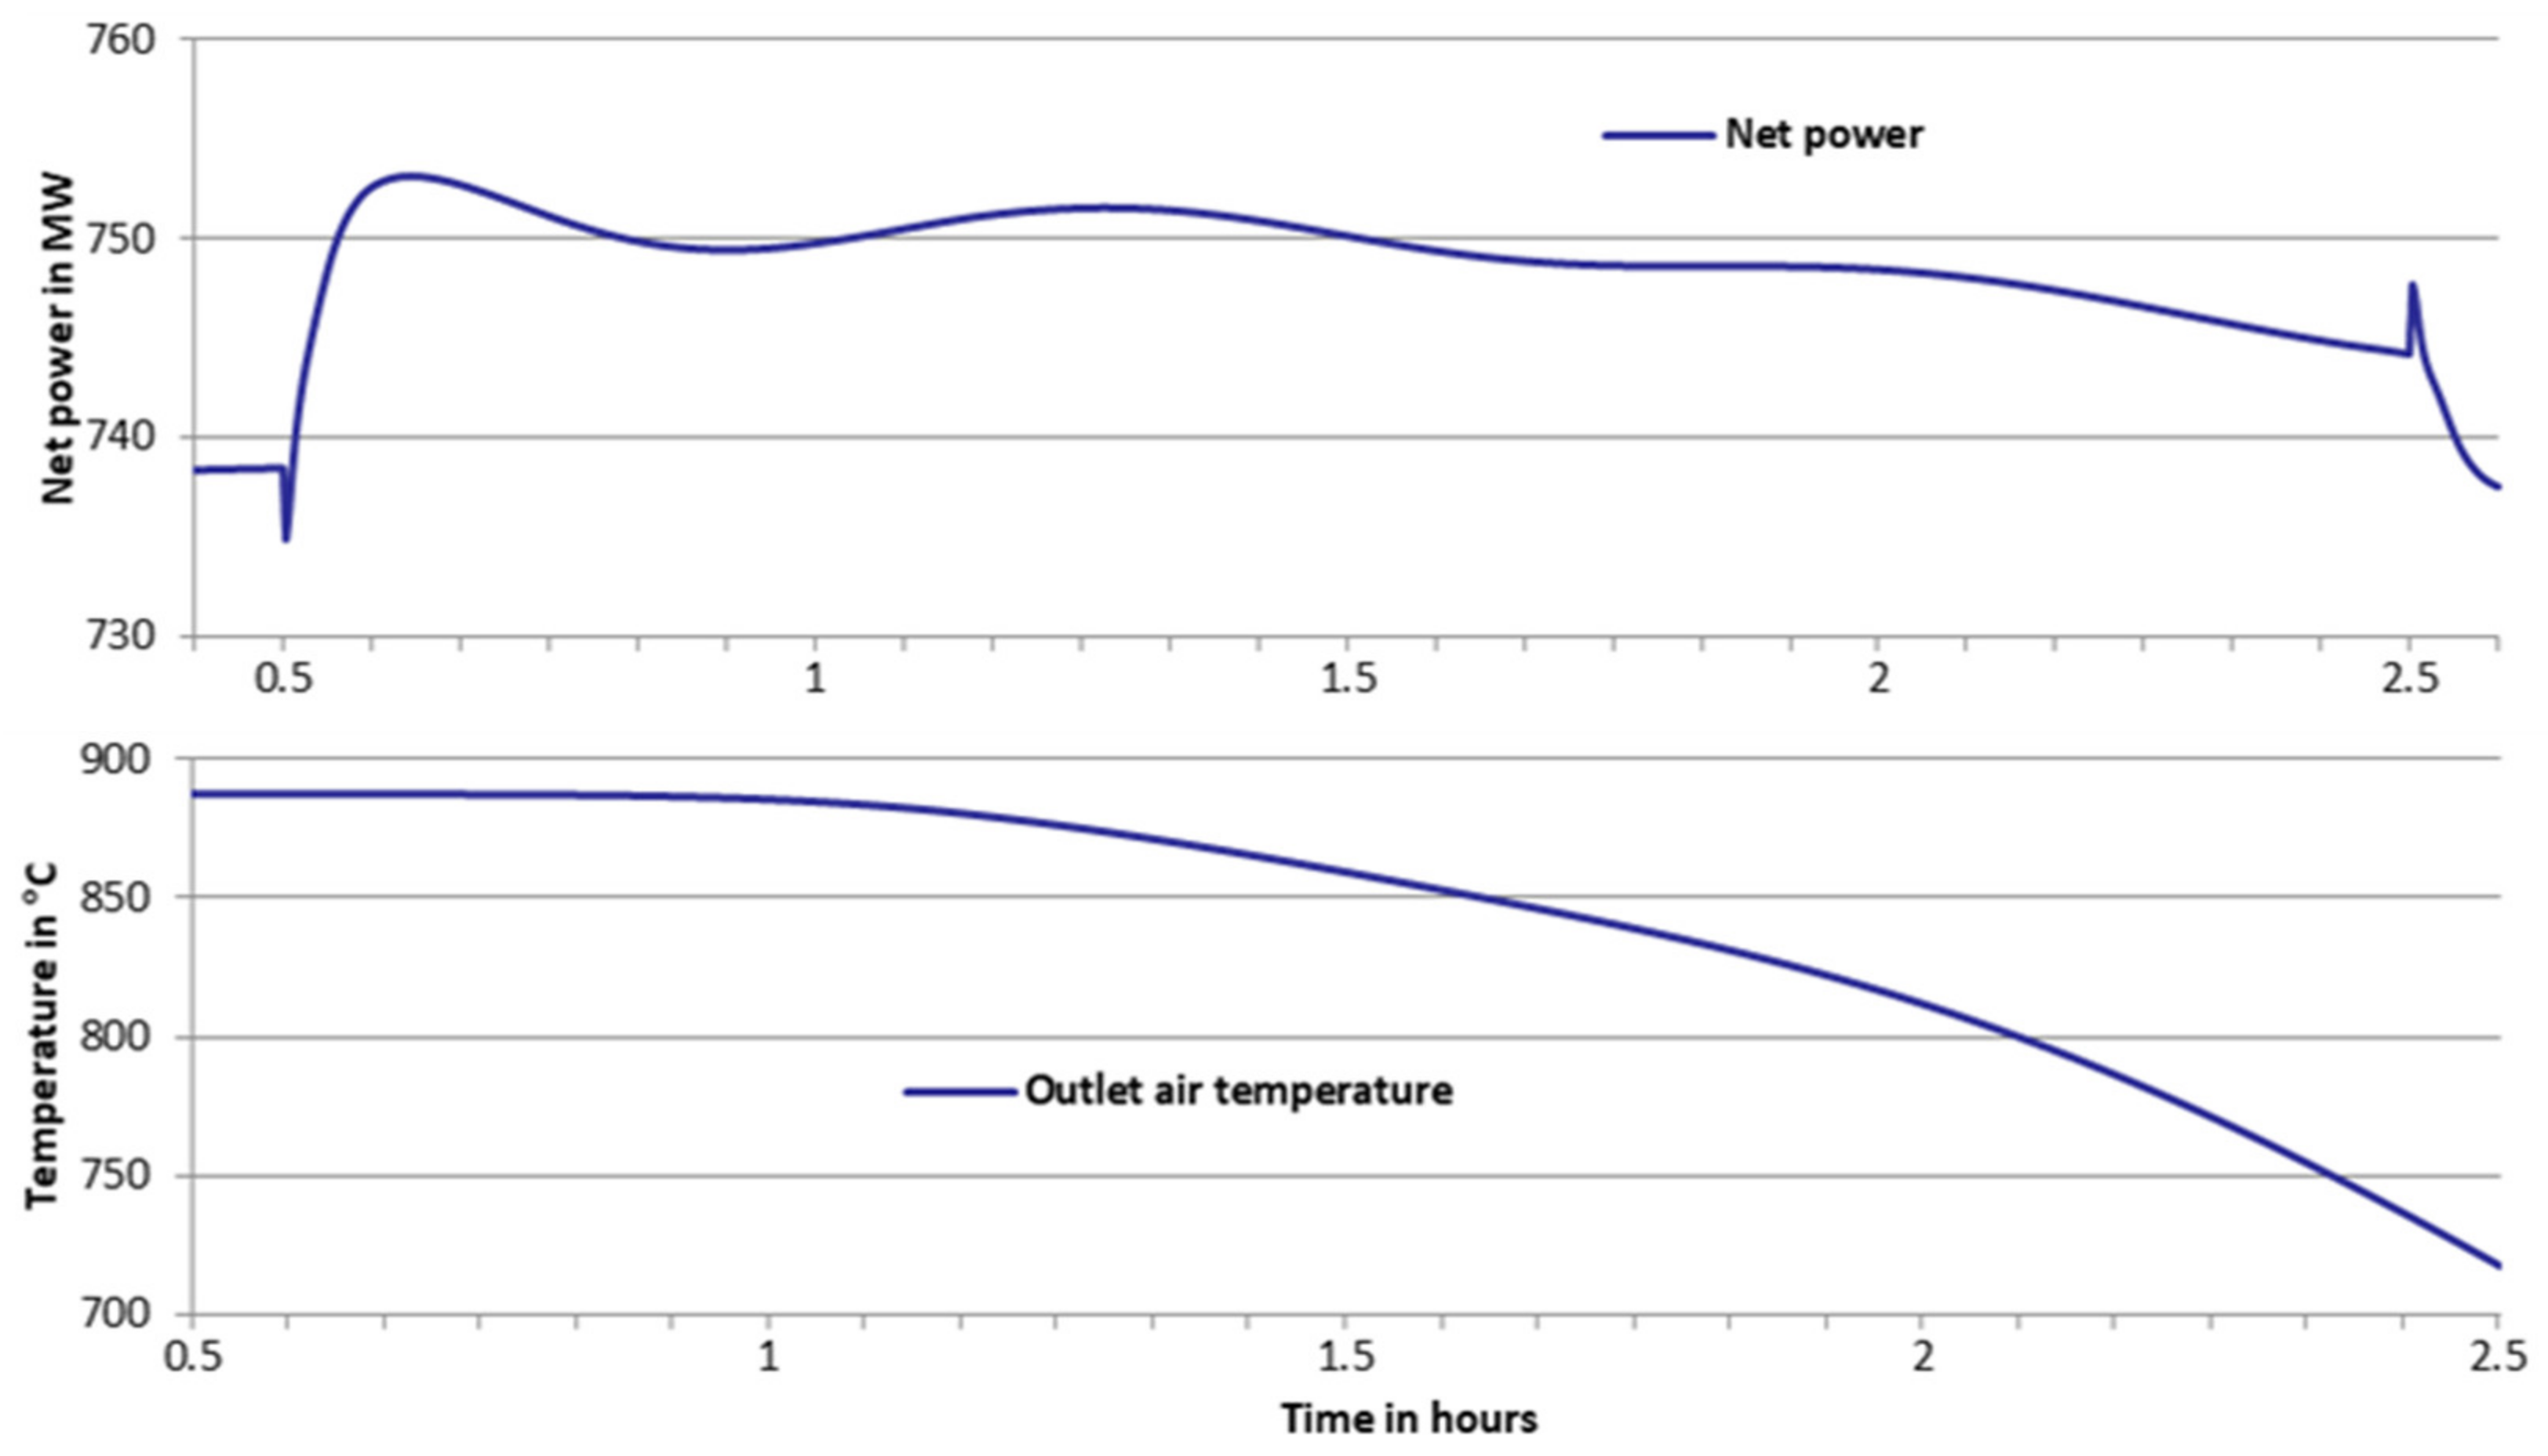
In the next step, the first discharge process (1) is evaluated in the minute range using Figure 9. The upper diagram shows the change in net power during the discharge. It is noticeable that at the beginning and end of the discharge, the net power briefly decreases or increases. The reason for this is that additional fresh air from the environment is needed during the discharging process, which means that the fresh air blower and the units for flue gas cleaning require more power. The increase in internal demand, therefore, becomes noticeable very quickly in this case. In addition, it can be observed that the net power is not constant over the entire discharge time because, at the end of the storage cycle, the air temperature at the outlet of the storage is no longer kept constant. This effect is illustrated in the lower diagram.

4. Thermal Energy Storage Investigations

The aim of the TES investigations was to elaborate in more detail the preliminary designs for heat storage systems in coal-fired power plants identified in the first phase of the project. The focus was on the storage technologies that had already been identified as promising in the previous “Partner Steam Power Plant” project, namely solid media heat storage, molten salt storage, and Ruths storage. For this purpose, simulation studies and design calculations were carried out and supported by experimental results on the material and the design. To this end, existing simplified models of the storage system were initially extended with regard to heat loss mechanisms and detailed dynamic mapping. Based on the detailed models, variation calculations were carried out to identify promising designs.

4.1. Modeling

4.1.1. Molten Salt Storage

The design of the molten salt heat storage tanks is based on a simple energy balance. Hereby the required quantity of salt is determined, and subsequently, the size of the tanks is calculated. For further details, see [17].

4.1.2. Ruths Storage

The aim of the work was the detailed modeling of a Ruths storage. As a basis for this modeling, a single-phase model was used to represent the water-steam behavior in the Ruths storage. Due to the water–steam equilibrium in the storage, the single-phase modeling is sufficient. The model approach is based on the 1st law of thermodynamics, which describes the relationship between internal energy U, the amount of heat Q, and the work W in a system:
d U = d Q + d W
Subsequently, the steam mass flows and specific enthalpies for charging and discharging the thermal storage are summarized in balance equations. In the charging case, the stored heat changes analogously to the injected steam flow f,in and its specific enthalpy hin:
d Q = h i n m ˙ f , i n
m ˙ f , e i n = d m d t
Assuming a constant storage volume V :
V = c o n s t = m ρ
The change over time of the specific enthalpy h in the storage can be calculated:
d h d t = V m d p d t + m ˙ f , e i n m h e i n h
Using a 2nd order backward difference method, this balance equation can be transformed to the following form:
V m 3 p 4 p 1 + p 2 3 h 4 h 1 + h 2 + 2 d t m ˙ f , e i n m h e i n h = 0
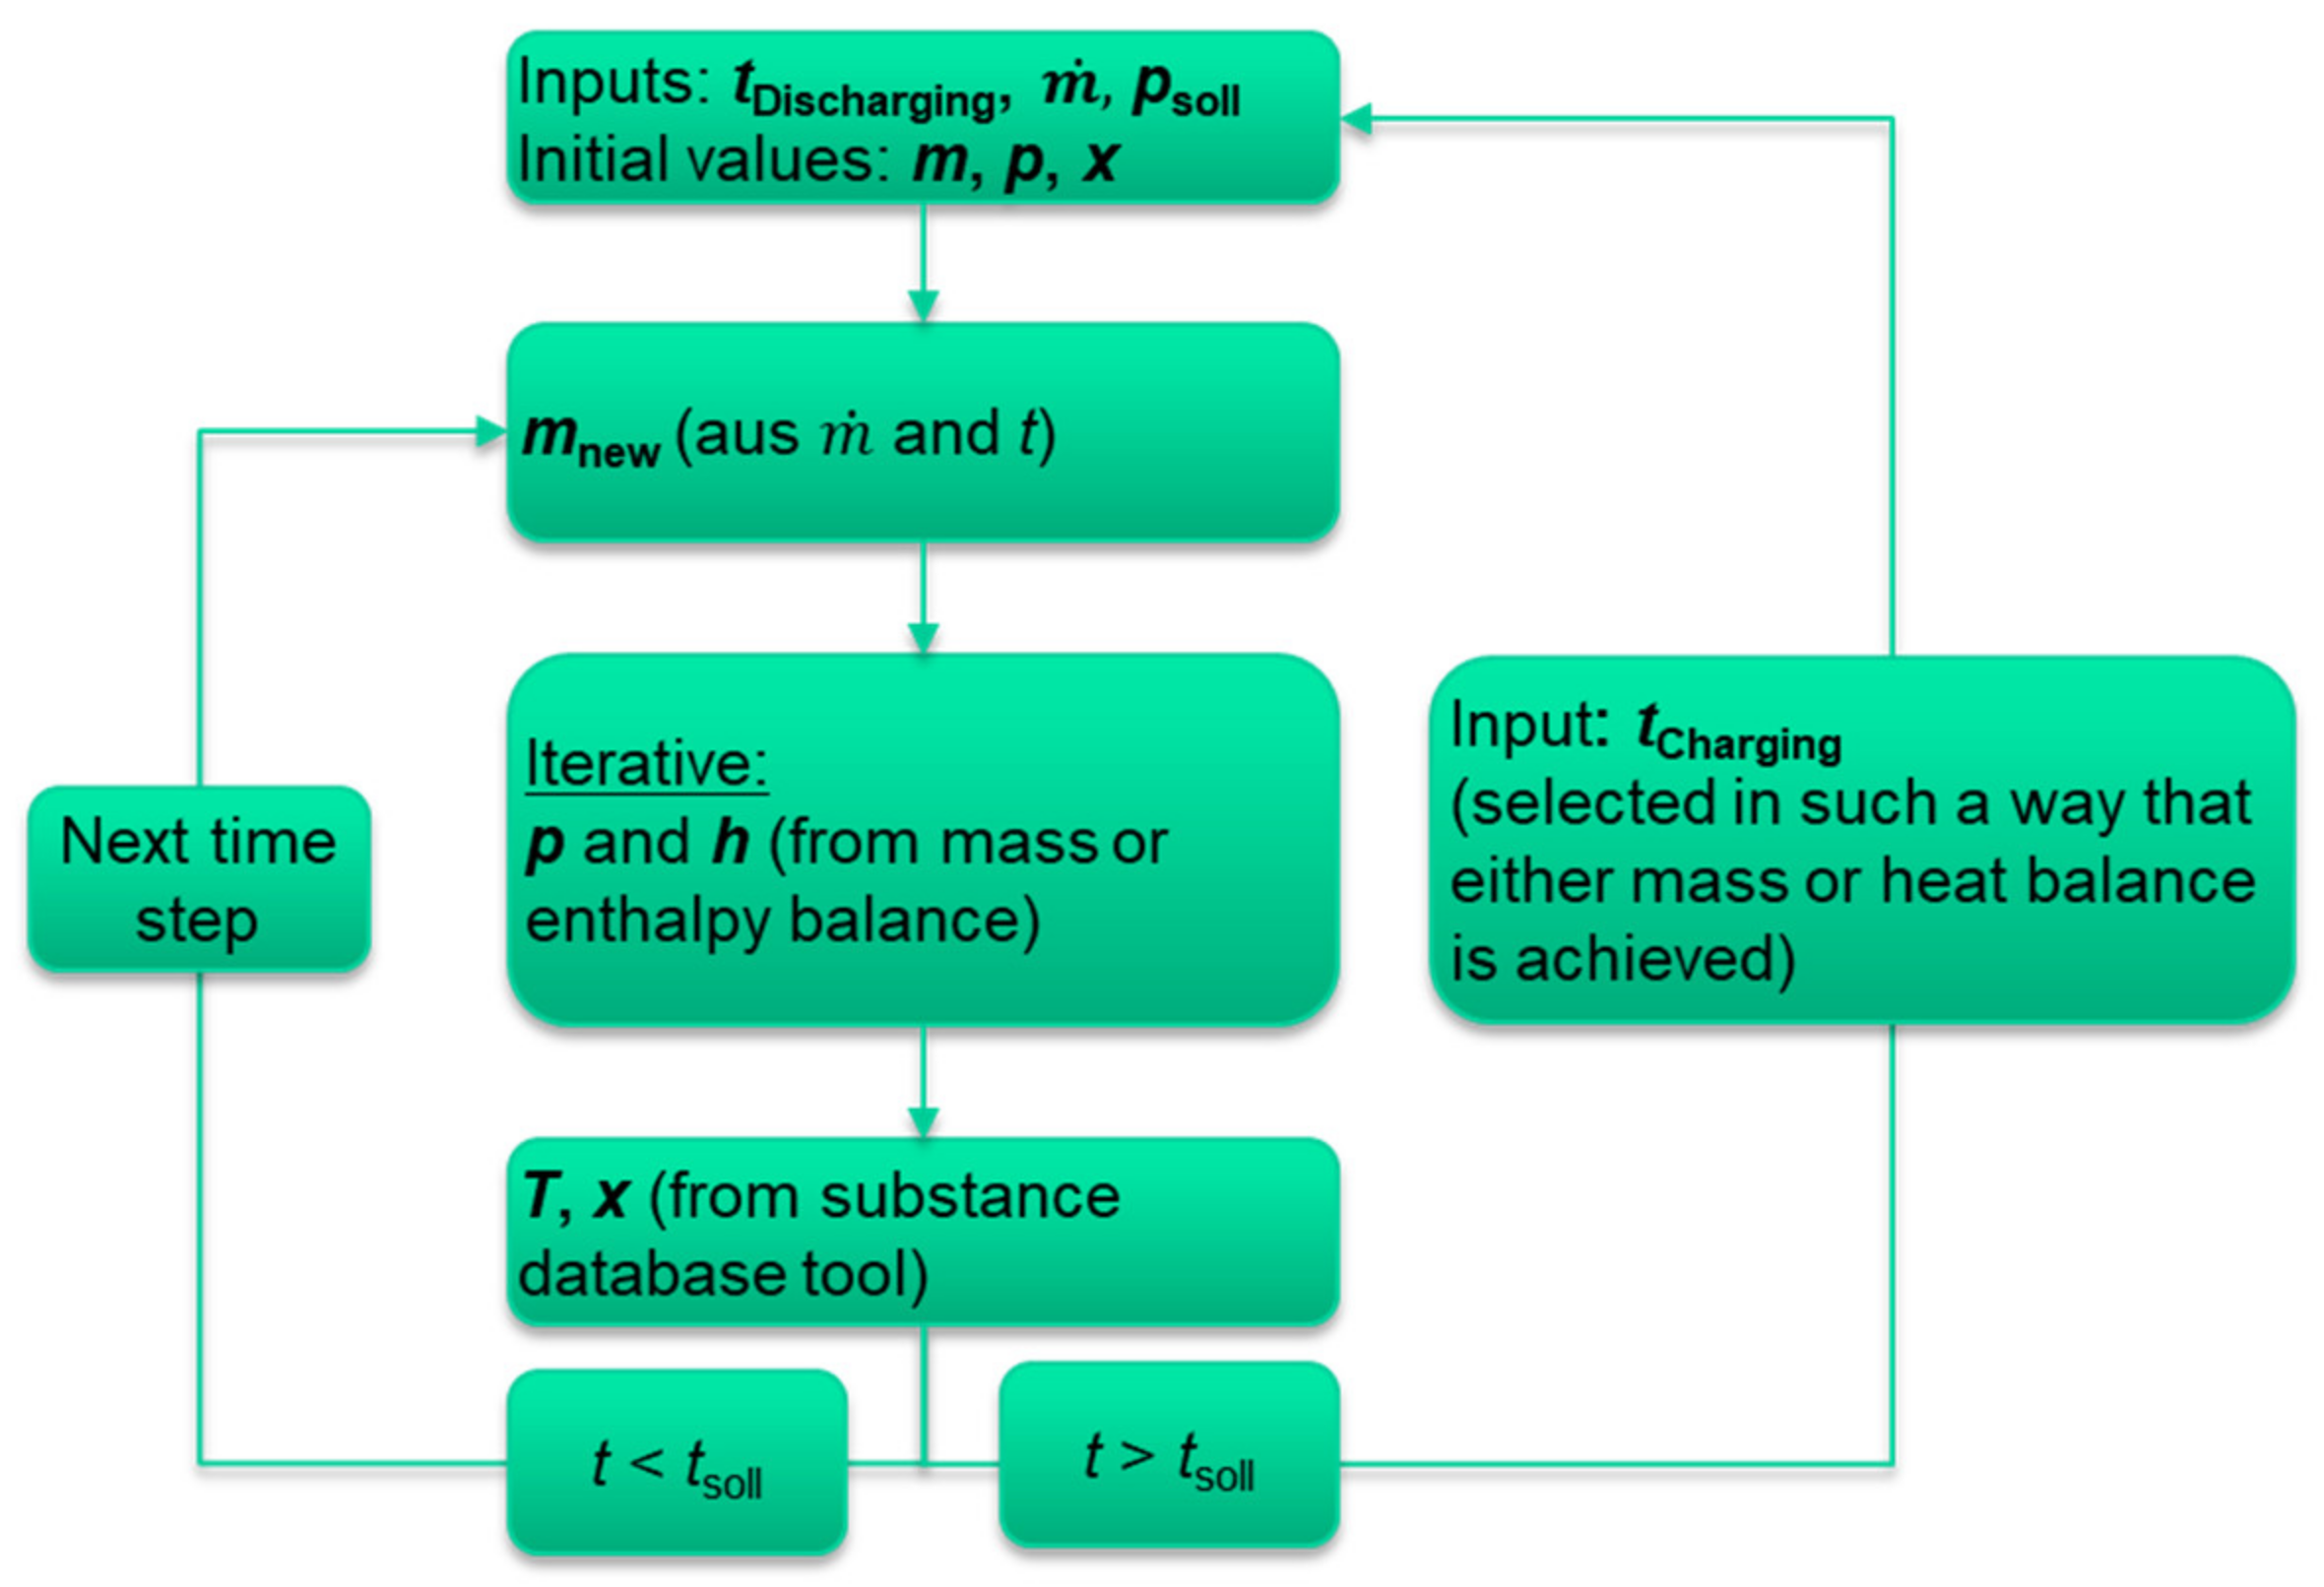
The variables p 1 , p 2 , h 1 , h 2 represent the pressures or enthalpies in the respective preceding time steps d t . With the aid of a substance data tool, the changes of state in the storage tank (temperature T , pressure p , vapor content x , …) can be calculated time-step by time-step using this balance equation. The storage volume is iteratively adjusted until the target values for discharge temperature, mass flow, and target pressure are reached after a given discharge time. This iterative procedure was implemented in Matlab. The sequential calculation sequence is represented schematically in Figure 10.
This basic model described was further detailed for different variation studies. For example, the balance equation described above was extended to include the corresponding terms for the thermal mass of the steel tank, a connected heat exchanger, and heat loss and insulation effects. This modeling enabled a high accuracy of modeling of the storage tank in the overall system.

4.1.3. Solid Media Heat Storage

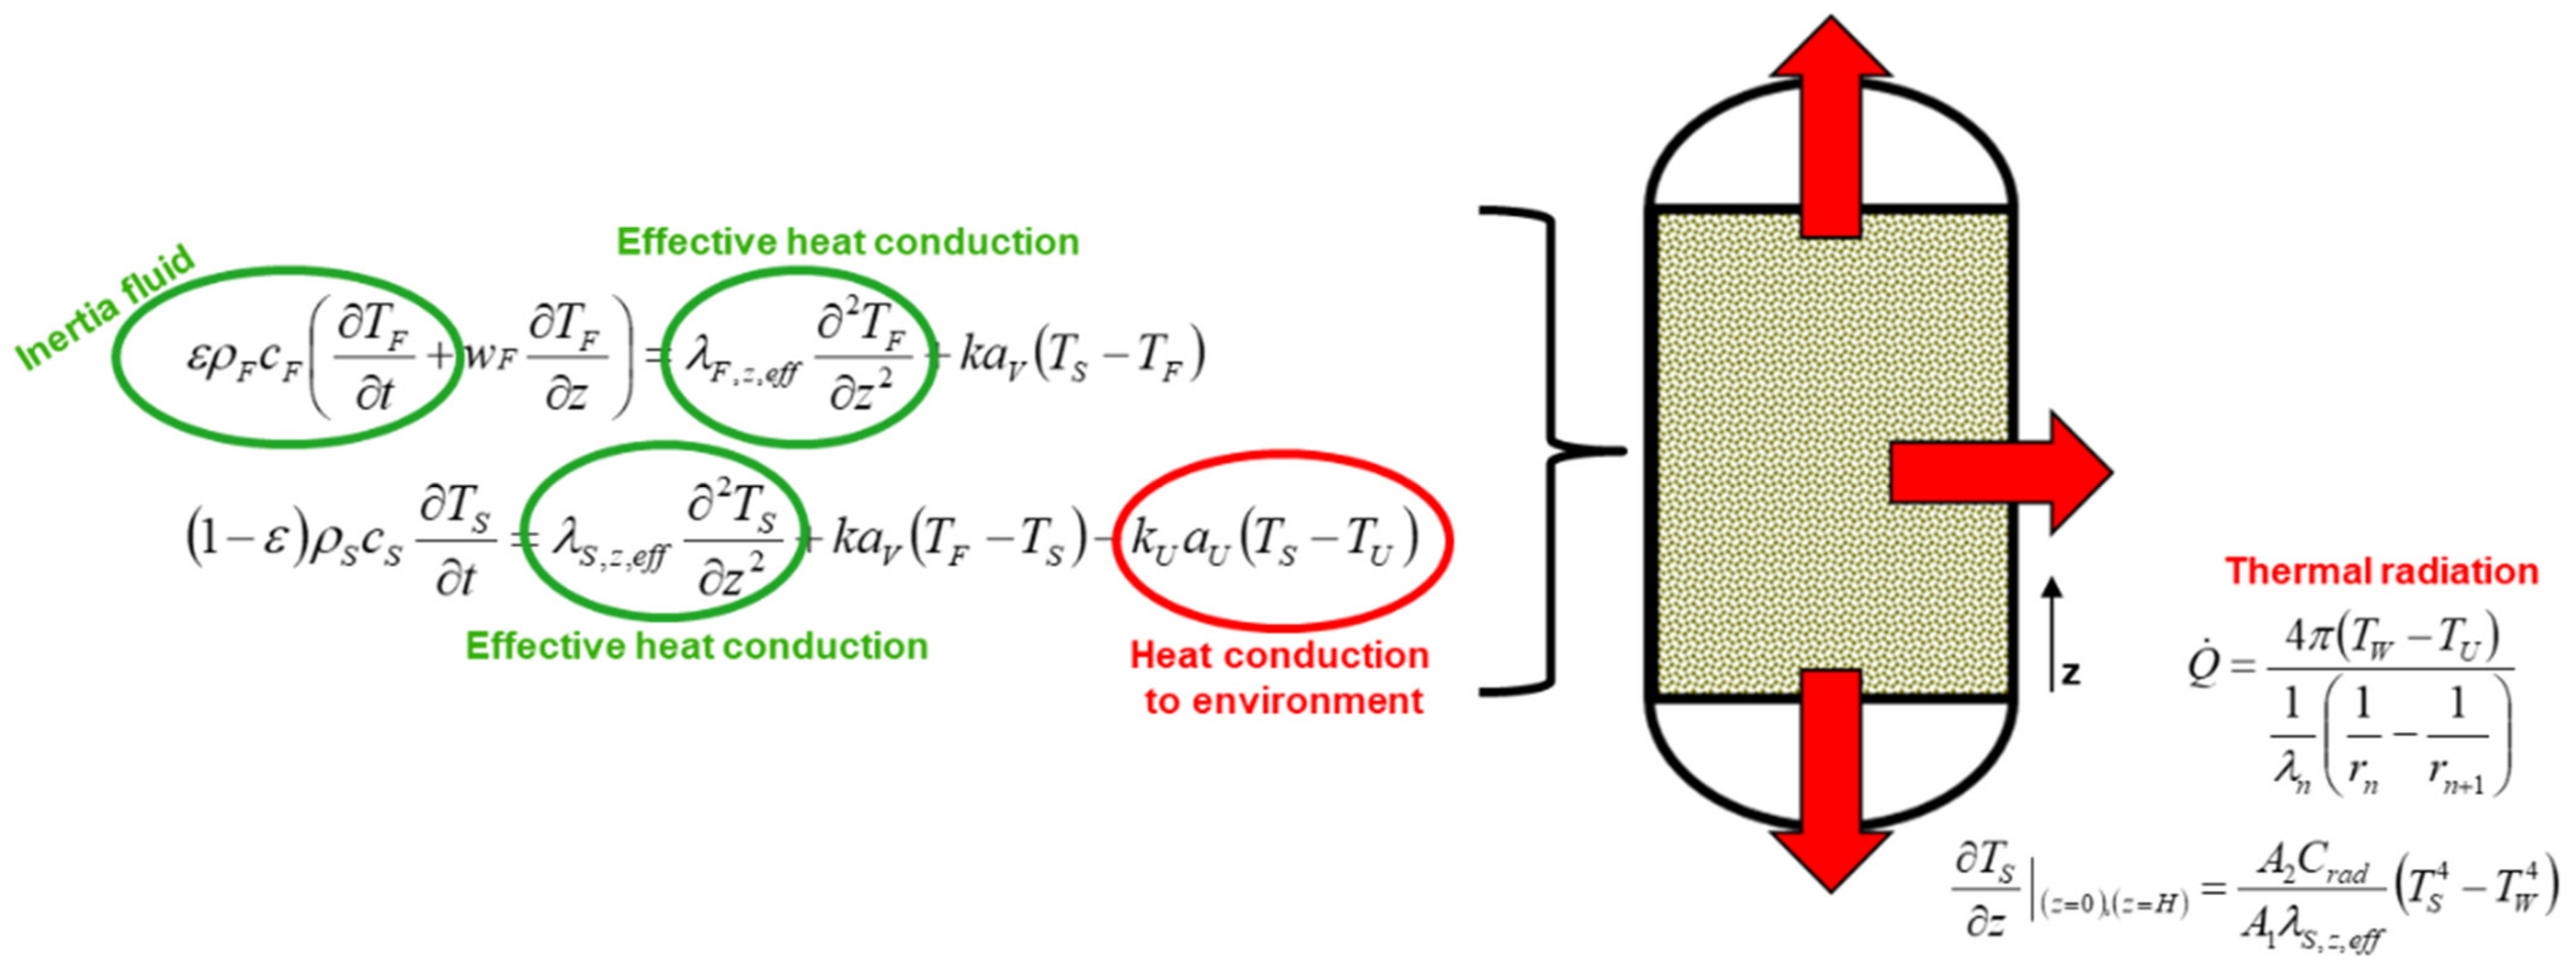
The existing thermal models for the solid media heat storage were expanded. This concerned, among other things, the thermal inertia of the fluid and the effective axial heat conduction in the bed, as well as various heat losses through conduction and radiation. For this purpose, the heat losses due to heat conduction to the environment and due to heat radiation within the heat storage tank were implemented in the existing one-dimensional heterogeneous porosity model, which is described in [17], see Figure 11.

4.2. Detailed Variation Calculations for the Storage Options and Identification of Design Options

4.2.1. Molten Salt Storage

The variation calculations in the area of molten salt storage exclusively concerned concept HRH-HPPH9_indirectly, as this is the only lead concept with molten salt storage. The work aimed to elaborate on efficient and cost-effective molten salt storage.
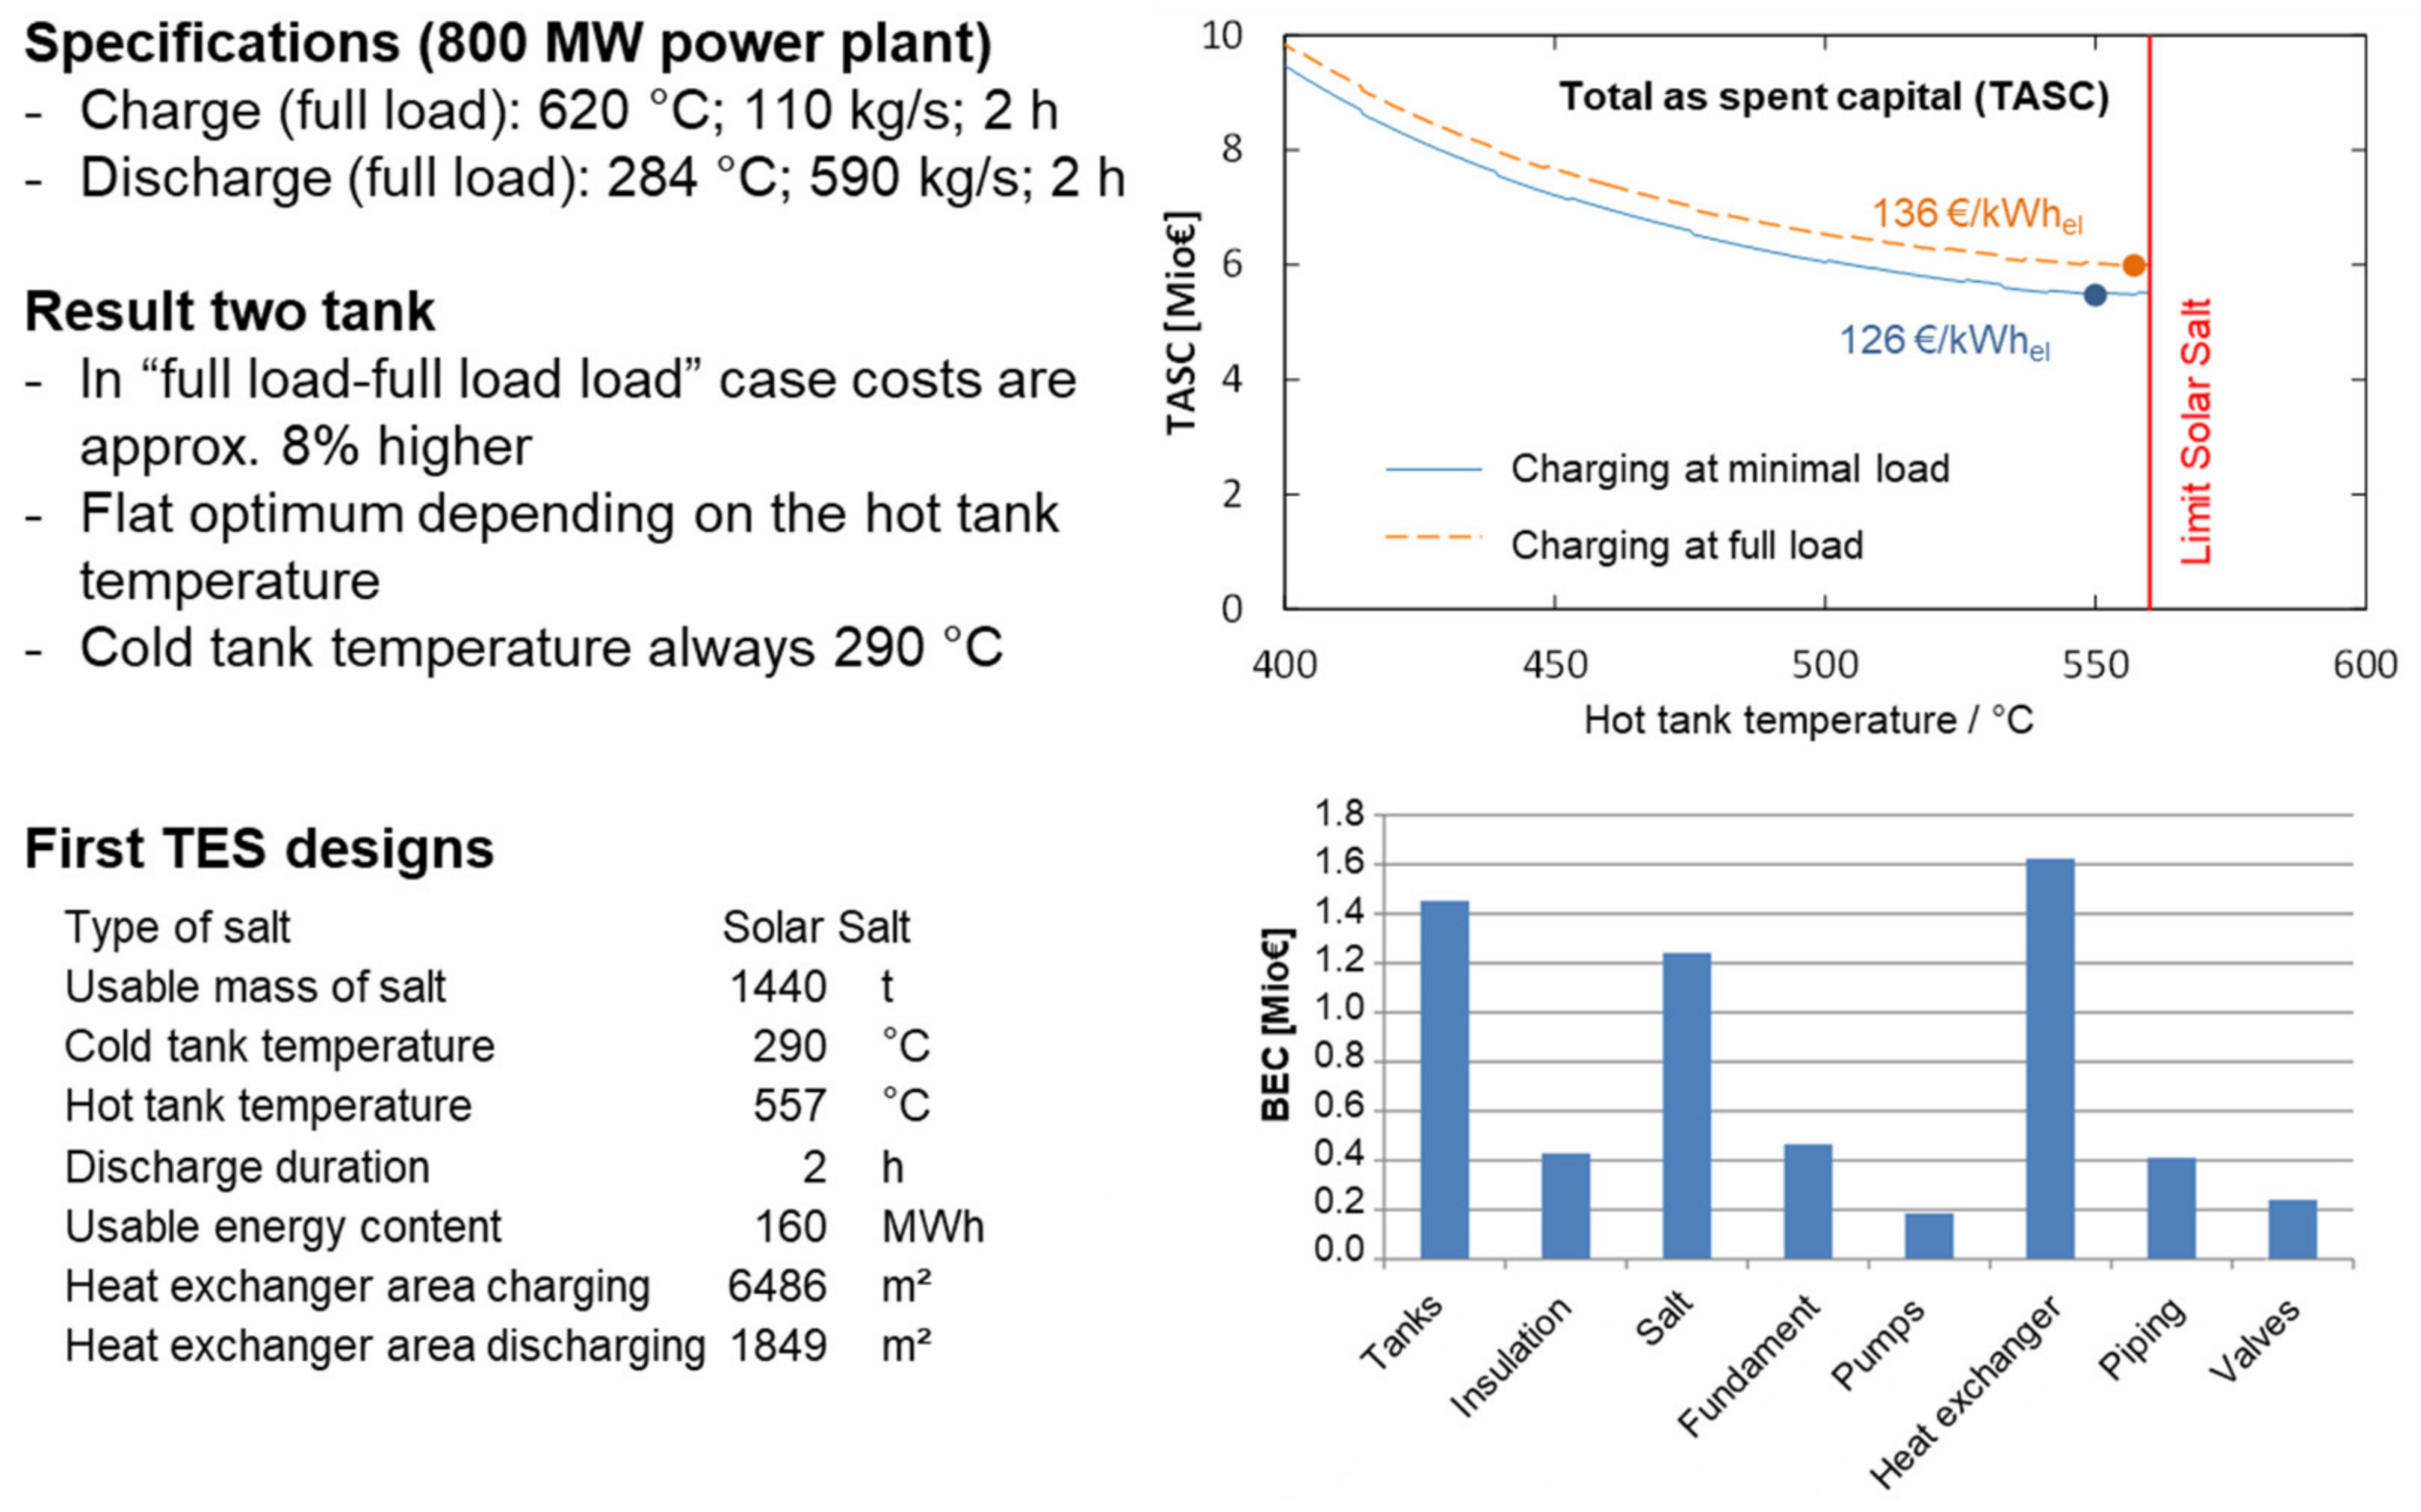
It can be concluded that in the load case, “charging at full load”, approx. 8% higher costs were calculated than in the load case “charging at minimum load”, see Figure 12. The largest cost blocks are the heat exchangers, the tanks, and the salt inventory. The calculation of the costs as a function of the hot tank temperature resulted in a flat optimum.

4.2.2. Ruths Storage

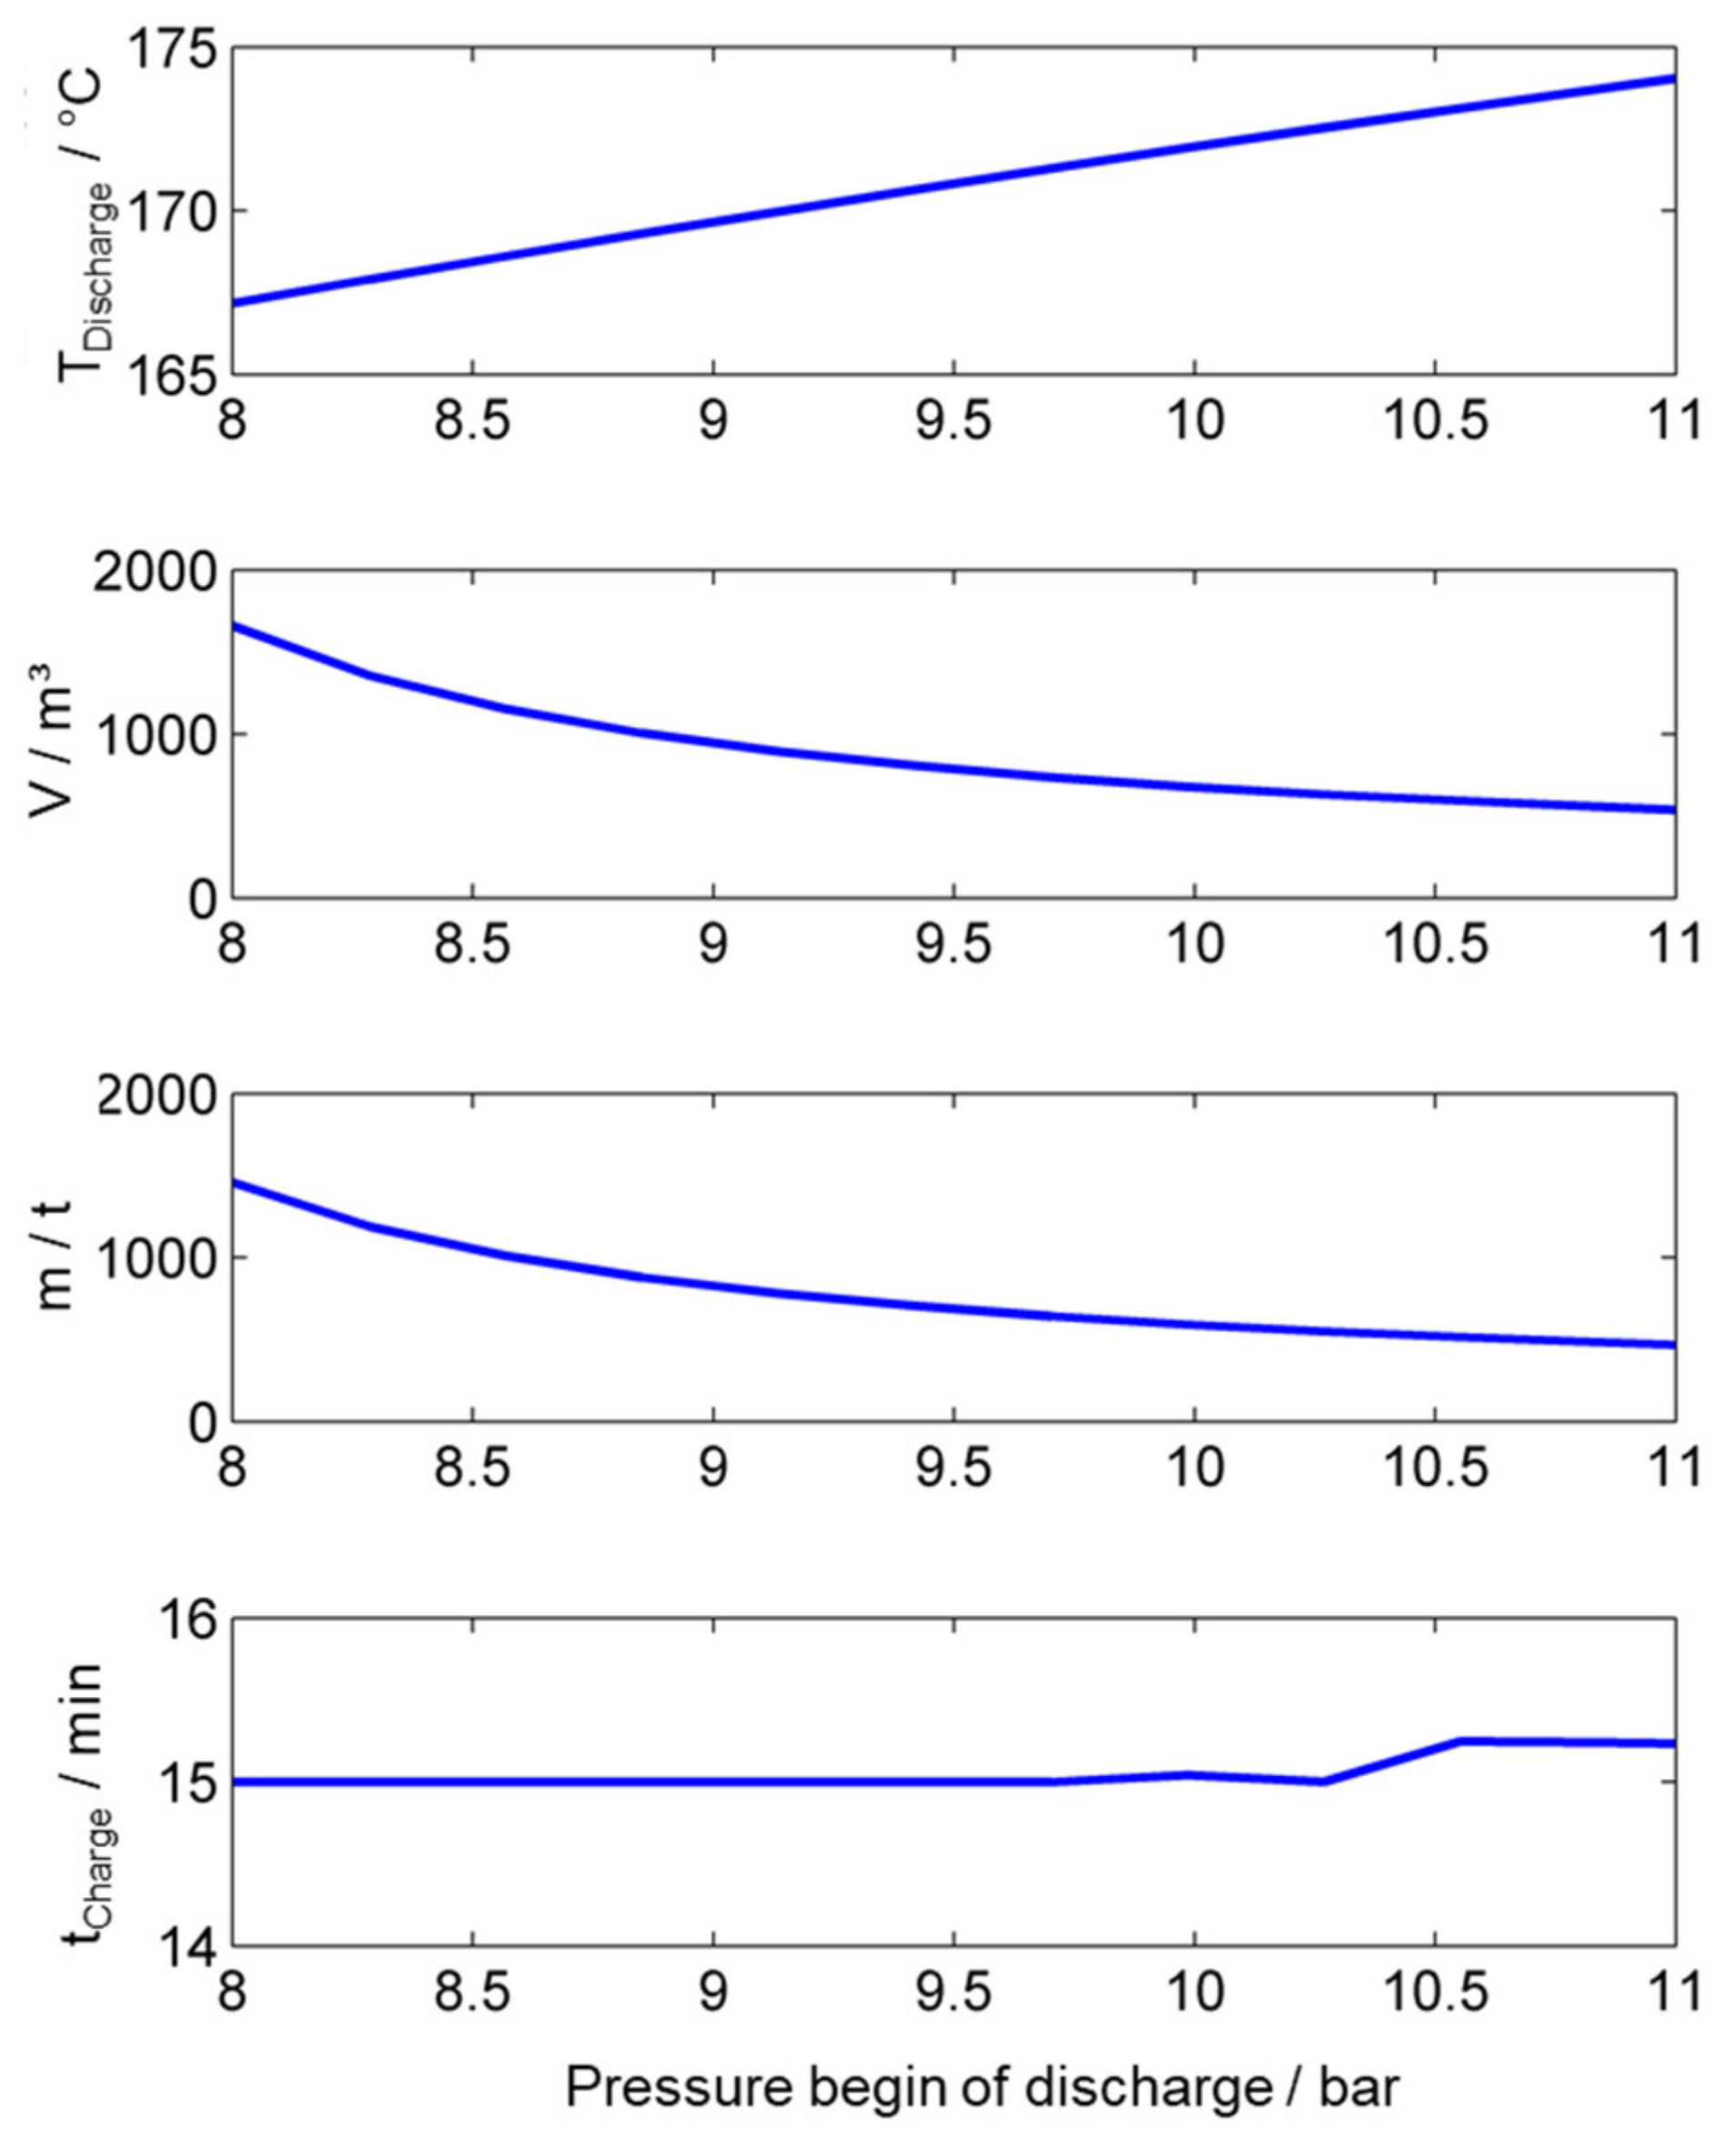
The aim of this section is to identify promising design options in terms of thermal and cost-efficiency. The parameter studies performed are based on the detailed models developed in Section 4.1.2. The boundary conditions and assumptions used are based on a modern 800 MW power plant. The relevant steam parameters (pressures, temperatures, and mass flows) for the charging and discharging steam originate from system simulations in Section 4. The operating mode for the following calculations was assumed to be charging at minimum load and discharging at full load for 15 min. First, the discharge temperature, storage volume, and mass were calculated for variable pressures of the charged storage tank, see Figure 13.
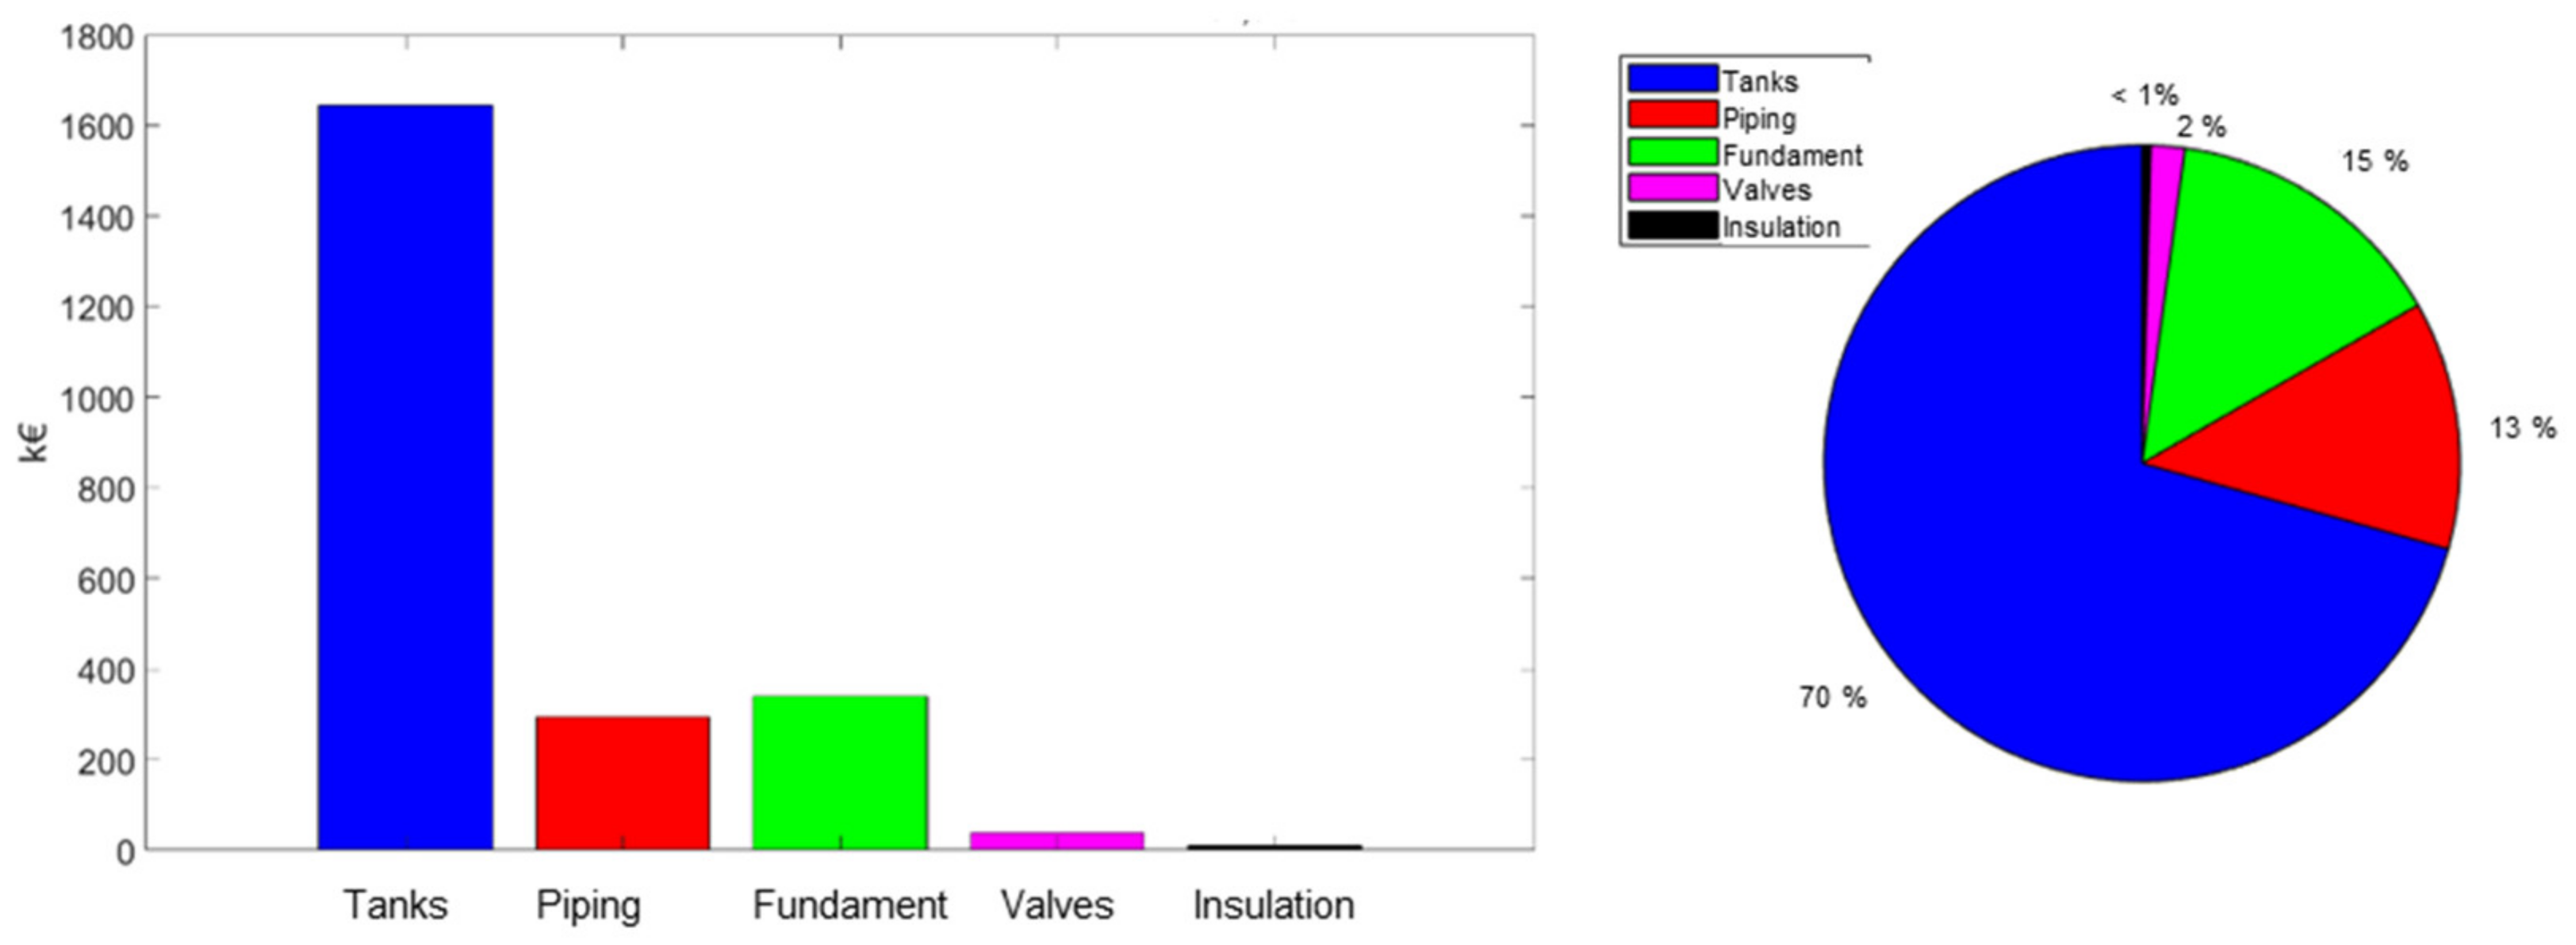
These calculations show that higher pressures in the storage at the start of discharging (or higher final charging pressures) result in lower storage volumes. The maximum final charging pressure is limited by the vapor pressure of the charging stream. Based on these figures, the total costs of the storage system were calculated. The costs shown in Figure 14 are based on the following assumptions:
  • Number of tanks: 2;
  • Pipeline length: 20 m (each for charging and discharging line);
  • Pipeline diameter (loading: 0.61 m, unloading: 0.81 m);
  • 1 valve per vessel;
  • Foundation for horizontal tanks with H/D = 5.
Related to the discharge capacity, this results in costs for the entire storage system of EUR 817 BEC/kWhel,dis.
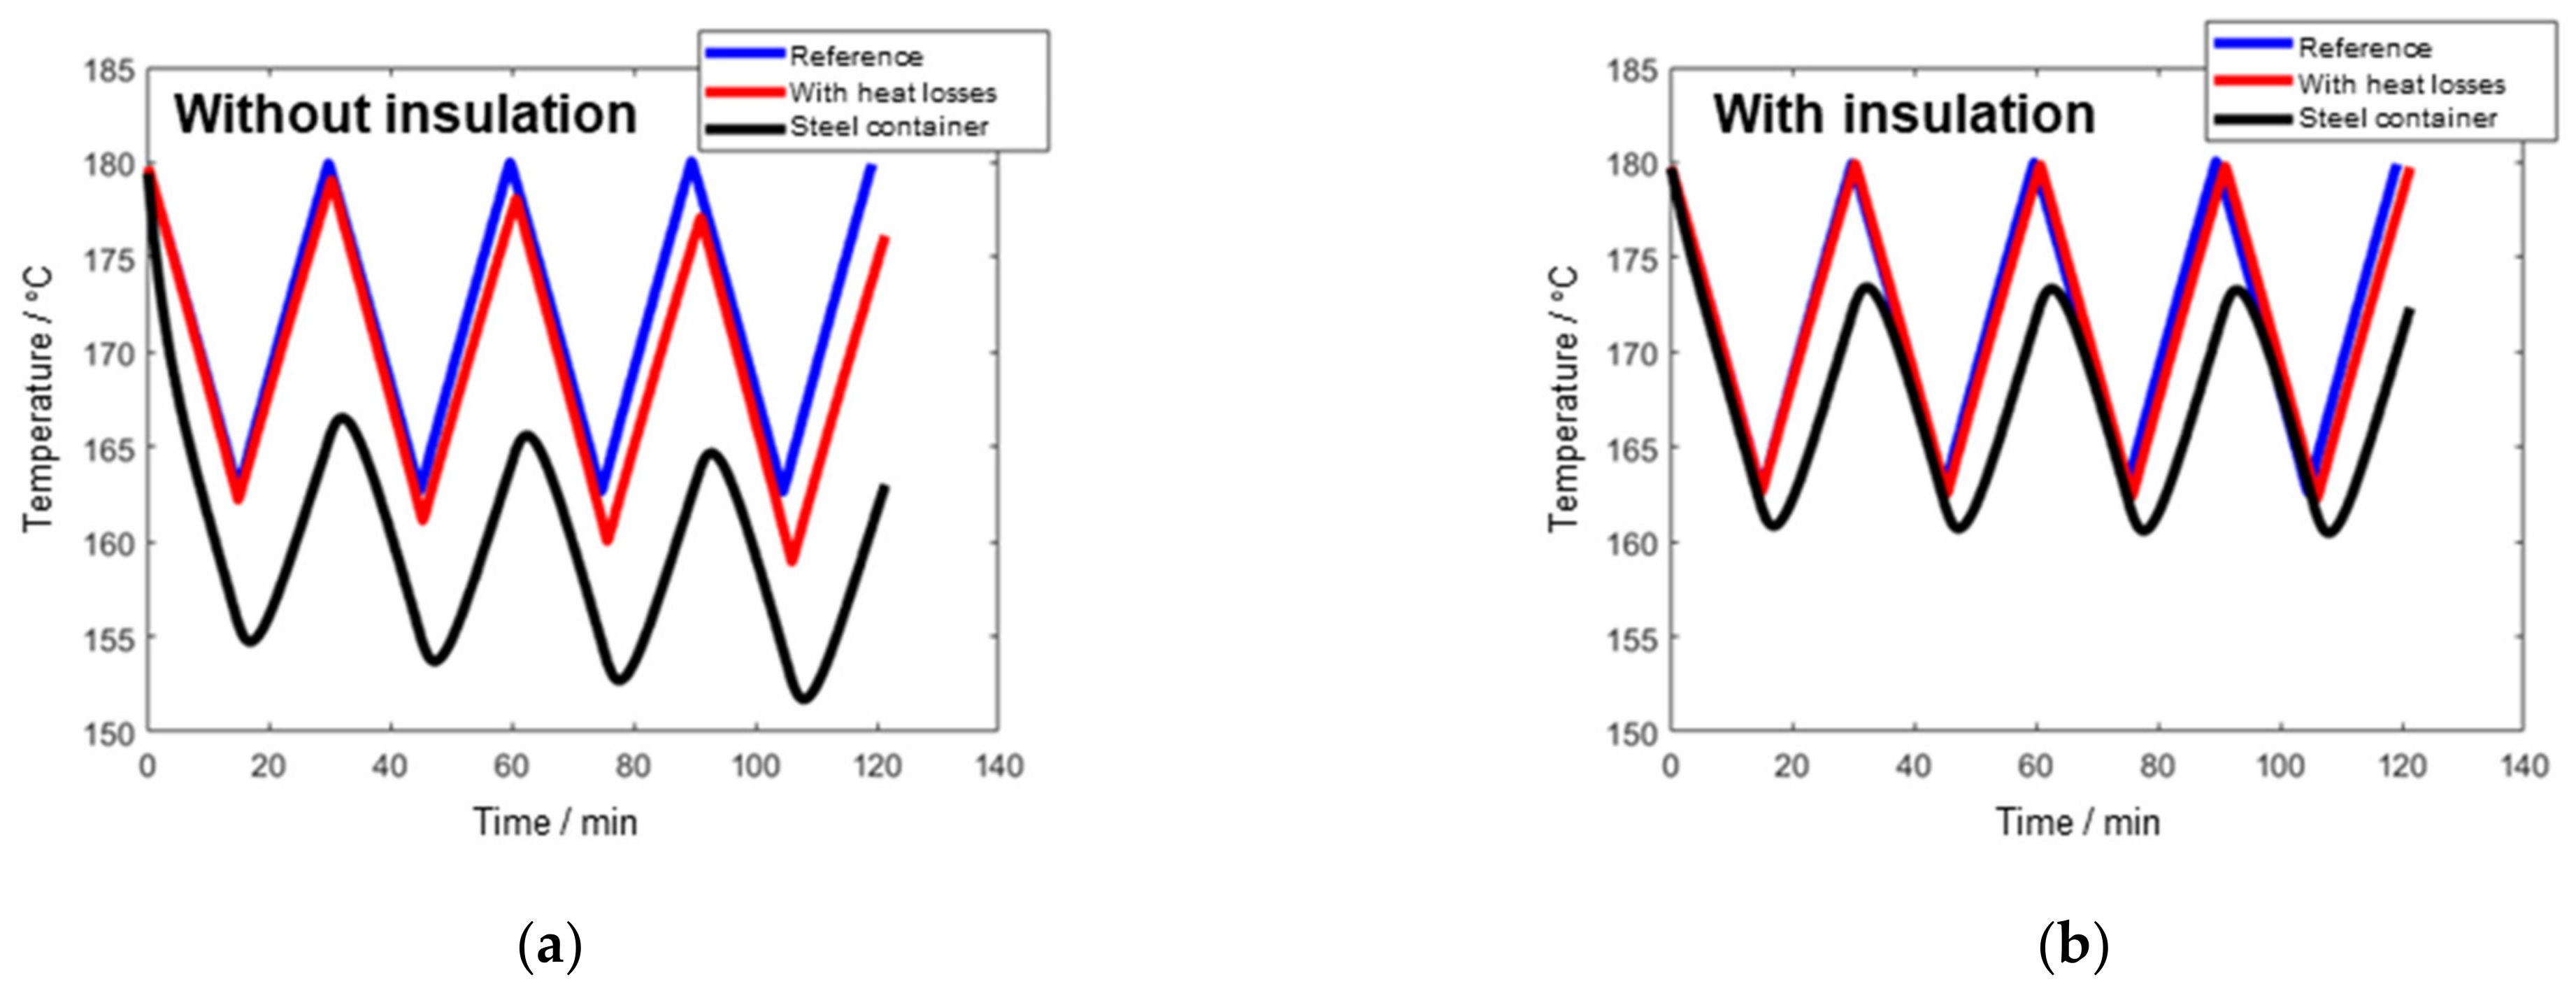
Furthermore, the cyclic behavior of the storage temperature was investigated for several successive storage cycles, see Figure 15. A storage system without heat losses was assumed as a reference. This reference was compared with the behavior of the storage system considering the heat losses and the thermal mass of the steel tank, respectively, with and without installed thermal insulation.
In the “without insulation” case, there is a cyclical drop in the storage tank temperature, which would have to be compensated for by external auxiliary heating or other control measures in a longer-lasting operating case. Installed thermal insulation minimizes the temperature loss compared to the reference case as well as the cyclic temperature loss, as shown.
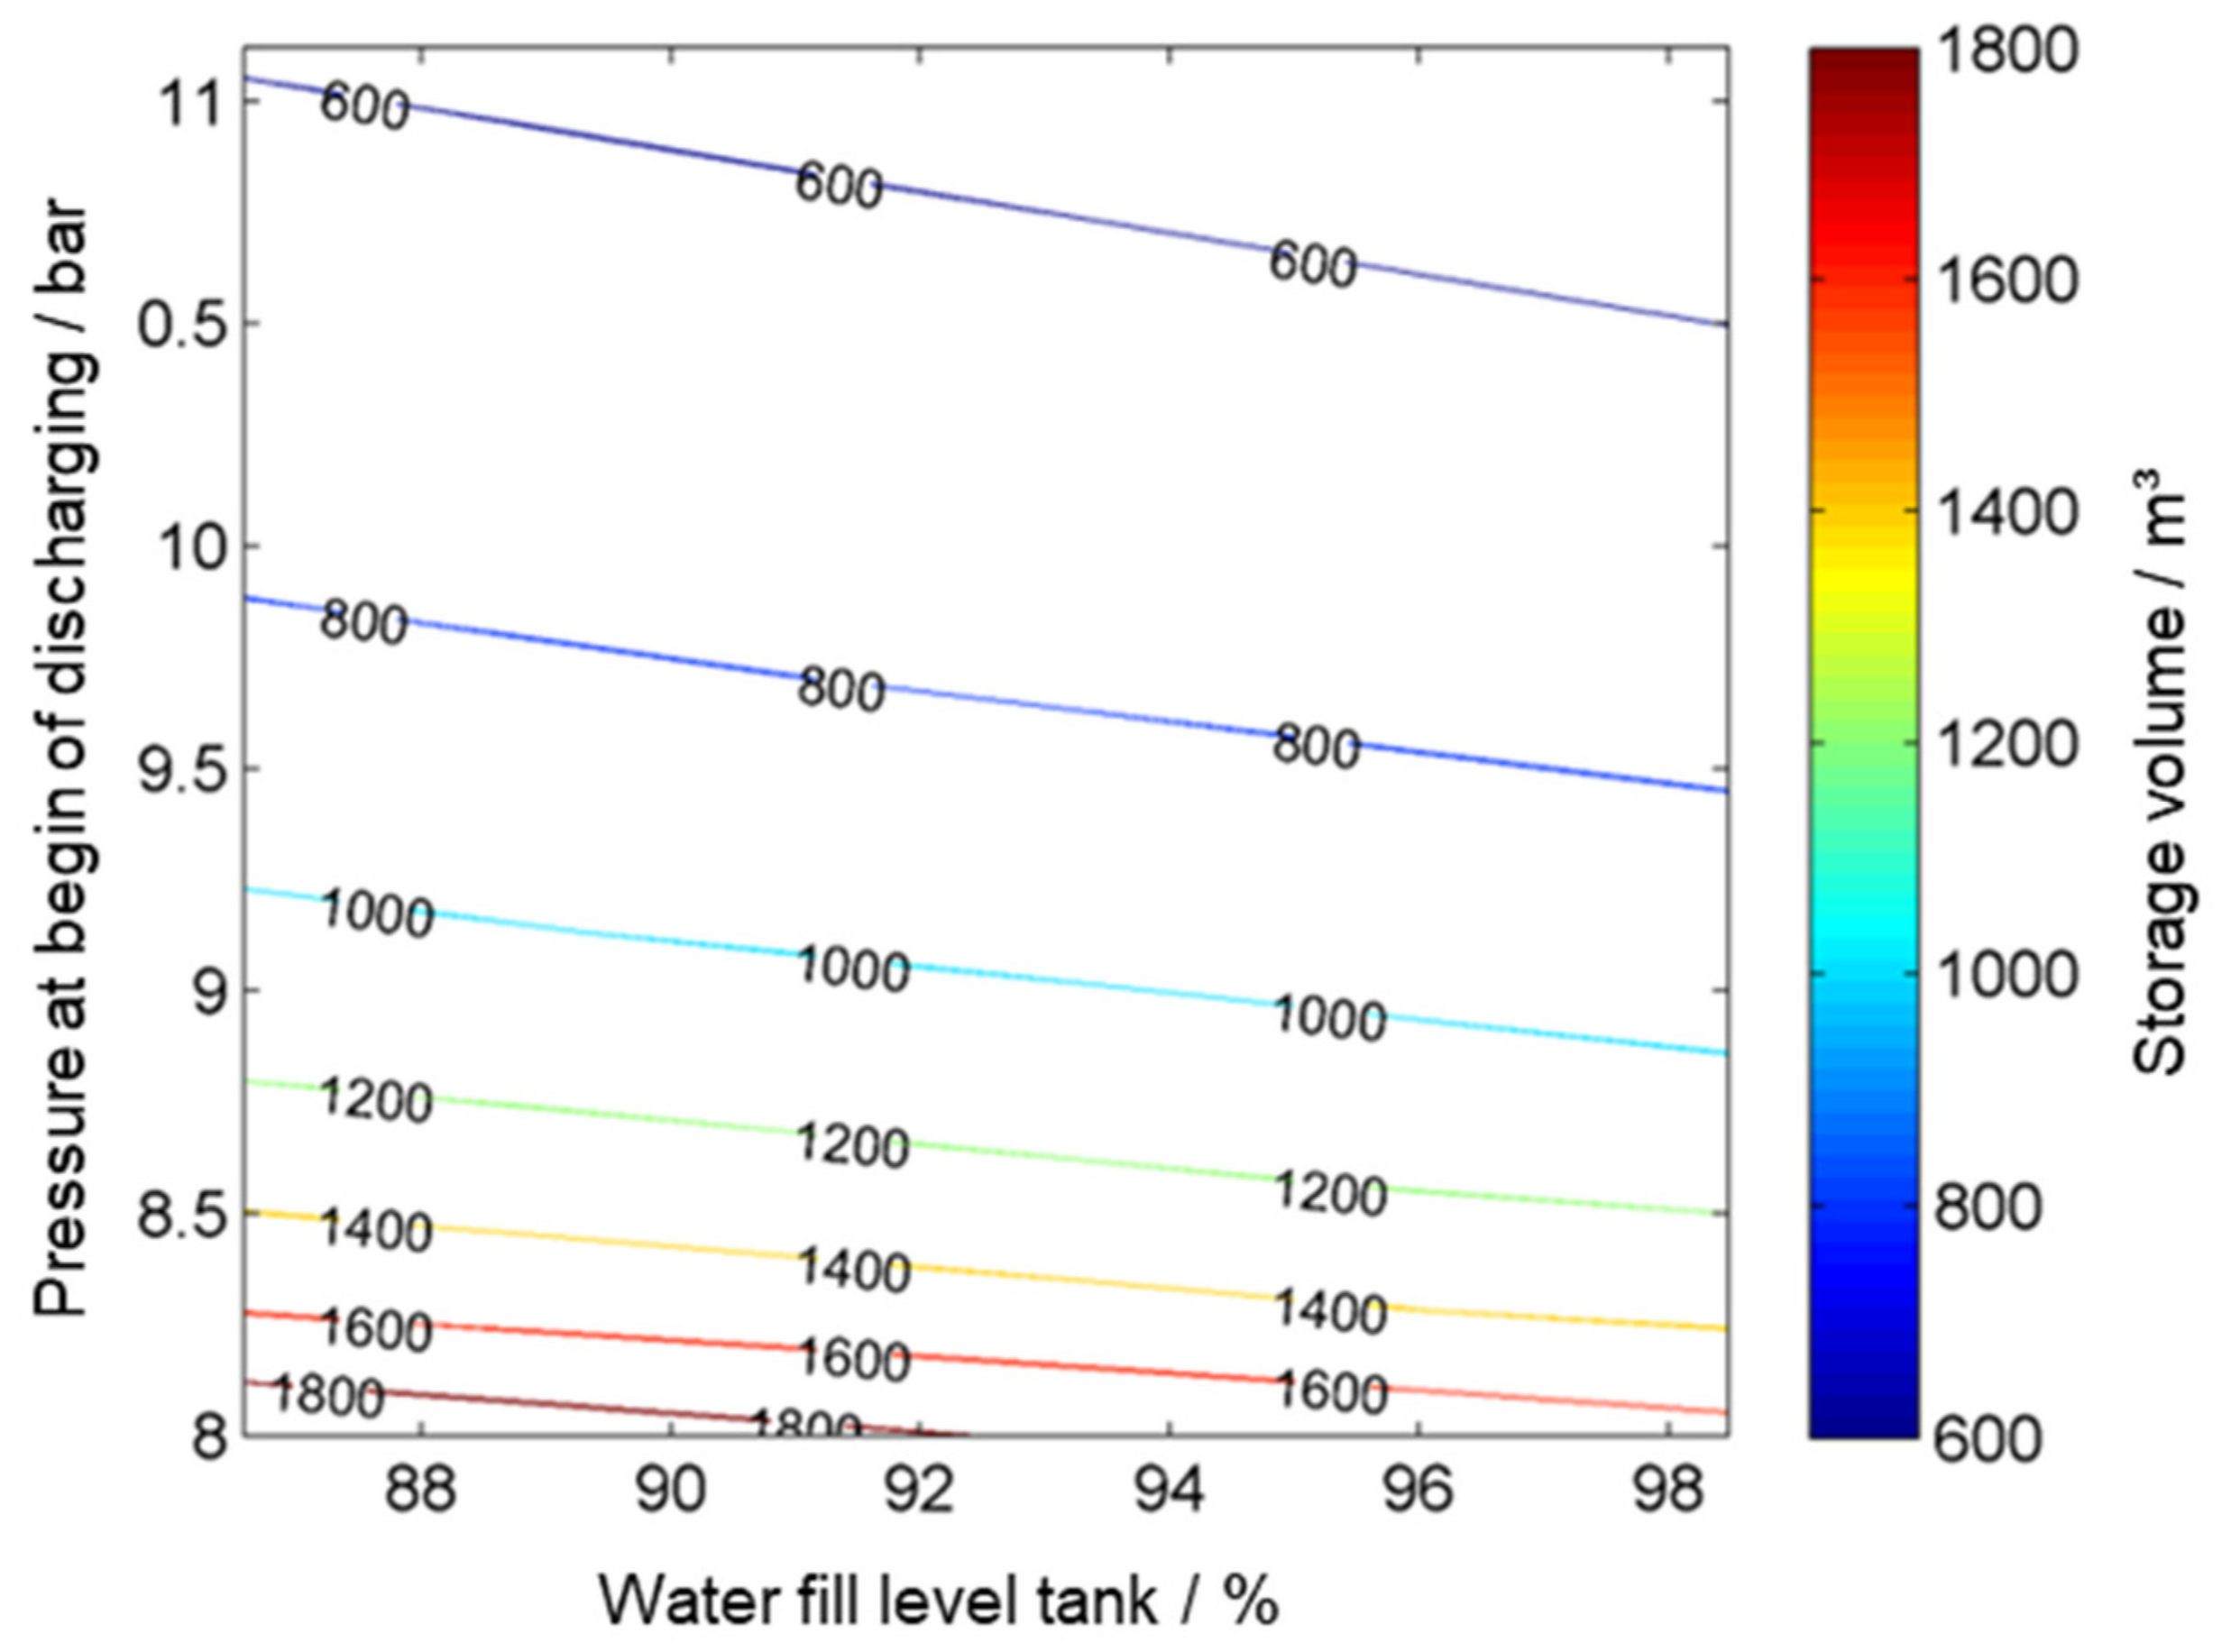
Subsequently, the relationship between the water level at the start of discharge and the required storage volume was investigated, see Figure 16.
A reduction in the storage volume can therefore be achieved by increasing the water level at the start of discharge. The greater the pressure in the storage tank at the start of discharge, the greater the influence of the filling level on the storage volume. Accordingly, there is also a cost reduction by increasing the water level.

4.2.3. Solid Media Heat Storage

The variation calculations in the area of solid media heat storage exclusively concerned the Flue gas-Air_indirectly concept, as this is the only lead concept with solid media heat storage. The aim of the work was to elaborate efficient and cost-effective solid media heat storage on the basis of the detailed model. The chosen procedure was to carry out broad variation studies with regard to storage mass, container geometry, and inventory options based on the specifications from the system simulations, see Section 3, namely charging at minimum load and discharging at full load, and the economic evaluation, see Section 6, namely a discharging duration of 2 h. The evaluation essentially concerned temperatures, costs, and pressure loss.
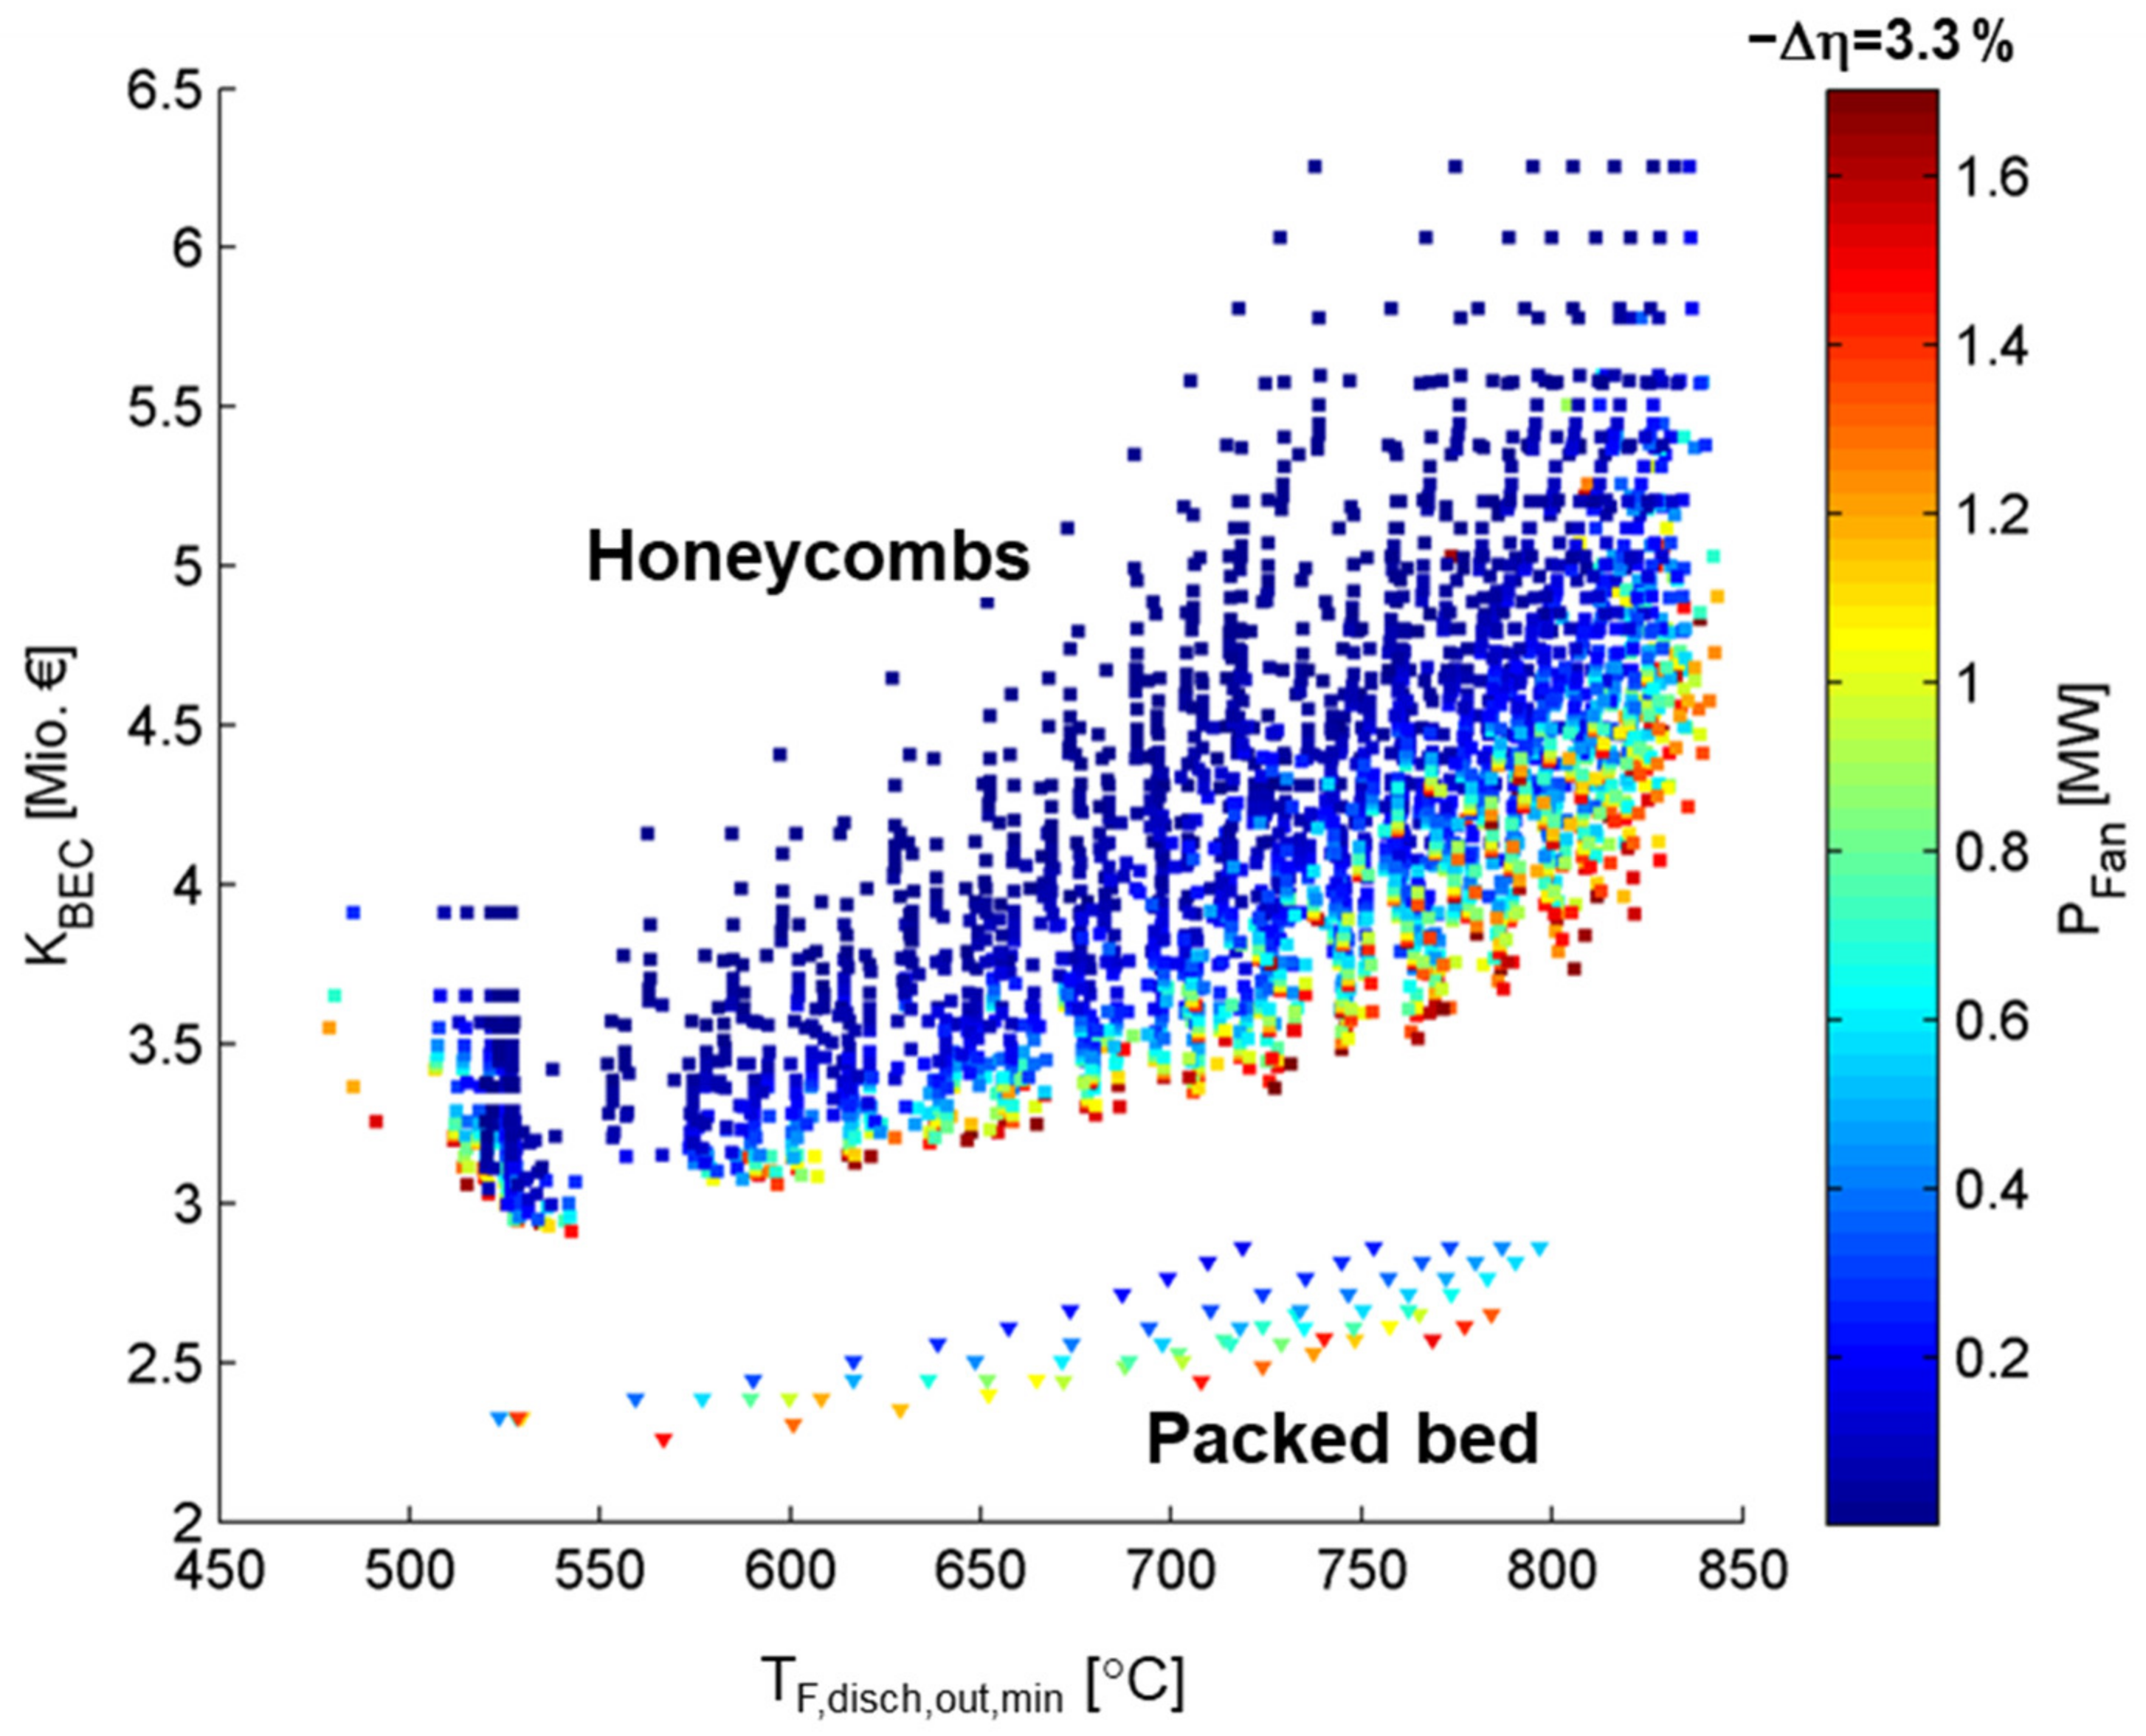
Figure 17 shows TES component costs of numerous storage designs for different fluid temperatures at the end of the discharge process, again varying different container geometries and inventory options, as well as their mass. The colored scaling represents the blower power to be provided for the different setups.
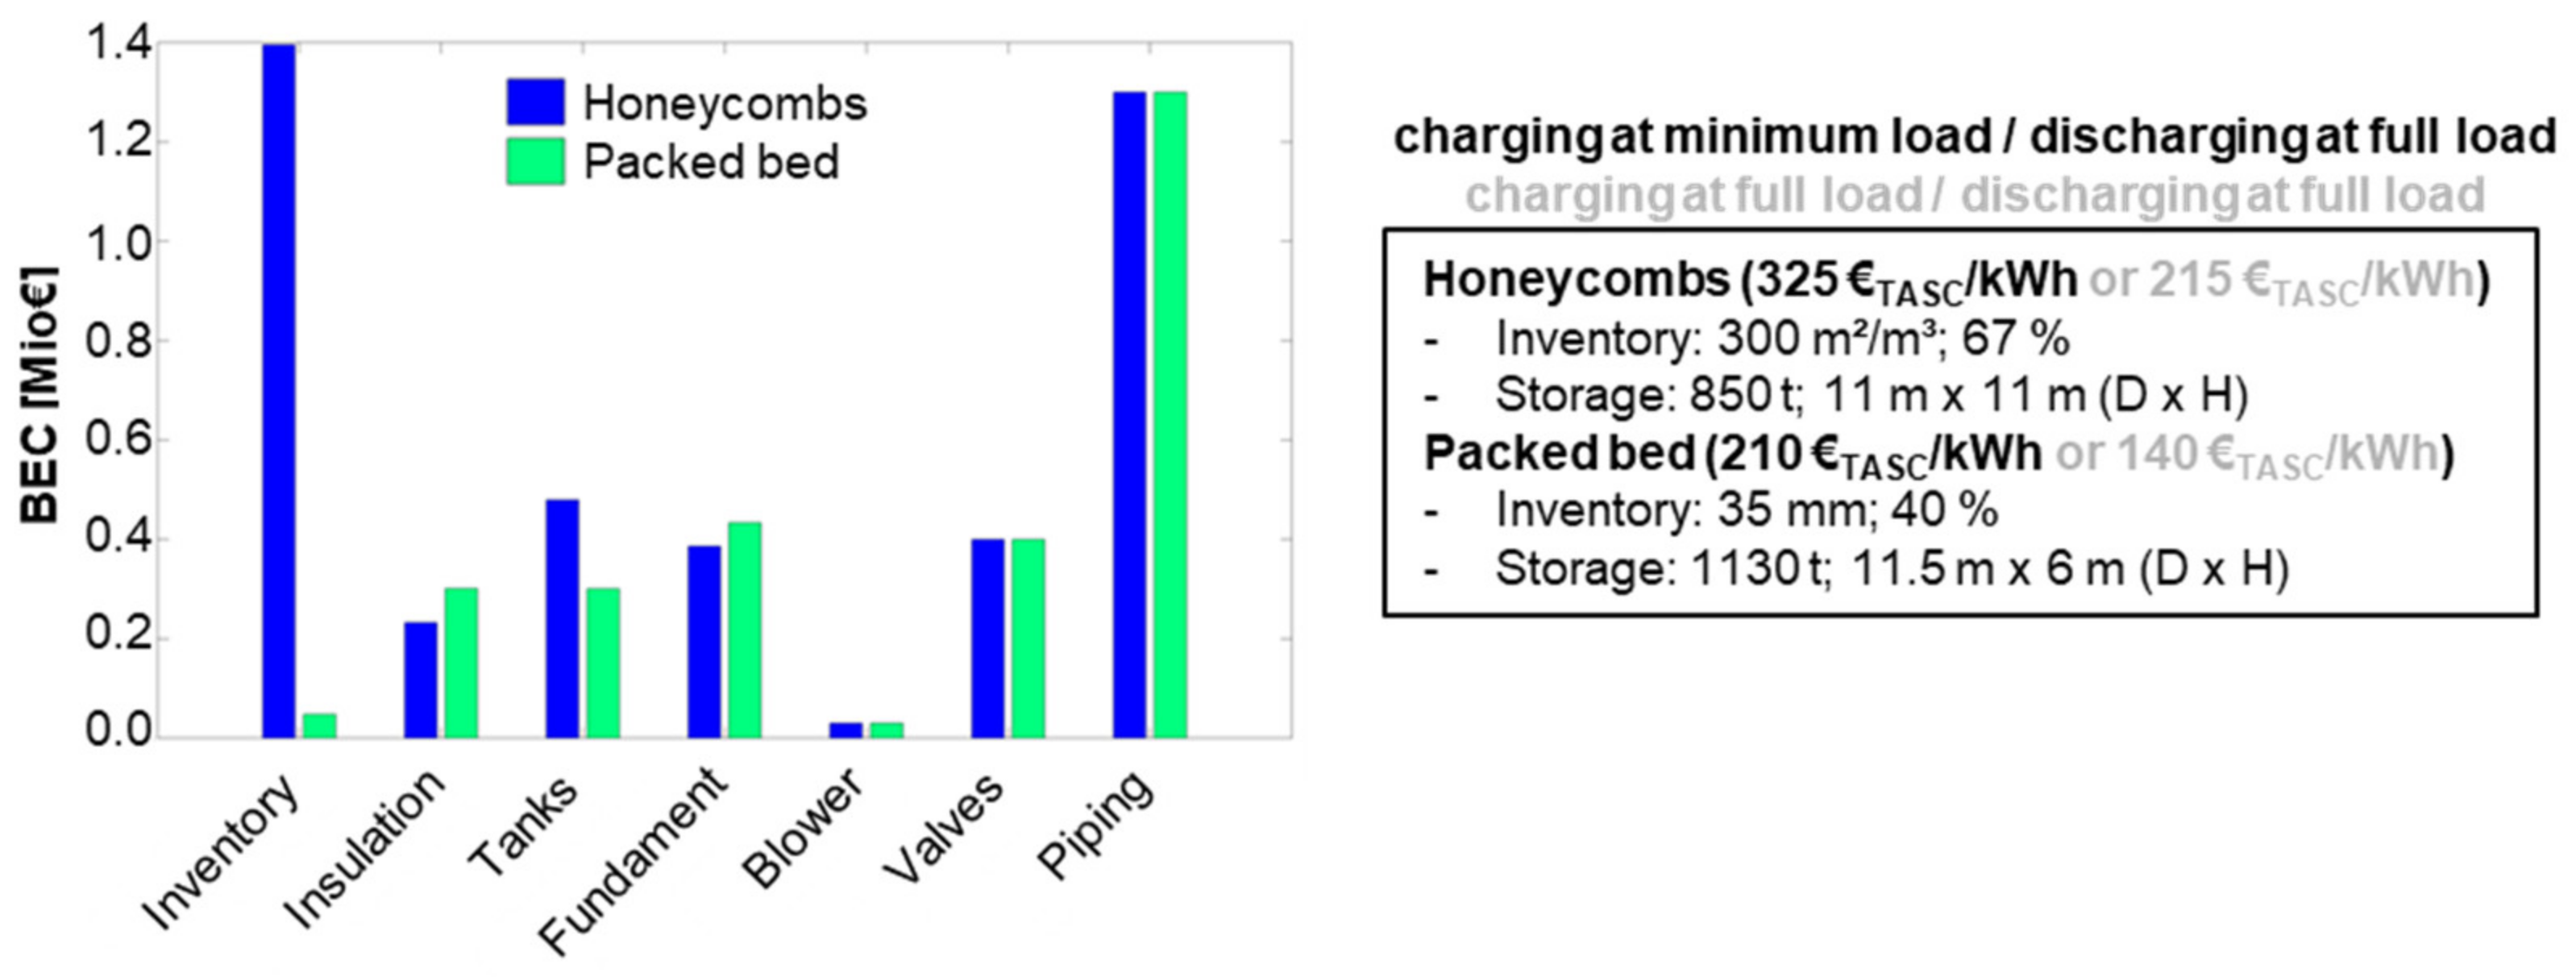
In summary, it can be stated that increasing requirements for temperature constancy result in a significant increase in costs. Increasing requirements for pressure losses, on the other hand, only lead to a moderate increase in costs. It also shows that significantly lower costs can be achieved with basalt packed bed as an inventory. As an example, a TES with a discharge outlet temperature always above 700 °C during the discharge period on the basis of commercially available honeycomb bodies equals investment costs of EUR 4.3 million, whereby the required blower power is 0.22 MW, and on the basis of natural stone fills to EUR 2.8 million, whereby a blower power of 0.47 MW is required. This corresponds to an efficiency loss of 0.5 and 1%, respectively. Further key data on the designs and the breakdown of the cost structure can be seen in Figure 18. Here, in addition to the probable operating mode “charging at minimum load/discharging at full load”, the case “charging at full load/discharging at full load” was also examined.
The conclusion of the investigations is that there is a wide range of solutions with high efficiency and low costs. Honeycombs cause significantly lower pressure losses; basalt-packed beds significantly lower costs. With the latter, however, a check for temperature stability is necessary, which was carried out in the project and certified negatively.

4.3. Experimental Investigation of Critical Design Aspects of a Promising Design Option for Solid Media Heat Storage (Flue Gas-Air_indirectly)

4.3.1. Preparation of Test Facility HOTREG

The available test facility for the solid media heat storage technology was the HOTREG in Stuttgart. The aim of the work on this research facility within the framework of FLEXI-TES is to demonstrate a solid media heat storage system in the flue gas path of a hard coal-fired power plant. The experimental setup is shown in Figure 19. Air is used as the heat transfer medium. The inventory, with a total weight of approximately 3 t, consists of honeycomb bodies made of ceramics, which were stacked in 6 layers with a diameter of approximately 1.5 m to a total height of 1.8 m. The inner insulation with an average insulation thickness of approx. 1.5 m was used. The internal insulation, with an average thickness of 100 mm, was made with ceramic fiber mats with a maximum continuous application temperature of 1600 °C. These mats are resistant to acids and alkalis.
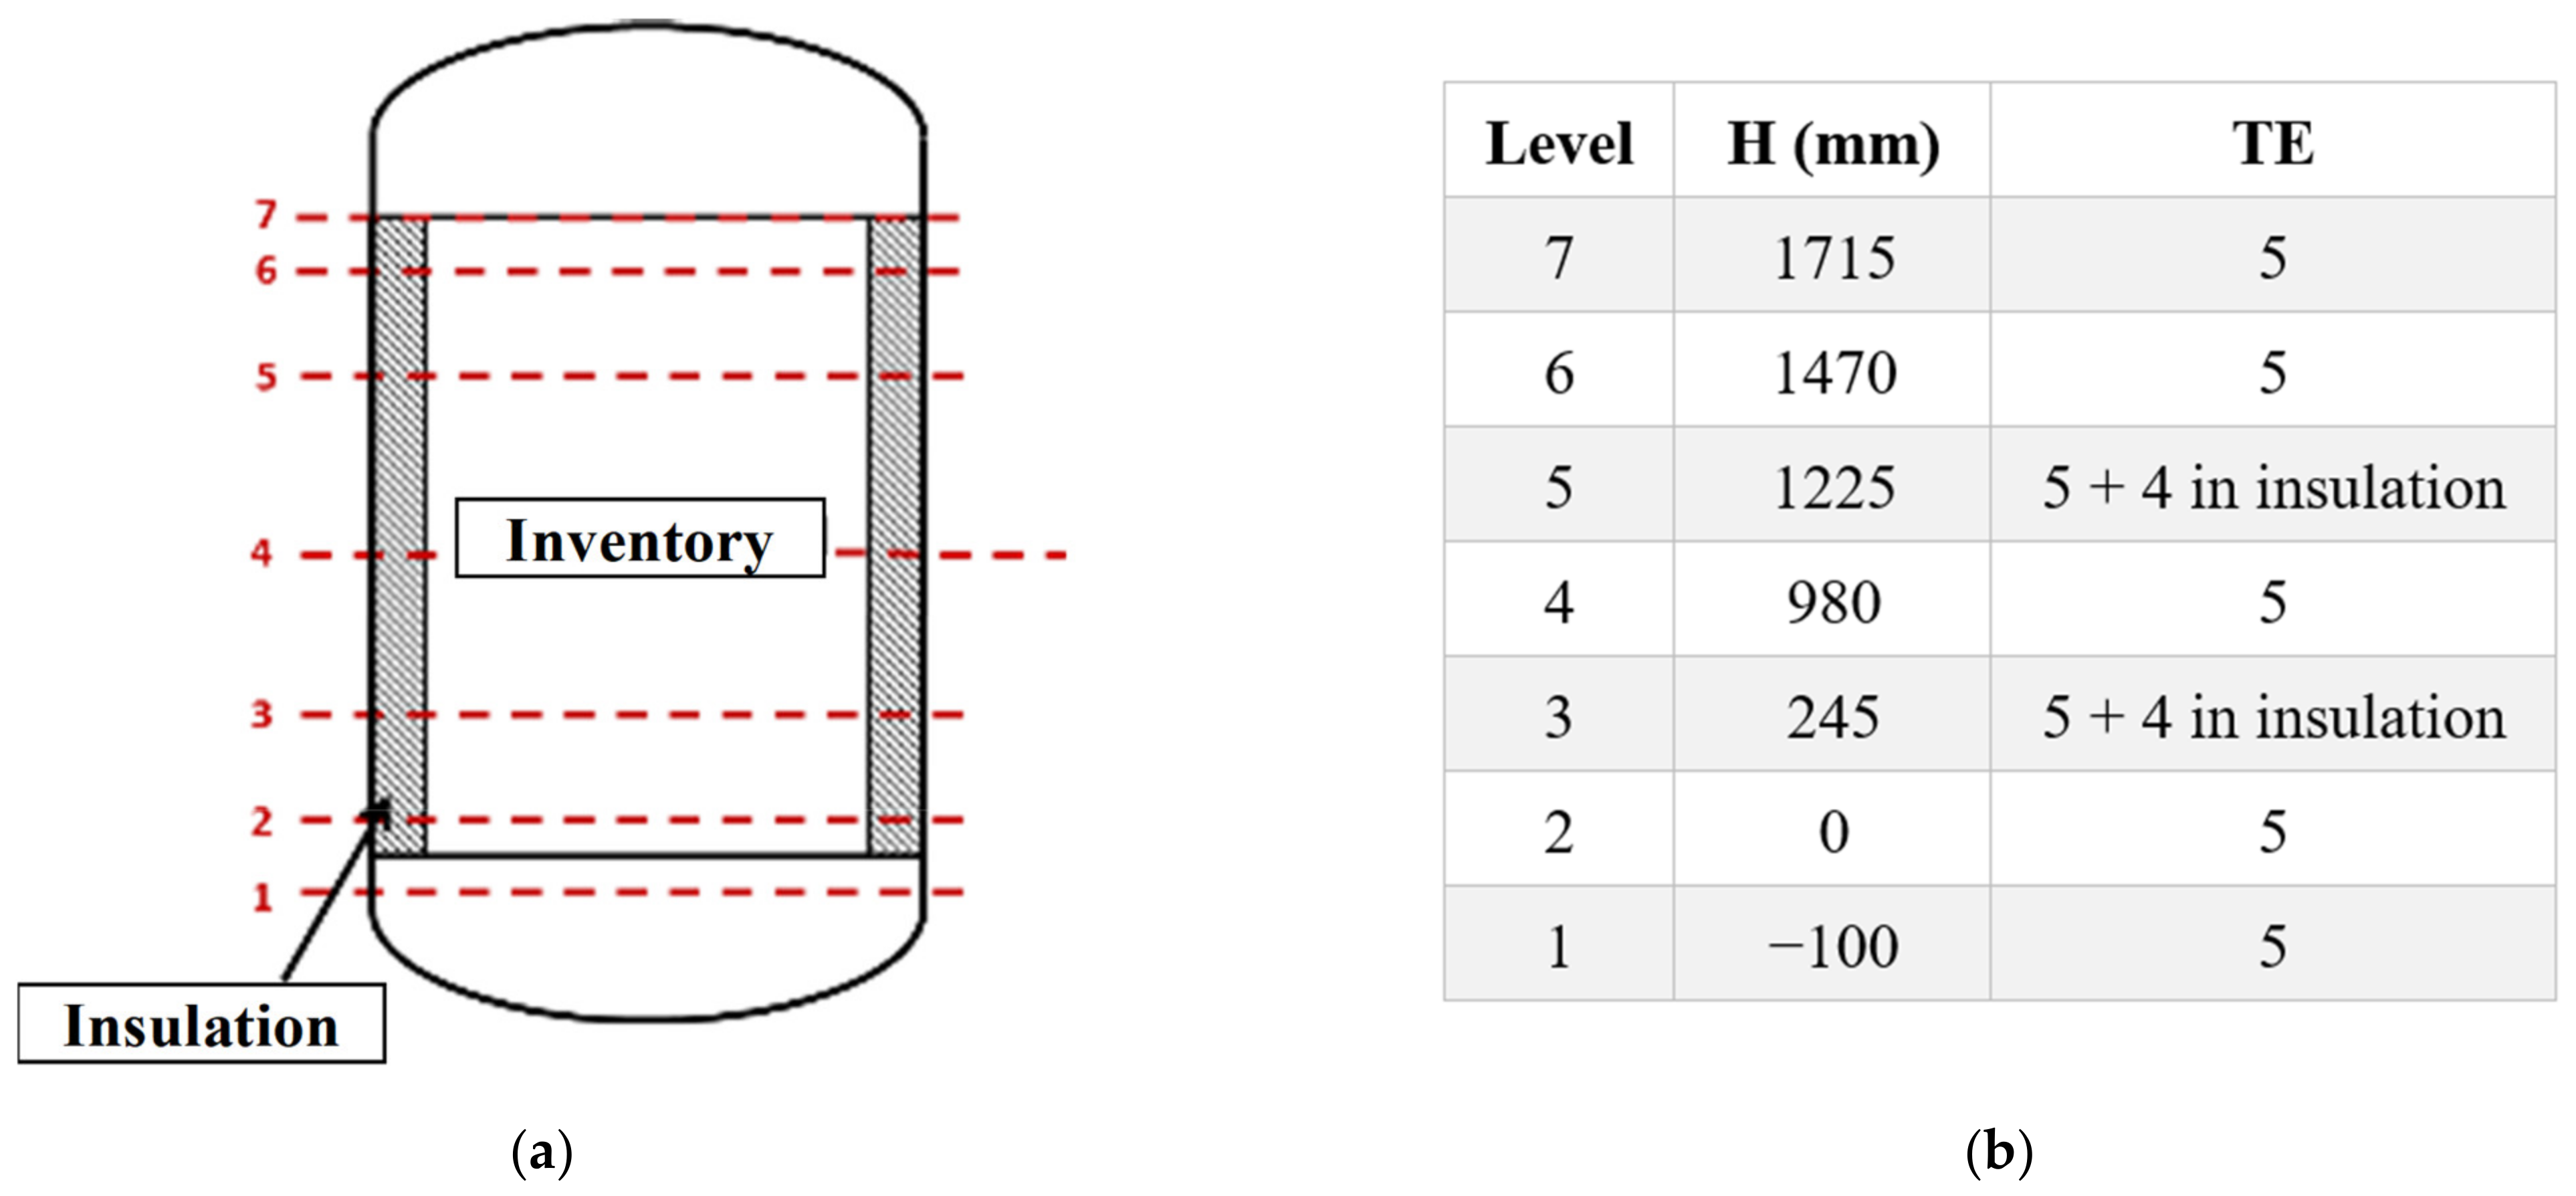
For the exact determination of the process temperatures, the inventory of the storage facility was equipped with a total of 35 thermocouples (TE) of the “type K”, which were placed inside and near the storage material. A total of 7 measuring levels with 5 TE each were located along the entire length of the inventory. Furthermore, 2 measurement levels with 4 TE each were placed within the insulation, cf. Figure 20. Levels 2 to 6 were located within the inventory material, and levels 1 and 7 were immediately below or above it. The TEs of each level were distributed in a circle within the inventory.
The pressure drop of the air along the bed was measured by the differential pressure between level 7 and level 1. The differential pressure sensor has a range of −500 Pa to 500 Pa with a measurement error of 0.5%.

4.3.2. Experimental Investigation and Validation

The focus of the experimental investigations was on the validation of simulations for the developed lead concept on the basis of the determined storage inventory as well as the identification of design-critical aspects. For this purpose, the thermal storage model developed in the project was used, which was extended with regard to test system-specific effects. These model extensions include, on the one hand, a detailed representation of the thermal insulation structure and, on the other hand, the consideration of heat loss paths caused by internal support structures on the liner plate within the hot-side distribution cover.
The validation simulations were carried out on the basis of a series of tests defined in advance (see Table 1), whereby the aim was to achieve thermal similarity with regard to large-scale storage systems. The measured time-dependent storage inlet variables (mass flow, temperature) were used as boundary conditions for the extended thermal storage model. The charging and discharging durations selected in the test matrix correspond to the maximum possible periods of time during which the storage bed is flowed through. Due to start-up and shut-down processes within the pilot plant and safety-related restrictions, charging and discharging times are sometimes shorter.
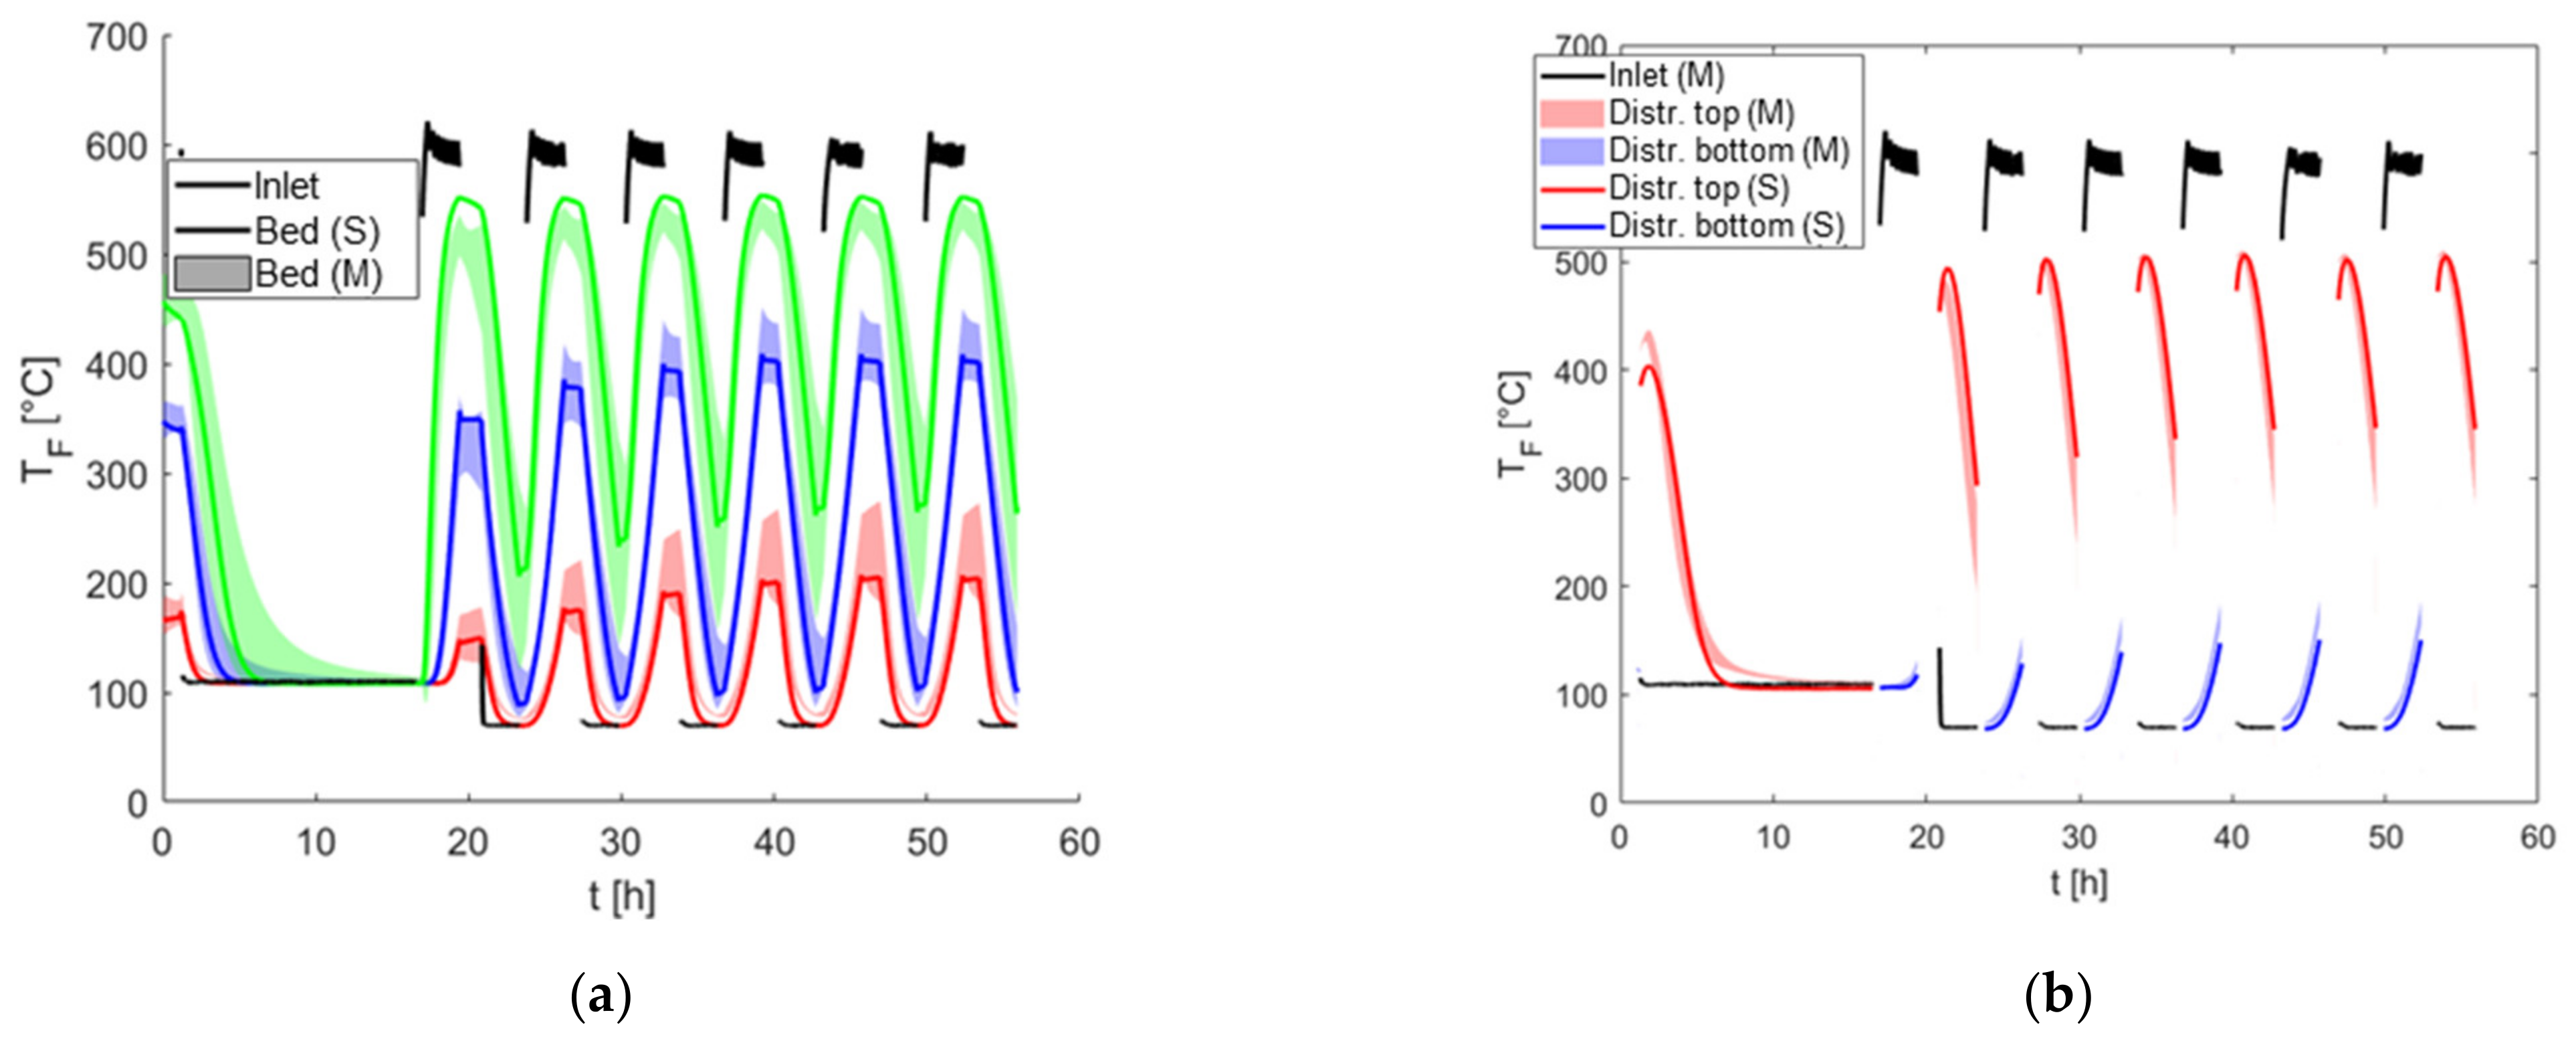
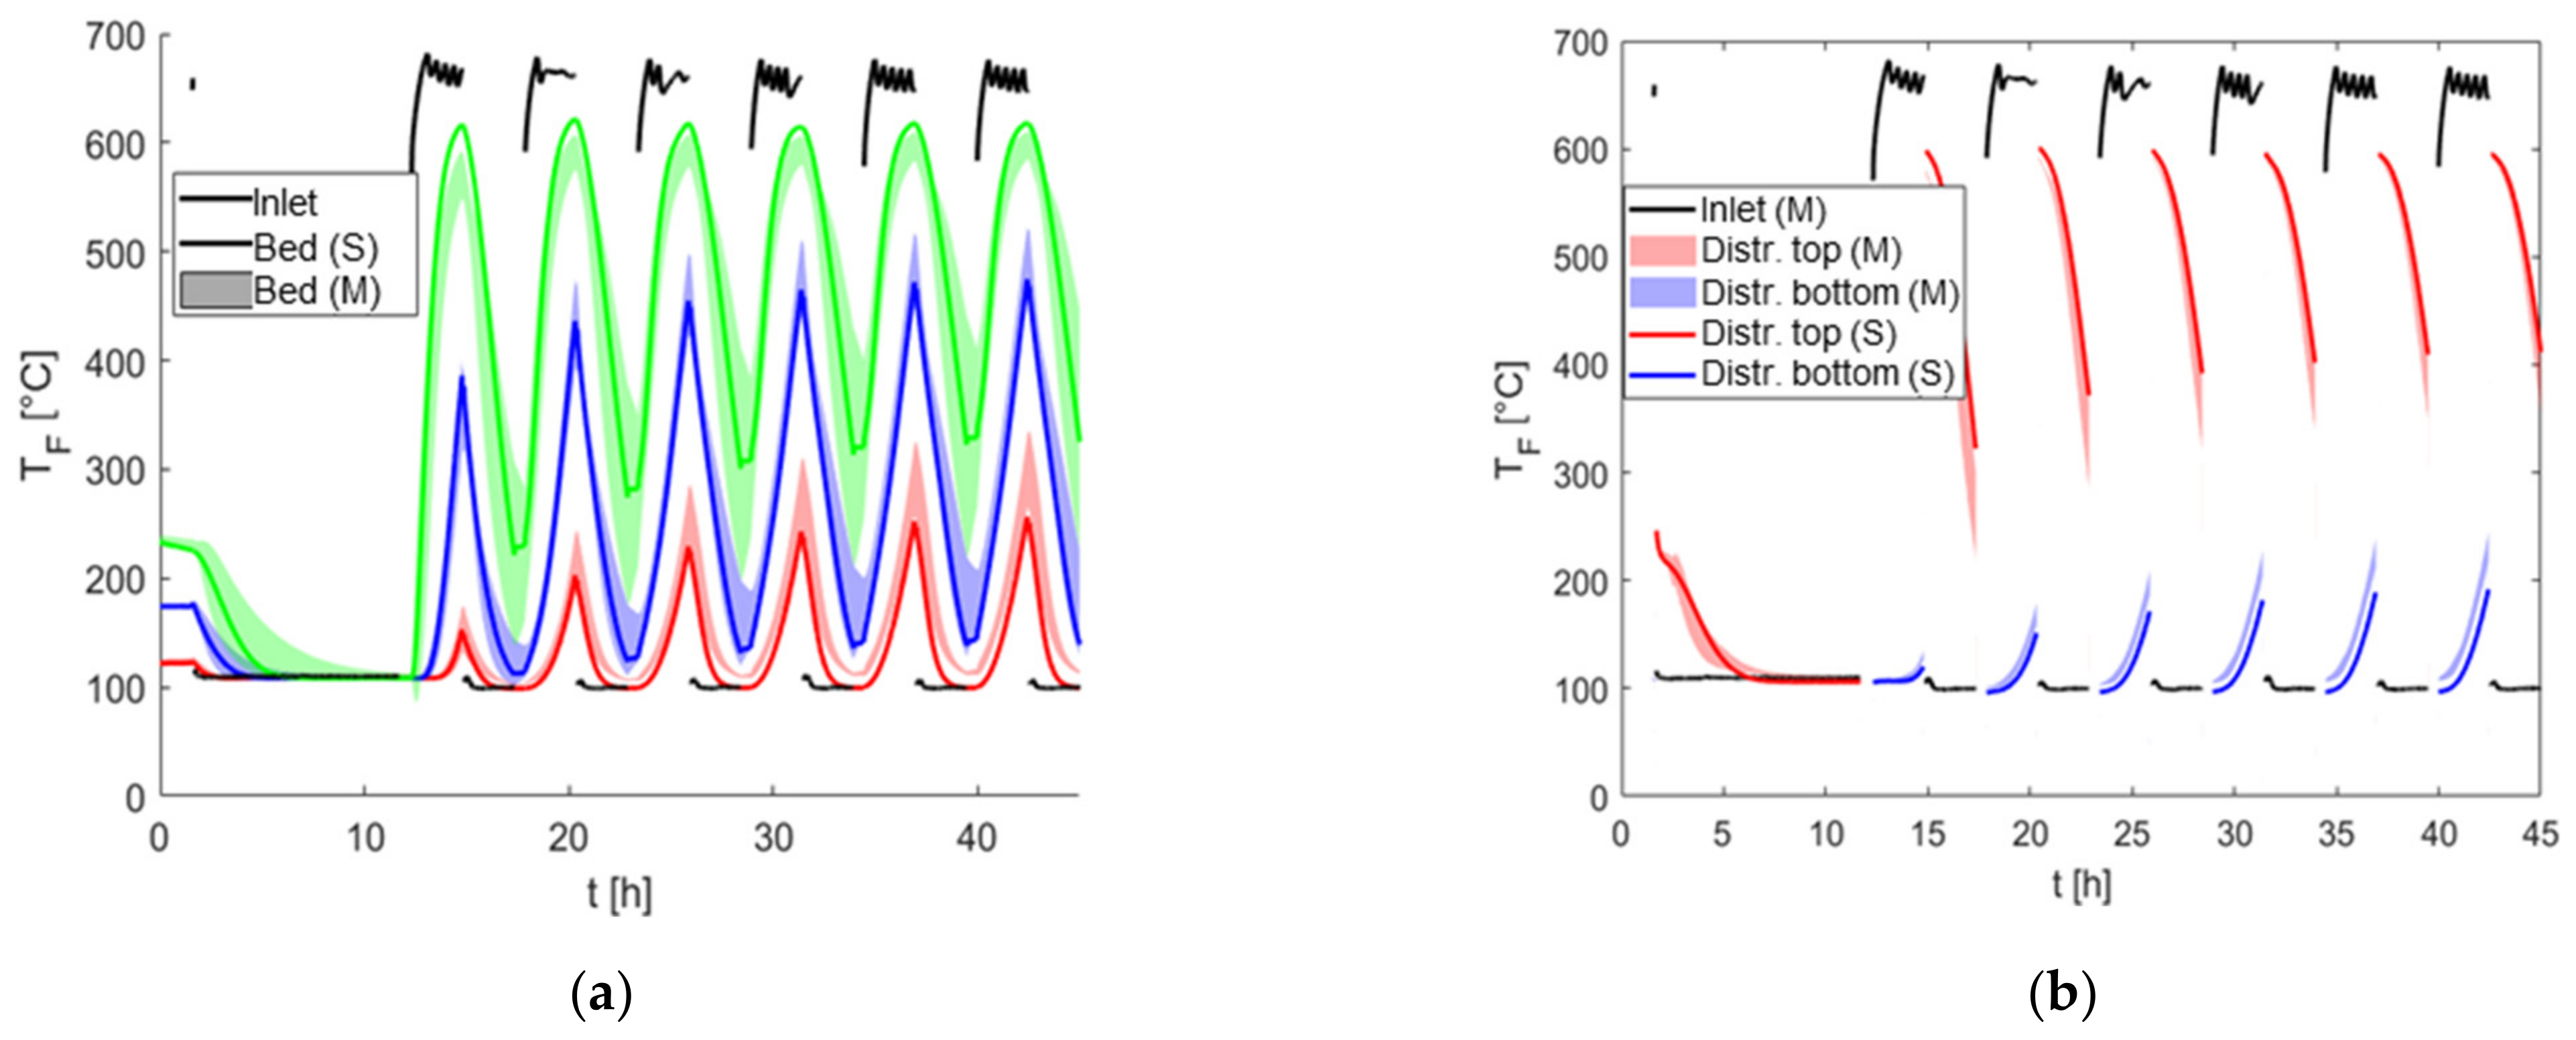
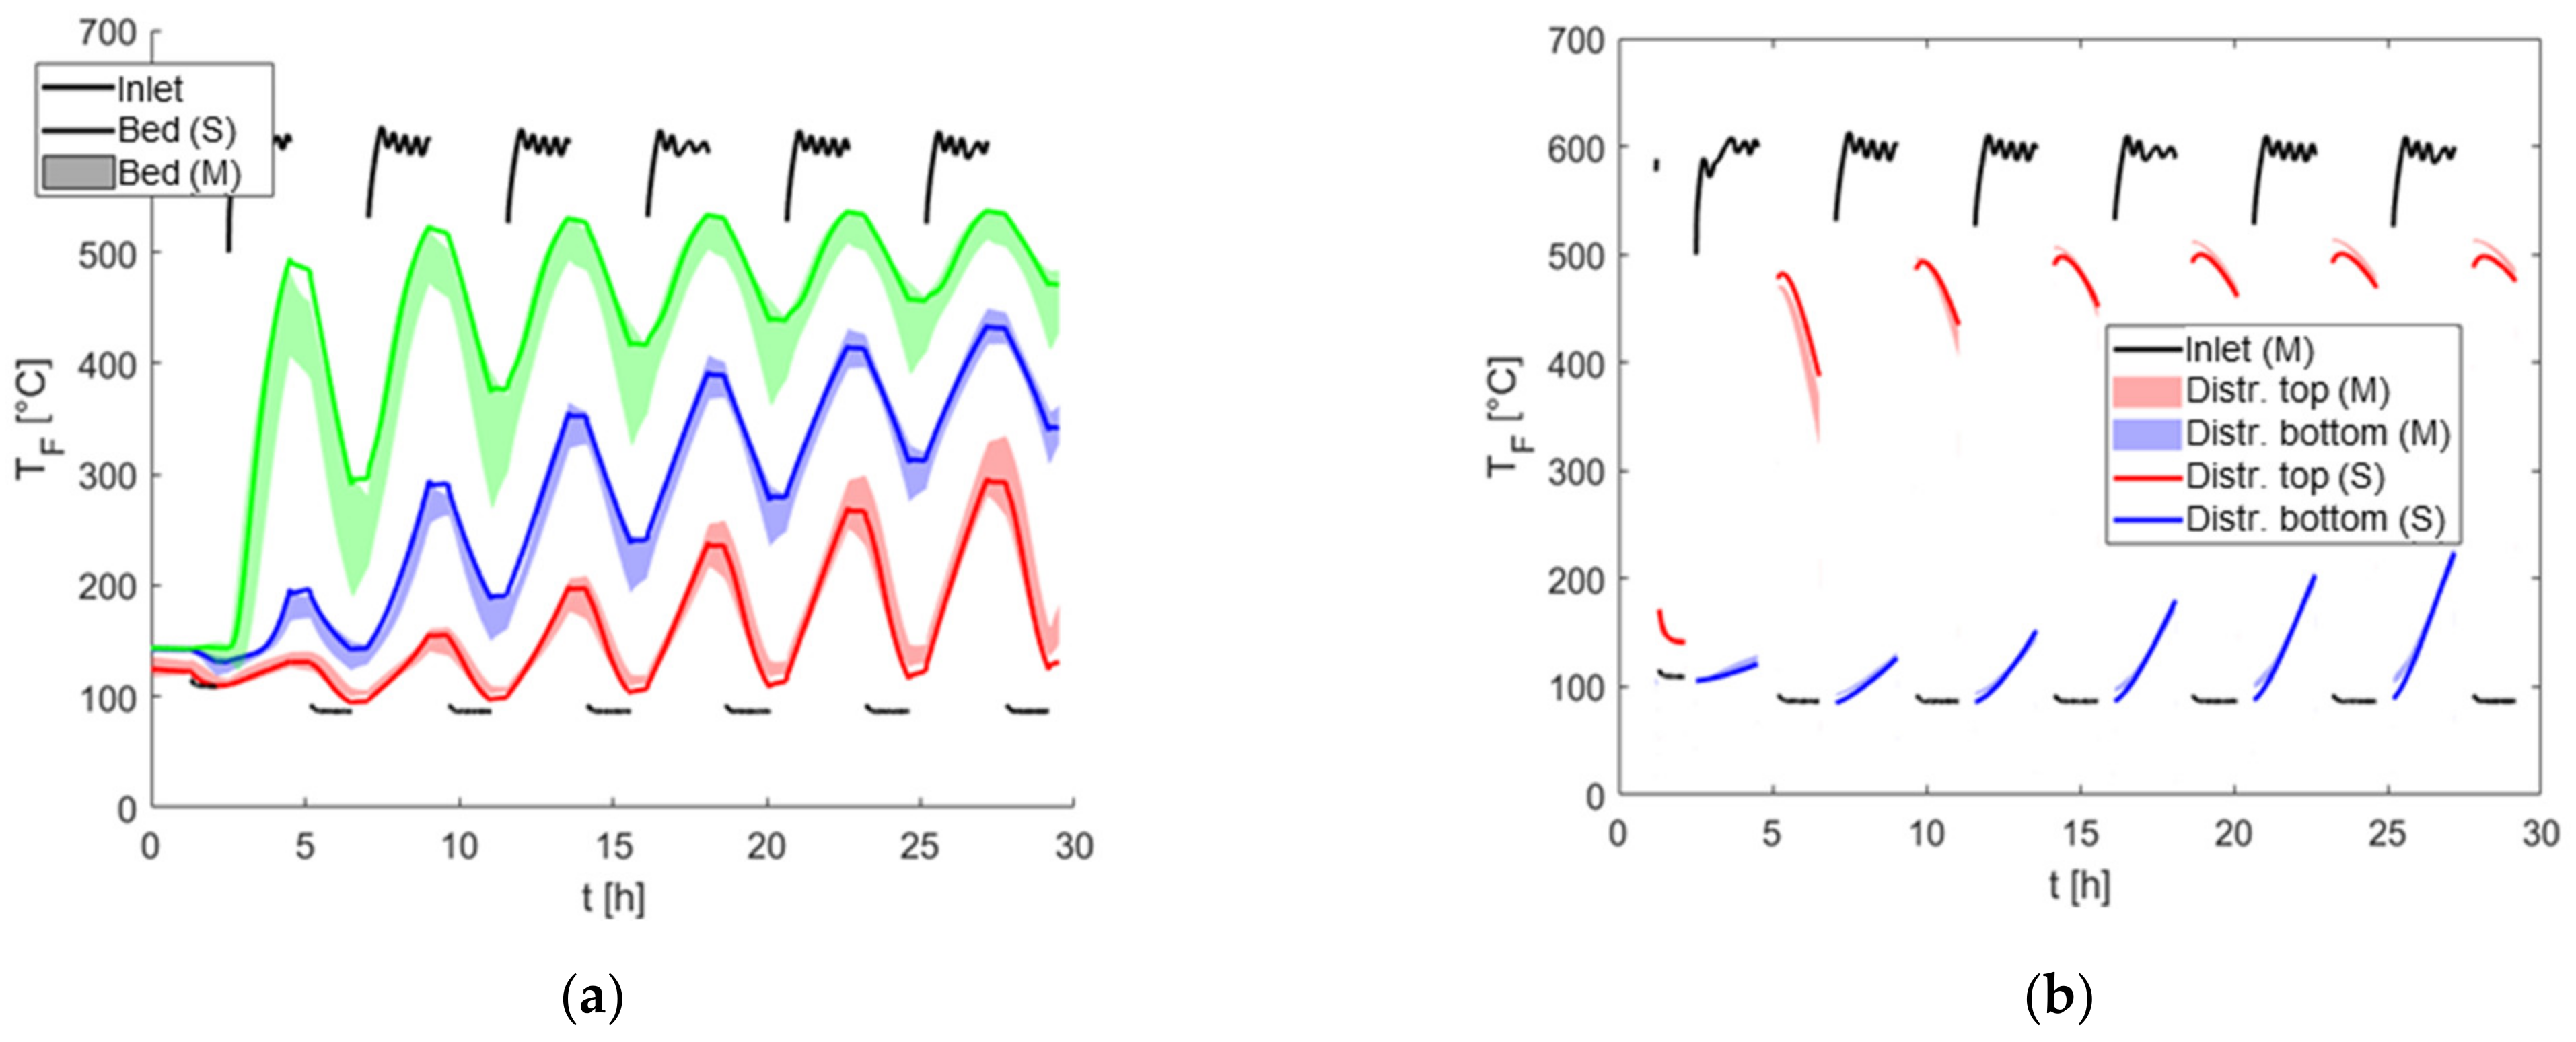
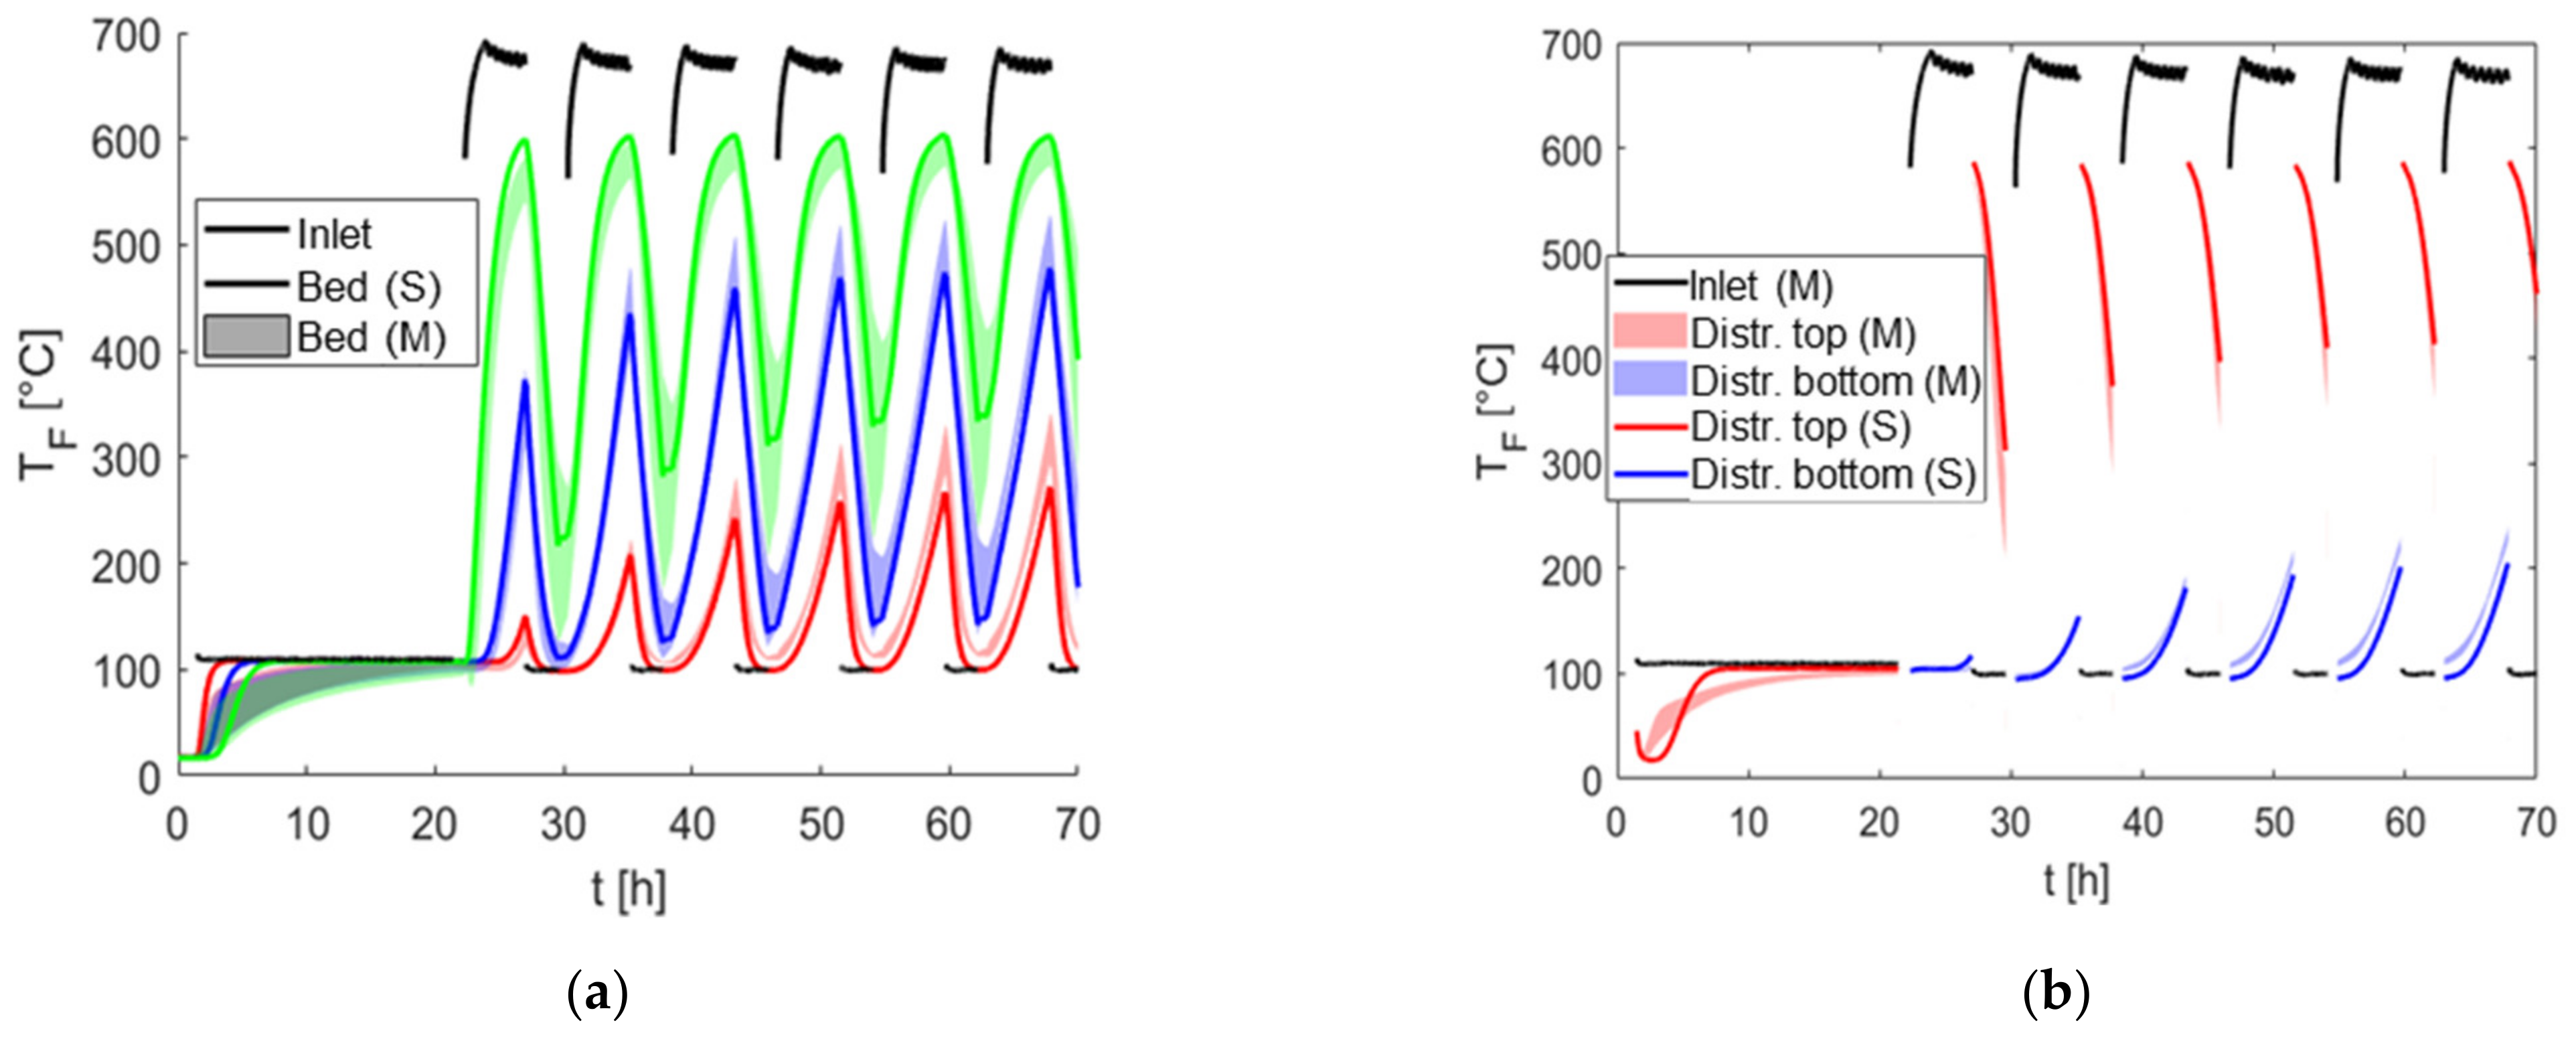
Detailed results of the resulting local and temporal temperature profiles in the storage bed as well as within the distribution covers are shown in the following diagrams (Figure 21, Figure 22, Figure 23 and Figure 24) for all tests (T). If several thermocouples were installed within one measuring level or point, the recorded temperature profiles are represented by hatched areas (mean values ± standard deviation).
Compared to the tests carried out (T1–T4), the simulation results show a good to very good agreement with the locally measured temperature curves (pictures on the left). Temperature gradients, especially during the charging and discharging phases, are reproduced in detail by the implemented approaches to heat transport (solid-fluid), and the cyclic transient behavior of the solid storage tank as a function of the test-specific mass flows or charging and discharging durations is reproduced with high accuracy by the developed models.
In addition, the simulation results also confirm clear exergetic losses of the heat leaving the storage tank during discharging (pictures on the right—red curves) compared to the high-temperature heat entering the storage tank during charging (pictures on the right—black curves). The reasons for this are test facility-specific heat losses due to internal support structures on the liner plate within the hot-side distributor cover as well as low inventory dimensions in relation to the other thermal capacities (thermal insulation, distributor covers).
Despite the test plant-specific characteristics and slight uncertainties in material data (thermal insulation), a good accuracy between simulation and measurement is achieved with a temperature-related average deviation of less than 10%. The results also show that especially exergetic loss mechanisms within the hot-side distribution cover as well as in the neighboring balance areas must be recorded in detail and considered as a design-critical aspect in the constructional design of large-scale structures—despite their significantly lower importance compared to smaller test structures.

5. Transfer of the Technical Results to a Reference Power Plant

In this section, the integration of two TES concepts in an initially generically defined reference power plant will be investigated. In a second step, the generic results were concretized for an existing modern hard coal-fired power plant and generalized by looking at other existing power plants. The focus was on questions of technical feasibility as preparation for a possible demonstrator and on the expected integration costs, with the aim of being able to quantify further influencing factors for the economic efficiency calculations, see Section 6.
Based on the technical and operational framework conditions of the reference power plant, the defined TES concepts were evaluated, and the two most promising concepts in terms of retrofit ability from the operators’ and manufacturers’ points of view were selected for further investigations at the reference power plant. The investigations include the process engineering as well as the control and electrical engineering implementation, which essentially depend on the integration points in the power plant and the defined storage design, including the associated periphery, but also on the desired operating strategies.

5.1. Definition of the TES Concept to Be Investigated at the Reference Power Plant

The task here was divided into two sub-steps and consisted, on the one hand, of the selection of a reference power plant and, on the other hand, of the definition of the TES concept to be investigated at the reference power plant.
Due to the decommissioning of the Voerde power plant, the power plant investigated in the previous project [16] was no longer available for work here. With regard to the utilization intentions, the following criteria were defined for the selection of the reference plant:
  • Sufficient remaining travel time;
  • Power plant in Germany;
  • Notable power output;
  • If possible, a plant and power plant components from the boiler manufacturer and operators from the project.
As Section 3 mentioned, instead of a single power plant, the modern 800 MWel power plant class was first defined generically as the reference plant type. Due to the chosen approach to focus the investigations at a generic power plant of the 800 MWel class as a reference plant, the preparation of the framework conditions for the reference power plant was not carried out until Section 5.2, specifically using the example of Walsum 10.
The transferability of the lead concepts from the first project phase to the work to be carried out here was investigated. Two variants were selected as the basis for the investigations in this section:
  • Concept HRH-HPPH9_indirectly (molten salt storage) with 2 h storage;
  • Concept CRH/LS-HPPH7_directly (Ruths) with 15 min storage.
Due to the focus on retrofitting existing power plants, the lead concept Flue gas-Air_indirectly (solid media heat storage) was not investigated here. The results summarized here focus largely on the exemplary presentation for concept HRH-HPPH9_indirectly.

5.2. Study on the Technical Integration of the Selected TES Concept

The investigation of the technical integration of the defined variants was carried out here at the Walsum 10 power plant. Due to its very compact design, Walsum 10 supposedly poses the greatest challenges to integration. The following aspects were part of the integration study:
  • Permit-relevant framework conditions;
  • Process integration in the form of installation planning;
  • Electrical and control integration;
  • Cost compilation;
  • Generalization to the power plants Schwarze Pumpe of LEAG and RDK 8 of EnBW.

5.2.1. General Conditions Relevant for Approval

If a storage system is subsequently installed to increase power plant flexibility, a modification permit for the storage system must be applied for. In doing so, the regulations and regional conditions for the site that are valid at that time must be observed for each specific power plant. Individual processing is required for each project. In general, the construction and operation of a storage system require the implementation of an immission control approval procedure, including a building permit procedure.
In a molten salt storage system, a mixture of sodium nitrate and potassium nitrate is often used as the storage medium. Emergency heating and initial heating of the salt, as well as final disposal, shall be described within the scope of the modification permit. The following conditions, among others, are to be expected from a technical point of view:
  • Catch basin for the entire salt quantity;
  • Splash protection due to the hydrostatic pressure around the catch basin;
  • Foundation cooling;
  • Double-walled heat exchangers with leakage monitoring;
  • Redundant measurements;
  • If necessary, quick-acting valves and bypass.

5.2.2. Process Integration

As part of the process integration study, the connecting piping systems between the two storage variants and the Walsum 10 power plant were investigated. As a result, lists of measuring points and consumers were derived, flow diagrams and layout plans were generated, and a 3D pipeline planning was carried out, which is described below.
The connecting piping systems serve to integrate the respective storage facility into the various subsystems of the water/steam cycle of the power plant. The corresponding process engineering design was carried out on the basis of the thermal circuit diagrams and the circuit calculations of the selected concepts.
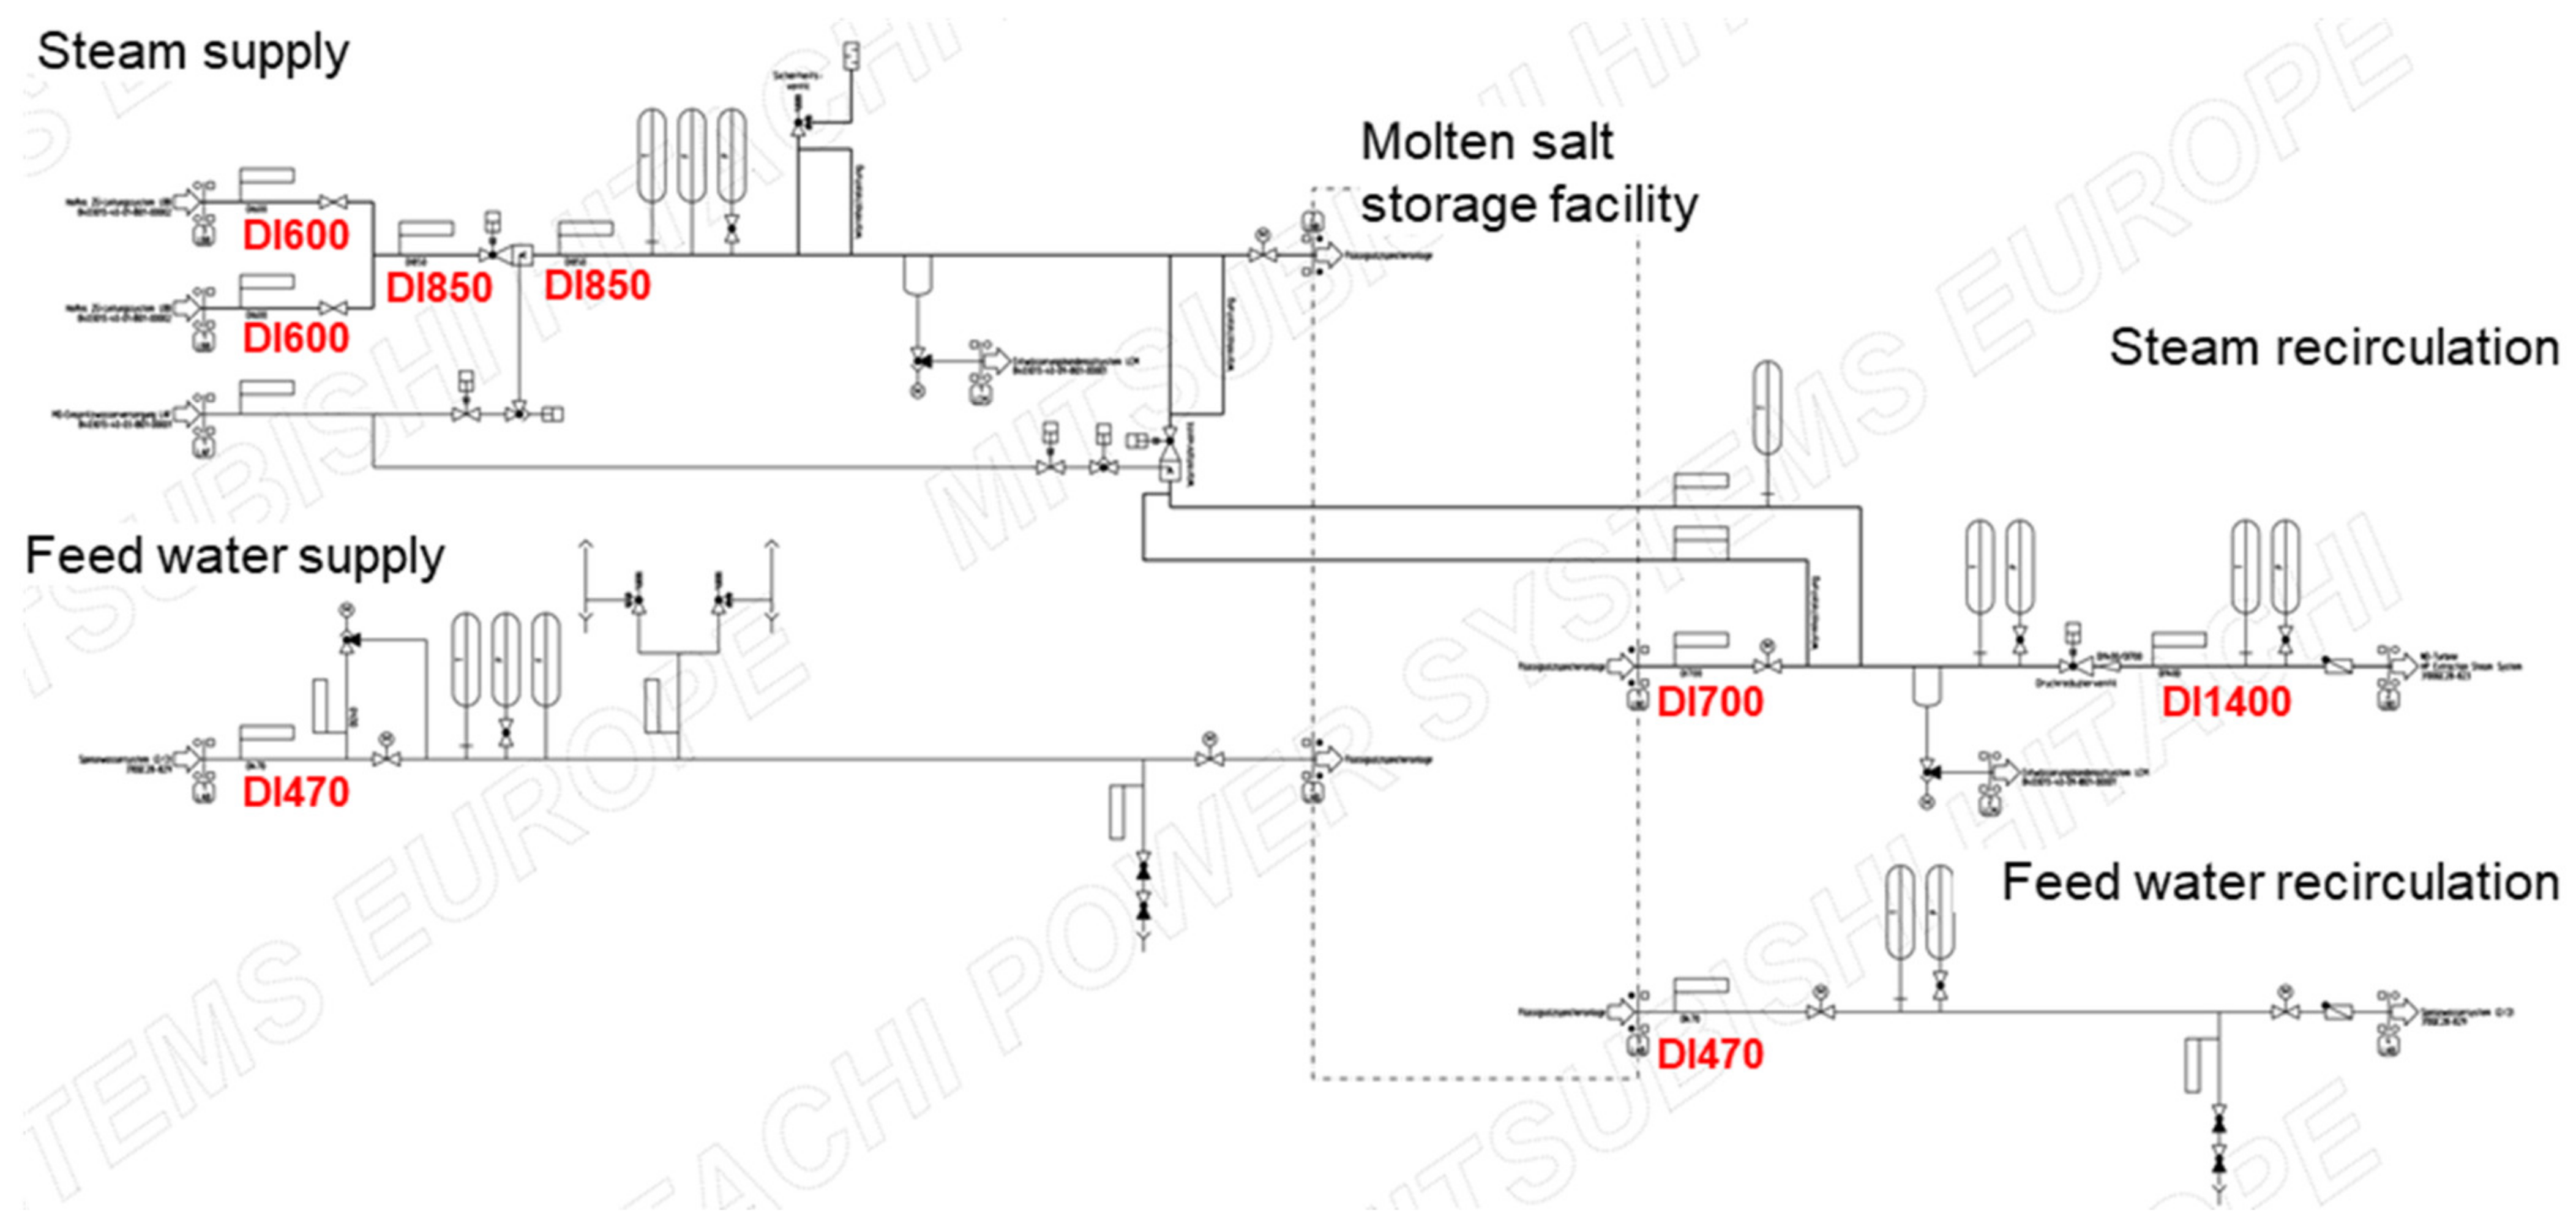
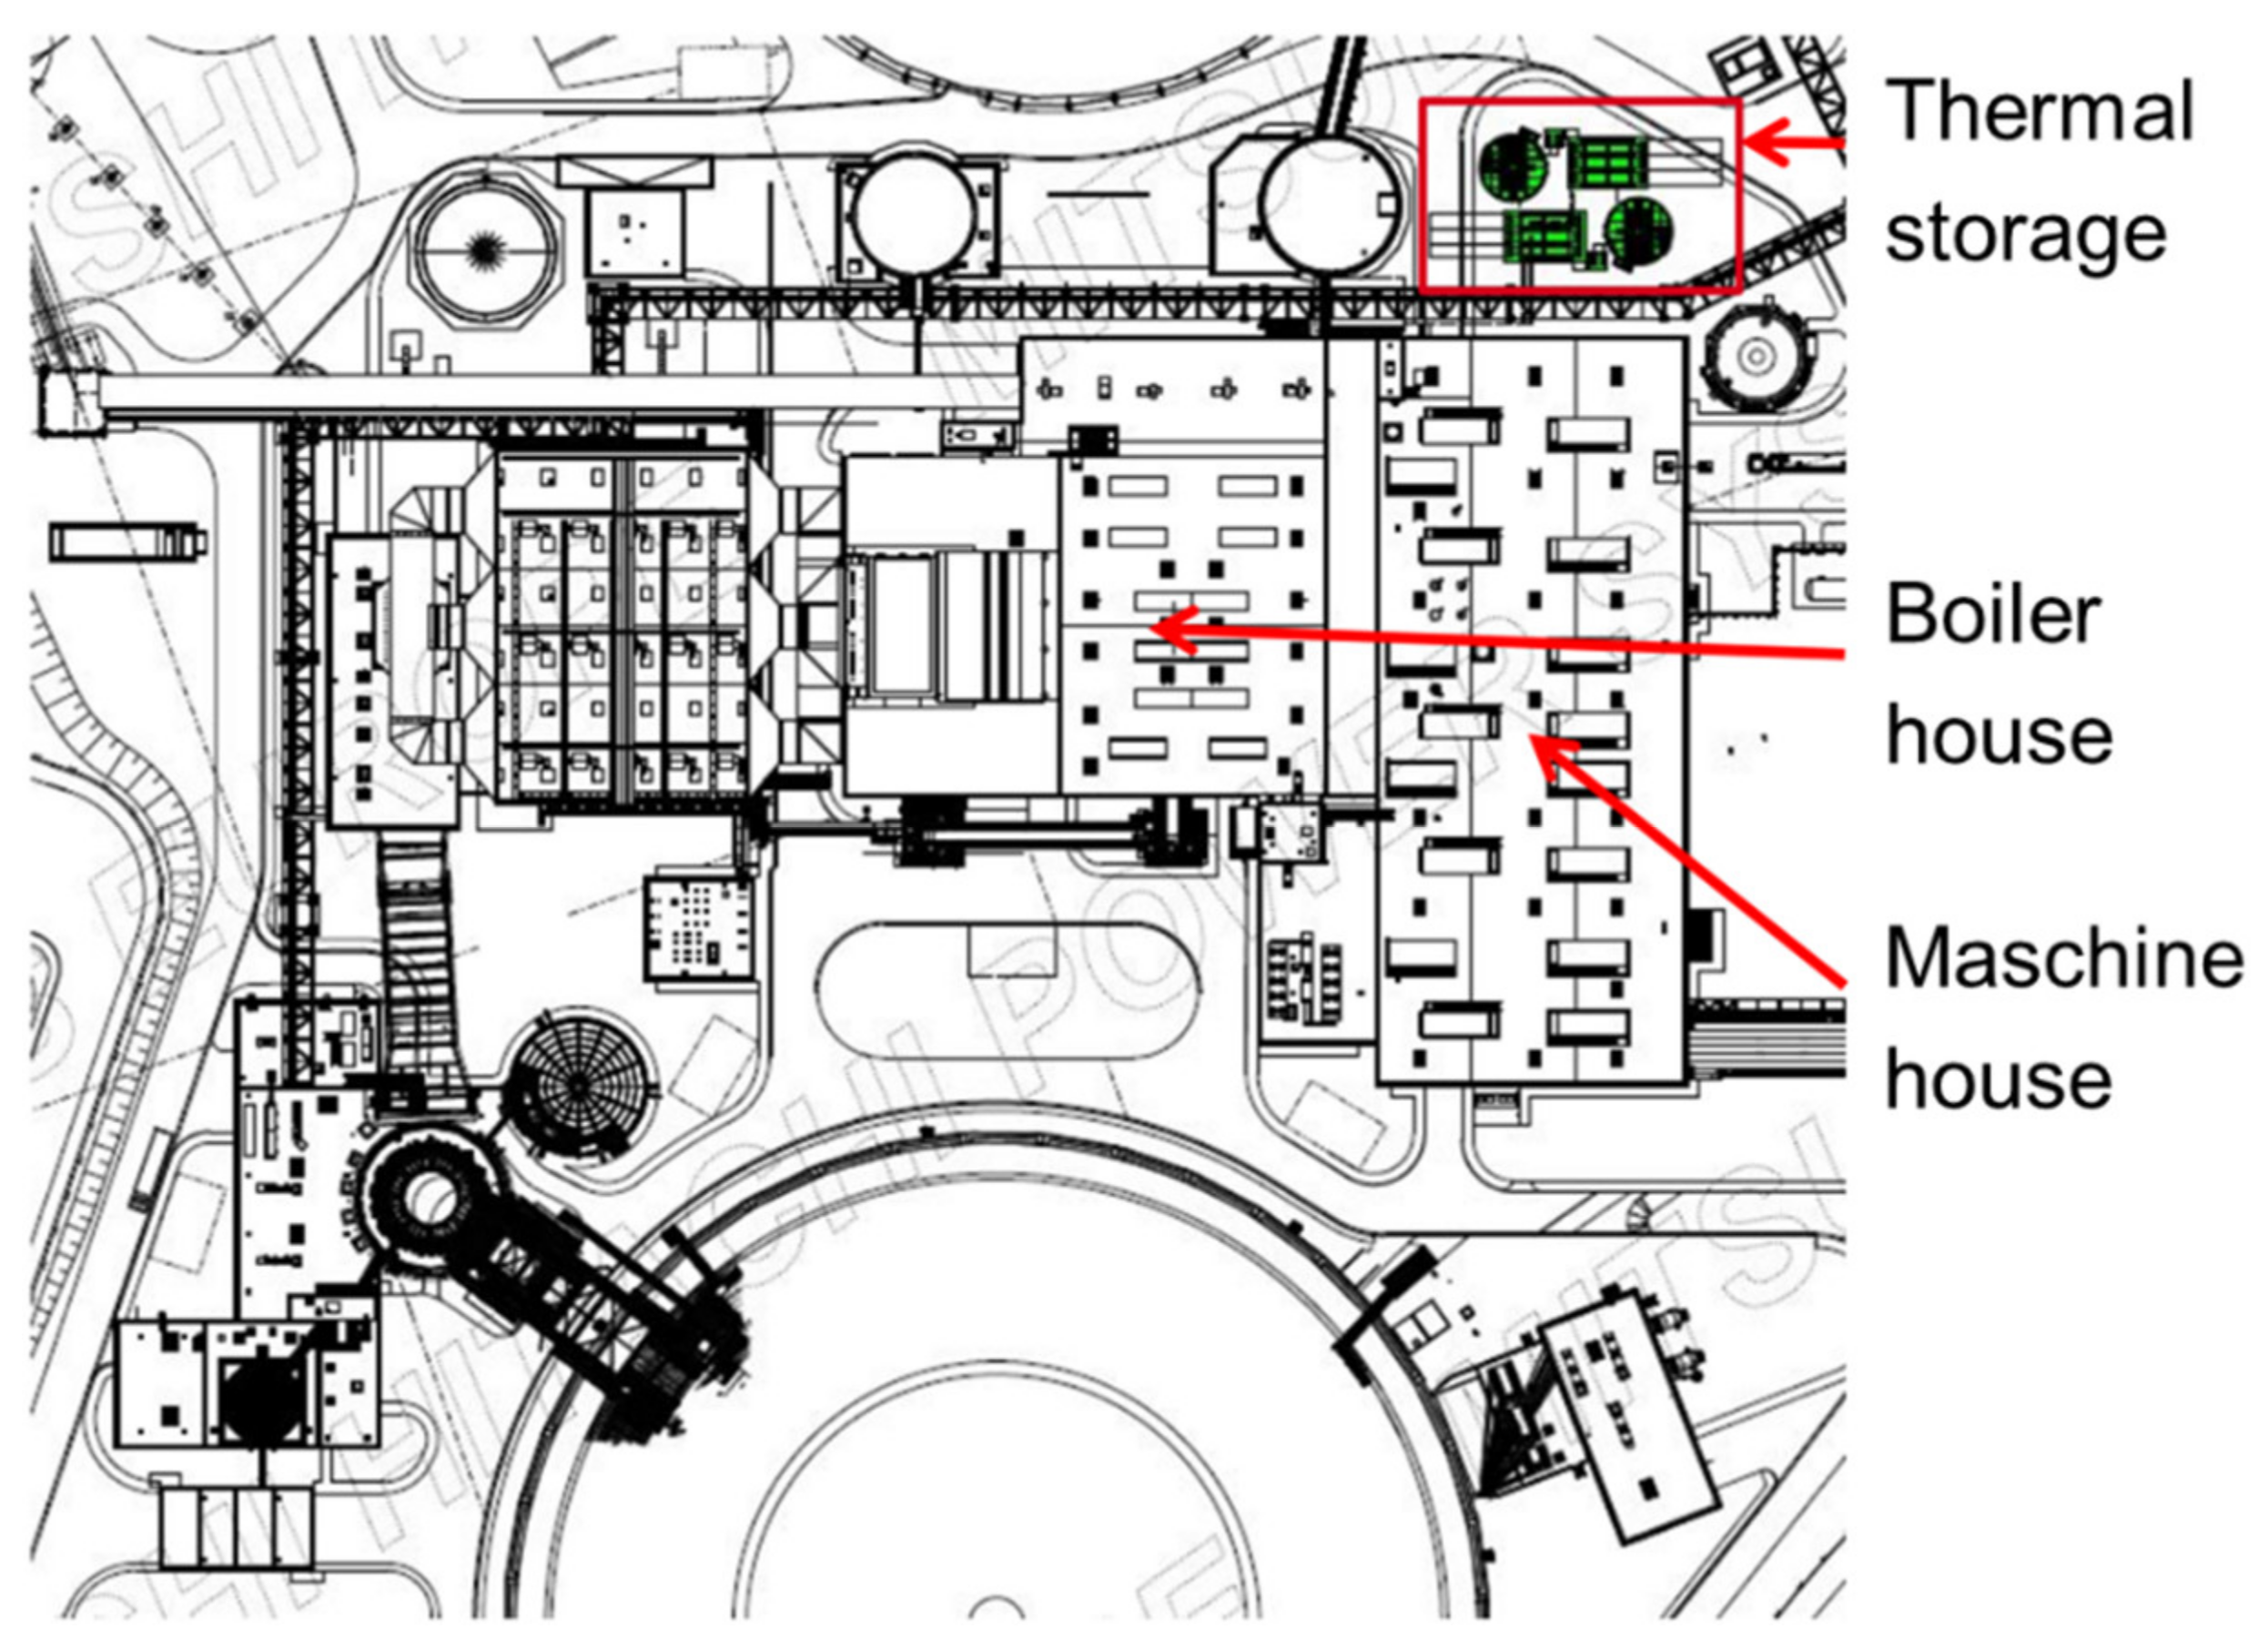
The results are presented here using the HRH-HPPH9_indirectly concept as an example. A schematic representation of the connecting piping systems for this concept is shown in Figure 25.
In the HRH-HPPH9_indirectly concept, the steam is supplied from the power plant’s hot reheat (HRH) steam system, which at Walsum 10 has two lines. The tapping lines of the two lines are brought together, and the HRH steam is routed to the storage facility by means of a manifold. Continuous flow, temperature, and pressure monitoring are ensured by measurements installed in the pipeline. For the purpose of steam conditioning, a steam conversion station is installed to condition the flash steam to the parameters required for the storage plant. Continuous monitoring of the steam conditioning takes place on the downstream side via pressure and temperature measuring points positioned in the manifold. The steam conversion station is supplied with injection water by tapping into the MP injection water system. Pressure protection of the complete steam supply is ensured by a safety valve installed downstream of the steam conversion station.
Steam is also returned from the storage facility to the power plant via a steam collection line. The recirculated HRH steam is coupled back into the water–steam circuit of the power plant upstream of the low-pressure stage of the steam turbine. A pressure-reducing valve installed in the return line ensures that the steam is conditioned to the conditions present at the inlet to the LP turbine. Condensates accumulating in the steam lines are collected at the low points of the system and fed to the dehydration condensate system of the power plant.
The feed water to be heated is taken from the feed water system on the upstream side of HP preheater 9, led to the storage system by means of a pipe, heated, and then fed back to the feed water system of the power plant on the downstream side of HPPH9. In order to avoid water hammer in the connecting pipelines, a control valve is installed in the bypass in the feed water line—analogous to the feed water start-up control valve. Continuous flow, temperature, and pressure monitoring are carried out by means of measurements installed in the pipelines, and the pressure protection of the entire system is ensured by safety valves installed in the feed water supply.

Layout Planning

Due to the higher complexity, the installation planning of the storage facility on the site of the Walsum 10 power plant was based on the molten salt storage unit (concept HRH-HPPH9_indirectly).
The following stipulations were made as boundary conditions for the installation planning:
  • The distance to the charging and discharging points should be as short as possible.
  • The arrangement of the individual components of the storage facility is flexible and adapts to the needs of the power plant site.
  • The storage facility does not interfere with the function or infrastructure of the power plant site (escape routes, access roads, inspection areas).
The results of the layout planning are shown in Figure 26.

Piping Planning of the Connecting Piping Systems

This section summarizes the pipeline planning of the connecting pipeline systems between the different variants of the storage facility and the Walsum 10 power plant.
The following stipulations were made as boundary conditions for the pipeline planning based on the installation planning:
  • The pipeline lengths are to be as short as possible.
  • The piping design of the various piping systems is adapted to the needs of the power plant site.
  • The additional piping systems do not interfere with the function or infrastructure of the power plant site (escape routes, access roads, inspection areas).
The piping design was based on a 3D model of the plant. Table 2 shows the resulting pipeline lengths for concept HRH-HPPH9_indirectly.
The costs considered for procedural integration include:
  • Piping;
  • Fittings;
  • Piping supports;
  • Primary and secondary steelwork;
  • Assembly (piping and steelwork);
  • Transport (piping and steelwork);
  • Measuring points;
  • Insulations;
  • QA/QS;
  • Project Management;
  • Engineering;
  • Procurement.
The items listed here only refer to an exemplary delivery portion of the plant integration. Salt pipelines and civil engineering, as well as supplementary BoP systems, are explicitly not included in the integration costs. The integration costs amount to EUR 4.45 million BEC for concept HRH-HPPH9_indirectly.

Electrotechnical and Control Integration

The simulations in Section 3 show that the integration of the TES has an impact on the entire water/steam cycle. This means that, in addition to the electrical and control integration of the storage facility, control optimization of power plant controls that are strongly influenced by the storage facility, e.g., condensate control, must also be considered.
The following planning assumptions were made for the investigations and the resulting cost estimate:
  • The storage tanks will be fully integrated into the main control system.
  • Sufficient space is available in existing control cabinets and switchgear, and only a small amount of cable routing is required.
With the quantity structure for sensors and actuators derived from process engineering for both concepts, considering the results from Section 4 and based on experience at the Walsum site, the costs for integration were derived. Potential extensions to the sensors and actuators resulting from the approval and basic requirement for unit protection of the storage facility—but also of the power plant—were discussed (including conductivity measurements, 2-of-3 design) but must be specified at a later planning stage as part of a HAZOP analysis and are therefore not adequately considered in the costs where applicable.
The costs considered for electrotechnical and control integration include:
  • Electrotechnical and control planning and documentation;
  • Creation of measurements and drives;
  • Function implementation;
  • Integration into the operating and monitoring system;
  • Control optimization (power plant controls, especially condensate, feedwater);
  • Support of cold and hot IBS;
  • Function implementation;
  • Integration into secondary systems (telephone system, BMA, camera, loudspeaker system, incl. installation);
  • Control assembly and power installation, including scaffolding.
The costs amount to EUR 1.08 m BEC for concept HRH-HPPH9_indirectly.

Cost Summary

In addition to the above-mentioned integration costs, further specific construction costs must be considered for the HRH-HPPH9_indirectly concept, which result from approval requirements, including construction costs for a catch basin, splash protection, and foundation cooling. In total, the integration costs amount to the values listed in Table 3 (concept CRH/LS-HPPH7_directly as a generalization of concept HRH-HPPH9_indirectly).

Generalization to the Power Plants RDK 8, Schwarze Pumpe, and New Power Plant Construction

Based on the planning results, estimated pipeline lengths were derived as a significant cost item for the integration costs by LEAG and EnBW for the Schwarze Pumpe and RDK8 power plants. As a result, it can be summarized that, on the one hand, Walsum 10 was challenging for the pipeline routing due to its compact design, but on the other hand, it offers advantages in terms of pipeline lengths and thus directly also in terms of integration costs compared to the RDK8 and Schwarze Pumpe power plants for the retrofitting of a thermal storage unit.
The higher pipeline lengths for RDK8 compared to Walsum 10 are due to the locations of the boiler house and the ash storage facilities, which hinders the installation of the thermal storage unit close to the preheating section of the water–steam cycle.
In summary, due to the compactness of Walsum 10, the integration costs to be applied for Walsum 10 are probably to be assessed as the lower limit with regard to retrofits of thermal power plants.
In relation to a new power plant construction, in which the thermal storage is taken into account from the very beginning, a further cost saving in the range of 30% can be assumed through optimized installation planning.

6. Economic Evaluations

The aim of the work here was to determine optimal techno-economic target values for flexibilizing coal-fired power generation plants by integrating thermal energy storage (TES).
The economic framework conditions in 2030 were mapped in a scenario-based electricity market modeling framework in order to identify the future requirements for power plants, power plant operation, and TES. An economic dispatch optimization model for power plant and TES was dimensioned with the parameters of the defined reference power plant and the TES specifications investigated in the project, which were refined step by step. The objective function corresponds to maximizing total profits by using a mixed-integer linear programming (MILP) model; for details, see [18]. Economic evaluations were carried out on the basis of this simulation model.

6.1. Determining the Energy-Economic Framework Conditions for the Economic Assessment (Scenario Definitions)

The future market framework conditions depend largely on the future development of the power plant fleet, electricity demand, renewables, fuel prices, and other flexibility options such as batteries and demand-side management (DSM). For this analysis, three distinct scenarios regarding potential TES revenue potential were defined: in addition to a baseline scenario, a best-case and a worst-case scenario for the TES profitability were defined.
In the baseline scenario, increasing demand, moderate addition of flexibility options, and moderate expansion of renewable energy (RE) were assumed. In contrast, in the best-case scenario, a lower addition of flexibility options was assumed in view of the increased RE expansion. This implies greater revenue potential for the TES system due to a higher demand for flexibility. In the worst-case scenario, the demand development remains unchanged compared to the baseline scenario. However, a higher addition of flexibility options was assumed, which would result in a reduced TES revenue potential. Additionally, by referencing the “Low” and “Central” scenarios in the report “Fossil Fuel Price Assumptions: 2017” by BEIS [19], fuel price trends were assumed to tend to result in a “fuel switch”, unlike the base and best-case scenarios. Hence, in this case, the gas and combined cycle power plants have lower variable costs than hard-coal power plants and, thus, tend to be more often the price setters in the merit order. This reduces the full-load hours of the hard-coal-fired power plants and also significantly reduces the TES revenue potential.
The development of the electricity market in the three scenarios was simulated with the electricity market model “DIMENSION” developed at the EWI; for details, see [20]. This is a dynamic linear investment and dispatch model of the European electricity system. For each scenario, the model simulates the hourly marginal system costs based on the marginal costs of the price-setting power plants. The marginal system costs consider European security of supply (covering national residual load peaks when using international balancing effects) and are the basis of fully cost-covering electricity prices; as such, they also represent the addition of generation capacity.
In subsequent steps, using heuristic EWI models based on the principle of opportunity costs, prices for primary (PCR) and secondary control power (SCR) were simulated. Similarly, using an ex-post stochastic model based on renewable energy and demand forecast error distributions, hourly day-ahead prices and quarter-hourly (continuous) intraday prices were simulated. The statistics for the simulated day-ahead and intraday prices are presented in Figure 27 for the three scenarios considered in the analysis.
Average day-ahead and intraday electricity prices are lower in the worst-case than in the baseline and best-case scenarios due to lower gas prices. However, in all scenarios, electricity prices in 2030 have roughly doubled compared to 2015. The increased average daily deviation of day-ahead and intraday electricity prices reflects the increased volatility of electricity generation from the worst-case to the best-case scenario.
The statistics for the primary and secondary control power prices are presented in Figure 28. Since SCR power prices are determined as opportunity costs relative to the day-ahead market, SCR power prices increase in parallel with day-ahead prices in all scenarios. In the best case, lower competing flexibility options amplify the price increase; in the worst case, higher competition reduces the price. With increasing battery capacities, PCR prices decrease noticeably in all scenarios compared to 2016, while the price differences between the scenarios reflect their different levels of capacity expansion of competing flexibility.

6.2. Developing the Future Power Plant Requirements from the Defined Scenario and Determining the Technical Target Values

First, the parameters of the reference power plant, which were used as the basis for the investigations carried out in the project for the integration of a TES, were carried out with the expertise of the participating manufacturers and operators, see Table 4 and Table 5.
Subsequently, the defined parameters were implemented in the power plant dispatch model; the calculation results were reflected back to the partners and adjusted several times after discussion with the project partners. The same basic procedure also applies to the work results presented in Section 6.3.
  • Minimum load efficiency (%): This corresponds to the efficiency when operating at minimum load. A linear interpolation of the efficiency was carried out to simulate operation between minimum and full load.
  • Start-up time (h): Time required for a start-up during which no electricity is fed into the grid until the power plant reaches minimum load. Average consideration of the start-up time—no differentiation between “hot, warm, cold start”. This enables shorter model run-times with relatively little deviation from reality.
  • Shutdown time (h): Time period for shutdown until the power plant reaches minimum load, below which no more electricity is fed into the grid.
  • Start-up costs (Euro): Costs for fuel input, which arise per start-up.
  • Positive load gradient (%/min): Rate at which positive load changes are possible.
  • Negative load gradient (%/min): Rate at which negative load changes are possible.
The minimum bids for primary control reserve (PCR) and secondary control reserve (SCR) are 1 MW. The maximum possible PCR and SCR bids for the reference power plant without TES are technically limited and have been quantified at 20 MW and 55 MW, respectively.
For positive and negative SCR, an average call probability of 20% is assumed on the basis of historical data from the EWI electricity market model DIMENSION [20]. The essential basis of the methodology is the consideration of markets with perfect competition. Since, under this assumption, the producers would bid according to their marginal costs, the average variable costs of the reference power plant are assumed as the SCR commodity price.

6.3. Evaluation of Economic Efficiency and Techno-Economic Target Determination in an Iterative Process

6.3.1. Operation without TES

The use of the reference power plant without TES was simulated by the EWI for each scenario of the electricity market model for the year 2030. It is assumed that the power plant without TES can only be used on PCR, SCR, and day-ahead markets. The power plant has perfect foresight on prices in all markets, and the dispatch is optimized with this information. The methodology, therefore, represents an “upper benchmark”.
The results for the reference power plant defined in the project are not congruent with the average dispatch of German hard-coal-fired power plants, as they include power plants with deviating performance data.
The annual operating results of the power plant without TES are summarized in Table 6. Due to the significantly lower average electricity price in the worst-case scenario, the reference power plant achieves the lowest profits as well as the lowest full-load hours. The number of starts is highest in the worst-case scenario. In contrast, due to similarly high average electricity prices, the baseline and best-case scenarios lead to profits that are almost twice as high as those from the worst-case scenario. In both scenarios, the full load hours are higher, and the number of starts is lower. The resulting number of startups is very low in all scenarios due to the specification of perfect foresight, and the differences between the scenarios are very small in absolute terms.

6.3.2. Operation with TES: Additional Profits

The economic evaluation took place iteratively, and its results were incorporated into the technical analysis. There, it was checked whether an adapted parameterization could be identified as a sensible object of investigation under the given parameterization and economic efficiency. This parameterization was then examined here again for its economic viability. This section presents the final results of this process.
Central input parameters for mapping the performance of the TES concepts in the model are the maximum charging and discharging power in minimum and full load and the efficiency. These parameters were developed in Section 3 and are summarized in Table 7.
The frequency of the TES charging and discharging processes in real power plant operation, i.e., at specific power plant load points, has a significant influence on the average efficiency of the TES concepts and is essential for determining an optimal operating strategy. Therefore, the frequency of charging and discharging of the TES concepts in the power plant load areas was analyzed in the dispatch simulations. The average efficiency values were then determined iteratively.
The analyses of the dispatch simulations have produced the following results:
  • TES concepts are mainly discharged in higher power plant load ranges. However, the frequency of discharging in lower load ranges increases with decreasing storage size as well as increasing efficiency.
  • Concepts with low efficiencies are mostly charged in lower power plant load ranges. With increasing efficiency, the frequency of charging at higher load points increases very strongly.
  • Intraday use of the reference power plant enabled by TES can theoretically double the additional TES profits. These intraday profits are proportionally more important for smaller storage sizes.
  • The economic viability of SCR and PCR support through TES is limited due to strict prequalification restrictions.
The additional absolute profits achieved by the TES concepts for the reference year under consideration (2030), which result from the deployment simulations, are shown in Table 8. The absolute profits measure the difference between the contribution margins to be achieved by the reference power plant with and without TES. They are shown in Table 8 in relation to the storage size (in discharge hours at full load) for the baseline scenario.
The absolute profits (EUR/a) are divided by the storage capacity (MWh) of the TES to obtain the specific TES profits (EUR/MWh/a) and to compare the concepts with different capacities. Specific profits of the TES concepts are shown in Figure 29. All lead concepts achieve the highest profits in the best-case scenario and the lowest in the worst-case scenario, which is why these can be seen as upper and lower limits, respectively, of the possible range of profitability. As the storage capacity of the TES increases, a saturation effect occurs, and the specific profits become steadily lower.
In a comparison of the concepts, HRH-HPPH9_indirectly achieves significantly lower specific profits in all scenarios due to the low efficiency (electricity to electricity). In the worst-case and baseline scenarios, CRH/LS-HPPH7_directly and Flue gas-Air_indirectly achieve profits of a similar magnitude, whereby CRH/LS-HPPH7_directly has slightly higher profits due to its higher efficiency. In the best-case scenario, however, Flue gas-Air_indirectly achieves higher profits than CRH/LS-HPPH7_directly for the smaller storage capacities. The reason for this is as follows. With smaller storage capacities, discharging takes place much more frequently at lower power plant load points. In addition, this happens more frequently in the best-case scenario than in other scenarios due to the higher price volatility. In this context, Flue gas-Air_indirectly can achieve higher revenues because, compared to the other concepts, there is a significantly higher discharge capacity at lower power plant load points.

6.3.3. Economic Efficiency Assessment

The economic evaluation corresponds to the calculation and comparison of the respective payback periods without and with discounting for the TES concepts. The payback period without discounting corresponds to the pure, absolute total investment costs divided by the annual absolute TES profit (“cash flow”) and indicates how many years it takes until the investment is amortized, i.e., the shorter the payback period, the more economical the concept. For the analysis, it is assumed that the profits simulated for the year 2030 remain constant during the lifetime of the concepts. For the discounted or dynamic payback period, an additional assumption is made about the discount factor. The discount factor can be interpreted as a risk estimate for the investors.
Payback Period:
P P = I N V C F
Discounted Payback Period:
D P P = l n 1 1 I N V · d C F l n 1 + d
I N V : Investment costs, C F : Periodic cash flow, d : Discount factor
The investment costs included in the calculation of the economic viability of the TES concepts are based on the cost estimates prepared in Section 4 and are summarized in Table 9. The costs are given as Total as Spent Costs (TASC).
For the first time, integration costs could be considered for the concepts; see Section 5. Integration costs correspond to the costs of integrating the respective TES concept into an existing power plant in terms of process engineering and electrical and control technology. Integration costs are independent of the storage size.
The estimated integration costs for the TES concepts HRH-HPPH9_indirectly and CRH/LS-HPPH7_directly are listed in Table 3. Integration costs for Flue gas-Air_indirectly, which is suitable for a new-build power plant, were not estimated within this project. The total costs of the concepts correspond to the sum of the investment costs and integration costs and are shown in Table 10 for the respective storage sizes.
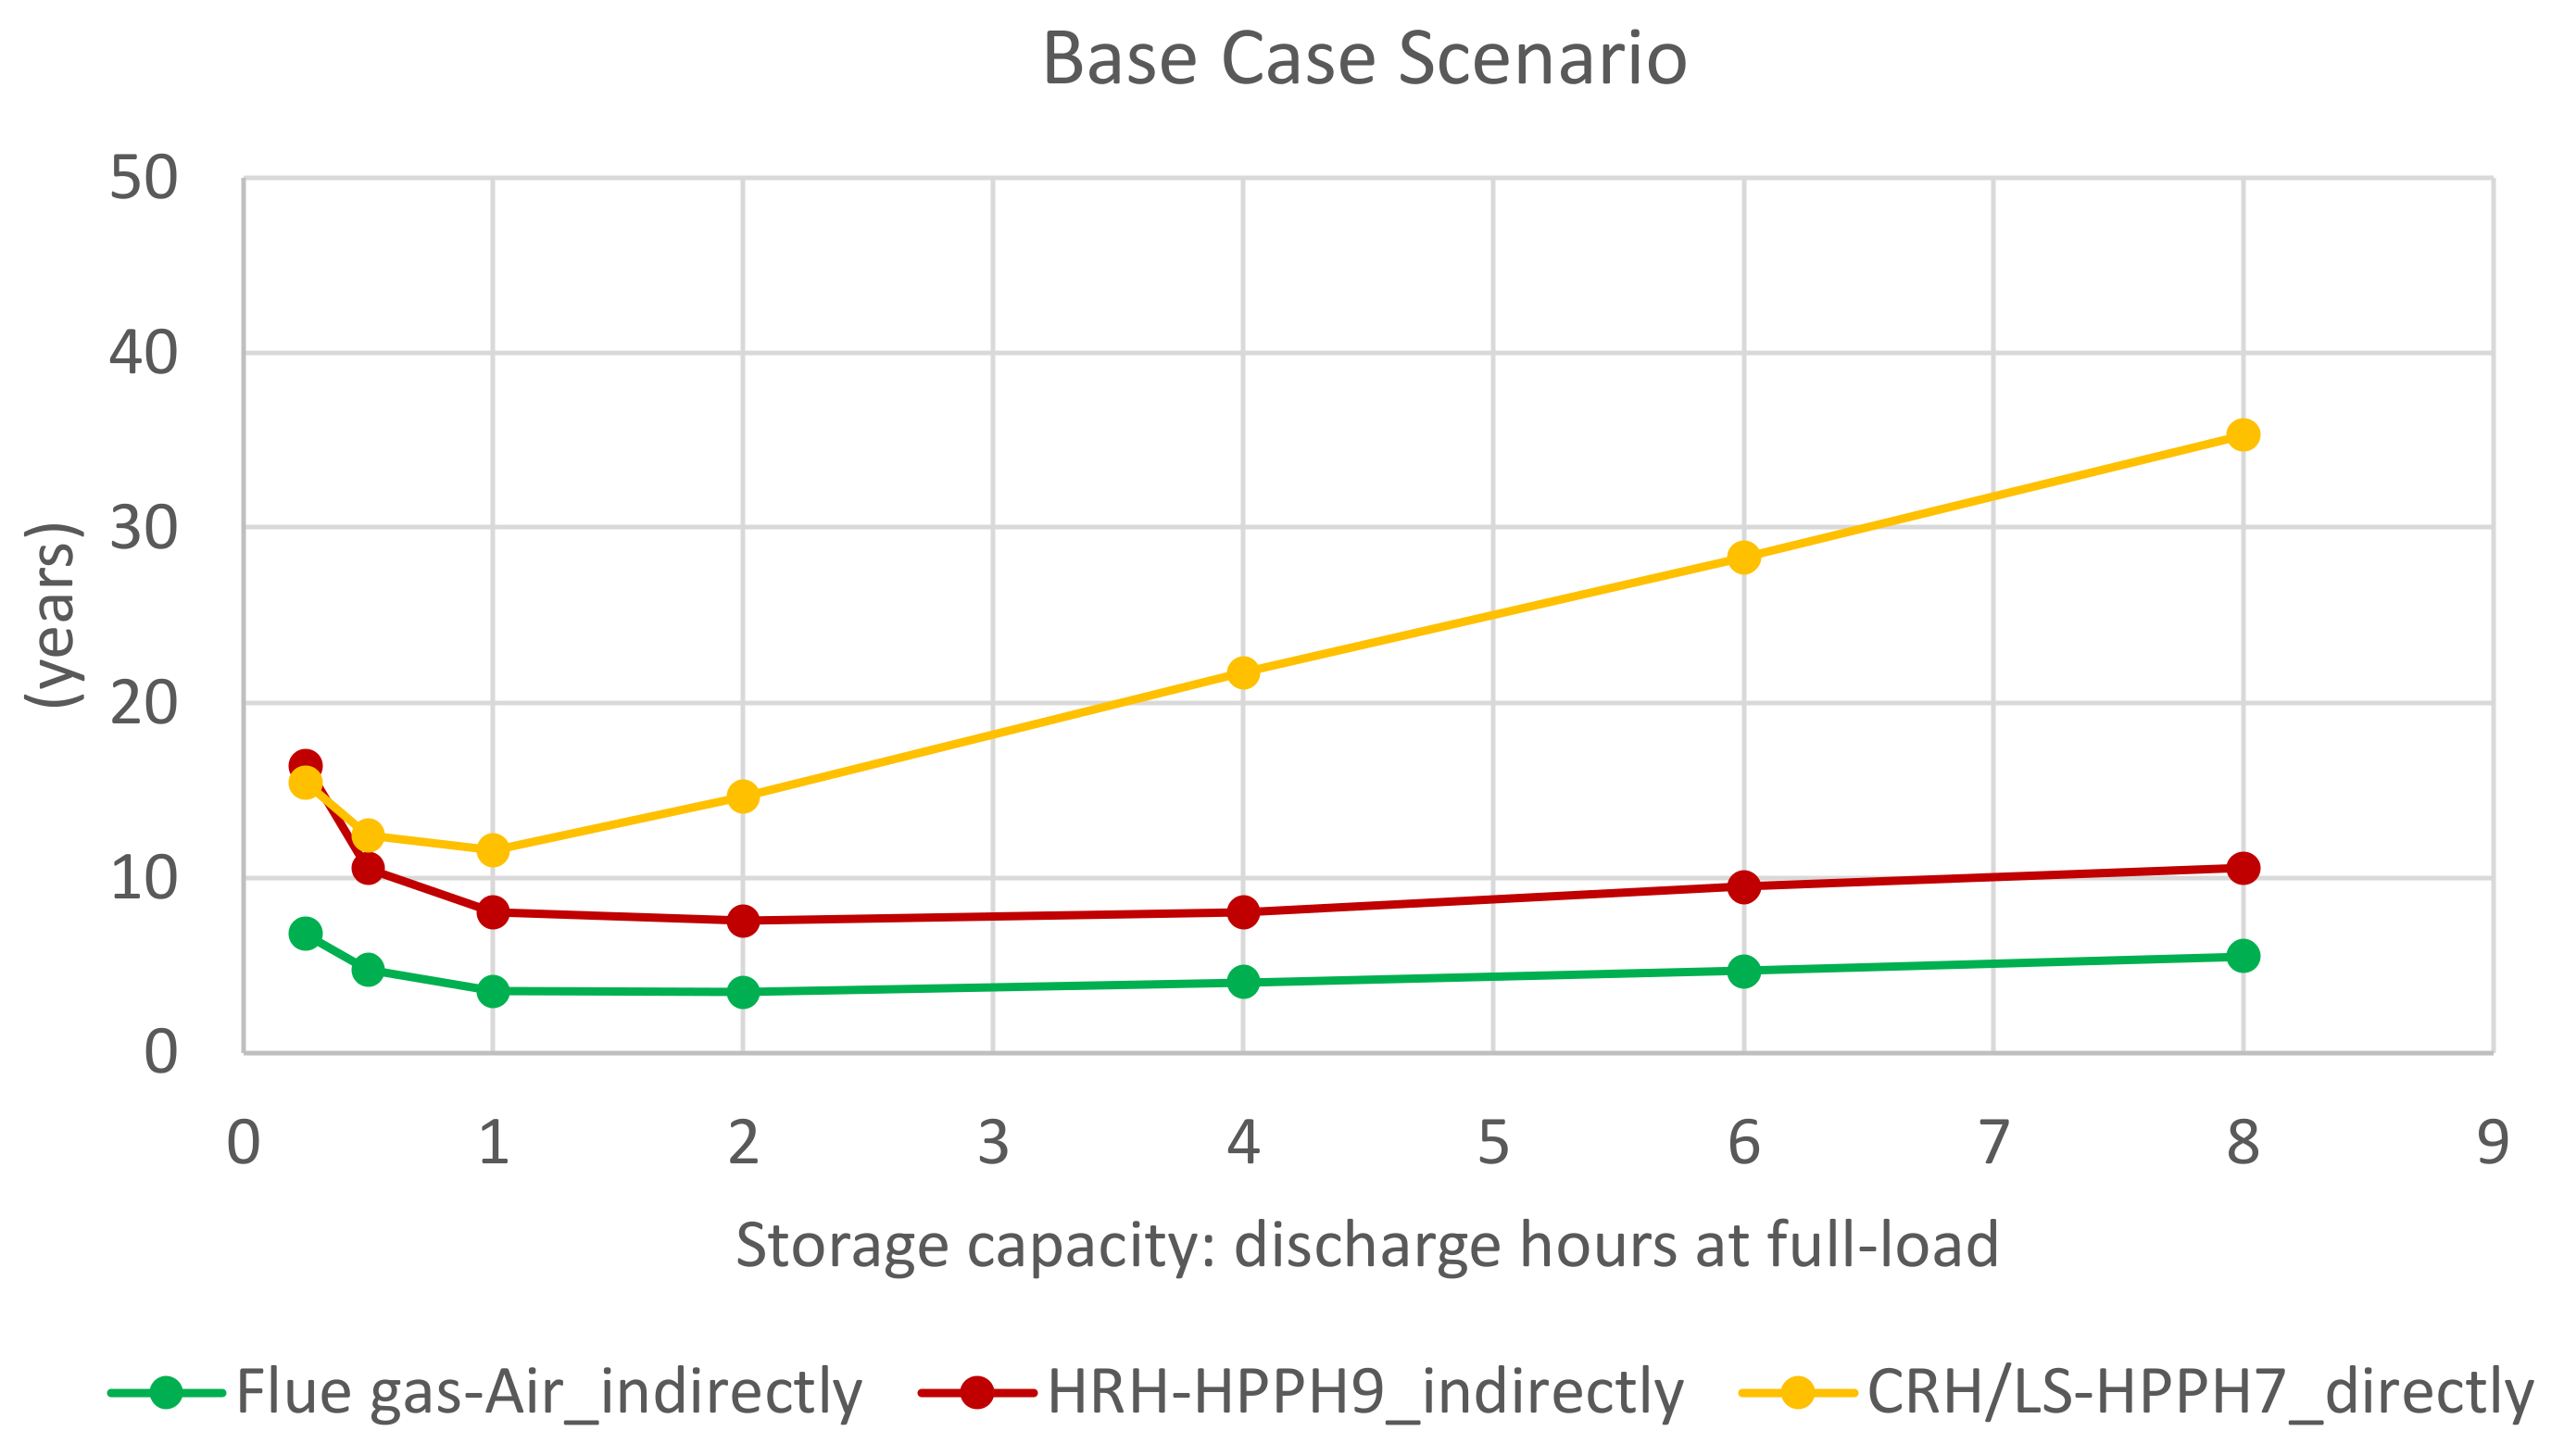
The determination of the optimal storage sizes was based on the total costs (for all except Flue gas-Air_indirectly, this corresponds to investment plus integration costs, for Flue gas-Air_indirectly investment costs only), see Table 11, and the model results (simulated profits). It follows that the optimal storage size for CRH/LS-HPPH7_directly is one discharge hour. The optimal storage size for HRH-HPPH9_indirectly and Flue gas-Air_indirectly is two discharge hours. These results are independent of the three market scenarios and can be seen in Figure 30.
The respective payback periods of the concepts were calculated. For a comparison of the economic efficiency of the concepts, both the investment costs (without integration costs) were considered in individual cases (Table 12), and the total costs were compared. For the calculation of the dynamic payback period, a discount factor of 4% was assumed as the lower value and a discount factor of 8% as the upper value. If only the investment costs (without integration costs) are considered, Flue gas-Air_indirectly is the most economical concept, closely followed by HRH-HPPH9_indirectly. CRH/LS-HPPH7_directly is the least economical concept.
When considering the total costs of the concepts HRH-HPPH9_indirectly and CRH/LS-HPPH7_directly, it becomes apparent that HRH-HPPH9_indirectly is the most economical concept. Compared to the consideration of investment costs alone in Table 13, the payback period for each concept has increased significantly.
The payback period increases exponentially as the discount factor increases. Results given as >80 correspond to cases where discounting does not converge. This can be interpreted as the investments not paying off under the assumed risk factor (i.e., discount factor). As expected, the payback period for all concepts is lowest in the best-case scenario and highest in the worst-case scenario.

7. Conclusions

In the completed FLEXI-TES project, the integration of thermal energy storage systems in coal-fired power plants was comprehensively investigated scientifically for the first time. Through the project results, major conclusions can be drawn on these complex topics. Equipping and retrofitting coal-fired power plants with thermal energy storage systems is a cost-effective way to increase the flexibility and, thus, also the economic efficiency of these power plants. Short-term implementations can also be realized with existing storage technologies, although this requires careful adaptation to the power plant process. High-temperature variants perform best in terms of investment costs, efficiency, and flexibility window but also have higher technical hurdles. Molten salt storage technology is a preferred solution for integration into the steam cycle. It allows retrofitting and has comparatively low investment costs but a moderate efficiency of 46%. The solid media heat storage technology is basically a suitable solution for integration into the flue gas path. However, due to the integration effort, it is only suitable for new installations and has a high efficiency of 63%. Despite low costs and good technical feasibility, the technology path of integrating thermal energy storage in coal-fired power plants has a difficult revenue situation; however, this currently applies to all electricity storage technologies on a power plant scale.

Author Contributions

This paper was mainly written by M.K., under support from S.M., E.Ç., D.L., V.D. and P.K.; M.K. was the project leader of the FLEXI-TES project. V.D. supplied the part of solid media heat storage under support from M.K.; F.K. provided the part of molten salt storage system and P.K. supplied the Ruths-type steam storage part. The power plant simulations were mainly carried out by S.M., the transfer of the technical results to a reference power plant by D.L. and the economic evaluations by E.Ç. under support from S.P. All authors have read and agreed to the published version of the manuscript.

Funding

This project received funding from the German Federal Ministry for Economic Affairs and Energy (BMWi) under grant agreement No. 03ET7055.

Institutional Review Board Statement

Not applicable.

Informed Consent Statement

Not applicable.

Data Availability Statement

Not applicable.

Conflicts of Interest

The authors declare no conflict of interest. The funders had no role in the design of the study; in the collection, analyses, or interpretation of data; in the writing of the manuscript, or in the decision to publish the results.

References

  1. Institut für Energietechnik der Technischen Universität Hamburg-Harburg. Available online: https://www.tuhh.de/iet/en/research/completed-research-projects/dynstart.html (accessed on 20 December 2021).
  2. Stahl, K.; Moser, P.; Marquardt, R.; Siebert, M.; Kessler, S.; Maier, F.; Krüger, M.; Zunft, S.; Dreißigacker, V.; Hahn, J. Flexibilisierung von Gas- und Dampfturbinenkraftwerken durch den Einsatz von Hochtemperatur-Wärmespeichern (FleGs): F&E Vorhaben zur Vorbereitung von Hochtemperatur-Wärmespeichern und deren Integration in den Gas- und Dampfturbinenprozess. BMWi 2012. [Google Scholar] [CrossRef]
  3. Johnson, M.; Fiss, M.; Dengel, A.; Bauer, D. Commissioning of High Temperature Thermal Energy Storage for High Power Levels; Enerstock: Ljubljana, Slovenia, 2021. [Google Scholar]
  4. Beckmann, G.; Gilli, P.V. Thermal Energy Storage; Springer: Wien, Austria, 1984. [Google Scholar]
  5. Goldstern, W. Dampfspeicheranlagen; Springer: Berlin, Germany, 1963. [Google Scholar]
  6. Goldstern, W. Steam Storage Installations; Pergamon Press: Oxford, UK, 1970. [Google Scholar]
  7. Jentsch, N.; Jochmann, A.; Kratzsch, A.; Braun, S. Auslegung von Energiespeichern und Integration in konventionelle Bestandskraftwerke; Kraftwerkstechnisches Kolloquium: Dresden, Germany, 2013. [Google Scholar]
  8. Li, D.; Wang, J. Study of supercritical power plant integration with high temperature thermal energy storage for flexible operation. J. Energy Storage 2018, 20, 140–152. [Google Scholar] [CrossRef]
  9. Cao, R.; Lu, Y.; Yu, D.; Guo, Y.; Bao, W.; Zhang, Z.; Yang, C. A novel approach to improving load flexibility of coal-fired power plant by integrating high temperature thermal energy storage through additional thermodynamic cycle. Appl. Therm. Eng. 2020, 173, 115225. [Google Scholar] [CrossRef]
  10. Sun, Y.; Xu, C.; Xin, T.; Xu, G.; Yang, Y. A comprehensive analysis of a thermal energy storage concept based on low-rank coal pre-drying for reducing the minimum load of coal-fired power plants. Appl. Therm. Eng. 2019, 156, 77–90. [Google Scholar] [CrossRef]
  11. Drost, M.K.; Antoniak, Z.I.; Brown, D.R.; Sathyanarayana, K. Thermal Energy Storage for Power Generation. U.S. Department of Energy (under Contract DE-AC06-76RLO 1830); Battelle: Columbus, OH, USA, 1989. [Google Scholar]
  12. WiWo Green. Available online: http://green.wiwo.de/mannheim-bunkert-grunen-strom/ (accessed on 20 December 2021).
  13. Vattenfall Europe Wärme AG. Available online: https://www.yumpu.com/de/document/read/21093887/infoblatt-warmespeicher-pdf-460-kb-vattenfall (accessed on 20 December 2021).
  14. Futurezone. Available online: https://futurezone.at/digital-life/wiener-waermespeicher-mit-hochdruck-technologie/39.860.903 (accessed on 20 December 2021).
  15. Vattenfall GmbH. Innovationskraftwerk Wedel. Available online: https://www.eg-westholstein.de/fileadmin/Dokumente/Foren/130524_Energie_Erker_Innovationskraftwerk_Wedel.pdf (accessed on 20 December 2021).
  16. VGB PowerTech e.V., Essen (VGB); Deutsches Zentrum für Luft- und Raumfahrt e.V., Stuttgart (DLR); ewi Energy Research & Scenarios gGmbH, Köln (EWI); Mitsubishi Hitachi Power Systems Europe GmbH, Duisburg (MHPSE); Siemens AG—Energy Sector, Mülheim an der Ruhr (SIEMENS); STEAG Energy Services GmbH, Essen (STEAG); Universität Duisburg-Essen, Essen (LUAT). Partner-Dampfkraftwerk für die Regenerative Stromerzeugung (P-DKW)—Final Report; VGB PowerTech e.V.: Essen, Germany, 2016. [Google Scholar] [CrossRef]
  17. Krüger, M.; Muslubas, S.; Loeper, T.; Klasing, F.; Knödler, P.; Mielke, C. Potentials of Thermal Energy Storage Integrated into Steam Power Plants. Energies 2020, 13, 2226. [Google Scholar] [CrossRef]
  18. Çam, E. Optimal dispatch of a coal-fired power plant with integrated thermal energy storage. EWI Work. Pap. 2020, 20/05. ISSN 1862-3808. [Google Scholar]
  19. BEIS. Fossil Fuel Price Assumptions. Available online: https://www.gov.uk/government/publications/fossil-fuel-price-assumptions-2017 (accessed on 20 December 2021).
  20. Richter, J. DIMENSION—A dispatch and investment model for European electricity markets. EWI Work. Pap. 2011, 11/03. ISSN 1862-3808. [Google Scholar]
Figure 1. Thermal circuit diagram of an 800-MW power plant with molten salt storage (concept HRH-HPPH9_indirectly).
Energies 15 03388 g001
Figure 2. Thermal circuit diagram of an 800-MW power plant with Ruths storage (concept CRH/LS-HPPH7_directly).
Energies 15 03388 g002
Figure 3. Thermal circuit diagram of an 800-MW power plant with solid media heat storage (concept Flue gas-Air_indirectly).
Energies 15 03388 g003
Figure 4. Course of net power over the entire simulation period (concept HRH-HPPH9_indirectly).
Energies 15 03388 g004
Figure 5. Curves of important process variables during the first discharge process (concept HRH-HPPH9_indirectly).
Energies 15 03388 g005
Figure 6. Course of net power over the entire simulation period (CRH/LS-HPPH7_directly concept).
Energies 15 03388 g006
Figure 7. Characteristics of the essential parameters during the discharging and charging process (CRH/LS-HPPH7_directly concept).
Energies 15 03388 g007
Figure 8. Course of net power over the entire simulation period (Flue gas-Air_indirectly concept).
Energies 15 03388 g008
Figure 9. Characteristics of the selected variables during the discharge process (Flue gas-Air_indirectly concept).
Energies 15 03388 g009
Figure 10. Iterative calculation scheme for the thermodynamic description of the storage state of a Ruths storage tank.
Energies 15 03388 g010
Figure 11. Model extension to include heat loss effects and inertias for solid media heat storage.
Energies 15 03388 g011
Figure 12. Detailed variation calculations for the storage option “molten salt” (concept HRH-HPPH9_indirectly).
Energies 15 03388 g012
Figure 13. Storage tank temperature, volume, mass as a function of discharge pressure.
Energies 15 03388 g013
Figure 14. Cost of the entire storage system.
Energies 15 03388 g014
Figure 15. Cyclic temperature curves with different configurations: (a) Without insulation; (b) With insulation.
Energies 15 03388 g015
Figure 16. Relationship between water level and storage volume.
Energies 15 03388 g016
Figure 17. Detailed variation calculations for the storage option “solid media heat storage” (concept Flue gas-Air_indirectly) (1).
Energies 15 03388 g017
Figure 18. Detailed variation calculations for the storage option “solid media heat storage” (concept Flue gas-Air_indirectly) (2).
Energies 15 03388 g018
Figure 19. Experimental setup: (a) honeycomb inventory and insulation; (b) HOTREG test facility.
Energies 15 03388 g019
Figure 20. Measurement setup: (a) measurement levels in the drawing; (b) positions and number of thermocouples.
Energies 15 03388 g020
Figure 21. Test T1—Fluid temperature (TF), measurement (M), simulation (S): (a) temperature at bed height 0.3 m (red), 0.9 m (blue), 1.5 m (green); (b) temperature in the hot-side (top)/cold-side (bottom) manifold.
Energies 15 03388 g021
Figure 22. Test T2—Fluid temperature (TF), measurement (M), simulation (S): (a) temperature at bed height 0.3 m (red), 0.9 m (blue), 1.5 m (green); (b) temperature in the hot-side (top)/cold-side (bottom) manifold.
Energies 15 03388 g022
Figure 23. Test T3—Fluid temperature (TF), measurement (M), simulation (S): (a) temperature at bed height 0.3 m (red), 0.9 m (blue), 1.5 m (green); (b) temperature in the hot-side (top)/cold-side (bottom) manifold.
Energies 15 03388 g023
Figure 24. Test T4—Fluid temperature (TF), measurement (M), simulation (S): (a) temperature at bed height 0.3 m (red), 0.9 m (blue), 1.5 m (green); (b) temperature in the hot-side (top)/cold-side (bottom) manifold.
Energies 15 03388 g024
Figure 25. Process flow diagram connecting piping systems (concept HRH-HPPH9_indirectly).
Energies 15 03388 g025
Figure 26. Layout planning concept HRH-HPPH9_indirectly—Site plan.
Energies 15 03388 g026
Figure 27. Day-Ahead and Intraday prices in Germany in 2030.
Energies 15 03388 g027
Figure 28. SCR and PCR prices in Germany in 2030.
Energies 15 03388 g028
Figure 29. Specific profits through TES per year for different storage sizes (worst-case scenario in red, baseline scenarios in yellow, best-case scenario in green).
Energies 15 03388 g029
Figure 30. Payback period in years (payback period, not discounted).
Energies 15 03388 g030
Table 1. Test series.
TChargingDischarging
Mass FlowTemperatureDuration (max.)Mass FlowTemperatureDuration (max.)
1675 kg/h580 °C148 min720 kg/h100 °C148 min
2675 kg/h645 °C148 min720 kg/h100 °C148 min
3509 kg/h580 °C120 min509 kg/h87 °C120 min
4360 kg/h645 °C296 min720 kg/h100 °C148 min
Table 2. Resulting pipeline lengths for concept HRH-HPPH9_indirectly.
Concept HRH-HPPH9_indirectlyDi [mm]MediumLength [m]Material
Feed-water inlet470Feed-water~19.815NiCuMoNb5-6-4
Feed-water outlet470Feed-water~38.715NiCuMoNb5-6-4
Steam inlet600RH Steam~41.0X10CrWMoVNb9-2
Steam inlet850RH Steam~66.5X10CrWMoVNb9-2
Bypass500RH Steam~8.0X10CrWMoVNb9-2
Steam outlet700RH Steam~59.1X10CrWMoVNb9-2
Steam outlet1400RH Steam~15.0X10CrWMoVNb9-2
Table 3. Integration costs.
ConceptProcess Engineering
(BEC Mill. EUR)
Electrotechnical/Control Technology
(BEC Mill. EUR)
Addition Civil Engineering (BEC Mill. EUR)TASC
(Mill. EUR)
HRH-HPPH9_indirectly4.451.080.79.5
CRH/LS-HPPH7_directly 7.65
Table 4. Input parameters for the reference power plant.
Full load739MWel
Minimum load148MWel
Efficiency at full load46%
Efficiency at minimum load36.8%
Start-up time3h
Shutdown time2.5h
Start-up costs142,500EUR
Variable costsBase and Best: 21.89EUR/MWhth
Worst: 22.20
Positive load gradient1.35%/min (9.97 MW/min)
Negative load gradient1.35%/min (9.97 MW/min)
Table 5. Calculation of variable costs from the scenario fuel assumptions (shown for baseline 2030).
Thermal Coal Price80.50EUR/t
conversion to EUR/tce93.92EUR/tce
+12 EUR/tce
domestic transport costs
105.90EUR/tce
conversion to EUR/MWhth13.04EUR/MWhth
CO2-price26.30EUR/t CO2
CO2 emissions0.337tCO2/MWhth
CO2 costs8.853EUR/MWhth
Total variable costs21.89EUR/MWhth
Table 6. Annual operating results of the power plant without TES.
Profits
(Mil. EUR/a)
Full-Load-Hours (h/a)Number of Startups/a
2030 Worst-Case Scenario66.1572013
2030 Baseline Scenario131.464667
2030 Best-Case Scenario134.260419
Table 7. Parameters of the lead concepts.
TES-ConceptsPlant Load LevelMax. Charging Power (MWel)Max. Discharging Power (MWel)TES-Efficiency
HRH-HPPH9_indirectly20%19.51.445.90%
100%66.433.2
CRH/LS-HPPH7_directly 20%27.42.776.10%
100%22.318.4
Flue gas-Air_indirectly 20%20.41663.30%
100%23.111.5
Table 8. Absolute profits in relation to the storage size in million EUR/a (baseline).
Storage Capacity (h)HRH-HPPH9_indirectlyCRH/LS-HPPH7_directlyFlue Gas-Air_indirectly
0.250.840.780.49
0.51.391.290.80
11.982.061.28
22.402.671.64
32.603.001.83
42.723.221.96
62.853.492.1
82.913.642.18
Table 9. Investment costs in relation to storage size (discharge hours at full load) in EUR million.
Storage Capacity (h)HRH-HPPH9_indirectlyCRH/LS-HPPH7_directlyFlue Gas-Air_indirectly
0.254.34.43.3
0.55.18.33.8
16.416.24.5
28.631.45.7
412.462.27.9
617.591.19.8
821.2120.712
Table 10. Total costs in relation to storage size (discharge hours at full load) in EUR million.
Storage Capacity (h)HRH-HPPH9_indirectlyCRH/LS-HPPH7_directly
0.2513.812.05
0.514.615.95
115.923.85
218.139.05
421.969.85
627.098.75
830.7128.35
Table 11. TES Total costs for the selected optimal storage sizes.
Discharge PowerDischarge DurationInvestment CostsIntegration CostsTotal
(MWel)(h)(Mil. €)(Mil. €)(Mil. €)
HRH-HPPH9_indirectly33.228.69.518.1
CRH/LS-HPPH7_directly18.4116.27.6523.85
Flue gas-Air_indirectly *11.525.7
* The integration costs of Flue gas-Air_indirectly, which is suitable for a new-build power plant, were not determined. A comparison with other concepts regarding integration costs was therefore not possible.
Table 12. Payback period in years for investment costs (without integration costs).
Payback PeriodDiscounted Payback Period (4%)Discounted Payback Period (8%)
Worst CaseBaseBest CaseWorst CaseBaseBest CaseWorst CaseBaseBest Case
HRH-HPPH9_indirectly5.63.62.26.43.92.37.74.42.5
CRH/LS-HPPH7_directly10.77.95.514.29.66.425.112.97.6
Flue gas-Air_indirectly4.73.52.25.33.82.46.14.22.5
Table 13. Payback period in years for total costs.
Payback PeriodDiscounted Payback Period (4%)Discounted Payback Period (8%)
Worst CaseBaseBest CaseWorst CaseBaseBest CaseWorst CaseBaseBest Case
HRH-HPPH9_indirectly11.77.54.616.29.15.136.512.05.9
CRH/LS-HPPH7_directly15.711.68.125.315.810.0>8033.713.6
Flue gas-Air_indirectly *
* The integration costs of Flue gas-Air_indirectly, which is suitable for a new-build power plant, were not determined. A comparison with other concepts regarding integration costs was therefore not possible.
Publisher’s Note: MDPI stays neutral with regard to jurisdictional claims in published maps and institutional affiliations.