1. Introduction
Decarbonization actions are the core of the European energy strategies: as a result of the efforts of the recent years, they have produced not only technical and economic efficiency improvements, but also the definition of new policies and business models, most of which are based on the aggregation concept. According to the EU 2019/944 Directive, an aggregation is a function performed by a natural or legal person who combines multiple customer loads or generated electricity for sale, purchase, or auction in any electricity market, with the expectation that new democratic forms of citizen participation are brought forward [
1,
2].
In this framework, new structurers of collaborations emerge, such as collective self-consumption, Virtual Power Plants (VPP), Peer-to-Peer energy trading schemes (P2P), or aggregators [
1,
2,
3,
4]. In particular, the aggregator, overcoming the actual technological and legal barriers that avoid the participation to the energy market also at consumers [
5], can participate in the long-term, short-term, and reserve markets by combining in an optimal way multiple assets in a single portfolio (distributed energy resources, but also technology to perform Demand Response) [
5,
6]. An aggregator can help both upstream and downstream market participants [
7], providing, in the first case, resources to the market operators, to manage system balancing and resolve the congestions, and, in the second case, maximizing revenues and reducing costs for all customers.
Summarizing, the aggregator provides several benefits include enabling: (i) ancillary services; (ii) real time demand-side management, through which commercial and industrial loads can be shifted in real time; (iii) flexibility at the power system level to increase the share of Distributed Energy Resources (DER), especially renewable; and (iv) local flexibility, through which aggregators can provide flexibility at the Distribution System Operator (DSO) level [
8,
9].
In the literature, it is possible to identify several aggregator business models. However, two are main aggregator’s business models: in the first, existing suppliers are clustered in an aggregator’s structure to better engage with customers; in the second, independent aggregators cluster and manage assets of most new profitable customers, i.e., residential loads as well as distributed storage and electrified transportation options, that previously act alone [
10].
In Italy, the second one is allowed, and the aggregator business model is applied to the UVAM (Unità Virtuali Abilitate Miste), an Italian virtual aggregation of mixed units (consumption, production, and storage units). The Italian large-scale pilot project UVAM, fully operational since January 2019, is one of the biggest projects of this type in all of Europe. The participation of new players in the market, able to act for several aggregated units, makes the market design highly complex, with positive and negative market developments [
11].
According to 422/2018/R/eel (According to the previous Authority’s Resolution n. 300/2017/R/eel) Italian Resolution, distributed resources belonging to the UVAM can participate as aggregates in the Ancillary Services Market (ASM), after obtaining authorization from TERNA S.p.A., the Italian Transmission System Operator (TSO) providing support for one or more of the following services: congestion resolution; rotating tertiary reserve; tertiary replacement reserve and balance and, for each of them, it can provide the service in the “upward” and/or “downward” model [
12].
As can be easily understood, the large number of actors involved creates a dynamic and complex energy system. The responsibility to manage this system, ensuring the stability between supply and demand is maintained in every time, is entrusted to the Energy Management System (EMS). Several methods are used by EMS to prepare the optimal scheduling and to ensure the efficient operation of the units. There are methods, such as dynamic programming, that decompose the complex problem into sub-problems, each of them characterized by an optimal solution. The solution for the original problem is obtained from the intersection of the optimal solutions’ set. Always belong to the Mathematical Problem, Mixed-integer linear programming (MILP) involves problems in which only some of the variables are constrained to be integers, while other variables are allowed to be non-integers. In [
13], Ahmad et al. used MILP to optimize the energy management of a microgrid (MG), reducing the peak loads of the system; while in [
14], the authors used MILP to reduce the operational cost of a MG. In [
15] instead, a MILP to minimize the total energy costs of all participants of the microgrid composed by PV and battery energy storage system that take part to the energy market. A quadratic programming is chosen in [
16] to determine the optimal economic dispatch of a MG. Heuristic techniques are approaches used in situations where a short-term solution is required. Indeed, they study the problem starting from similar situations, and they used practical methods to produce solutions that may not be optimal, but are sufficiently reliable in determining situations. They are combined to approximate the best solution using genetic algorithms, biological evolution, and statistical mechanisms for achieving optimal operation and control of microgrid energy [
17]. Both [
18,
19] use a genetic algorithm: the first to minimize the operating costs, the second to reduce operational and life cycle costs, and dump energy. In [
20,
21], the authors used fuzzy logic control to minimize both the costs of the generating units and the emission levels of the fossil fuel sources of a microgrid. Metaheuristics are methods to solve complex problems characterized by a higher-level strategy based on a heuristic method. The metaheuristics can be distinguished into metaheuristics with single solution, in which a succession of solutions is calculated, and the solution is updated only if the new one satisfies a predefined criterion, and metaheuristics based on population, where many entities are simultaneously sent in parallel to solve the same problem [
22]. Swarm algorithm is used by [
23] to minimize both the capital and fuel costs of a MG, by Hossain et al., whose model for charging and discharging a battery allows them to reduce the operation cost of a MG in significant way. A multi-objective, intelligent energy management system for a MG that minimizes the operational costs and environmental impact by an artificial neural network, as soon as [
24], who use neural networks to predict wind turbine generation. Multi-agents used on microgrids allow a decentralized management of the microgrid and consist of sections having autonomous behavior to execute the tasks with defined objectives. Stochastic methods and robust programming are used to solve the optimization functions when the parameters have random variables, particularly in artificial neural networks, fuzzy logic, and game theory [
25]. Predictive control techniques are used in applications where the accurate forecasting of loads (or generation) is requested to guarantee effective management of the grid (i.e., all the grids in which the percentage of renewable energy sources is relevant). This typically combines stochastic programming and control [
26]. Different from other papers in the literature [
27,
28,
29,
30], this work aims to evaluate the profitability for users and aggregator involved in the UVAM providing an innovative methodology, that is articulated in two steps: (1) a cost–Benefit Analysis (CBA), which aims to identify the main costs/benefits parameters’ impact on the revenues of the UVAM, (2) a Sensitive Analysis (SA), which aims to provide a strategic decision making tool. In fact, one of the key problems with CBA is that it cannot stand alone in the decision-making process.
Specifically, a CBA represents an independent study that compares the costs and benefits of two or more viable and mutually exclusive alternatives (not including the status quo) in order to make an effective decision on a preferred alternative. In order to overcome this limit, a sensitive analysis is developed with the aim to help the decision maker to take the most convenient choice [
31]. In particular, the SA model aims to capture the optimal interaction between consumers and the aggregator, through the identification of a region of convenience obtained by the intersection between the aggregator’s revenue curve and the users’ revenues curve. The power of the model is connected to identify the “working point” within the common convenience area aggregator-users, that is the point at which the optimal economic value can be reached for both the aggregator and the end consumers. The obtained results show different optimal “working points” depending on the specific aggregator–consumers’ strategy. Then, the proposed methodology is assessed through the analysis of a case study consisting of a UVAM placed in the South of Italy.
The paper is structured as follows. After a description of the Italian Electricity Market (
Section 2), the methodology applied is presented in
Section 3. The model formulation is shown and discussed in
Section 4, while in
Section 5, a case study is implemented based on the operation of a UVAM consisting of 5000 residential users equipped with a PV power system of 3.3 kW. The feasibility and effectiveness of the proposed approach is shown and discussed by numerical results in
Section 6. Finally, conclusions and the main findings are reported.
Novelty
The main contribution of this research work relative to the already existing studies is provided below:
A real case study is analyzed. The UVAM (Unità Virtuali Abilitate Miste) pilot project has started in 2019, enabling consumption and production units as well as storage systems.
Starting from an overview of participation requirements and remuneration mechanisms, this paper aims to analyze the real barriers that could slow down the diffusion of these new aggregations of consumption and generation (i.e., the platform costs). Indeed, the diffusion of these new systems allow a reduction of CO2 thanks to a greater diffusion of renewable sources, a reduction in the cost of energy (in part due to the elimination of transmission charges, in part of the revenue obtained by the energy sell in the electricity market), and a reduction of the electric load peaks because each system is partially self-sufficient.
Different from the other works existing in the literature, we do not propose a new optimization model, but a methodology with the aim to identify the parameters that impact on the choices of both the consumers and the aggregators. The reasons are twofold: first, as we said, we analyze a real system, so the algorithm and several platforms that allows it to work already exists. It could be very difficult, in this phase, to propose TERNA to test new models and accept new algorithms. Then, we want to investigate the parameters able to increase the social acceptability of this “technology” in order to propose new improvement actions. The sensitivity analysis also allows us to understand how much the variation of one parameter can impact on the others and until it is convenient to move in one direction rather than another.
2. Italian Electricity Market
The aim of the electricity market is to ensure a balance between supply and demand at the most effective cost. The Italian Electricity Market is composed by Spot Electricity Market (MPE), where the electrical energy is traded for immediate physical delivery, and by the Forward Electricity Market, where forward electricity contracts with delivery and withdrawal obligation are traded (MTE). MPE structure, in particular, is articulated in several different temporal sequences: Day-Ahead Market (DAM); Ancillary Services market (ASM), Market (MPEG), and Intra-Day Market (IM), as shown in
Figure 1.
In this work, the authors, leaving out the part of the market that is more closely related to financial aspects, focused on the ASM market, as the UVAM can provide services only to this branch of the Italian market structure (according to the 422/2018).
The ASM is the venue where TSO procures the resources that it requires for managing and monitoring the system relief of intra-zonal congestions, creation of energy reserve, and real-time balancing.
The ASM facilitates the trading of services and improves the competition among different involved stakeholders. Generally, the TSO is the operator and sole purchaser of products in the ASM, while sellers include the prequalified generators and, in some cases, demand response (involving large consumers and aggregators) and storage facilities. Ancillary services (AS) are provided by flexible actors (Balancing Services Provider—BSP) able to adjust their consumption or generation output to rebalance the system in case of imbalance and they are clustered in Frequency Control, Voltage Control, Black Start Capability, Congestion Management and Balance. A brief description of each of them is reported below [
32]:
- -
Frequency Control consists in containing, within predetermined limits, the oscillations of the mains frequency caused by imbalances between generated power and absorbed power. This is caused both due to the unpredictability with which users change their withdrawal, and to the occurrence of component failures. If frequency is above its nominal value, it means that there is more generation than consumption and vice versa.
- -
Voltage Control concerns the reactive power and consists in supporting the operation of the grid through the continuous control of the voltage levels in order to ensure the electrical system stability. To provide the service, the appropriate level of reactive power is required to be injected at specific locations of the system.
- -
Black Start Capability concerns the set of actions to be taken to re-energize the entire network or a part of it, putting the generation groups back into operation in the absence of voltage. It is the service provided by units that can inject energy into the system (black-start units), without any electrical energy supply external to the power generating facility, following a general or partial system operation interruption (shut down).
- -
Congestion Management is necessary to prevent congestion phenomena that happen every time that the energy exchanges along a transmission line exceed the capacity of the same transmission line. Load shedding and rescheduling of generating units for the purpose of congestion management are two alternative actions admitted to re-balance the system.
- -
Balance consists of the continuous submission of offers, with hourly readings for the 24 h of flow the day before.
To provide the ancillary services, a “Downward flexibility” or “Upward” flexibility is requested.
“Downward flexibility” is defined as the TSO requirement of reduction of input energy into the grid or a greater energy absorption by the aggregate energy system. It is possible to operate, as a matter of priority, by disconnecting, for example, the PV systems. The amount of regulation produced does not depend on the system peak power, but on the power delivered at the time of the request.
An “Upward” demand for flexibility is instead configured as a request by the TSO to the aggregate energy system to inject a greater quantity of energy into the grid or to absorb a smaller quantity than ordinary consumption.
For upward reserve, TSO remunerates the BSPs for extra-energy generated: TSO activates reserves in increasing order of bid prices. For downward reserves, Balancing Responsible Parties (BRPs) remunerate TSOs for energy not produced due to reserve activation: TSO activates reserves in decreasing order of bid prices.
In the past, AS services were provided only by large production units such as generators, but with the integration of more intermittent generation and the development of smart grid technologies, the provision of AS is extended to smaller distributed generation and consumption units aggregated through the UVAMs. A UVAM includes five fundamental elements (see
Figure 2):
Peripheral Monitoring Unit (PMU);
Concentrator;
Communication between PMU and Concentrator;
Communication between Concentrator and Grid operator;
Energy Management Platform (EMP).
The PMU, a device connected to each point of delivery, performs the function of detecting and sending the system measurements (production and/or consumption) in real-time to a remote center.
The concentrator essentially develops the function of a server connected through the data network among the various PMUs and the Control System, which allows the data and information real-time acquisition from the plants whose operations influence the functioning of the National Transmission Grid.
In communication between the PMU and concentrator, the communication protocol and the connection cost used among the PMU and the concentrator may vary according to the devices and technology providers have chosen.
In communication between the concentrator and Grid operator, a specific code regulates the communication between the Grid Operator and the concentrator. The aggregators are not authorized to choose the way of communication to establish with Terna. Further technological evolutions must necessarily come from Terna S.p.A. provisions. The connection costs differ according to the typology of connection chosen.
Finally, another essential element for the UVAM function is the EMP. The EMP optimizes operation by interfacing with the concentrator. This software platform may present more or less complexity depending on the optimization algorithms implemented within it (e.g., forecasting, cybersecurity, etc.); these algorithms receive a series of input data (both technical and economic from Terna S.p.A. and prosumers) and return the distribution of orders as output dispatching between the different UVAM units.
4. The Models Formulation
In this section, the models used for the CBA and SA will be made explicit. Regarding the CBA model, it is supposed that for what concerns the costs, the evaluation requires the distinction between the case of requests for flexibility “Upward” and “Downward” made by the TSO and that the design of the optimal UVAM configuration is supposedly known.
In the case of “Upward” requests, these costs depend exclusively on the amount of energy exchanged (E) annually, and can be calculated as:
where:
- -
E is the total energy exchanged annually (MWh);
- -
PPA-P represents the purchase price of energy by prosumers (€/MWh);
- -
CoSTO represents the coefficient related to the storage system (%);
- -
CoInt-Loads represents the coefficient concerning the initial hypothesis that the energy must be balanced by disconnecting internal loads from the aggregate energy system (%);
- -
CDisc-Loads represents the cost linked to the disconnection of internal loads (remuneration for the inconvenience) (€);
- -
CoSTO + CoInt-Loads= 1.
For the “Downward” requests, the case where the total power can be balanced by detaching the PV energy production plants has been considered exclusively. In particular, the cost of regulation for users (taking into account the percentages described in
Section 4) can be expressed as follows:
where:
- -
Eb is the overall energy to be balanced (MWh);
- -
RBF represents the rate of energy balanced through the failure to inject the surpluses production by the aggregator into the network (-);
- -
SPP-A represents the sale price of energy from prosumers to the aggregator (€/MWh);
- -
BRHCA represents the balanced rate through a higher collection of energy from the network, by the aggregator, due to the failure of the prosumers to sell excess energy (-);
- -
BRHCP represents the balanced rate through a higher collection from the network by prosumers, due to the lack of self-consumption of energy from photovoltaic (PV) systems (-);
- -
PPA-P is the purchase price of energy charged by the aggregator to prosumers (€/MWh);
As mentioned, “downward flexibility” takes the form of a reduction in the input of energy into the grid or a greater absorption by the aggregate energy system. To contribute to the downward flexibility, a first action that can be put into practice is the detachment of PV systems, as above supposed [
40]. Considering the reduction in injection into the grid, this will mean that prosumers will be forced to purchase energy that they previously drew from the PV system, and therefore the aggregate system will absorb additional power from the grid. Similarly, EMS will not purchase the necessary power from prosumers, but will have to purchase it from the network to resell it within the aggregate energy system. What has been said will be better clarified in the case study.
As concerns total annual revenues related to UVAM (R
UVAM) can be calculated according to the following equation:
where:
- -
RFF represents the revenues deriving from the fixed fee, which does not depend on any other balancing factor (€);
- -
SP is the sale price of energy to the TSO, which has been varied in the simulation (€/MWh);
- -
Q is the amount of energy injected or absorbed annually based on the requests made by the TSO (MWh).
The annual revenues of the aggregator (R
A) can be calculated according to the following equation:
where:
- -
PA represents the percentage of revenues for the aggregator (%).
Finally, based on the assumptions described above, the economic analysis of UVAM’s costs and revenues for prosumers was calculated as a complementary part of the aggregator’s revenues. In this sense, revenues for users have been evaluated with the following relationship:
where:
represents the percentage of revenues, related to the aggregator (%), which has been varied from 10% to 100%.
The model developed was applied to a specific case study. As reported in
Figure 4:
From the application of the model (Equations (1)–(5)), through a sensitivity analysis, on the amount of energy exchanged and on the sale energy price, diagrams were obtained that showed the curves trend underneath the profit areas of the aggregator and of the users. From the intersection of the results, the shared areas of convenience were observed. These areas show the set of operating points of the UVAM, in which a profit margin is shown for both the aggregator and the users. It is worth noting that a SA generally investigates how the variation in the output of a numerical model can be attributed to variations of its input factors. It is generally used with the goal to verify the consistency of the model behavior [
40]. In this study, on the other hand, the SA identifies the profit areas that have been recognized separately for aggregator and users, itself constituting a part of the cost–benefit model.
The model developed was applied to a specific case study as specified in the next section.
5. Case study
5.1. System Assumptions
The proposed model is tested on a grid-connected UVAM, located in the South of Italy. The hypotheses underlying the case study are reported below:
- -
The case study consists of 5000 residential users, 1250 are only consumers, while 3750 prosumers, and each of the residential users has an available withdrawal power of 3.3 kW and an annual energy requirement of 5000 kWh.
- -
It is assumed that each prosumer is equipped with a PV system characterized by a nominal power of 3 kWp. The PVs installed within the aggregate system provide an estimated annual producibility, equal to 1430 kWh/kWp [
41] (i.e., for the 3 kW plant, equal to 4290 kWh/year). Finally, it is supposed that each prosumer is provided by a Li-ion storage system with a capacity of 3 kWh.
- -
It is supposed that the energy produced in surplus by the prosumers can be reused according to the following alternatives: sale within the aggregate energy system; sale to the “wholesale market”, using the Zonal Price (ZP) according to the forms provided by the current regulatory framework or offered in the ASM.
- -
The aggregate energy system is regulated by a subject, called Energy Management System (EMS), which has the task of providing electricity to all users by using, as a priority, the surplus produced by PV systems and, secondly, by purchasing electricity from the grid and reselling it to the users themselves.
- -
It is assumed that the UVAM balancing capacity is equal to 4 MW to participate in the ASM, according to the requirements described in [
42].
- -
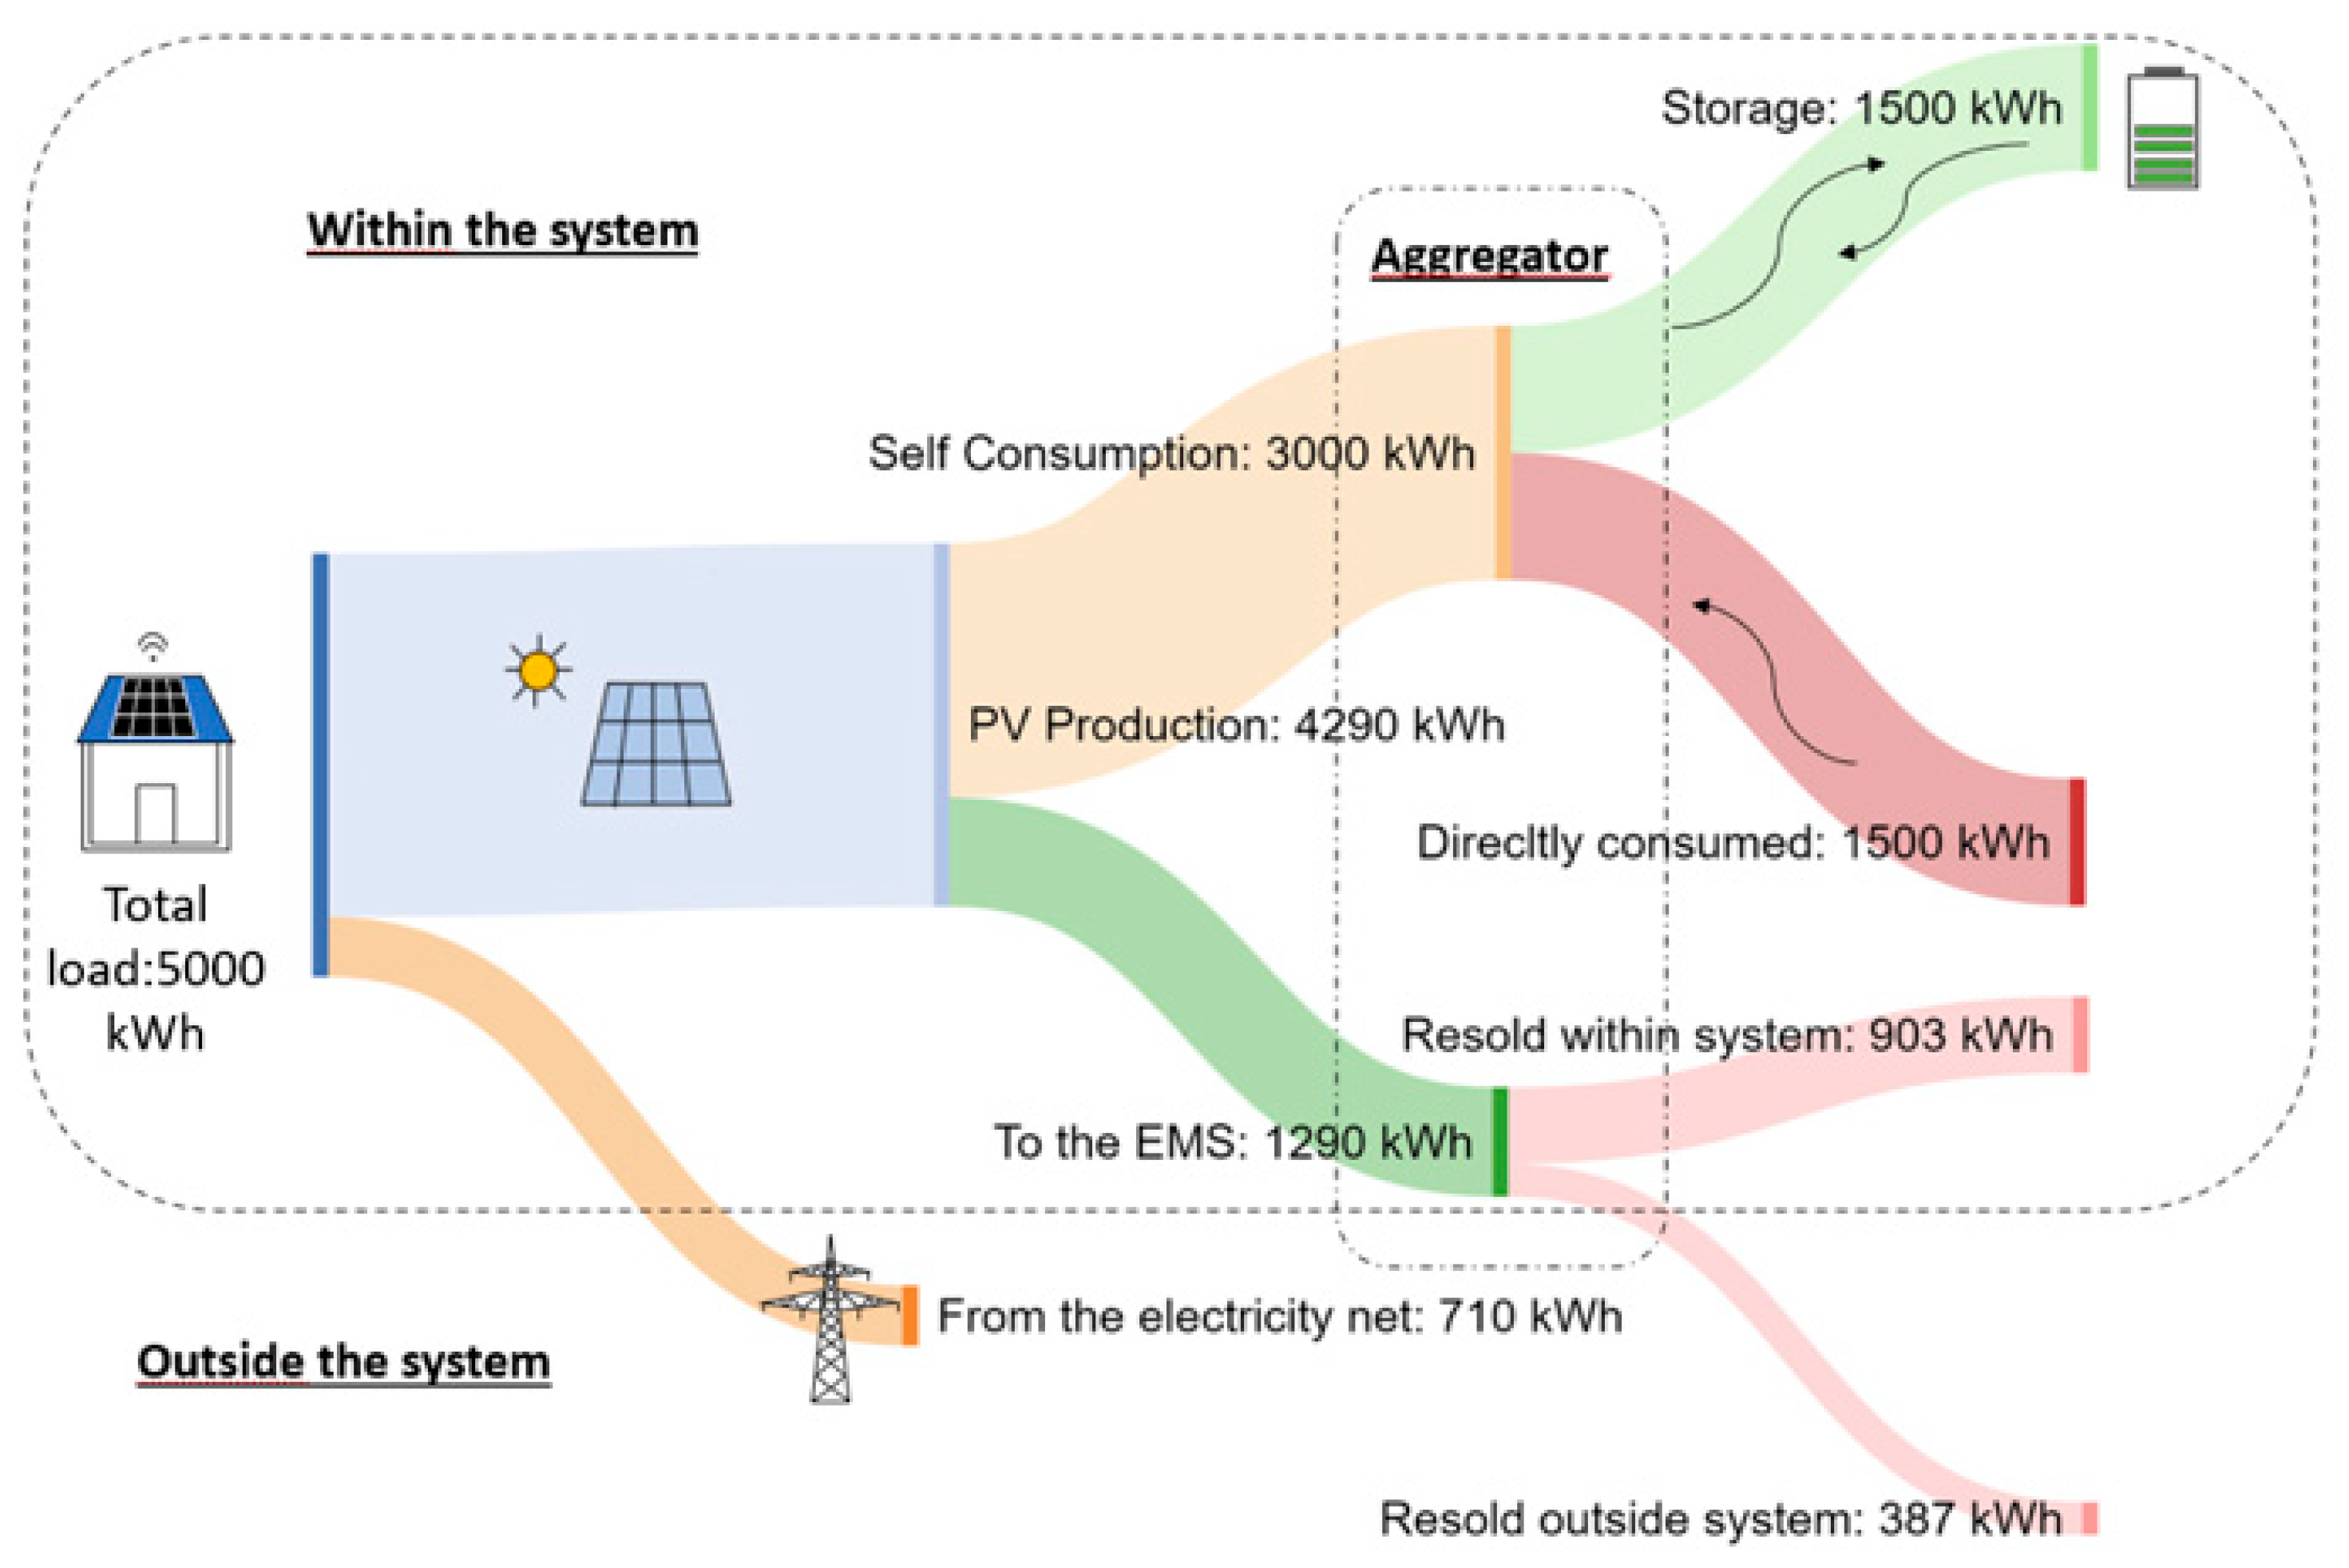
According to the previous assumptions, for the model arrangement, it was supposed that each prosumer realizes an overall self-consumption of 70% of the necessary energy (from direct PV production, with an average incidence of 50%, and energy from PV stored inside the storage systems). Therefore, as reported in
Figure 5, if each prosumer consumes 5000 kWh/year, it is assumed that:
- -
1500 kWh accounts for the rate consumed at the same time as production by the PV system;
- -
1500 kWh are taken from the storage systems powered by the PV system;
- -
2000 kWh are purchased by the EMS.
Consequently, of the 4290 kWh/year produced by the PV system, 3000 kWh are used by the prosumers, and the additional 1290 kWh are sold to the EMS. Afterwards, it is assumed that the aggregator/EMS reserves 70% of the energy (903 kWh) for the sale of the aggregate system users and the remaining part to the external grid (387 kWh). In these hypotheses, the entire PV energy production (4290 kWh) is divided as follows:
- -
70% (3000 kWh) is self-consumed by the prosumers;
- -
21% (903 kWh) is purchased by EMS and resold within the aggregate energy system;
- -
9% (387 kWh) is purchased by EMS and resold to the external grid.
5.2. Aggregator Assumptions
In
Table 1, the costs, both for the investment (CAPEX)) and operational and maintenance ones (OPEX) sustained by the aggregator, are summarized. In particular, the cost of the PMU is a data project, while the other costs refer to the study and analysis carried out in the report [
43].
On the other hand, for the analysis of the revenue, the payment due for power and energy has been evaluated. The related values are shown below in
Table 2.
The above power and energy payments, reported in
Table 2, must be considered as a total for UVAM. To conduct a sensitivity analysis, the aggregator’s total revenues have been evaluated according to different percentage values (10–100% range).
5.3. Assumption and Costs of Request of Flexibility
Before addressing the results obtained from the analysis of the cost–benefit model applied to the case study (
Section 5), the concepts and the assumptions of “upward” and “downward” flexibility will be addressed below.
Concerning the request of “upward” flexibility, the strategy adopted is to download (discharge) the energy of the storage systems to the network and complete the regulation by disconnecting non-essential loads (internal non-critical loads). In this case, because balancing capacity is assumed to be equal to 4 MW, 2.8 MW are balanced discharging of the storage in the grid, while 1.2 MW derive from the disconnection of internal loads. Where, 2.8 MW represents 70% of the balancing capacity, and 1.2 MW corresponds to 30% of the balancing capacity. According to Equation (1), the 70% is CoSTO and 30% is CoInt-Loads.
In order to ensure the required availability, the EMS will have to implement an energy management strategy such that the storage systems at the local level do not fall below the “dedicated” threshold for the ASM. From the analysis of historical data, it can be seen that, in general, requests to participate in the ASM are concentrated between 14:00 and 20:00, the time slot in which the storage systems are mostly loaded by the plant’s PV.
The cost charged to users relates to the purchase of energy no longer available in the storage systems. In fact, it is assumed that, in the absence of regulation, the prosumer can consume the energy accumulated during the day and produced by the PV system in the evening (which is, therefore, free for the prosumer). If the same energy is sold to the grid during the day, the prosumer will have discharged accumulators in the evening, and will be forced to buy back the same amount of energy from the EMS at the assumed purchase price which is equal to 0.2 €/kWh [
44]. According to Equation (1), 0.2 €/kWh is the PP
A-P.
As regards the cost of disconnecting the user’s loads (CDisc-Loads), this value was assumed to be zero. As a first approximation, in fact, considering that these are residential users whose disconnection does not cause interruptions to company production cycles and that the reduction in available power is less than 10% of the nominal one, this cost has been assumed to be remunerated on a flat-rate basis from revenues connected to participation in the aggregate.
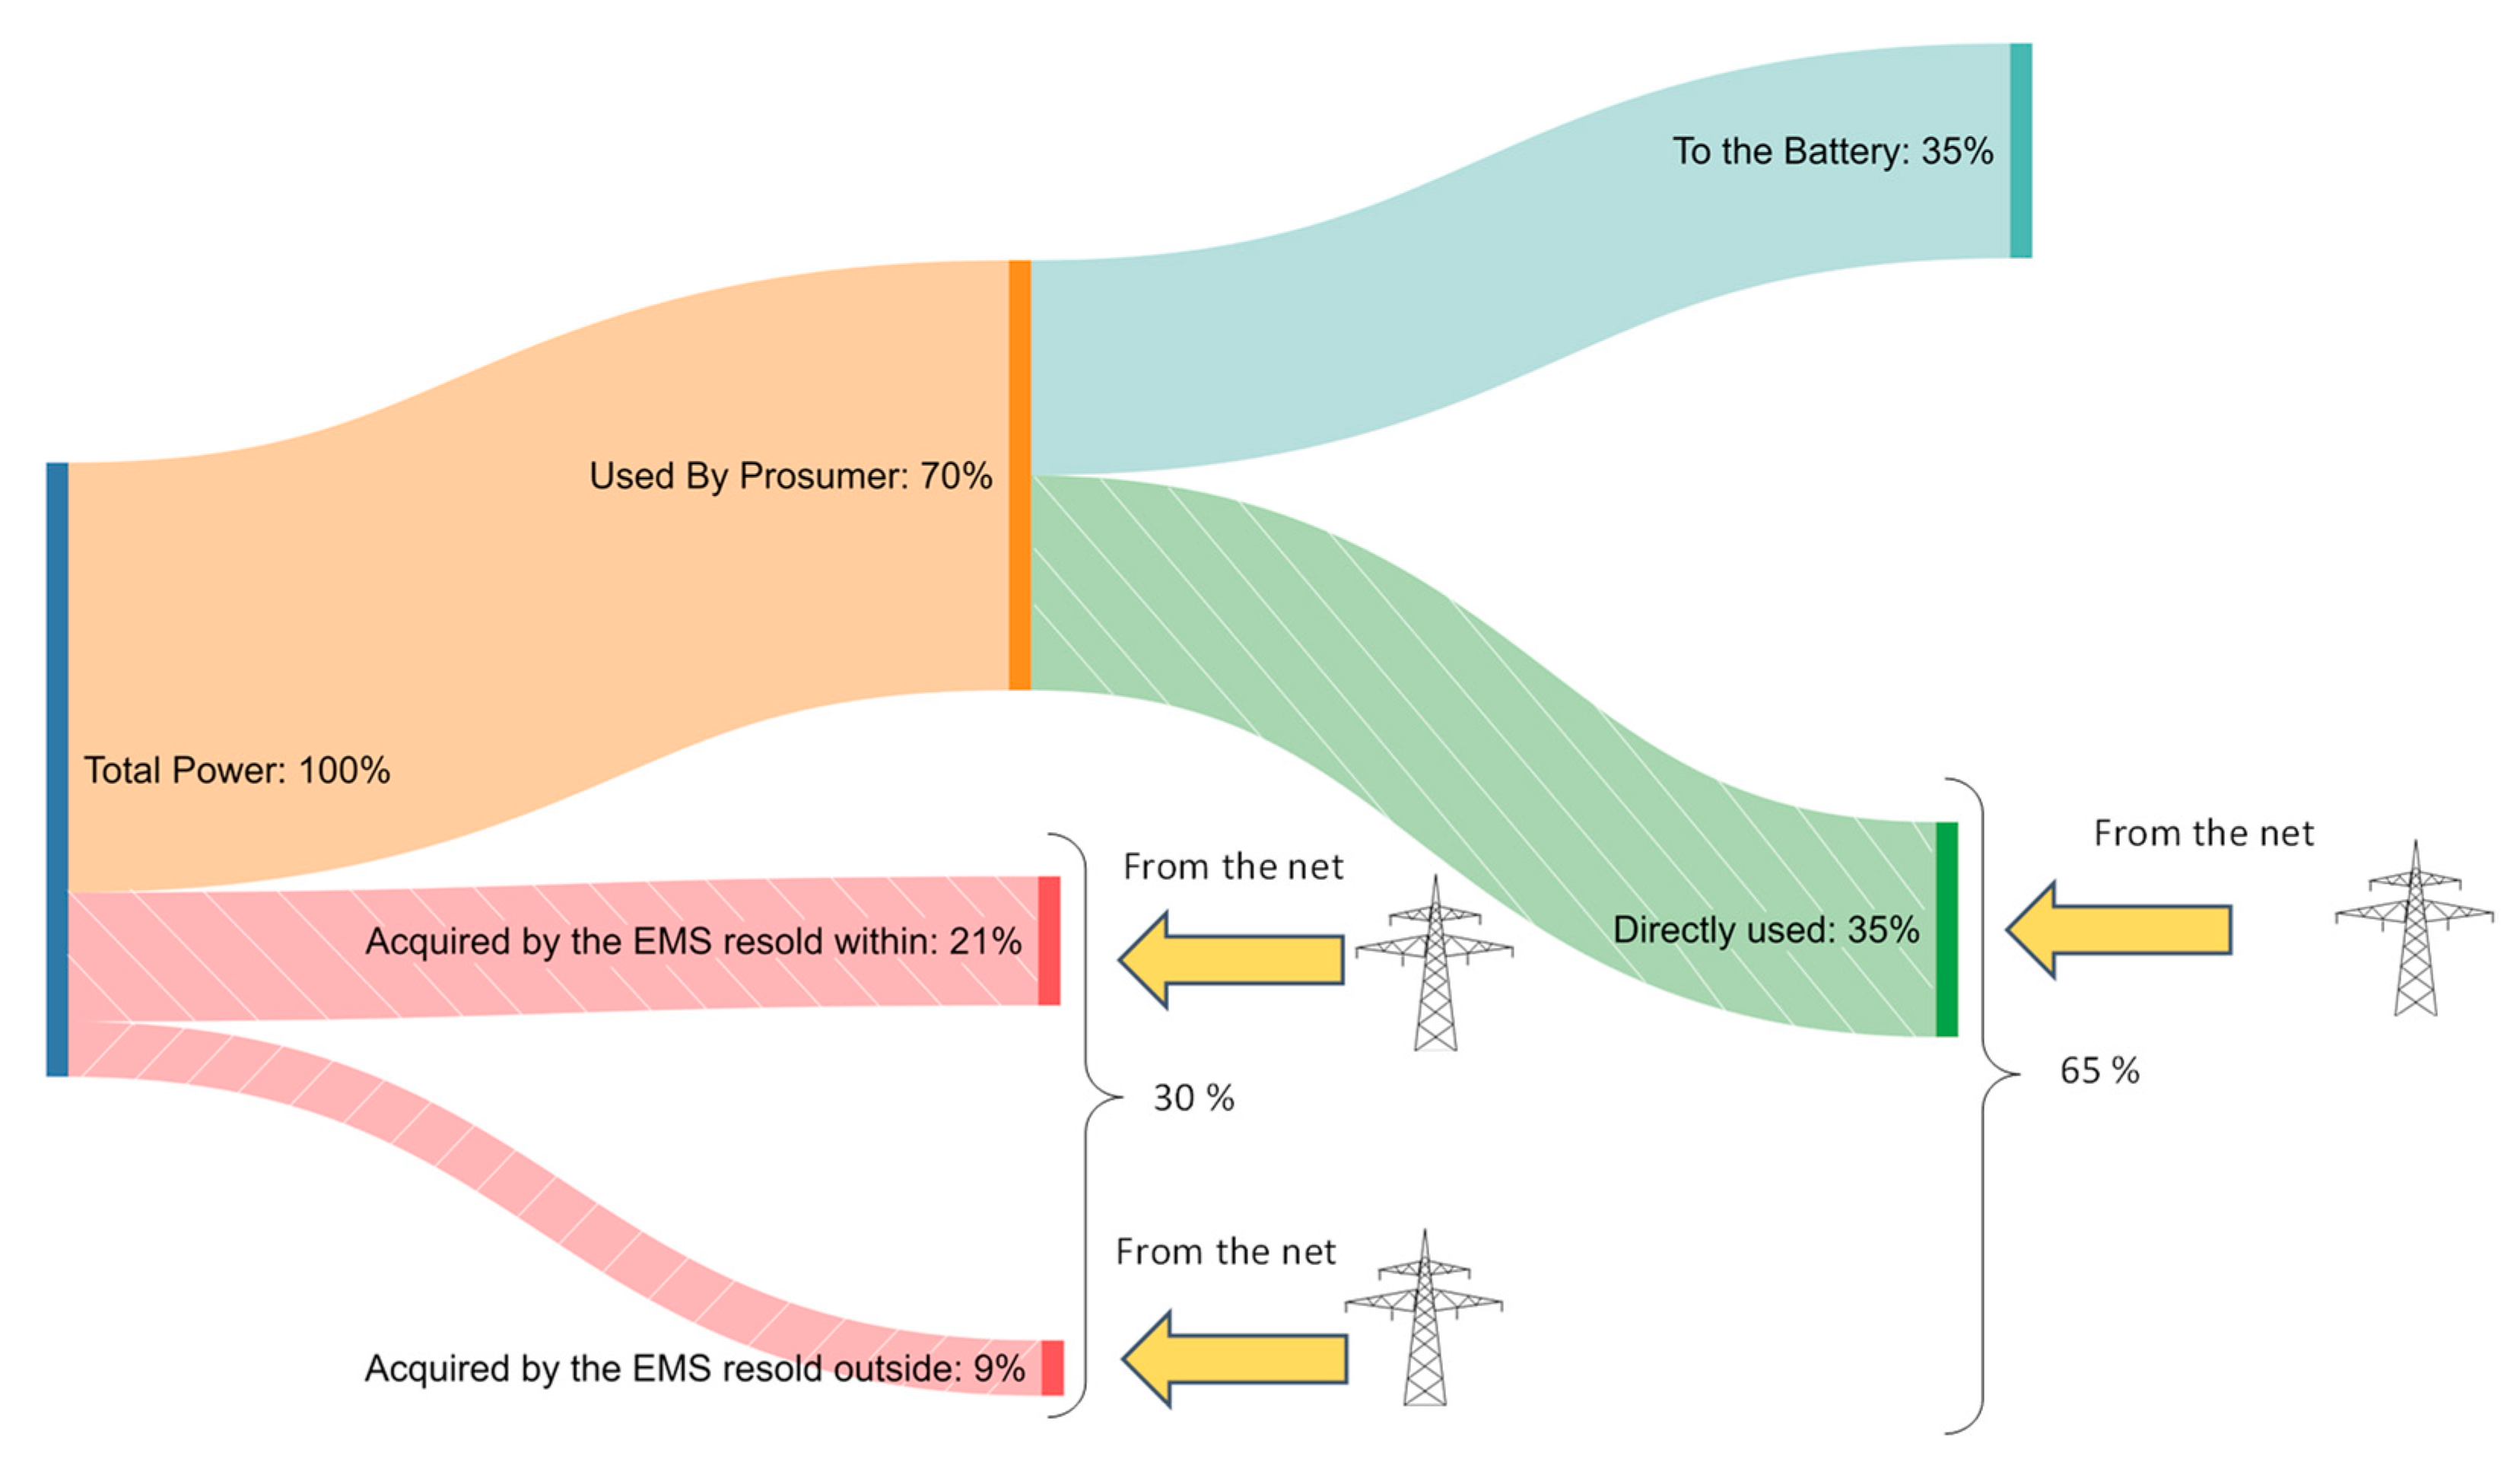
Concerning the request of “downward” flexibility, when the TSO requires a reduction of energy injection into the grid or a greater absorption by the aggregate energy system, it is possible to operate, as a matter of priority, by disconnecting the photovoltaic systems.
In the absence of regulation, the total power is composed by:
- -
70% of the power is used by the prosumer (35% related to power the internal loads and 35% related to load the storage systems);
- -
21% of the power is purchased by EMS and resold within the aggregate system;
- -
9% of the power is purchased by EMS and resold to the external network.
The consequence of switching off the production plants, provide the following effects:
TSO cannot sell the energy produced by the PV system, equal to 9%. The cost of users is therefore linked to the failure to sell energy to EMS, valued at a price of 65 €/MWh (, according to the Equation (2)). Compared to the total 4 MW to be balanced, this amount represents a rate of 14% (, according to the Equation (2)).
EMS cannot buy the energy produced by the PV system, equal to 21%, and it is obliged to buy energy from the power grid. This implies for prosumers an economic loss due to the failure to sell energy to the EMS, valued at a price of 65 €/MWh (, according to the Equation (2)), and a greater withdrawal from the grid equal to the amount of energy not produced by PVs. Compared to the 4 MW to be balanced, this contribution represents a rate of 32% , according to the Equation (2)).
Prosumers cannot self-consume energy produced by the PV system, equal to 35% of the total, and they will be obliged to buy this amount of energy from the EMS. Therefore, from an economic point of view, the prosumer is obliged to buy energy from EMS, at a price of 200 €/MWh (
, according to the Equation (2)), while from a regulation point of view, it contributes as a greater collection from the grid, compared to when the PV system produced. In relation to the total 4 MW to be balanced, this contribution represents a rate of 54% (
, according to the Equation (2)). Results are summarized in
Figure 6.
Finally, considering the reduction in injection into the grid (9%) and the increase in absorption (56%), an overall power regulation effect equal to 65% will be obtained. In the case of “Downward” flexibility, therefore, if a total power equal to 4 MW is needed, as a consequence, the PV system must produce at least 6.15 MW (as reported in the case study assumptions). As the nominal power of the production plants is supposed to be 11.25 MW, this condition will have a good chance of being fulfilled during the spring season. In any case, whenever it is not enough, it will be necessary to absorb energy from the grid to charge the prosumers’ storage systems. Additionally, in this case, the costs are proportional to the amount of energy annually exchanged within the ASM.
6. Results and Discussion
To analyze the results in the specific case study, it is necessary to define a “profit criterion” to evaluate the minimum revenue threshold that makes the model profitable. In order to calculate the profitability of the project, the authors started from the NPV formula and set it equal to zero as to obtain the WACC value. The WACC represents the rate of return of the project which, for a value of the NPV equal to zero. Therefore, with a fixed interest rate equal to 2%, in order to increase the NPV, it is possible to intervene on the difference between revenues–costs, which must be minimized. This is obtained either by maximizing the revenues (obtained from the sale of energy), or by minimizing the costs. Finally, a sensitivity analysis is carried out to understand by how much it is possible to reduce the costs to increase the profitability of the system. The equation applied is reported below:
where:
- -
NPV is the net discounted value at year 5;
- -
CFi are the cash flows in the i-th year, i.e., the difference between annual profits and costs. I0 is the investment made in year zero, which is the sum of the capex considered;
- -
R is the annual interest rate that represents the cost of the money borrowed from the bank to carry out the investment I0. It has been considered equal to 2%.
It worth noting that the aggregator provides to implement the UVAM, both with CAPEX, concerning the PMU, Concentrator, EMP, Communication with Terna and Communication UPM-Concentrator. Moreover, the aggregator must also sustain the operative and maintenance costs. For the aggregator, it has been assumed that the annual revenue could be significant enough to repay all the annual variable costs, with a return of the initial investment within 5 years. For the prosumers, it was assumed that all the costs necessary to make them suitable for the ASM are incurred by the aggregator and the profitability area was identified by imposing that the revenues for users are greater than the costs incurred.
6.1. Representation of Profit Areas for the Aggregator
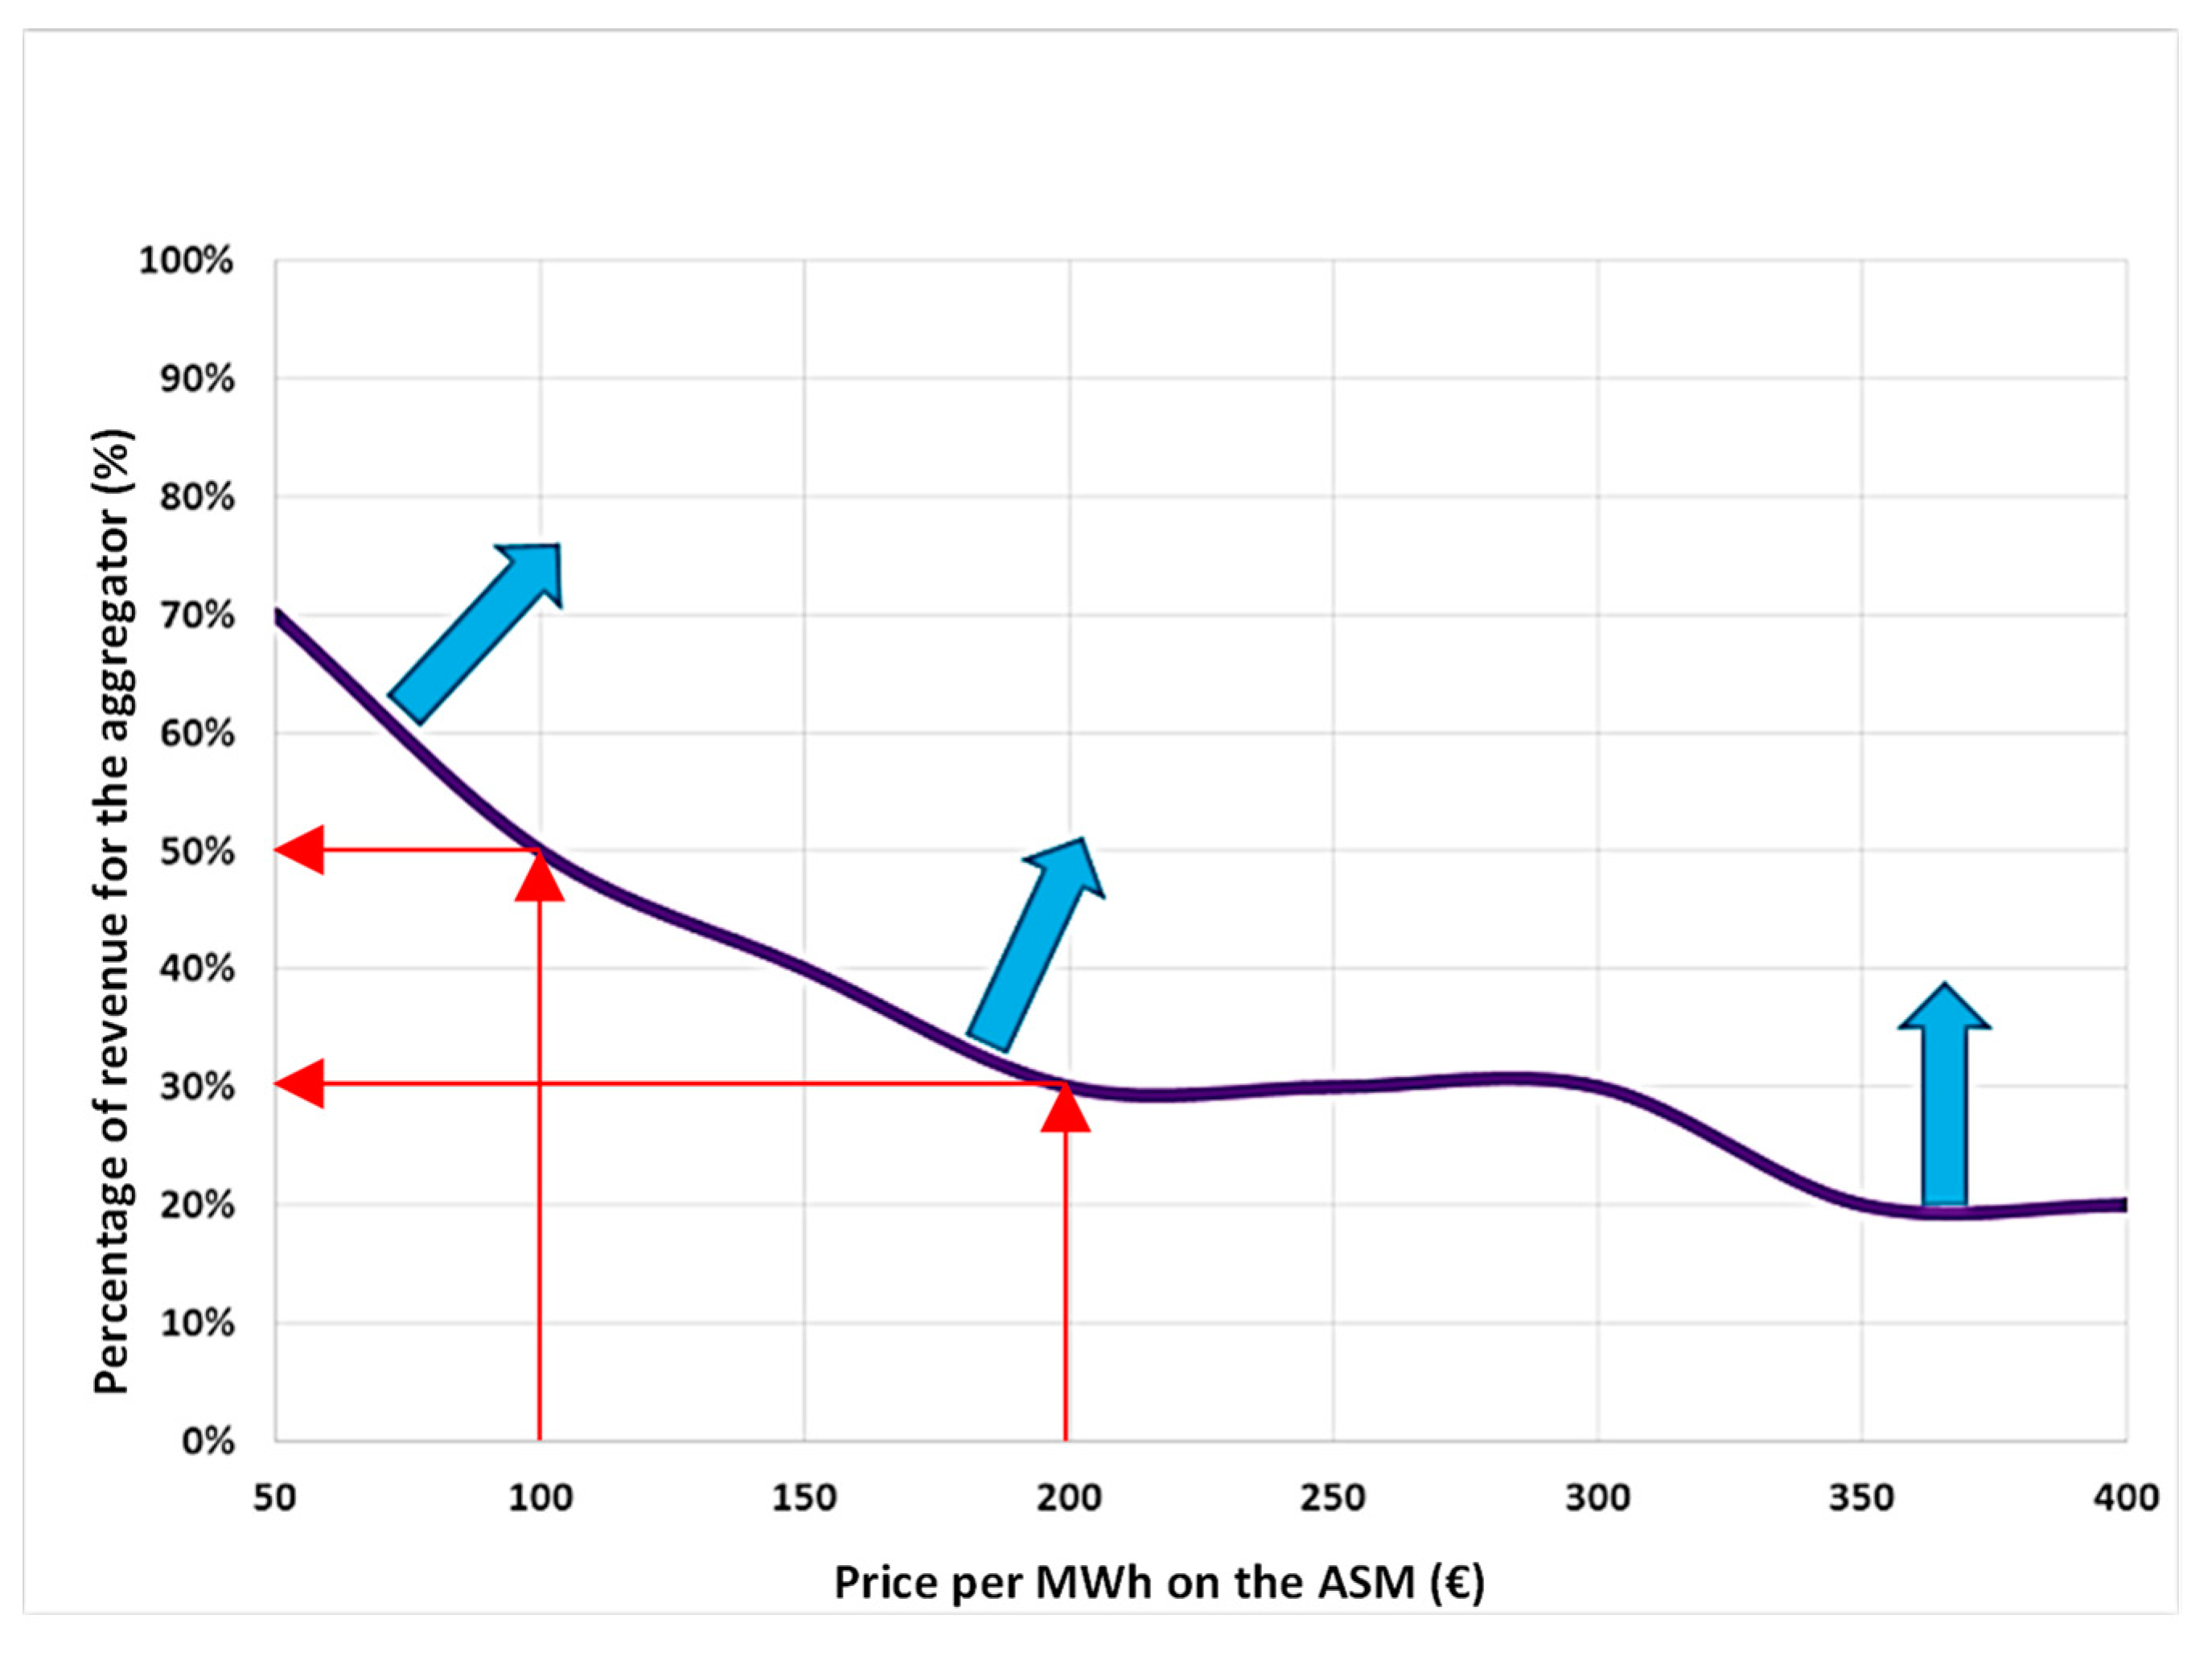
To show a synthetic representation of the results obtained, the profit areas for the aggregator (according to the variation of the considered parameters) are shown in
Figure 7. In particular, the sale price of energy is represented on the
X-axis, while the percentage of the total revenue of the aggregator is shown on the
Y-axis. The diagram has been obtained according to a fixed combination of the EMP costs and the Communication UPM-Concentrator cost (COM), for a fixed amount of energy sold per year. As can be noticed from the diagram, the profit area for the aggregator is outlined above the curve plotted in blue. This means that, for example, for a price of energy paid on the ASM of €200, the aggregator must retain at least 30% of the overall UVAM revenues, while if this price drops to €100, the convenience threshold will not be less than 50% of revenues.
Figure 8 shows a comparison of the profit areas considering zero (
Figure 8a) and maximum (€100,000 for CAPEX and €15,000 for OPEX) for the EMP costs (
Figure 8b).
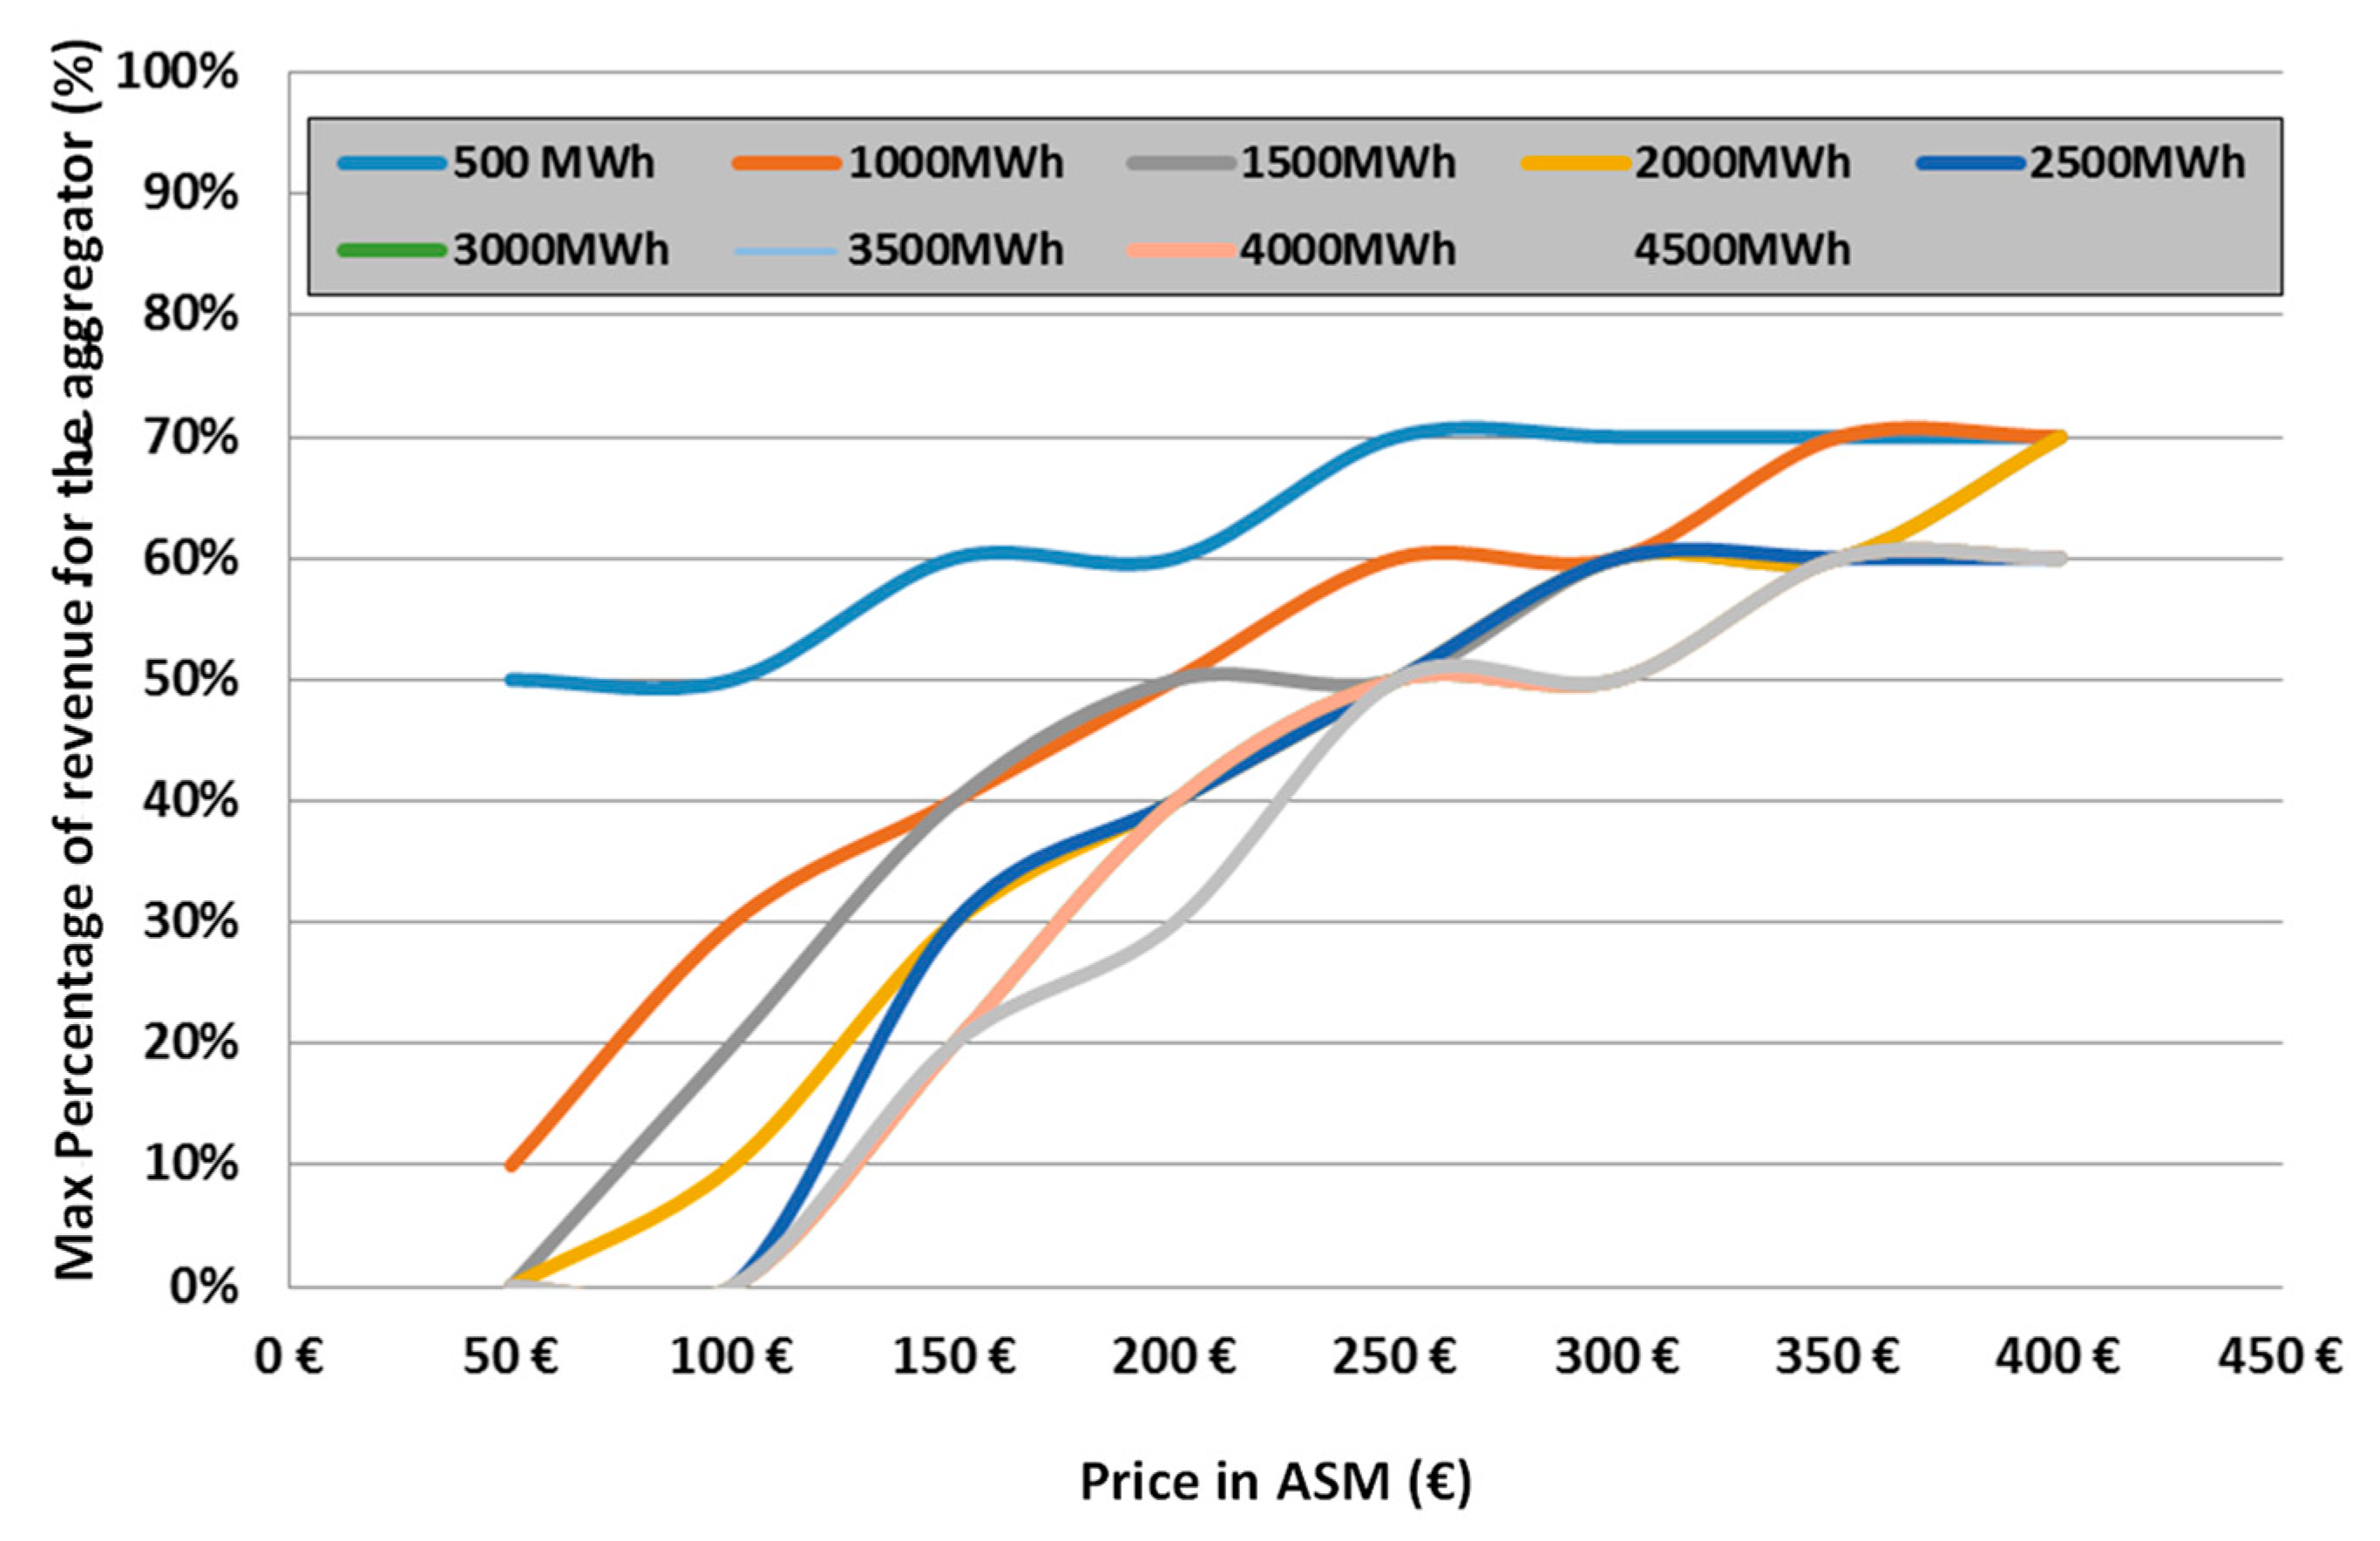
As it is possible to notice, as the amount of energy exchanged increases, the curves tend to decrease, and consequently, the profit area for the aggregator increases. This means that, for example, if the curve plotted in red has been taken into account (1000 MWh/year (
Figure 8a)) and a price of €200/MWh is considered, the aggregator must retain at least 40% of the overall UVAM revenues, while if this price drops to €100, the convenience threshold would not be less than 60% of revenues.
On the other hand, if it is considered a higher development cost for the EMP, a general rise in the curves is observed (see
Figure 8b). Generally, an increasing cost related to the EMP is associated with a greater profit required to reach the convenience conditions. This influence is greater, as a lower quantity of energy is exchanged annually. From
Figure 8a,b, it can also be observed that the greatest differences are found on the curves referring to smaller quantities of energy exchanged. Furthermore, the decrease of the convenience areas is gradual, because of the average impact (in percentage) of the costs increase on overall revenues.
The results of the analysis considering increasing costs in COM are shown in
Figure 9, where the profit areas, characterized by maximum COM costs (50 €/each per year). It can also be noticed that the decrease in the profit areas is significant. The high incidence of this parameter can be explained by the number of UVAM users, equal to 5000, so the COM cost of 50 €/point per year corresponds to an increase in annual costs of 250,000 € (a very significant percentage compared to the aggregator’s total revenues).
Finally,
Figure 10a,b report a comparison of the profit areas calculated as the COM costs vary, considering the starting condition with maximum values of the costs related to EMP. The effect of reducing the profit areas is amplified by the increase in costs and, therefore, the curves move upwards and right, compared to previous cases.
6.2. Representation of Profit Areas for Users
User revenues, clearly, tend to decrease as the BSP percentage assigned and the energy exchanged annually increase. The total revenues for the aggregation, with a sale price equal to 200 €/MWh, are shown below in
Figure 11.
To obtain the convenience diagram, a constant value was subtracted from the curves shown in
Figure 11, coinciding with the costs supported by users, relating to the value of the energy exchanged annually to which the curve refers.
For example, considering the case of the “upward” flexibility, from the results shown in
Figure 11, the following graph is obtained.
The straight lines represented in
Figure 11 and
Figure 12 present the same slope and are translated by a segment equal to the costs incurred by UVAM users, calculated according to the amount of energy exchanged. This segment will be greater the larger the quantity of energy exchanged. The convenience threshold must be identified, for each value of energy exchanged annually, as the maximum percentage of aggregator revenue, that allows UVAM users to obtain an economic advantage. As the energy exchange increases, this percentage decreases, since in the face of greater energy exchange and therefore an increase in revenues, there is an increase in costs borne by users.
The previous analysis has been reproduced for all energy price values belonging to [50–400] €/MWh. Once the quantity of energy exchanged within the ASM has been fixed, the maximum values of the gain percentage transferable to the BSP have been identified.
“Upward” flexibility: The areas of convenience are influenced by the amount of energy exchanged and tend to shrink as it increases.
Figure 13 shows the convenience curves for aggregation, on varying energy exchange.
“Downward” flexibility: It is noted that the curves, and consequently the areas of convenience, in
Figure 14 initially appear different from the “upward” regulation, but with the hypotheses examined, they are very similar, since the costs of regulation on the user side are similar for both flexibility requests.
6.3. Profitability Analysis of the Aggregator—Users System
The final part of the analysis was focused on identifying the profit area for aggregator-users.
As specified above, the areas of profit for the aggregator vary according to the assumptions made on the EMP/COM costs and on the amount of energy exchanged annually by the UVAM. The user-side curves, on the other hand, depend only on the amount of energy exchanged annually. It is, therefore, possible to represent both the convenience curves of the aggregator/users in a single figure.
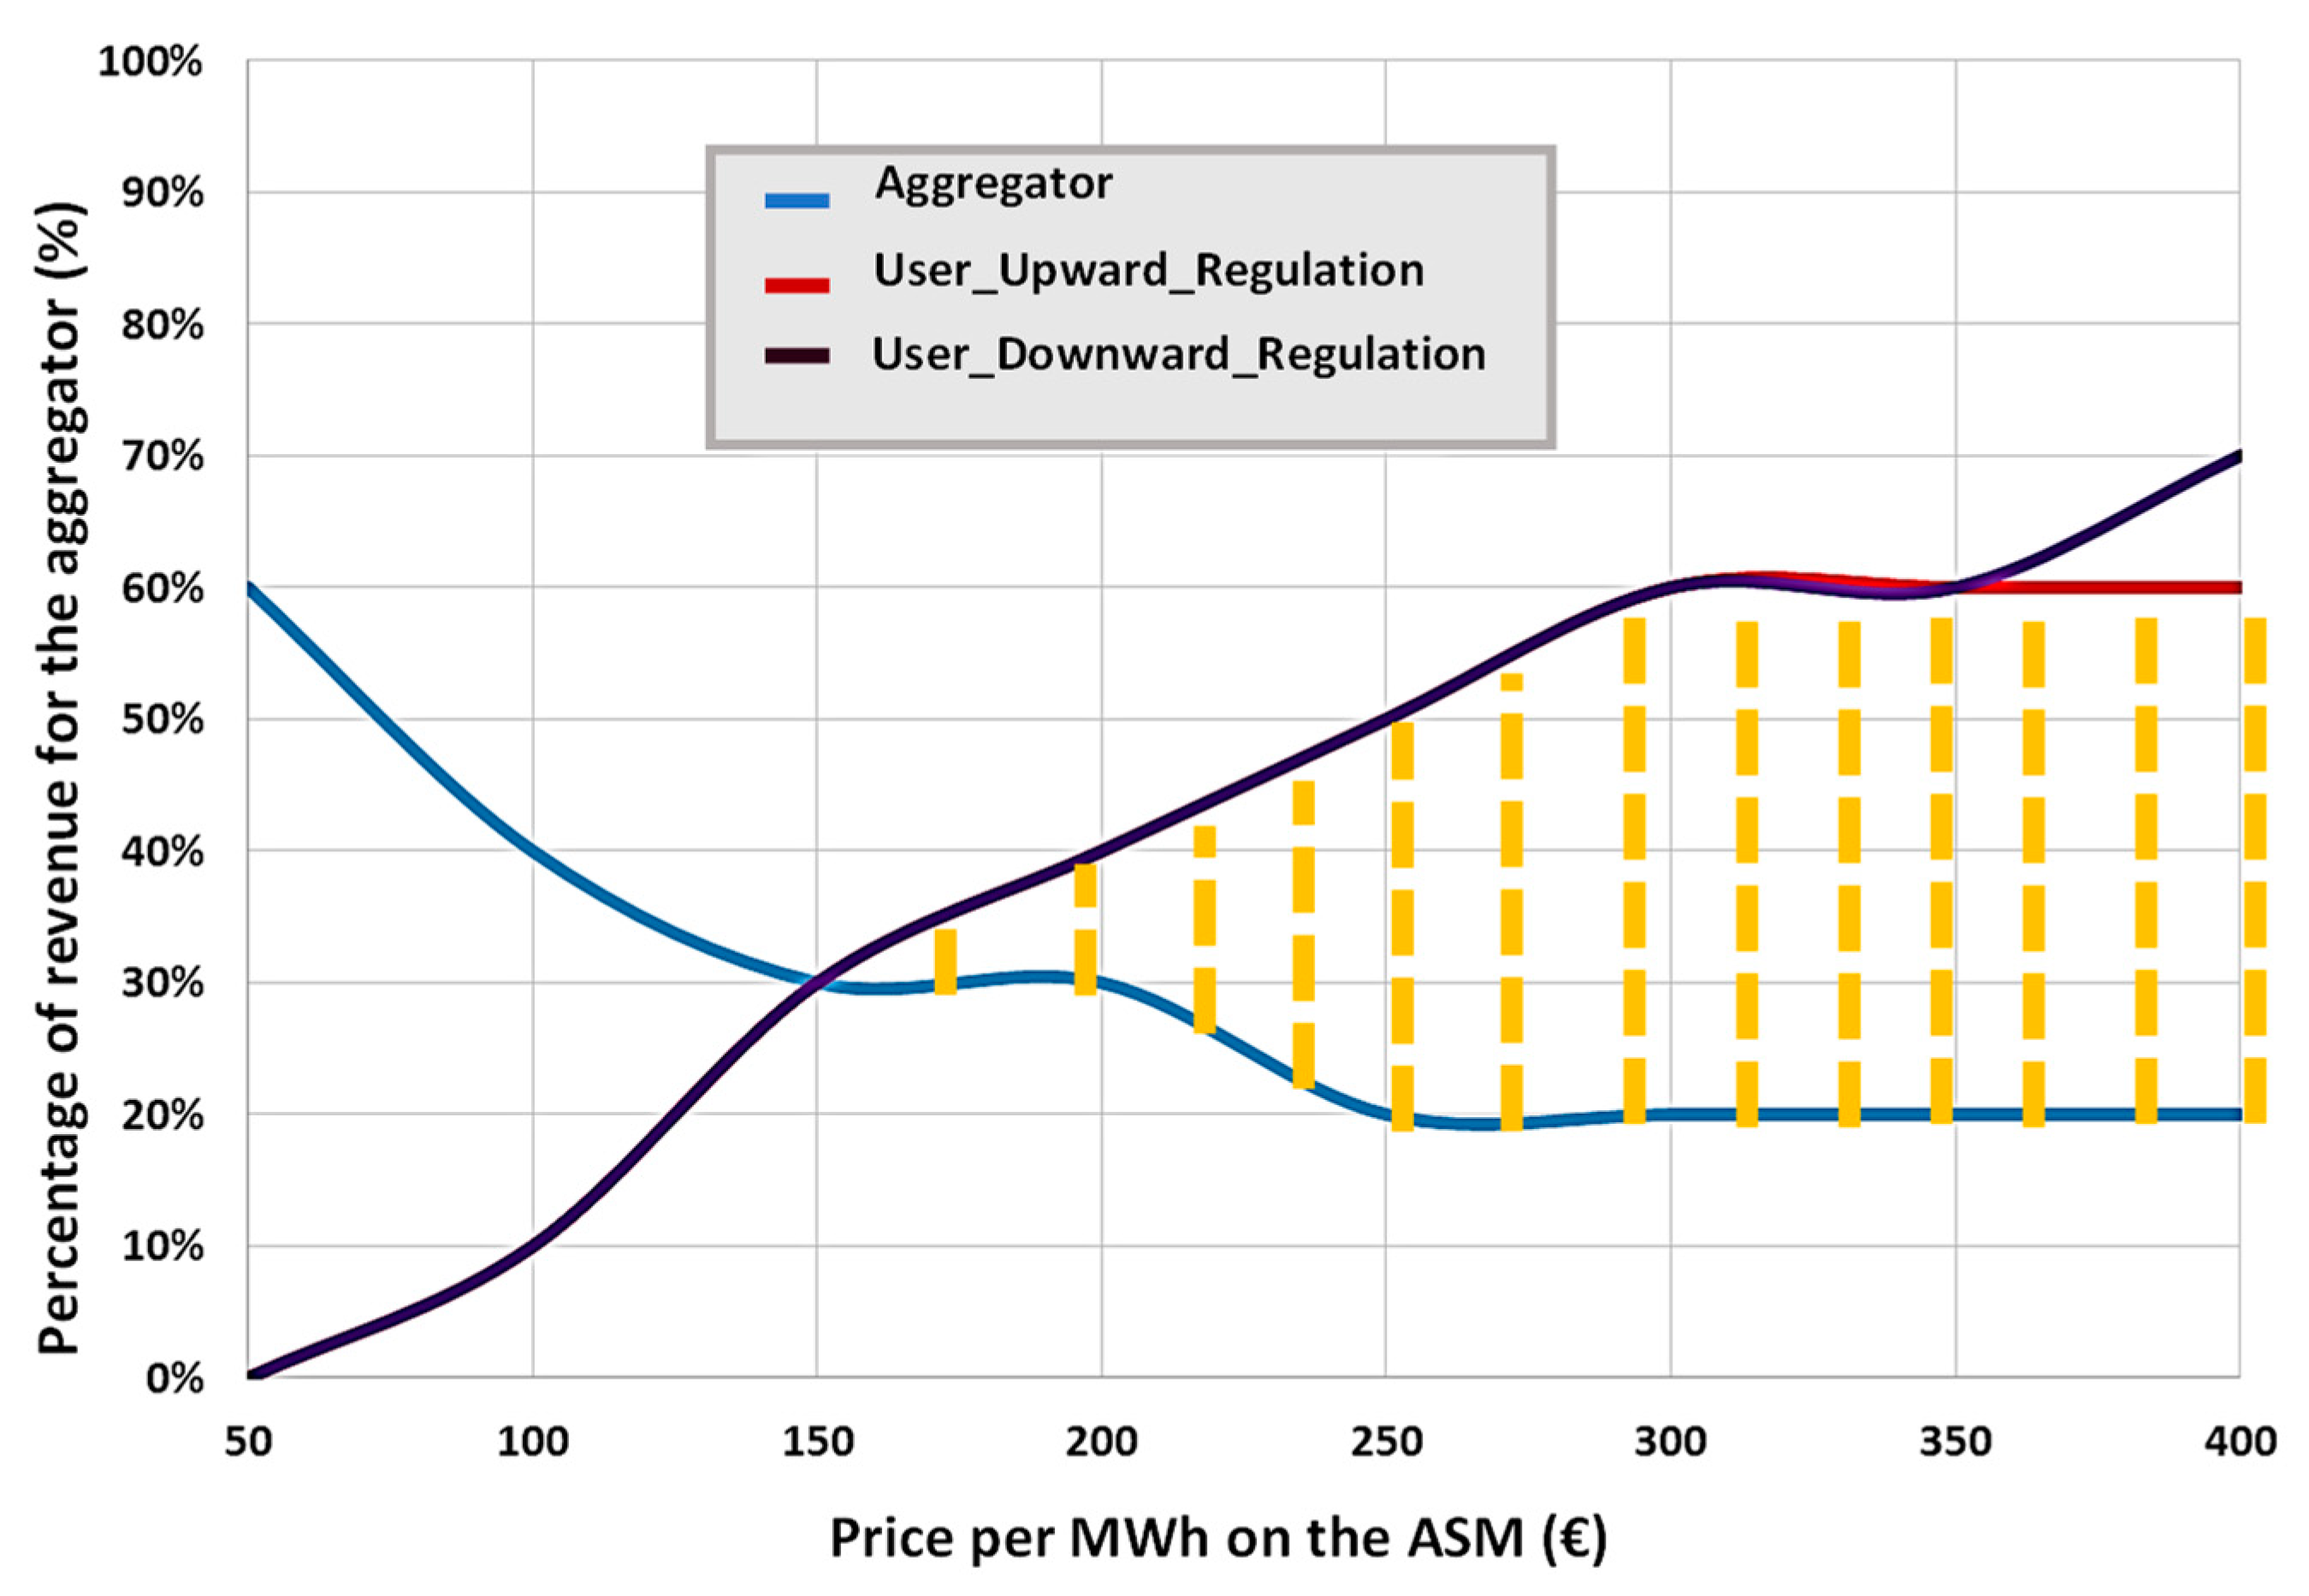
In
Figure 15, for example, for each price value, the curve concerning the aggregator side analysis (plotted in blue) shows the minimum percentage of revenues that must be granted to the BSP to be profitable, while the two curves (red and black, corresponding to the “upward” and “downward” regulation) represent the maximum value of the percentage of revenues that users can grant to the BSP. Therefore, the conditions in which an economic advantage is obtained for both actors can be found between the two curves, in correspondence of the optimum point, represented by the intersection of the two marginal curves. For example, if the price of energy is equal to €250, the compatible values of the percentage of revenue for the aggregator are between 20% and 50%. Values greater than 50% are not compatible with user profit, while values below 20% are not compatible with the aggregator. Therefore, the common convenience area is strictly internal to the three curves considered.
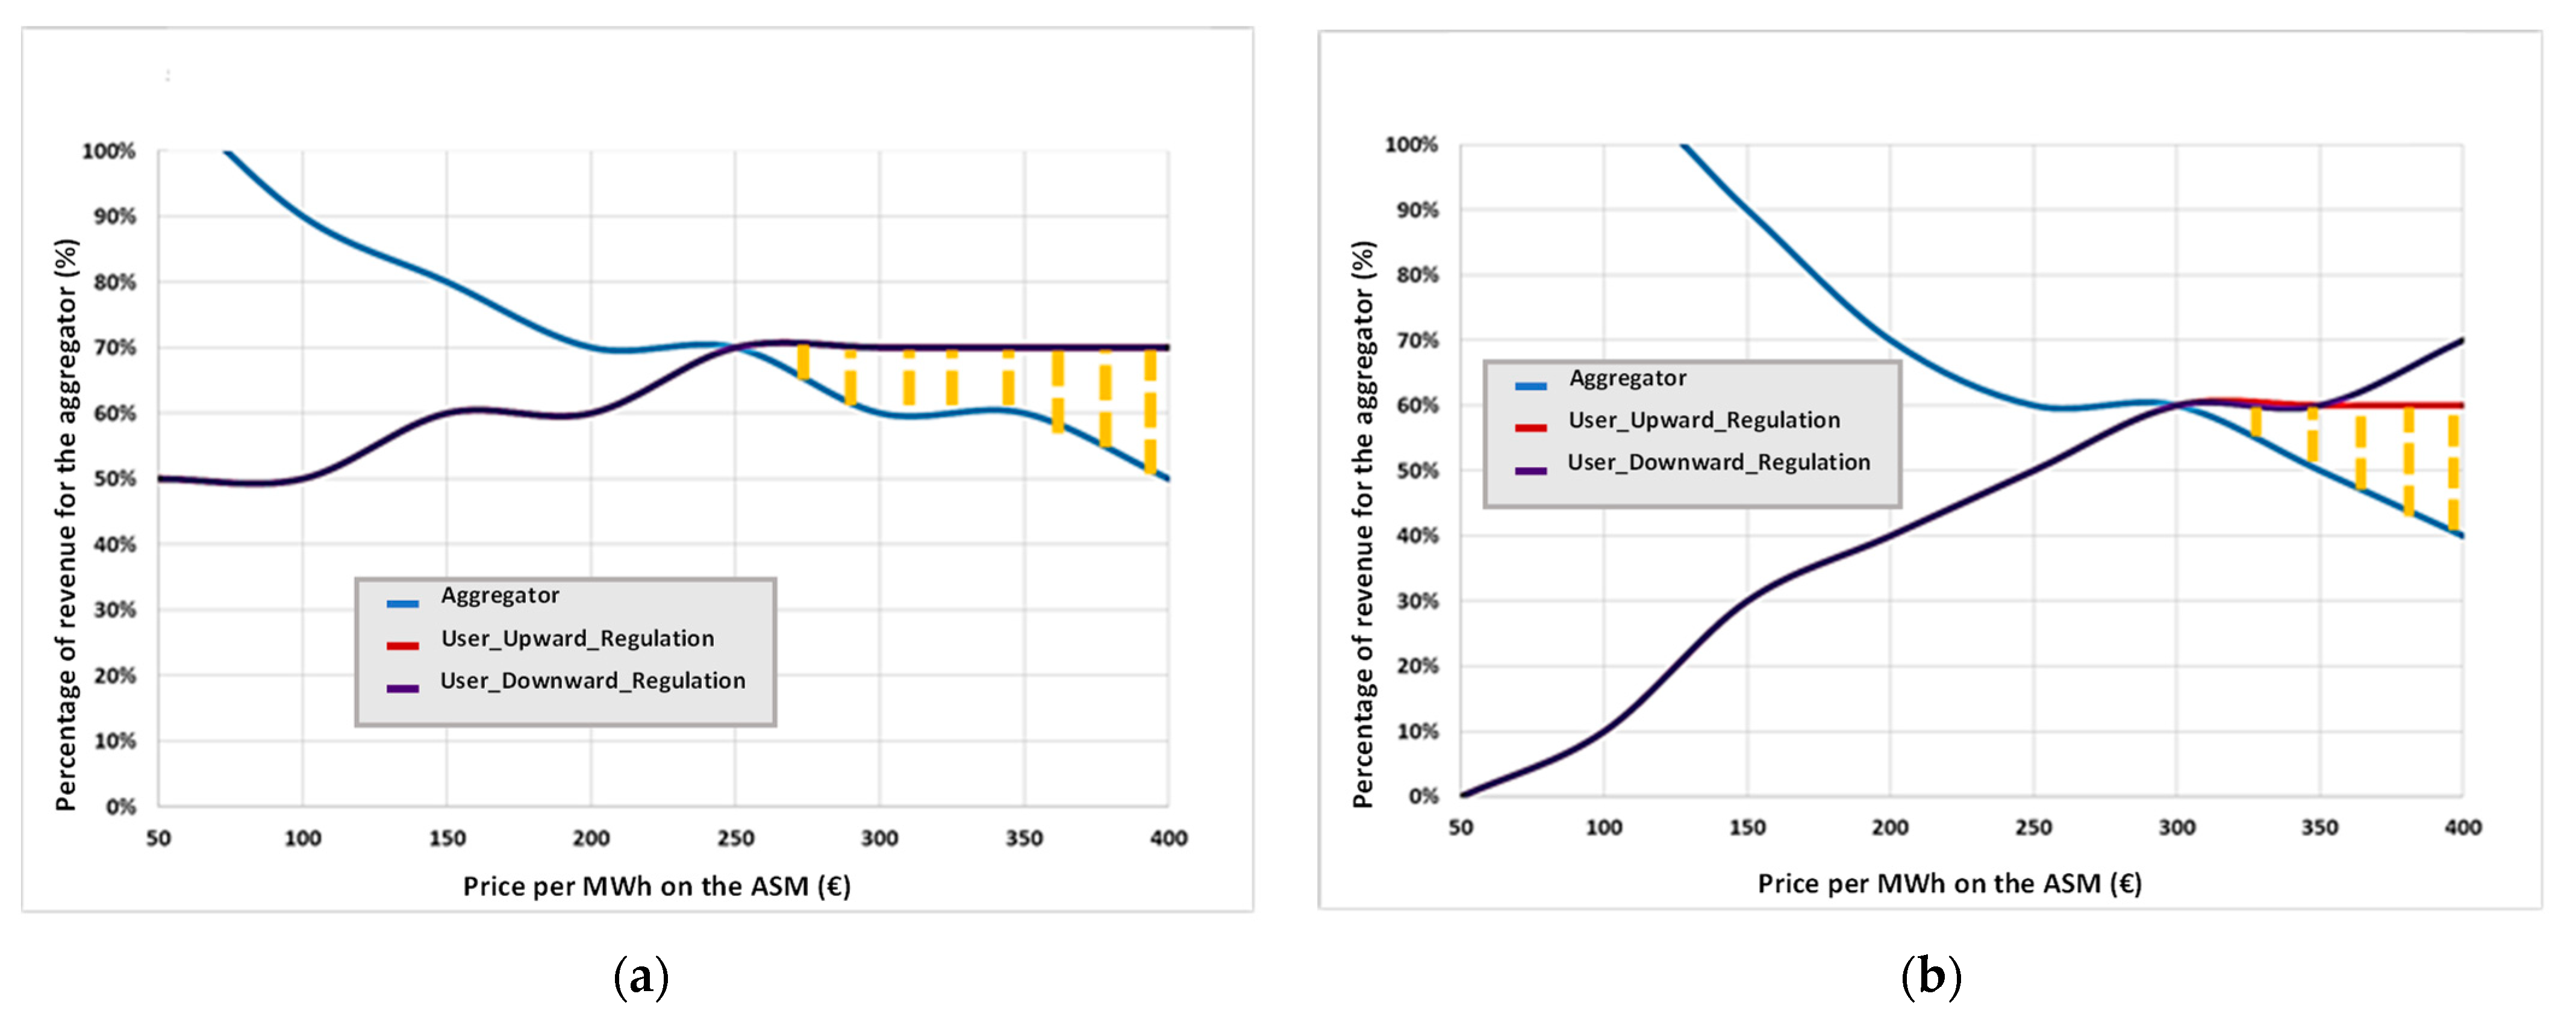
It is interesting to note how this area of common convenience varies as the parameters of this analysis change. In fact, considered constant the quantity of energy exchanged with the TSO, and supposed different cost conditions for the aggregator (EMP and COM), it can be seen that the curves on the user side remain unchanged (since as mentioned, they depend only on the quantity of energy exchanged), while the curve relating to the aggregator tends to rise and move up to the right as costs increase.
According to what was previously stated, COM costs are the ones with the greatest weight, while EMP costs have a minor influence on the size of the common convenience area. It is worth noting that the minimum price compatible with common (aggregator/users) convenience, increases as the costs vary (EMP and COM), from €150 (in the case of zero costs, (
Figure 15), to €175 if the costs of the management platform are €100,000 for the CAPEX and €15,000 for the OPEX (EMP) (
Figure 16c), while they reach around €300 if additional COM costs are considered (€50/user *year, with zero costs for EMP).
Moreover, considering annual energy exchanged of 2000 MWh and 500 MWh (
Figure 16a,b), the user-side curves tend to rise, because the costs for users decrease and, therefore, it would be possible to grant greater profit margins to the BSP, but at the same time, the aggregator curve also shifts upwards, since a higher percentage (of revenue) is required as the overall revenues decrease. The overall result is a decrease in the common area of convenience and an increase from €250 to €300 in the minimum admissible price.
On the other side, if an increase in the energy exchanged (from 2000 to 4500 MWh/year) is considered (
Figure 17), the curves regarding users “drop”, due to an increase in their costs; while on the aggregator side, the curve that delimits the convenience area drops because the increase in overall revenues allow to achieve convenience at the BSP, with a lower percentage of revenue compared to the previous case. The final effect is an increase in the common area of convenience, while the minimum price is around €150.
6.4. Sensitivity Analysis According the the Varioation of Price of Energy
The sensitivity analysis proposed shows the variation of the minimum price relating to the MWh offered on the MSD, in order to show the economic convenience for UVAM actors involved.
Figure 18a–c show the trend of this parameter in correspondence with three values of energy exchanged annually referred to low, medium, and high exchange regimes (500 MWh–2000 MWh and 4500 MWh) as a function of the EMP cost and parameterized according to the COM cost. The influence of the cost of the management platform becomes weighty exclusively for low volumes of energy exchanged with the TSO, while for medium–high volumes, the minimum price is primarily influenced by the value of the cost of the communication; this confirms the importance of this parameter in the general economy of UVAM. In fact, the lower the cost of communication, the lower the value of the minimum sale price; while the greater the volume of energy exchanged with the network, the lower the value of the minimum price, all other factors being equal. In the cases analyzed, the lack of common economic convenience for MWh sales prices lower than €150 is evident.
In fact, the lower the cost of communication, the lower the value of the minimum sale price; while the greater the volume of energy exchanged with the network, the lower the value of the minimum price, all other factors being equal. In the cases analyzed, the lack of common economic convenience for MWh sales prices lower than €150 is evident.
7. Conclusions
The transition from a traditional energy system to a distributed one can contribute to improve the energy efficiency of the system and increase the penetration of electric renewable energy sources that strongly suffer from unpredictability. This transition process passes through two main steps:
- (1)
Design of the new distribution network in terms of technologies and management platform involved;
- (2)
Provide the optimal operational strategies of the network.
Both steps can be reached by taking into account three important goals requested by the stakeholders: minimize the economic and environmental costs and increase the system efficiency.
In order to introduce a novel operational strategy, and increase and better manage the consumption of renewable energy, this study aims to define the profit economic areas, according to the variable parameters for both the aggregator and the users, when the UVAM participates in the ASM. As it has been clarified in the previous sections, for each of the analyzed cases, these regions of opportunity have been defined according to the percentage of revenues acquired from the aggregator and the quantity of energy exchanged annually on the ASM. The authors have found that the possibility to participate in the ASM for a UVAM is connected to the need to identify a “work point”, which is within the common aggregator-users convenience area. This condition is expressed by two important parameters, represented by the sale price and the percentage of revenue attributed to the aggregator. Finally, it has been demonstrated that the influence of the EMP costs becomes weighty for low volumes of energy exchanged with the TSO, while for medium–high volumes, the minimum price is primarily influenced by the value of the COM costs; this confirms the importance of this parameter in the general economy of UVAM. In fact, the lower the cost of COM, the lower the value of the minimum sale price; while the greater the volume of energy exchanged with the network, the lower the value of the minimum price. Finally, it is worth noting that COM costs represent a large cost rate for two reasons: (i) for the type of users considered (residential); and (ii) for the number of users considered. If the case study had taken into account a large energy-intensive industrial user, the results would obviously be completely different. This consideration leads us to the conclusion that, not only are the sustainable costs for both actors linked to the quantity of energy exchanged, but also to the types and number of utilities considered. Possible future developments will essentially focus on the limitations of the model. The adaptation of the model to case studies with different connotations of energy demand and/or different policies (industrial, tertiary sector, o energy communities) will allow us to introduce other variables to be taken into account that have not emerged in this work stage. Moreover, the introduction of one or more renewable energy sources and electric vehicle recharging points (with the related costs and associated energy flows) will make the analysis carried out more complete and realistic. These further developments will allow for an analysis of the UVAM’s sustainable working point deferrals both by the user and by the aggregator.


 ,
, 


