Abstract
The subject of a gas jet generated by underwater detonation is an important issue in the field of underwater propulsion. The experimental system of underwater detonation is established, which utilizes a high-speed camera to record the morphological changes in bubbles and various pressure sensors to measure the flow field pressure. The effect of nozzles and the pressure of the flow field are analyzed thoroughly. The comparison of the bubble and field pressure shows that the shrinking nozzle increases the peak pressure of the transmitted shock wave generated by underwater detonation compared with that of the straight nozzle. Simultaneously, the water–air mixing phenomenon caused by the gas jet is enhanced. Under the influence of the reflected shock wave and the converging angle of the nozzle, the pulsation process of the bubble is inhibited enormously, which results in the bubble energy being substantially below that of the straight nozzle. The bubble pulsation period is 24.2 ms when the shrinking nozzle is installed, and the pressure of the bubble pulsation is quite small, only 9.8 kPa. On the contrary, the expansion angle increases the velocity of the gas jet, suppressing the water–gas mixing phenomenon while enhancing the bubble pulsation process. The bubble pulsation period is 33.0 ms when the expanding nozzle is equipped, which is larger than the 31.2 ms of the straight nozzle and the bubble pulsation pressure is higher, at 26.1 kPa. Although the bubble energy is increased when the expanding nozzle is installed, thus generating a higher pulsation pressure, the peak pressure and direction of the shock wave are changed in the water.
1. Introduction
The gas jet of the underwater detonation involves various difficult hydrodynamic challenges, such as shock waves, water–gas mixing phenomena, turbulence, and water–gas interface instability, which are relevant to the engineering domains of underwater propulsion [1,2] and submarine detection [3]. A variety of complex phenomena are observed underwater, such as bubble pulsation, water–gas interface movement and deformation, and vortex motion [4,5], caused by the obstruction of the high-density water when the detonation gas is injected from different nozzles. Simultaneously, the shock wave from the degradation of the detonation wave interacts with the water–air interface to generate a series of complex pressure waves [6], which have important effects on the stability and concealment of the mechanical structure. Considering the significant impact of the interface evolution and pressure oscillations generated from a gas jet via underwater detonation in engineering applications, it is very important to investigate this area thoroughly.
The gas jet generated by underwater detonation is a complex subject of the high-transient multiphase dynamics, which basically contains shock wave propagation and bubble evolution processes. The process of a gas jet formed by a solid rocket motor launching underwater and by an underwater explosive charge has been thoroughly investigated by many scholars. Wang [7], Gong [8], and Zhang [9,10] performed experiments on a solid propellant rocket motor ignited underwater and employed the volume of fluid (VOF) model to study a supersonic gas jet underwater, which revealed the interaction principle between the supersonic gas and the aqueous medium. Analyzing many pressure waves in the field of an underwater supersonic gas jet and a classic series of phenomena of bubble evolution, such as necking and swelling, the effects of the instability of the water–gas interface on the morphology and shock wave structure of the gas jet underwater are discussed. Regarding the gas jet generated by an underwater explosive charge, Phan [11,12], Yu [13], and Li [14] employ the five-equation model and the VOF model, respectively, to simulate the process of a gas jet produced by an explosive charge detonating underwater. The common evolution of the underwater explosive charge is obtained, including the processes of expansion, shrinking, deformation, and water jet formation. Moreover, the phenomenon of almost uniform pressure distribution and non-uniform velocity distribution within the bubble is found, which is basically in accordance with the results of experimental studies on underwater explosive charge performed by Liang [15] and Poplavski [16]. The experimental research on the gas jet generated by underwater detonation employs mostly pressure measurements and high-speed photography combined with particle image velocimetry (PIV) techniques to obtain the pressure oscillation characteristics of the field and the typical phenomena of the bubble evolution, such as bubble expansion, shrinking, and necking [17,18,19].
In recent years, the underwater impulse detonation propulsion system has received increasing attention from scholars, which opens up a special domain for the gas jet generated by underwater detonation. Frolov [20,21] first proposed the pulse detonation hydroramjet (PDH), which consists of an appropriately shaped water pulse detonation engine (PDE) positioned vertically and a guide tube positioned horizontally in the water. The periodic ignition of the PDE is continuously filled with fuel to generate the cyclical detonation wave and the degradation of the detonation wave, and the water–gas mixture is filled with bubbles in the guide tube so that the water–gas mixture accelerates out of the guide pipe to generate propulsion [22]. Research has found that the propulsion and specific impulse generated by the first detonation are significantly higher than the subsequent cyclic processes. To analyze the characteristics of the gas jet formed by a single detonation of the PDE, Liu [23] conducts an experimental and numerical simulation study of the single detonation of a PDE underwater, analyzing the expansion and shrinking process of the bubbles created by a gas jet via underwater detonation and the pressure characteristics of the flow field.
As a new type of gas jet generated by underwater detonation, this field principally consists of a shock wave from detonation wave degradation, followed by a high-speed gas jet when the PDE works underwater. Compared with the gas jet formed by an underwater explosive charge, the gas jet of the PDE detonating underwater has a higher velocity in the axis direction of the detonation tube, creating a bubble morphology with an ellipsoidal shape. Meanwhile, the procedure of the gas jet underwater is combined with the phenomenon of necking, water–gas mixing, and interface instability, etc. The shock wave and the formation of the bubble by the underwater explosive charge have obvious spherical symmetry, and the bubble pulsation process is accompanied by collapse with water jets and other phenomena. Both the underwater PDE and the solid rocket motor igniting underwater present the directional gas jet as a modern underwater propulsion device. The velocity of the gas jet exiting from the PDE outlet underwater changes periodically, resulting in a pulse gas jet, which causes the shrinkage process of the bubble to be separated from the nozzle by the necking phenomenon and eventually forms a separate bubble that continues to pulse. Whereas the velocity of the continuous gas jet formed by the solid rocket motor underwater is relatively stable, thus preventing the necking process from producing the isolated bubble, only periodic expansion and swelling phenomena are produced by the combined action of the shock wave [24]. Additionally, the formation of the supersonic gas jet with shock wave interaction in the water–gas interface results in a significant enhancement of the Richtmyer–Meshkov (RM) and Kelvin–Helmholtz (KH) instabilities [25], whereas the pulsation process of the bubble formed by the gas jet generated by underwater detonation is more significantly affected by Rayleigh–Taylor (RT) instability. The underwater PDE is a new propulsion system with broad application prospects, but relevant theoretical and experimental studies are very scarce, and the formation mechanism of the gas jet phenomenon via underwater detonation has not been explained completely. Therefore, it is scientifically important to investigate the process of a gas jet formed via detonation gas by an underwater PDE, as well as prove a reference for the widespread application of a gas jet generated by underwater detonation.
In this paper, the field characteristics of a gas jet were researched during a single detonation of an underwater PDE, and the effect of different nozzles on bubble morphology was studied. A detailed description of the experimental system of the underwater PDE is presented in Section 2, including the experimental equipment, working process, and numerical methodology. Using image post-processing technology, the parameters of the projected area, morphological characteristics, and the pulsation period of the bubble when different nozzles are installed were measured and analyzed. The evolution of the bubble was also analyzed in detail, and the mechanism of the bubble movement is revealed in Section 3. Many pressure waves of the flow field were studied, and the shock wave and characteristics of bubble pulsation in the jet field via underwater detonation are described in Section 4. Some primary conclusions are summarized briefly, and future research directions are proposed in Section 5.
2. Experimental System and Numerical Methodology
2.1. Experimental System of Underwater Detonation
To investigate the characteristics of the gas jet formed from an underwater detonation when different nozzles are installed, an experimental setup was established in the laboratory, as shown in Figure 1. The whole setup comprised three systems: an underwater detonation system, a data acquisition system, and a synchronous control system. The underwater detonation experiments were carried out in a 1.2 × 1 × 1 m3 cuboid water tank.
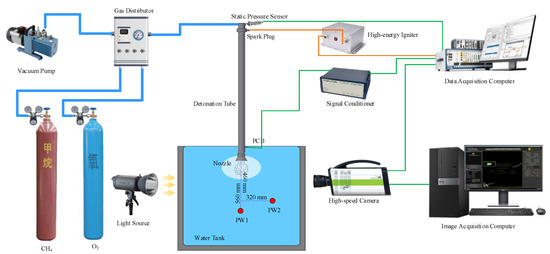
Figure 1.
Experimental system of underwater single detonation gas jet.
A 0.9 m × 0.8 m polycarbonate glass observation window with sufficient strength and optical transmission was designed to take photographs of complete underwater detonation gas bubble evolution using a high-speed camera. A detonation tube with an inner diameter of 30 mm and a length of 1.2 m was fixed in the center of the water tank by two sliding rails. The nozzle was connected to the end of the detonation tube by a thread, which allowed for rapid and convenient replacement. There were three kinds of nozzles in this investigation, namely, a shrinking nozzle (ShrinkingN20), with a shrinkage angle of 20°; a straight nozzle (StraightN0); and an expanding nozzle (ExpandingN20), with an expansion angle of 20 °. The axial length of the nozzles was 30 mm, and the distance between the outlet and the water surface was 230 mm, as shown in Figure 2. A polyethylene terephthalate (PET) film with a thickness of 0.05 mm was assembled between the nozzle and the detonation tube [26] to create a closed space for subsequent fuel filling.
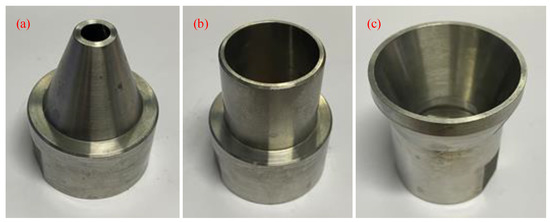
Figure 2.
The picture of the convergent nozzle, the straight nozzle, and the expanding nozzle: (a) ShrinkingN20, (b) StraightN0, and (c) ExpandingN20.
The methane and oxygen flowed to the detonation tube through a gas distributor independently according to the partial-pressure law. The filling pressure was precisely controlled by a static pressure sensor (OMEGA PX409-750G5V). The high-energy ignition source was installed approximately 80 mm away from the head of the detonation tube with an energy of 1.8 J in a single pulse discharge, and a detonation wave was formed by deflagration via a detonation transition (DDT) process.
One dynamic pressure sensor (PCB 113B24) was installed 215 mm away from the nozzle exit to detect the detonation state. Two underwater explosion pressure sensors (PCB W138A01) suspended in the water were arranged at 560 mm below the detonation tube to record the pressure of the shock wave and pulsing bubble, as shown in Figure 1. Pressure signals were processed by a signal conditioner (480C05) and memorized by a data acquisition board (NI-PXIe 8861) at a sampling rate of 1M Sample/s. Pulsing bubble images were recorded using a high-speed camera (I-Speed 7) with a frame rate of 5000 frame/s and an exposure time of 1/7000 s, with the help of 800 W LED lamps near the observation window as light sources. Both ignition and signal recordings were triggered simultaneously by a digital waveform generator (RIGOL DS4072).
The experiment was organized as follows: First, the detonation tube and fuel-filled pipelines were evacuated under vacuum at 100 Pa by an explosion-proof vacuum pump. Second, the detonation tube was filled with the mixtures until the pressure was set independently and left for over 20 min for effective mixing. Finally, the detonation tube wave was formed after ignition, and all the pressure and image data were saved simultaneously.
2.2. Numerical Methodology
The flow field structure of the underwater detonation gas jet is extremely complicated, and the interaction process of water and gas cannot be thoroughly described by the experiment phenomenon. To supplement the experimental results, corresponding numerical studies were performed using OpenFOAM. According to the pattern and flow characteristics of the detonation tube, the axis symmetric model was used, and the effects of cavitation and phase change were ignored. The calculation domain setting is shown in Figure 3.
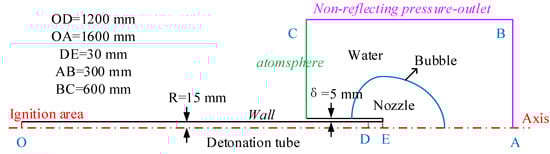
Figure 3.
Calculation domain of the underwater detonation gas jet.
The detonation process was calculated in the detonation tube using rhoCentralFoam, using a 0.1 × 0.1 mm2 mesh and a time step of 2 × 10⁻¹¹ s. When the detonation wave reached point D, the reaction was complete, and the detonation gas jets started calculating by compressibleInterFoam. The structural grid resolution was 1 × 1 mm2, and the time step was 2 × 10⁻⁸ s. The simulation results of the detonation process were mapped onto the detonation tube. Subsequently, the comparative analysis of the experimental and simulation results illustrated the accuracy of the simulation.
3. Evolution Process of the Bubble Generated by Underwater Detonation
3.1. Morphology Evolution Process of the Bubble
The first aspect of the underwater detonation event to be addressed was that of bubble dynamics. This aspect of response occurred within a time frame in the order of 30 milliseconds. The pattern of bubbles from the detonation tube when the straight nozzle was installed is shown in Figure 4, which illustrates different phases of bubble growth and contraction. In general, the evolution process of the bubble in the underwater detonation can be mainly divided into three parts, namely, the expansion stage, shrinkage stage, and re-expansion stage.
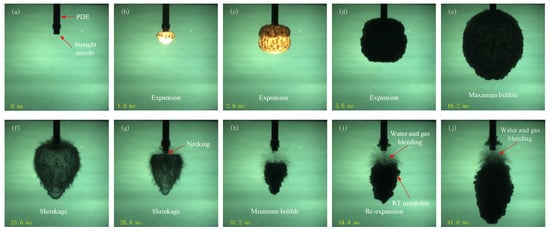
Figure 4.
Bubble evolution process when the straight nozzle was installed: (a) t = 0 ms, (b) t = 1.0 ms, (c) t = 2.8 ms, (d) t = 5.6 ms, (e) t = 16.2 ms, (f) t = 25.6 ms, (g) t = 28.8 ms, (h) t = 31.2 ms, (i) t = 34.4 ms, (j) t = 41.6 ms.
After the shock front propagated rapidly throughout the water medium, a gas bubble began to expand radially outward due to the high temperature and pressure of the detonated exhausts at the nozzle exit, as shown in Figure 4b. Upon the rapid ejection of detonated products in the axial direction, there was an approximate inverted triangle shape at the initial stage of bubble expansion, which was notably different from the growth form of bubbles generated by a typical explosive charge in a fixed position. Accompanied by a continuous injection of detonated productions, the gas bubble continued to expand radially outward as the pressure inside the bubble was greater than the pressure outside of the bubble, as shown in Figure 4c,d. After an expansion duration of 16.2 ms, the bubble reached its first maximum with an approximate round shape when the momentum of the bubble expansion was overcome by the imbalance between the pressure outside and inside of the bubble, as shown in Figure 4e and Figure 5a.
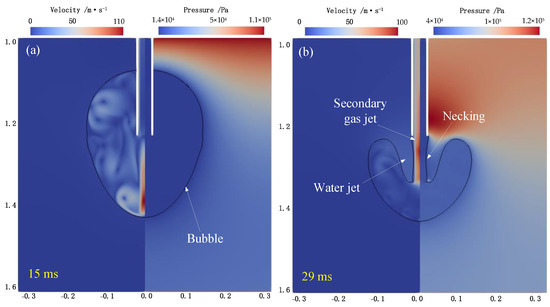
Figure 5.
Simulation results of the bubble evolution process when the straight nozzle was installed: (a) t = 15 ms, (b) t = 29 ms.
Then, the bubble started to shrink. There was still an obvious inverted triangle shape during this shrink phase, as shown in Figure 4f. It is worth noting that the bottom of the bubble moved very little in the vertical direction, but the migration of the top of the bubble became significant. After rapidly passing through the point of pressure equilibrium and continuing on to recompress the bubble gasses, the impact of the high-speed water jet separated the bubble from the nozzle exit, resulting in the shrinkage phenomenon of the jet necking, as shown in Figure 4g and Figure 5b. In addition, at this moment, the water would be pushed into the detonation tube immediately due to the overexpansion in the tube and atmospheric pressure, which has unfavorable effects on the proper working of the detonation engine. The water flowing back into the detonation tube would have an adverse effect on the next detonation process, further affecting the thrust of the engine. The bubble reached its first minimum when the contraction phase stopped, with a duration of 15 ms. The inward contraction of the bubble was rapidly reversed, causing the first bubble pulse, which was evident in the corresponding pressure–time history.
The first bubble pulsation dissipated a large amount of the gas energy inside the bubble, while each of the following pressures in successive pulsation diminished in amplitude significantly, which is not discussed in this paper. RT instability appeared when the gas with a small density was pushed away from the surrounding water [27], which was characterized by the distortion of the bubble boundary and the change to an irregular shape. At the same time, the bubble top was violently water–gas mixed, making the bubble boundary become gradually blurred, as shown in Figure 4i,j.
As shown in Figure 6 and Figure 7, comparing the bubble shape when the straight nozzle was installed, the bubble pulsation process and the typical phenomena were generally similar when the expanding nozzle was installed, with the exception of the following differences. First, an obvious increase in the duration of bubble pulsation was observed, approximately 16.8 ms for the gas expansion phase and 16.2 ms for the shrinkage phase. The reason for this is that the supersonic gas in the detonation tube entered the bubble through the accelerated jet of the expanding nozzle, while the effect of the shrinking nozzle on the flow was the opposite. Therefore, the bubble when the expanding nozzle was installed had a greater mass of gas and a higher velocity, which increased the period of bubble expansion and the shrinkage phase. Second, the maximum bubble size in the expansion phase was larger than the corresponding value mentioned above. The maximum bubble radius when the straight nozzle was installed was 10.1 times that of the tube diameter, slightly less than 10.3 when the expanding nozzle was installed, but the value was only 6.8 when the shrinking nozzle was installed. These results provide direct evidence that greater bubble energy is generated by an expanding nozzle. Finally, the phenomenon of water–gas mixing also appeared in the re-expansion phase of the bubble pulsation, but this phenomenon was weak when the expanding nozzle was installed, as shown in Figure 6i,j.
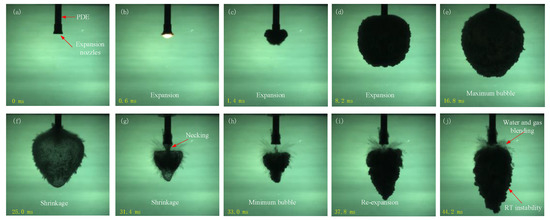
Figure 6.
Bubble evolution when the expanding nozzle was installed: (a) t = 0 ms, (b) t = 0.6 ms, (c) t = 1.4 ms, (d) t = 8.2 ms, (e) t = 16.8 ms, (f) t = 25.0 ms, (g) t = 31.4 ms, (h) t = 33.0 ms, (i) t = 37.8 ms, (j) t = 44.2 ms.
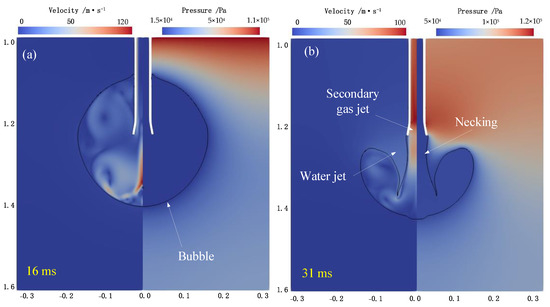
Figure 7.
Simulation results of the bubble evolution process when the expanding nozzle was installed: (a) t = 16 ms, (b) t = 31 ms.
However, there was a notably different phenomenon in the bubble pulsation process when the shrinking nozzle was installed. The duration of the bubble expansion (Figure 8a–e and Figure 9a) was only 12.2 ms, and the primary pulsation period was 24.2 ms, which are much smaller than the corresponding duration mentioned above. Due to the excessive detonated gas injection from the detonation tube, the bubble and nozzle could not be completely separated (Figure 8g,h and Figure 9b), which resulted in an obvious increase in the minimum bubble size in the shrinkage phase. The bubble pulsation would be suppressed because there was not enough negative pressure in the bubble, and a lower speed of shrinkage would be generated for the small pressure difference between the bubble and the water. Additionally, the water–gas mixing phenomenon occurred in advance of the bubble shrinkage phase, resulting in the appearance of the vesicular zone during the re-expansion phase (Figure 8j) at the nozzle exit, causing the bubble boundary to be very fuzzy.
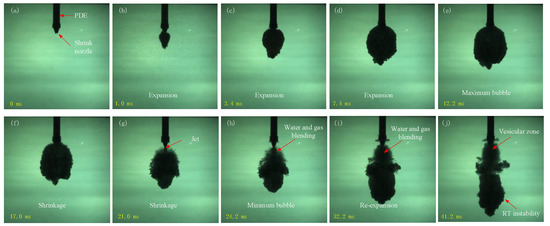
Figure 8.
Bubble evolution when the shrinking nozzle is installed: (a) t = 0 ms, (b) t = 1.0 ms, (c) t = 3.4 ms, (d) t = 7.4 ms, (e) t = 12.2 ms, (f) t = 17.0 ms, (g) t = 21.0 ms, (h) t = 24.2 ms, (i) t = 32.2 ms, (j) t = 41.2 ms.
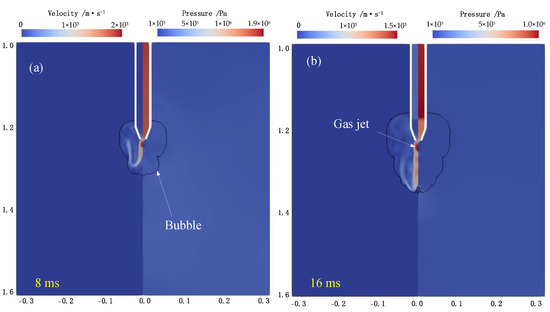
Figure 9.
Simulation results of the bubble evolution process when the shrinking nozzle is installed: (a) t = 8 ms, (b) t = 16 ms.
Significantly, the phenomenon of the intense water–gas mixing occurred before the pulsation of the shrinkage process, so the re-expansion of the bubble formed a bubble cluster near the nozzle exit. Therefore, the pulsation process of the bubble was enhanced when the expanding nozzle was installed, but the phenomenon of water–gas mixing had a suppressive effect. On the contrary, the phenomenon of the water–gas mixing was strengthened, and the pulsation process of the bubble was inhibited when the shrinking nozzle was installed. It is simultaneously interesting to note that during the contraction phase, the bubble did not remain spherical but instead assumed a more toroidal shape as the bottom of the bubble folded inward to create a re-entrant jet during the bubble pulse. This geometric shape change, coupled with the associated flow, assisted the bubble in its vertical migration, as mentioned previously.
3.2. Characterization Parameters of the Bubble Morphology
The morphological characteristics of the bubble generated by the underwater detonation can be described using the fundamental morphological parameters determined by ImageJ 1.8.0. The images were calibrated using the conversion ratio between the outer diameter of the detonation tube and the image pixels. After identifying the contour of the bubble from the images, the necessary parameters of the bubble morphological were measured or calculated, as shown in Table 1.

Table 1.
The necessary characteristic parameters of the bubble.
The area is the projected area of the bubble in the axis plane of the nozzle, indicating the size of the bubble. C, L, and W are the perimeter, width, and length of the bubble projection, respectively. The origin of the image and the coordinate axis are shown in Figure 10. The roundness of bubbles is calculated as follows:
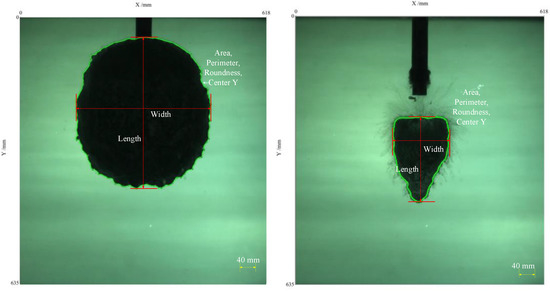
Figure 10.
Post-processed bubbles of the gas jet generated by underwater detonation.
In Figure 11, a plot of projected bubble area as a function of time is shown for the three kinds of nozzles, and the measured results in the primary pulsation are concluded in Table 2. Here, Tmax and Tmin are the moments when the bubble expands to the maximum and shrinks to the minimum, respectively. Similarly, Amax and Amin are the maximum and minimum projected areas of the bubble, respectively, whose ratio indicates the intensity of the bubble pulsation.
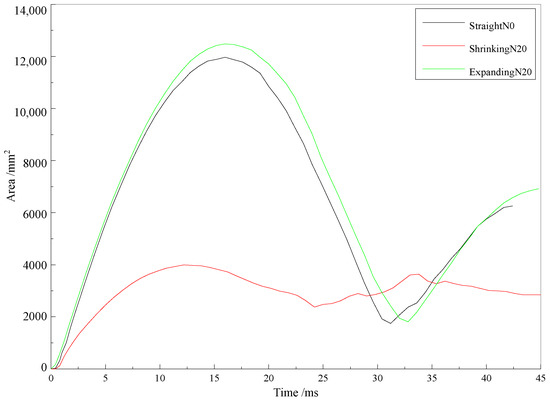
Figure 11.
Curves of the area of the bubble projected when different nozzles were installed.
Table 2.
Characteristic parameters of the bubble pulsation when different nozzles were installed.
Obviously, the variation trends of both the bubble pulsation duration and the projected area were similar for the straight and expanding nozzles. Specifically, the duration of the expansion phase and maximum projected area increased remarkably, which promoted bubble growth. Compared to the nozzles above, the maximum of the projected bubble area was reduced by 66.6%, while the minimum area was increased by 36.2% when the shrinking nozzle was installed, which significantly suppressed the pulsation capability of the bubble. It was evident that the impact of the shrinking nozzle on the bubble pulsation was more pronounced than that of the expanding nozzle with the same angle and length.
The aspect ratio and roundness are essential parameters to describe the morphological characteristics of the bubble, which are shown in Figure 12. For the straight nozzle, the aspect ratio of the bubble in the initial phase increased sharply and then grew slowly until 2.8 ms when the initial bubble was formed. The aspect ratio curve from the expanding nozzle presented the similarity, but the value was a little smaller. There was an opposite variation in the aspect ratio when the shrinking nozzle was installed. Especially during the early stage of bubble formation, the aspect ratio decreased sharply. The shape of the nozzle affected the initial bubble; as a result, the change rule of the initial bubble aspect ratio of the shrinking nozzle installed was opposite to that of the straight nozzle or the expanding nozzle installed. The aspect ratio was relatively stable at the beginning of the expansion and early stage of the shrinkage phases because there was no high-speed water flow that could impact the bubble, so the bubble shape changed steadily in this phase. Thereafter, severe fluctuation appeared in the late stage of the shrinkage phases. Significant fluctuations that appeared in the shrinkage and re-expansion phases as the water jet formed in the shrinkage phase impacted the bubble, so the bubble shape changed rapidly, and the aspect ratio fluctuated.
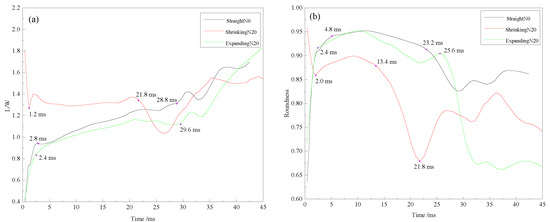
Figure 12.
Curves of the aspect ratio and roundness of the bubbles when different nozzles were installed. (a) Curves of the bubble L/W when different nozzles were installed, (b) Curves of the bubble roundness when different nozzles were installed.
The next concept to be discussed is the roundness of the bubble. At the initial stage of the bubble formation, the roundness of the bubble increased rapidly when the straight nozzle was installed. After a stable period of 18.4 ms, it decreased rapidly in the later shrinkage phase and the re-expansion phase, fluctuating at approximately 0.85 finally. When the expanding nozzle was installed, the roundness of the bubble varied in the identical pattern as mentioned above, except for a more severe decrease in the later shrinkage phase, ending with a strong oscillation at approximately 0.66. There was an opposite variation in the roundness of the bubble when the shrinking nozzle was installed since the roundness was more sensitive to the bubble morphology. At the initial stage of the bubble formation, the roundness of the bubble decreased and then stabilized. After that, the roundness decreased rapidly and reached a minimum of 21.8 ms before increasing rapidly, with considerable fluctuations during the re-expansion stage when entering the shrinkage stage at 13.4 ms. The reason for this is the same as the reason for the change in the aspect ratio.
The aspect ratio and roundness directly reflected the morphological characteristics of the bubble. The bubble at the outlet of the engine was related to the gas jet formed in the next circulation, further affecting the detonation frequency and thrust of the underwater detonation engine. Therefore, it is very important to study the above two values for the control of the engine outlet field, which provides a reference basis for the ulterior study of engine performance.
In Figure 13, a plot of the displacement of the gas bubble as a function of time is shown for these three nozzles. In general, the bubble center moved faster when the shrinking nozzle was installed. As can be observed from this plot, during the bubble expansion and early shrinkage phases, the center of the bubble moved very little in the vertical direction. It is only after the later shrinkage stage that the migration of the center of the bubble became significant. During the later shrinkage stage, the gas in the bubble tail moved sharply in front of the nozzle under the action of the water jet, which caused the bubble center to increase rapidly. The wall of the expanding nozzle hindered the movement of the gas at the tail of the bubble, so the movement of the bubble center was the slowest. The shrinking nozzle suppressed the retraction of the gas, and the bubble moved further away from the field and helped to keep the gas away from the nozzle. This was conducive to the cyclic operation of the engine.
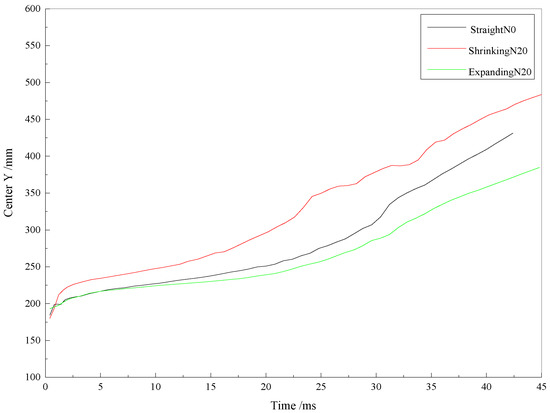
Figure 13.
Curves of the bubble centroid-Y when different nozzles were installed.
3.3. Effect of the Nozzle on the Bubble Energy
Under the conditions of three different nozzles, there were significant effects on the bubble profiles formed from detonation gas, which represents the efficiency of the energy transformation from the detonation gas into the bubble.
The bubble was formed via high-speed gas flushing into the water, and the gas energy was converted into potential energy, so the speed was rapidly decreased. When the bubble expanded to the maximum, the energy of the bubble was potential energy in the water. It can be calculated by the following [28]:
where Rmax is the equivalent radius of the maximum bubble, and P0 is the hydrostatic pressure at the point of the bubble center. The calculation formula is as follows:
where Amax is the maximum area of the bubble, the water density is 998 kg/m3 in the laboratory conditions, the gravity acceleration is 9.8 m/s2, and the depth of the bubble center is h. The bubble energy when the straight nozzle was installed was applied to the dimensionless processing of the bubble energy of the shrinking nozzle and the expanding nozzle; the calculation results are shown in Table 3.
Table 3.
Bubble energy when different nozzles were installed.
The energy in the first bubble pulse was reduced by 81% when the straight nozzle was replaced by the shrinking nozzle. The flow blockage can be explained by the fact that the shrinking nozzle causes a large amount of the gas energy to fail to be converted into bubble energy. Since the duration of subsequent detonated gas flow with high pressure after the detonation wave was extended due to blockage using the shrinking nozzle, it was obvious that the bubble could be pushed deeper into the water and the maximum depth of the bubble center under this condition was the largest. However, the jet flow was seriously impeded in this process, resulting in enormous gas energy dissipated in the form of the shock wave and water–gas mixing. Therefore, the transformation efficiency of the bubble energy with the shrinking nozzle was smaller than that with the straight nozzle. In comparison, the energy in the first bubble pulse was increased by only 6% when the expanding nozzle was installed. The facilitation of the energy transformation efficiency of the detonation gas into the bubble energy was lower when the expanding nozzle was installed.
Although the detonated gas jet’s speed was increased under this condition, the lower pressure of the gas jet slightly reduced the depth of the overall bubble. The analysis results are consistent with those of the high-speed photographic images.
4. Research on Pressure Histories of the Gas Jet Generated by Underwater Detonation
4.1. Characterization of Reflected Shock Wave in Detonation Tube
After the filling process of the methane and oxygen mixture, a stable detonation wave was formed by DDT in the detonation tube and then broke the PET diaphragm film. The pressure of the detonation wave, the theoretical value Pcj using NASA’s online Chemical Equilibrium with Applications (CEA) tool, simulation results Psim/Pcj, and experimental value Pexp/Pcj are listed in Table 4. The pressure of the detonation wave obtained by the experiment and simulation was similar to the theoretical value, which proves that the accuracy of the detonation process by simulation and the detonation tube indeed formed a stable propagation in the experiment.
Table 4.
Comparison with theoretical value of detonation wave from simulation and experiment.
The PET diaphragm was damaged by detonation and formed a reflected wave (RSW) returning PDE. Under a high temperature and a high-pressure detonation wave, the diaphragm was completely burned. The series rupture phenomena of PET diaphragms are thoroughly analyzed in [29].
The detonation wave passing through the diaphragm degenerated into a shock wave in the nozzle field, followed by the shock wave and the detonation gas flowing across the nozzle to encounter the gas–water interface and the reflected shock wave. Obstructed by the water with a higher density, the shock wave was divided into a transmitted shock wave (TSW) into the water, while the detonation gas was compressed at the gas–water interface. Under the conditions of different nozzles installed, the measured shock wave pressure–time history from the dynamic pressure sensor is shown in Figure 14, and the characteristic parameters are shown in Table 5, where PDW is the pressure of the TSW, PSW is the pressure of the RSW, Δt is the interval between PDW and PSW, and Vave is the average velocity of the shock wave through the nozzle.
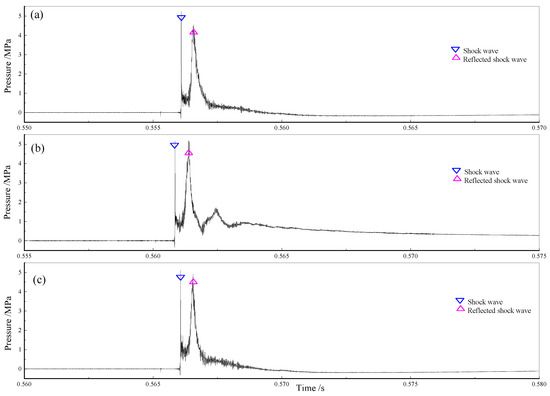
Figure 14.
Curves of the pressure in the detonation tube when different nozzles are installed: (a) StraightN0, (b) ShrinkingN20, (c) ExpandingN20.
Table 5.
Characteristic parameters of shock wave in the detonation tube when different nozzles are installed.
Again, the pressure history from the expanding nozzle showed an apparent similarity to that from the straight nozzle. The pressure of the RSW was slightly lower than that of the TSW, with a decay amplitude of 13.1% and 4.1%, respectively. The average propagation velocities of the shock wave were relatively small, approximately 769.23 m/s and 758.20 m/s, respectively. However, the pressure of the RSW was basically equal to the detonation wave when the shrinking nozzle was installed, and the subsequent pressure fluctuation increased significantly, but the average velocity was 695.49 m/s. The results showed that both the shrinking and expanding nozzles reduced the average velocity of the RSW.
According to aerodynamic theory, the supersonic gas formed by detonation is decelerated when flowing through the shrinking nozzle, and the obstruction of the shrinking nozzle reduces the injection rate of the detonation gas. This would cause the decline rate of the pressure history to be much slower. Due to the generation of more fluctuations when installing the shrinking nozzle, more energy was consumed, resulting in the great energy dissipation of the detonation gas by the shock wave. The expanding nozzle acted in the opposite way. Accordingly, the fluctuation of the bubble was obviously weaker, and the maximum size was smaller when the shrinking nozzle was installed when compared with the other two nozzle structures.
4.2. Analysis of the Characteristic of Transmitted Shock Wave and Bubble Pulsation in Water
Figure 15 illustrates the typical pressure–time history the from underwater detonation, including signals from the TSW, and subsequent bubble pulsation, which were measured by the underwater blast pressure sensors PW1 and PW2. It could be clearly observed that the shock wave reached PW1 and PW2 simultaneously due to the nature of the diverging spherical wave under the conditions of these three nozzles. Pressure peaks generated by PW1 were obviously larger than those generated by PW2 when the shrinking nozzle was installed, but the result was the opposite under the condition of the expanding nozzle, indicating that there was a significant effect on directivity due to the smaller outlet concentrating the energy of the TSW in the axial direction. From another point of view, the pressure peak of the TSW was largest when the shrinking nozzle was installed.
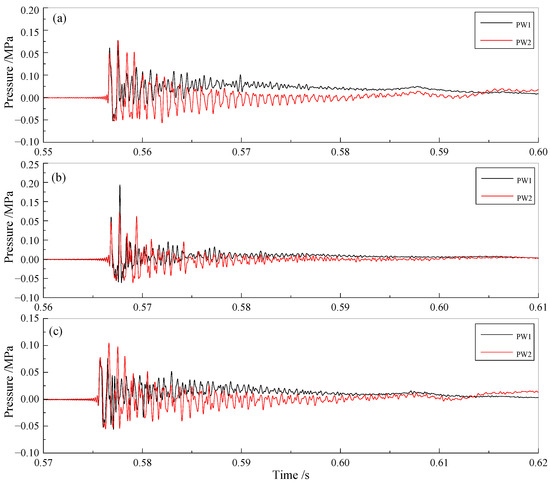
Figure 15.
Curves of the pressure signals when different nozzles were installed: (a) StraightN0, (b) ShrinkingN20, and (c) ExpandingN20.
The analysis suggested that the energy of the shock wave passing through the expanding nozzle was more dispersed and changed the orientation of the energy distribution, making the peak of the TSW at PW2 larger than PW1. With the same detonation energy, the shrinking nozzle concentrated the TSW energy on the axis, and the pressure peak of the shrinking nozzle installed at PW2 was smaller than that of the straight nozzle installed.
According to the existing research [30], the frequency of the TSW is higher than 800 Hz (correlation with experimental conditions). However, the frequency of the bubble pulsation is much lower, below 200 Hz. For a better analysis of the pulsation pressure of the bubble under the conditions of different nozzles, the sensor on the axis of the detonation tube was selected for analysis. PW1 pressure signals in Figure 15 were filtered using a low-pass filter with a cutoff frequency of 800 Hz.
The characteristic parameters of the pulsation pressure wave of the bubble are shown in Table 6, where the interval time is the difference between the moment of the shock wave arrival and the pressure peak of the bubble pulsation. It could be found that the minimum pressure of bubble pulsation was only 9.8 kPa when the shrinkage nozzle was attached. This was dramatically increased when the other two kinds of nozzles were installed, approximately 24.3 kPa and 26.1 Pa, respectively. The results indicate that the pulsating energy of the bubble can be suppressed using a shrinking nozzle to suppress bubble pulsation, which is consistent with the conclusion from the analysis of the bubble pulsation profile above using high-speed photography.
Table 6.
Characteristic parameters of the pulsation pressure of the bubble when different nozzles were installed.
4.3. Frequency Characterization of the Transmitted Shock Wave
The final element of underwater detonation phenomena to be addressed is the frequency characteristics of the pressure wave, which could be altered due to the influence of nozzles. For underwater detonation, the influence of the nozzles on the frequency characteristics is of great interest for propulsion performance via a detonation engine. The frequency characteristics of pressure waves can be best described by performing a fast Fourier transform (FFT) calculation on the series of pressure–time curves under the conditions of different nozzles from PW1, as presented in Figure 16.
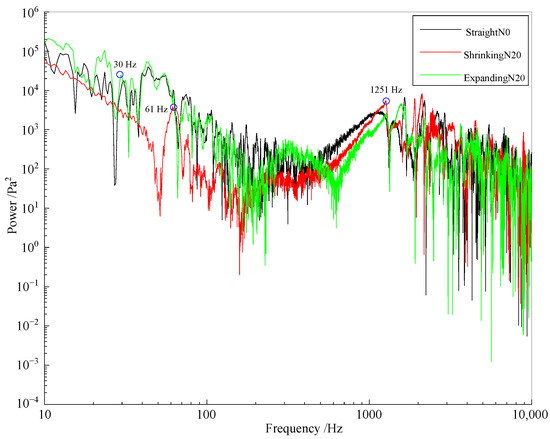
Figure 16.
Frequency characteristics of pressure waves when different nozzles were installed.
From these curves, it is evident that the main energy from the underwater detonation is concentrated at a low frequency, in particular, a frequency smaller than 80 Hz, for each condition. The components in the low-frequency energy come from different sources, including the pressure of the shock wave and bubble pulsation concerned in this paper, the water surface fluctuation (0–15 Hz), and the water tank vibration caused by shock waves (correlation with experimental conditions).
First, it is worth noting that there were obvious peaks near the frequency of 30 Hz, which indicated the rate of bubble pulsation. The peak frequency was located at 43 Hz when the expanding nozzle was installed, a little higher than that based on the straight nozzle, and the corresponding amplitude of the bubble pulsation was also the largest during the conditions of three nozzles. This is consistent with the pulsation period obtained using high-speed photography. It similarly showed that the bubble had more gas and greater energy when the expansion nozzle was installed, so the pulsation period was longer, and the intensity was stronger.
Second, the TSW produced more energy in the high-frequency range when the shrinking nozzle was installed, larger than 1000 Hz. The energy of the bubble from the expanding installed nozzle was higher in the low-frequency segment (frequency below 200 Hz), while that of the shrinking nozzle was lower. For the underwater propulsion engine, the energy of the TSW was concentrated in the high-frequency segment, which was conducive to the concealment of the machine.
Additionally, the frequency of the tank vibration was in the range of 40~70 Hz, and the peak frequency of 61 Hz when the shrinking nozzle was installed was higher than the peak frequency of 43 Hz for the expanding nozzle. The major reason for this is that the pressure of the TSW when the shrinking nozzle was installed was more powerful than that of the expanding nozzle, which shifted the peak frequency of the tank vibration to the high-frequency segment.
Finally, the peak frequency of the surface fluctuation signal was below 20 Hz, which can be proved in our previous research. The measurement results show that surface fluctuation would be more influenced by the intensity of the first bubble pulsation, which means that the detonation tube would transmit more energy into this component when the expanding nozzle is installed.
5. Conclusions
This report has introduced and provided an in-depth description of the elements of an underwater detonation via a detonation tube when three typical nozzles are installed, where the high-speed camera and underwater blast sensor were used to record the images and pressure data. From the details and examples presented herein, it is clear that underwater detonation phenomena when different nozzles are installed are indeed complex.
The research results show that:
- (1)
- The conversion process of the energy of the detonation gas to the bubble energy was affected by the nozzle; the shrinking nozzle was only 19% higher than that of the straight nozzle, while the expanding nozzle was 6% higher than when the straight nozzle was installed. The pulsation pressure of the bubble was only 9.8 kPa when the shrinking nozzle was installed, which was much smaller than 26.1 kPa when the expanding nozzle was attached.
- (2)
- The shrinking nozzle reduced the velocity of the gas jet from the underwater detonation, but the expanding nozzle enlarged this. Compared with the morphological characteristics of the bubble when the straight nozzle was installed, the expanding nozzle decreased the aspect ratio of the bubble and had little effect, but the evolution of the bubble was severely hindered by the shrinking nozzle.
- (3)
- The shrinking nozzle increased the shock wave pressure in the water but reduced the peak pressure of the bubble pulsation. The expanding nozzle reduced the peak of the shock wave in water but increased the bubble pulsation pressure.
- (4)
- The nozzle changed the frequency spectrum of the pressure wave in the water. The energy of the pressure wave moved towards the high-frequency segment when installing the shrink nozzle.
Since the nozzle types in practical applications are more complex, such as the Laval nozzle, the investigation of the gas jet generated by underwater detonation when different nozzles are installed will be continued. The objective of this paper is to provide a deeper understanding of the influence of nozzle type on an underwater detonation and to provide sufficiently detailed information for further propulsion research.
Author Contributions
Conceptualization, C.W. (Chuanwei Wang) and N.L.; methodology, C.W. (Chuanwei Wang) and N.L.; software, C.W. (Chuanwei Wang); validation, N.L.; formal analysis, C.W. (Chuanwei Wang); investigation, C.W. (Chuanwei Wang); resources, X.H. and C.W. (Chunsheng Weng); data curation, N.L.; writing—original draft preparation, C.W. (Chuanwei Wang); writing—review and editing, N.L.; visualization, C.W. (Chuanwei Wang); supervision, N.L.; project administration, C.W. (Chunsheng Weng); funding acquisition, X.H. and C.W. (Chunsheng Weng). All authors have read and agreed to the published version of the manuscript.
Funding
This research was funded by the Fundamental Research Funds of the Central Universities, grant number 30919011258; the China Scholarship Council, grant number 201906845059; the Young Scientists Found of the Natural Science Foundation of Jiangsu Province, grant number BK20190439.
Institutional Review Board Statement
Not applicable.
Informed Consent Statement
Not applicable.
Data Availability Statement
Not applicable.
Acknowledgments
We acknowledge Tiago Ferreira and Wayne Rasband for providing the ImageJ User Guide.
Conflicts of Interest
The authors declare no conflict of interest.
References
- Zhang, C.; Yu, W.; Wang, B. Research on the initial flow field characteristics of underwater supersonic gas jets. Acta Armamentarii 2018, 39, 961–968. [Google Scholar]
- Skryja, P.; Hudak, I.; Bojanovsky, J.; Jegla, Z.; Korček, L. Effects of oxygen-enhanced combustion methods on combustion characteristics of non-premixed swirling flames. Energies 2022, 15, 2292. [Google Scholar] [CrossRef]
- Mcneese, A.R.; Sagers, J.D.; Wilson, P.S.; Knobles, D.P. An investigation of the combustive sound source. Proc. Meet. Acoust. 2010, 9, 005002. [Google Scholar]
- Fronzeo, M.; Kinzel, M.P. An investigation of compressible gas jets submerged into water. In Proceedings of the 46th AIAA Fluid Dynamics Conference, Washington, DC, USA, 13–17 June 2016. [Google Scholar]
- He, M.S.; Qin, L.Z.; Liu, Y. Oscillation flow induced by underwater supersonic gas jets from a rectangular laval nozzle. Procedia Eng. 2015, 99, 1531–1542. [Google Scholar]
- Luo, J.; Niu, Z.P. Jet and shock wave from collapse of two cavitation bubbles. Sci. Rep. 2019, 9, 1352. [Google Scholar] [CrossRef] [Green Version]
- Wang, L.L.; Liu, Y.; Li, D.Q.; Wu, Q.; Wang, G.Y. Numerical study of underwater supersonic gas jets for solid rocket engine. Acta Armamentarii 2019, 40, 1161. [Google Scholar]
- Gong, Z.X.; Lu, C.J.; Li, J.; Cao, J.Y. The gas jet behavior in submerged laval nozzle flow. J. Hydrodyn. 2017, 29, 1035–1043. [Google Scholar] [CrossRef]
- Zhang, X.Y.; Li, S.P.; Yang, B.Y.; Wang, N.F. Flow structures of over-expanded supersonic gaseous jets for deep-water propulsion. Ocean Eng. 2020, 213, 107611. [Google Scholar] [CrossRef]
- Zhang, X.Y.; Li, S.P.; Yu, D.; Yang, B.Y.; Wang, N.F. The evolution of interfaces for underwater supersonic gas jets. Water 2020, 12, 488–518. [Google Scholar] [CrossRef] [Green Version]
- Nguyen, V.T.; Phan, T.H.; Duy, T.N.; Kim, D.H.; Park, W.G. Numerical modeling for compressible two-phase flows and application to near-field underwater explosions. Comput. Fluids 2021, 215, 104805. [Google Scholar] [CrossRef]
- Phan, T.H.; Nguyen, V.T.; Duy, T.N.; Park, W.G. Numerical study on simultaneous thermodynamic and hydrodynamic mechanisms of underwater explosion. Int. J. Heat Mass Transf. 2021, 178, 121581. [Google Scholar] [CrossRef]
- Yu, J.; Liu, G.Z.; Wang, J.; Wang, H.K. An effective method for modeling the load of bubble jet in underwater explosion near the wall. Ocean Eng. 2021, 220, 108408. [Google Scholar] [CrossRef]
- Li, T.; Wang, S.P.; Li, S.; Zhang, A.M. Numerical investigation of an underwater explosion bubble based on FVM and VOF. Appl. Ocean Res. 2018, 74, 49–58. [Google Scholar] [CrossRef]
- Liang, H.Z.; Zhang, Q.M.; Long, R.R.; Ren, S.Y. Pulsation behavior of a bubble generated by a deep underwater explosion. AIP Adv. 2019, 9, 025108. [Google Scholar]
- Poplavski, S.V.; Boiko, V.M.; Lotov, V.V.; Nesterov, A.U. On the dispersion of liquid in coaxial supersonic gas jet. J. Phys. Conf. Ser. 2017, 894, 012115. [Google Scholar] [CrossRef]
- Zhou, Y.F.; Kang, P.X.; Huang, Z.L.; Yan, P.; Sun, J.Y.; Wang, J.D.; Yang, Y.R. Experimental measurement and theoretical analysis on bubble dynamic behaviors in a gas-liquid bubble column. Chem. Eng. Sci. 2020, 211, 115295. [Google Scholar] [CrossRef]
- Cong, S.H.; Liu, J.T. Experimental study on bubble acoustic characteristics of elliptical nozzles. E3S Web Conf. 2021, 299, 01009. [Google Scholar] [CrossRef]
- Shi, H.H.; Wang, J.F.; Chen, S.; Dong, R.L. Experimental study on flow characteristics at the initial injection stage of underwater supersonic gas jets. J. Univ. Sci. Technol. China 2014, 44, 233–237. [Google Scholar]
- Frolov, S.M.; Avdeev, K.A.; Aksenov, V.S.; Frolov, F.S.; Sadykov, I.A.; Shamshin, I.O.; Tukhvatullina, R.R. Pulsed detonation hydroramjet: Simulations and experiments. Shock Waves 2019, 30, 221–234. [Google Scholar] [CrossRef]
- Frolov, S.M.; Avdeev, K.A.; Aksenov, V.S.; Frolov, F.S.; Sadykov, I.A.; Shamshin, I.O.; Tukhvatullina, R.R. Pulse-Detonation Hydrojet. In Proceedings of the Scientific-Practical Conference “Research and Development—2016”, Moscow, Russia, 14–15 December 2016. [Google Scholar]
- Avdeev, K.A.; Aksenov, V.S.; Borisov, A.A.; Sevastopoleva, D.G.; Tukhvatullina, R.R.; Frolov, S.M.; Frolov, F.S.; Shamshin, I.O.; Basara, B.; Edelbauer, W.; et al. Calculation of shock wave propagation in water containing reactive gas bubbles. Russ. J. Phys. Chem. B 2017, 11, 261–271. [Google Scholar] [CrossRef]
- Liu, W.; Li, N.; Weng, C.S.; Huang, X.L.; Kang, Y. Bubble dynamics and pressure field characteristics of underwater detonation gas jet generated by a detonation tube. Phys. Fluids 2021, 33, 023302. [Google Scholar] [CrossRef]
- Xiang, M.; Zhao, X.Y.; Zhou, H.C. Transient dynamic analysis for the submerged gas jet in flowing water. Eur. J. Mech. B-Fluids 2021, 85, 351–360. [Google Scholar] [CrossRef]
- Zhang, H.H.; Guo, Z.Q.; Wang, R.Q.; Chen, Z.H.; Huang, Z.G. Initial flow characteristics of an underwater supersonic gas jet. J. Vib. Shock 2019, 38, 88–93. [Google Scholar]
- He, Q.G.; Zhang, W.; Chen, X.W.; Xu, J.P. Analysis on the deformation process of PET shock tube diaphragm. Explos. Shock Waves 2019, 39, 033201. [Google Scholar]
- Doludenko, A.N. On contact instabilities of viscoplastic fluids in two-dimensional setting. Comput. Math. Math. Phys. 2017, 57, 1550–1557. [Google Scholar] [CrossRef]
- Wilson, P.S.; Ellzey, J.L.; Muir, T.G. Experimental investigation of the combustive sound source. IEEE J. Ocean. Eng. 1995, 20, 311–320. [Google Scholar] [CrossRef]
- Asahara, M.; Saburi, T.; Ando, T.; Takahashi, Y.; Miyasaka, T.; Kubota, S. Self-ignited flame behavior of high-pressure hydrogen release by rupture disk through a long tube. Int. J. Hydrogen Energy 2021, 46, 13484. [Google Scholar] [CrossRef]
- Liu, W.; Li, N.; Huang, X.L.; Kang, Y.; Li, C.; Qiang, W.; Weng, C.S. Experimental study of underwater pulse detonation gas jets: Bubble velocity field and time-frequency characteristics of pressure field. Phys. Fluids 2021, 33, 083324. [Google Scholar] [CrossRef]
Publisher’s Note: MDPI stays neutral with regard to jurisdictional claims in published maps and institutional affiliations. |
© 2022 by the authors. Licensee MDPI, Basel, Switzerland. This article is an open access article distributed under the terms and conditions of the Creative Commons Attribution (CC BY) license (https://creativecommons.org/licenses/by/4.0/).