Article

Experimental and Numerical Study on the Effect of Hydrogen Addition on Laminar Burning Velocity of Ethanol–Air Mixtures

1
State Key Laboratory of Clean Energy Utilization, College of Energy Engineering, Zhejiang University, Hangzhou 310027, China
2
College of Mechanical and Electrical Engineering, Wenzhou University, Wenzhou 325035, China
*
Author to whom correspondence should be addressed.
Energies 2022, 15(9), 3114; https://doi.org/10.3390/en15093114
Submission received: 4 March 2022 / Revised: 11 April 2022 / Accepted: 18 April 2022 / Published: 24 April 2022
(This article belongs to the Topic Fuel Combustion Chemistry)

Abstract

:
To understand the effect of hydrogen addition on the laminar burning velocity (LBV) of ethanol–air mixtures, experiments were conducted in a constant volume combustion chamber with the high-speed schlieren photography technique. The experiments were carried out under the equivalence ratios (ERs) of 0.7–1.4, an initial temperature of 400 K, an initial pressure of 0.1 MPa, and hydrogen fractions of 30% and 90% by volume, respectively. The effects of ER, initial temperature, initial pressure, and hydrogen fractions on the LBV were investigated. Moreover, adiabatic flame temperature (AFT), heat release rate (HRR), flow rate sensitivity analysis, and ROP (rate of production) analysis were also performed. Results showed that LBV increased with increasing hydrogen addition and temperature but decreased with increasing pressure. The hydrogen addition significantly increased the HRR of ethanol–hydrogen–air flames. The sensitivity analysis showed that R5 (O2 + H = O + OH) significantly influenced the LBV.

Graphical Abstract

1. Introduction

Environmental pollution, resource scarcity, and a slew of other energy issues have necessitated the exploration of alternative green fuels such as ethanol, hydrogen, etc. to traditional fossil fuels. Ethanol is widely used due to its renewability, cleanliness, and oxygenation [1]. Compared with gasoline, ethanol can effectively reduce CO and HC emissions due to its enough oxygen content for complete combustion. Moreover, ethanol could reduce engine knocking and enhance engine performance due to its high-octane number. However, the high latent heat of vaporization and low calorific value limit the combustion characteristics of ethanol [2,3].
Furthermore, hydrogen has been considered an alternative fuel in combustion devices and fuel addictive to various fuels to improve their combustion performance due to its high calorific value, wide flammability limits, and cleanliness [4,5,6]. Additionally, enriching or adding hydrogen to fuels such as ethanol can increase the laminar burning velocity (LBV) [7], increase the flame resistance to strain-induced extinction [8,9], and the overall combustion stability [10]. Consequently, a deeper understanding of the combustion characteristics of ethanol–hydrogen-blended fuel is very significant for its use in combustion devices [11].
LBV is an important parameter used to understand the dynamics of a combustion process, i.e., it represents the exothermicity, reactivity, and diffusivity of a combustion process. Therefore, LBV can be used to evaluate the performance of combustion devices. To this end, several studies have been performed to investigate the LBV of different fuel mixtures. Al-Hamamre et al. [12] investigated ethanol–hydrogen–air flames and found that the LBV increased linearly with the increasing hydrogen fraction. Elsewhere, Li et al. [13] investigated the effects of hydrogen addition on ethanol outwardly propagating spherical laminar premixed flame characteristics. The results showed that the LBV increased with increasing hydrogen fraction and flame instability was exacerbated with increasing hydrogen concentration. Ji et al. [14] proposed an LBV correlation for the combustion simulation of a hydrogen-rich ethanol engine, which covered the combustion conditions encountered in the combustion process of the spark-ignition engine.
Although many researchers have conducted a series of studies such as experimental verification, simulation, and correlation on the LBV of hydrogen addition to ethanol–air mixtures [15,16], few scholars have conducted chemical reaction kinetic simulation studies on the premixed laminar burning characteristics of ethanol–hydrogen mixed fuel. Therefore, the LBV of hydrogen–ethanol blend fuel was studied experimentally and numerically in this paper. Kinetic simulations of hydrogen addition on ethanol–air mixtures under different ethanol volume fractions and ERs were carried out. Additionally, flow rate sensitivity analysis was conducted to further investigate the effect of hydrogen addition on the LBV of ethanol–hydrogen–air mixtures. The research results enrich the basic data of hydrogen–ethanol–air laminar premixed flames and could also be used as a basis for the design of hydrogen-added ethanol engines.

2. Study Methodology

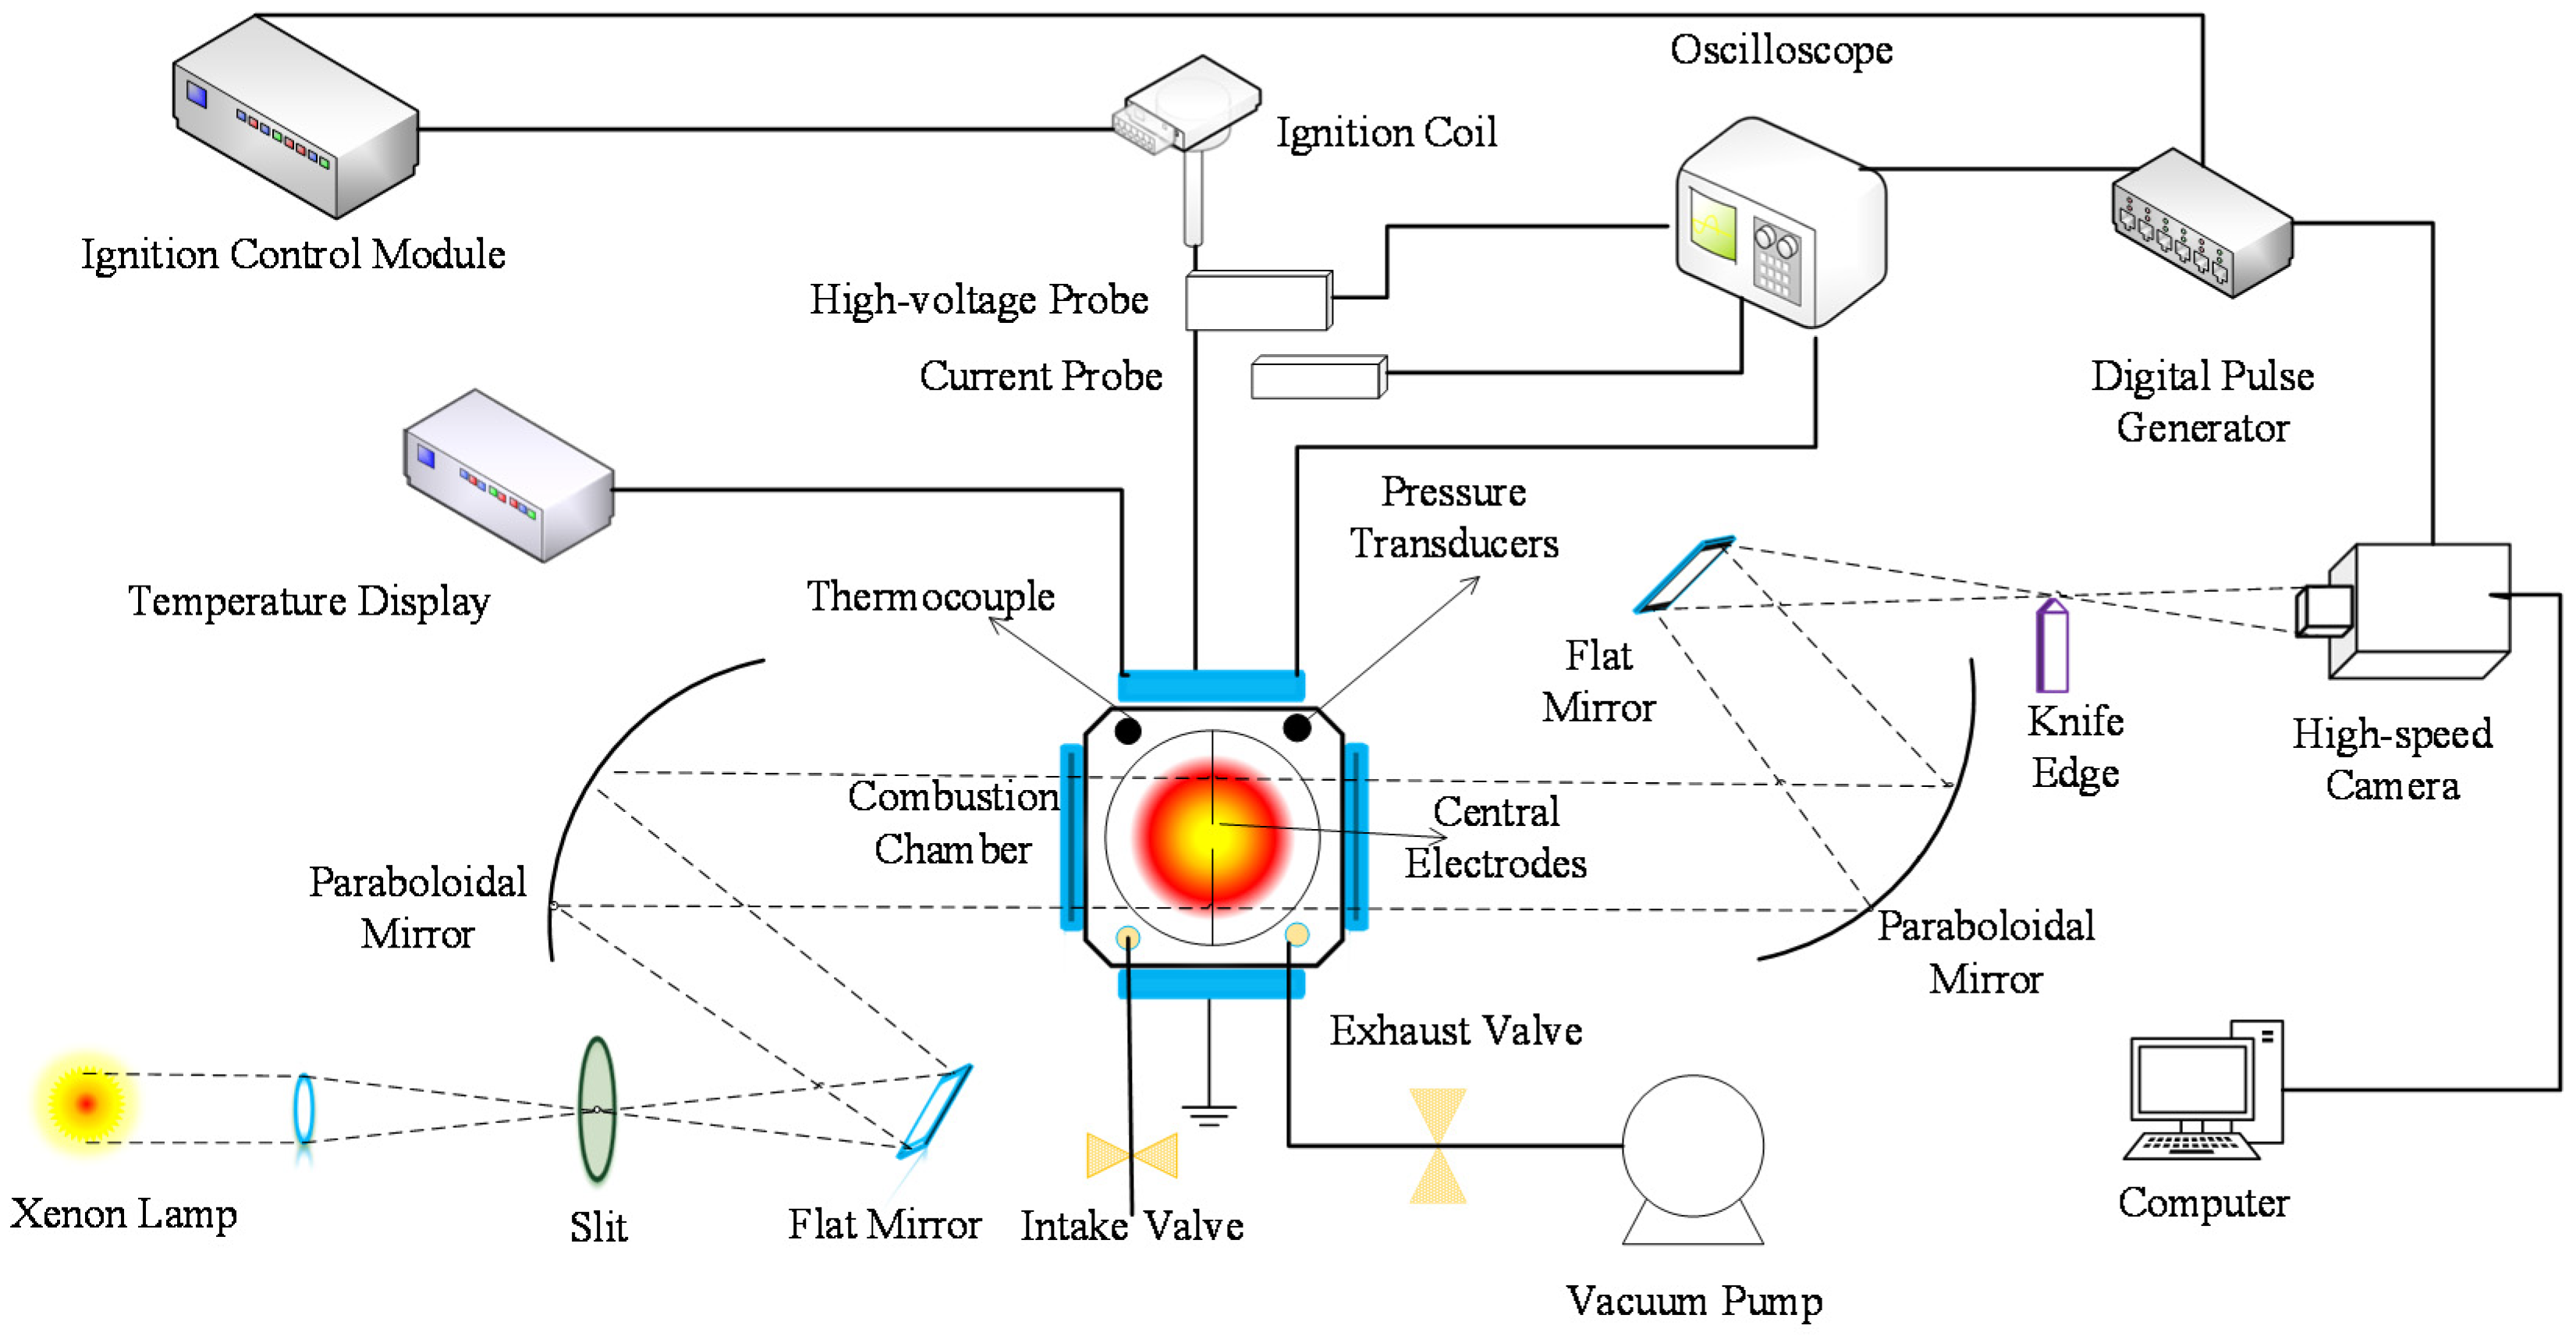
2.1. Experimental Setup

Figure 1 shows the experimental equipment, which consisted of a constant volume combustion chamber (CVCC), air intake and exhaust system, heating device, high-speed schlieren system, ignition, and data acquisition systems [17]. The inner cavity of the constant volume bomb is a space formed by the intersection of three orthogonal cylinders, which has an inner diameter of 158 mm and a volume of 1.94 L. The testing device also has an imaging system. The two sides of the CVCC are equipped with quartz glass windows (diameter = 105 mm) which provide optical paths of the schlieren system for imaging the flame [18,19]. A high-speed camera with a speed of 12,800 fps and a resolution of 1024 × 1024 pixels was used to capture the flame images in the CVCC in real time and save them on a computer. A central electrode (diameter = 0.4 mm) was arranged in the CVCC for ignition. A K-type thermocouple (±0.75%) and pressure sensor were used to measure the initial temperature and pressure, respectively. Heating rods were arranged evenly outside the CVCC and heated by a PID control heater. An oscilloscope recorded pressure change in real time according to the pressure sensor.
The heating coil heated the CVCC to the tested initial temperature before the fuel was introduced into the CVCC. During the experiment, the solenoid valve flowmeter was opened to fill the CVCC with the hydrogen–air mixture; meanwhile, a microsyringe was used to inject the ethanol into the CVCC. The hydrogen–ethanol mixture was allowed to stand for 3 to 5 min to ensure that the fuel mixed fully before ignition. The high-pressure air pump was used to flush the combustion exhaust gas inside the CVCC for at least 5 min. The experiments were carried out at the initial temperature, pressure, and ER conditions of 400 K, 0.1 MPa, and 0.7–1.4, respectively. The volumetric fraction of 30% (H30E70) and 90% (H90E10) hydrogen was mixed with ethanol. To ensure the certainty of experimental data, three sets of experiments were performed at every condition and averaged to obtain the final dataset. The uncertainty of the experimental data measurement was between 0.1% and 5%.

2.2. Extrapolation Methodology and Data Processing

The methodology to calculate the LBV in this paper is widely used [20,21,22,23]. The radius ( r f ) of the spherical flame is calculated by Equation (1) as follows:
r f = n f n r
where n f , n , r are the pixels inside the flame front, the pixels of the optical window, and the actual radius of the optical window, respectively.
The stretched flame propagation speed ( S b ) is calculated using Equation (2) as follows:
S b = d r f d t
where t is the elapsed time after ignition.
The stretch rate ( α ) is defined as the derivative of the logarithm to time of infinitesimal area A of the flame front.
α = d ln A d t = 1 A d A d t = 2 r f d r f d t = 2 S b r f
In order to minimize the influence of electrode ignition energy at the early stage of flame development and pressure rise at the later stage of flame development, the flame radius of r f = 8 16   mm was used in the determination of flame propagation speed. There is a linear relationship between flame propagation rate and flame stretch rate,
S u 0 = S b 0 L b α
where L b is the Markstein length relative to the burned gas.
With the assumption of a quasi-steady and quasi-planar flame, LBV ( S u 0 ) is calculated based on the law of mass conservation using Equation (5) as follows:
S u 0 = ρ b ρ u S b 0
where ρ b and ρ u are the densities of burned and unburned gases, respectively.

2.3. Numerical Simulations

The numerical simulations were performed using the PREMIX code of CHEMKIN. The detailed chemical mechanism proposed by Zhang [24] for ethanol combustion was used for the simulation. The mechanism consists of 433 species and1004 reactions. The LBV was calculated using 1D adiabatic premixed laminar flame-speed calculation. The physical model of laminar burning was simplified to a mathematical model. It was assumed that one-dimensional flow has uniform entrance conditions. The correlation between mass flow rate, density, fluid mixture velocity, and the flame area is given in the continuous equation. The correlation between temperature, thermal conductivity, heat capacity, enthalpy, etc. is given in the energy conservation equation. The relationship between mass fraction and diffusion rate of substance is given by the conservation equation of composition. Finally, the relationship between pressure, average molecular weight, and gas constant is given by the equation of state [25].
In the simulation, a mixture-averaged formula was used to determine the species diffusion coefficients. This is less accurate than the full multicomponent approach but is usually computationally faster and often easier to converge. In order to ensure that the calculated value is in a thermodynamic equilibrium state, that is, all the heat release of the reaction is used to increase the temperature; the starting point of the reactor calculation was set as 0 cm, and the endpoint as 0.3 cm in the model. The curvature and gradient of 0.1 and 0.05, respectively, were used in the simulation. The number of grids was greater than 250 but less than 2000. The simulated LBVs were obtained at the initial pressures of 0.1, 0.2, and 0.3 MPa, with initial temperatures of 350, 400, and 450 K over the equivalence ratios of 0.7–1.4.

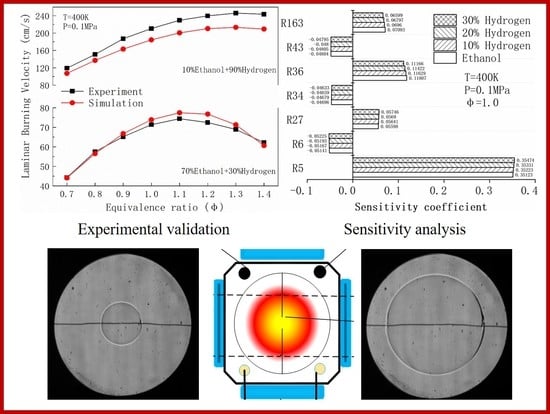
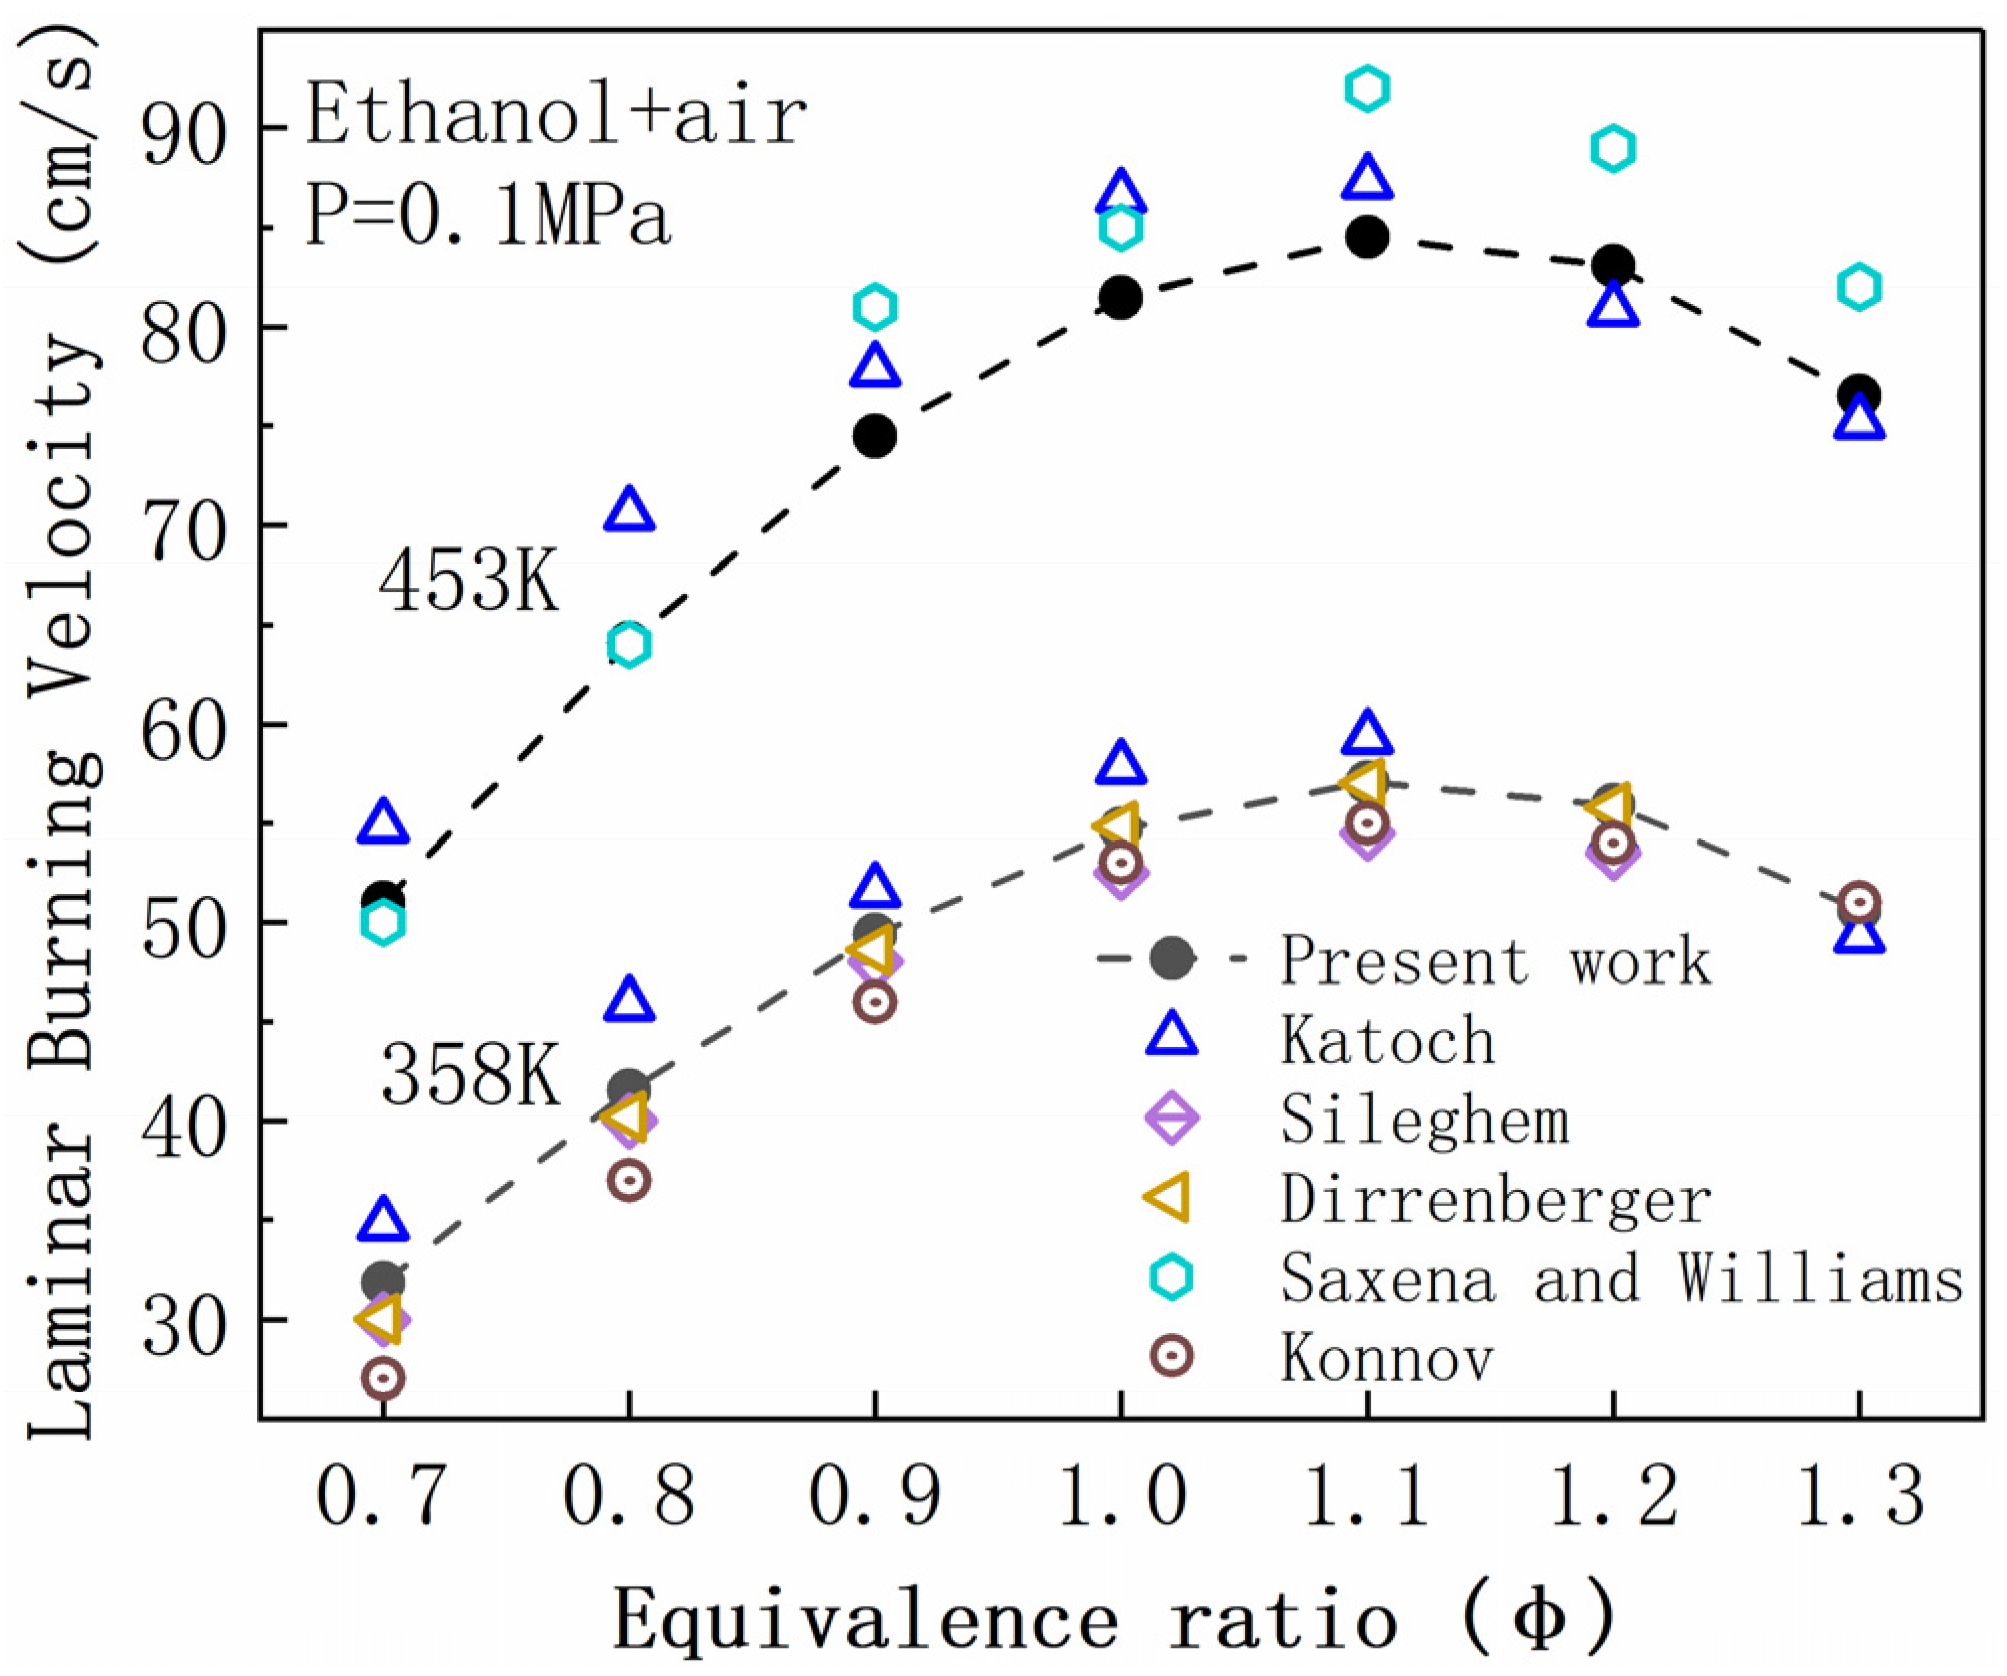
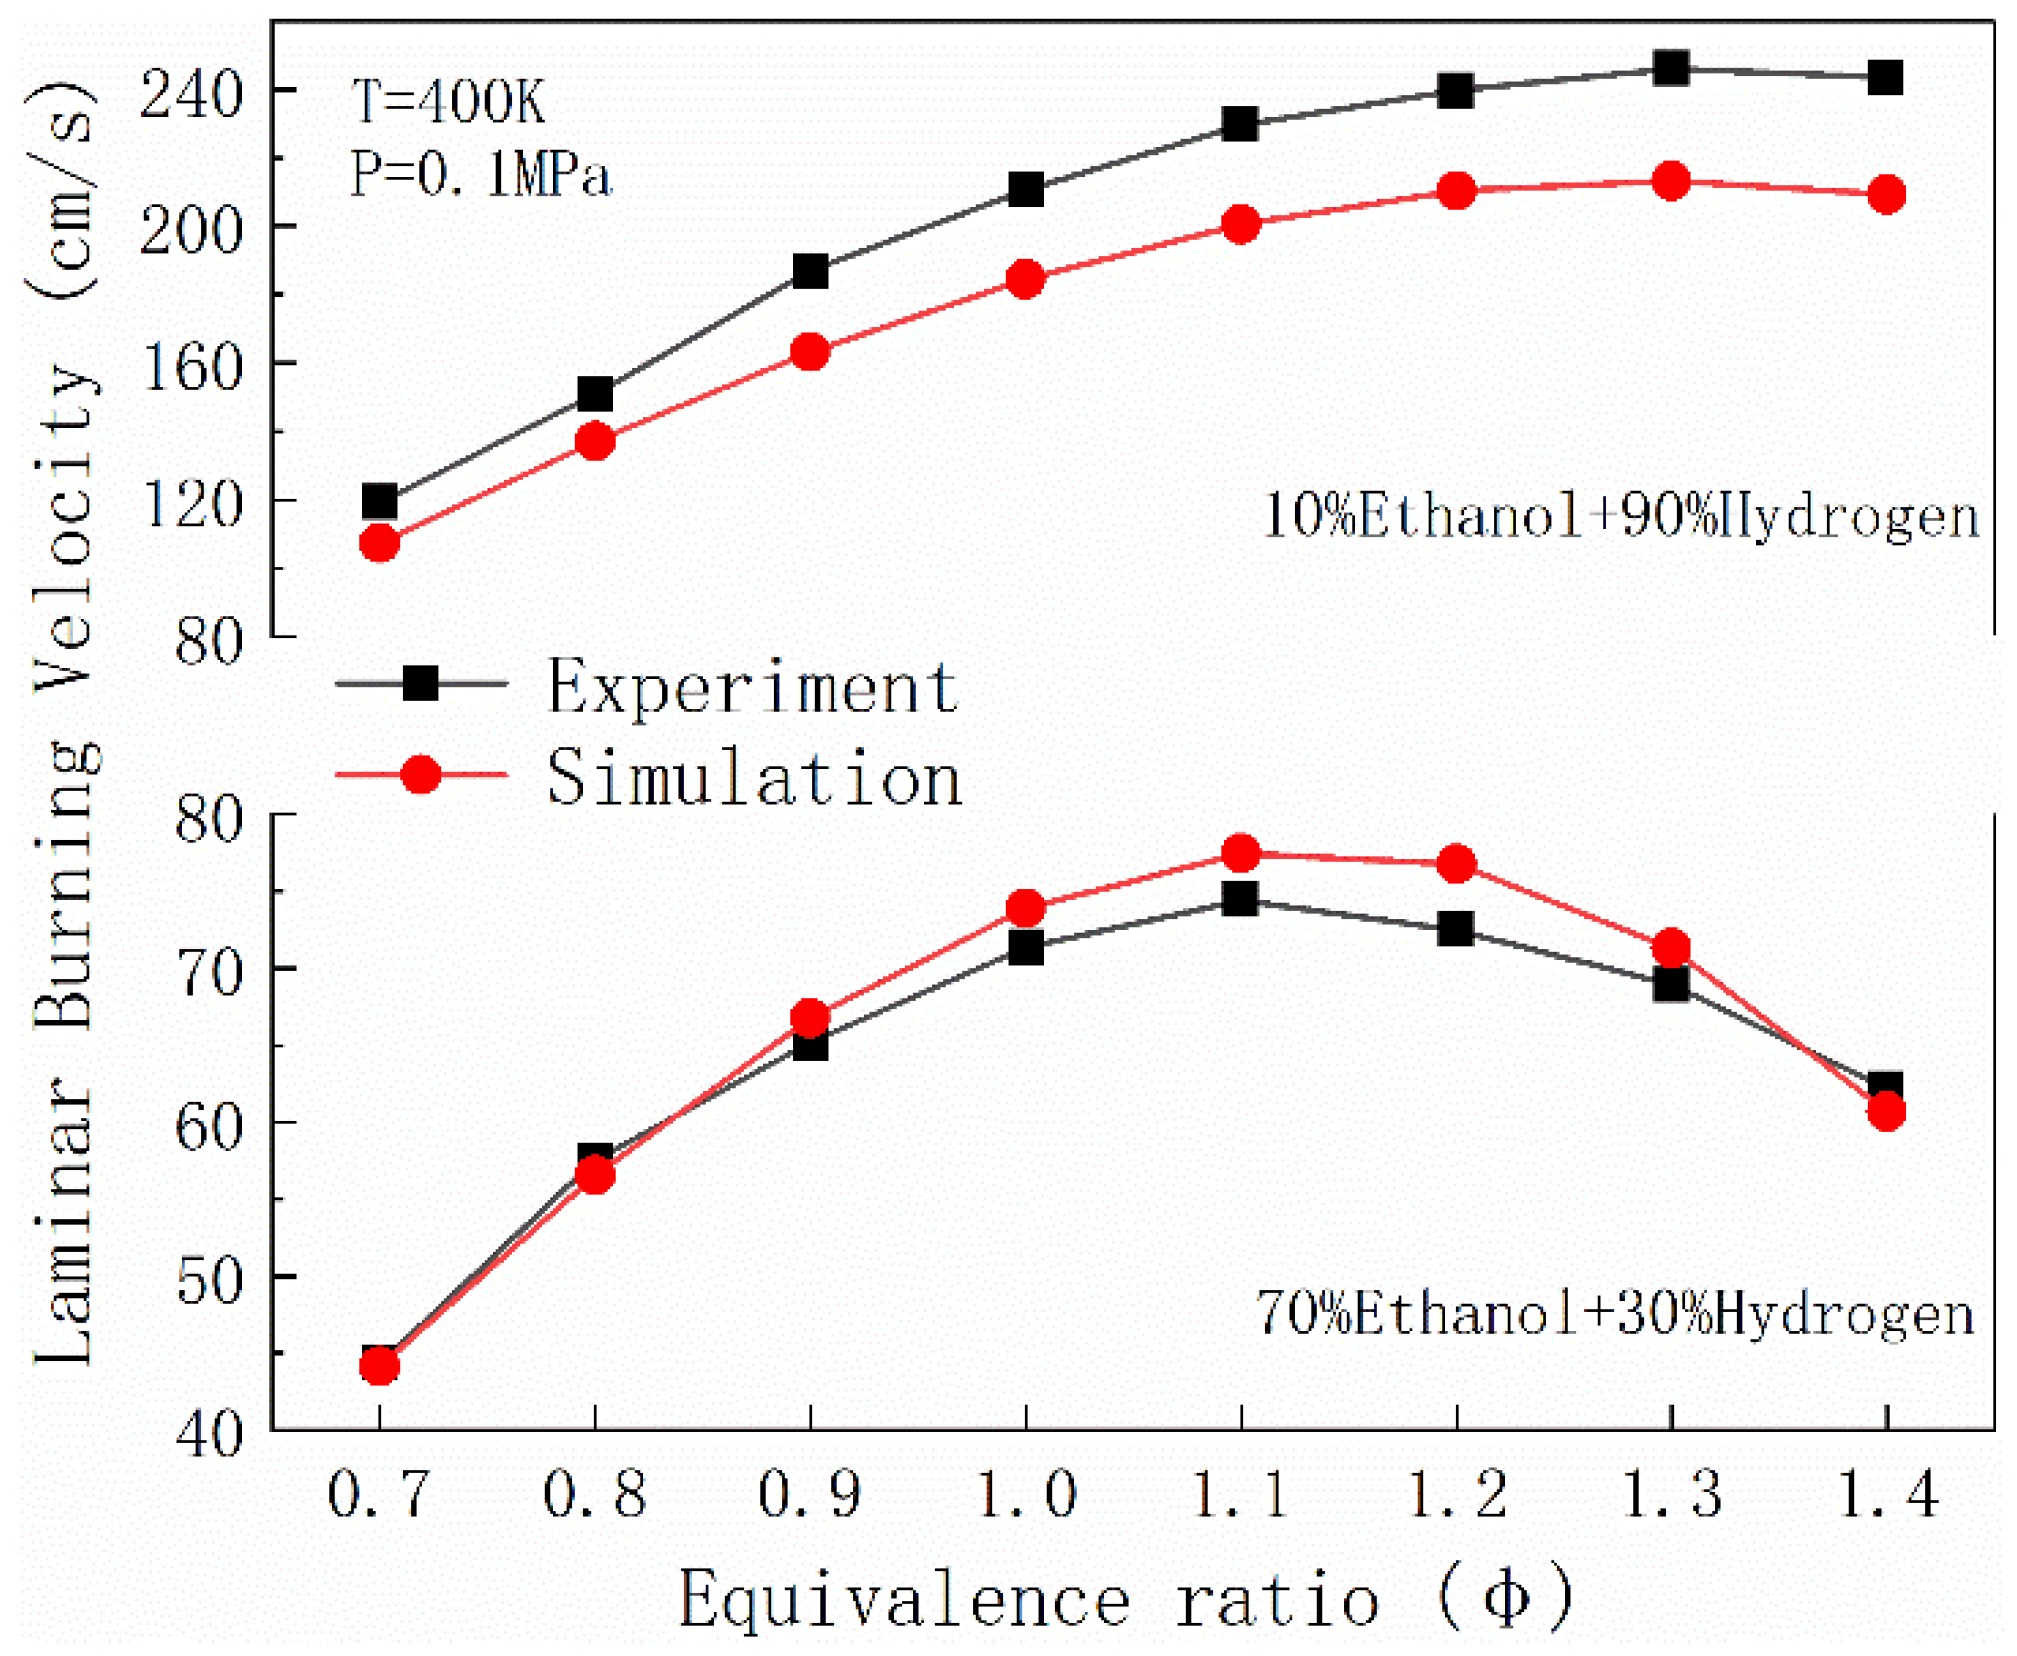
3. Validation of the LBV

Figure 2 presents the schlieren flame images of H30E70 at ϕ = 0.7, 0.9, 1.1, and 1.3, T0 = 400 K, and P0 = 0.1 MPa. Figure 2 shows that the flame propagates slowly at ϕ of 0.7 and 0.9 due to less heat released rate from the combustion process. However, the flame propagation is faster at ϕ of 1.1 due to the higher heat released rate and increased adiabatic flame temperature. Additionally, at ϕ of 1.3, the adiabatic flame temperature decreases, and the flame propagates slowly but faster than the flame propagation at ϕ of 0.7 and 0.9. The flame front propagates following the order of 1.1 > 1.3 > 0.9 > 0.7.
The LBV simulated with Zhang’s mechanism in this paper agrees well with Katoch [26], Sileghem [27], Dirrenberger [28], and Konnov [29] at 358 K, as shown in Figure 3. The difference between Katoch [26] and Saxena and Williams [30] at 453 K might be due to the different experimental methods and postprocessing methods used by the researchers. For both 358 K and 453 K, the LBV of the present study has roughly the same tendency as that of the literature data.
The comparison of the LBV of H30E70 and H90E10 obtained by experiment and simulation is shown in Figure 4. In the model, the system is assumed to be adiabatic, and in the experiment, adiabatic conditions cannot be achieved, so there are some differences. For H30E70, the simulation data agree well with our experimental one, especially for the lean and rich mixture. In general, the simulation results are larger than the experimental results, except ER = 0.8 and 1.4 for H30E70. For H90E10, the simulation data are overestimated at all the points. Considering the combustion characteristics of hydrogen, this research mainly studied ethanol mixing with a small amount of hydrogen. Consequently, this research can use the model to reasonably predict the premixed laminar combustion characteristics of the mixed fuel.

4. Result and Discussion

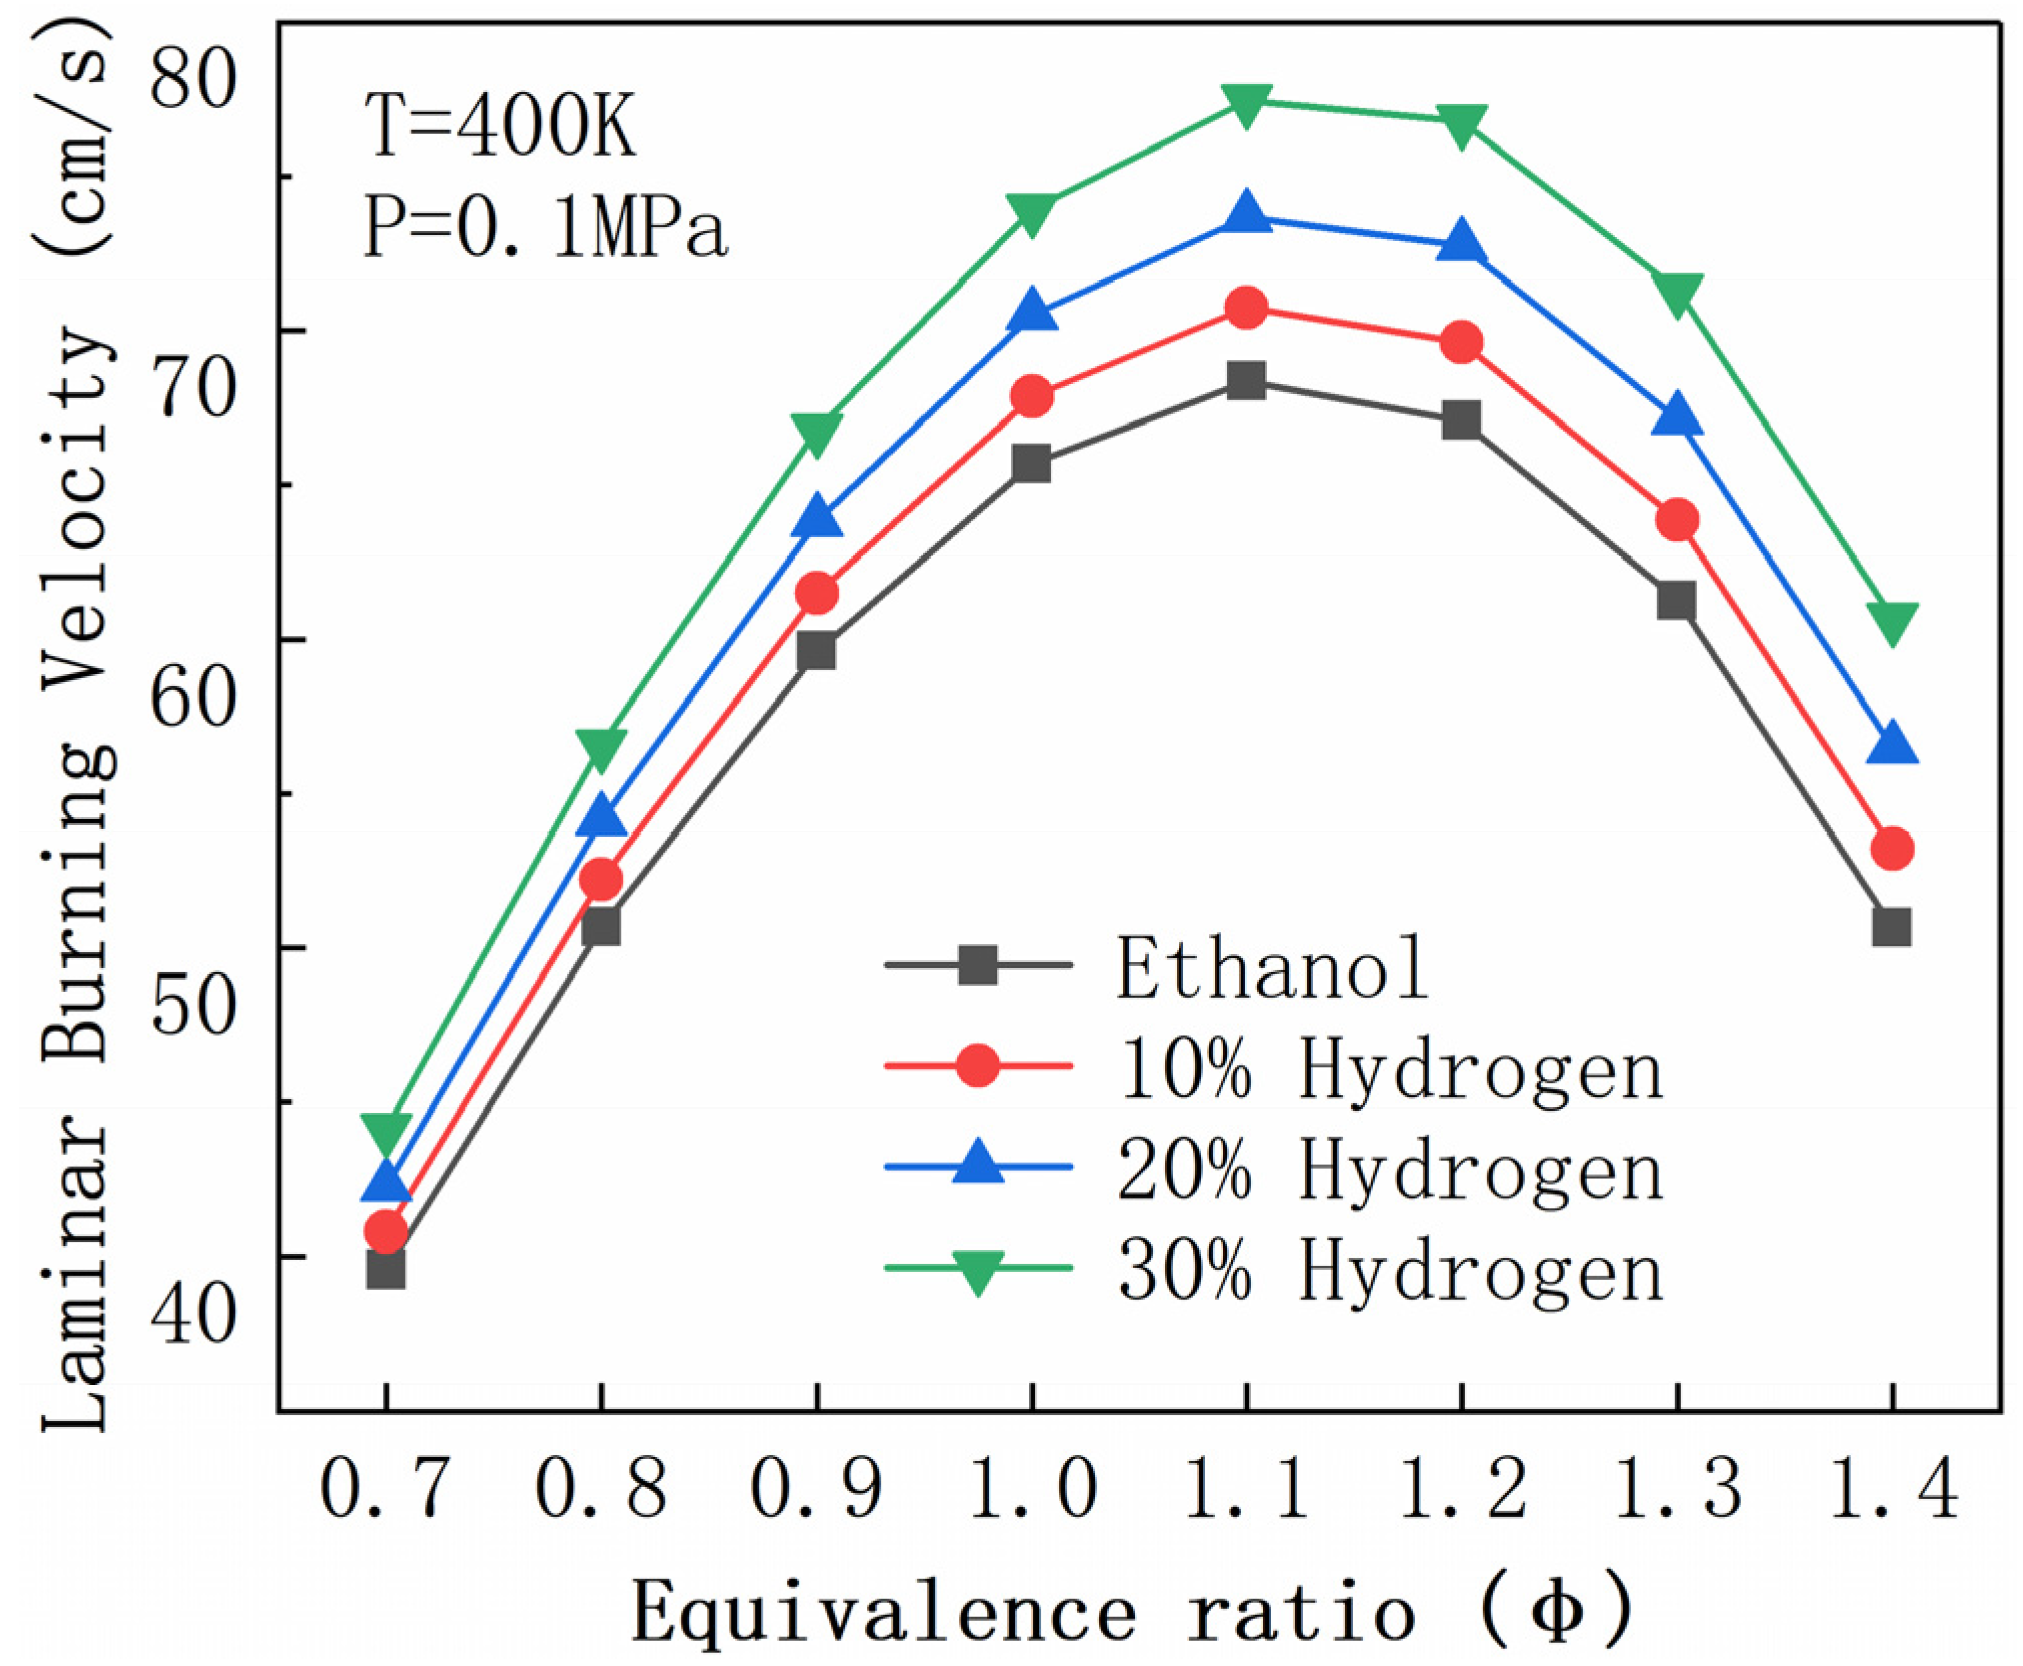
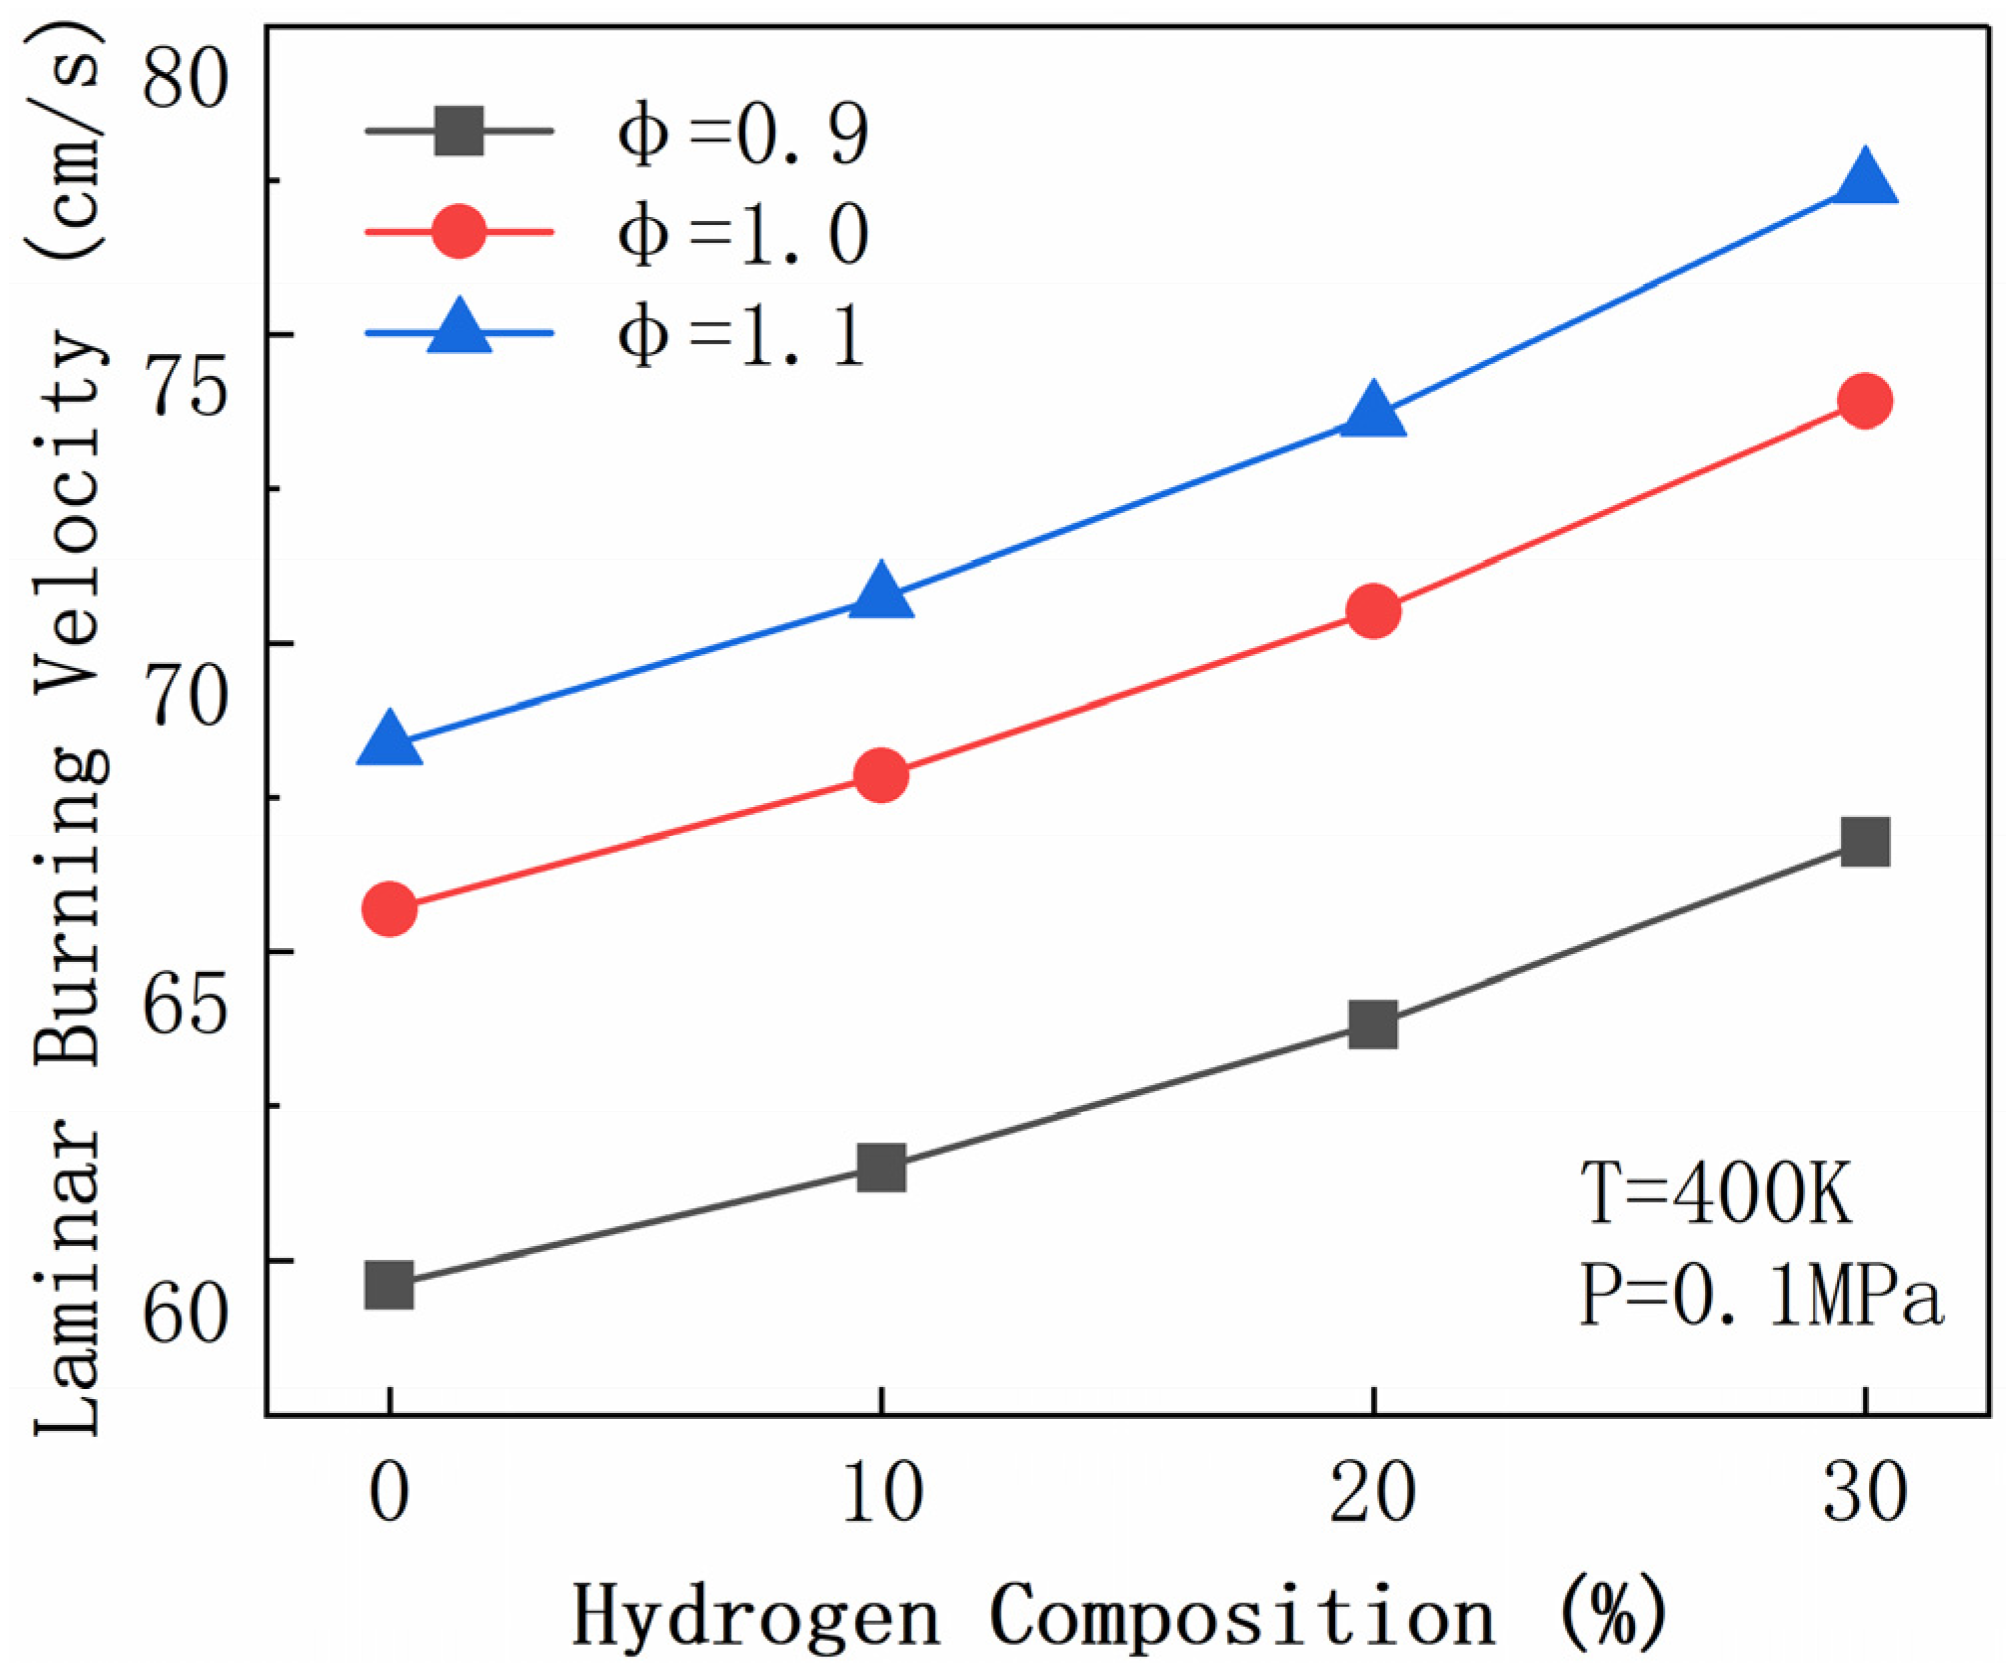
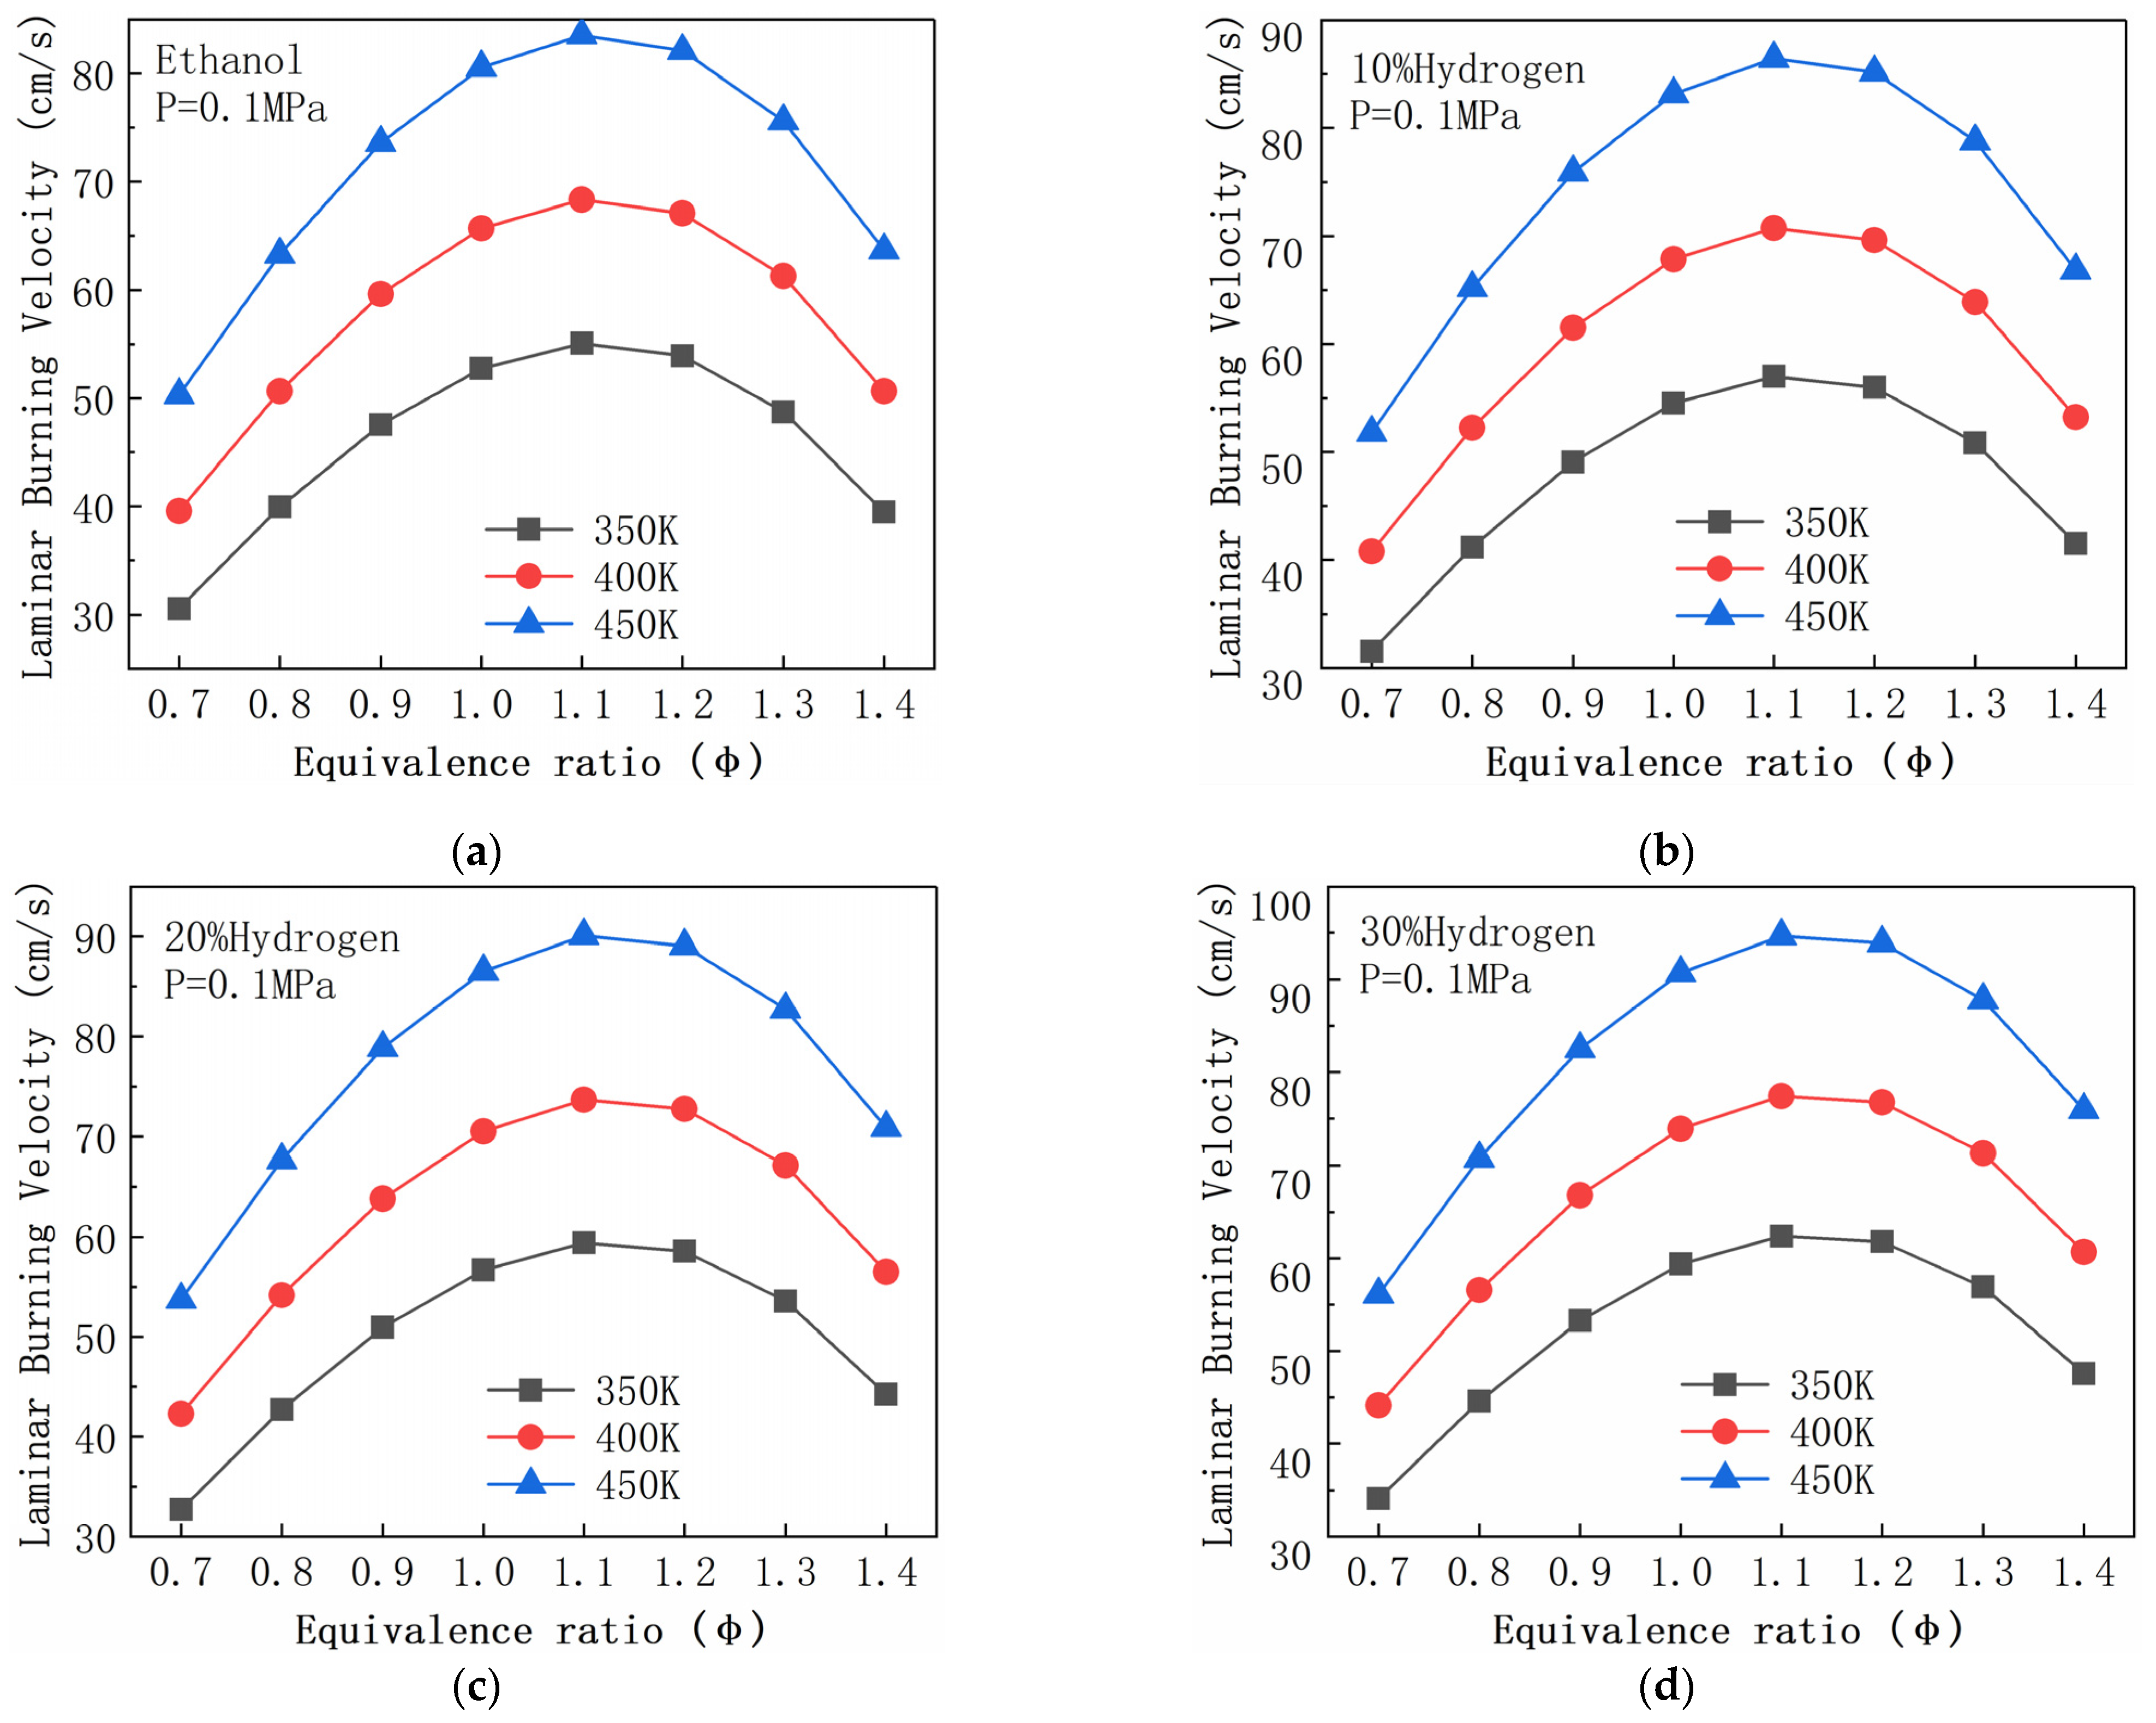
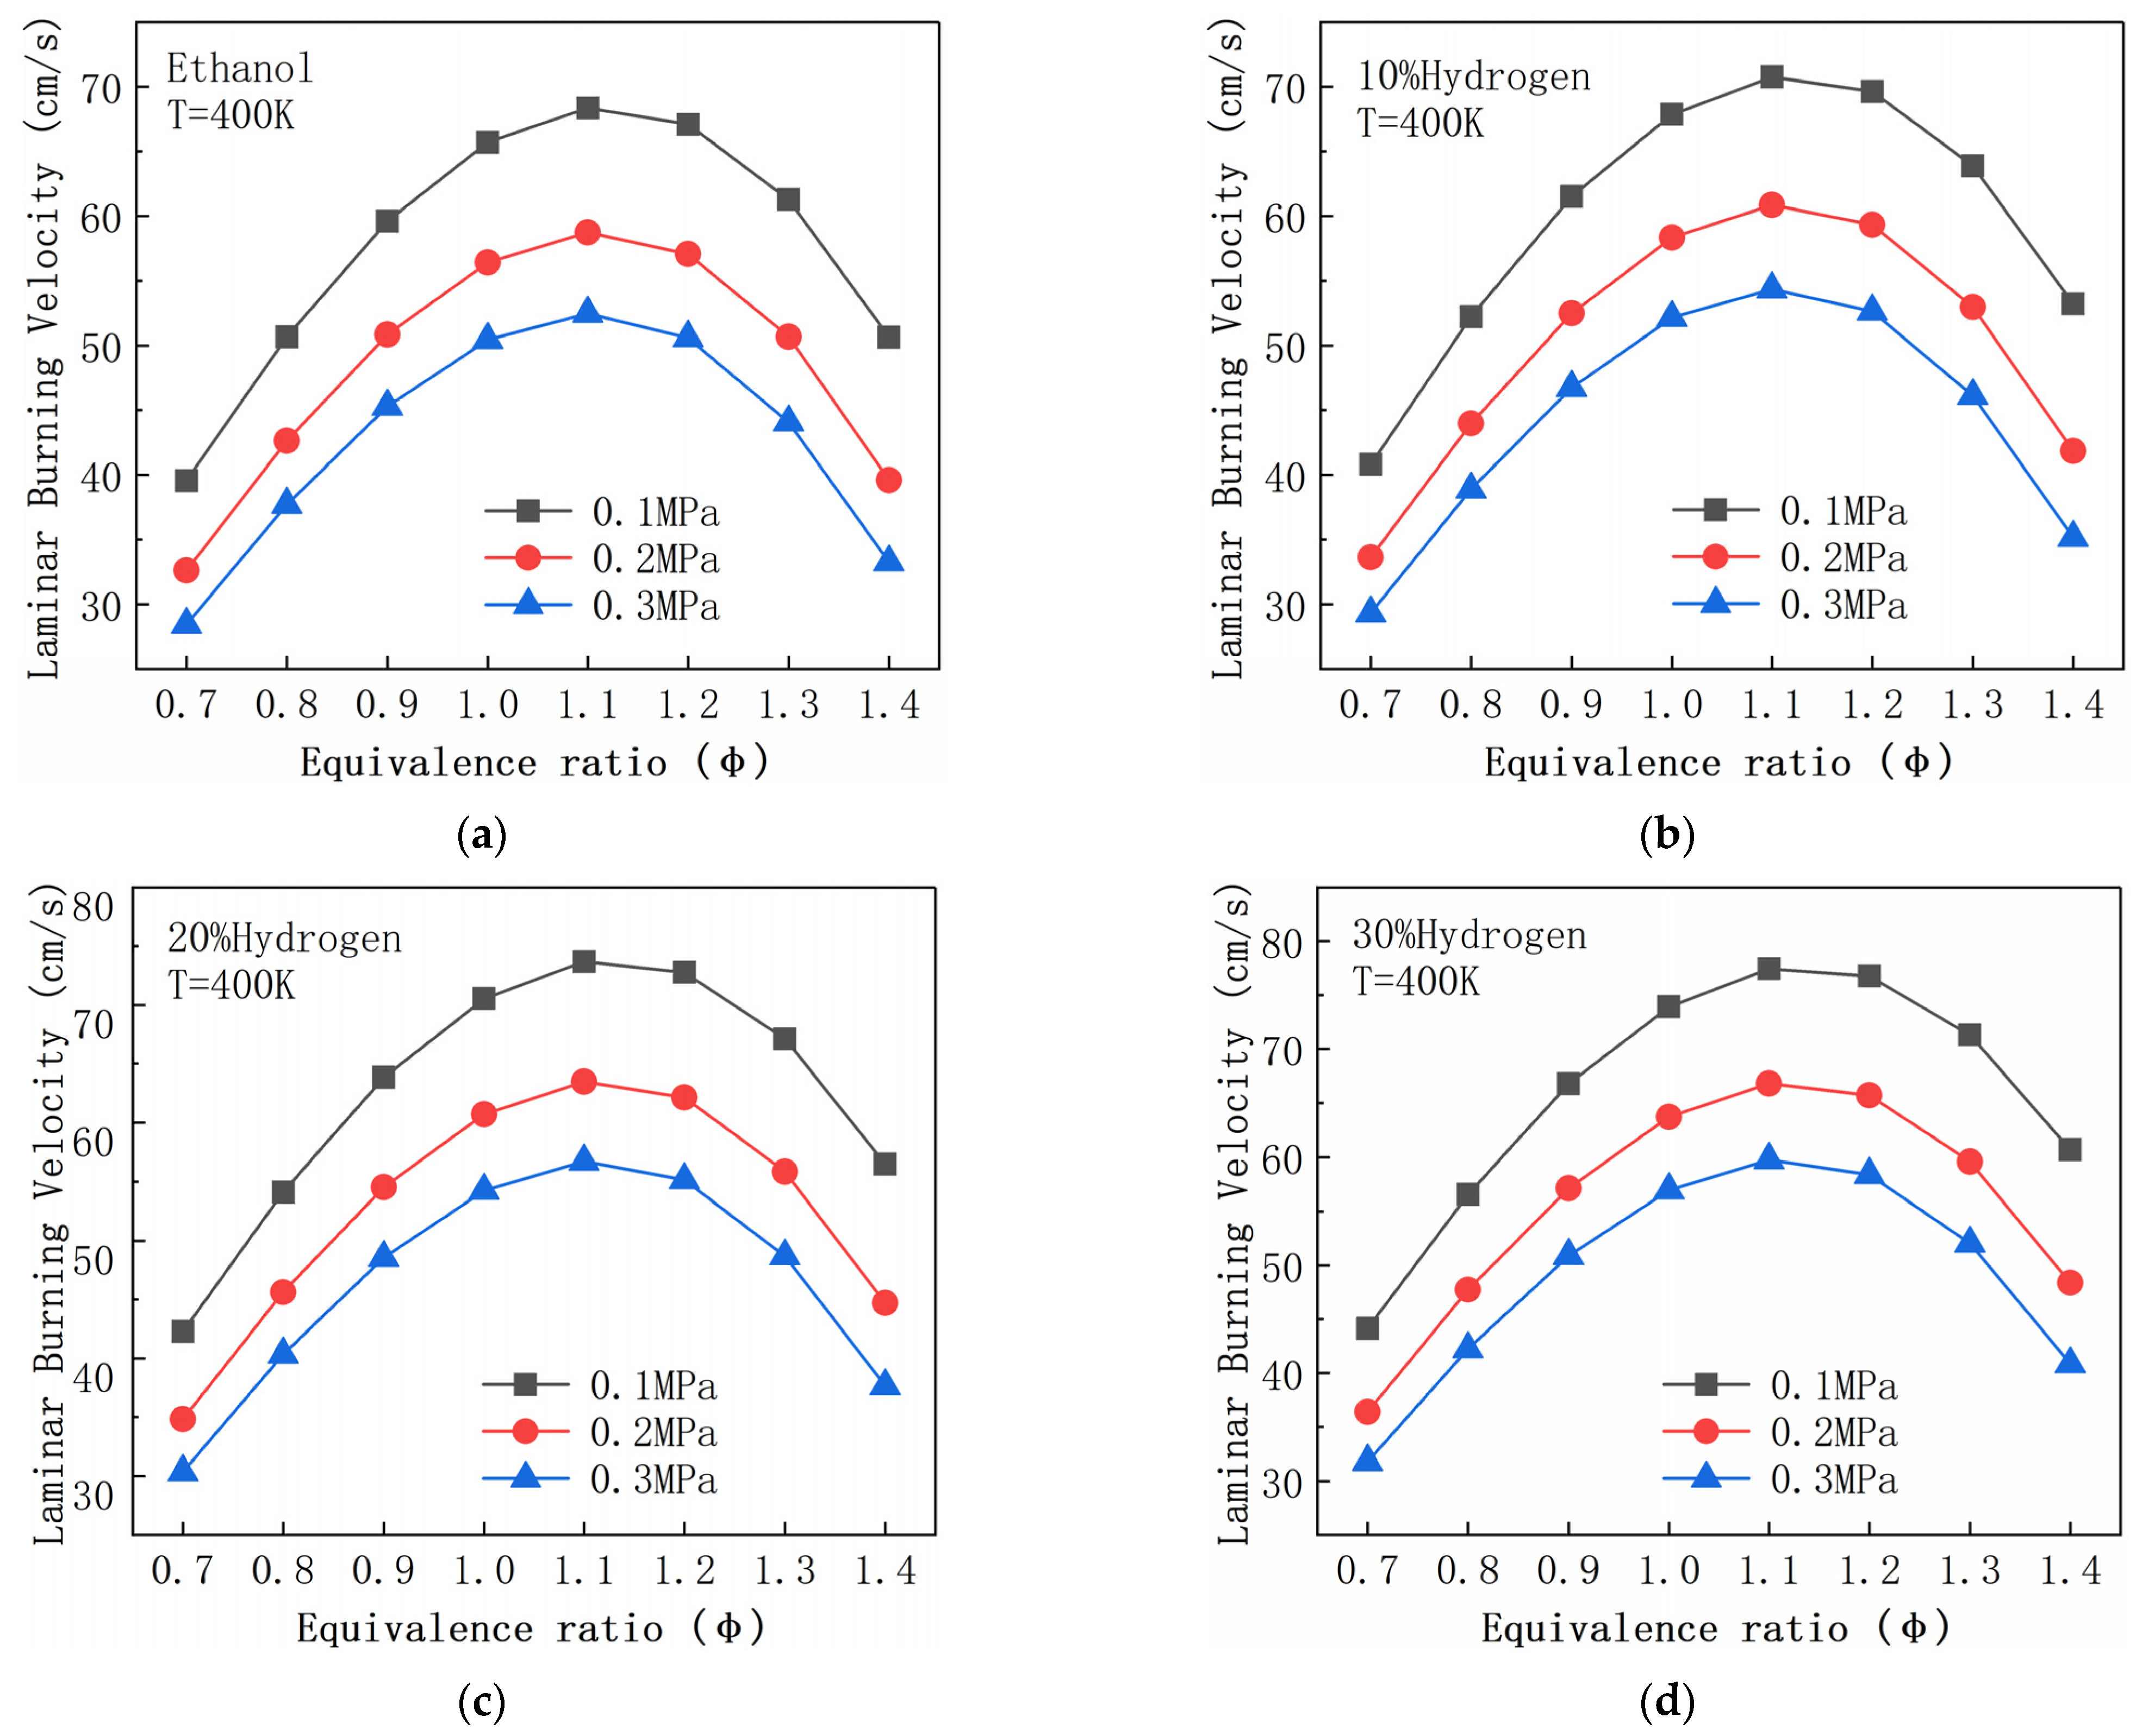
4.1. Laminar Burning Velocity

Figure 5 shows the simulated LBV of ethanol mixed with different ratios of hydrogen at an initial temperature of 400 K and an initial pressure of 0.1 MPa. The LBV first increased and then decreased, reaching the peak value at ER of 1.1. Figure 6 represents the LBV at different ERs as a function of hydrogen fraction. For the simulations, a small amount of hydrogen was mixed with ethanol, so only up to 30% of hydrogen is presented in the figure. Figure 5 and Figure 6 show that the LBV increased as the hydrogen fraction increased.
Figure 7 shows the LBV of fuels with distinct mixing ratios at different initial temperatures and an initial pressure of 0.1 MPa. The LBVs of all fuels with different mixing ratios increased with increasing initial temperature because the higher temperature improved the active radicals of reactants, enhanced the reaction of chain structure, and accelerated the chemical reaction rate.
Moreover, the LBVs of fuels with various mixing ratios at different initial pressures and the initial temperature of 400 K are shown in Figure 8. There is a correlation ( S u 0 P n 2 1 , n is the order of reaction) between LBV and pressure [31]. When the initial pressure increased, P n 2 1 decreased; therefore, LBV decreased. The above results show that hydrogen promoted the LBV of ethanol. LBV increased with the increase in initial temperature but decreased with the increase in initial pressure.
The LBV variation with the ER, initial temperature, and pressure has a similar trend to that observed in the LBV of methane–isooctane mixture [25]. Additionally, from literature data, it can be found that methanol, ethanol, methane, isooctane, etc., all have similar LBV variation trends [8,32,33,34].

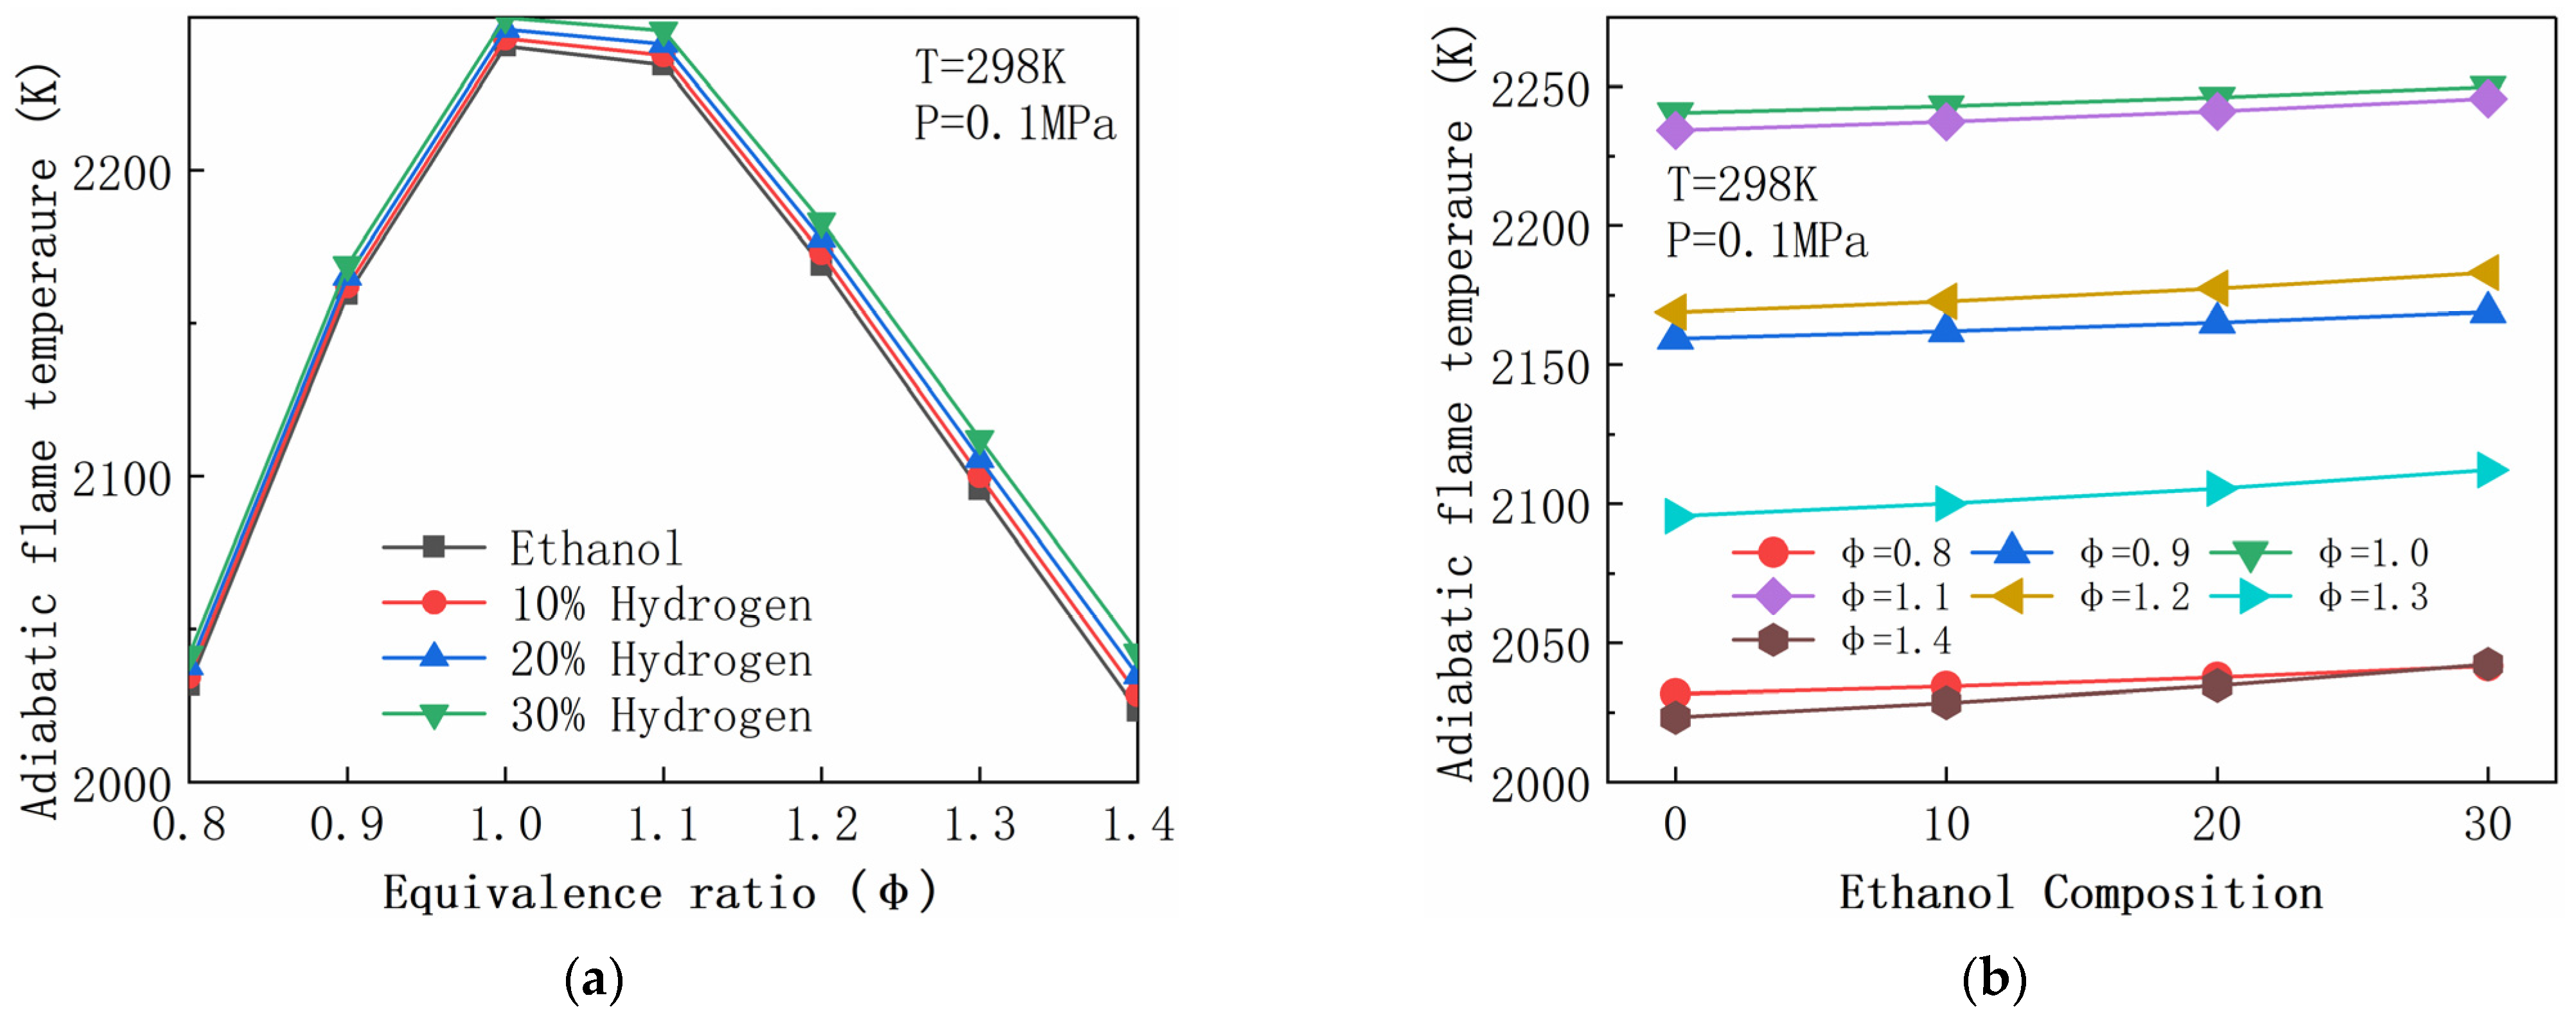
4.2. Adiabatic Flame Temperature

Adiabatic flame temperature (AFT) refers to the heat released by reactant combustion to raise the temperature of combustion products in an isobaric adiabatic combustion system. It is also the highest temperature that the combustion phenomenon can reach. However, there is heat loss, chemical kinetics, or mass transportation limits in real systems, so the flame temperature is often lower than the AFT [35]. AFT is an essential metric for characterizing the thermodynamic properties of a combustible mixture, which reflects the exothermic performance of the reaction mixture, and has an important influence on various combustion phenomena related to chemistry, such as flame propagation velocity, flame extinction, and ignition limit [36]. Figure 9 displays the AFT of ethanol–hydrogen–air flames at different ERs. The AFT of the fuel reached its peak when the ER was 1.0. Due to its higher calorific value, the AFT of H2 addition was greater than that of ethanol. When the ER was low, the difference in AFT was smaller (less than the unit ER). The increase in AFTs had a thermal effect on the LBV of the ethanol–air flames with hydrogen additions, which favor the increase in LBV.

4.3. Heat Release

The heat release rate (HRR) expresses the speed and magnitude of the heat released by the combustion. Figure 10 shows the peak net HRR and average HRR of ethanol–hydrogen–air flames with different ϕ. The addition of hydrogen can significantly increase the HRR of ethanol−hydrogen−air flames, and the reaction rate increases significantly with the increase in hydrogen concentration. Like LBV, the position of the peak HRR of ethanol–hydrogen–air flames with hydrogen composition from 0% to 30% was at the ER of 1.1.

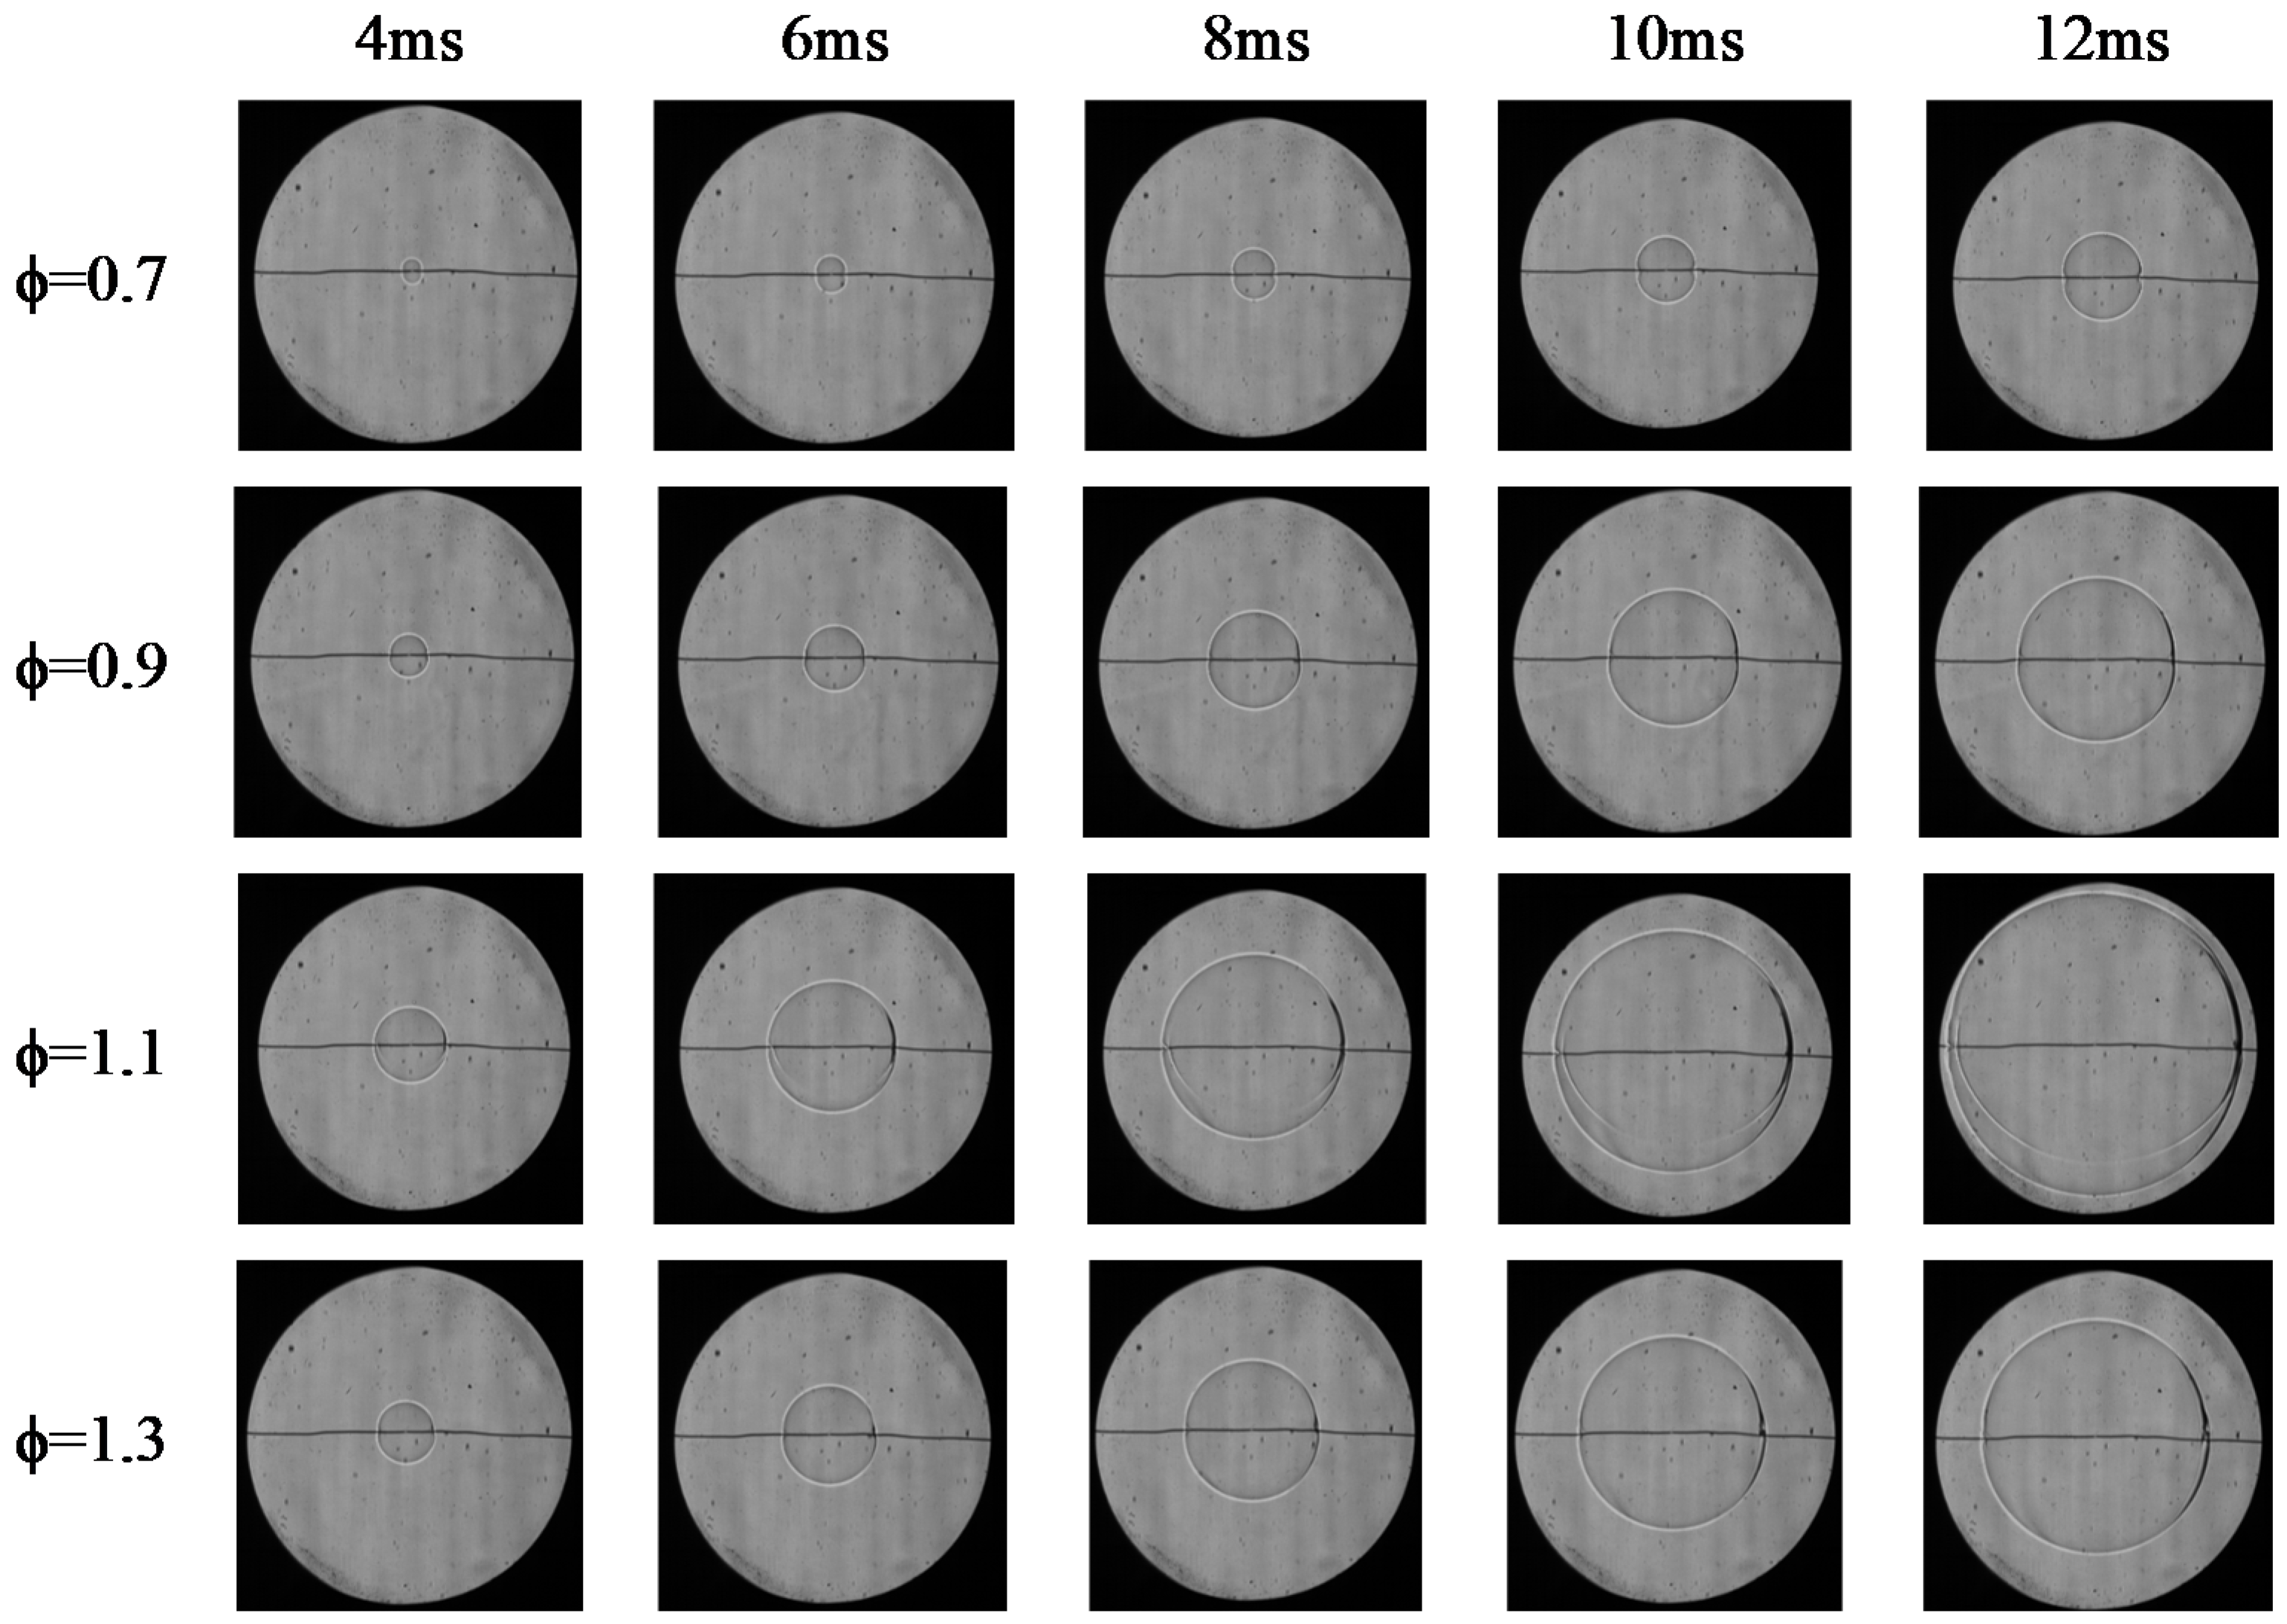
4.4. Flame Instability

One of the features of a laminar premixed flame is flame instability. Flame instability causes local wrinkles on the flame front, thus affecting the local HRR and combustion efficiency. Thermal expansion (σ) and laminar flame thickness (δ) are two main parameters associated with the intensity of hydrodynamic instability. It is generally agreed that higher σ and thinner δ correspond to greater hydrodynamic instability intensity [37]. σ and δ are defined as follows:
σ = ρ u ρ b
δ = T b T u ( d T d x ) m a x
where ρ u and ρ b are the unburned gas density and the burned gas density, respectively. Tb and Tu are the burned and unburned gas temperatures, respectively. The maximum temperature gradient is (dT/dx) max.
Figure 11 reveals that the laminar flame thickness (δ) of ethanol–hydrogen–air flames first decreased and then increased with the increase in ER. The thermal expansion ratios (σ) increased with the increase in ER. However, with the hydrogen addition, the decrease in hydrodynamic instability intensities of ethanol–hydrogen–air flames was not obvious after ϕ = 1.1. The values of σ and δ decreased with the hydrogen increase, so it is impossible to determine whether hydrogen increases the hydrodynamic instability intensities of ethanol–hydrogen–air flames. Adding hydrogen properly to ethanol fuel does not reduce its stability.

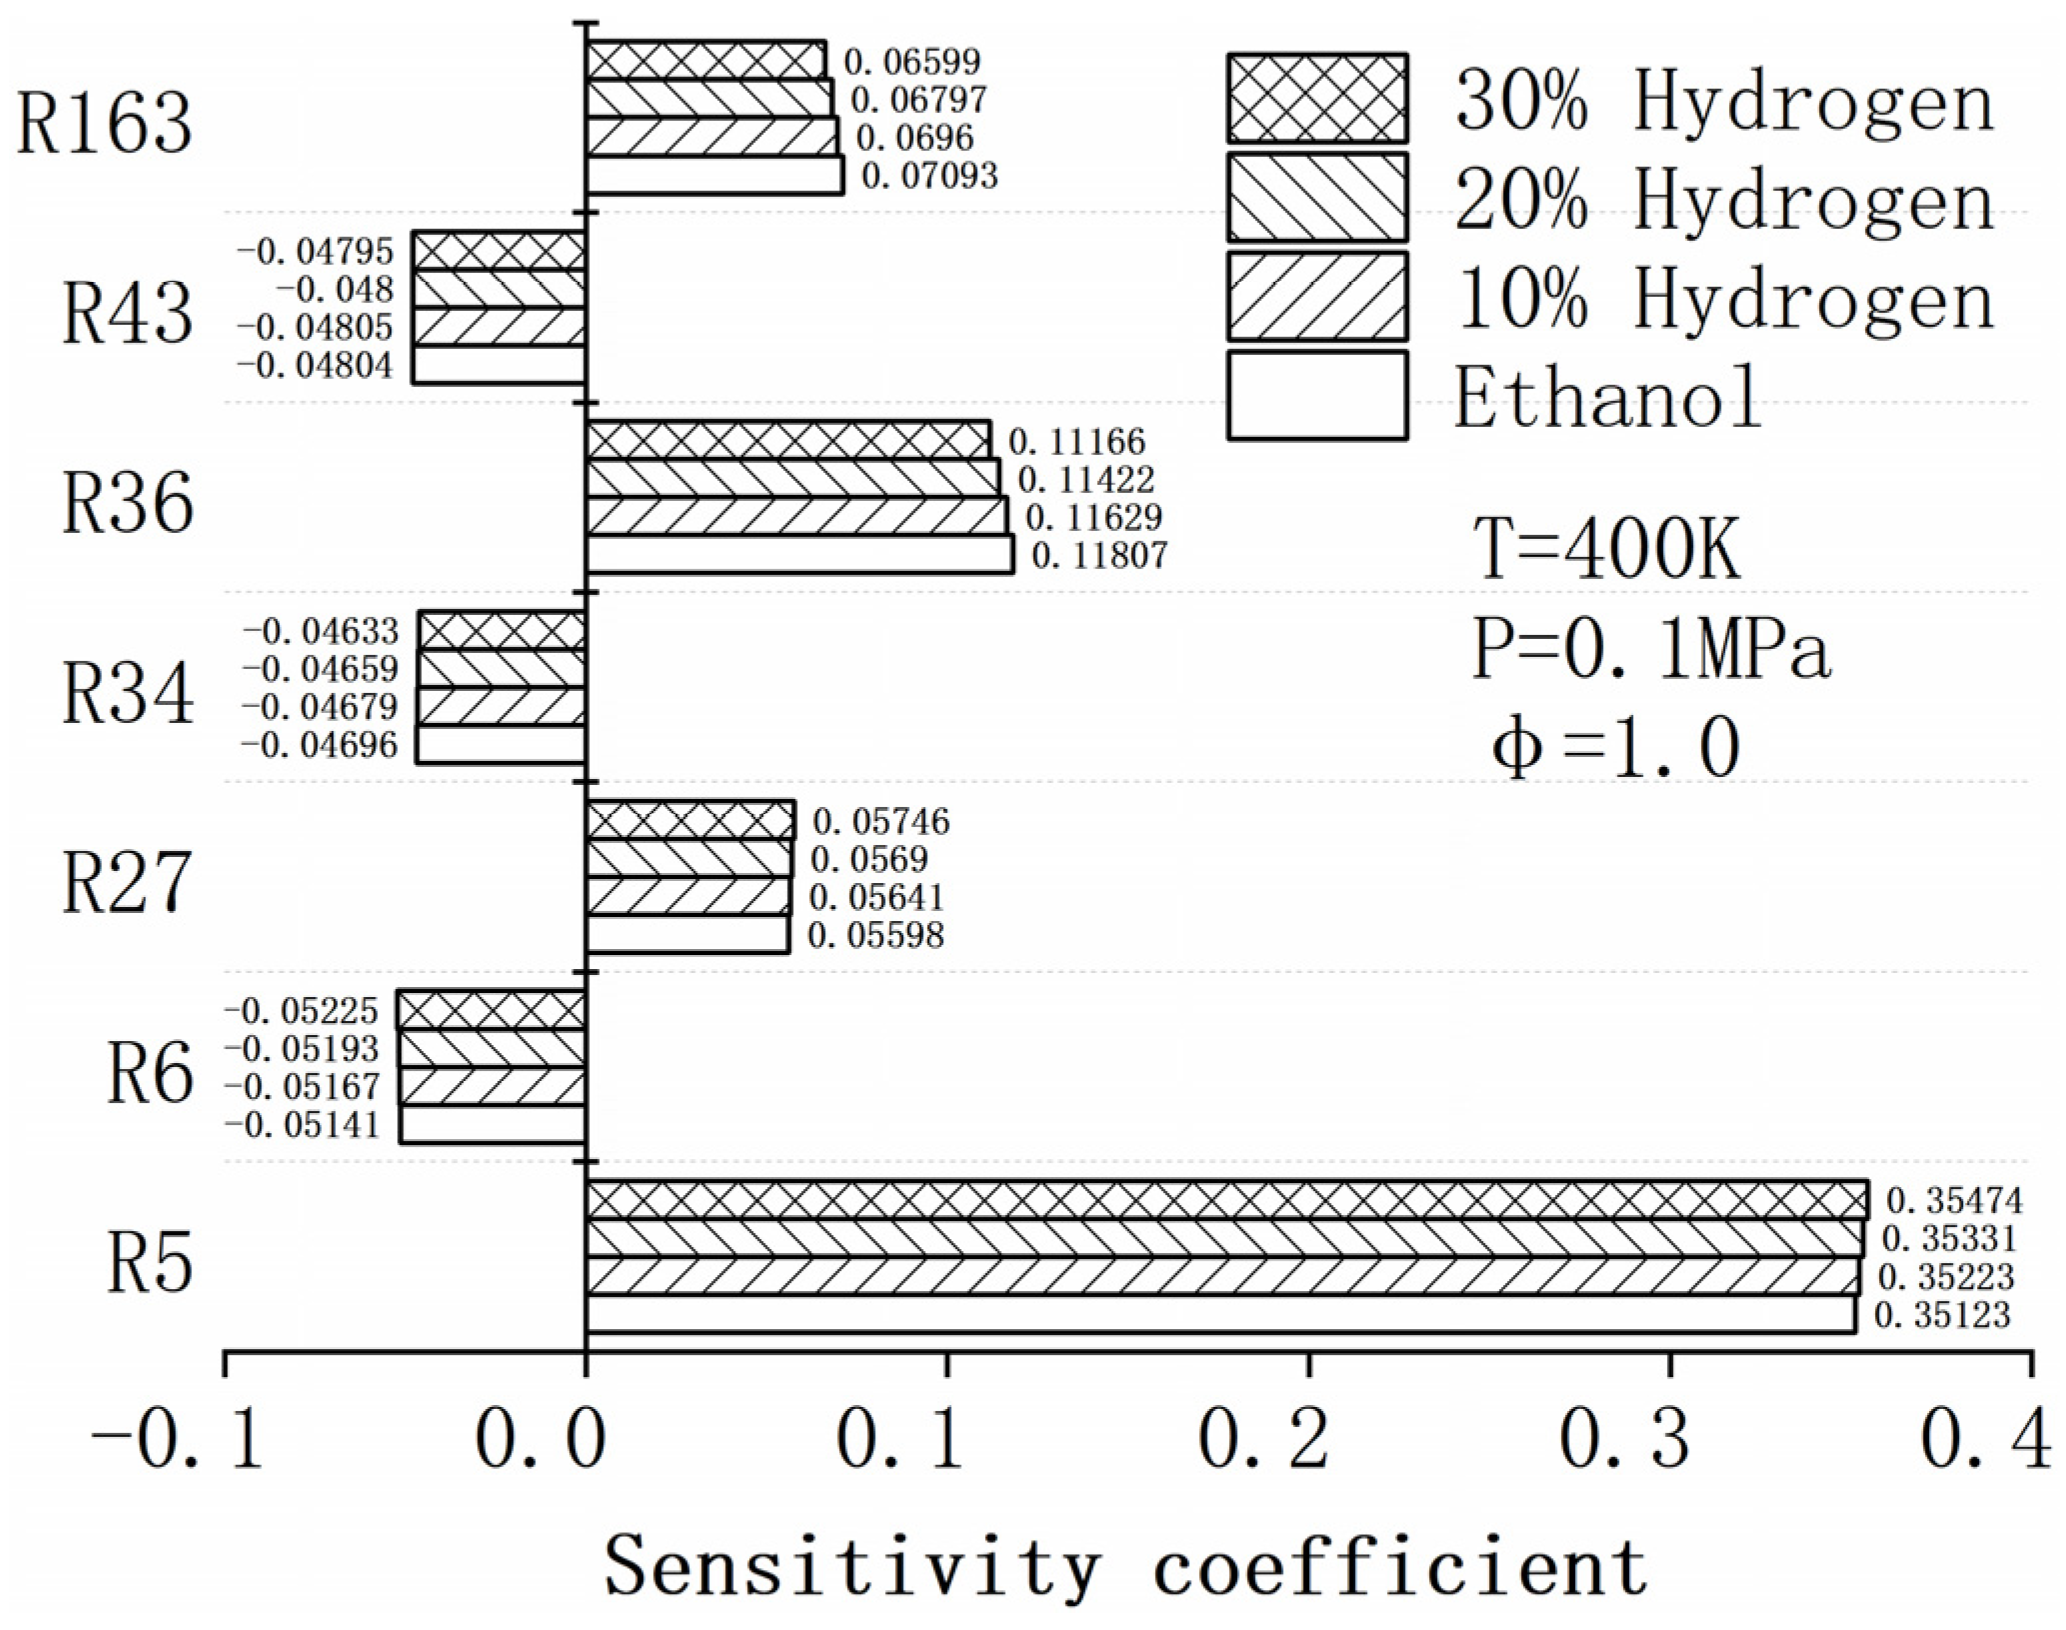
4.5. Sensitivity Analysis

Sensitivity analysis was used to find the key reaction and analyze its effect on the reactivity of the premixed flame [38]. The reaction with a positive coefficient indicates enhanced reactivity. Figure 12 shows the 10 reactions with the greatest influence on the LBVs of different fuel mixing ratios. R5 (O2 + H = O + OH), R27 (HO2 + H = 2OH), R36 (CO + OH = CO2 + H), and R163 (HCO + M = H + CO + M) showed the highest influences on LBV, and R36 was the main reaction with CO2 as product. R6 (H + OH + M = H2O + M), R34 (H + O2 + M = HO2 + M), and R43 (CH3 + H + M = CH4 + M) inhibited LBV. With the increase in hydrogen composition, O, OH, and H radicals rapidly increased, and the positive influences of R5 and R27 increased but those of R36 and R163 decreased. Meanwhile, the influence of the most inhibiting reaction R6 was also observed to increase with an increase in hydrogen addition. Temperature also had a direct chemical influence on these sensitive reactions. As shown in Figure 13, increasing temperature accelerated positive reactions and inhibited negative reactions. Therefore, LBV increased with an increased hydrogen fraction and temperature.

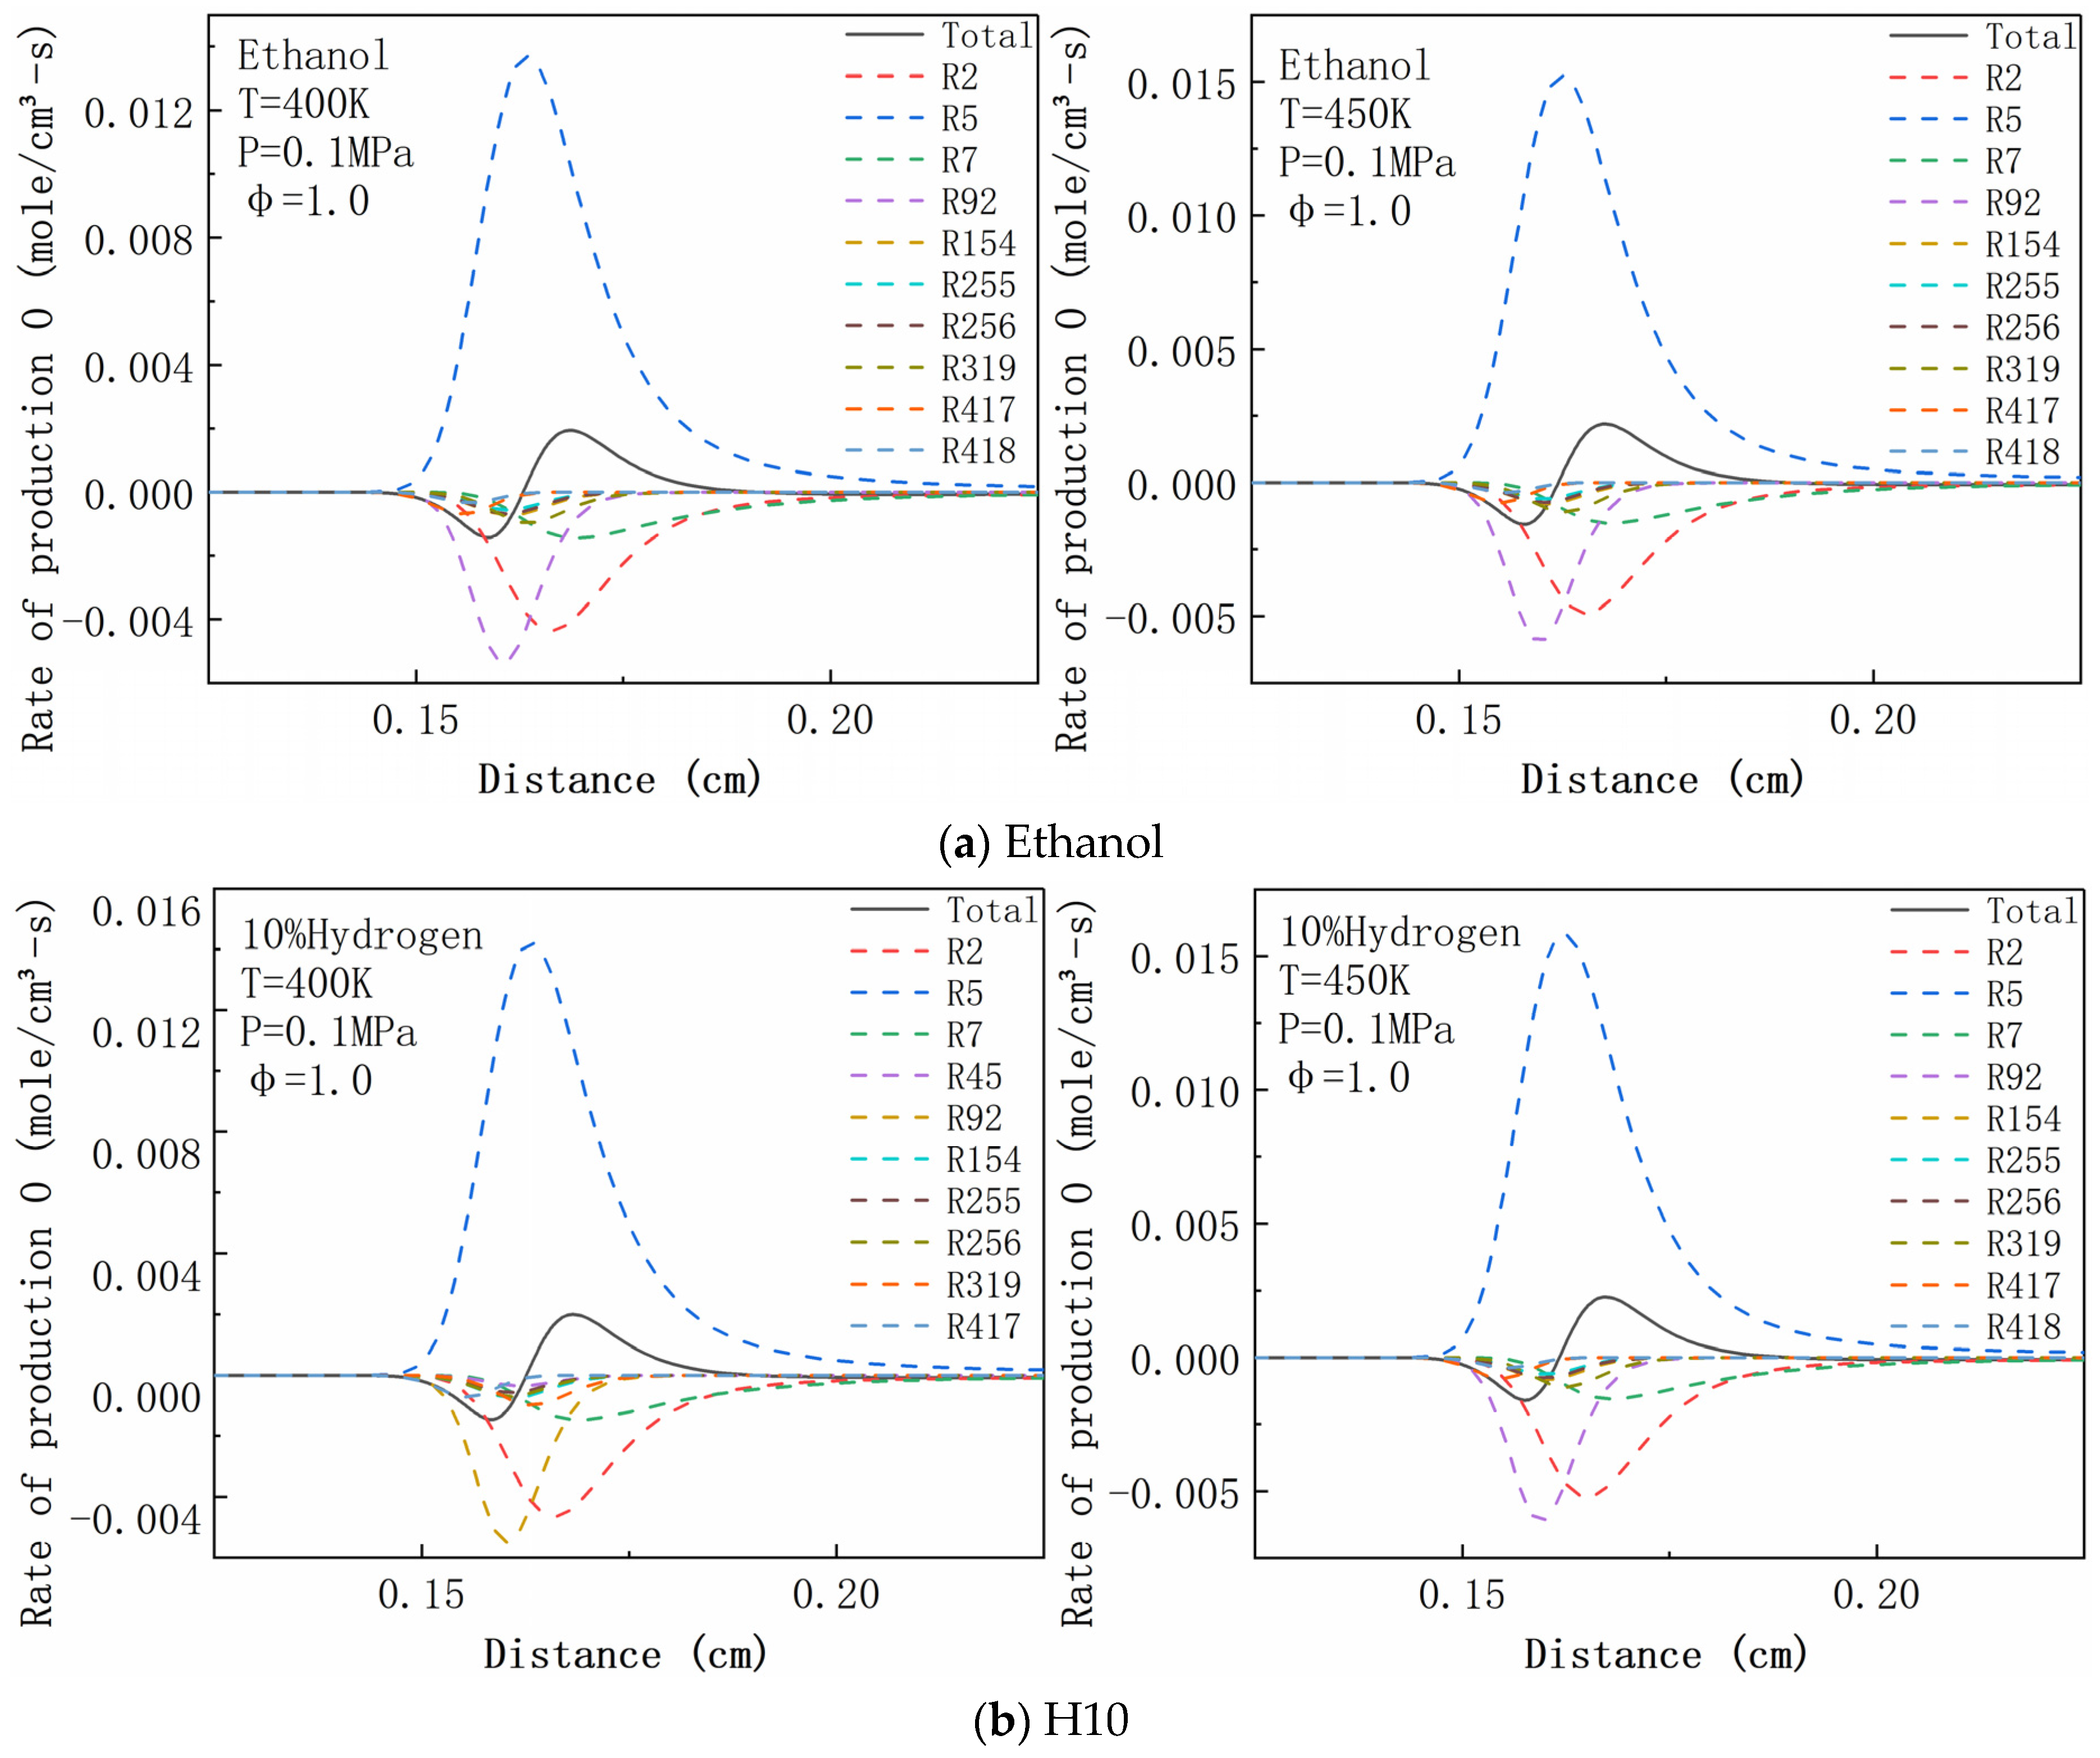
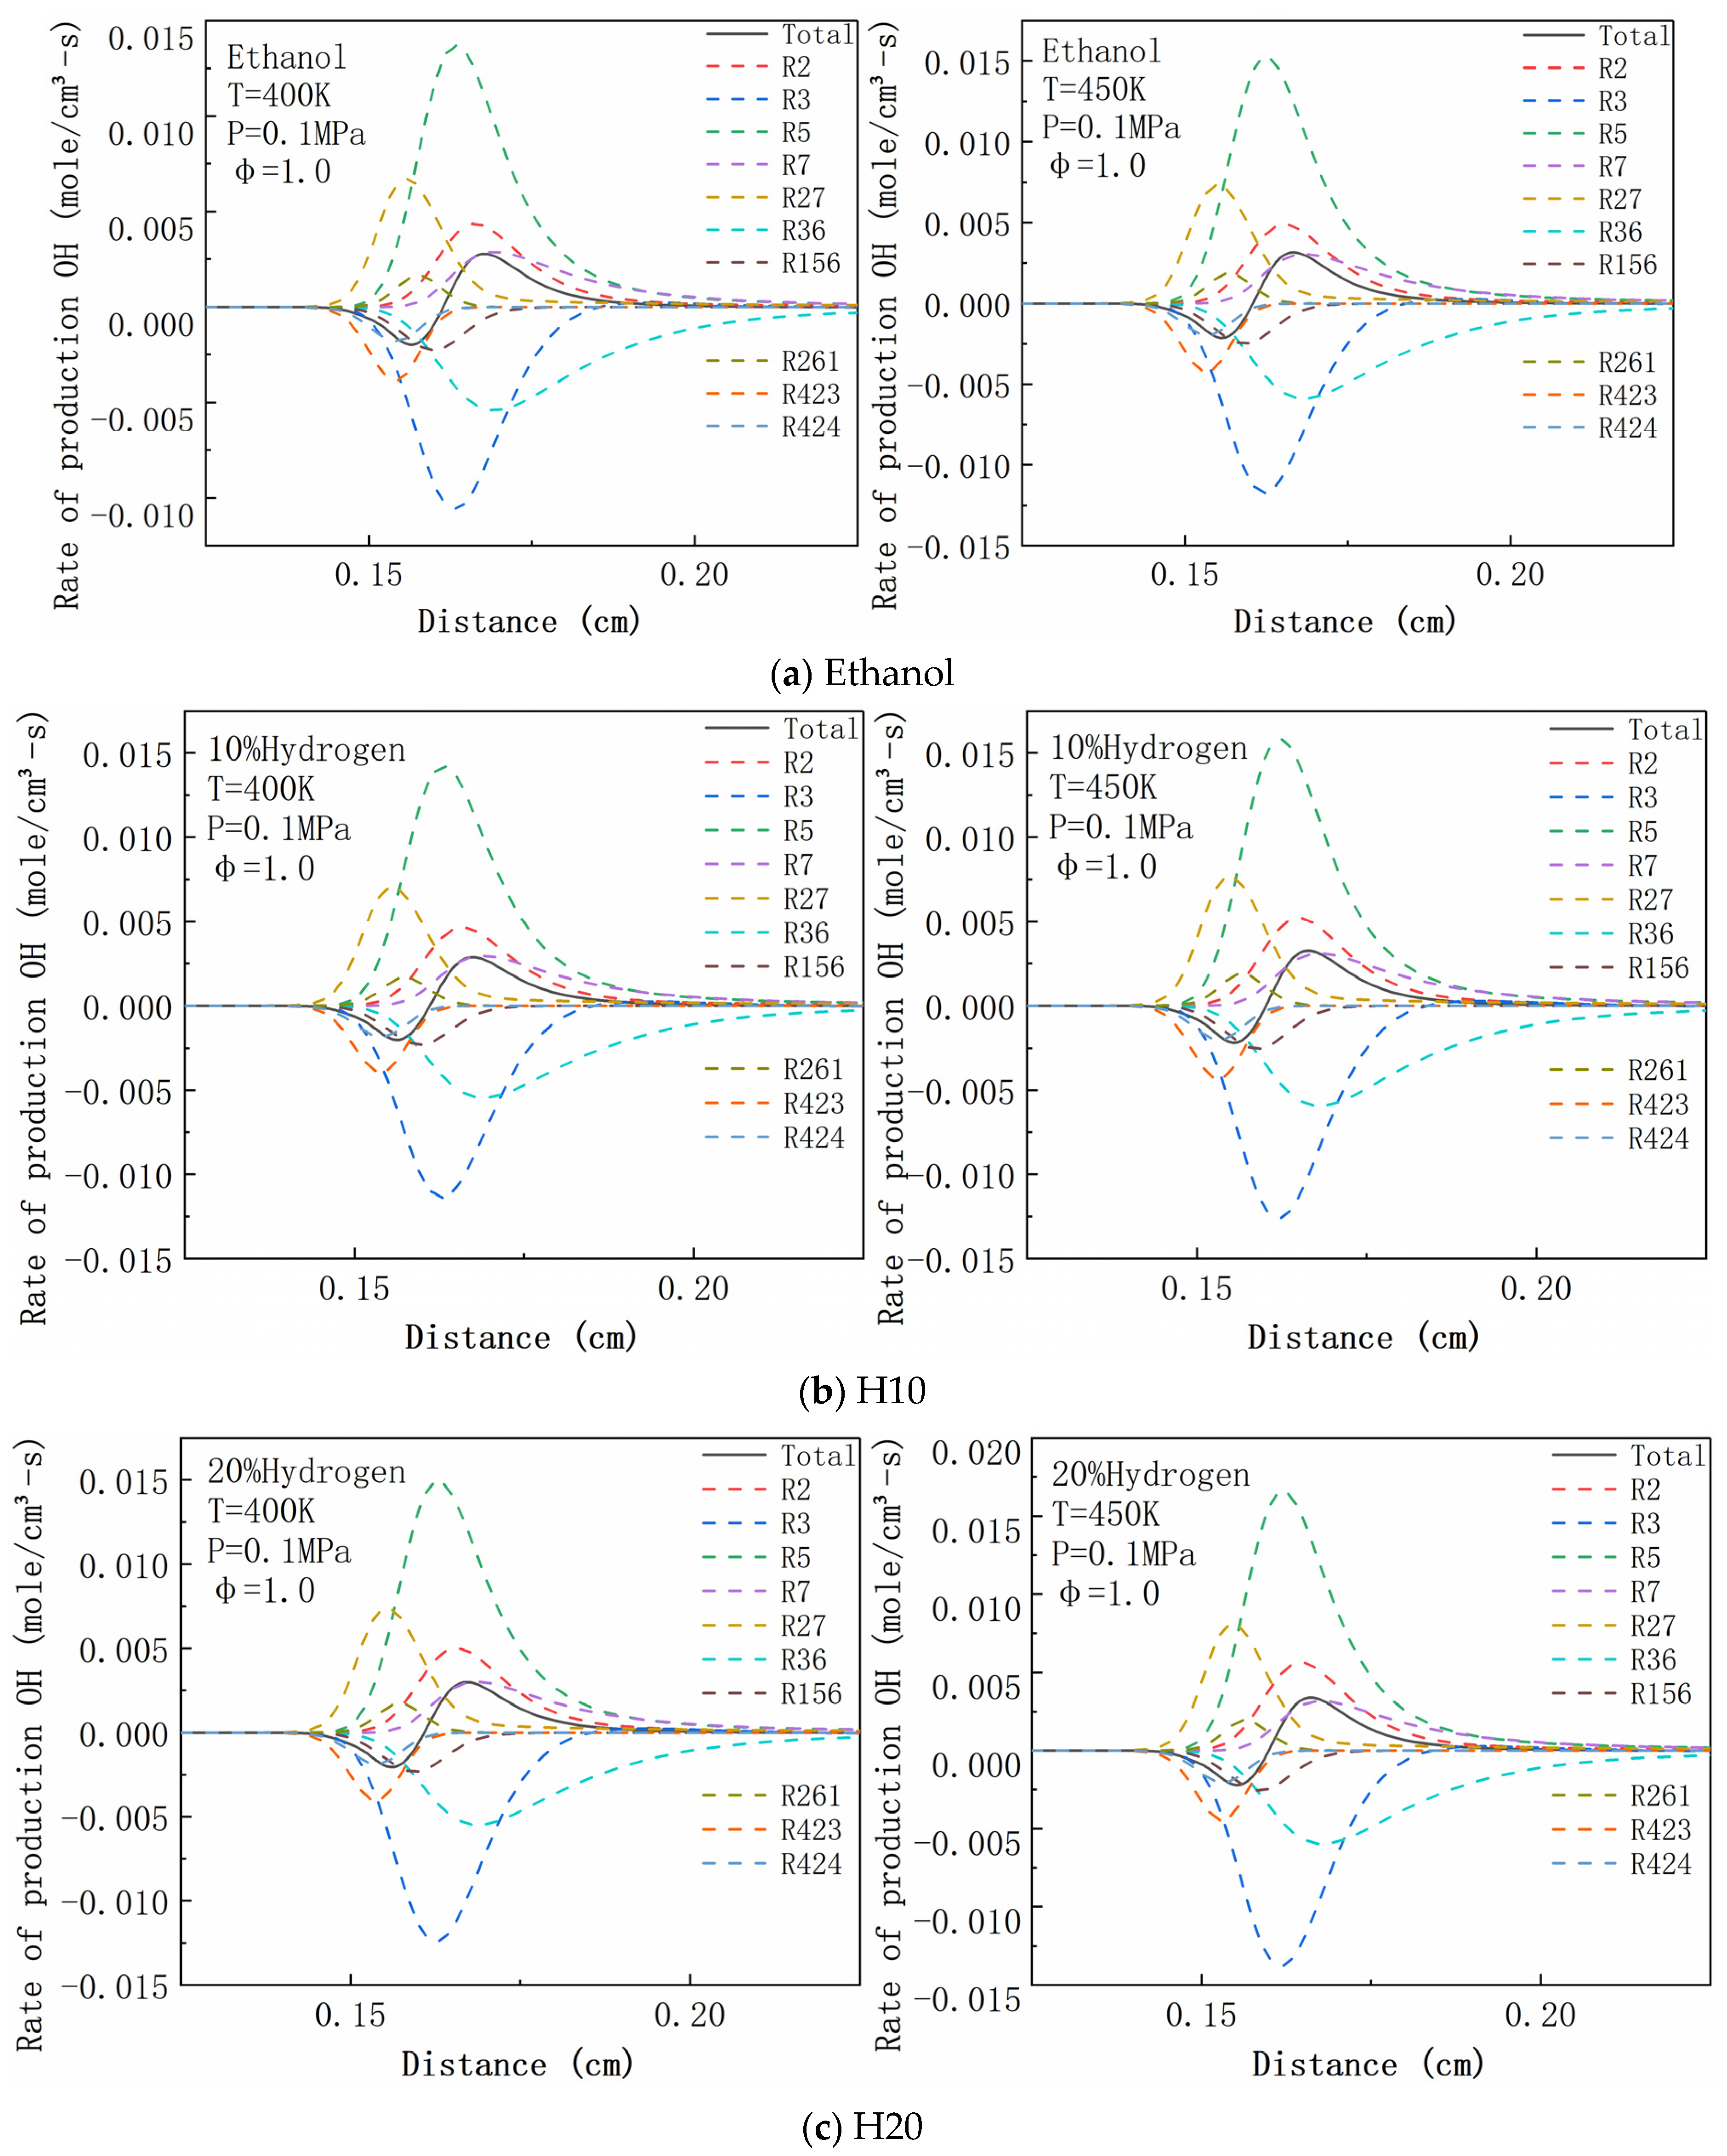
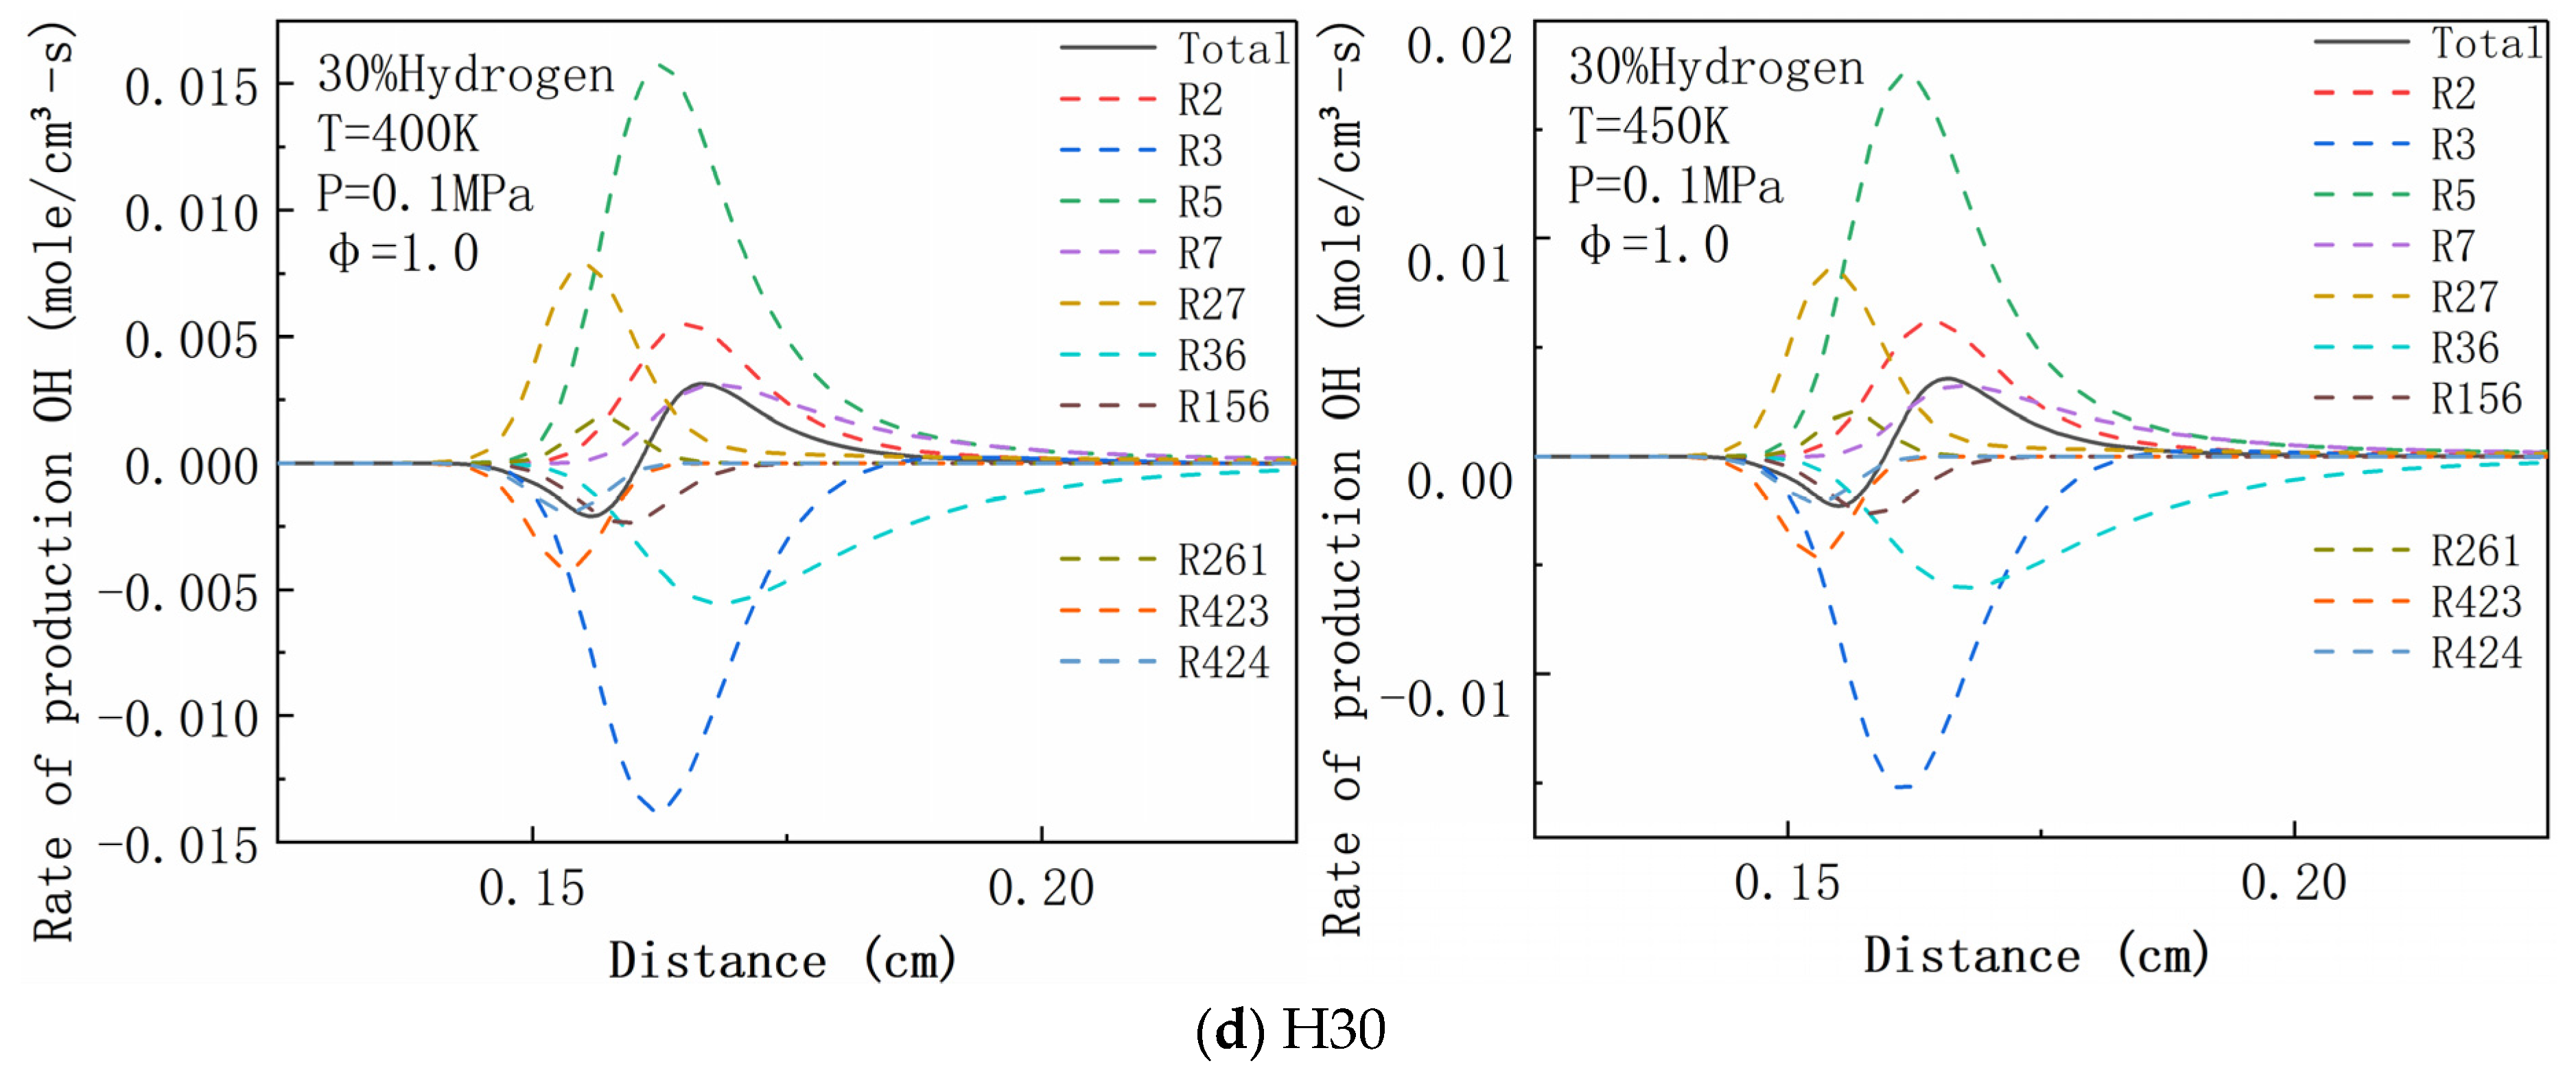
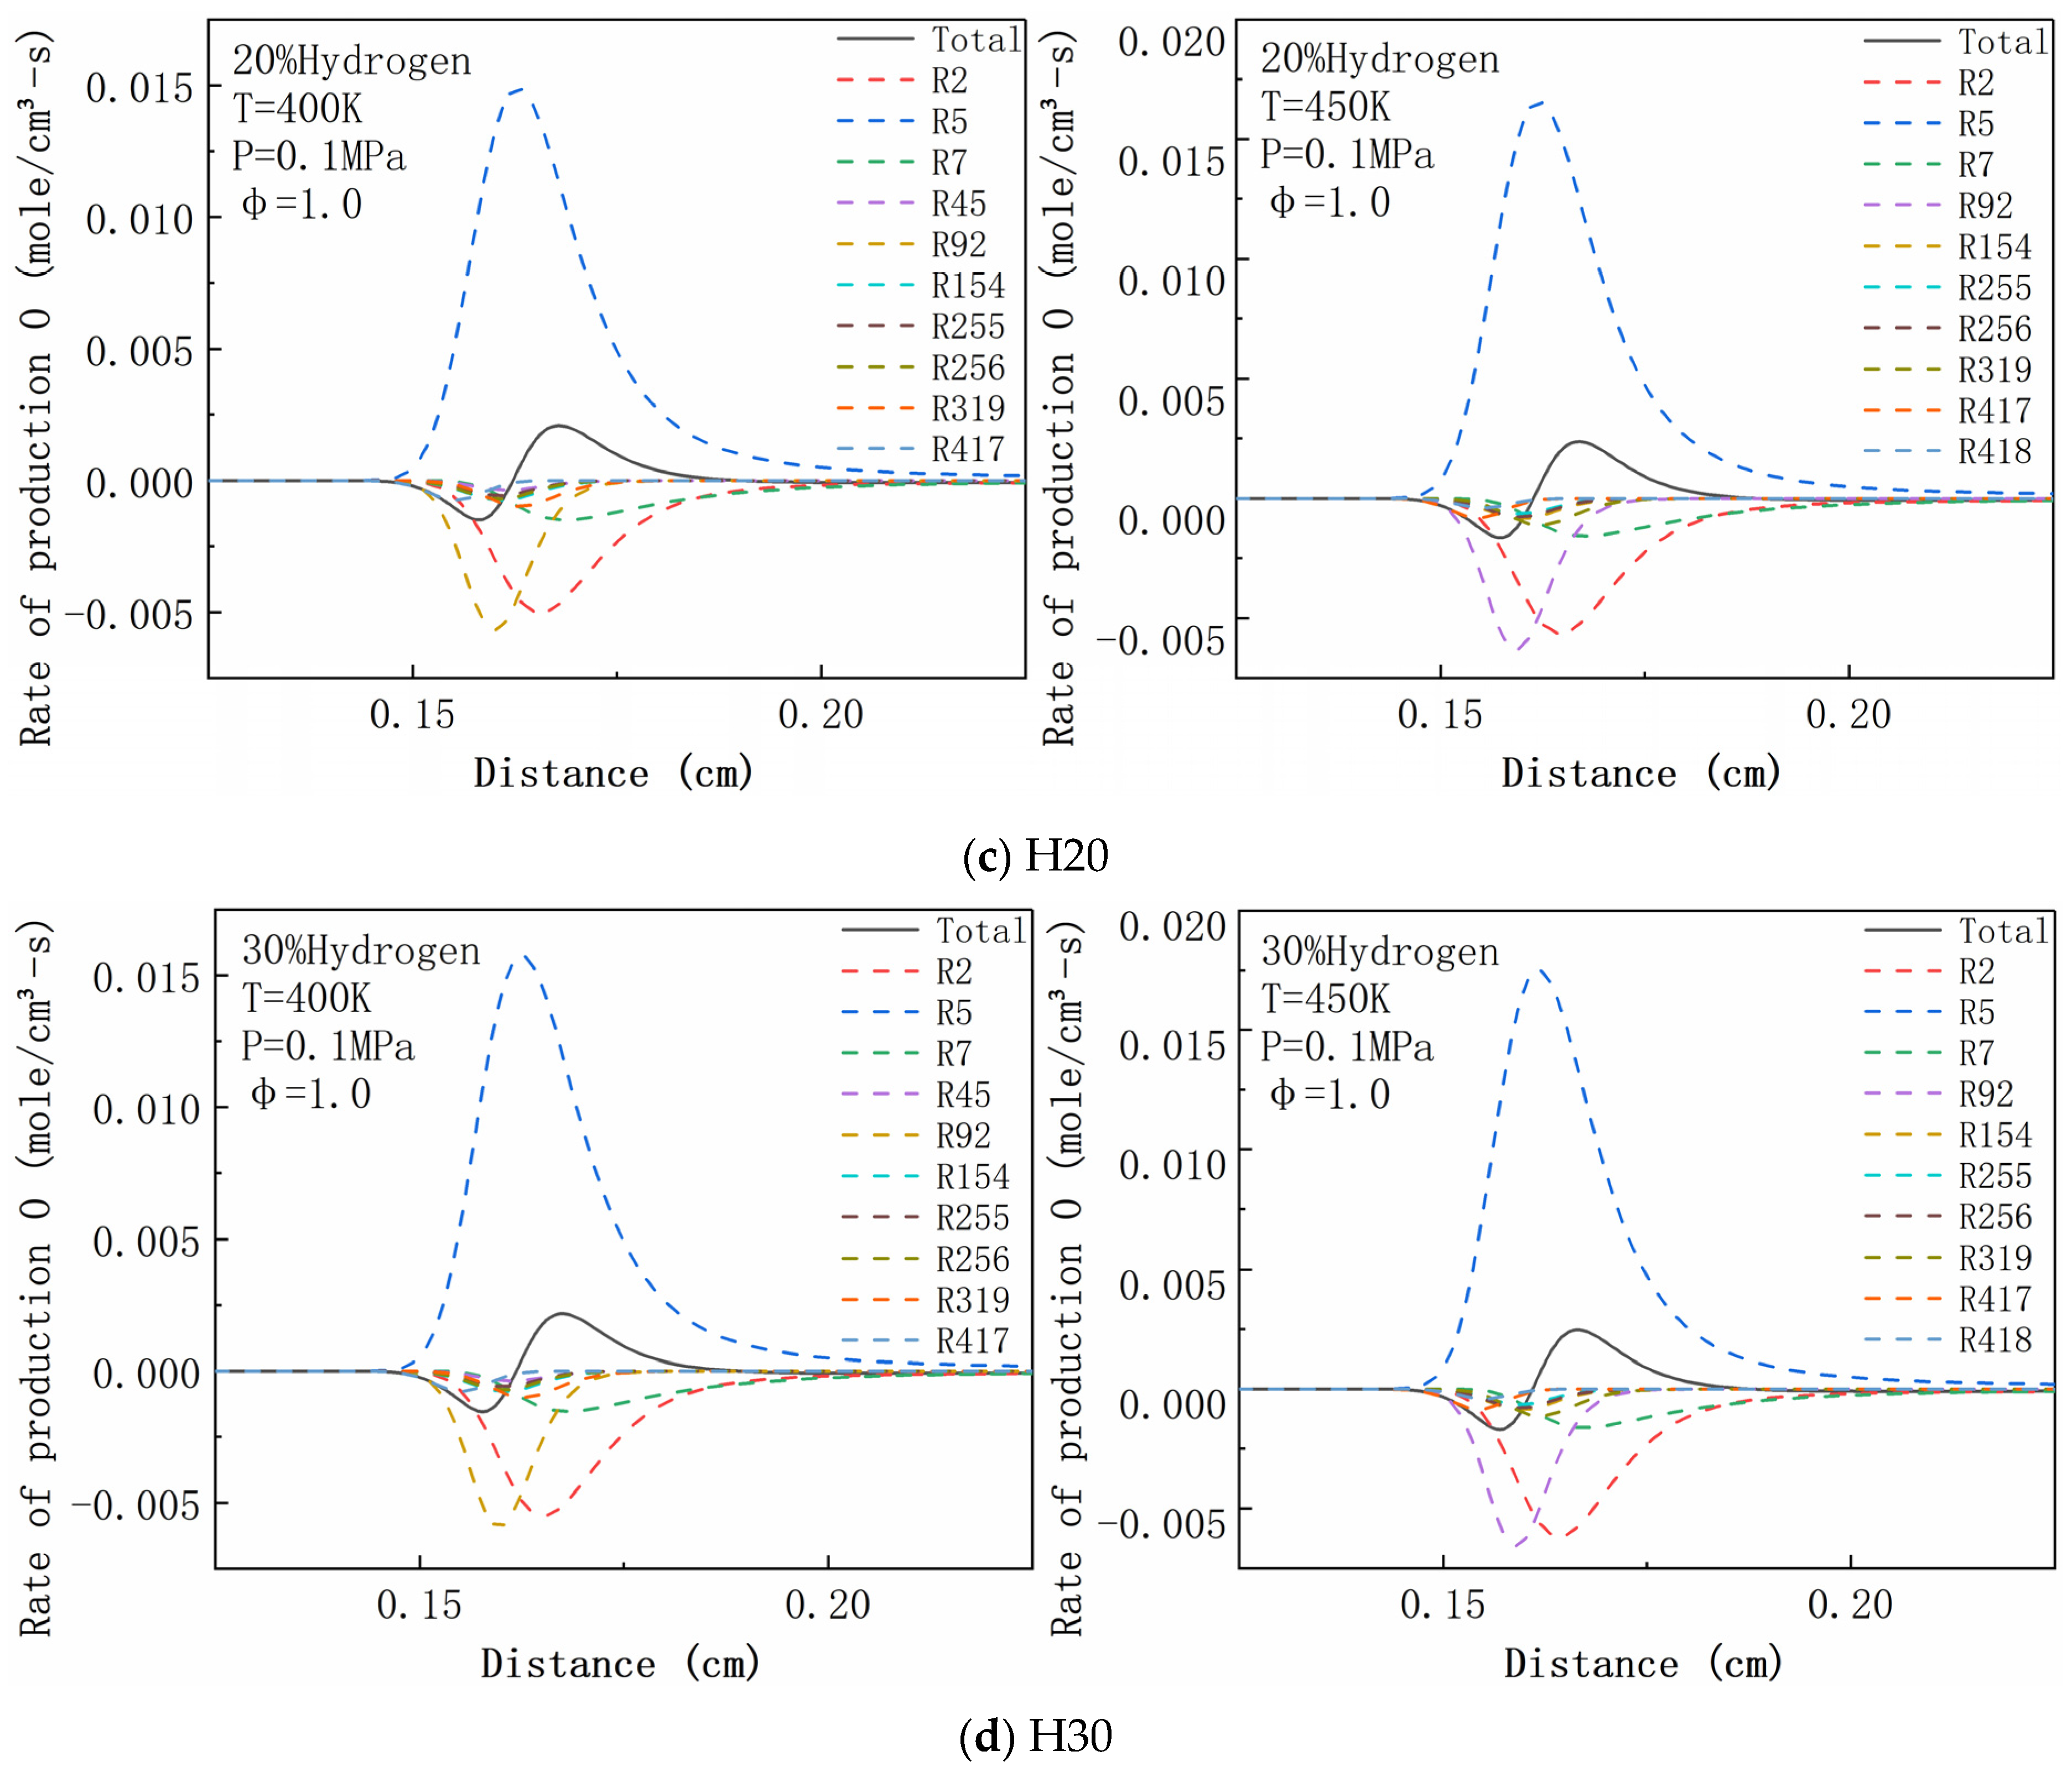
4.6. Rate of Production Analysis

The formation or consumption of a target substance in a chemical reaction can be determined by an analysis of the production rate. The rate of production is proportional to the formation of the target substance. Important elementary reactions that influence the production or consumption of a particular component can be quickly identified by the magnitude of the production rate. Table 1 summarizes the reaction conditions.
Figure 14 compares the O radical production rates of the first 10 sensitive basic reactions, respectively, under the initial conditions of ϕ = 1.0, P = 1 bar, T = 400 K, and 450 K. The reaction O2 + H <=> O + OH (R5) is the main contributor. O radical was mainly consumed by the reaction H2 + O <=> H + OH (R2), and the reaction CH3 + O <=> CH2O + H (R92). With the addition of hydrogen, the main consumption reaction, CH3 + O <=> CH2O + H (R92), increased gradually.
Figure 14 depicts the rise of the entire curve’s peak value. With the increase in hydrogen content, the reaction O2 + H <=> O + OH (R5) contributed more to the generation of O radicals; the higher the hydrogen content, the higher the peak value. At T = 400 K, the reaction rate of O radical: O2 + H <=> O + OH (R5) increased from 0.0137 to 0.01427, then to 0.0149, and finally to 0.0157 mole/(cm3·s), with LBVs of 65.6890, 67.8529, 70.5194 and 73.9136 (cm/s), respectively.
These results show that LBV had a larger value in this case, due to the higher production rate of O radical in the R5 reaction. The peak values of ethanol, H10, H20, and H30 at 450 K were 0.0152, 0.0158, 0.0166, and 0.0175 moles/(cm3·s), respectively, which are higher than those at 400 K. It can be said that temperature is more sensitive to R5 than fuel composition.
Figure 15 depicts an analysis of OH production rates. Like O radical, the reaction of O2 + H <=> O + OH (R5) contributed most to the generation of OH radical. The difference is that the reaction of H + HO2 <=> 2OH (R27) produced many OH radicals. The peak value of the reaction curve increased when hydrogen was introduced. In contrast to the consumption of O radicals, the consumption of OH was more prevalent in the reactions, as depicted in the figure. The primary OH consumption reactions were H2 + OH <=> H + H2O (R3) and CO + OH <=> CO2 + H (R36); R3 increased with the increase in temperature and hydrogen components. From ethanol to H10, H20, and then to H30, the key reaction R36 of OH radical consumption was unchanged. The OH consumption was much faster than O consumption. The main reaction influencing LBV was O2 + H <=> O + OH (R5), and R5 had the greatest contribution to the generation rate of O and OH radicals.
When the production rates of O and OH were compared at 400 K and 450 K, it was found that the temperature had a greater effect on the reaction rate, compared with the hydrogen component. In addition, due to the small change in temperature in this paper, the top 10 most effective reactions for ethanol–air flames did not change. For ethanol–hydrogen–air flames, R418 (C2H5OH + O <=> CH2CH2OH + OH) replaced R45 (CH4 + O <=> CH3 + OH) at elevated temperatures.

5. Conclusions

In this paper, the effect of hydrogen addition on the LBV of ethanol was studied by experiment and simulation. The LBV under various conditions was simulated in the models by CHEMKIN software. The experimental results agree well with the numerical simulations. The AFT, heat release, flame instability, and sensitivity analysis were also studied. The following primary conclusions are drawn:
(1) Adding hydrogen to ethanol increased the LBV. LBV increased with an increase in temperature and decreased with an increase in pressure. Meanwhile, the AFT reached its peak at the ER of 1.0. Hydrogen addition fuel had a greater AFT than ethanol. The hydrogen addition can significantly increase the HRR of ethanol–hydrogen–air flames, and the reaction rate increased significantly with the increase in hydrogen content.
(2) The values of σ and δ both decreased with the increase in hydrogen, so it is impossible to determine whether hydrogen increases the hydrodynamic instability intensities of ethanol–hydrogen–air flames. It is assumed that the proper addition of hydrogen to the mixed fuel does not decrease the stability of the fuel.
(3) Through sensitivity analysis, it was found that O2 + H <=> O + OH (R5) had the greatest effect on LBV. Additionally, the sensitivity coefficient of R5 had the same trend as LBV when temperature and hydrogen composition changed.
(4) The production rates of O and OH radicals were analyzed, and the temperature had more influence than the hydrogen proportion. O2 + H <=> O + OH (R5) reaction was the key reaction affecting LBV. R5 greatly contributed to the formation rate of O and OH radicals.
This research indicates that H2 can significantly improve the combustion performance of ethanol–air mixture, including LBV, AFT, net HRR, and flame stability. The research results enrich the basic data of hydrogen–ethanol–air flame in the process of laminar premixed combustion and provide a basis for the design of hydrogen-mixed ethanol engines. In terms of future perspectives, this paper investigated the reaction kinetics of the premixed laminar burning characteristics of a small amount of hydrogen mixed with ethanol fuel; thus, further studies can be conducted in the case of ethanol with high hydrogen composition. In order to better provide basic data for the design and manufacture of hydrogen-mixed ethanol engines, further experiments and numerical studies should be conducted under high temperatures and high pressures, at which the HC, CO, and NOx emissions can be analyzed.

Author Contributions

Conceptualization, J.Z. and Z.Y.; methodology, J.Z. and C.X.; software, C.L.; validation, J.Z., C.X. and Z.Y.; formal analysis, J.Z.; investigation, J.Z.; resources, J.Z.; data curation, J.Z. and C.L.; writing—original draft preparation, J.Z., C.L. and C.X.; writing—review and editing, J.Z. and C.X.; visualization, J.Z.; supervision, Z.Y.; project administration, J.Z.; funding acquisition, J.Z. All authors have read and agreed to the published version of the manuscript.

Funding

This research was funded by the National Natural Science Foundation of China grant number [51506154] And the Natural Science Foundation of Zhejiang Province, China grant number [LY20E060008].

Institutional Review Board Statement

Not applicable.

Informed Consent Statement

Not applicable.

Data Availability Statement

The data that support the findings of this study are available from the corresponding author upon reasonable request.

Conflicts of Interest

The authors declare that they have no known competing financial interests or personal relationships that could have appeared to influence the research reported in this paper.

References

  1. Kyriakides, A.; Dimas, V.; Lymperopoulou, E.; Karonis, D.; Lois, E. Evaluation of gasoline–ethanol–water ternary mixtures used as a fuel for an Otto engine. Fuel 2013, 108, 208–215. [Google Scholar] [CrossRef]
  2. Park, C.; Choi, Y.; Kim, C.; Oh, S.; Lim, G.; Moriyoshi, Y. Performance and exhaust emission characteristics of a spark ignition engine using ethanol and ethanol-reformed gas. Fuel 2010, 89, 2118–2125. [Google Scholar] [CrossRef]
  3. Sales, L.C.M.; Sodré, J.R. Cold start characteristics of an ethanol-fuelled engine with heated intake air and fuel. Appl. Therm. Eng. 2012, 40, 198–201. [Google Scholar] [CrossRef]
  4. Lowesmith, B.; Mumby, C.; Hankinson, G.; Puttock, J. Vented confined explosions involving methane/hydrogen mixtures. Int. J. Hydrogen Energy 2011, 36, 2337–2343. [Google Scholar] [CrossRef] [Green Version]
  5. Tang, C.; Huang, Z.; Jin, C.; He, J.; Wang, J.; Wang, X.; Miao, H. Explosion characteristics of hydrogen–nitrogen–air mixtures at elevated pressures and temperatures. Int. J. Hydrogen Energy 2009, 34, 554–561. [Google Scholar] [CrossRef]
  6. Liu, Y.; Zhang, Y.; Zhao, D.; Yin, J.; Liu, L.; Shu, C.-M. Experimental study on explosion characteristics of hydrogen–propane mixtures. Int. J. Hydrogen Energy 2019, 44, 22712–22718. [Google Scholar] [CrossRef]
  7. Di Sarli, V.; Di Benedetto, A. Laminar burning velocity of hydrogen–methane/air premixed flames. Int. J. Hydrogen Energy 2007, 32, 637–646. [Google Scholar] [CrossRef]
  8. Di Sarli, V.; Di Benedetto, A.; Long, E.; Hargrave, G. Time-Resolved Particle Image Velocimetry of dynamic interactions between hydrogen-enriched methane/air premixed flames and toroidal vortex structures. Int. J. Hydrogen Energy 2012, 37, 16201–16213. [Google Scholar] [CrossRef] [Green Version]
  9. Di Sarli, V.; Di Benedetto, A. Effects of non-equidiffusion on unsteady propagation of hydrogen-enriched methane/air premixed flames. Int. J. Hydrogen Energy 2013, 38, 7510–7518. [Google Scholar] [CrossRef]
  10. Di Sarli, V. Stability and Emissions of a Lean Pre-Mixed Combustor with Rich Catalytic/Lean-burn Pilot. Int. J. Chem. React. Eng. 2014, 12, 77–89. [Google Scholar] [CrossRef]
  11. Garcia-Agreda, A.; Di Sarli, V.; Di Benedetto, A. Bifurcation analysis of the effect of hydrogen addition on the dynamic behavior of lean premixed pre-vaporized ethanol combustion. Int. J. Hydrogen Energy 2012, 37, 6922–6932. [Google Scholar] [CrossRef]
  12. Al-Hamamre, Z.; Yamin, J. The effect of hydrogen addition on premixed laminar acetylene–hydrogen–air and ethanol–hydrogen–air flames. Int. J. Hydrogen Energy 2013, 38, 7499–7509. [Google Scholar] [CrossRef]
  13. Li, G.; Zhang, Z.; Liang, J.; Dong, F.; Li, Y.; Gao, X. Effects of hydrogen addition on the premixed laminar-flames of ethanol–air gaseous mixtures: An experimental study. Int. J. Hydrogen Energy 2012, 37, 4490–4501. [Google Scholar] [CrossRef]
  14. Ji, C.; Liu, X.; Wang, S.; Gao, B.; Yang, J. A laminar burning velocity correlation for combustion simulation of hydrogen-enriched ethanol engines. Fuel 2014, 133, 139–142. [Google Scholar] [CrossRef]
  15. Cammarota, F.; Benedetto, A.D.; Sarli, V.D.; Salzano, E. The effect of hydrogen addition on the explosion of ethanol/air mixtures. Chem. Eng. Trans. 2012, 26, 405–410. [Google Scholar]
  16. Zhang, Z.; Li, G.; Ouyang, L.; Pan, Z.; You, F.; Gao, X. Experimental determination of laminar burning velocities and Markstein lengths for 75% hydrous-ethanol, hydrogen and air gaseous mixtures. Int. J. Hydrogen Energy 2011, 36, 13194–13206. [Google Scholar] [CrossRef]
  17. Xu, C.; Zhong, A.; Wang, H.; Jiang, C.; Sahu, A.; Zhou, W.; Wang, C. Laminar burning velocity of 2-methylfuran-air mixtures at elevated pressures and temperatures: Experimental and modeling studies. Fuel 2018, 231, 215–223. [Google Scholar] [CrossRef]
  18. Xu, C.; Fang, D.; Luo, Q.; Ma, J.; Xie, Y. A comparative study of laser ignition and spark ignition with gasoline–air mixtures. Opt. Laser Technol. 2014, 64, 343–351. [Google Scholar] [CrossRef]
  19. Xu, C.; Hu, Y.; Li, X.; Zhou, X.; Zhong, A. Comparative experimental study of ethanol-air premixed laminar combustion characteristics by laser induced spark and electric spark ignition. Korean J. Chem. Eng. 2017, 34, 574–579. [Google Scholar] [CrossRef]
  20. Galmiche, B.; Halter, F.; Foucher, F. Effects of high pressure, high temperature and dilution on laminar burning velocities and Markstein lengths of iso-octane/air mixtures. Combust. Flame 2012, 159, 3286–3299. [Google Scholar] [CrossRef]
  21. Zhou, J.; Cordier, M.; Mounaïm-Rousselle, C.; Foucher, F. Experimental estimate of the laminar burning velocity of iso-octane in oxygen-enriched and CO2-diluted air. Combust. Flame 2011, 158, 2375–2383. [Google Scholar] [CrossRef]
  22. Baloo, M.; Dariani, B.M.; Akhlaghi, M.; AghaMirsalim, M. Effects of pressure and temperature on laminar burning velocity and flame instability of iso-octane/methane fuel blend. Fuel 2016, 170, 235–244. [Google Scholar] [CrossRef]
  23. Cano, J.P.C.; Cabot, G.; Foucher, F.; de Persis, S. Effects of oxygen enrichment and water dilution on laminar methane flames at high pressure. Fuel 2018, 225, 499–508. [Google Scholar] [CrossRef]
  24. Zhang, Y.; El-Merhubi, H.; Lefort, B.; Le Moyne, L.; Curran, H.J.; Kéromnès, A. Probing the low-temperature chemistry of ethanol via the addition of dimethyl ether. Combust. Flame 2018, 190, 74–86. [Google Scholar] [CrossRef] [Green Version]
  25. Zhong, Z.; Zhou, J.; Long, J. Effect of high temperature and pressure on laminar burning velocity and reaction kinetics of methane/iso-octane mixtures. Energy Sources Part A Recover. Util. Environ. Eff. 2020, 1–16. [Google Scholar] [CrossRef]
  26. Katoch, A.; Millán-Merino, A.; Kumar, S. Measurement of laminar burning velocity of ethanol-air mixtures at elevated temperatures. Fuel 2018, 231, 37–44. [Google Scholar] [CrossRef]
  27. Sileghem, L.; Alekseev, V.; Vancoillie, J.; Nilsson, E.; Verhelst, S.; Konnov, A. Laminar burning velocities of primary reference fuels and simple alcohols. Fuel 2013, 115, 32–40. [Google Scholar] [CrossRef]
  28. Dirrenberger, P.; Glaude, P.; Bounaceur, R.; Le Gall, H.; da Cruz, A.P.; Konnov, A.; Battin-Leclerc, F. Laminar burning velocity of gasolines with addition of ethanol. Fuel 2013, 115, 162–169. [Google Scholar] [CrossRef] [Green Version]
  29. Konnov, A.; Meuwissen, R.; de Goey, L. The temperature dependence of the laminar burning velocity of ethanol flames. Proc. Combust. Inst. 2011, 33, 1011–1019. [Google Scholar] [CrossRef]
  30. Saxena, P.; Williams, F.A. Numerical and experimental studies of ethanol flames. Proc. Combust. Inst. 2007, 31, 1149–1156. [Google Scholar] [CrossRef]
  31. Wang, S.; Wang, Z.; Han, X.; Chen, C.; He, Y.; Zhu, Y.; Cen, K. Experimental and numerical study of the effect of elevated pressure on laminar burning velocity of lean H2/CO/O2/diluents flames. Fuel 2020, 273, 117753. [Google Scholar] [CrossRef]
  32. Srinidhi, C.; Madhusudhan, A.; Channapattana, S.V.; Gawali, S.V. Comparitive investigation of performance and emission features of methanol, ethanol, DEE, and nanopartilces as fuel additives in diesel-biodiesel blends. Heat Transf. 2020, 50, 2624–2642. [Google Scholar] [CrossRef]
  33. Waluyo, B.; Setiyo, M.; Saifudin; Wardana, I. Fuel performance for stable homogeneous gasoline-methanol-ethanol blends. Fuel 2021, 294, 120565. [Google Scholar] [CrossRef]
  34. Gainey, B.; Yan, Z.; Lawler, B. Autoignition characterization of methanol, ethanol, propanol, and butanol over a wide range of operating conditions in LTC/HCCI. Fuel 2020, 287, 119495. [Google Scholar] [CrossRef]
  35. Nabi, M.N. Theoretical investigation of engine thermal efficiency, adiabatic flame temperature, NOx emission and combustion-related parameters for different oxygenated fuels. Appl. Therm. Eng. 2010, 30, 839–844. [Google Scholar] [CrossRef]
  36. Jarungthammachote, S. Simplified model for estimations of combustion products, adiabatic flame temperature and properties of burned gas. Therm. Sci. Eng. Prog. 2019, 17, 100393. [Google Scholar] [CrossRef]
  37. Wang, G.; Li, Y.; Li, L.; Qi, F. Experimental and theoretical investigation on cellular instability of methanol/air flames. Fuel 2018, 225, 95–103. [Google Scholar] [CrossRef]
  38. Mohammad, A.; Juhany, K.A. Laminar burning velocity and flame structure of DME/methane + air mixtures at elevated temperatures. Fuel 2019, 245, 105–114. [Google Scholar] [CrossRef]
Figure 1. Schematic of the experimental setup.
Energies 15 03114 g001
Figure 2. Schlieren flame images of hydrogen–ethanol fuel. Hydrogen composition is 30%, T0 = 400 K, and P0 = 0.1 MPa.
Energies 15 03114 g002
Figure 3. LBV of ethanol–air flame obtained in the literature and in this study: working conditions at 0.1 MPa and 358/453 K.
Energies 15 03114 g003
Figure 4. Comparison of LBVs obtained by simulation and experiment: T0 = 400 K and P0 = 0.1 MPa, with a hydrogen composition of 30% and 90%.
Energies 15 03114 g004
Figure 5. LBVs of fuels with different mixing ratio (ϕ = 0.7–1.4, T0 = 400 K, P0 = 0.1 MPa).
Energies 15 03114 g005
Figure 6. LBVs at different ER as a function of hydrogen composition (T0 = 400 K, P0 = 0.1 MPa).
Energies 15 03114 g006
Figure 7. LBVs at different initial temperature and P0 = 0.1 MPa: (a) ethanol, (b) 10% hydrogen, (c) 20% hydrogen, and (d) 30% hydrogen.
Energies 15 03114 g007
Figure 8. LBVs at different initial pressure and T0 = 400 K: (a) ethanol, (b) 10% hydrogen, (c) 20% hydrogen, and (d) 30% hydrogen.
Energies 15 03114 g008
Figure 9. The AFT of ethanol−hydrogen−air flames at various ERs. (a) Different ERs. (b) Different ethanol compositions.
Energies 15 03114 g009
Figure 10. The peak NHRRs and HRR0 of ethanol−hydrogen−air flames with various hydrogen concentrations and ϕ. (a) Peak net heat release rate (NHRRs). (b) Heat release rate (HRR0).
Energies 15 03114 g010
Figure 11. The laminar flame thickness (δ) and thermal expansion ratios (σ) of ethanol–hydrogen–air flames. (a) Thermal expansion ratios (σ). (b) The laminar flame thickness (δ).
Energies 15 03114 g011
Figure 12. Flow rate sensitivity influenced by hydrogen composition (T0 = 400 K, P0 = 0.1 MPa, ϕ = 1).
Energies 15 03114 g012
Figure 13. Flow rate sensitivity influenced by temperature (hydrogen composition is 30%, P0 = 0.1 MPa, ϕ = 1).
Energies 15 03114 g013
Figure 14. Rates of O radical production for various fuels. Working conditions at ϕ = 1.0 and P = 1 bar: (a) Ethanol, (b) H10, (c) H20, and (d) H30 left: 400 K and right: 450 K.
Energies 15 03114 g014aEnergies 15 03114 g014b
Figure 15. Rates of OH radical production for various fuels. Working conditions at ϕ = 1.0 and P = 1 bar: (a) Ethanol, (b) H10, (c) H20, and (d) H30; left: 400 K and right: 450 K.
Energies 15 03114 g015aEnergies 15 03114 g015b
Table 1. Reaction summary of O or OH production rates.
R2H2 + O <=> H + OHR156CH2O + OH <=> HCO + H2O
R3H2 + OH <=> H + H2OR255C2H4 + O <=> CH3 + HCO
R5O2 + H <=> O + OHR256C2H4 + O <=> CH2CHO + H
R7O + H2O <=> 2OHR261C2H4 + OH <=> C2H3OH + H
R27HO2 + H <=> 2OHR319C2H2 + O <=> HCCO + H
R36CO + OH <=> CO2 + HR417C2H5OH + O <=> CH3CHOH + OH
R45CH4 + O <=> CH3 + OHR418C2H5OH + O <=> CH2CH2OH + OH
R92CH3 + O <=> CH2O + HR423C2H5OH + OH <=> CH3CHOH + H2O
Publisher’s Note: MDPI stays neutral with regard to jurisdictional claims in published maps and institutional affiliations.

