Article

Economic Viability of Rooftop Photovoltaic Systems and Energy Storage Systems in Qatar

1
Division of Sustainable Development, College of Science and Engineering, Hamad Bin Khalifa University, Qatar Foundation, Doha P.O. Box 34110, Qatar
2
Department of Electronic and Electrical Engineering, University of Strathclyde, Glasgow G1 1XQ, UK
*
Author to whom correspondence should be addressed.
Energies 2022, 15(9), 3040; https://doi.org/10.3390/en15093040
Submission received: 19 December 2021 / Revised: 29 January 2022 / Accepted: 1 February 2022 / Published: 21 April 2022
(This article belongs to the Topic Solar Thermal Energy and Photovoltaic Systems)

Abstract

:
Renewable energy sources and sustainability have been attracting increased focus and development worldwide. Qatar is no exception, as it has ambitious plans to deploy renewable energy sources on a mass scale. Qatar may also investigate initiating and permitting the deployment of rooftop photovoltaic (PV) systems for residential households. Therefore, a research gap has been introduced regarding the system design, grid compatibility, economic viability, and energy consumption produced from household rooftop PV systems. Additionally, the lack of supporting policies and a feed-in tariff creates further research and development topics. Therefore, using collected data regarding household power consumption and rooftop PV generation, the purposes of this research study are as follows: (1) determining the economic aspects and practicality of using energy storage systems for self-consumption values; and (2) evaluating the economic viability of rooftop PV systems under different policies and electricity rate schemes. The insights of the results of this study can serve as a stepping stone for decisions and policymakers regarding the application of rooftop PV systems in Qatar. This study utilizes empirical evidence and an economic model to evaluate rooftop PV systems in Qatar and can also be applicable in the middle east region. A few studies in the region produce complementary results, which further supports our findings; however, what makes this paper unique is the use of different economic tools and real collected data while investigating multiple economic and energy policy scenarios.

1. Introduction and Background

Since Qatar’s energy and economy sectors are profoundly dependent upon fossil fuels, which are slowly and inevitably depleting, a substantial shift must take place toward sustainability and renewable energy soon. The most common tools for helping achieve this desired sustainability include deploying serious demand-side management (DSM) techniques and investing heavily in energy efficiency and renewable energy systems [1]. Both strategies indisputably depend on acquiring residential load profiling during their development stages and, to some extent, during the operational stages. Therefore, gaining a deeper understanding of the factors, which shape residential load profiles and their behavior, is essential for promoting long-term sustainability. In addition, the evaluation of the economic viability of photovoltaic (PV) and energy storage systems is essential for sustainable development. Unfortunately, in Qatar, DSM techniques are currently lacking, and there are no existing programs focused on rooftop PV systems or solar energy system deployment [2].
Many aspects motivate the research toward the economic viability of PV rooftop systems in Qatar. These aspects can be categorized into four factors: economic, environmental, technical, and social. The economic factors are the most significant among all the other factors. Energy security is one of the leading national concerns of Qatar [3]. Therefore, increasing power production has become necessary with the total consumption load approaching the maximum power production capacity. The environmental factors stem from the high-power demands and the relatively small population of Qatar. According to Kahramaa, the sole supplier of the electricity and water sector in Qatar, owing to the massive amounts of exported fossil fuels and high power demands, Qatar has one of the largest carbon footprints per capita worldwide [4].
The technical motivation is represented by technical challenges arising from integrating mass-scale renewable energy sources [5]. These technical challenges motivate the research towards understanding the viability of PV rooftop systems and the modifications required for the grid and household based on several aspects. Finally, the social aspects are often overlooked regarding sustainable development; however, ambitious government plans towards deploying new renewable sources have been met with public opposition on several occasions [6]. Moreover, the load profiles are heavily impacted by weather patterns and socioeconomic factors [7]. Therefore, revealing the links between consumption patterns and socioeconomic factors will better assist policymakers in promoting responsible citizenship.
Energy monitors were installed in 10 houses selected to represent the residential classifications in Qatar, and the data were collected over a year-long period to cover the seasonal impacts on power profiles. Global Horizontal Irradiance (GHI) data were acquired from a solar testing facility and were used in creating annual PV power generation profiles. Self-consumption and payback period values were calculated to assess the economic feasibility of rooftop PV systems. Energy storage requirements and payback periods were calculated to evaluate the economic viability of solar energy storage in Qatar. The results from the present study can serve as a contribution to future research activities, including the design of PV rooftop and energy storage systems and demand/response programs. Moreover, the results provide valuable insight for policy and decision-makers regarding DSM, PV rooftop system deployment, and feed-in tariff (FIT) initiation.
The findings of this research could potentially serve as a foundation for developing national-level DSM techniques or mass application of residential rooftop PV systems. The significance of this research can be summarized in three main areas. First, the observed load profiles can influence policymakers to modify electricity tariffs and subsidies. Moreover, socioeconomic factors and their effect on the economic viability of PV rooftop systems and their relation to the energy storage design are discussed. Furthermore, the study offers insights into the technical compatibility of residential rooftop PV systems with Qatar’s electrical grid, which helps policymakers modify the electrical grid before permitting PV system installation.
A few studies in Qatar and the Gulf Cooperation Council (GCC) investigate the economic viability of rooftop PV systems and energy storage systems. Given the early stage of solar energy utilization and similar economic and weather conditions of the GCC, these studies produce comparable and consistent results. The main difference in these studies is the methodology used and the depth of result analysis and interpretation. For example, in their study [8], Elbeheiry uses load modulation with residential houses from Texas’ load profiles to represent Qatari residential houses. Their results show that return on investments is negative with Qatar’s current grid rate, while in their study [9], Mohandes used an agent-based approach driven by cost to assist the adoption of PV systems in Qatar. Their results demonstrate favorable PV adoption under the conditions of reducing energy subsidies and introducing carbon taxes.

1.1. Viability Analysis of Photovoltaic (PV) Systems

Electricity generation using PV systems is essential and reliable and can play a significant role in CO2 emission mitigation by becoming a substantial source of future electricity generation. In general, household owners have two motives to install PV systems for power generation: economic and environmental incentives. This section discusses the environmental motivations for a household owner to deploy rooftop PV systems. Although the economic incentives are by far the most dominant motivators for the public to utilize PV systems, environmental awareness can also play a role in individuals’ interest in consuming sustainable energy from renewable sources [10]. A general misconception on behalf of the public is that PV systems are completely “green” and have no negative impact on the environment. Although PV systems produce renewable energy that has zero impact on the environment during the operation phase, they consume energy and release greenhouse gases during the manufacturing and deployment phases. Life cycle assessment (LCA) is a useful environmental assessment tool employed to analyze the environmental impacts associated with the various life stages of a product. Using environmental indicators in LCA, namely, the energy payback time (EPBT) and the greenhouse-gas payback time (GPBT), we can measure the sustainability of PV systems [11]. Using the EPBT consists of comparing the embodied energy in the system used during the manufacturing phase with the energy the system ought to produce during its operational lifetime.
However, the GPBT investigates the greenhouse gases (GHGs) embodied in the system, as divided by the GHGs produced by a local power plant. There are many factors at play when measuring the results for both EPBT and GPBT, including the type of materials and technical processes used in manufacturing, the location of manufacturing, and the location of PV system operations. In a study conducted in the UK, Wilson and Young [12] found out that the EPBT for two mono-crystalline PV systems is 8 to 12 years. In another study conducted in the USA, Knapp and Jester [13] found out that the EPBT for mono-crystalline and thin-film copper indium diselenide PV systems are 3 to 4 years and 9 to 12 years, respectively. The EPBT for a Hong Kong study on a mono-crystalline silicon PV system was found to be 7.1 years, and the GPBT was 5.2 years [11]. When comparing these values with the typical lifespan of PV systems, which can range between 20 to 30 years, we can deduce PV systems are generally considered sustainable and a source of green energy.

1.2. Economic Analysis of PV Systems

Currently, solar technologies continue to flourish and have attained a steady decline in cost in a competitive market. Remarkably, the global average levelized cost of electricity (LCOE) of utility-scale PV stations has decreased by 73% from 2010 to USD 0.10/kWh for new projects commissioned in 2017. Furthermore, this cost is expected to decrease to USD 0.06/kWh for solar PV by 2020. LCOE is the net present value of the unit cost of electricity over the lifetime of a generating asset [14]. The main drivers of the cost reduction in solar technologies are (1) technology improvements, (2) competitive procurement, and (3) a broad base of experienced, internationally active project developers, as shown in Figure 1. In addition, the market claimed an 81% decrease in solar PV module prices since 2009, along with a substantial reduction in the cost for the rest of the PV system components. As a result, the electricity generation cost from renewable energy sources will become consistently cheaper than fossil fuel-generated power soon (e.g., after 2020). The cost range for fossil fuel-generated power ranges between USD 0.05 and 0.17/kWh globally. According to the International Energy Agency (IEA), the cumulative global installed PV capacity had grown from 6.1 GW in 2006 to approximately 398 GW in 2017. Likewise, the residential PV system’s total installment costs have declined significantly by 47–78% since 2007, to USD 1050–4550/kW in 2017, depending on the market [15].
In the public sector, economic incentives, electricity bills, and the potential of revenue from energy sources are the essential factors assisting in choosing energy sources. Currently, electricity from solar PV systems remains more expensive than conventional electricity; hence, most public members are discouraged from the deployment of solar PV systems. Therefore, countries such as Germany, the USA, and Japan have implemented residential PV system incentive programs to promote increased usage of PV systems, with economic viability for the end-users. The focus of these incentives targets most public and commercial sector members interested in selling electricity back to the grid (feed-in tariff). In contrast, some members are primarily interested in generating green energy. In Qatar, however, there is still no FIT option available to the public; moreover, the current challenges to the promotion of PV systems, by far, are the energy subsidies for fuel, water, and electricity provided to the public sector.

2. Methodology

Three different types of datasets have been collected throughout this research. The first dataset consists of the load or the total energy consumption data of the sample household. The second dataset consists of solar energy generation data. The third dataset is related to the households’ technical and socioeconomic factors. These collected datasets make this research unique and stand out from other similar studies [8,9], together with the various economic indicators used, leading to more accurate and valid results. This study is a continuation of our previous publication [7], in which we use in-depth economic tools to further analyze the datasets collected.

2.1. Energy Monitoring System Structure

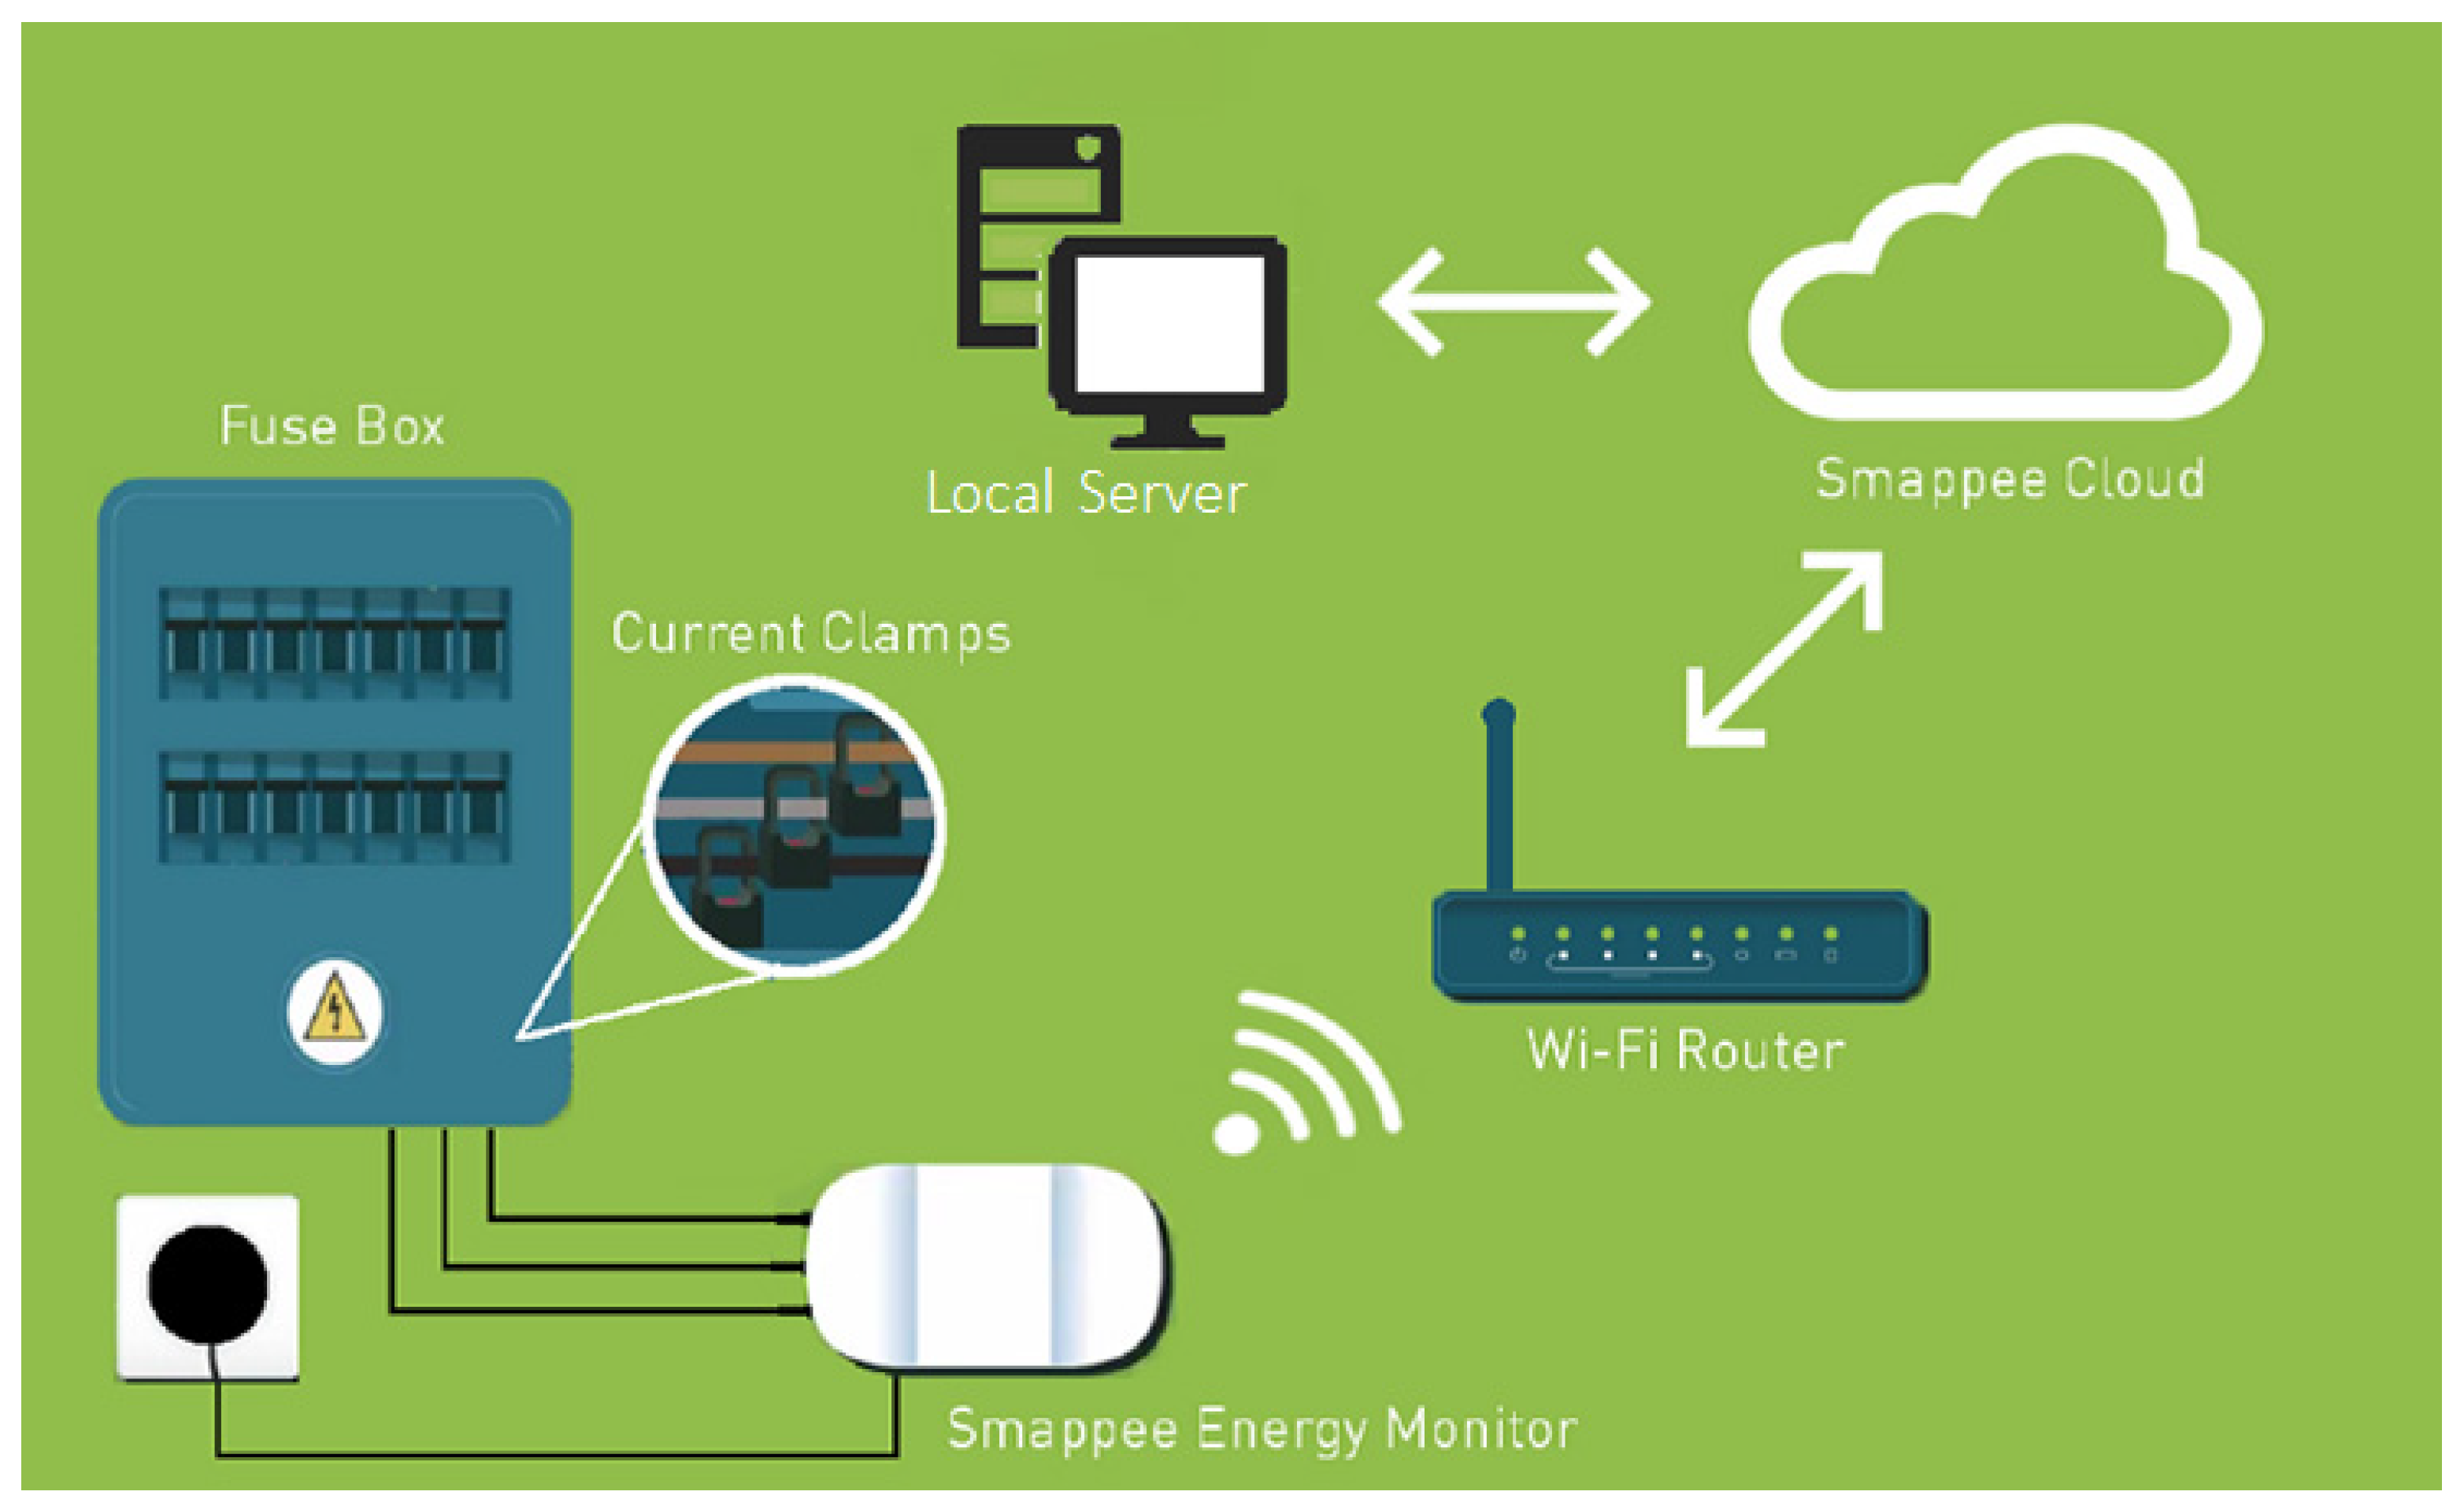
In Qatar, the electricity network supplies a three-phase power rated at 240 V and 50 Hz to the residential sector, following UK standards. Therefore, due to their compliance, the energy monitoring devices that we chose are commercially available devices called Smappee devices. Smappee devices are connected to a house’s main distribution board through non-physical contact clamp meters and upload energy readings at a 5 min interval-sampling rate to the cloud. This type of energy monitoring is called non-intrusive load monitoring. A single monitoring point is required to measure an electrical current supplied at a constant voltage, allowing usto measure power and energy readings. In addition to the power and energy readings, the system utilizes smart machine learning algorithms that can recognize the house’s appliances, by sensing and detecting their unique energy consumption signature trends. A local server is created to overcome the Smappee server’s storage limitations and to download and store the data periodically for the full duration of the study. The monitoring system is depicted in Figure 2, which illustrates the different components of the system structure. An IRB certificate was acquired before installing the energy monitors and collecting the socioeconomic data of the households.

2.2. Solar Energy Data

The solar data used in this study were collected from the solar test facility located at the Qatar Science and Technology Park (QSTP). The 35,000-square meter test site is operated by the Qatar Environment and Energy Research Institute (QEERI), in collaboration with Hamad Bin Khalifa University (HBKU). The data include GHI values (in W/m2) for 2016, in 1 min intervals to visualize the PV generation demand curve; the GHI data are used for PV panels with 15% efficiency and physical size of 1.6 square meters.

2.2.1. PV System Sizing

The number of PV panels installed in each house will determine the scale of the PV power generation. The available rooftop space primarily determines the number of PV panels that can be installed. Further, the number of panels can be limited by financial factors, including the upfront cost. Table 1 demonstrates the socioeconomic factors associated with the selected houses. Table 2 indicates the available rooftop spaces that could occupy a suitable number of PV panels. At first glance, there might seem to be a large discrepancy between the rooftop space’s total size and its free space. In that regard, in Qatar, most rooftops are occupied with large, packaged AC unit outer compression units, portable water tanks, clarifiers, and satellite dishes. Moreover, small spaces, narrow corridors, and irregular surfaces do not count toward the total free space. It is also worth noticing that houses 3 and 7 opt to install half of the possible number of panels due to their low average energy consumption loads, whereas H8 chooses to decrease the number of panels due to financial constraints.

2.2.2. Self-Consumption

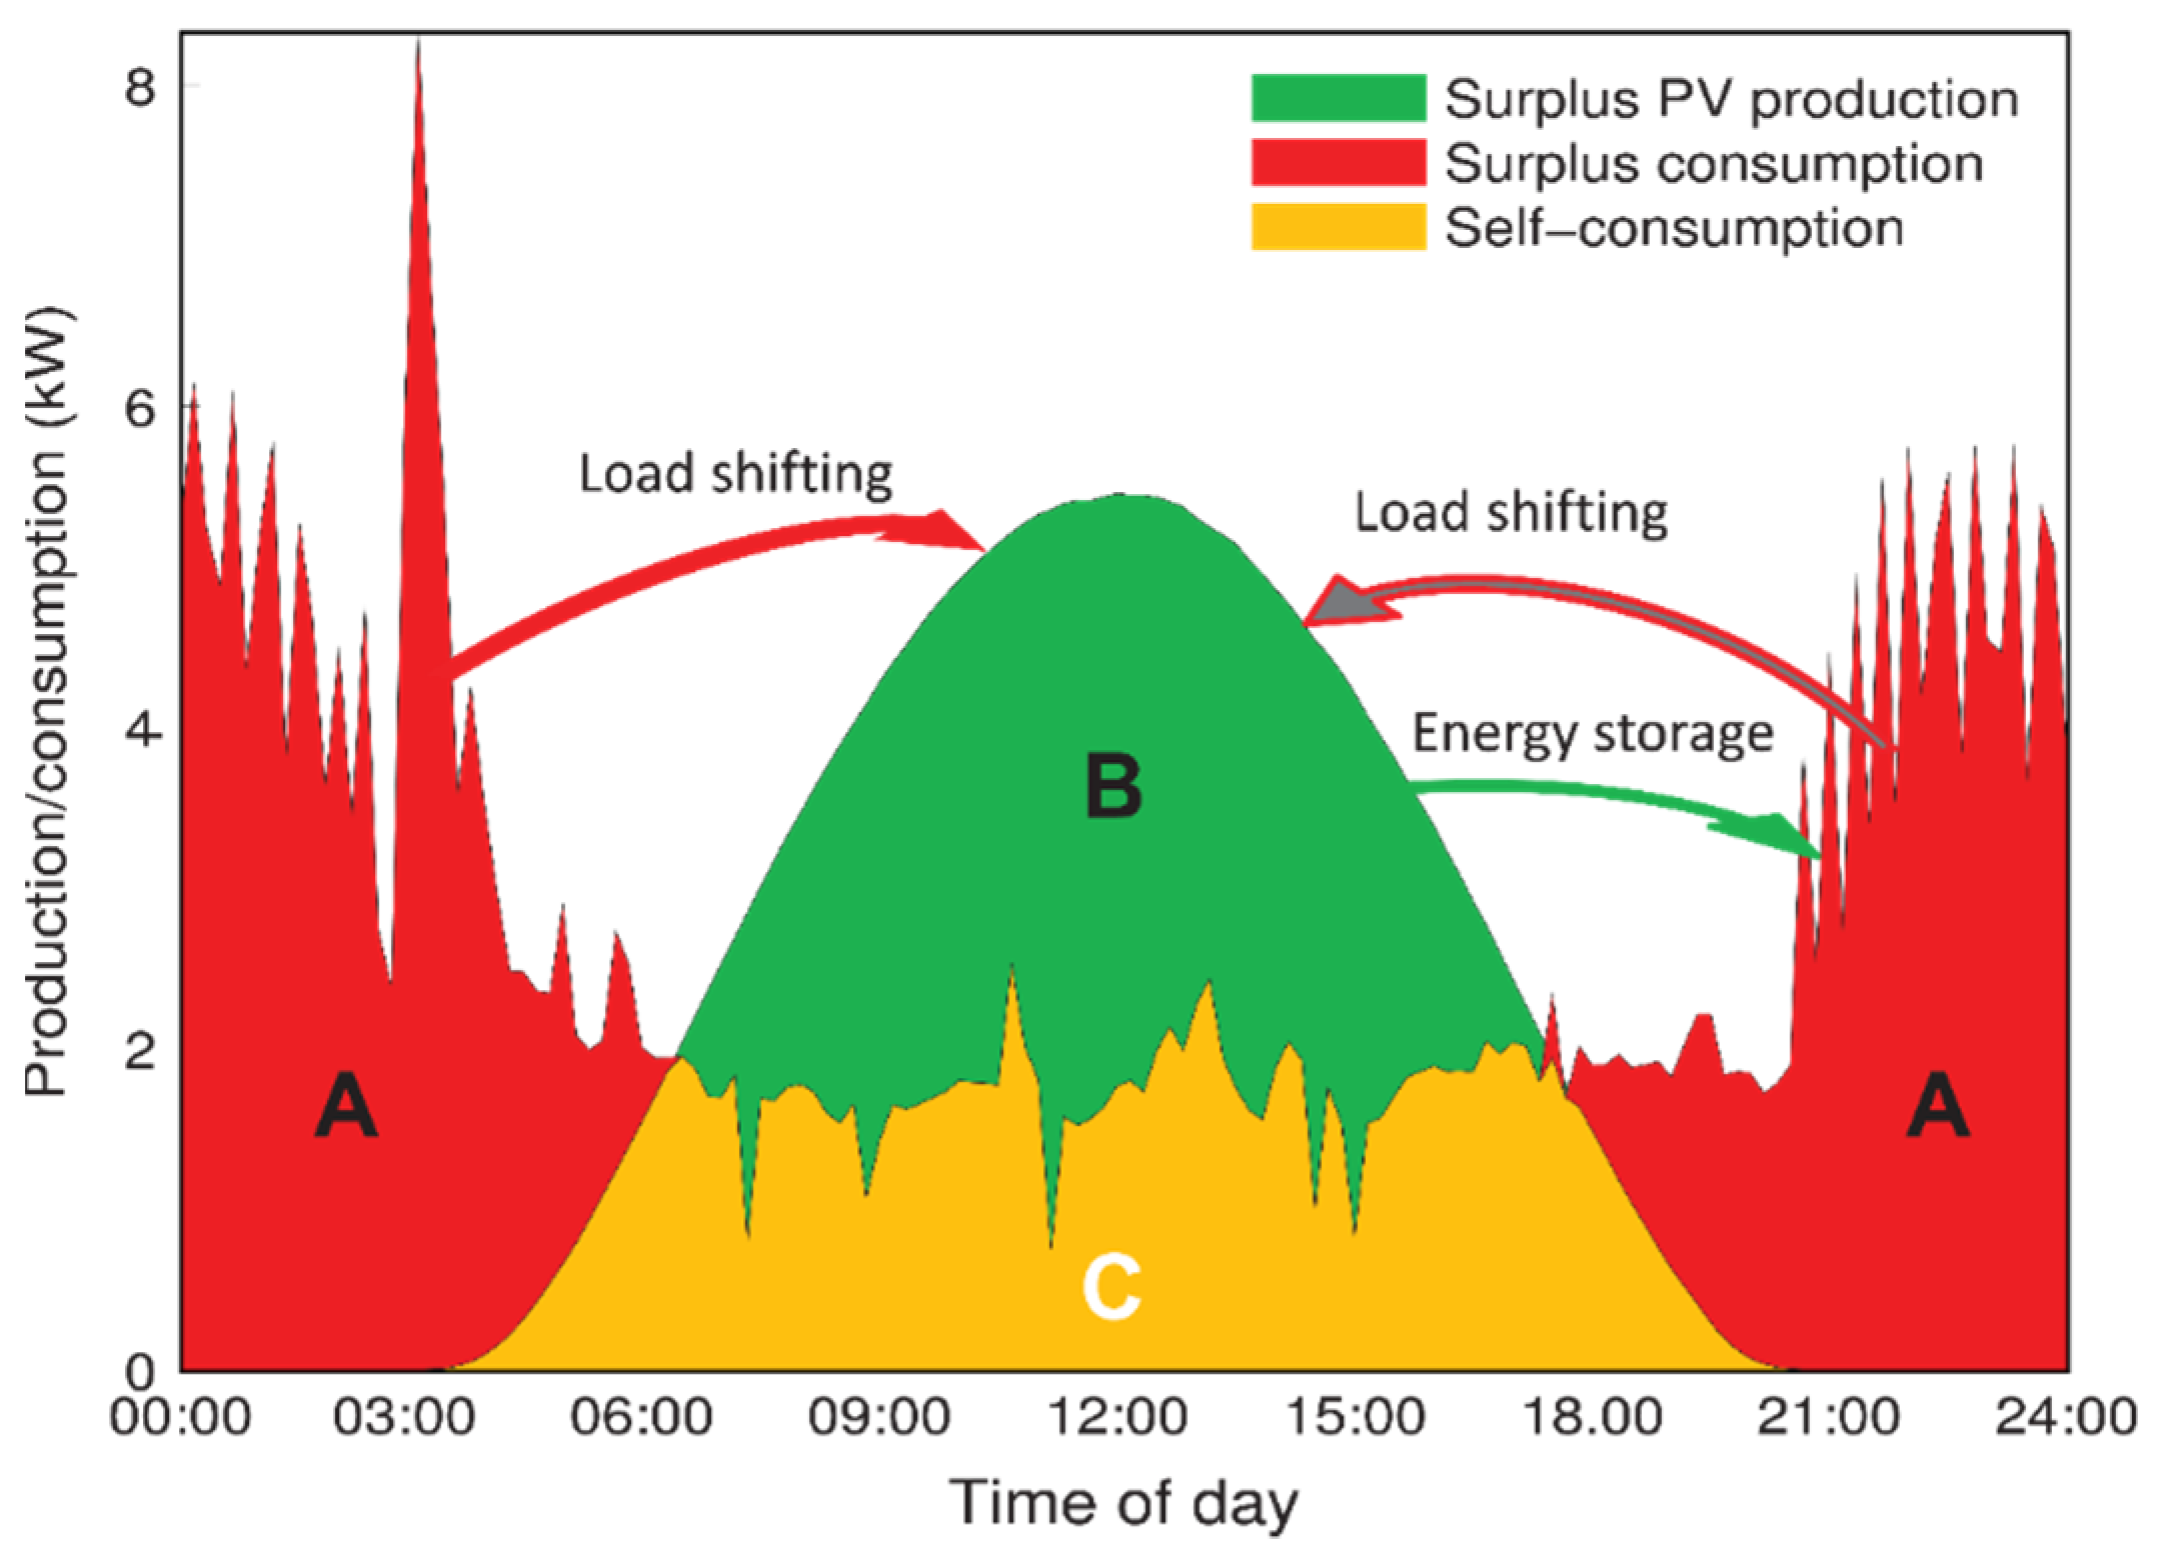
In households that employ PV and energy storage systems, it is essential to evaluate the economic viability and system efficiency. Self-consumption denotes the portion of the PV energy production that the household consumes. Two primary metrics are used to evaluate energy storage systems: self-consumption and self-sufficiency. According to Luthander et al. [16], these two matrices are defined as follows, and the areas A, B, and C are illustrated in Figure 3. Self-consumption is defined as in Equation (1).
Self   Consumption   = C B + C
High self-consumption rates lead to increased economic benefits because the electricity generated from PV systems is typically cheaper than the utility tariffs. Self-consumption can be increased by using two techniques: DSM and energy storage.

2.3. Methodology and Assumptions

The payback period must be determined to examine the PV system’s economic viability. To this end, an economic model is created to calculate the PV payback time [17]. In addition to the PV payback time, other economic indicators are also calculated, such as the net present value, internal rate of return, and investment rate. Many variables must be incorporated into the calculation, including the PV decay rate. Generally, for the first two years, the PV module exhibits a decay of 2–3% inefficiency, a maximum of 0.7% decay for the next eight years, and a maximum of 0.5% decay. The factors that affect the decay rate include the material of the photovoltaic panels, the weather, the installation site, and the type of installation. The average life of a suitable solar cell is guaranteed at least 20 years. This is five years less than the average global solar panel lifespan expectancy, owing to Qatar’s rough, hot, and humid weather. As the average decay values are between 0.6% and 1.1%, the value chosen for this calculation is 0.7%. The following values to be calculated are the total energy production, the portion consumed over a year, and the surplus of energy generated over the year.
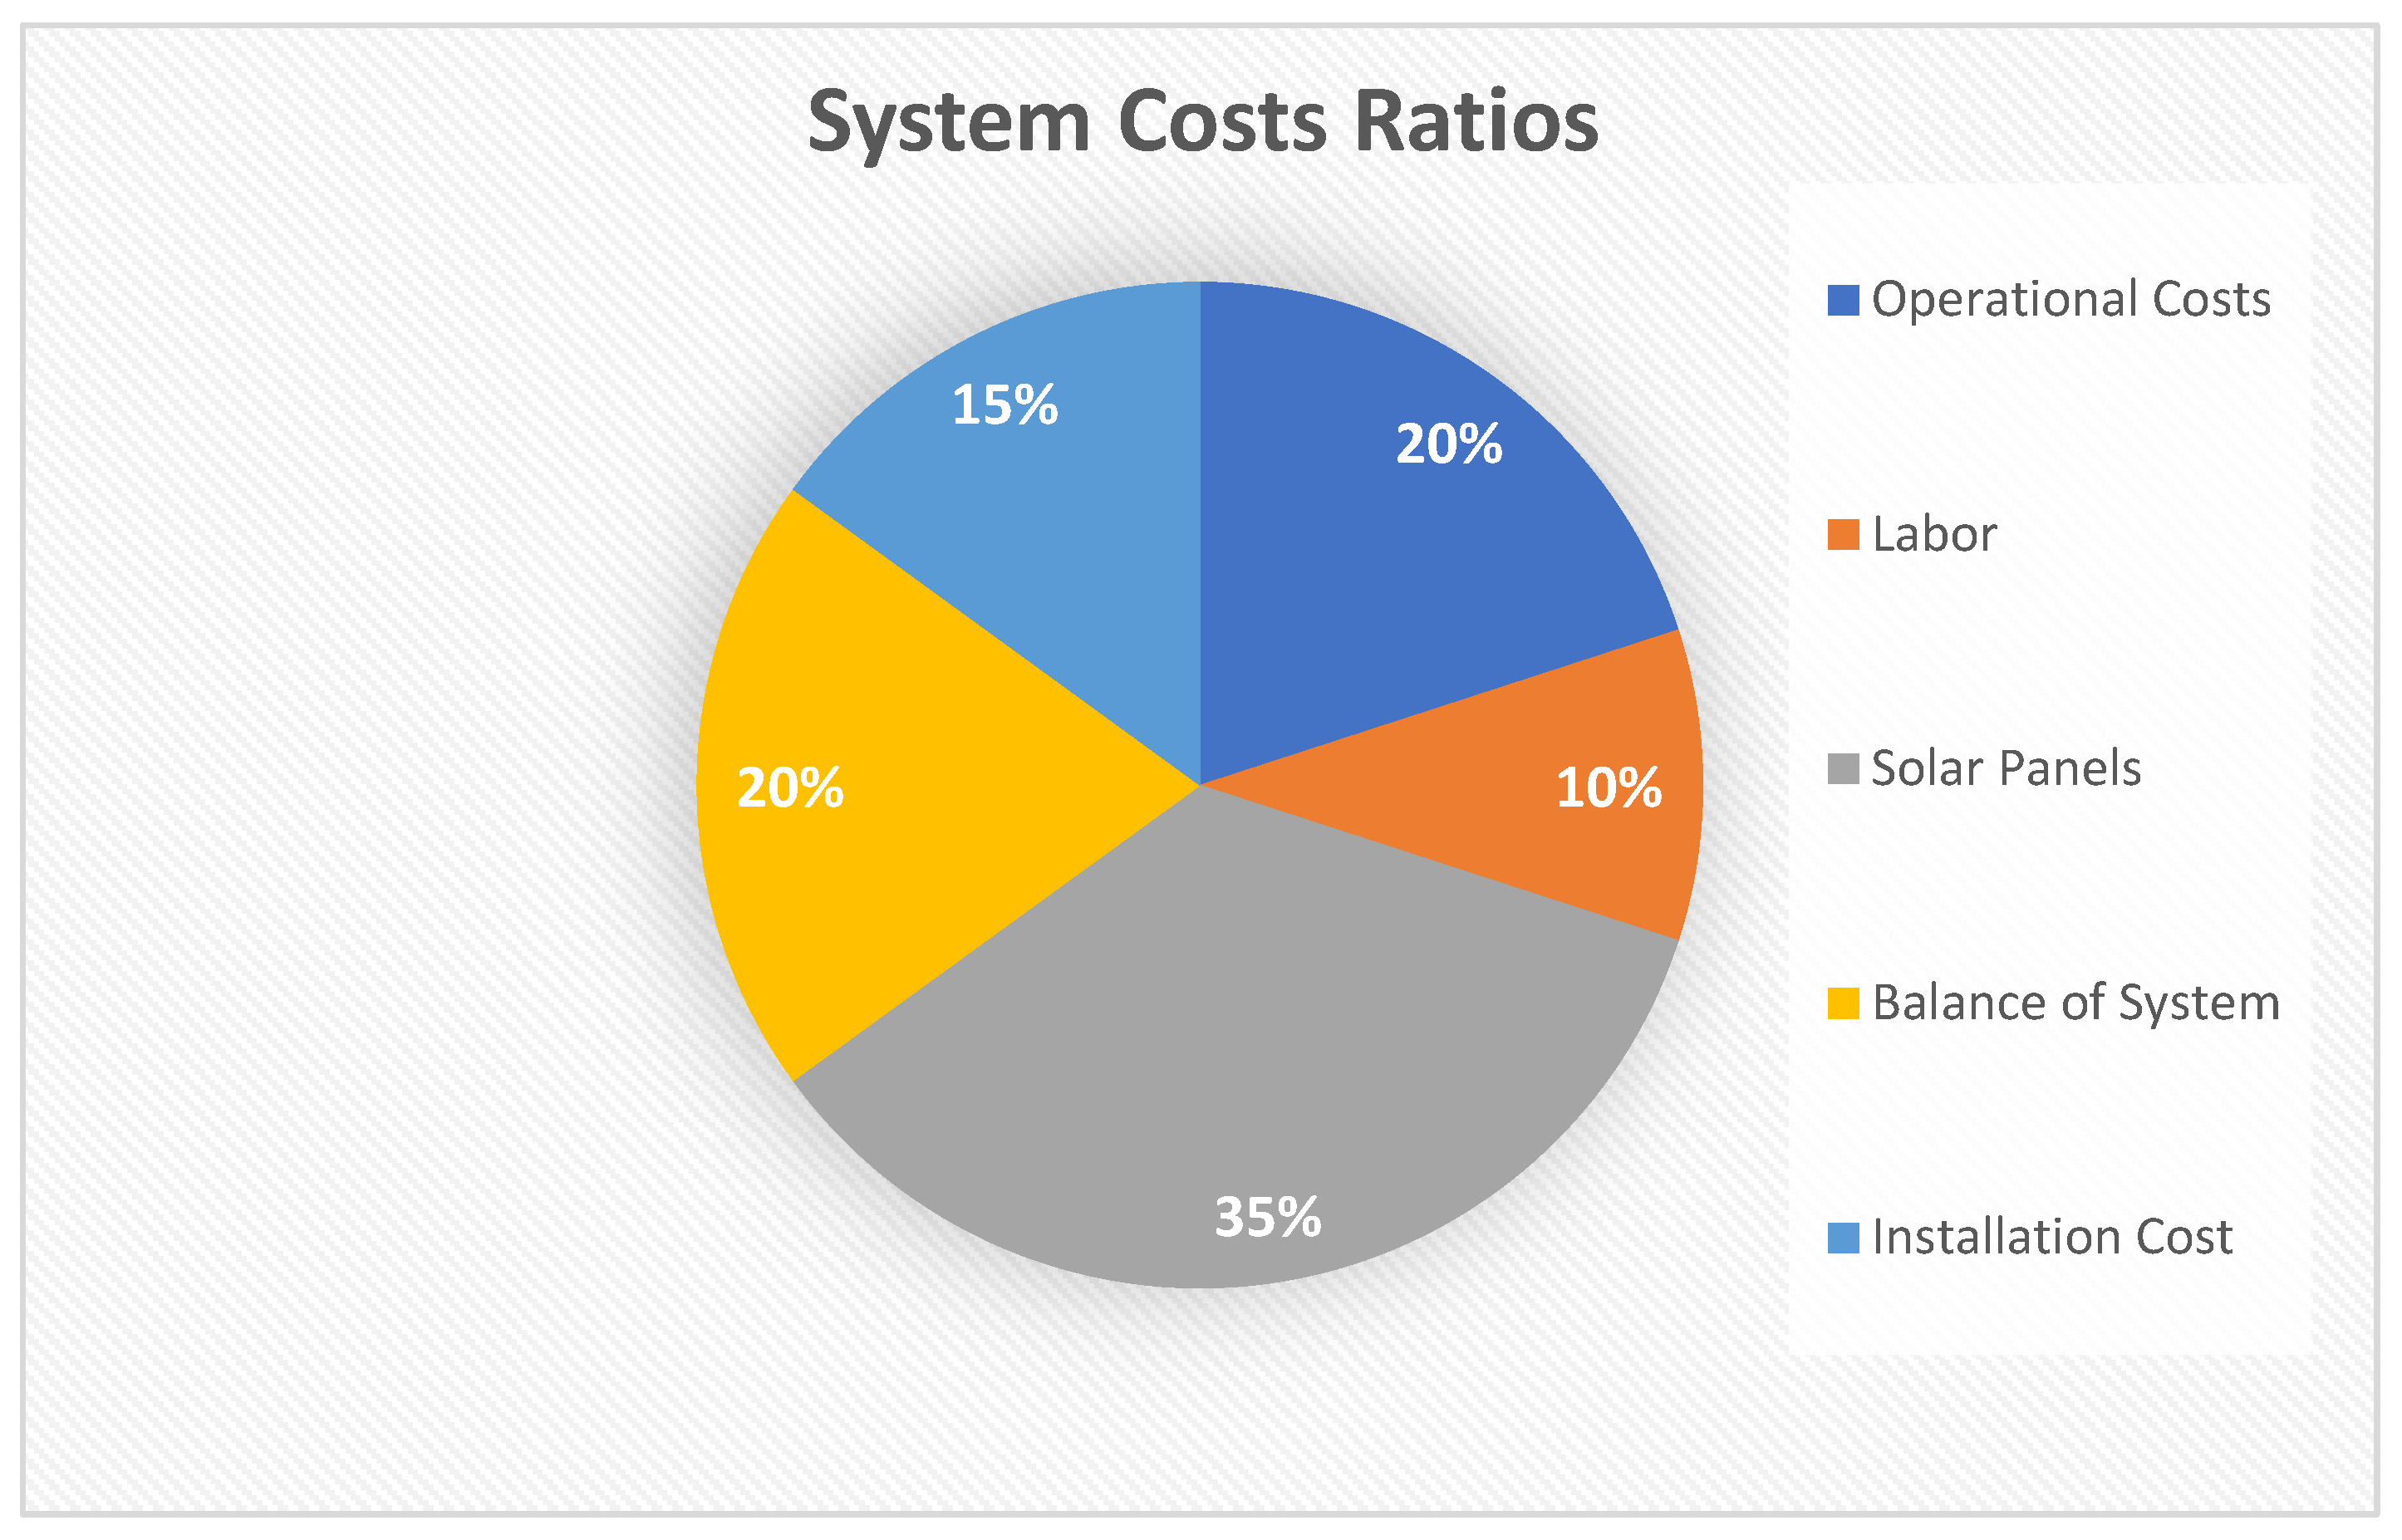
The tariff electricity rate is 4.9 cents/kWh for the residential sector, as there is no real implementation of FITs for residential rooftop PV systems in Qatar. It is difficult to predict the selling cost rate, although we can assume the government would attempt to encourage residential PV systems and adopt attractive rates; therefore, it is considered that the energy unit selling rate would be approximately USD 0.10/kWh. Mortgage rates are predicted to be approximately 3%, based on the local banks’ loan rates for amounts comparable to the PV system’s installation costs. However, this value could be even lower, e.g., if promotional bank loans are offered to support solar energy. The system cost is broken down into the panel cost, consisting of a USD 300 panel cost and a USD 200 installation cost, both consistent with global averages [18]. The balance of the system includes all components of the solar system except for the solar panels (including the inverter) and is estimated to be approximately USD 3500. The annual cost is assumed to be USD 150, which a bit steep compared to other regions, owing to the higher cost of water in Qatar expected to be used for cleaning. The system cost ratios are demonstrated in Figure 4 for a 20 panel/4500 W system. Qatar has a strong economy with a low inflation rate of 0.1% [19], and a discount rate of approximately 3.5% [20]. Table 3 presents the different variables applied in the model.
The equations used in the model are as follows:
E t = E 1 · [ 1 D r 100 · ( t 1 ) ]
C t = { ( 1 + I 100 ) t · E t · U M         C t 1 < 0                 ( 1 + I 100 ) t · E t · U                   C t 1 > 0        
t = 1 n C t C i
In the above, t is the time in years, E1 is the energy generated in the first year, and Et in Equation (2) is the energy generated during subsequent years. Dr is the decay rate of the PV system in percent per year and causes the annual energy generation to decrease linearly. In Equation (3), Ct is the cost value in dollars (USD), for either the offset electrical energy generated by the PV system or the surplus electrical energy generated by the PV system and sold to the grid through an FIT. The energy unit cost U is measured in USD/kWh and can be used to evaluate both the offset and access energy generated by PV systems. In the case of evaluating the offset PV-generated energy, U takes the rate of the electrical utility power supply energy unit retail price. For the surplus PV-generated energy, U takes the rate at which the rooftop PV owner sells the energy back to the grid, I is the inflation rate in percent per year, and M is the annual mortgage settlement paid in dollars (USD). Mortgage settlements are paid to the bank until finally paid off, i.e., the cash flow is no longer negative at the year of PV payback. The payback is the number of years n in Equation (4), i.e., the number of years that it takes for the cash flow to break even and for the accumulating cash over n years to become greater than the initial PV system cost Ci.

3. Results and Discussion

3.1. Rooftop PV Power Generation Viability in Qatar

There are two scenarios for households interested in using rooftop PV systems. The first scenario involves houses that will utilize most of the generated PV power. The second scenario includes houses that would need to either store or sell surplus energy to the grid. In both cases, electricity subsidies are a clear obstacle to project success. Energy subsidies have long outlived their usefulness; electricity has been supplied residentially at low fixed prices in the GCC region from the 1970s until recently. Governments have finally rejected the notion of citizen entitlement to cheap energy prices in the GCC region in recent years. The driver behind this new approach is to (1) relieve pressure on government budgets, (2) reduce public oil and gas consumption (which can otherwise be exported), and (3) reduce GHG emissions and encourage sustainability [21].

3.2. Results

The results section consists of three case studies. The first focuses on investigating the impacts of the electricity rate subsides in Qatar under various conditions, including the premise of having an FIT, and electricity unit prices comparable with those of the global average. The second case study focuses on the impacts of permitting FITs in Qatar. Finally, the third case study investigates the design process and the economic impacts of energy storage on household owners with rooftop PV systems.

3.2.1. Economic Viability of Rooftop PV Systems without Energy Storage and Feed-In Tariff in Qatar

The data of the houses and the model variables are summarized in Table 4 and Table 5. The selection of panels in this case study is subject to many factors, mainly the available rooftop space and financial constraints of the household owners, as presented in Table 1 and Table 2. The energy data in Table 4 show the breakdown of the total yearly PV generation into the total self-consumed energy and total surplus generated energy, calculated with the help of collected data from the energy monitors installed in each house.
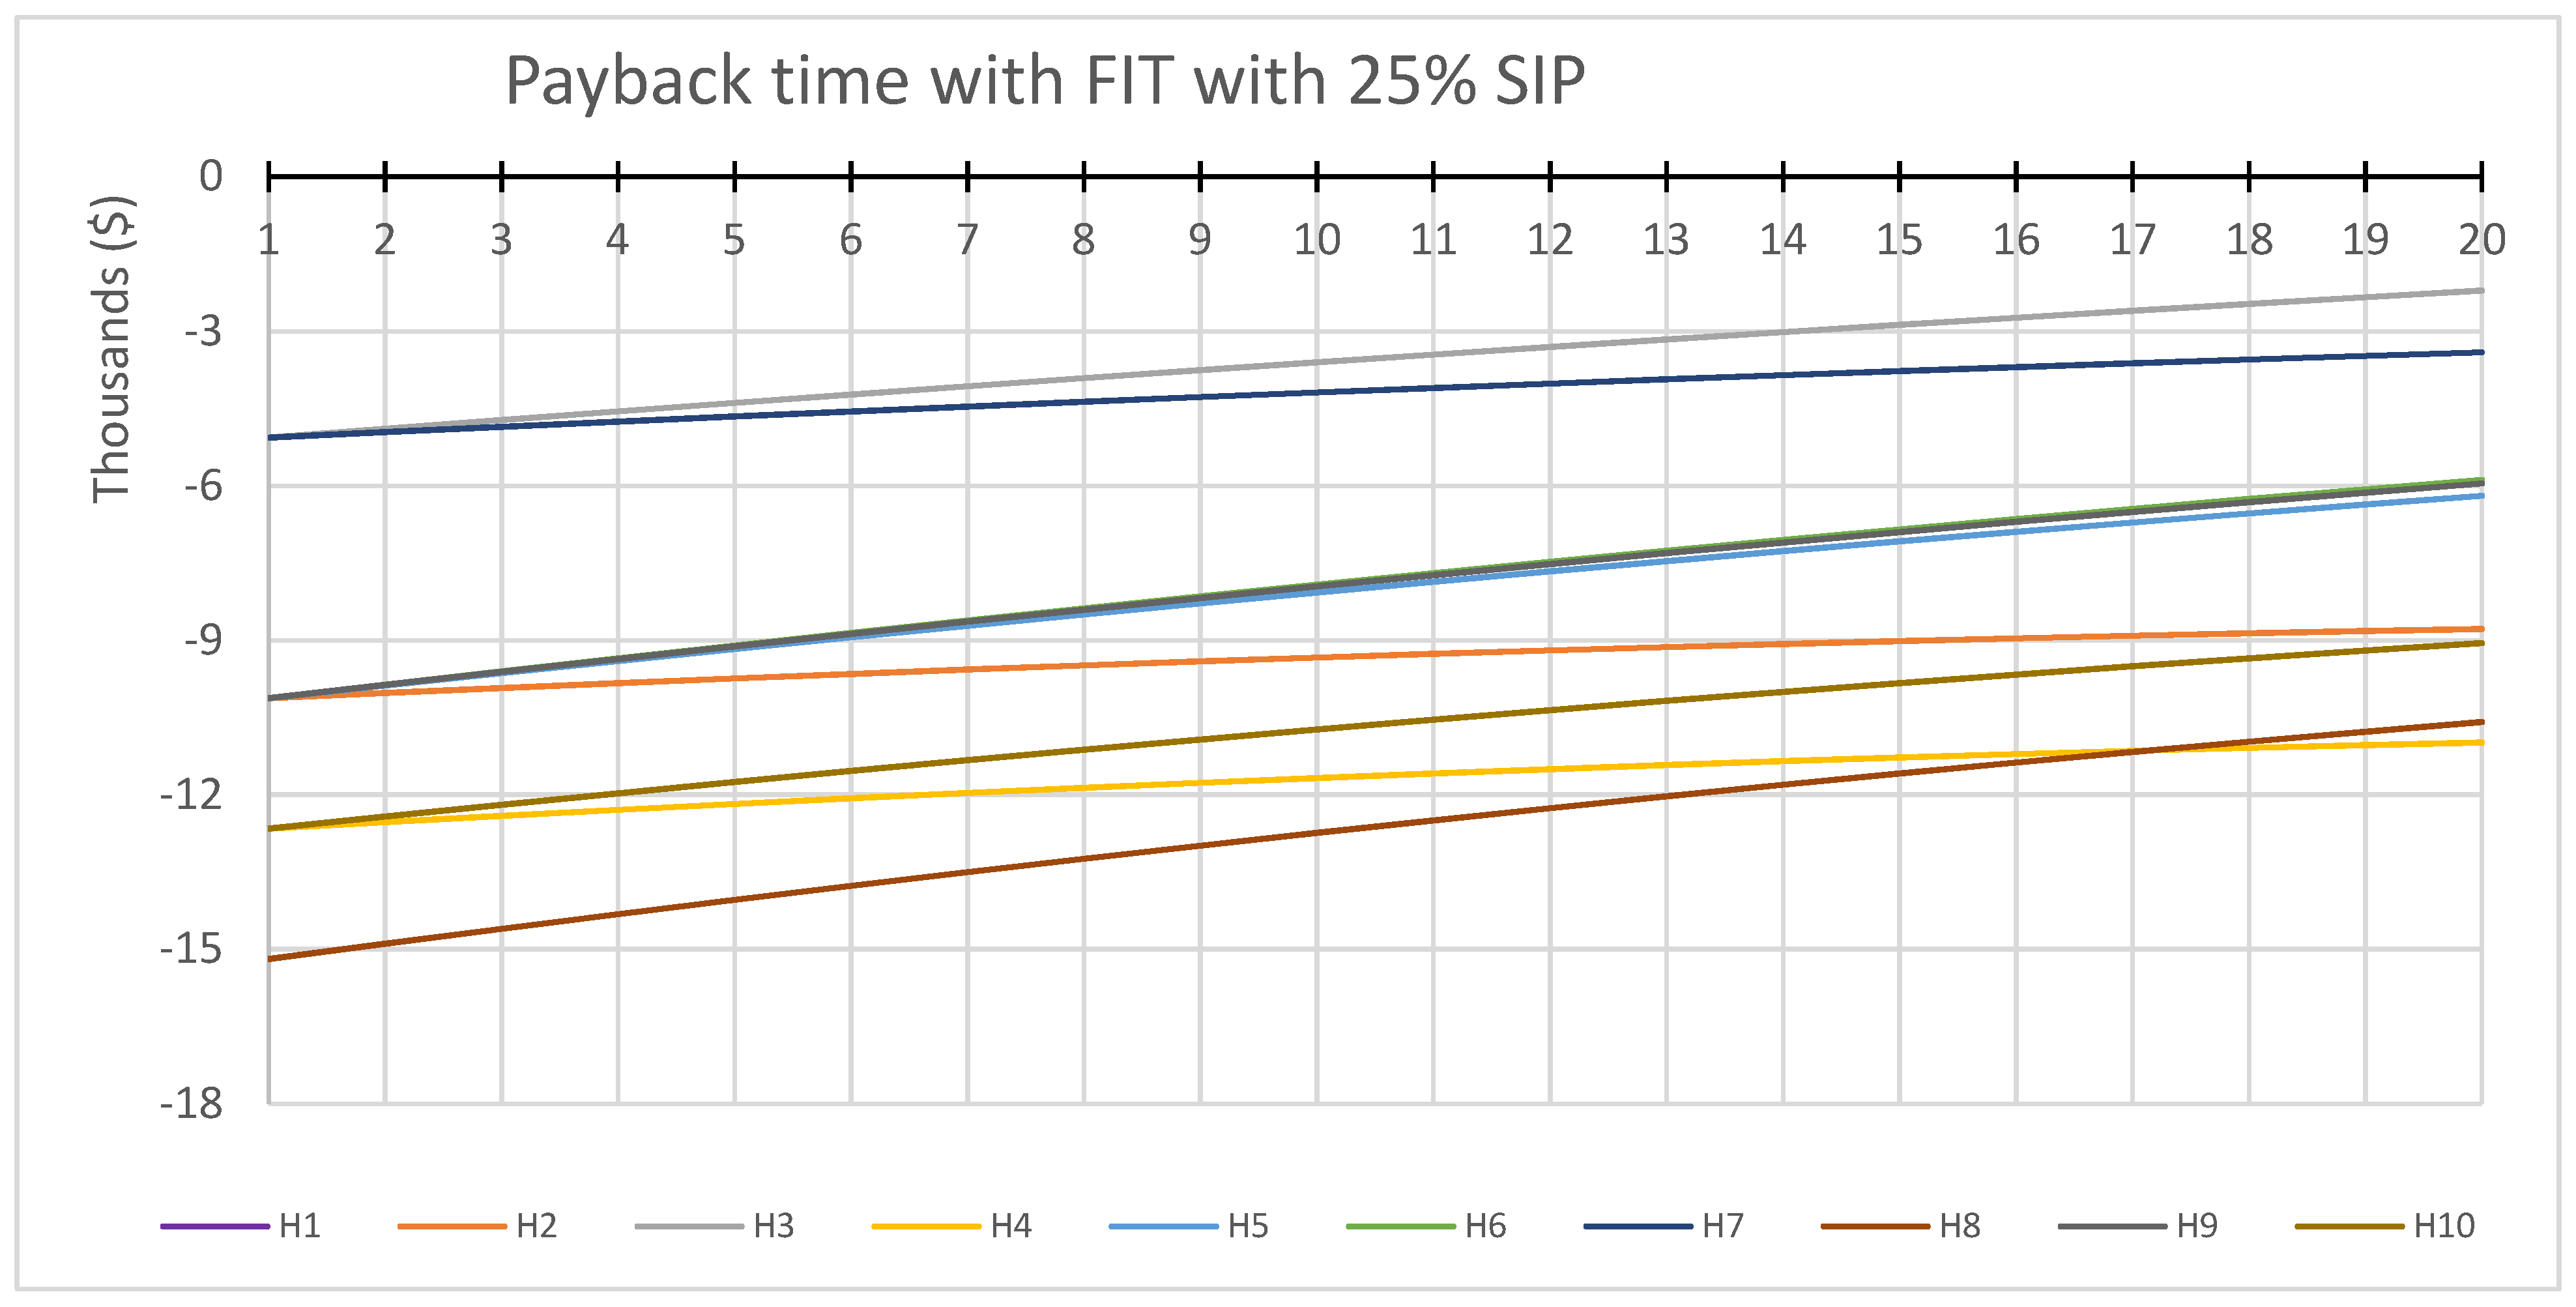
According to the IEA, the global average electricity price is USD 0.13/kWh for the residential sector [15]. In contrast, it is USD 0.049/kWh for the residential sector in Qatar, owing to the substantial subsidies provided by the local government. This circumstance presents a significant obstacle for the rooftop PV systems to be financially viable for household owners. Luckily, there are also incentive programs provided by the government, energy suppliers, and various organizations that support rooftop PV systems. In many cases, incentive programs and tax credits can cover well above 50% of the total installation cost in the USA [22]. To that end, we can investigate the impact of solar incentive programs in Qatar for 25%, 50%, and 75% of the installation cost. Figure 5 and Figure 6 demonstrate that for the Solar Incentive Program (SIP) under 25% and 50%, the rooftop PV systems in Qatar would not be economically viable, as the payback period exceeds the expected lifespan of the system.
Figure 7 demonstrates the impact of a 75% SIP on the payback period of rooftop PV systems. Table 6 presents an economic analysis of this scenario. The results show that the payback year’s range is from 7 to 12 years. Houses 2 and 4 have a longer payback period due to high power consumption. All their generated PV energy is self-consumed at an energy price equivalent to the highly subsidized low grid electricity unit prices. House 3 has the highest total savings because they have higher investment, as reflected by the higher system capacity. Furthermore, houses that can afford to sell more power at higher selling energy prices tend to have higher return rates and investment rates.
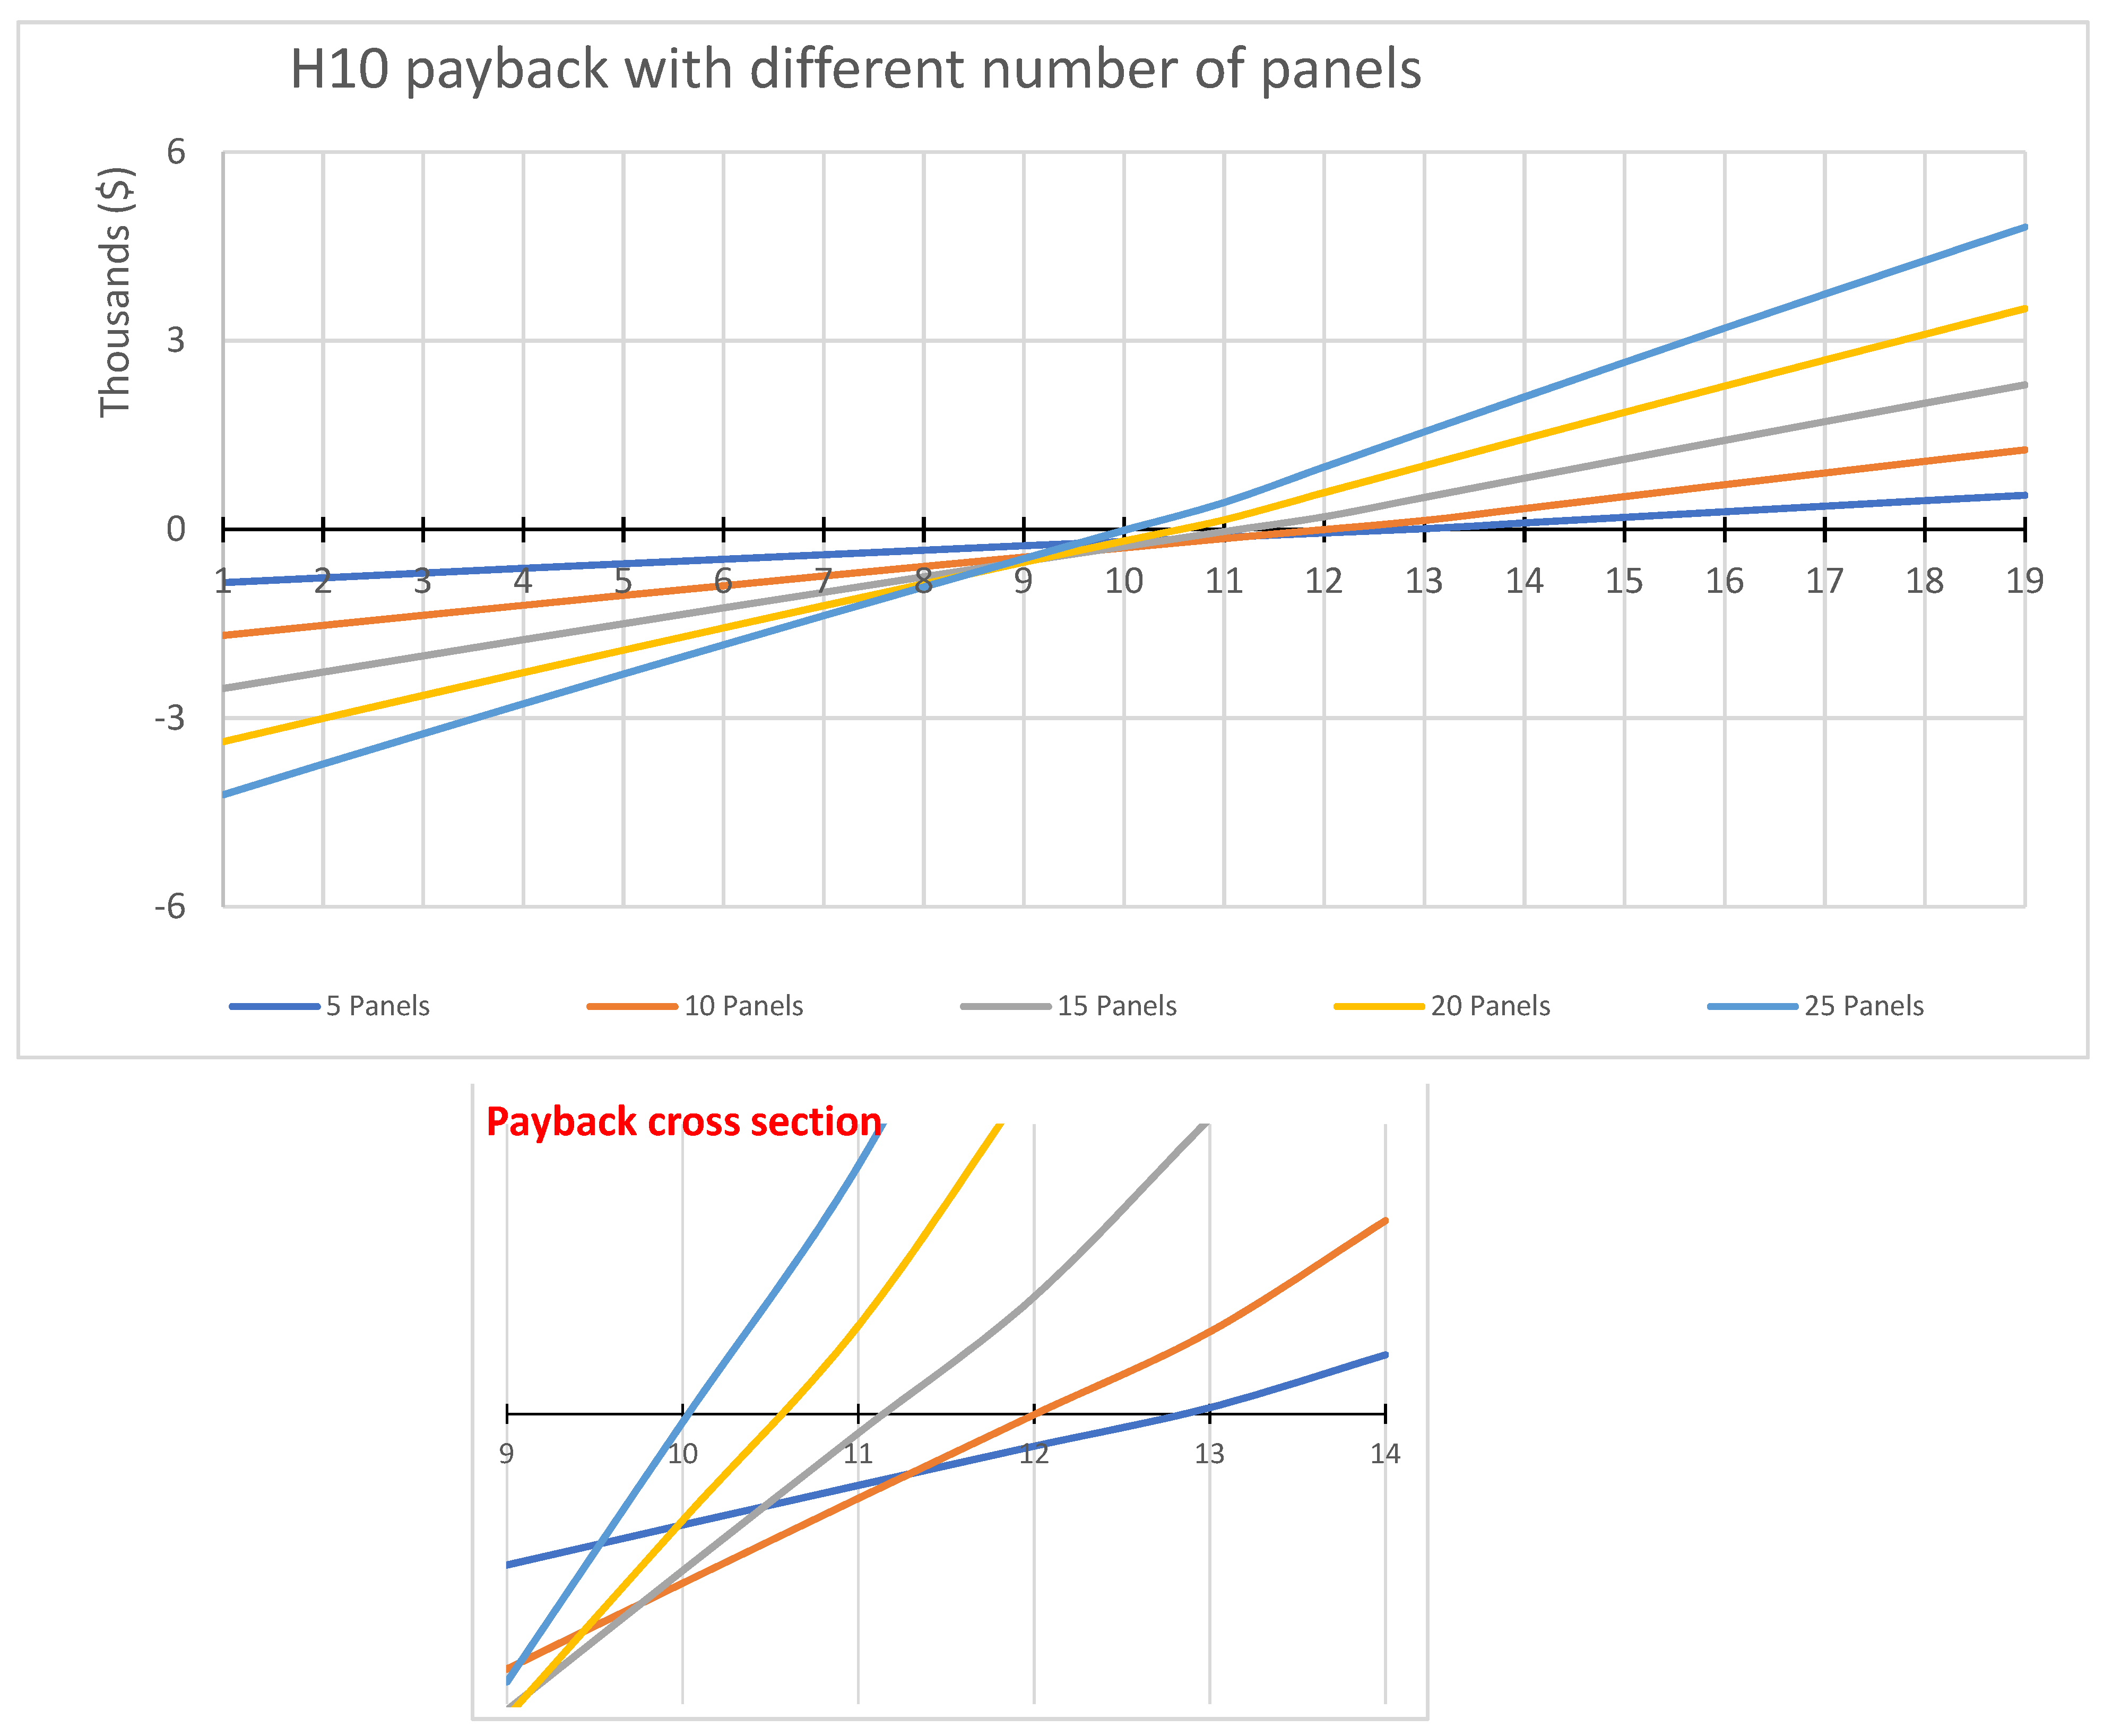
The following scenario investigates the impact of changing the number of panels on the economic viability of the PV system in house number 10, as demonstrated in Figure 8. The results become more apparent after observing the results in Table 7. The system becomes more profitable as the number of panels increases and the self-consumption ratio decreases, indicating that the ratio favors sold surplus energy, more valuable under the circumstances of the study. Globally, the energy prices sold to the grid are competitive with the energy prices from the power suppliers. Therefore, if the price of the sold energy is lower, the results of the impacts of the system size would be different.
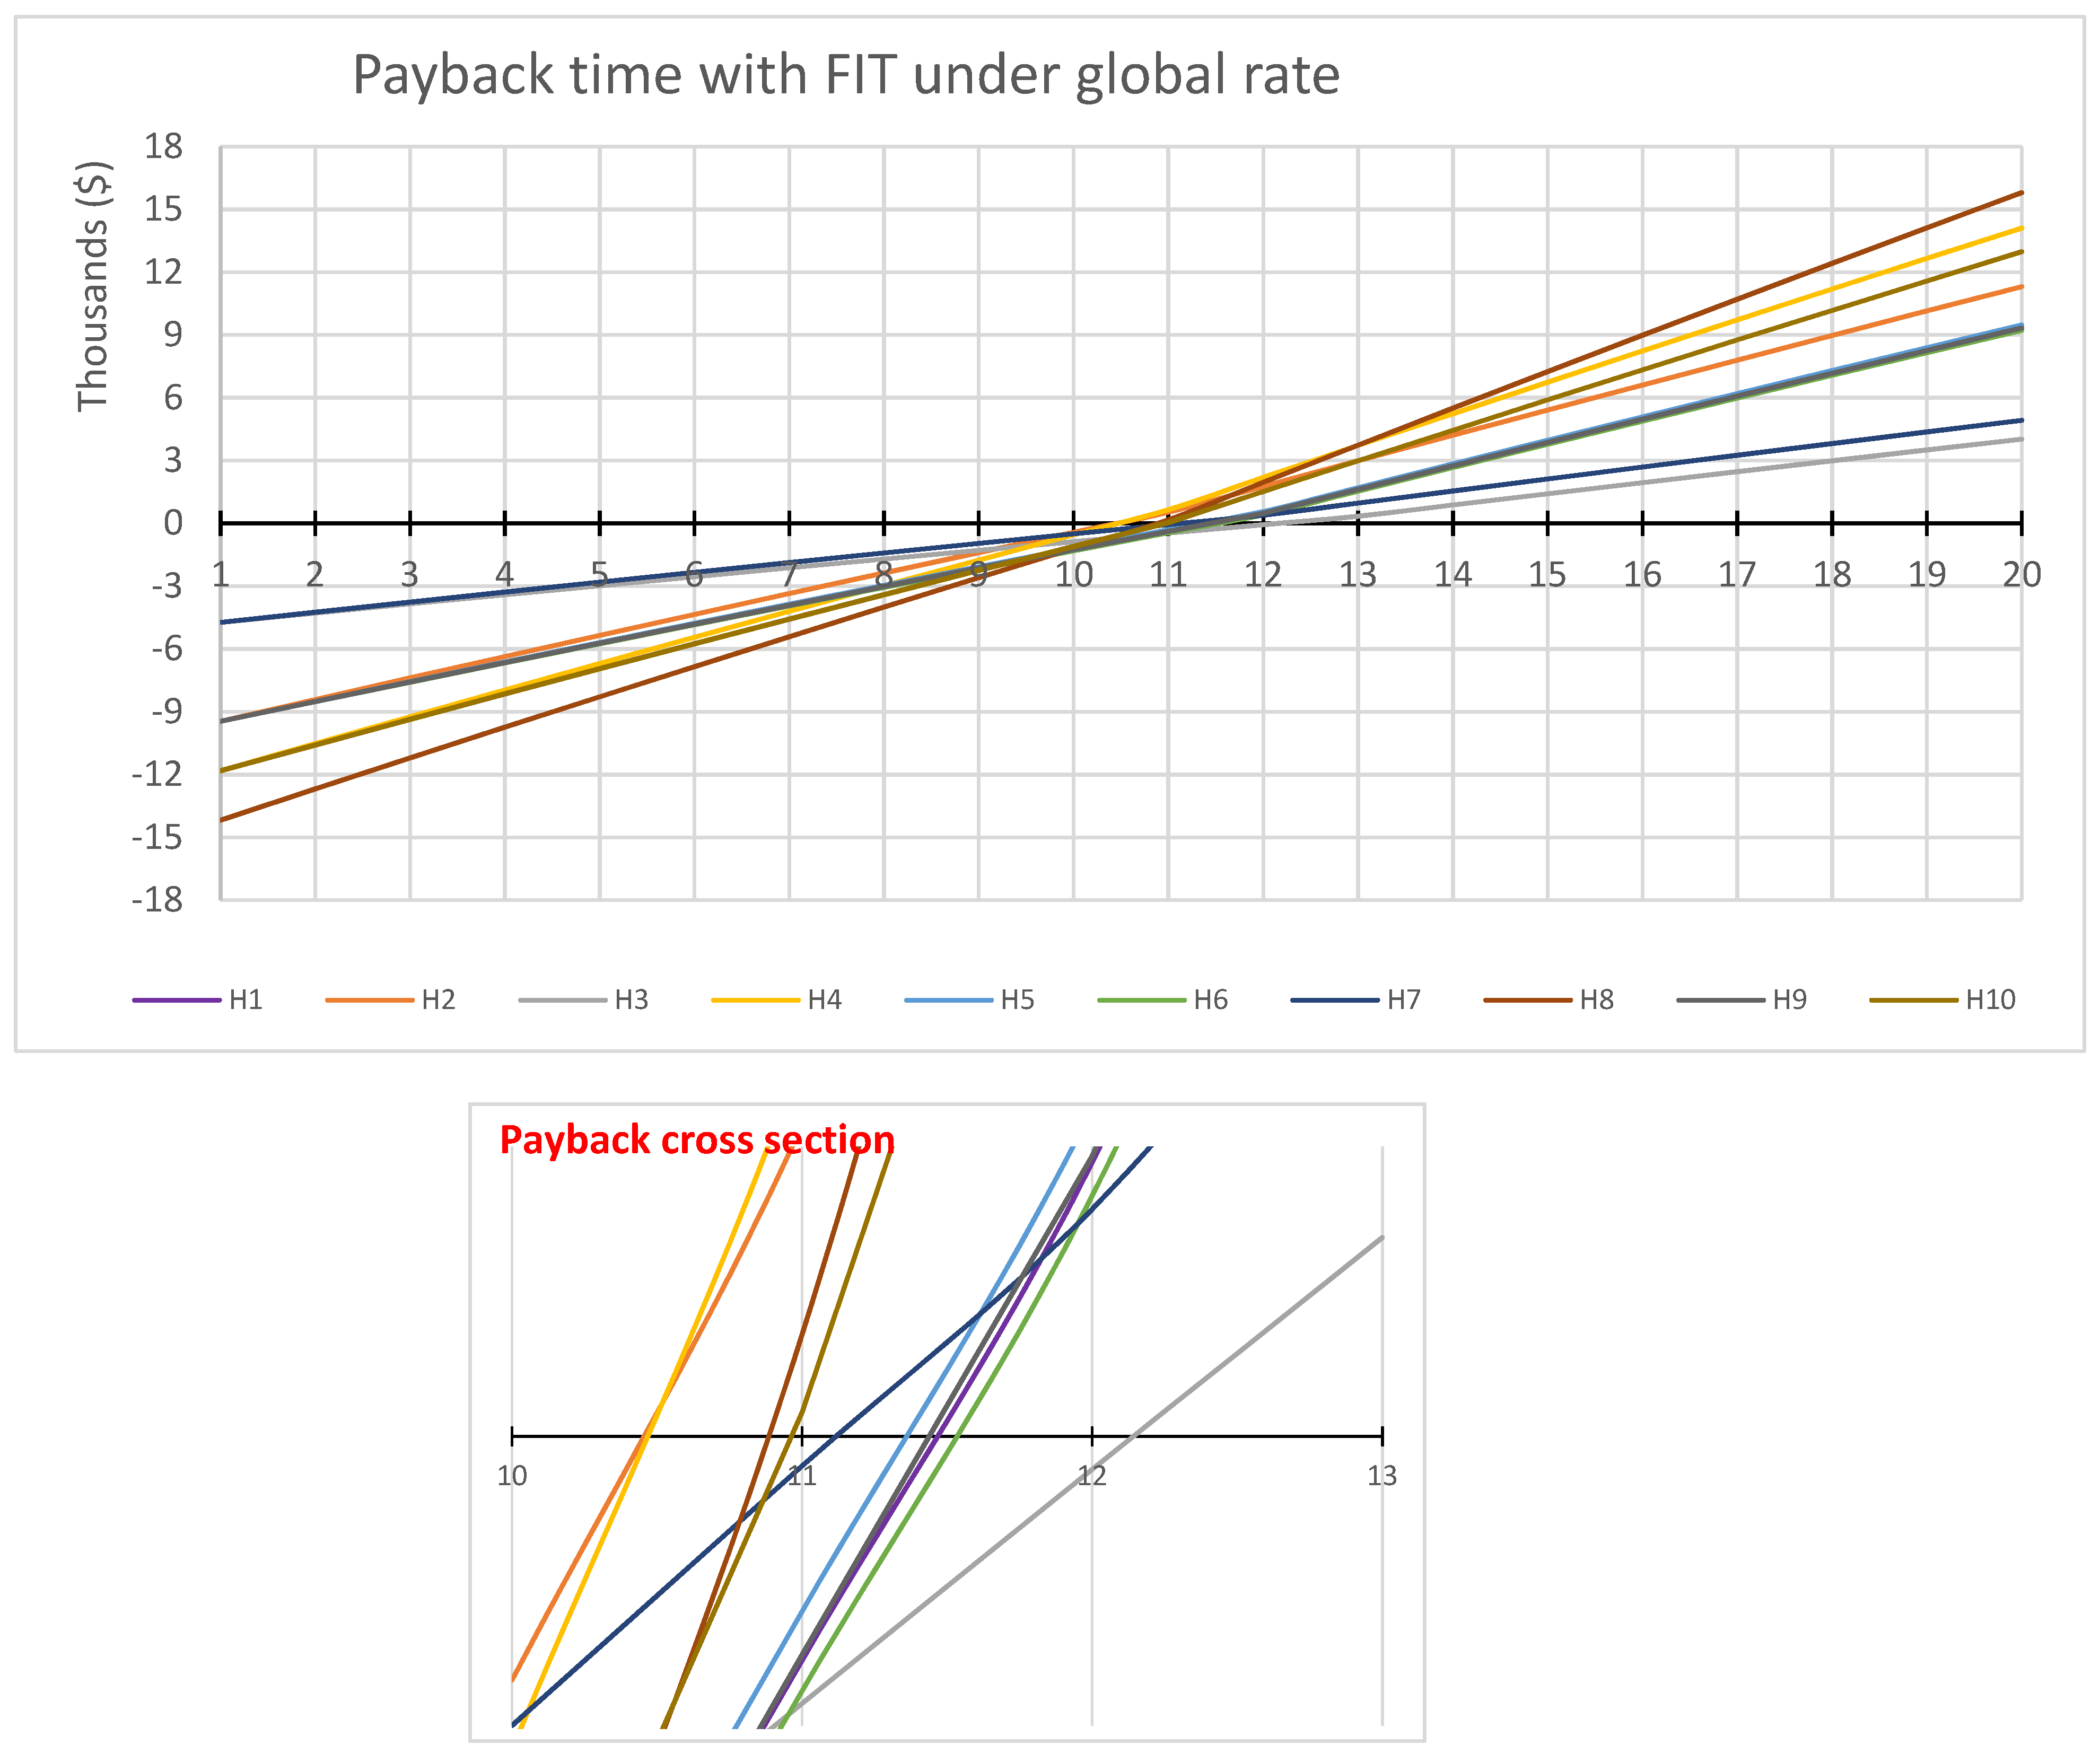
Electricity prices have been consciously rising in Qatar, and the following scenario demonstrates the impact of applying average global electricity rates on the model while decreasing the SIP to approximately 30%. Figure 9 and Table 8 demonstrate the impact of decreasing the subsidies and SIP on the economic viability in Qatar.

3.2.2. Economic Viability of Rooftop PV Systems without Energy Storage and Feed-In Tariff in Qatar

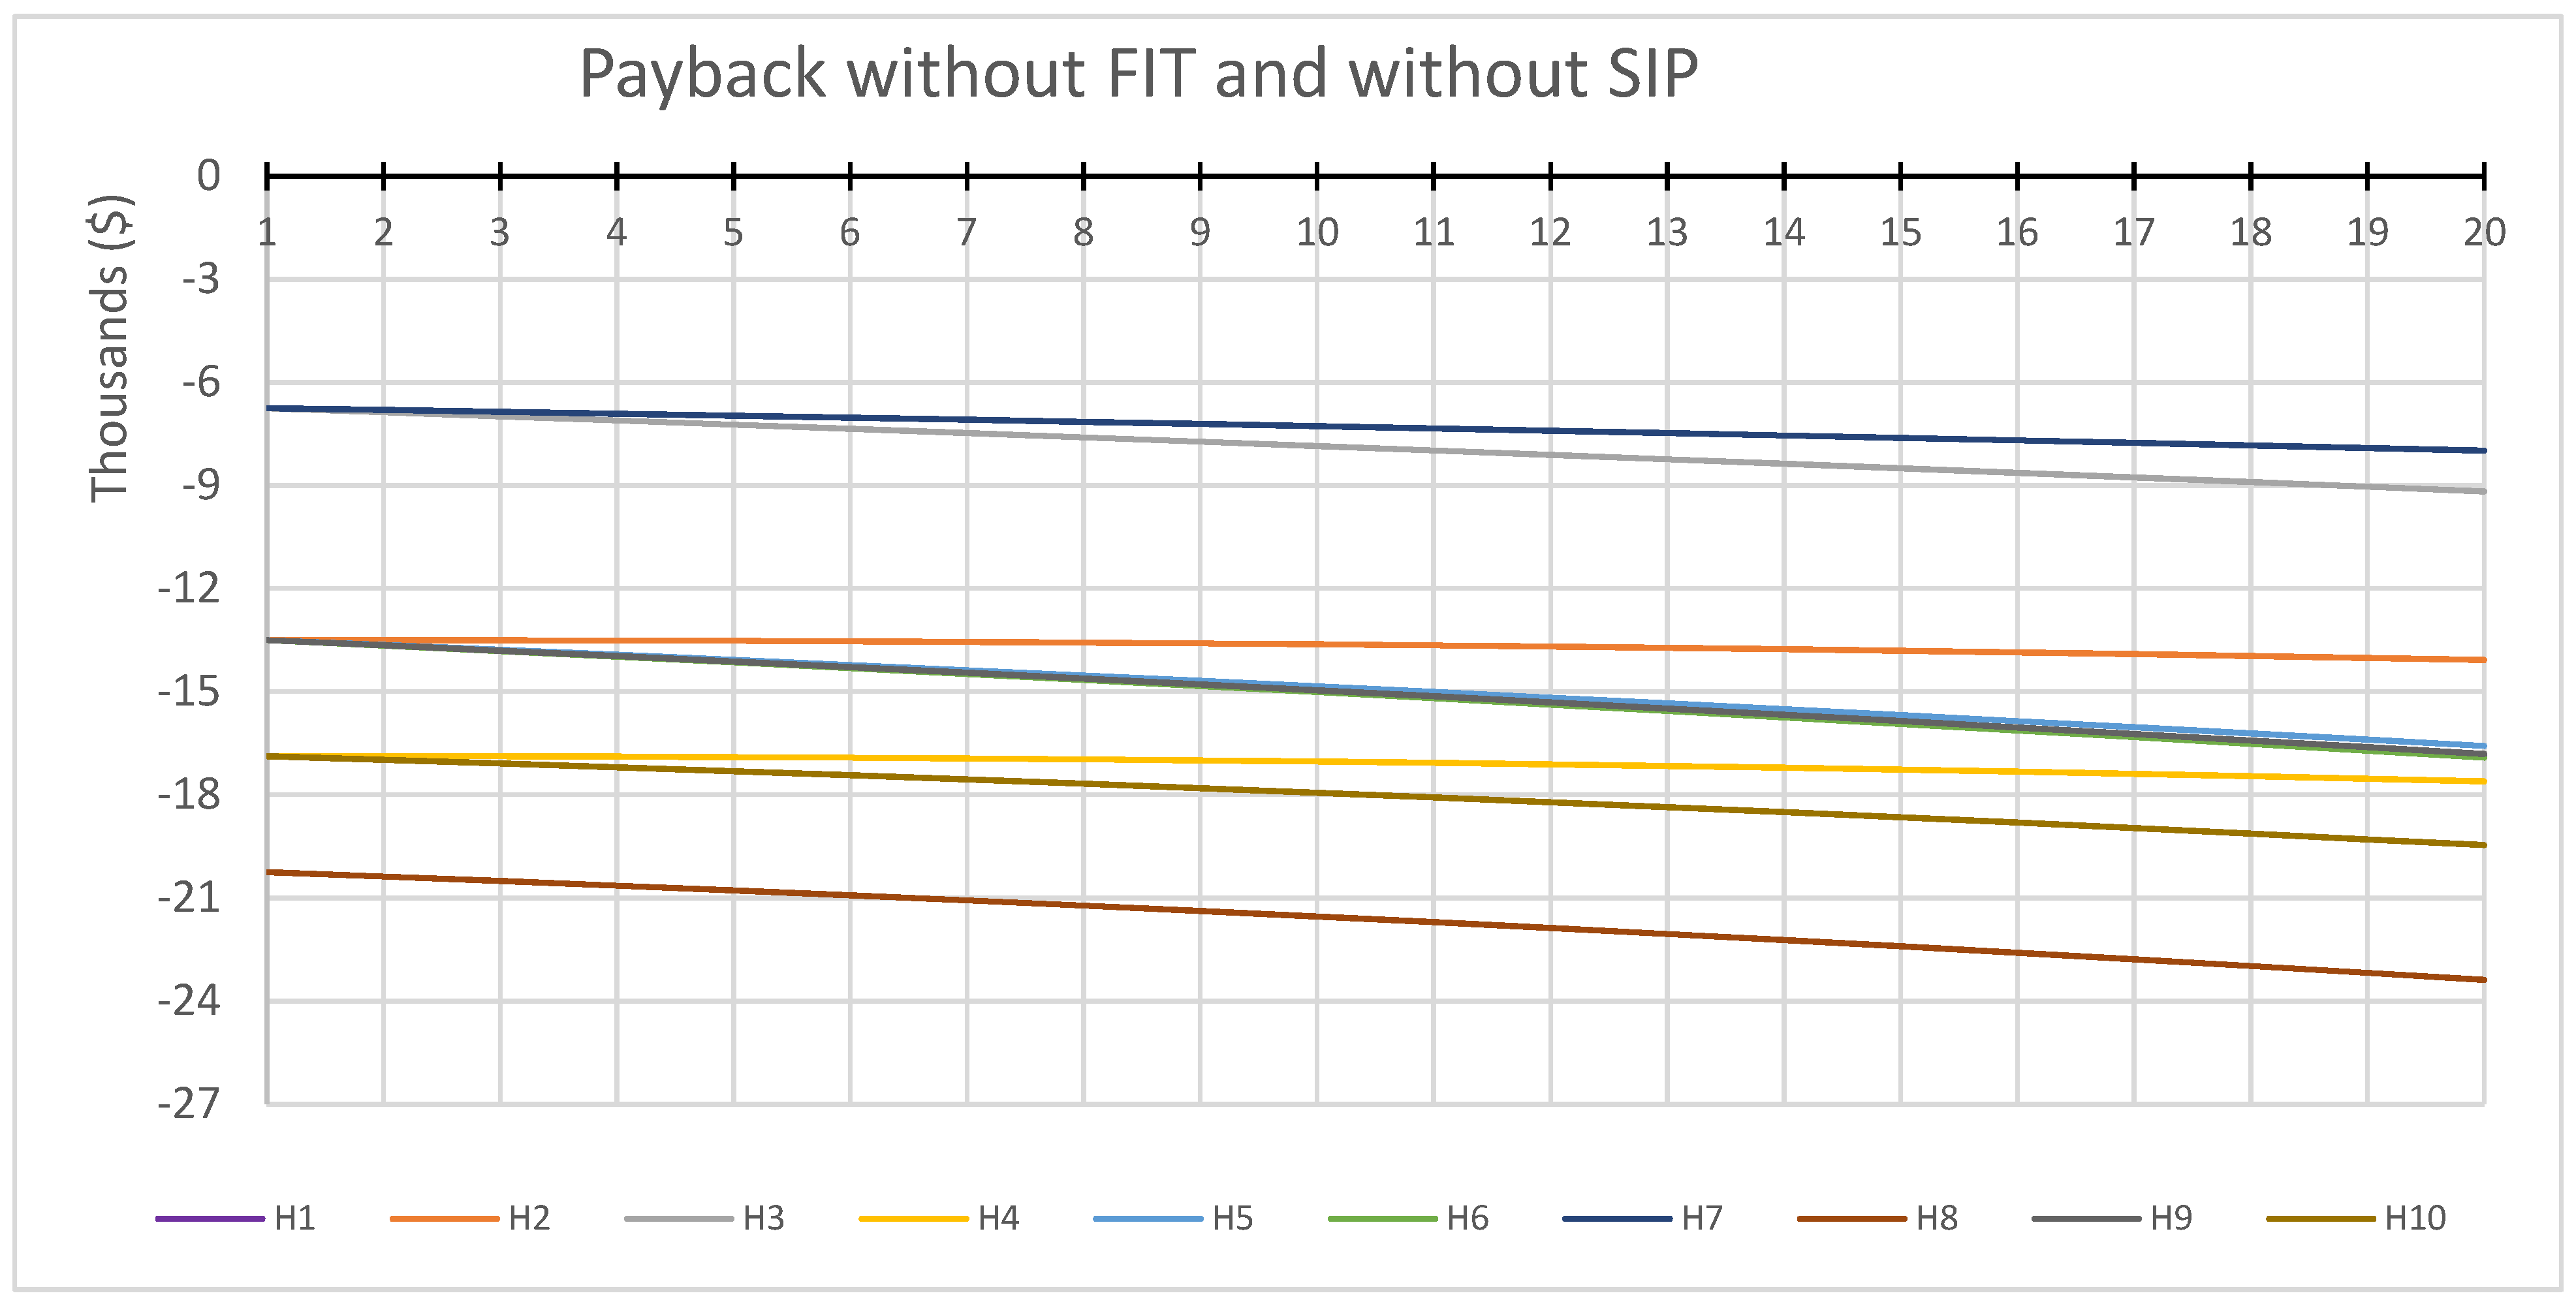
Currently, FIT schemes are not yet supported in Qatar. Therefore, those who wish to install rooftop PV systems have to shoulder the total installation cost. Moreover, the system is at a continuous financial deficit with the operational cost and low return value, as demonstrated in Figure 10.
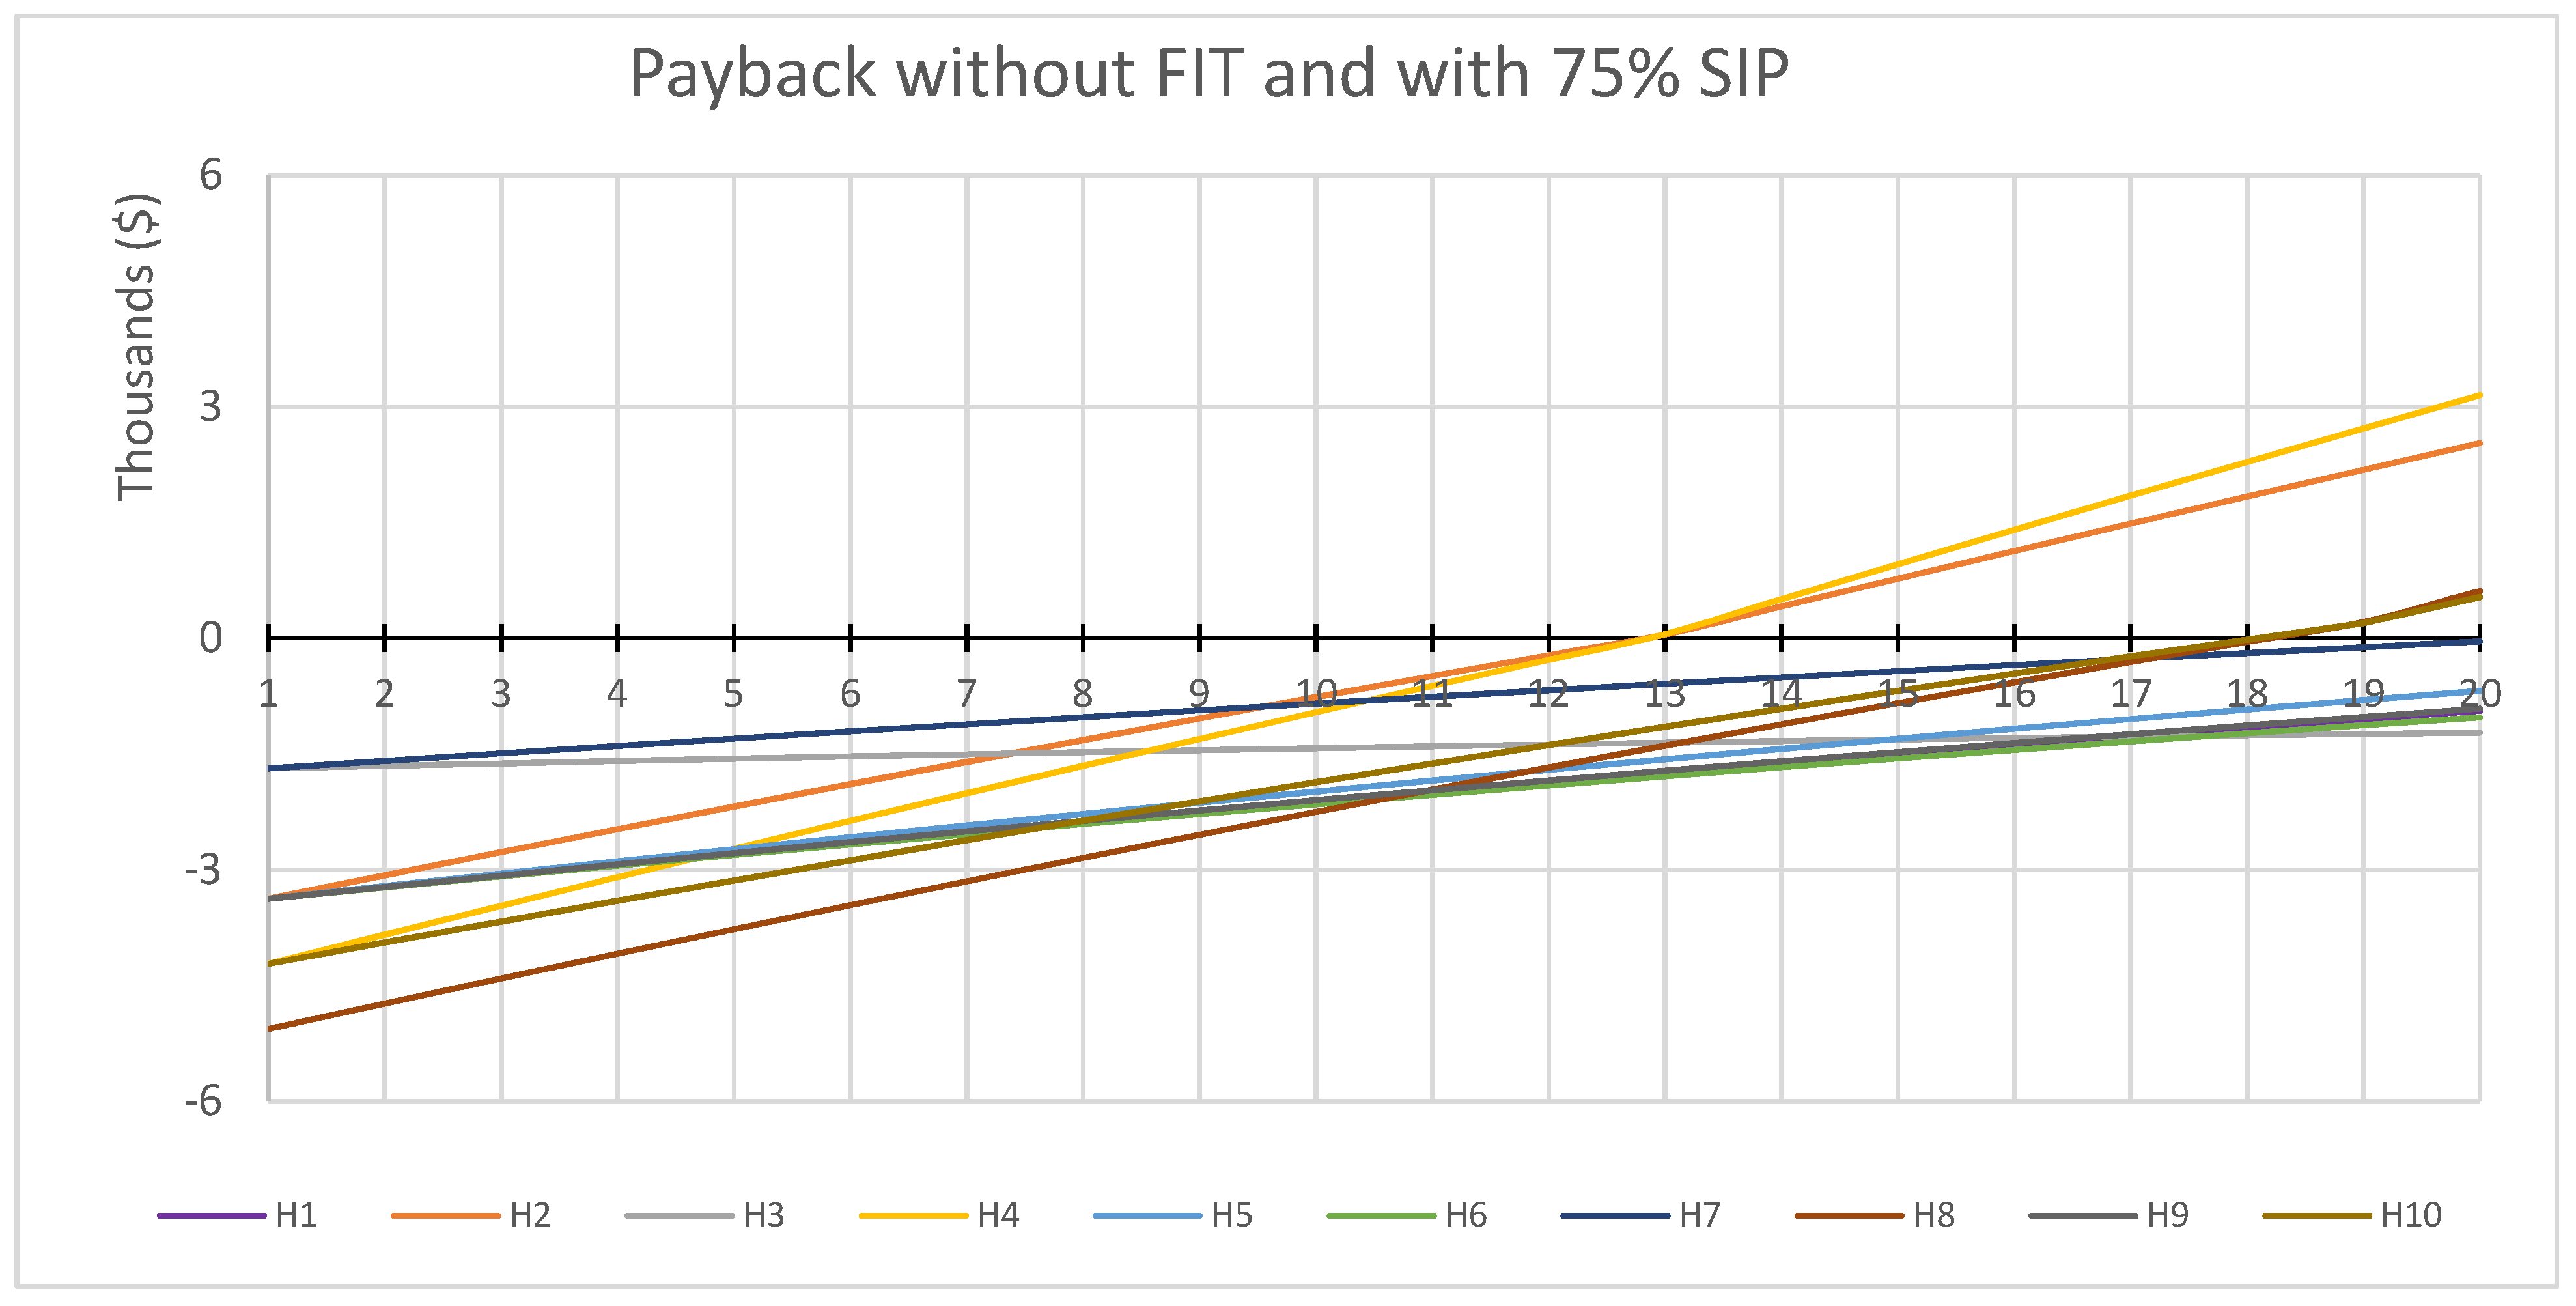
Even with 75% SIP support, the payback periods are too long for the system to be profitable, as demonstrated in Figure 11. This indicates the precedence and urgency for the FIT scheme application in Qatar. This application includes grid infrastructure adjustment, residential electricity metering adjustment, and policy initiation.

3.2.3. Economic Viability of Rooftop PV Systems with Energy Storage

This section discusses the economic viability of using energy storage for low self-consumption and surplus energy production, especially during winter, when the load demands are at their lowest values. The energy storage requirements for houses H1, H3, H5, H6, H7, and H9 were calculated. Houses H2, H4, H8, and H10 are omitted, as they have high loads and high self-consumption values throughout most of the year. Therefore, energy storage would not apply to these houses.
Moreover, in contrast to the previous case studies, the number of panels was adjusted to provide a more comprehensive result. It was determined that installing rooftop PV systems with energy storage is not economically viable for these houses under current circumstances. These houses face the same issue as other houses with high self-consumption owing to electricity subsidies, and they also replace less of the electricity supplied by the utility. While it is true that some of the houses examined will require smaller and cheaper PV system sizes, the addition of the storage system will dramatically increase the price of the system. Solar energy storage systems exist mainly in batteries, costing on average USD 400 to 700/kWh [23], depending on the type of batteries.
Moreover, the lifespan of the batteries ranges from 5 to 15 years, which means the energy system will require replacement once or more over the lifespan of the PV module, estimated to be 20 to 30 years. These results pose a dilemma, as it may not be economically viable for a low-income family to acquire energy storage systems. Moreover, the peak electricity consumption in Qatar takes place in summer afternoons. Hence, the energy storage units do not appear to play a critical role in peak reduction applications. Finally, solar energy storage works best when Qatar has not yet introduced a time-of-use scheme. As a result, the load can be shifted and consumed easily during low electricity costs. All these factors add financial burdens that lead to the conclusion that solar energy storage in Qatar is not economically viable, as the payback period will exceed the system’s lifespan by a substantial duration. Therefore, different business models are required, including utility companies’ operation of shared storage units to manage excess demands and overvoltage issues in specific parts of the network.
The PV production load profiles provided in the previous section are essential in distribution system planning and operation as they reveal the amount of power that will be sent back to the grid. Moreover, the results show consumption patterns in Qatar are highly dependent on weather conditions and that changes in PV production do not change proportionally with changes in power demand; this is further elaborated in our previous studies [7,24]. Moreover, electricity is a must in Qatar for comfortable living, especially in summers. Hence, potential blackouts from bidirectional power flows must be minimized. One practical approach is to use energy storage units to store excess energy from PV production. Owing to the high capital costs, energy storage systems need to be optimally sized to meet the predefined objectives. The size of the storage units can be determined based on a confluence of drivers, including the size of the PV system, electricity prices, and consumption factors. In the case of Qatar, certain barriers are facing PV adoption: (1) electricity prices are mostly subsidized and are too low as compared to international benchmark prices; (2) there are no financial rebate programs for the promotion of PV systems; and (3) most residents are expats, who stay in the country for a short amount of time. Therefore, new business models are needed, and PV and storage systems are likely to be owned and operated by the utility company. This study assumes that storage units are sized to minimize the average reverse power flow.
After calculating the self-consumption values, important information regarding the potential and viability of energy storage can be deduced. The self-consumption rates reflect the percentage of PV production consumed locally. Table 9 summarizes all the self-consumption values and ratios from Equation (1) for all houses from the available monthly data. After analyzing the results, we can deduce H2, H4, H8, and H10 have high load demand during peak hours and consume all the PV production during most months, making energy storage redundant. The immediate solution is to increase the number of panels; however, there are limiting factors to consider, including the cost and the available rooftop space.
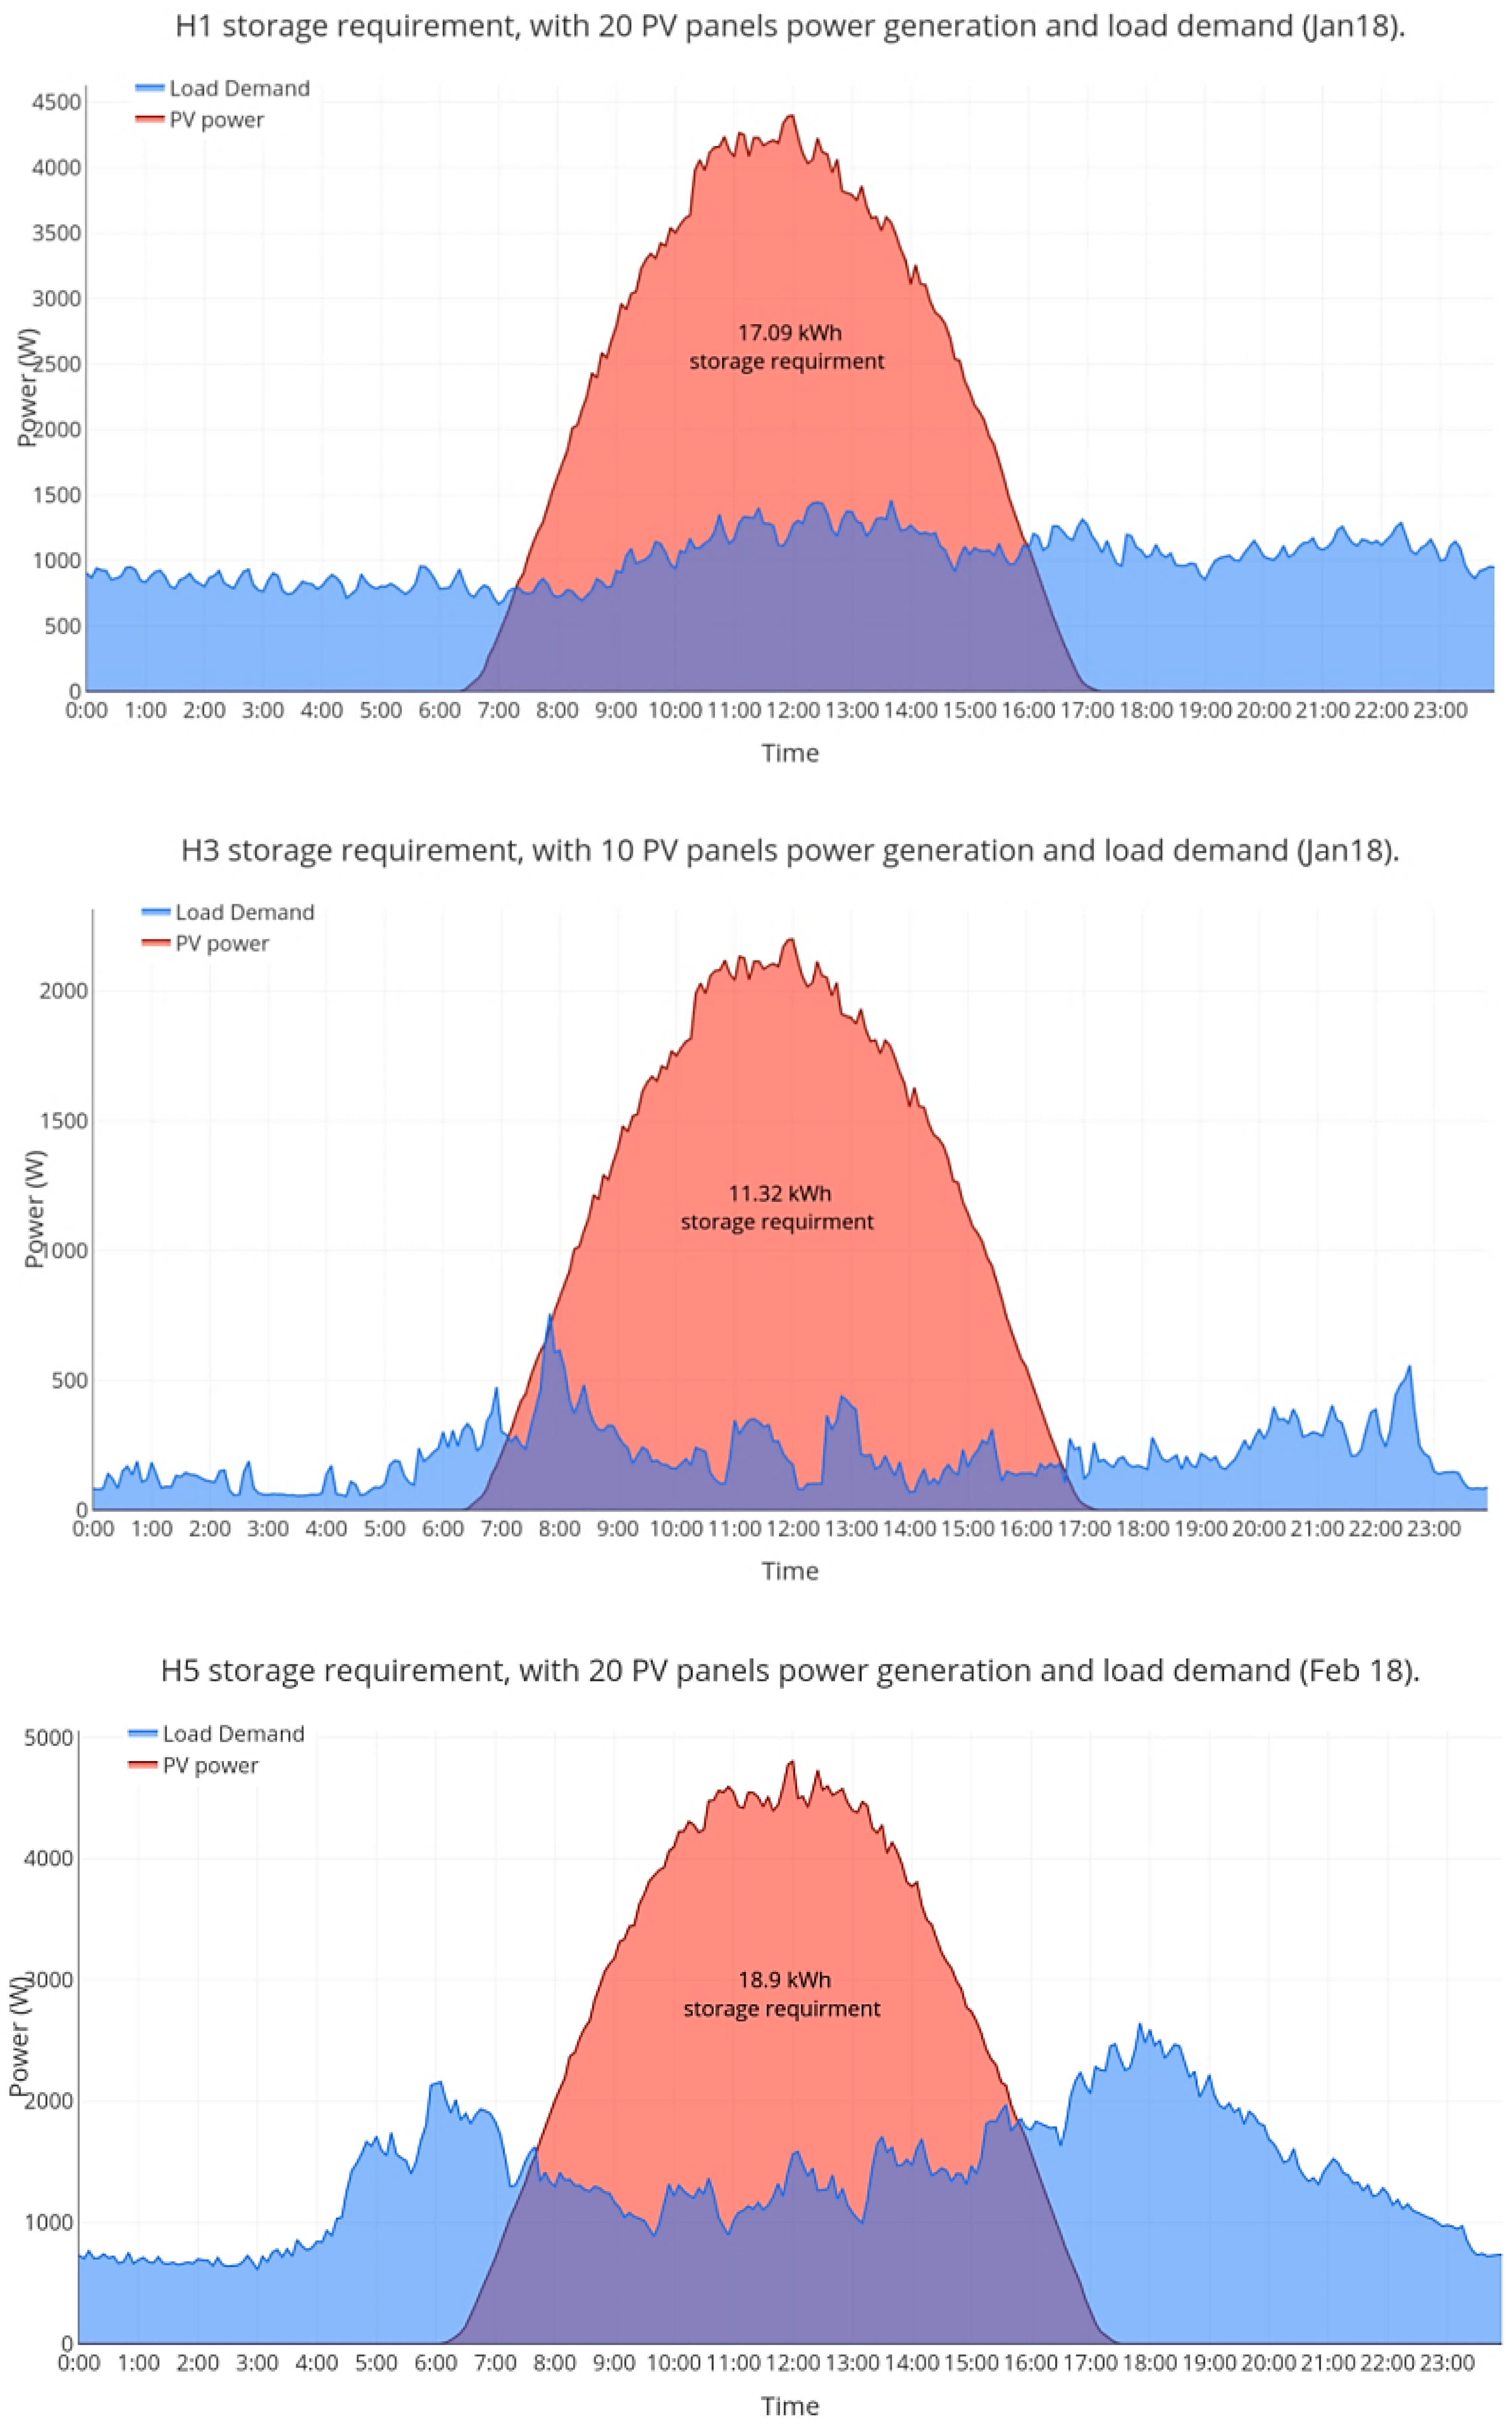
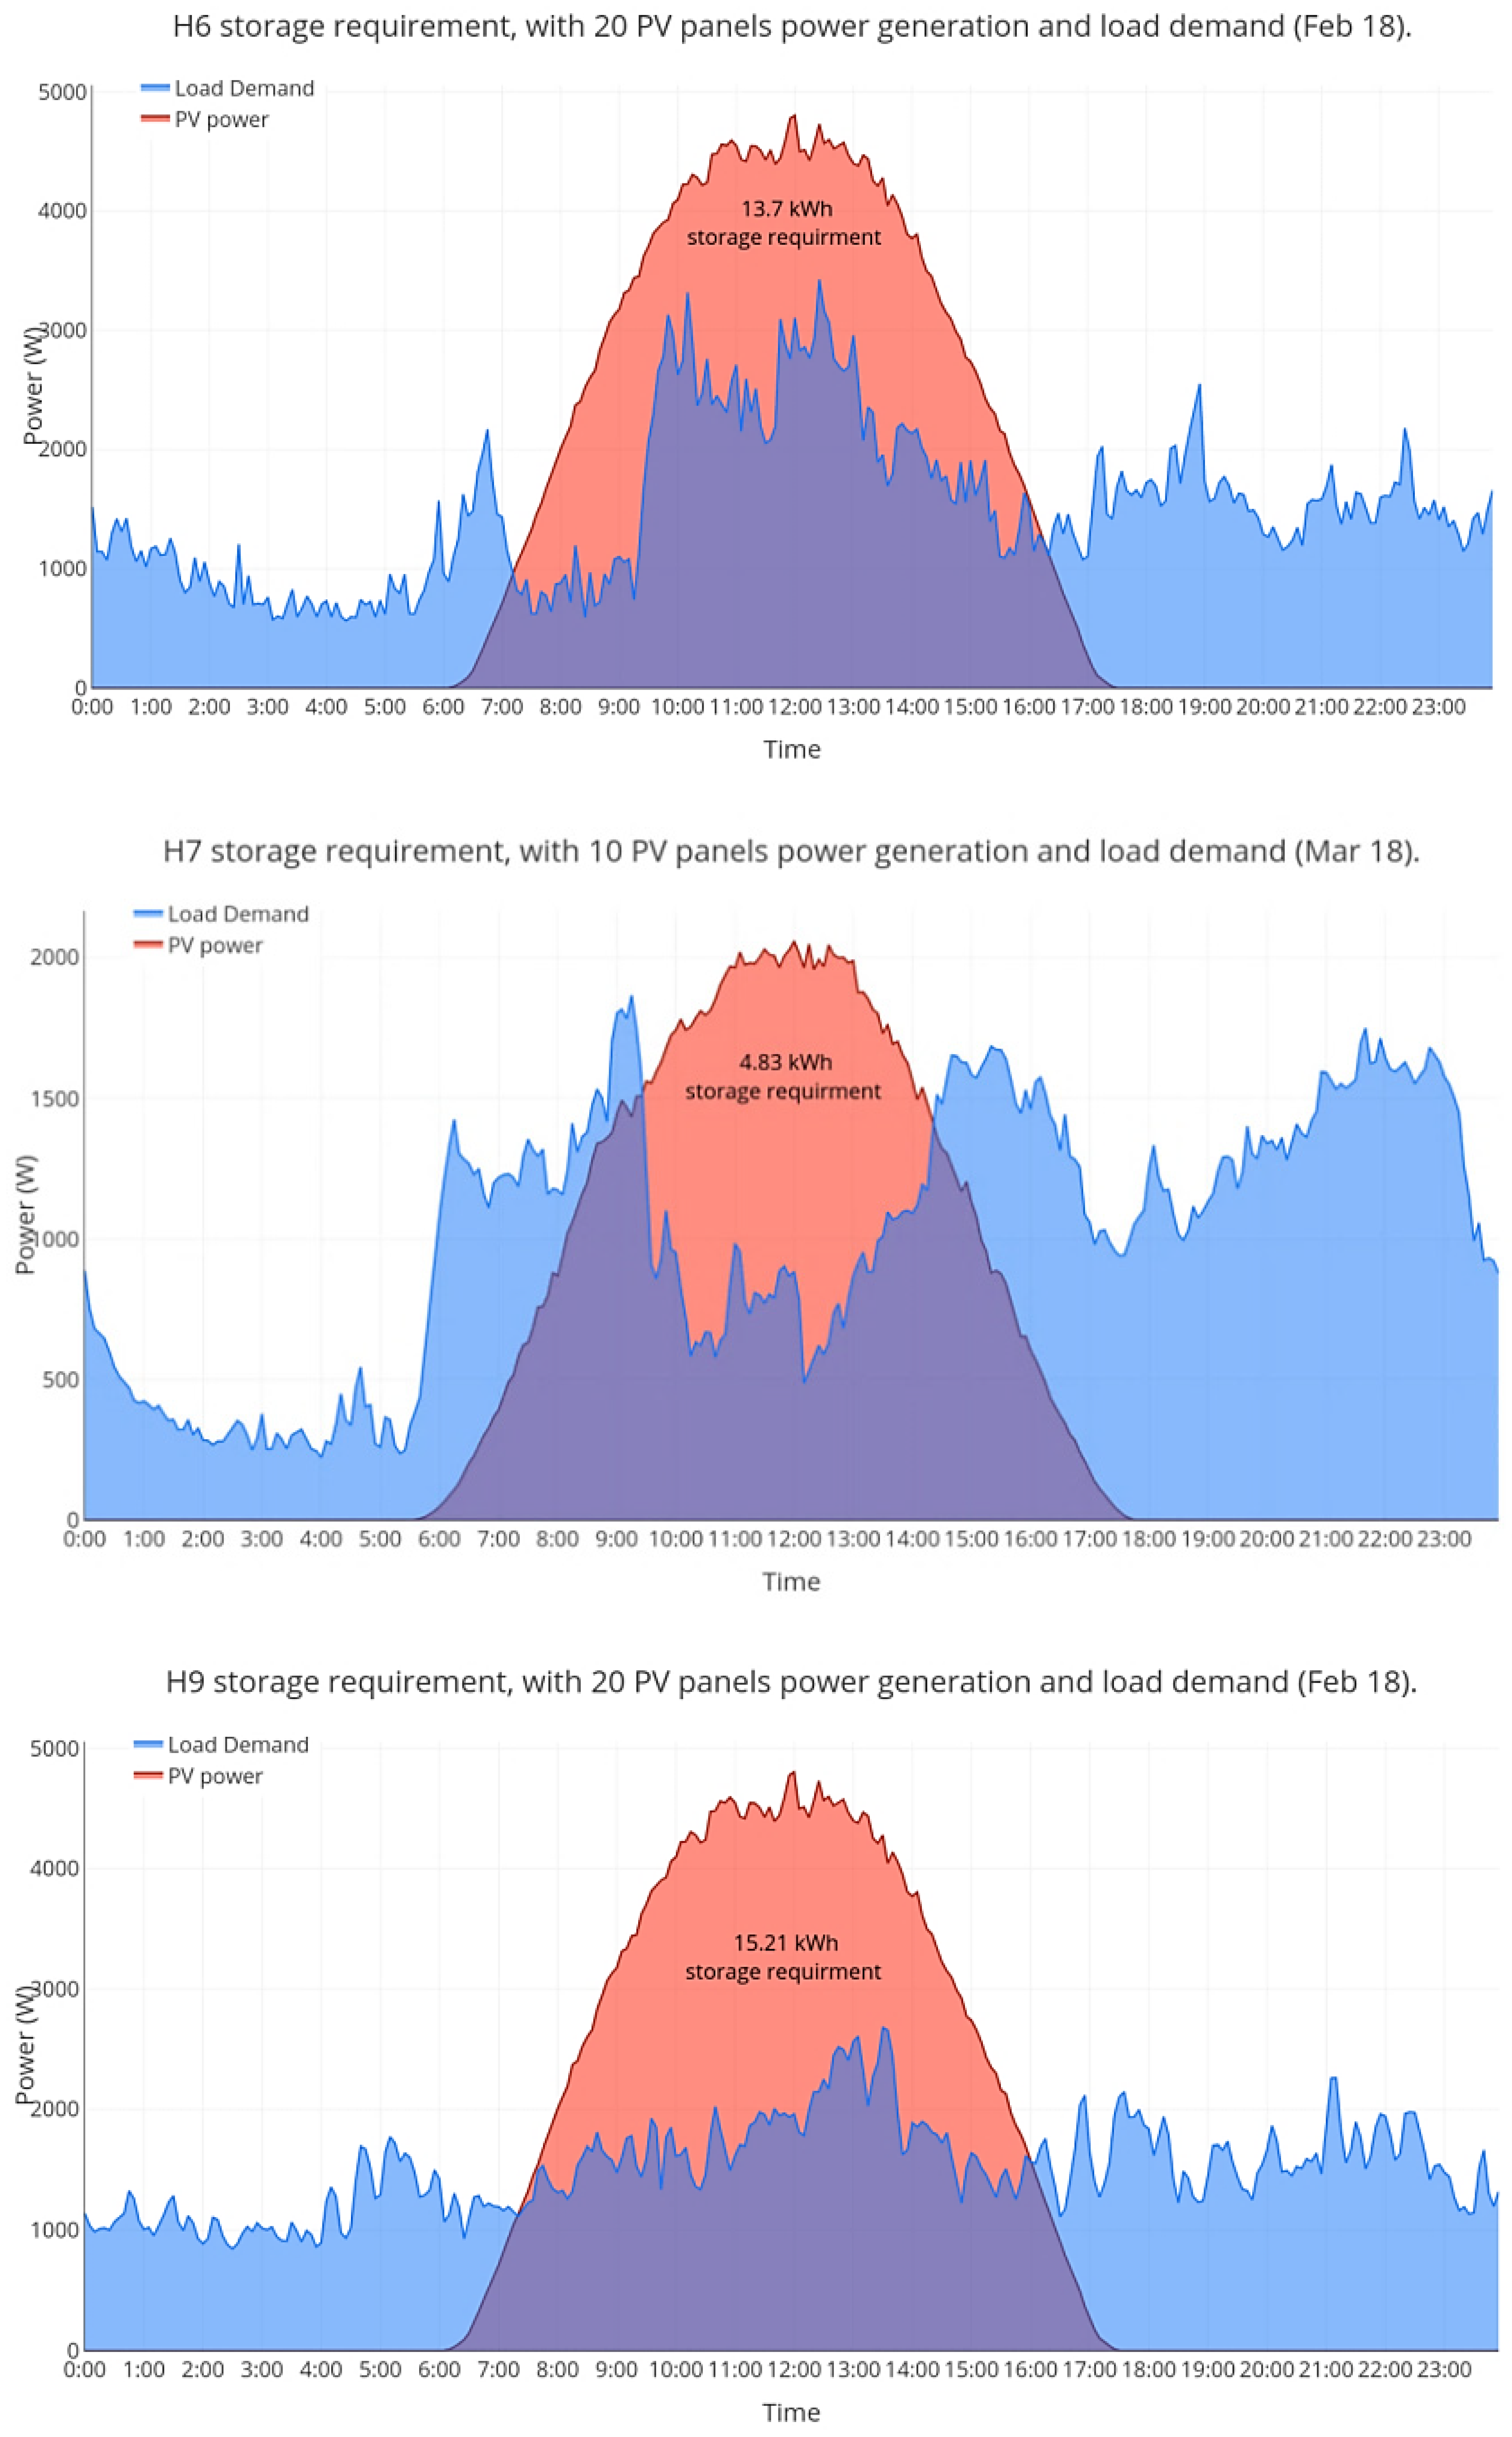
As for the remaining houses, we can deduce the maximum storage size requirement by choosing the month with the lowest value of self-consumption, often found during a cold month with low load demand. By plotting the load demand against the PV power generation, the surplus area of PV generation on the top of the load demand represents the power that can be stored or sold back to the grid. As selling PV-generated power back to the grid is not yet a viable option in Qatar, all the surplus power should be stored for later use. It is noteworthy to mention that we chose 20 panels of PV generation for all the houses, except for H3, owing to its small rooftop area and small overall load demand; therefore, for H3, it would have been illogical to choose 20 PV panels. Typically, 12-volt batteries are used to store PV energy; Table 10 summarizes the maximum energy size requirement for the selected houses in Ampere hours (Ah), with a 20% safety factor increase to the actual size requirement. The storage requirements, PV generation, and load demands for houses H1, H3, H5, H6, H7, and H9 are shown in Figure 12.

3.2.4. Economic Viability of Rooftop PV Systems with Feed-In Tariff in Qatar

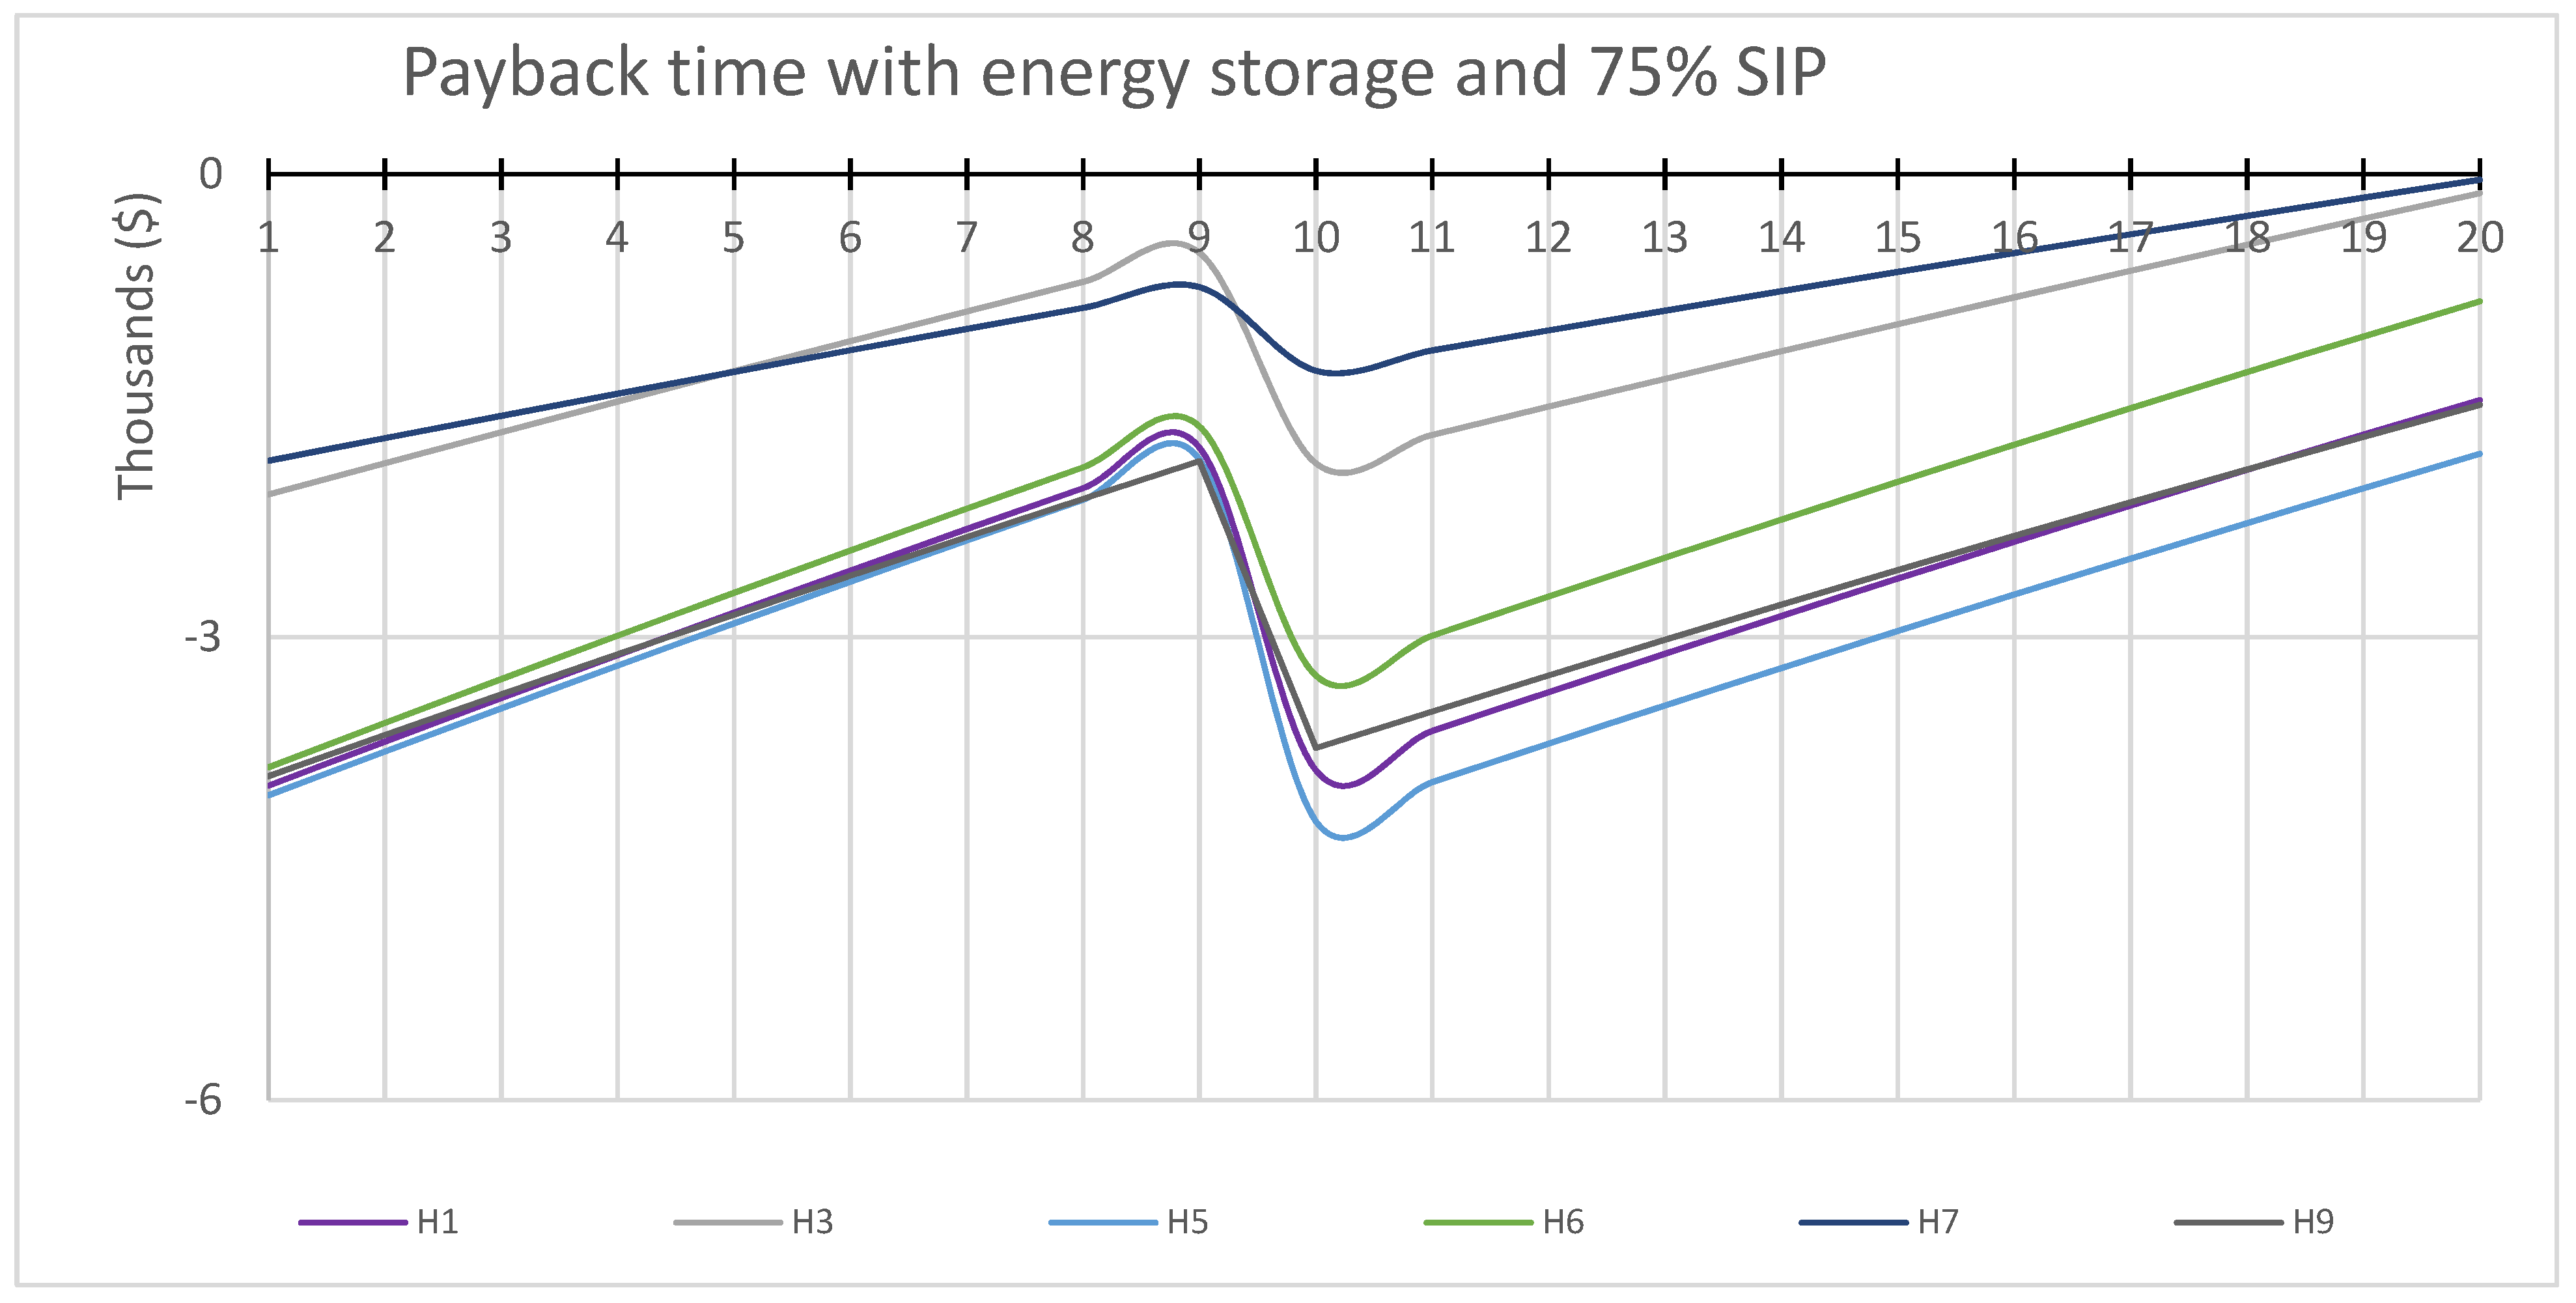
Applying the economic model to houses H1, H3, H5, H6, H7, and H9 with 75% SIP and the storage costs presented in Table 10, we yield the results as demonstrated in Figure 13. Notably, the storage cost is also subjected to the SIP, as it is part of the cost; moreover, it is applied twice, as the lifespan of the storage system is assumed to be ten years. The results indicate that storage systems are not profitable in Qatar, as the payback period is beyond the PV system lifespan. As suggested in the previous section, the alternative is to introduce a FIT. In his study, Zahedi (2012) [25] also attempted to develop a method that accurately estimates the price of a FIT for power generated from PV systems in Qatar.

3.3. Policy Implications

Globally, renewable energy adoption is overgrowing; it is dependent on the regulatory and incentive framework. In GCC countries, renewable energy adoption is lacking, owing to the highly subsidized energy tariffs, lack of taxes, and legal frameworks for accessing grid power policies such as FITs and net metering. Moreover, both grid electricity and fossil fuels are highly subsidized and are challenging to compete economically. In addition to the lack of taxation, there is no carbon pricing mechanism. Finally, Qatari households are relieved from paying electricity bills. However, we have already established that household owners would be more attracted to residential PV systems if they were more competitive with electricity tariffs. Other reasons which would incentivize household owners to deploy rooftop PV systems and that policy and decision-makers should consider are: (1) falling costs of PV systems, owing to technology maturity; (2) introduction of carbon taxes; (3) reduction in electricity and fuel subsidies; (4) adapting FITs and net metering; (5) introduction of dynamic electricity pricing; and (6) exploiting the peer effect, also known as the “neighborhood effect,” by offering financial incentives to increase rooftop PV system adoption. In her study [9], Mohandes showed how residential PV adoption is strongly influenced by introducing a carbon tax, falling costs of PV systems, reduction in electricity subsidies, and extension of an electricity tariff to Qatari households. Similar studies from the GCC countries have similar results; both Alhammami [26] and Alsabbagh [27] investigate the potential of rooftop PV systems in their respective countries and highlight the restrictive role the energy subsidies play on the development of residential rooftop PV systems. Similarly, the same can also be said about Elbeheiry [8] and Mohandes’ [9] results that investigate rooftop PV systems’ potential in Qatar. However, the results presented in this study further indicate that storage systems at their current cost and technology are not suitable for the region. Solar PV should be utilized during peak and high-demand hours or should target heat ventilation and air conditioning systems that represent most of the total load.
The insights into the results of this study can serve as a steppingstone for decisions and policymakers. Government policies, investment costs, and risks are expected to be the main factors underpinning the future growth utilization of renewable and sustainable energy sources. This study helps understand the residential load profiles and the factors that impact their implementation and use. Additionally, this study gives insights into the economic viability of residential rooftop PV systems in Qatar. It falls in the hands of decisions and policymakers to implement national laws, policies, and actions to enable the deployment of residential rooftop PV systems. Careful planning and precautions in terms of the technical, economic, and social viability of rooftop PV system deployment must be considered before initiation. The results of this study encourage a review of the current electricity tariffs and electricity subsidies if rooftop PV systems are to be implemented on a large scale.

4. Conclusions

Qatar has a lack of studies addressing the viability of rooftop PV systems and solar energy storage systems and the feasibility of FITs. Although similar research studies in Qatar and GCC investigate the viability of rooftop PV and energy storage systems, this study uses three collected datasets of PV generation, load profiles, and households’ socioeconomic information. The datasets were then combined and analyzed using several economic indicators to conclude the economic viability of the PV systems. In comparison, the viability of the storage was tested with the help of calculating the self-consumption ratios. Self-consumption data were calculated and provided valuable insights regarding how each house consumed the PV-generated power. In our study, we installed energy monitors in 10 households carefully selected to mimic the residential classifications in Qatar; data were collected over a year-long period. GHI data were obtained from a solar test facility to create PV generation profiles. The main economic indicator, the payback period of PV systems, provided insights into the economic viability of PV systems in Qatar. According to our results, FIT and SIP schemes must be implemented to enable and endorse rooftop PV systems in Qatar. Energy storage systems are unfeasible and economically unacceptable, as they would push the payback period far past the system’s lifespan. Furthermore, cheap electricity prices and energy subsidies pose a dire challenge to the economic viability of PV systems. Further insights indicate favorable utilization of demand side management techniques and energy policies that encourage self-use of the generated PV power and selling the surplus rather than storing it.

Author Contributions

Conceptualization, O.A. and I.S.B.; methodology O.A. and I.S.B.; software, O.A.; validation, O.A., I.S.B., M.K. and S.G.A.-G.; formal analysis, O.A. and I.S.B.; investigation O.A. and I.S.B.; resources, O.A., M.K. and I.S.B.; data curation, O.A. and I.S.B.; writing—original draft preparation, O.A.; writing—review and editing, O.A., I.S.B., M.K. and S.G.A.-G.; visualization, O.A.; supervision, I.S.B., M.K. and S.G.A.-G.; project administration, O.A., I.S.B., M.K. and S.G.A.-G.; funding acquisition, I.S.B. All authors have read and agreed to the published version of the manuscript.

Funding

This research received no external funding. Scholarship was provided by Hamad Bin Khalifa University, Qatar Foundation to Omar Alrawi.

Institutional Review Board Statement

The study was conducted according to the guidelines of the Declaration of Helsinki, and approved by the Institutional Review Board of Qatar Biomedical Research Institute (IRB Project Number: 2018-020 and date of approval: 06 June 2018).

Informed Consent Statement

Informed consent was obtained from all subjects involved in the study.

Data Availability Statement

Not applicable.

Conflicts of Interest

The authors declare no conflict of interest.

References

  1. Meltzer, J.; Hultman, N.E.; Langley, C. Low-Carbon Energy Transitions in Qatar and the Gulf Cooperation Council Region. SSRN Electron. J. 2014. [Google Scholar] [CrossRef]
  2. Sahin, E.S.; Bayram, I.S.; Koc, M. Demand side management opportunities, framework, and implications for sustainable development in resource-rich countries: Case study Qatar. J. Clean. Prod. 2019, 241, 118332. [Google Scholar] [CrossRef]
  3. Miller, R. Qatar, Energy Security, and Strategic Vision in a Small State. J. Arab. Stud. 2020, 10, 122–138. [Google Scholar] [CrossRef]
  4. Kahramaa. Sustainability Report 2016; Kahramaa: Doha, Qatar, 2016; Available online: https://www.km.com.qa/MediaCenter/Publications/Kahramaa_Sustainability_Report_2016.pdf (accessed on 25 September 2019).
  5. Crabtree, G.; Misewich, J.; Ambrosio, R.; Clay, K.; DeMartini, P.; James, R.; Lauby, M.; Mohta, V.; Moura, J.; Sauer, P.; et al. Integrating Renewable Electricity on the Grid. AIP Conf. Proc. 2011, 19, 387–405. [Google Scholar] [CrossRef] [Green Version]
  6. Wu, R.; Wolsink, M.; Bu, M.J. Social acceptance of renewable energy innovation: An introduction to the concept. Energy Policy 2007, 35, 2683–2691. [Google Scholar] [CrossRef] [Green Version]
  7. Alrawi, O.; Bayram, I.S.; Al-Ghamdi, S.G.; Koç, M. High-Resolution Household Load Profiling and Evaluation of Rooftop PV Systems in Selected Houses in Qatar. Energies 2019, 12, 3876. [Google Scholar] [CrossRef] [Green Version]
  8. Elbeheiry, N.; Amer, A.; Elgazar, S.; Shukri, S.; Metry, M.; Balog, R.S. A Techno-Economic Study of Rooftop Grid-Connected Photovoltaic-Energy Storage Systems in Qatar. In Proceedings of the 2020 47th IEEE Photovoltaic Specialists Conference (PVSC), Calgary, AB, Canada, 15 June–21 August 2020; pp. 2730–2736. [Google Scholar] [CrossRef]
  9. Mohandes, N.; Sanfilippo, A.; al Fakhri, M. Modeling residential adoption of solar energy in the Arabian Gulf Region. Renew. Energy 2019, 131, 381–389. [Google Scholar] [CrossRef]
  10. Wittenberg, I.; Blöbaum, A.; Matthies, E. Environmental motivations for energy use in PV households: Proposal of a modified norm activation model for the specific context of PV households. J. Environ. Psychol. 2018, 55, 110–120. [Google Scholar] [CrossRef]
  11. Lu, L.; Yang, H.X. Environmental payback time analysis of a roof-mounted building-integrated photovoltaic (BIPV) system in Hong Kong. Appl. Energy 2010, 87, 3625–3631. [Google Scholar] [CrossRef]
  12. Wilson, R.; Young, A. The Embodied Energy Payback Period of Photovoltaic Installations Applied to Buildings in the UK. Build. Environ. 1996, 31, 299–305. [Google Scholar] [CrossRef]
  13. Knapp, K.; Jester, T. Empirical investigation of the energy payback time for photovoltaic modules. Sol. Energy 2001, 71, 165–172. [Google Scholar] [CrossRef]
  14. IRENA. Power Generation Costs in 2017. 2018. Available online: https://www.irena.org/-/media/Files/IRENA/Agency/Publication/2018/Jan/IRENA_2017_Power_Costs_2018.pdf (accessed on 20 September 2019).
  15. IEA. World energy prices: An overview. 2019. Available online: https://webstore.iea.org/world-energy-prices-2019-an-overview%0AMore (accessed on 1 September 2019).
  16. Luthander, R.; Widén, J.; Nilsson, D.; Palm, J. Photovoltaic self-consumption in buildings: A review. Appl. Energy 2015, 142, 80–94. [Google Scholar] [CrossRef] [Green Version]
  17. Sunearthtools. Tools for Consumers and Designers of Solar. 2014. Available online: http://www.sunearthtools.com/dp/tools/pos_sun.php (accessed on 1 September 2019).
  18. Branker, K.; Pathak, M.J.M.; Pearce, J.M. A review of solar photovoltaic levelized cost of electricity. Renew. Sustain. Energy Rev. 2011, 15, 4470–4482. [Google Scholar] [CrossRef] [Green Version]
  19. Bank, Q.C. The Fortieth Annual Report Doha. 2016. Available online: http://www.qcb.gov.qa/English/Publications/ReportsAndStatements/AnnualReports/ (accessed on 1 September 2019).
  20. Investing.com. Qatar Government Bonds—Yields Curve. 2016. Available online: http://www.worldgovernmentbonds.com/country/qatar/ (accessed on 25 September 2019).
  21. Krane, J.; Hung, S.Y. Energy Subsidy Reform in the Persian Gulf: The End of the Big Oil Giveaway. 2016. Available online: https://www.bakerinstitute.org/media/files/research_document/0e7a6eb7/BI-Brief-042816-CES_GulfSubsidy.pdf (accessed on 1 September 2019).
  22. N.C. Clean Energy Technology. Database of State Incentives for Renewables and Efficiency (DSIRE). 2016. Available online: http://programs.dsireusa.org/system/program/tables (accessed on 1 September 2019).
  23. EnergySage. Choosing a battery: How to pick the best solar battery for you. 2009. Available online: https://www.energysage.com/energy-storage/how-to-get-storage/choosing-battery/ (accessed on 1 September 2019).
  24. Alrawi, O.; Bayram, I.S.; Koc, M. High-resolution electricity load profiles of selected houses in Qatar. In Proceedings of the 2018 IEEE 12th International Conference on Compatibility, Power Electronics and Power Engineering, CPE-POWERENG 2018, Doja, Qatar, 10–12 April 2018; pp. 1–6. [Google Scholar] [CrossRef]
  25. Zahedi, A. Developing a method to accurately estimate the grid-connected solar PV electricity cost in Hobart-Australia. In Proceedings of the 2013 Australasian Universities Power Engineering Conference, Hobart, Australia, 29 September–3 October 2013; pp. 1–4. [Google Scholar] [CrossRef]
  26. Alhammami, H.; An, H. Techno-economic analysis and policy implications for promoting residential rooftop solar photovoltaics in Abu Dhabi, UAE. Renew. Energy 2021, 167, 359–368. [Google Scholar] [CrossRef]
  27. Alsabbagh, M. Public perception toward residential solar panels in Bahrain. Energy Rep. 2019, 5, 253–261. [Google Scholar] [CrossRef]
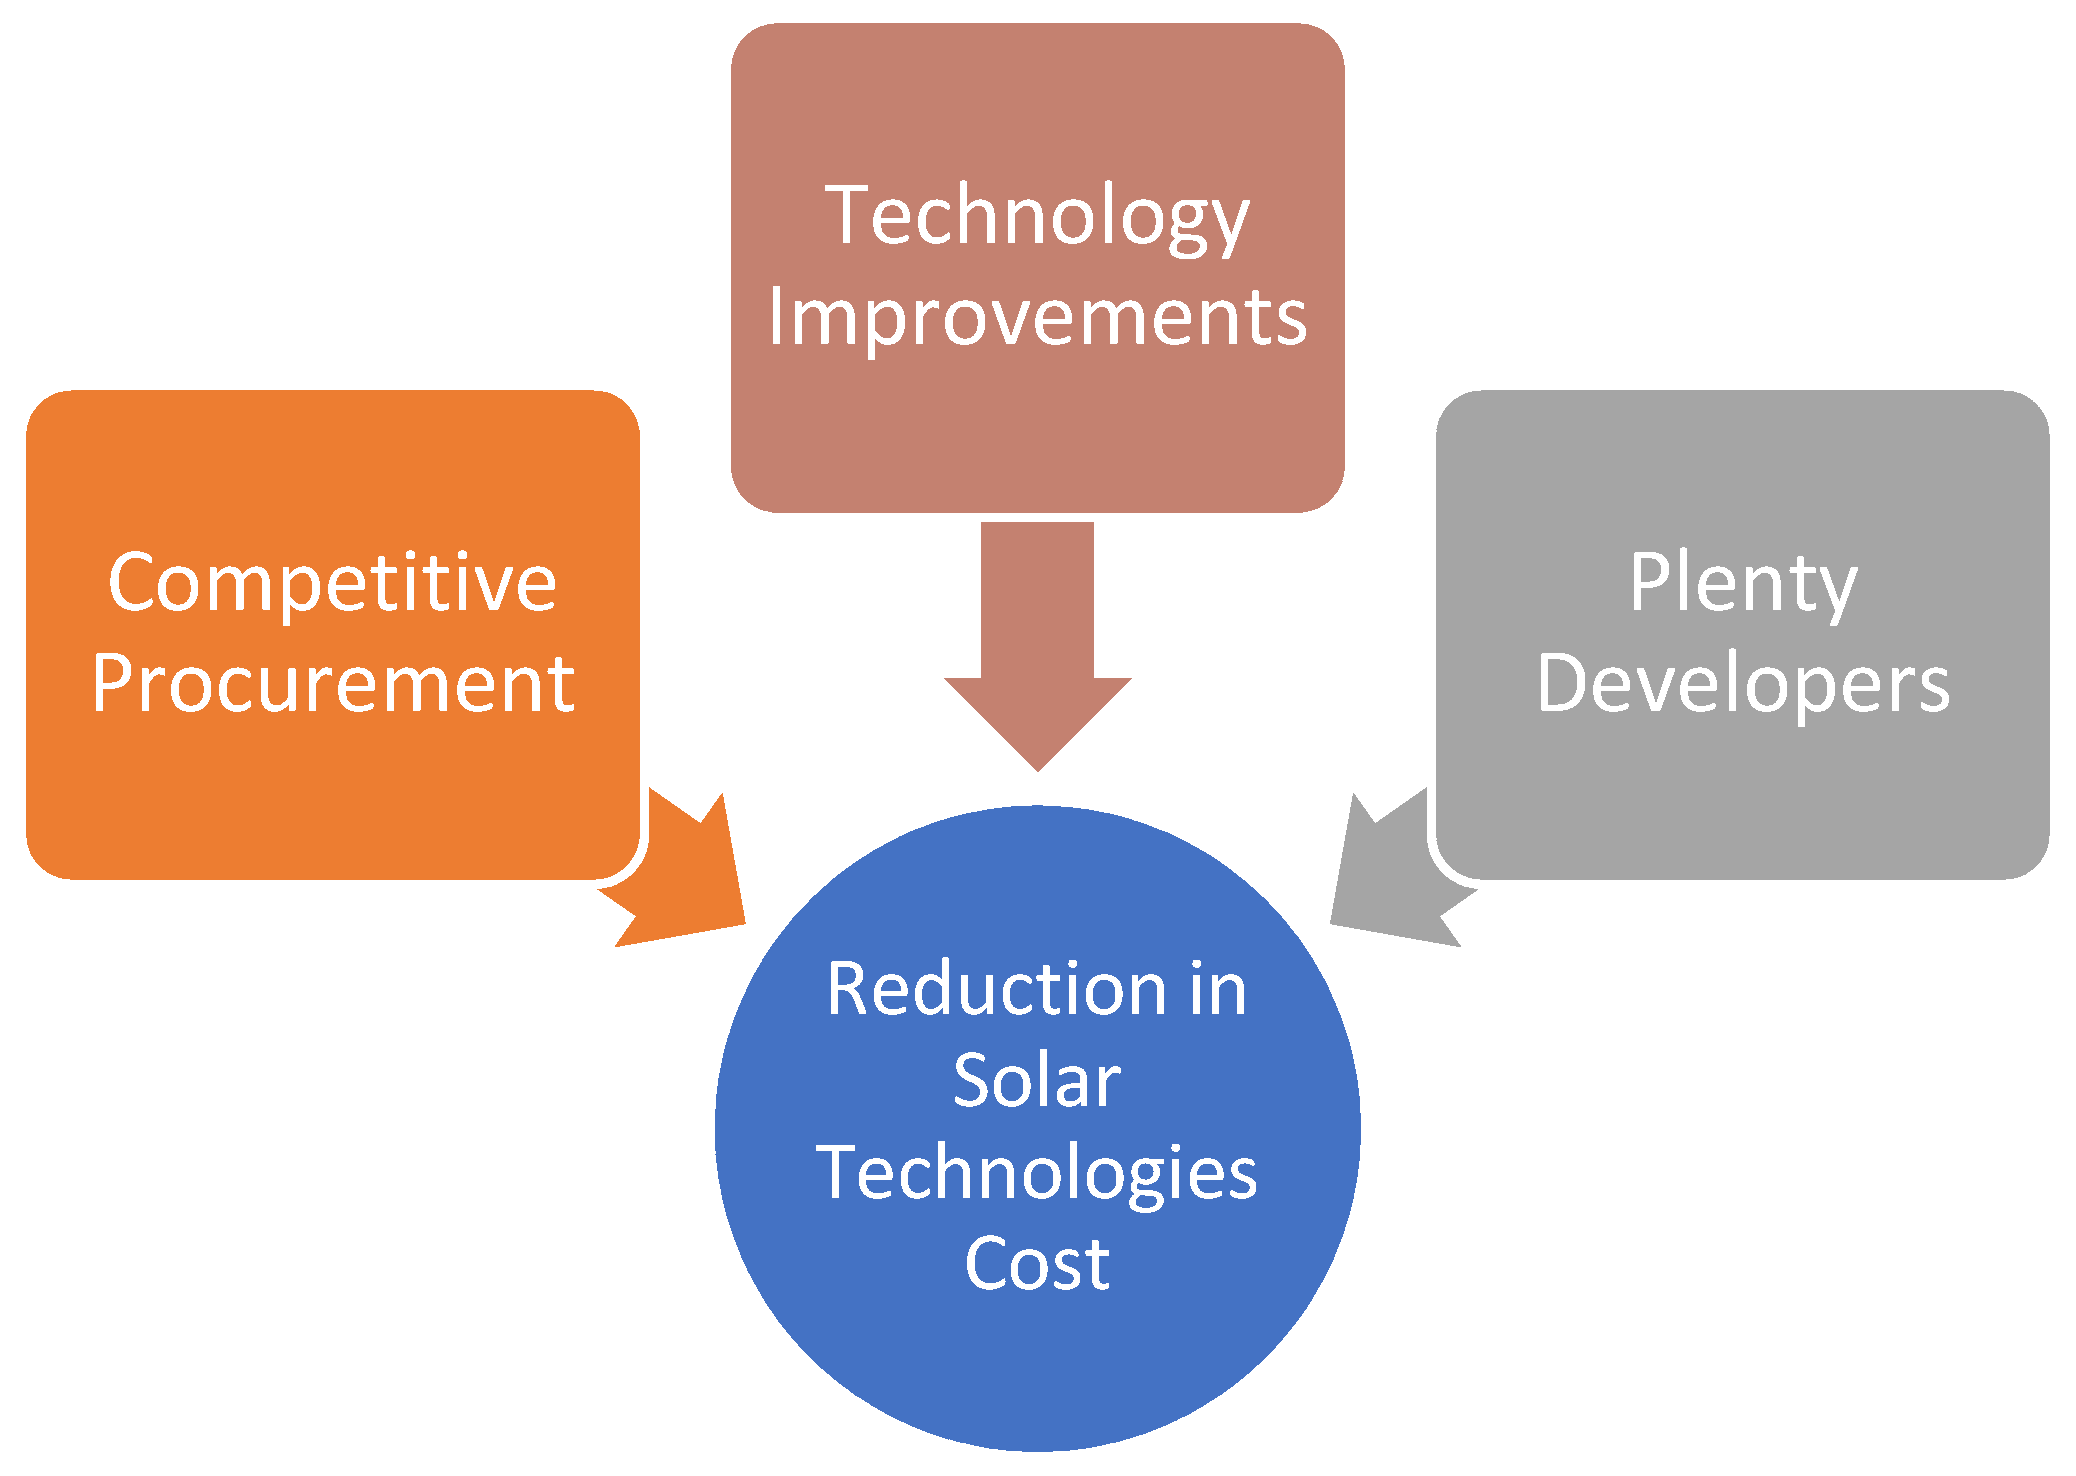
Figure 1. Summary of drivers of the reduction in solar technology costs.
Energies 15 03040 g001
Figure 2. Power monitoring system structure.
Energies 15 03040 g002
Figure 3. Self-consumption and self-sufficiency load region indexes [16].
Energies 15 03040 g003
Figure 4. A 20-panel or 4500 W rooftop photovoltaic (PV) system cost breakdown.
Energies 15 03040 g004
Figure 5. Economic model results demonstrating the payback time for the rooftop PV systems with feed-in tariff (FIT) with 25% Solar Incentive Programs (SIP) for houses H1:H10.
Energies 15 03040 g005
Figure 6. Economic model results demonstrating the payback time for the rooftop PV systems with FIT with 50% SIP for houses H1:H10.
Energies 15 03040 g006
Figure 7. Economic model results demonstrate the payback time for the rooftop PV systems with FIT with 75% SIP for houses H1:H10.
Energies 15 03040 g007
Figure 8. Economic model results demonstrate the payback time for the rooftop PV systems with a variant number of panels for house H10.
Energies 15 03040 g008
Figure 9. Economic model results demonstrate the payback time for the rooftop PV systems with global electricity rates, FIT with 30% SIP for houses, H1:H10.
Energies 15 03040 g009
Figure 10. Economic model results demonstrate the payback time for the rooftop PV systems without FIT and SIP for houses H1:H10.
Energies 15 03040 g010
Figure 11. Economic model results demonstrate the payback time for the rooftop PV systems without FIT but with 75% SIP for houses H1:H10.
Energies 15 03040 g011
Figure 12. H1, H3, H5, H6, H7, and H9 PV generation vs. load demand, maximum energy storage requirement in kWh (red area).
Energies 15 03040 g012aEnergies 15 03040 g012b
Figure 13. Economic model results demonstrate the payback time for the rooftop PV systems with energy storage and 75% SIP for houses H1, H3, H5, H6, H7, and H9.
Energies 15 03040 g013
Table 1. Socioeconomic details of the electricity profiling study participants (H: House).
MetricsH1H2H3H4H5H6H7H8H9H10
Household Size (m2)1502200–50420101–150250300+300+201–250201–250
TypeApart.VillaApart.VillaApart.Apart.VillaVillaVillaVilla
Building Age (years)11–1511–1511–1511–1511–150–55–1015+5–1011–15
Education Level (Decision Maker)Ph.D.CollegePh.D.Ph.D.Ph.D.Ph.D.High schoolCollegeCollegeMasters
Occupants32176296135
Occupants under 18 years old1NoneNone34None3None5None
Annual Household Income (USD)101–200k101–200k0–100k200k+101–200k200k+0–100k101–200k0–100k101–200k
Cooling TypeCentralCentralSplit UnitCentralSplit UnitDistrict CoolingSplit UnitSplit UnitSplit UnitSplit Unit
Table 2. Available roof space in comparison with photovoltaic (PV) system sizing.
House NumberH1H2H3H4H5H6H7H8H9H10
Total Rooftop Space (m2)16010050170180200280140180150
Approximate Available Rooftop Space (m2)3030.53039.53365321053042
Approximate Maximum Possible Number of Panels20202025204020552025
Table 3. Variables applied to the model.
Parameters
1Unit cost (USD/kWh)
2Selling cost (USD/kWh)
3Mortgage rate
4Annual main. Cost (20P)
5Balance of System (USD) (20P)
6Inflation Rate
7Discount rate
8Decay rate
9Solar Incentive program (SIP)
10Panel Cost (USD)
Table 4. Case 1 Houses H1:H10 number of panels and PV energy generation details.
H1H2H3H4H5H6H7H8H9H10
Number of Panels20201025202010302025
Total self-consumed PV energy kWh/y818211,314323514,13184758087457814,399821412,025
Total surplus PV production kWh/y3122023990282931911074269730912105
Table 5. Case 1 economic model chosen variables.
ParametersValue
1Unit cost (USD/kWh)0.049
2Selling cost (USD/kWh)0.1
3Mortgage rate3%
4Annual main. Cost (20P)150
5Balance of System (USD) (20P)3500
6Inflation Rate0.1
7Discount rate3.5%
8Decay rate0.7
9Solar Incentive program (SIP)30%
10Panel Cost (USD)500
Table 6. Economic model results demonstrate the economic analysis for the rooftop PV systems with a feed-in tariff (FIT) with a 75% Solar Incentive Program (SIP) for houses H1:H10.
H1H2H3H4H5H6H7H8H9H10
NPV (USD)5737373433964660554757662555741357176015
TS (USD)944665925475822991769487427712,471941710,160
PBY8127128899810
ROI (%)380295424295372381353346379341
IRR20%15%23%15%19%20%18%18%20%18%
Table 7. Economic model results in demonstrating the economic analysis for the rooftop PV systems with a varying number of panels for house H10.
5 Panels10 Panels15 Panels20 Panels25 Panels
SC99%96%91%88%85%
NPV (USD)9321995323345656015
TS (USD)164734795560777610,160
PBY1212111010
ROI (%)295306320330341
IRR15%15%16%17%18%
Table 8. Economic model results demonstrating the economic analysis for the rooftop PV systems with global electricity rates, FIT with 30% SIP for houses, H1:H10.
HouseH1H2H3H4H5H6H7H8H9H10
NPV (USD)82299427376711,76483398161429913,324824210,967
TS (USD)15,28616,993714821,21315,44215,189790624,32615,30420,077
PBY11101210111111101110
ROI (%)262280251280263261267272262270
IRR13%14%12%14%13%13%13%13%13%13%
Table 9. Summary of all the self-consumption values (C) in kWh and self-consumption ratios in percentages (%) including houses H1, H3, H5, H6, H7, and H9 for the available monthly data.
H#H1H3H5H6H7H9
No. Panels201020201020
Value TypeC (kWh)Ratio (%)C (kWh)Ratio (%)C (kWh)Ratio (%)C (kWh)Ratio (%)C (kWh)Ratio (%)C (kWh)Ratio (%)
Jan749389218NANA108761119784116367
Feb75739NANA7294110155784173101652
Mar122161NANA15186811446775665114154
Apr16106640639209388NANA8026780760
May2021711451963538100NANA121581NANA
Jun318982501NA3059100200683185689NANA
Jul346099218310016516919997620619899797
Aug3799100240010030321001619671594971565100
Sep267696475412988NA203176120593NANA
Oct21538584155228577190875128680NANA
Nov1316752282914066514837367759182869
Dec79141163206004512026393376125966
Table 10. Maximum energy size requirement for selected houses in Ah.
Excess PV Energy
(kWh)
Estimated Storage Cost
(USD)
Excess PV Energy
(Ah)
Max Storage
Size (Ah)
Operation Duration within a Year
H117.0994001424170076%
H311.326200943110067%
H518.9010,4001575190066%
H613.70750011421400100%
H74.83270040250083%
H915.2184001268150077%
Publisher’s Note: MDPI stays neutral with regard to jurisdictional claims in published maps and institutional affiliations.