Article

Experimental and Numerical Analysis of Rotor–Rotor Interaction Characteristics inside a Multistage Transonic Axial Compressor

1
High Speed Aerodynamics Institute of China Aerodynamics Research and Development Center, Mianyang 622761, China
2
Institute of Aeronautics and Astronautics, Xihua University, Chengdu 610097, China
*
Author to whom correspondence should be addressed.
Energies 2022, 15(7), 2627; https://doi.org/10.3390/en15072627
Submission received: 8 March 2022 / Revised: 29 March 2022 / Accepted: 31 March 2022 / Published: 3 April 2022
(This article belongs to the Special Issue Advanced Research on High-Energy Performance Compressors)

Abstract

:
Serving as a key component of the core engine, the high-load axial compressor is expected to have high performance, which determines several critical parameter levels of the aero-engine. The unsteady effect on the performance induced by the interaction among different rotors should not be ignored during the design of a high-load compressor. The interaction between R1 (the first rotor row) and R2 (the second rotor row) rotors of a transonic axial compressor was measured in detail using high-frequency pressure fluctuation sensors, aiming to reveal the evolution and distribution characteristics of the R1 sweep effect inside the R2 passage. The results show that near choke and design points, the interaction between the R1 oblique shock wave at the leading edge and the high-pressure region on the blade pressure side triggers the R1-2BPF (blade passing frequency) disturbance, which is different from the traditional harmonic of the blade wake disturbance. A ‘long tail’ flow structure, which indicates the major influence of the R1 shock wave, fluctuation obviously reaches the exit of R1 and influences the upper part of S1 and R2. The combination of the R1-2BPF and the R1-1BPF (mainly caused by the R1 wake disturbance) influences the R2 flow field significantly, and both of them sharply grow at the middle and rear parts of the R2 passage where the strength of the two disturbances increases by 24% and 68%, respectively, compared to the leading edge of R2. Moreover, the circumferential non-uniformity of the R1-1BPF and R1-2BPF disturbances significantly increase at some locations of the R2 passage compared to the R1 exit, which is attributed to the relative clocking positions of the R1 and R2 blades.

Graphical Abstract

1. Introduction

As the core engine is developed with a trend of a smaller size, the interactions among different rows should not be ignored in the design of a high-load compressor. Several previous studies have analyzed the adjacent rotor–stator interaction from the aspect of macro performance and flow details. For example, the optical equipment laser two-focus anemometer was used by Ottavy [1,2] to measure the interaction between the IGV and rotor inside a single-stage transonic axial compressor. The propagation of the rotor shock wave and its interaction with the IGV wake, which influences the inter-row flow characteristics, were shown in the results. Using similar experimental methods, Lecheler [3] investigated the rotor–stator interaction and their coupling effect with the rotor shock wave inside a five-stage transonic compressor. Gorrell [4,5] experimentally pointed out the performance dropped because of a decrease in the space between the rotor and stator. In further studies, the time-averaged distribution of the pressure ratio and efficiency, measured by rake pressure probes, specified the most significant influence of the stator wake on the rotor efficiency. Additionally, both the experimental and numerical results showed an extra loss region at the stator trailing edge, which is induced by the rotor shock wave/stator wake interaction and plays an important role in the dropping of the transonic compressor performance. An investigation into the unsteady effects of the rotor wake on the stator boundary layer was performed by Mailach [6]. The research adopted the approximate boundary shear stress coefficients to reveal the effect of the rotor wake on the distribution of different flow characteristics near the stator suction side. Similar boundary shear stress coefficients were used in an experimental and numerical investigation of the interaction between the rotor wake and flow at the stator leading edge inside a single-stage axial compressor performed by Wheeler [7,8]. The results estimated the effect of leading-edge geometry on the rotor–stator interaction and revealed the boundary layer separation at the stator leading edge generated by the increasing incidence of the incoming rotor wake at low flow rate conditions. Yamagami [9] investigated the relationship between the rotor–stator interaction phenomenon and the macro performance within a six-stage high-pressure compressor. It was noticed that the unsteady interaction characteristics could not significantly influence the compressor performance. The effect of the tip leakage flow on the rotor wake characteristic was studied in Ref. [10]. Meanwhile, some studies have focused on the stator–stator interaction. Stading [11] and Fruth [12] performed experimental and 3-D numerical investigations on the interaction between adjacent two stators inside 1.5-stage [11] and two-stage [12] compressors, respectively. The results presented the effect of the relative positions of the stator blade on the compressor performance and the blade force response. The study by Milidonis [13] concentrated on the acoustic generation mechanisms by the stator clocking effect. According to the results, the effect of the clocking position on the compressor efficiency is very limited; however, the amplitudes of some important acoustic modes change significantly.
Nowadays, the axial compressor is developed from the high-loaded to the extra-high-loaded level, which makes the blade sweep effect more prominent, especially for the rotor blade. The significant disturbance of the rotor blade sweep propagates further, and its interference within other rotor rows becomes more critical [14]. However, investigations into the rotor–rotor interaction are relatively rare, especially for high-load transonic axial compressors. Furthermore, past studies about the adjacent rotor–stator or stator–stator could not completely cover the unsteady aerodynamic theory needed for the design of a higher load compressor, and the theory of the interaction among rotors should be developed. Up to now, there have only been a few relatively classic works. The investigations by Hsu [15], He [16], and Mileshinv [17] paid attention to the rotor–rotor clocking effect. Numerical calculations and measurements were performed on 1.5-stage subsonic [15] and two-stage transonic [16,17] compressors. Miserda [18] investigated the rotor–rotor interaction phenomenon within a counter-rotating cascade. The authors found the relationship between some potential sources of noise and different rotor interference modes. Huang [19] presented high-precision results of the rotor–rotor interaction phenomenon within the axial compressor using the time–space spectral method. However, the contents of these works mainly focus on the compressor macro performance and calculation error analysis but not the details of the propagation of unsteady flow structures. The experimental results from Smith [20] indicate that the quasi-wall shear stress at the leading edge of the stator blade is altered by the relative position between the R1 wake and R2. Ernst [21] measured the interference of the R1 and S1 wakes within R2, using both the high-frequency transient pressure measurement technique and the laser Doppler anemometer. The results revealed the unsteady coupling effect of the R1 wake and R2 tip leakage flow. However, the works were not based on the high-load compressor; thus, the interference of the R1 shock wave within the R2 passage, which influences the R2 performance, was not considered.
To cover the gaps in knowledge above, this study employed the high-frequency transient pressure measurement technique to reveal the propagation characteristics of the rotor–rotor interaction and make clear the critical interaction region and distribution of the disturbance frequency spectrum, which provides a theoretical basis for the optimization of the rotor of a high-load compressor.

2. The Scope of Paper

For the transonic compressor, the shock wave influence on R1 is usually critical for the compressor’s performance. However, whether this shock wave has significant effects on R2 and what this procedure is are still under discussion. The aim of this study was to experimentally present the characteristics of the R1 disturbance (including the shock wave effect) inside the R2 passage and explain the related mechanisms. Meanwhile, the CFD method was used to help investigate the flow field more deeply. The results mainly contain three parts, as follows:
(1)
The axial propagation characteristics of the R1 disturbances within the R2 passage, especially for a special shock wave-related R1-2BPF disturbance;
(2)
The circumferential propagation characteristics of the R1 disturbances within the R2 passage and its mechanisms;
(3)
The influence of the operation condition on the propagation of R1 disturbances within R2.

3. Experimental and Numerical Methods

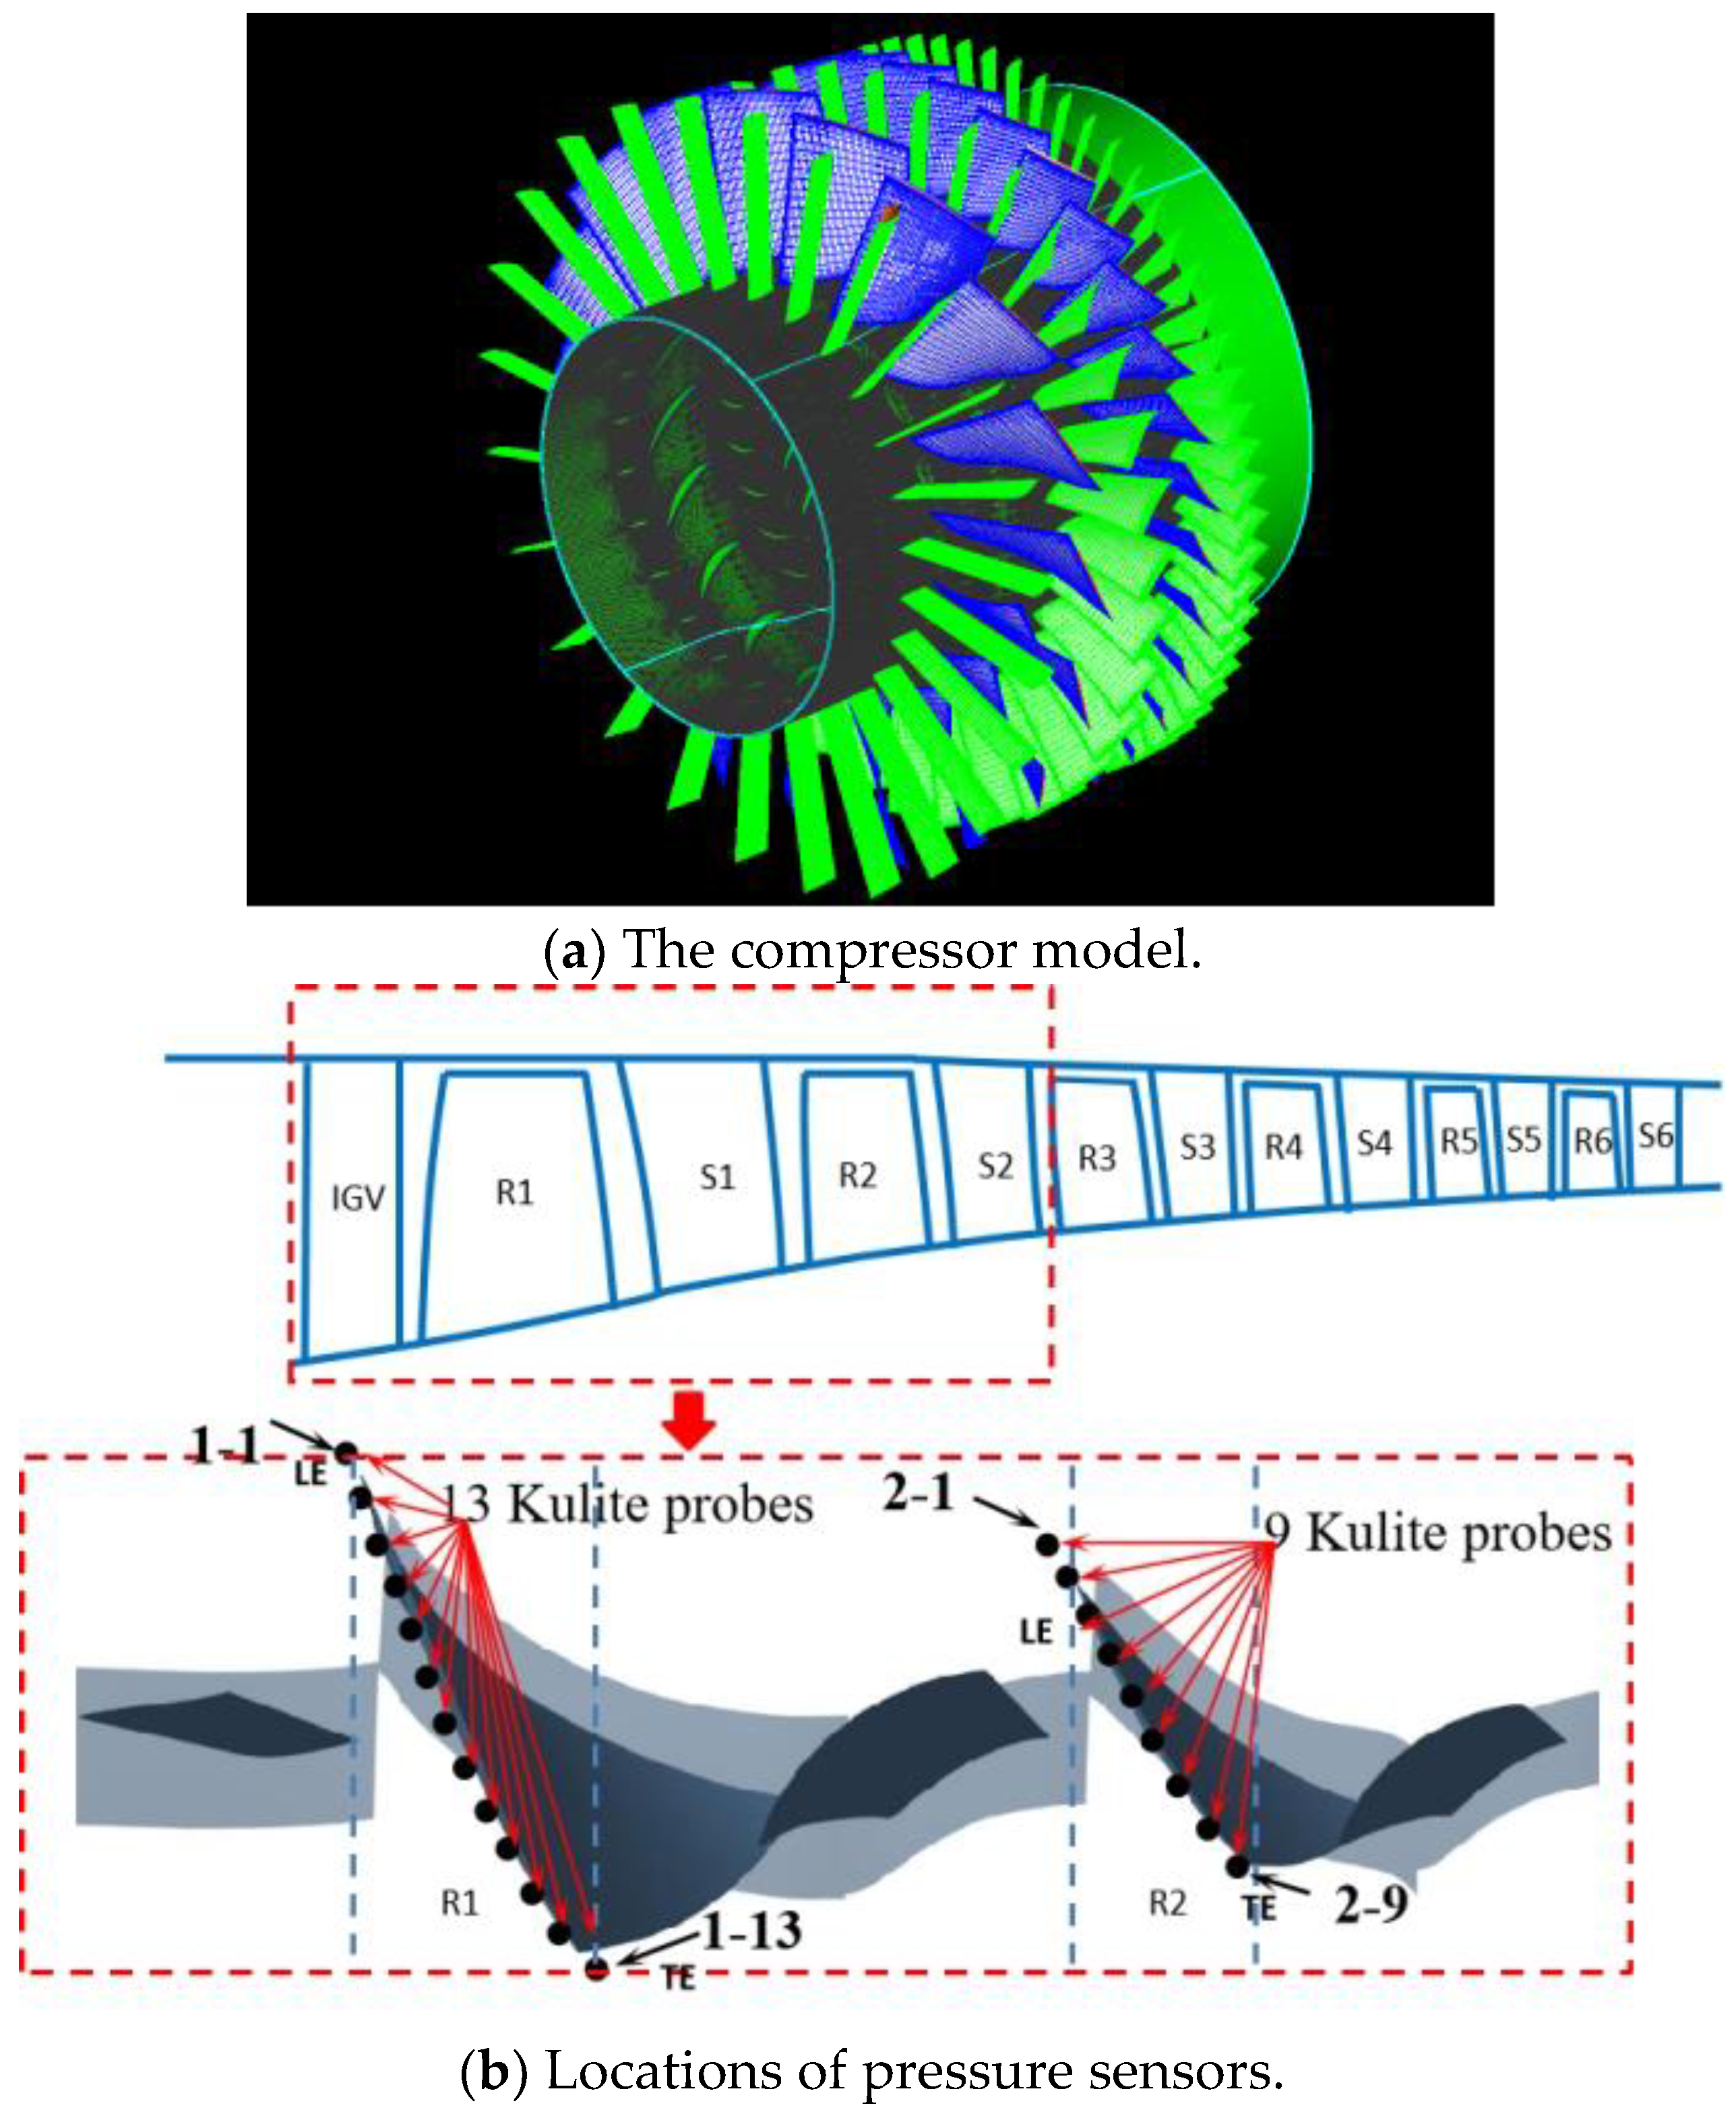
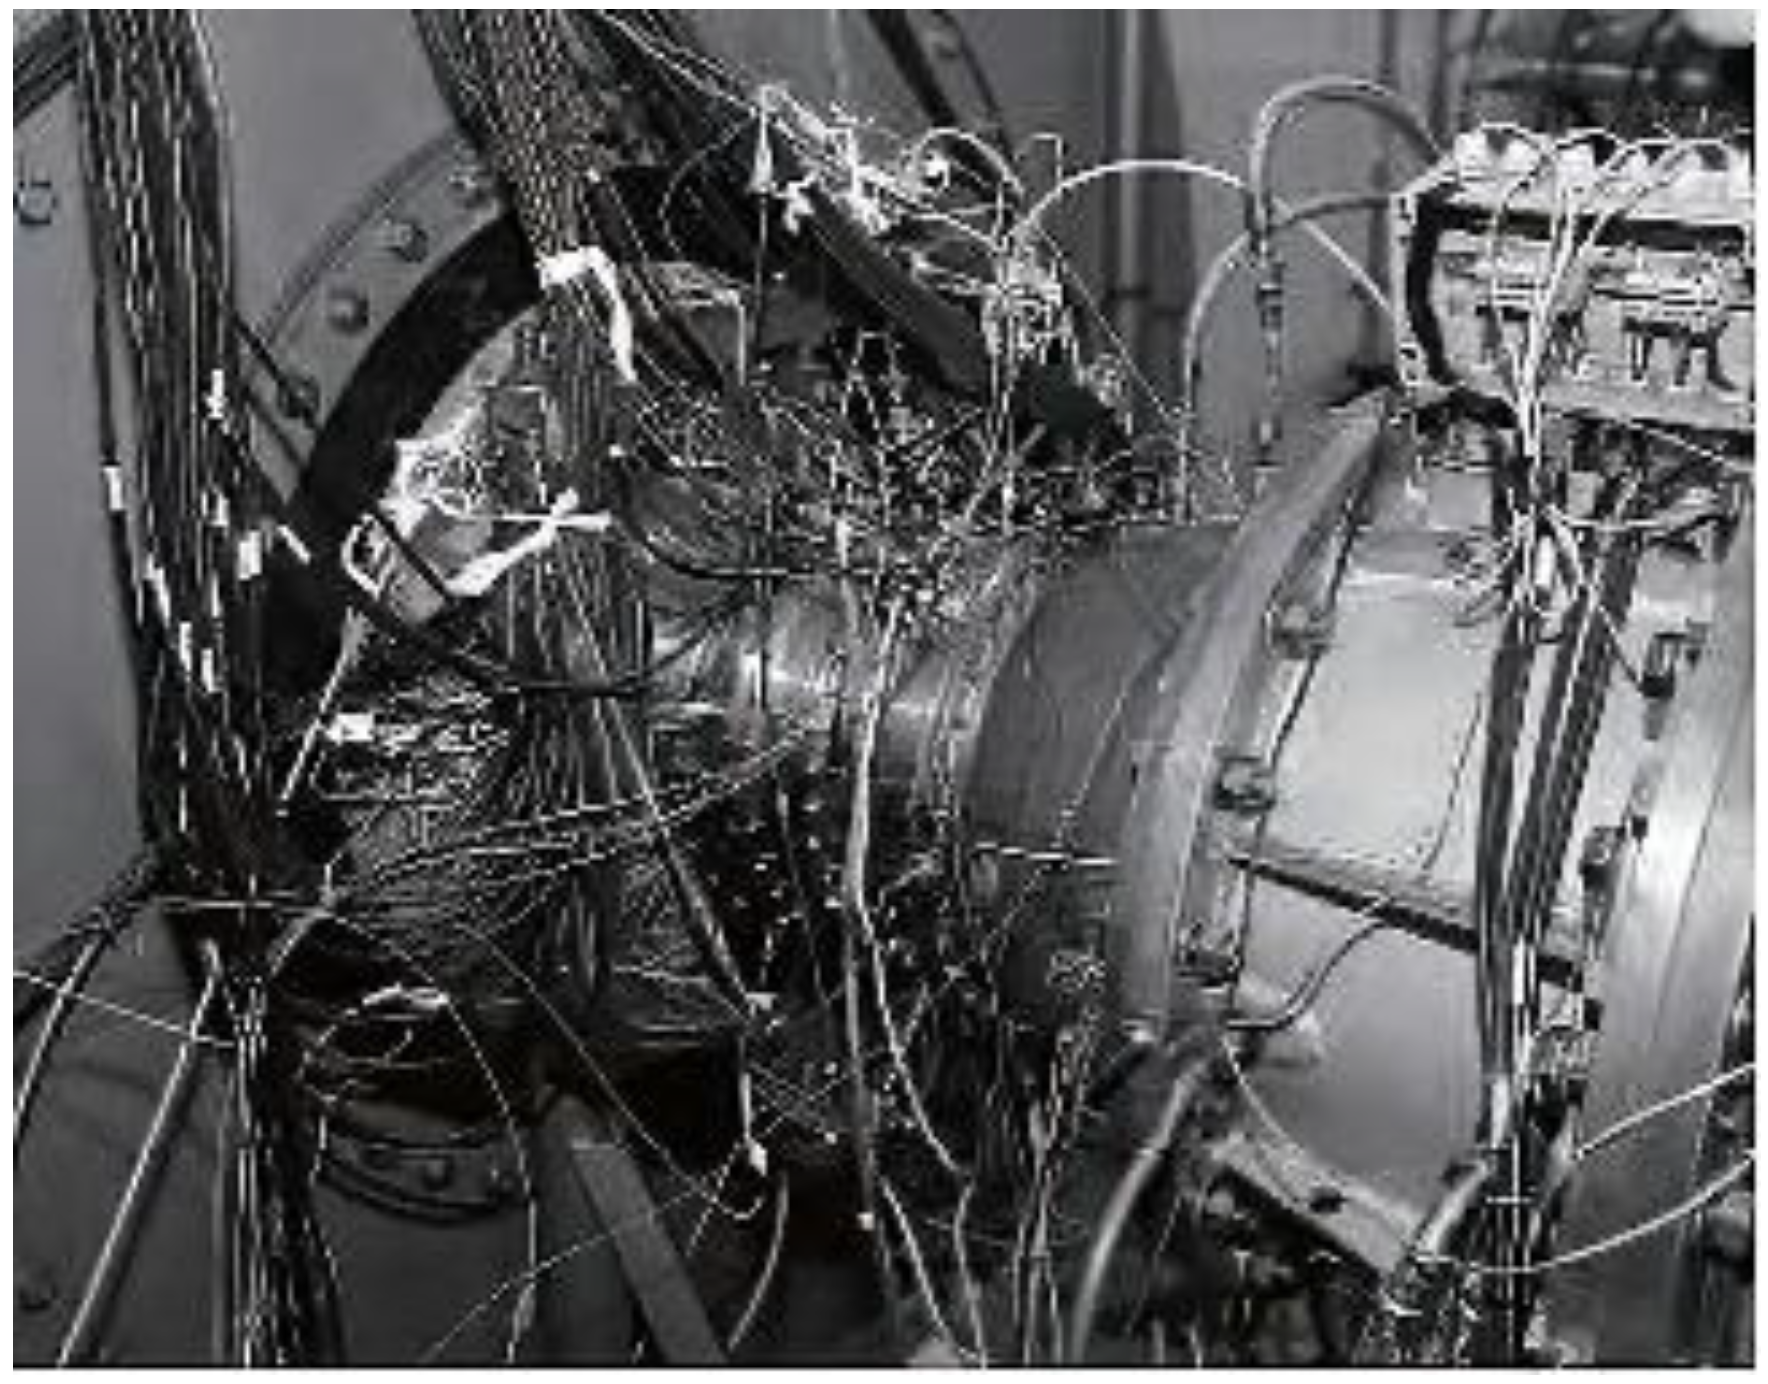
3.1. Experimental Approaches

As the test rig of this research (shown in Figure 1) was introduced in detail in Ref. [22], the information about the experimental approaches is roughly presented here. The maximum rotating speed of the test motor was 16,000 rpm, and its highest power reached 8000 kW. The rotating speed fluctuation of the test rig was limited to under 0.2%. The front two stages of a 6-stage transonic axial compressor, of which the design speed and tip tangential velocity of the first rotor were 12,900 rpm and 388 m/s, were selected here. The design pressure ratio of this test compressor segment arrived at 2.66. Moreover, for the inlet domain of R1, the hub–tip ratio reached 0.6. The blade numbers of the test rig were 25 + 18 + 34 + 33 + 62. To effectively measure the pressure fluctuation from inside the rotor, 13 and 9 Kulite high-frequency pressure sensors were equidistantly installed on the casing wall, along the chords of R1 and R2 (the numbers of sensors at R1 were from 1-1 to 1-13 and the numbers of sensors at R2 were from 2-1 to 2-9), as is shown in Figure 2. The highest sampling frequency of the sensor was 300 kHz, which was enough for the experiment. The Dewesoft signal conditioner was used for the signal acquisition and filter. The operation temperature for this system ranged from −10°~50°, and the analysis uncertainty was 0.5% F.S. To adequately remove the environmental disturbance, the low-pass filter frequency of 200 kHz was used. Additionally, the acquisition temporal interval was set at 20 s. It is believed that this measurement system was enough to precisely capture the phenomena analyzed in the paper.

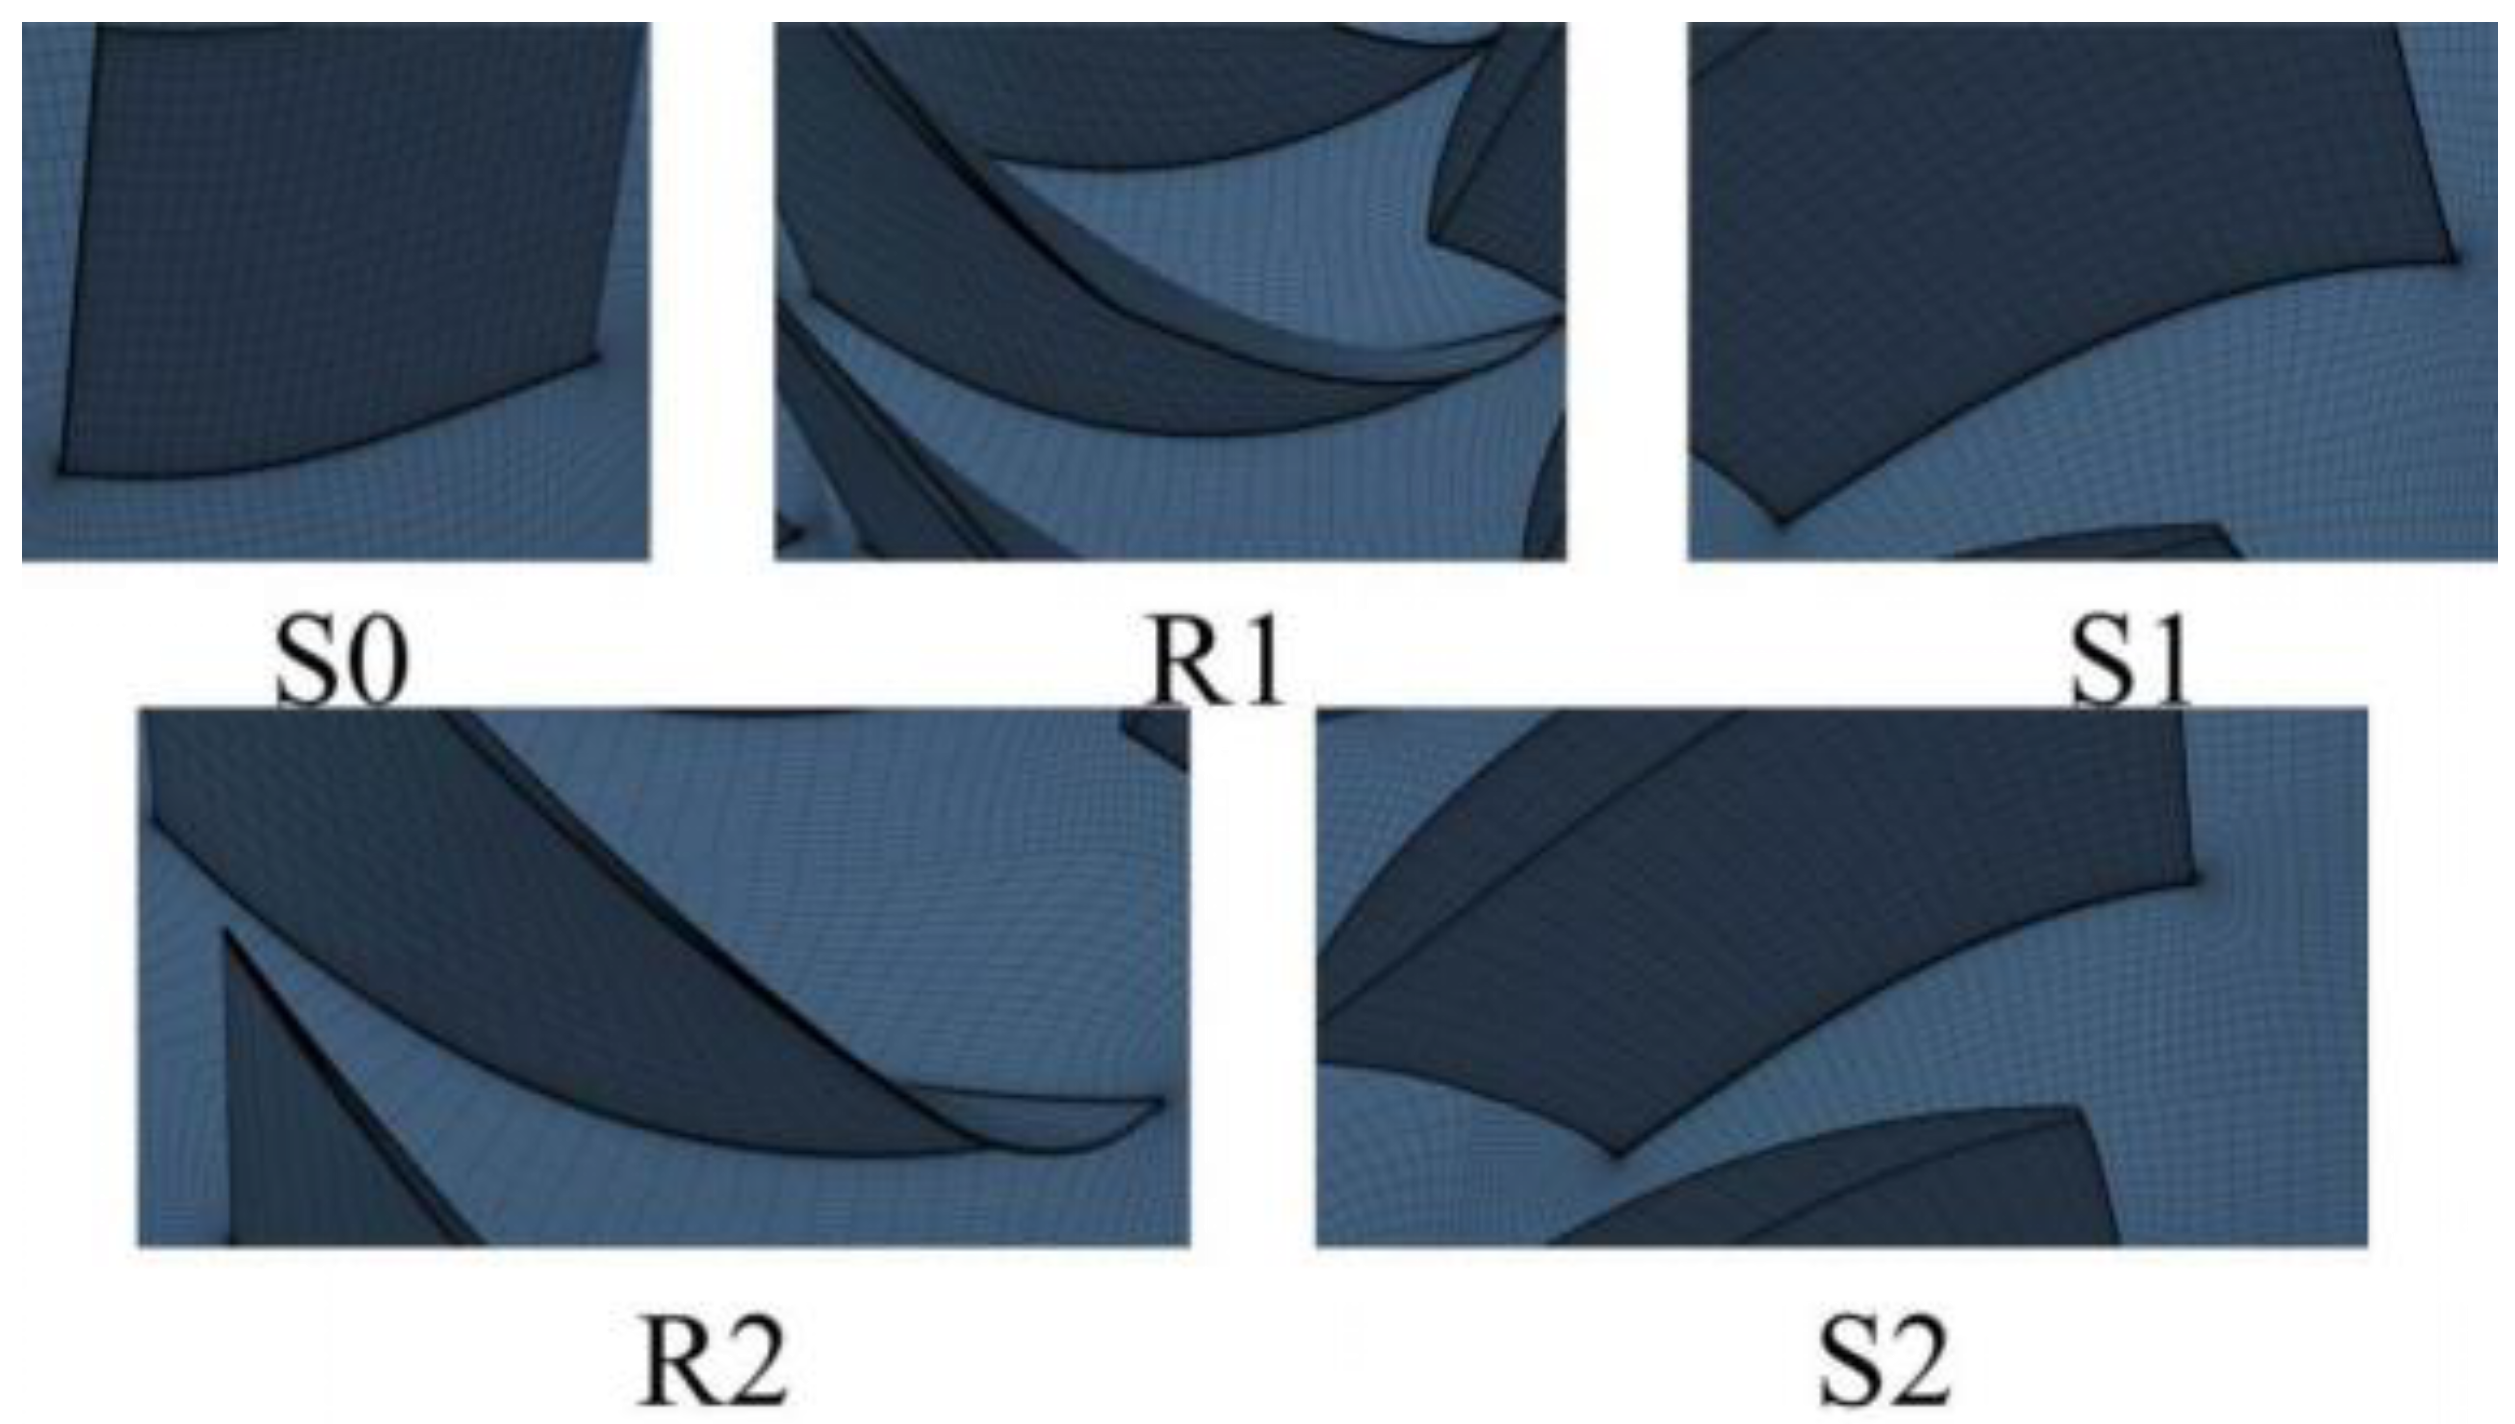
3.2. Numerical Methods

The commercial CFD software FINE/Turbo was employed. All the calculations were based on the RANS (used for steady calculation) and URANS (used for unsteady calculation) methods, and the S-A turbulence model was used. The authors adopted the whole wheel model to eliminate the domain-scaling error. The grid number of single passages for each row (including the IGV) reached 414,000, 446,000, 414,000, 446,000, and 414,000, respectively. Thus, the value of Y + for each row that could be controlled was less than 3. According to the studies by Spalart and Allmaras [23], the boundary flow characteristics inside the compressor could be well predicted under such a Y+ range when using the S-A turbulence model. More details of the grid meshing are shown in Figure 3. The mixing plane interface and sliding grid techniques were used in the steady and unsteady calculations, respectively. The combination of the inlet total pressure of 101,325 Pa, inlet total temperature of 288 K, and the inlet axial flow direction was exerted at the inlet domain of the compressor. Accordingly, the average static pressure was set at the outlet domain and the radial equilibrium equation was also considered. The flow turbulence viscosity at the inlet domain was set to 0.0001 m2/s, which is usually selected in the simulation of turbomachinery flow. In the study, the convergence judgment for the steady simulation was proposed as follows: (1) the root mean square (RMS) residual was below 10-6, and (2) the difference between the inlet mass flow and outlet mass flow was less than 0.1%. The convergence of the unsteady calculation obtained as the fluctuation of the selected parameter appears to have been periodic.

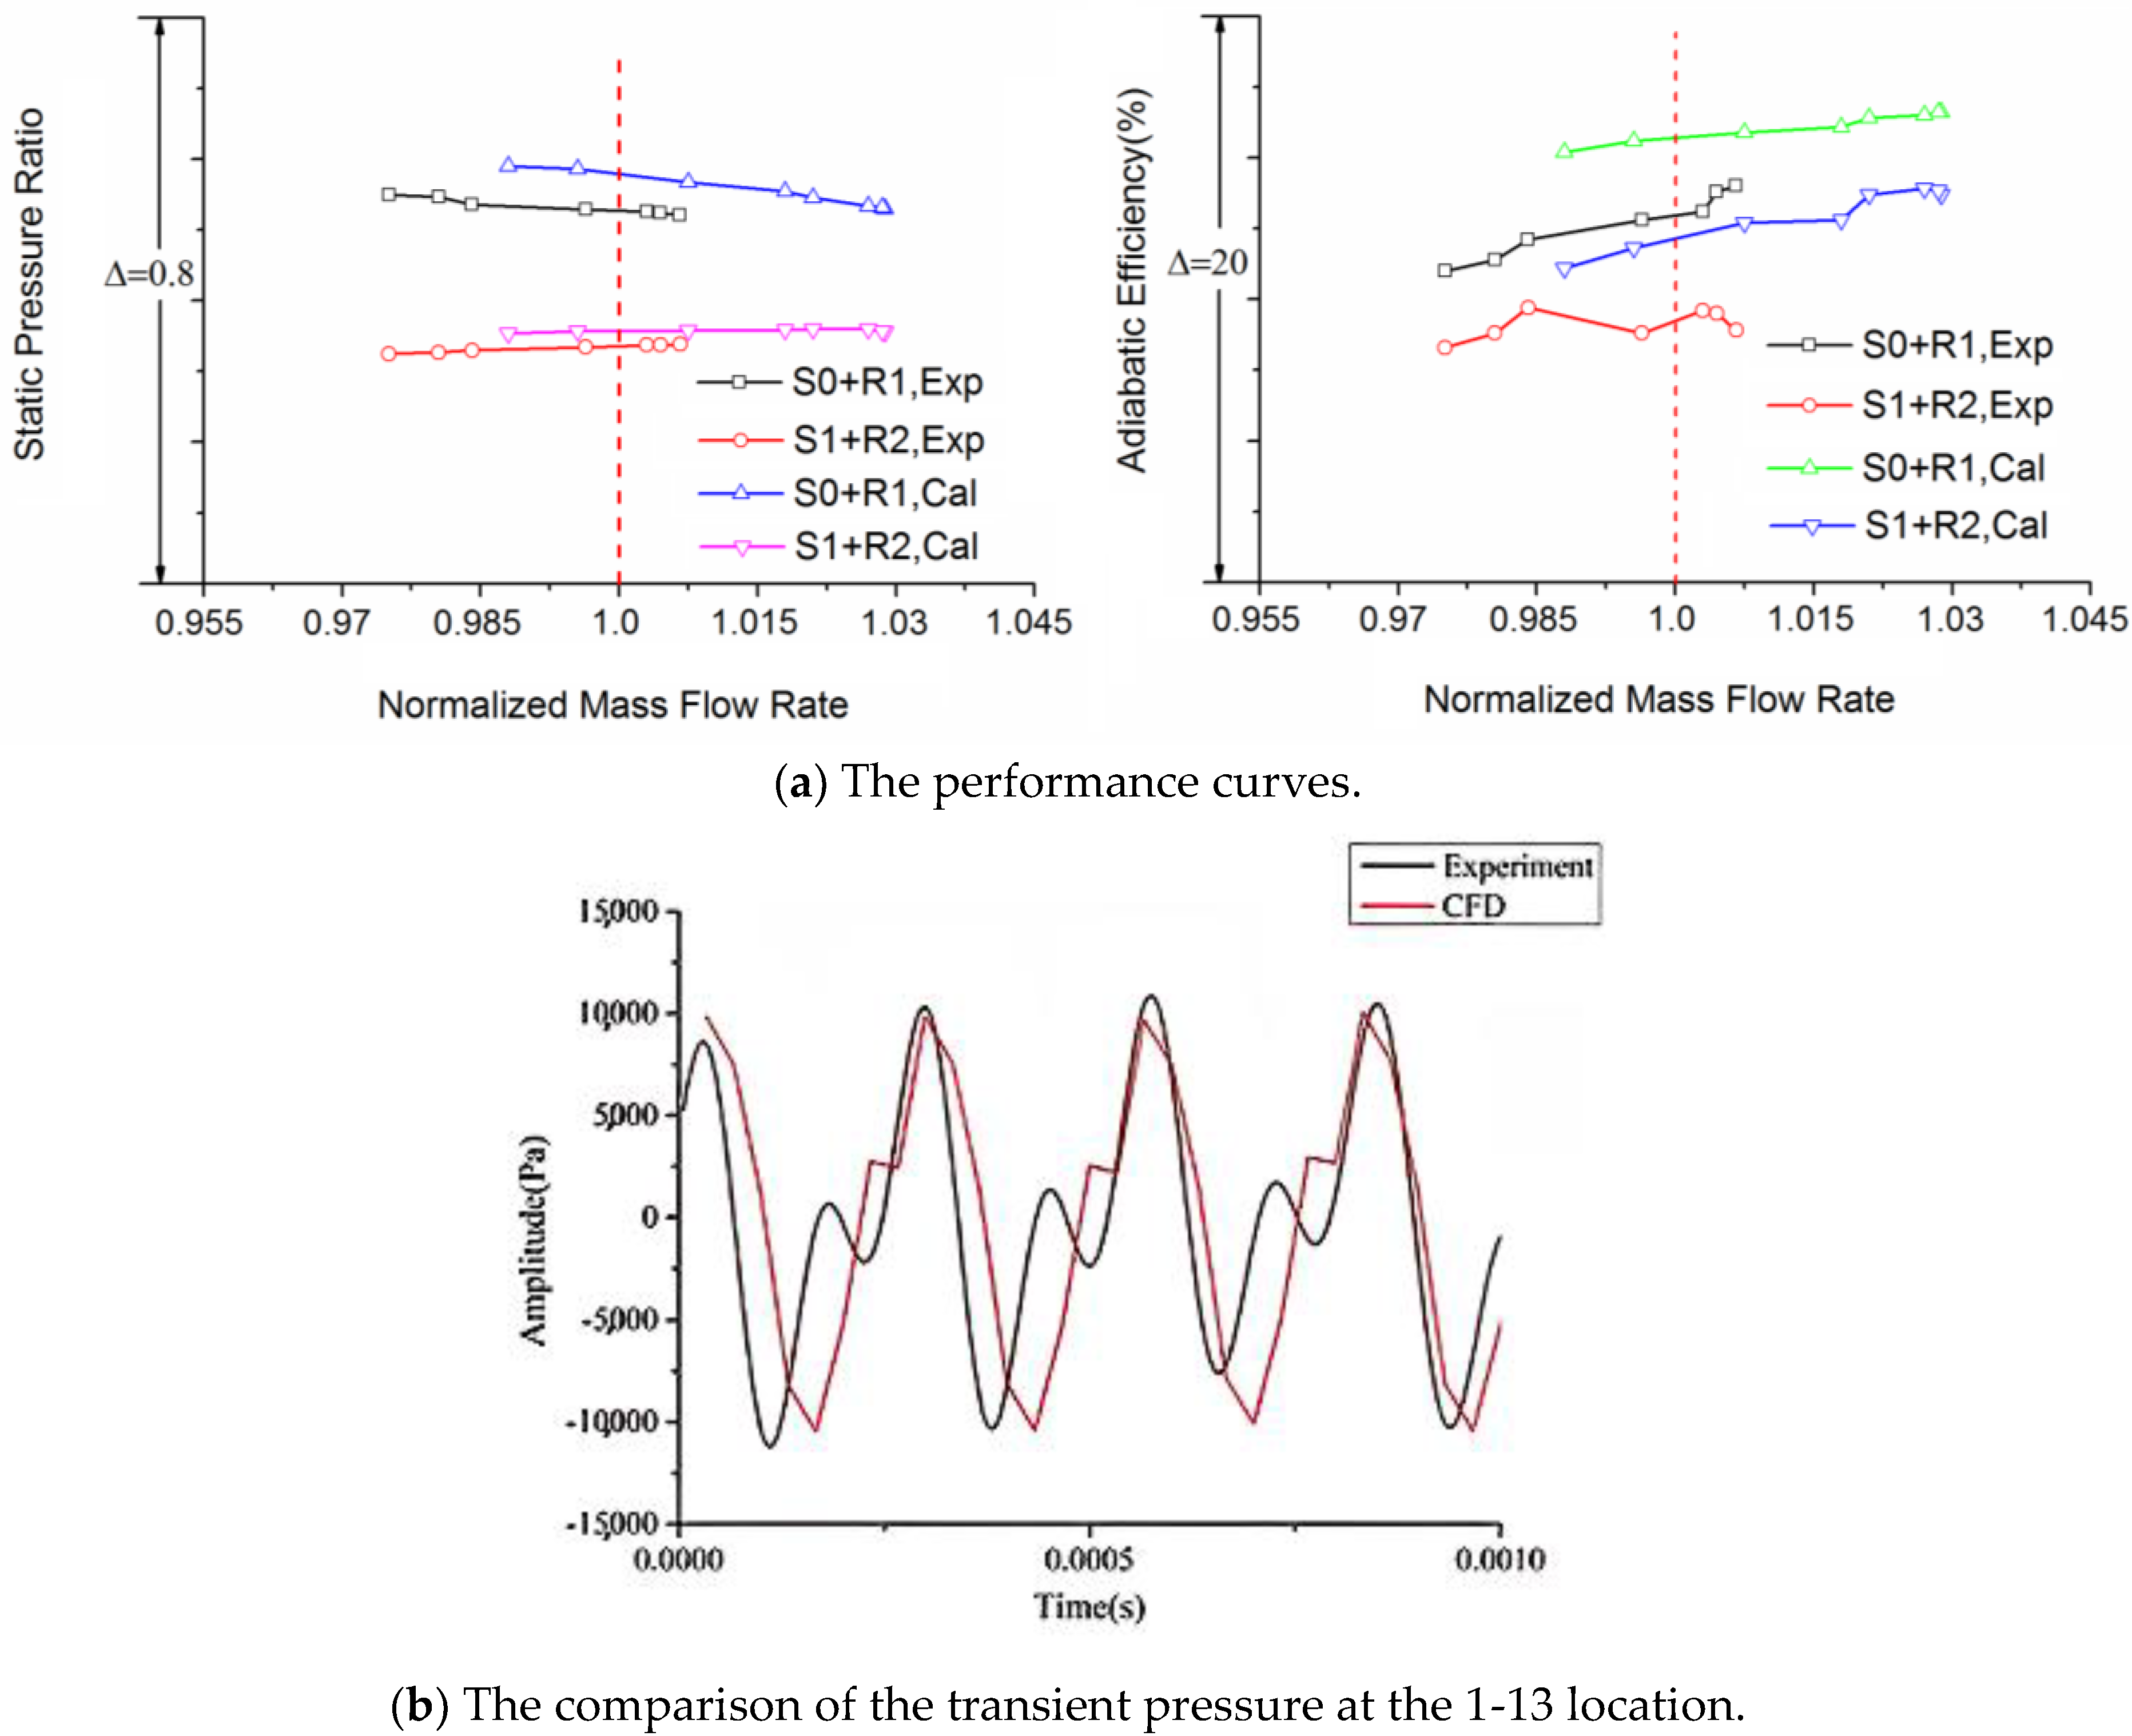
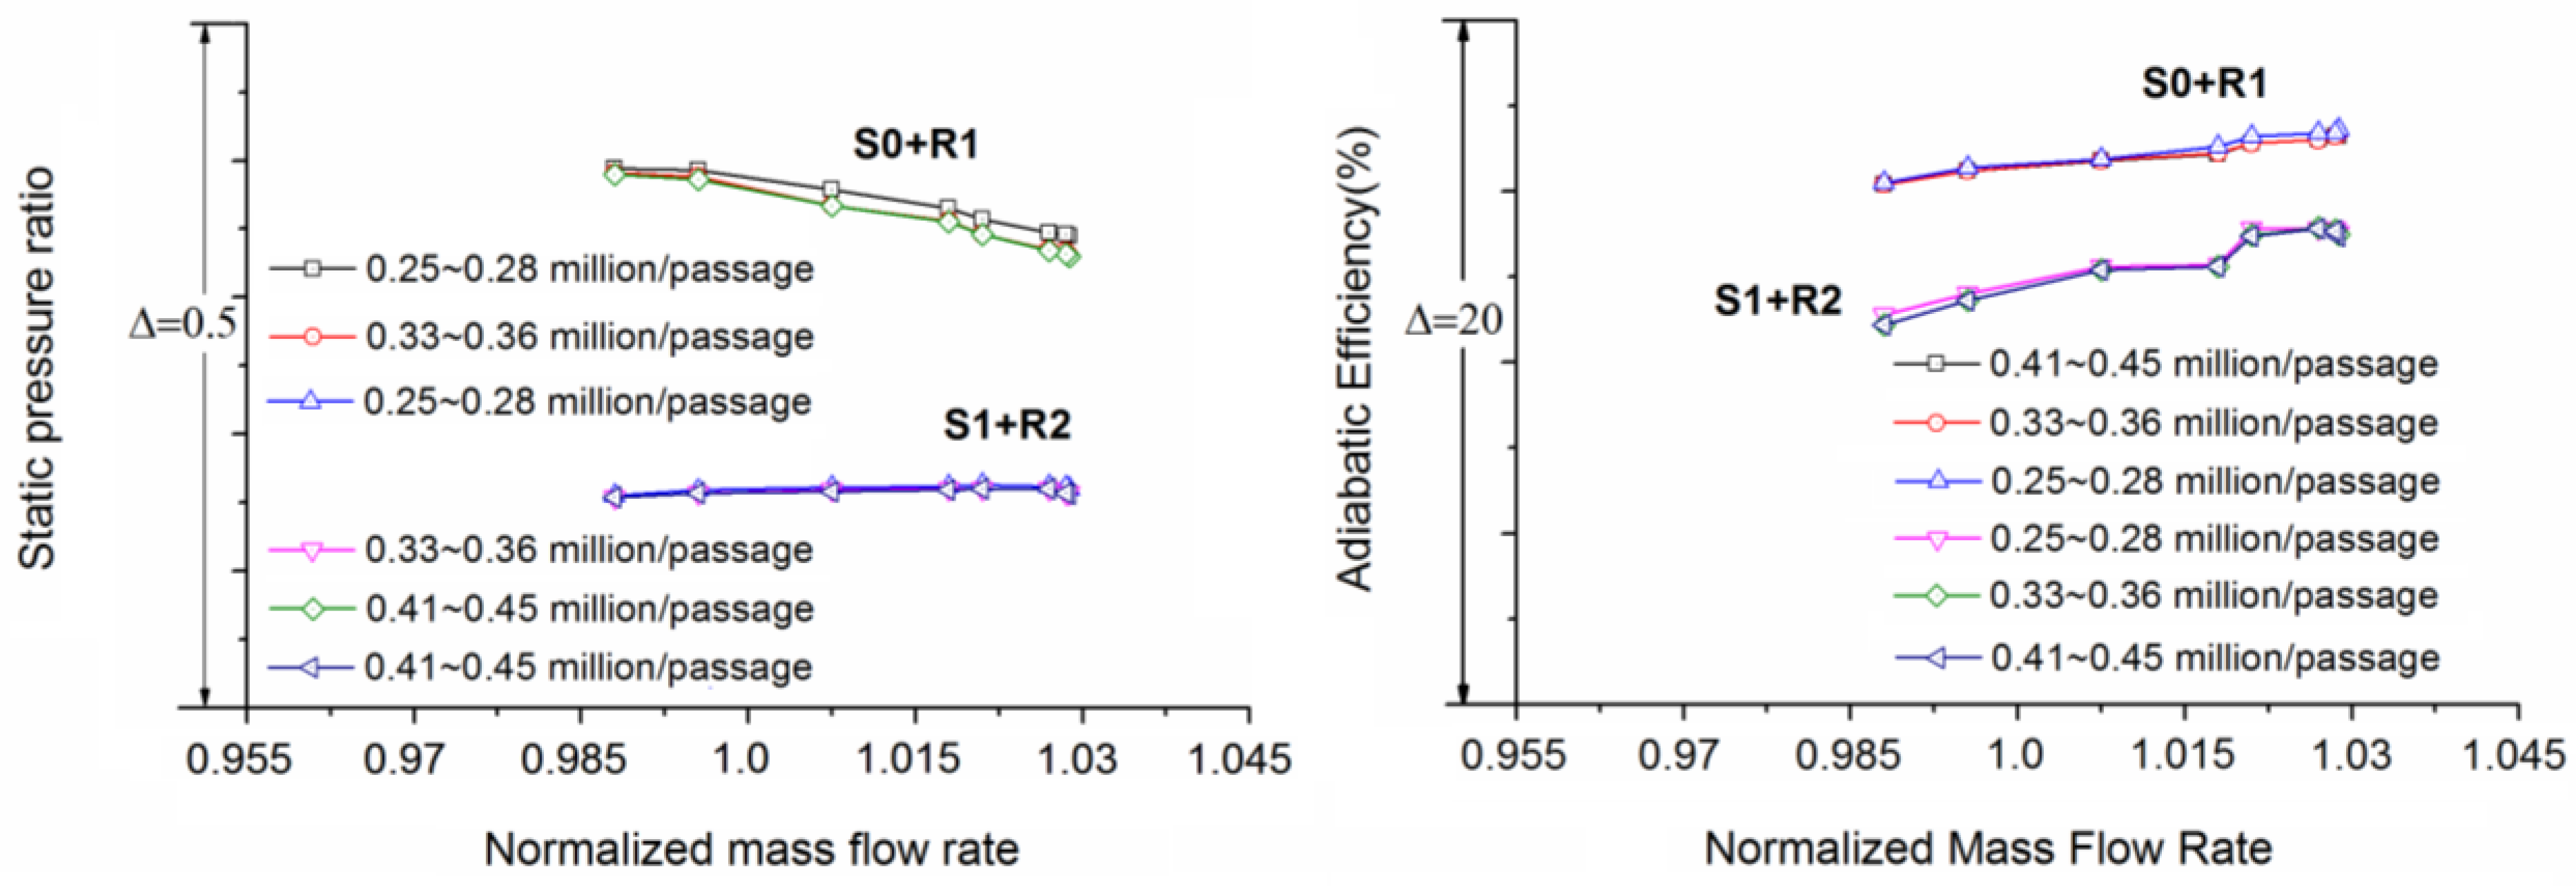
3.3. Validation of the Numerical Method

Details of the validation of the numerical method were introduced in the recent research of the authors of [22], and the results are directly cited here. Figure 4 presents both the experimental and numerical performance curves at the 100% speed line, in which the red dashed line represents the normalized mass flow rate at the design point. According to the performance curves in Figure 4a, it should be noted that the trend of the numerical results is similar to that of the experimental ones. Additionally, the designed mass flow rate of the CFD is only 1.5% higher than that of the experimental results. The differences in the static pressure ratio and adiabatic efficiency between the CFD and the experiment were less than 2.9% and 2.8% at the design point. For the highly-loaded multistage compressor, published information on performance comparisons between the CFD and the experiment is extremely rare. One of the classic calculations from Ref. [9] (in which the difference between the numerical and experimental results is higher than 3%) indicates that the CFD accuracy of this research is acceptable. To validate the precision of the unsteady method, the unsteady pressure fluctuation at the 1-13 location is shown in Figure 4b, and it indicates that the flow structure obtained by the experiment is also reflected in the CFD.
Figure 5 shows that for the part of S0 + R1 (here, S0 indicates the IGV), both the static pressure ratio and the adiabatic efficiency slightly changed as the grid number of the single passage increased from 250,000~280,000 to 410,000~450,000. For the part of S1 + R2, the static pressure ratio changes were extremely limited and the adiabatic efficiency averagely decreased by only about 0.16%. As the grid number of the single passage reached 330,000~360,000, both the static pressure ratio and the adiabatic efficiency remained unchanged. Meanwhile, the uncertainty analysis of the simulation was conducted with the method by Celik [24], and the results are shown in Table 1. It was noticed that the uncertainties of the pressure ratio and efficiency were all lower than 0.005 and 0.007. The results show that the grid number chosen in this study was appropriate.

4. Results and Discussions

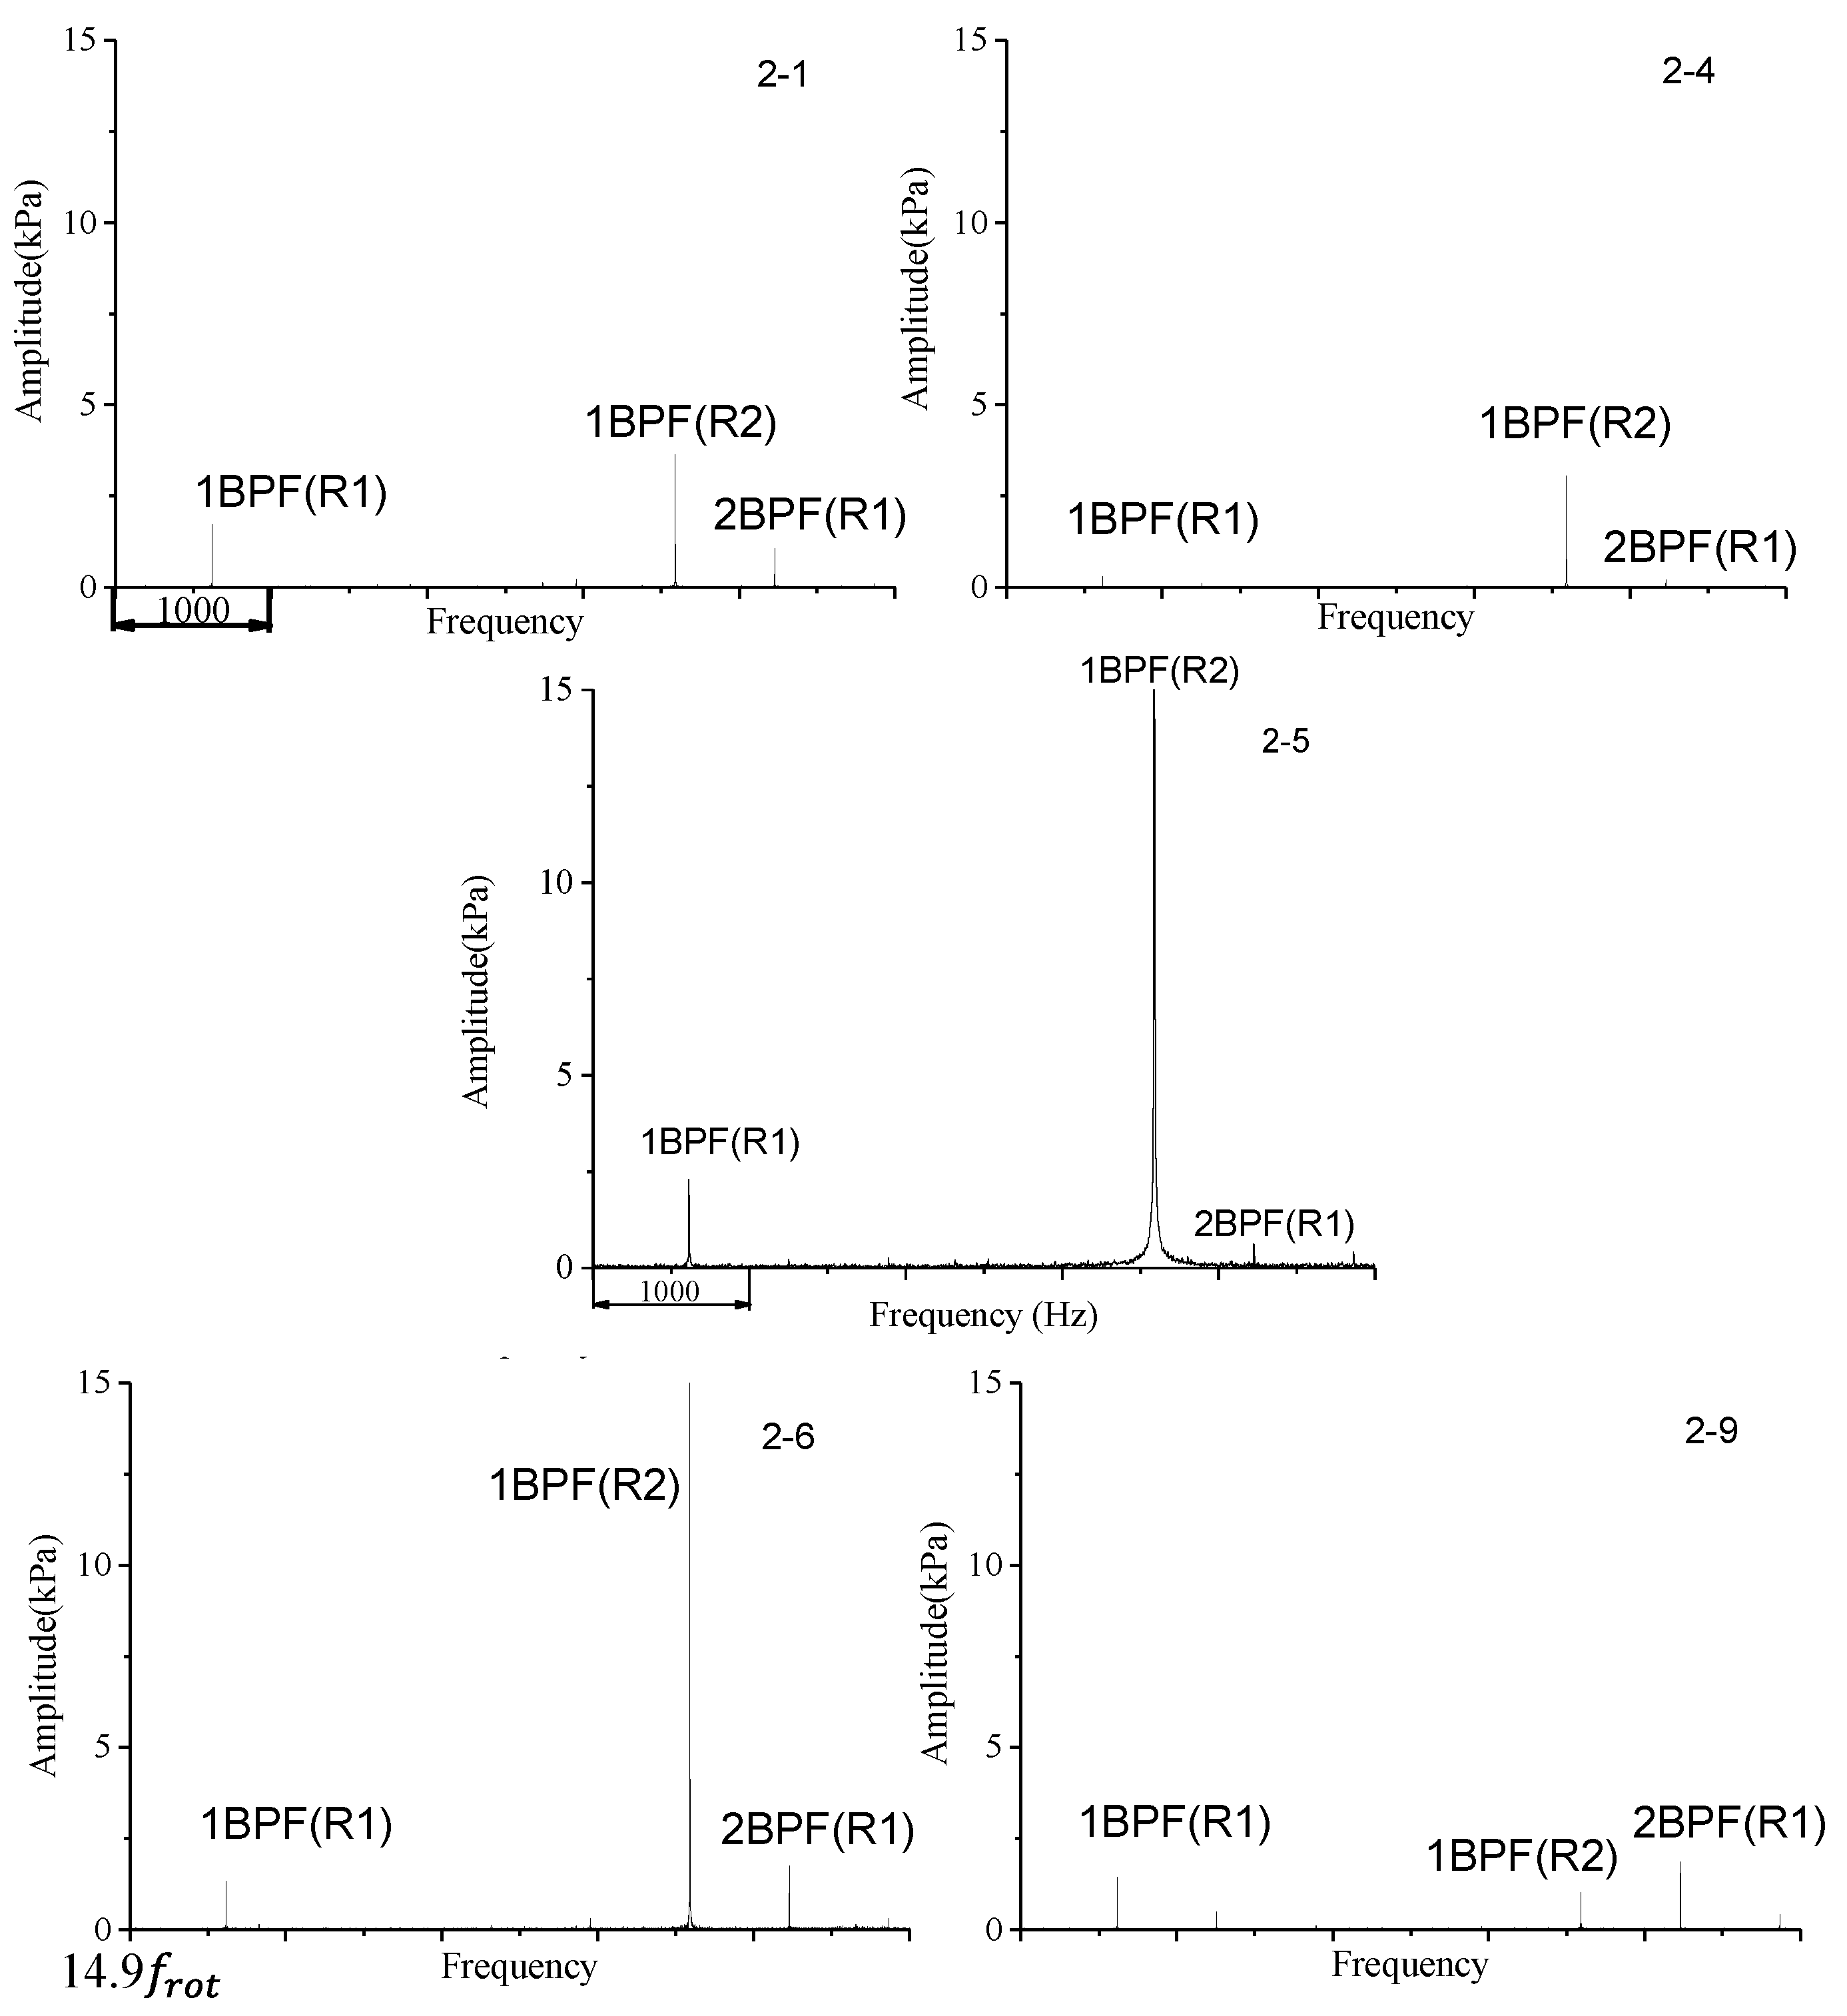
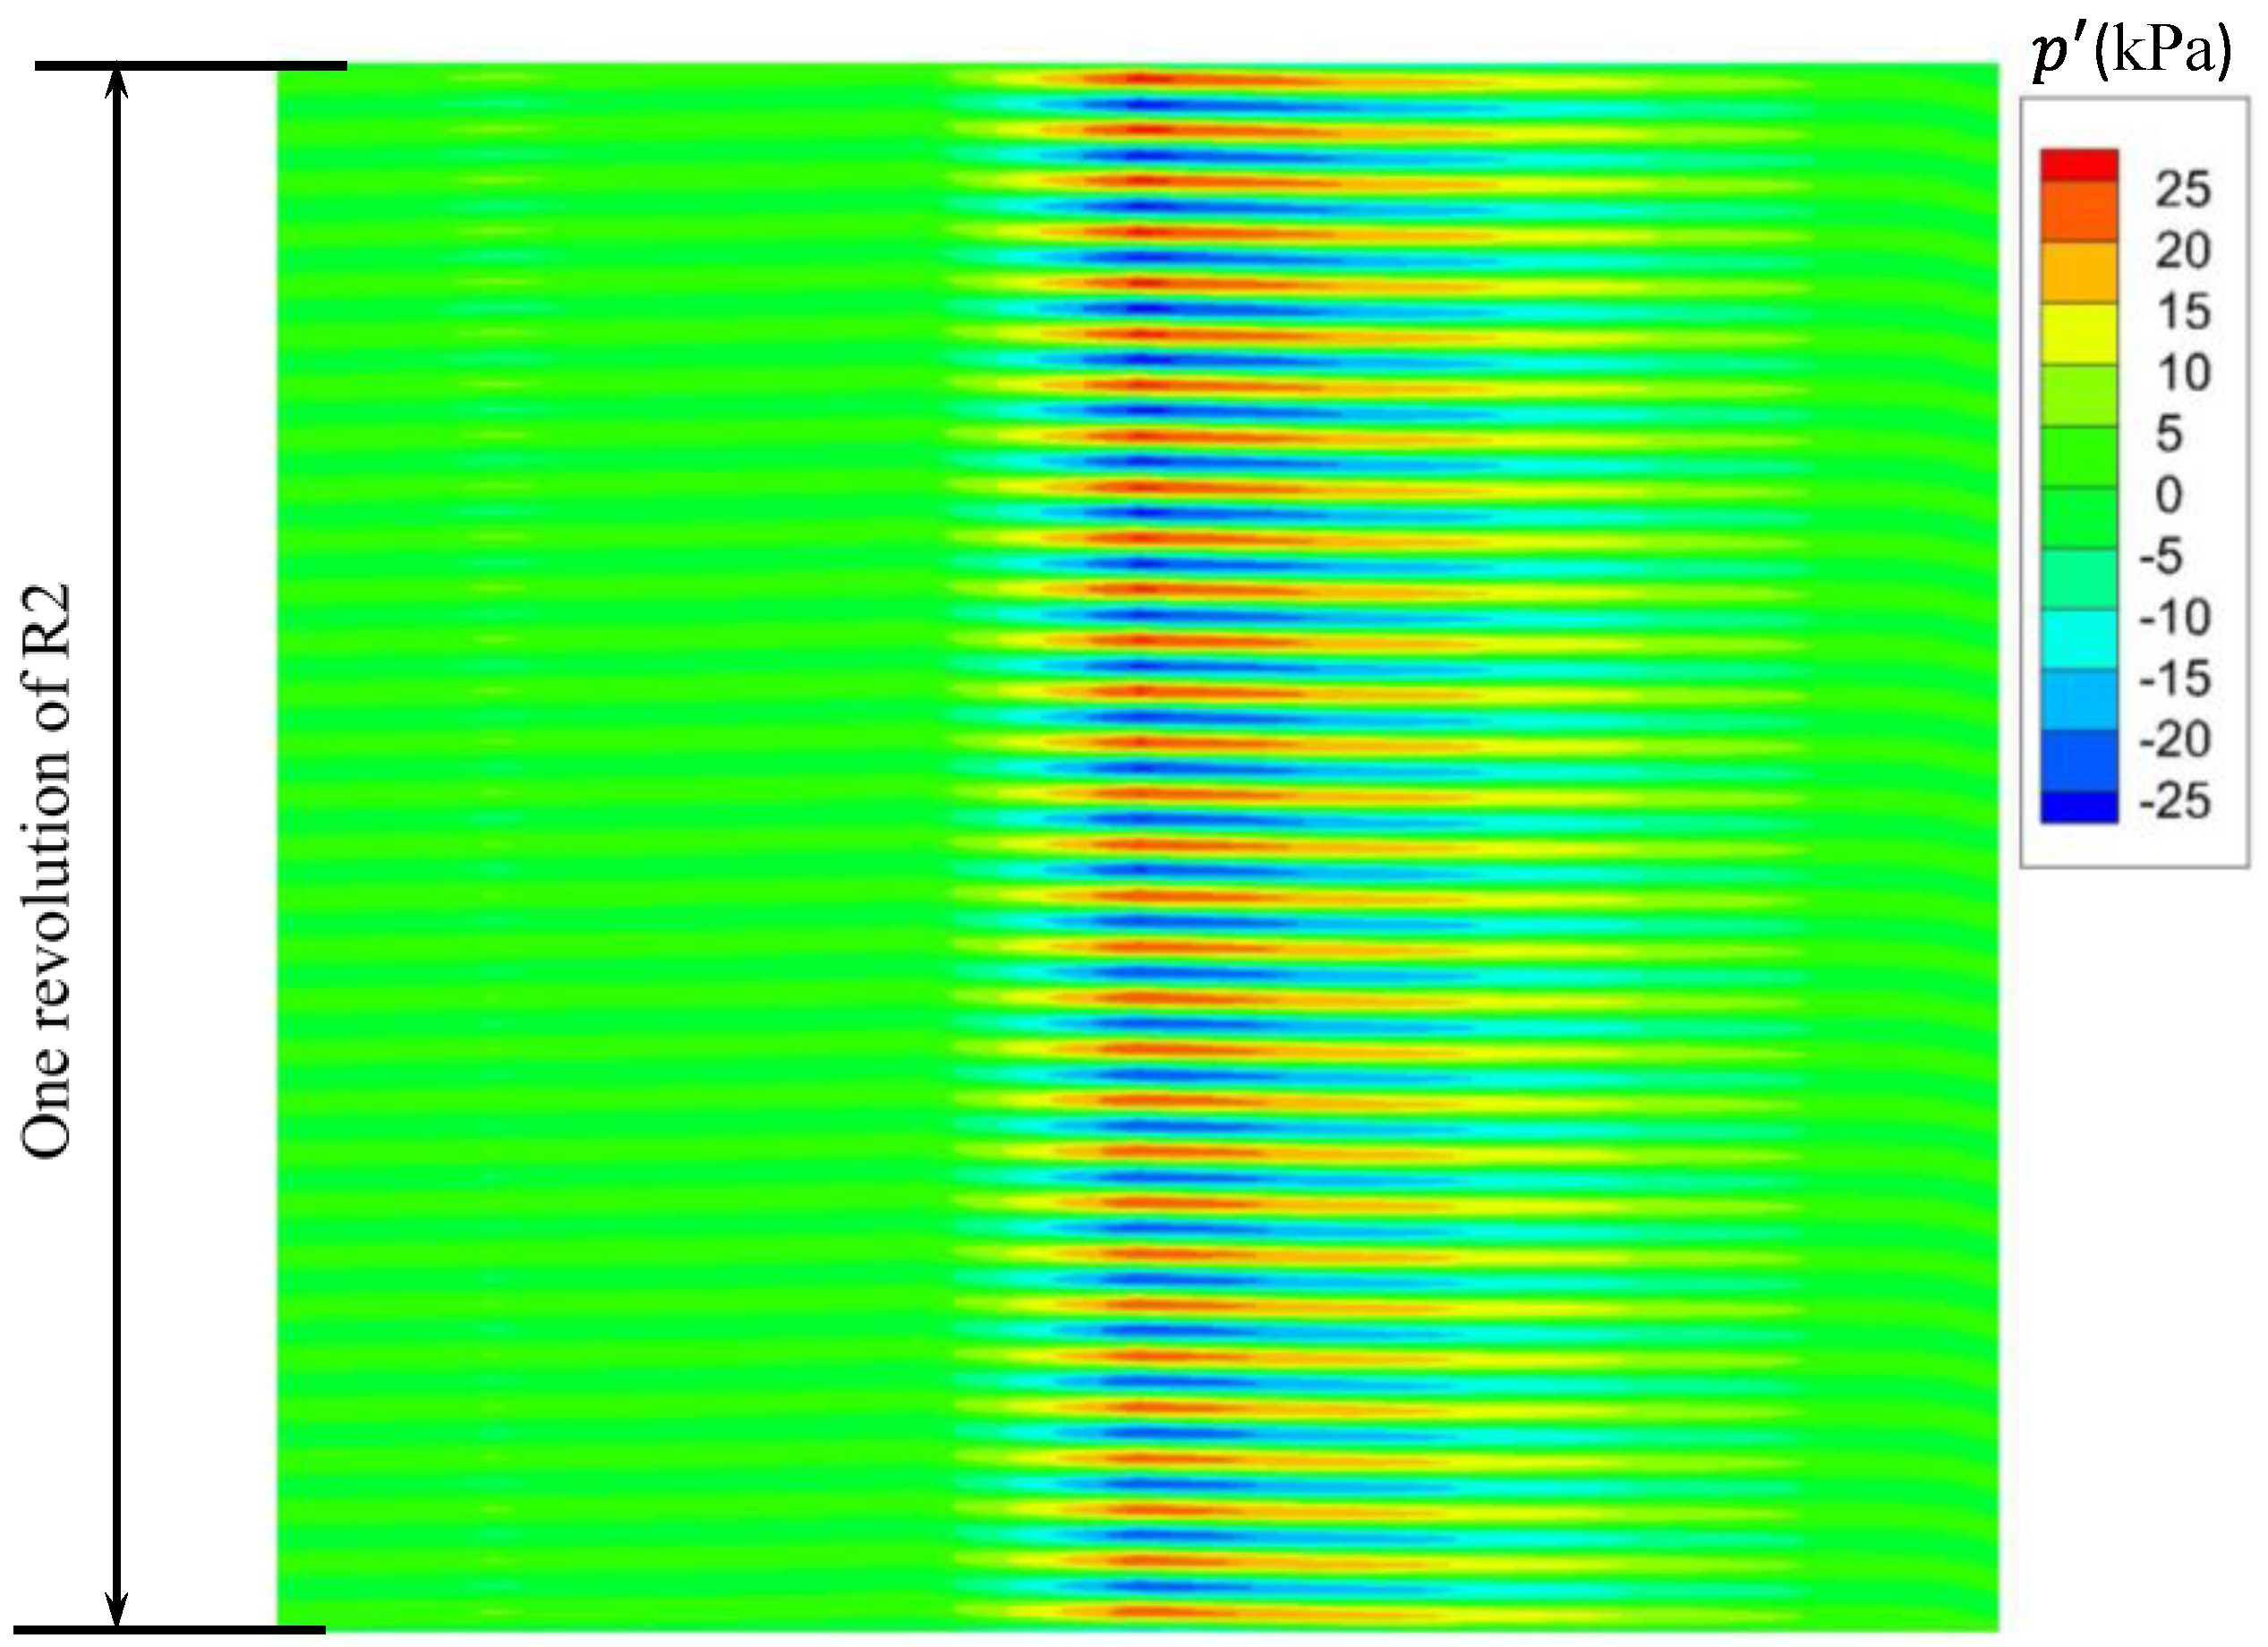
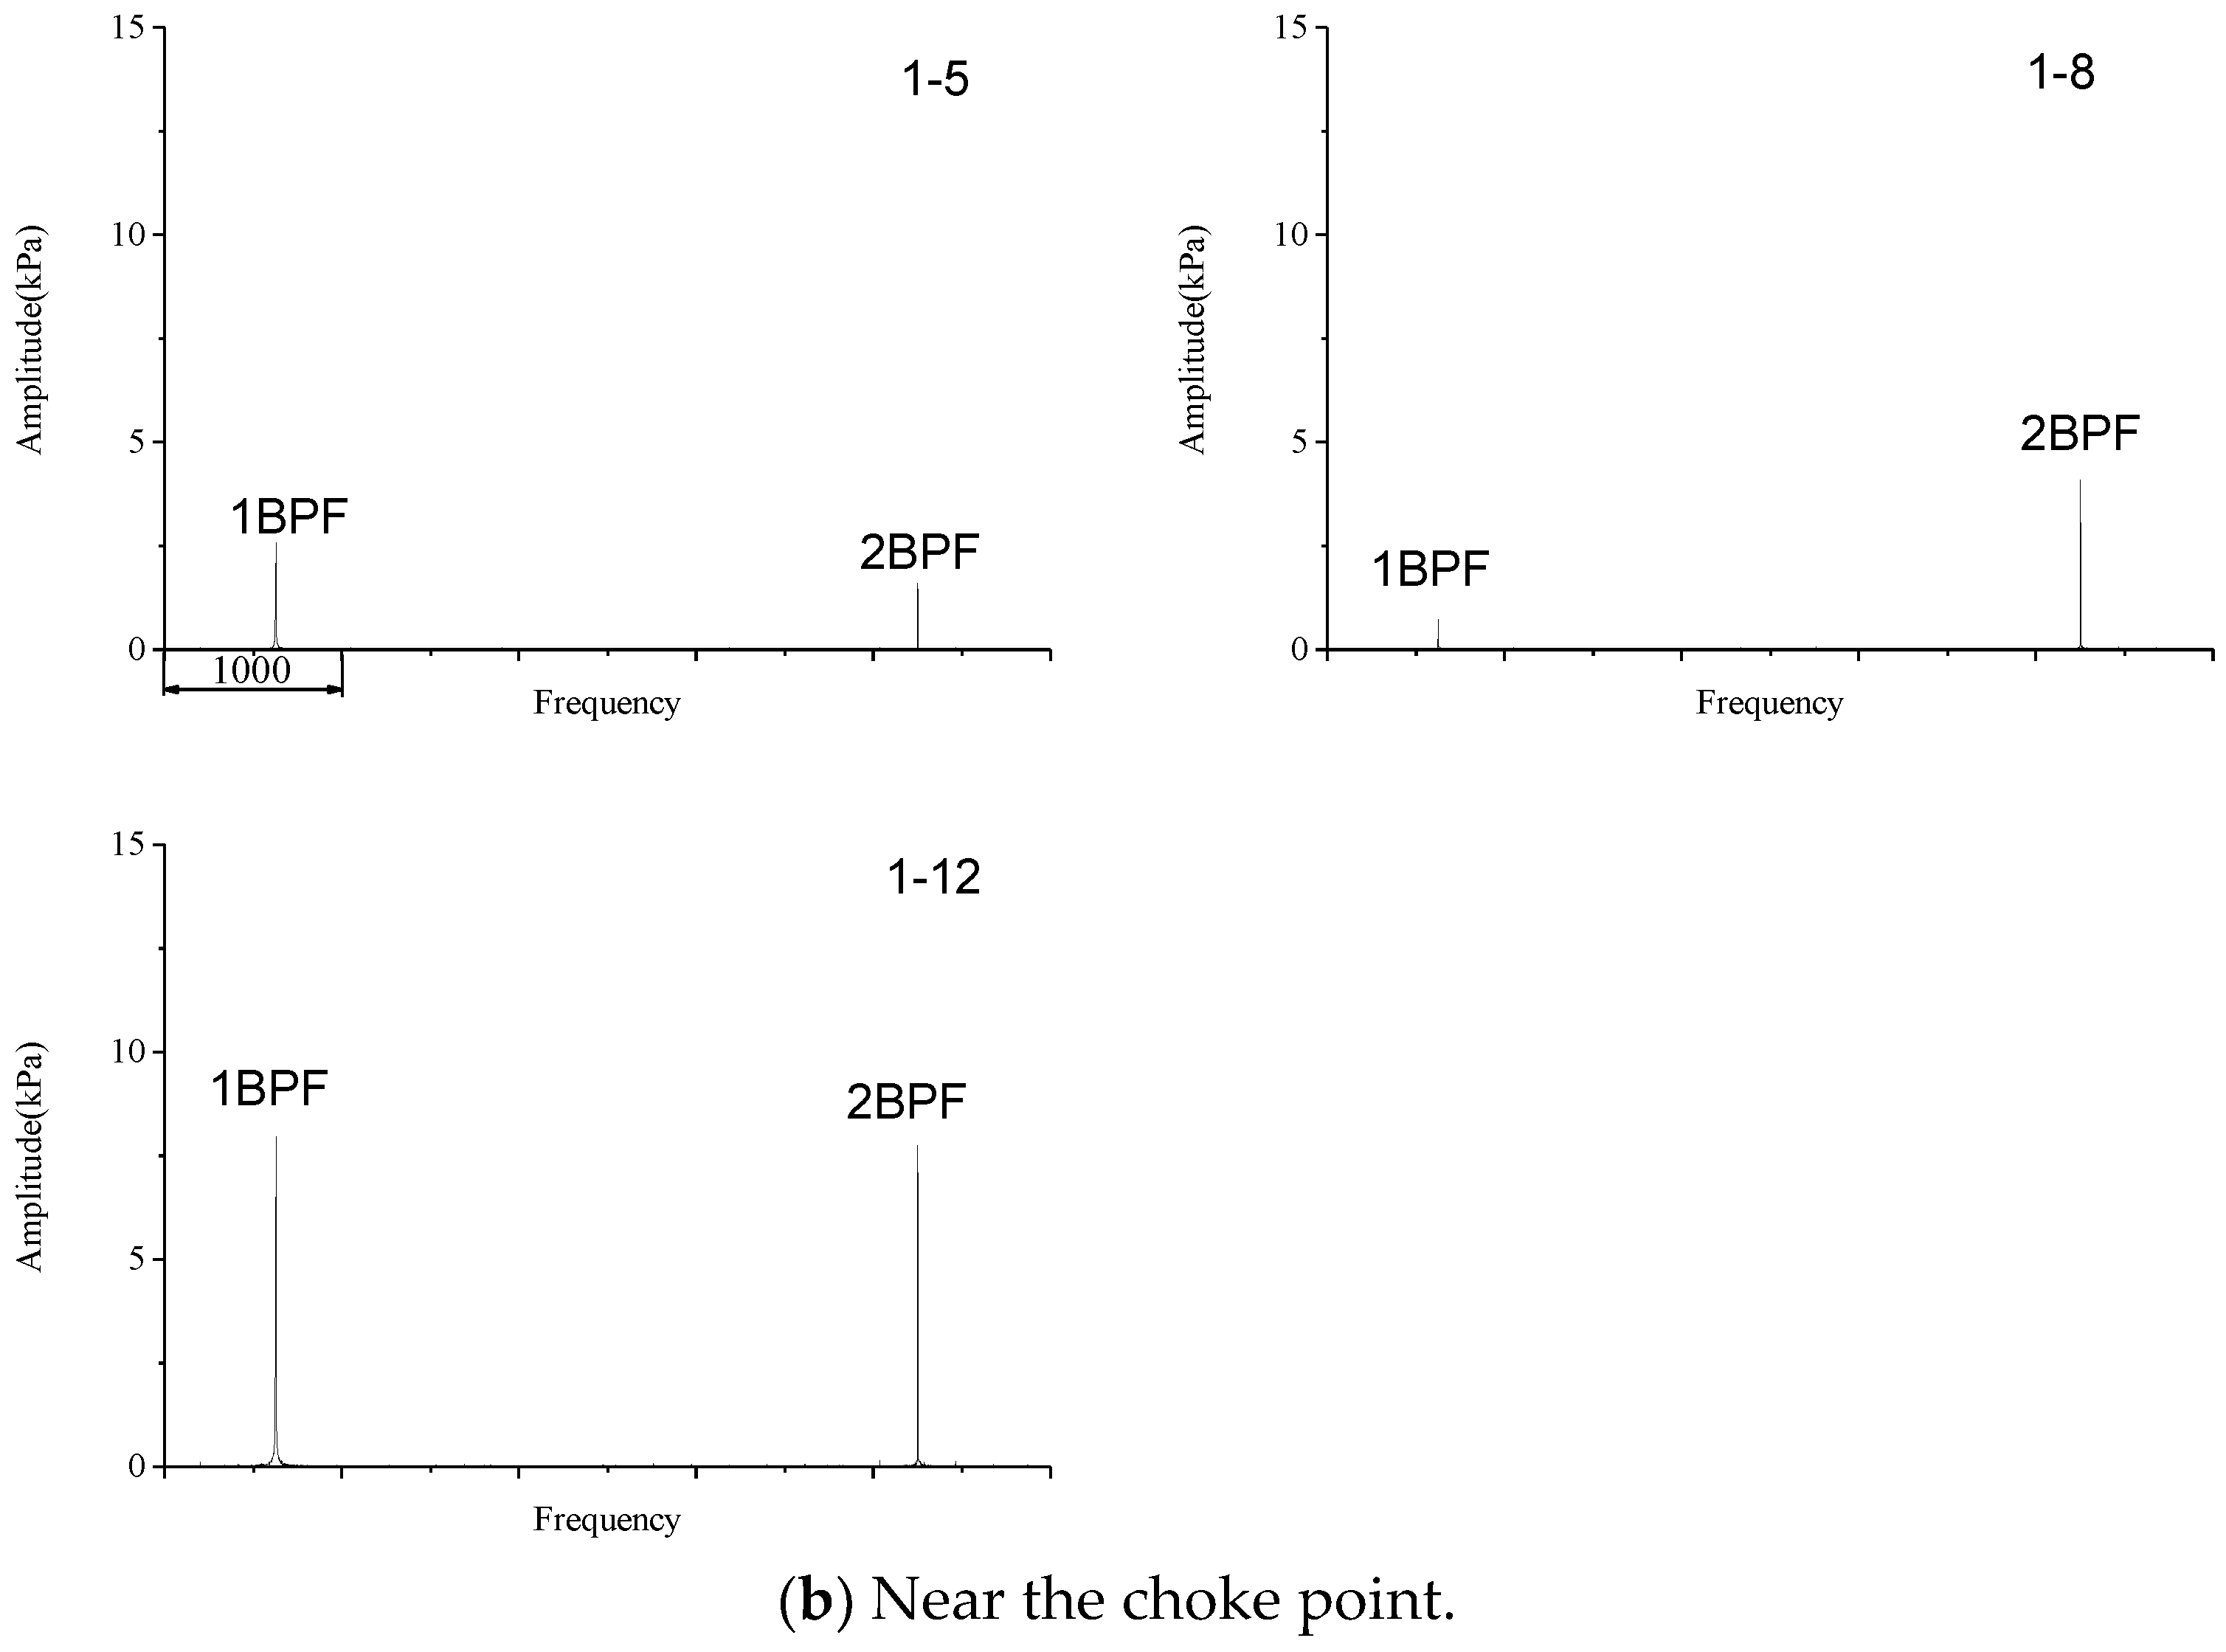
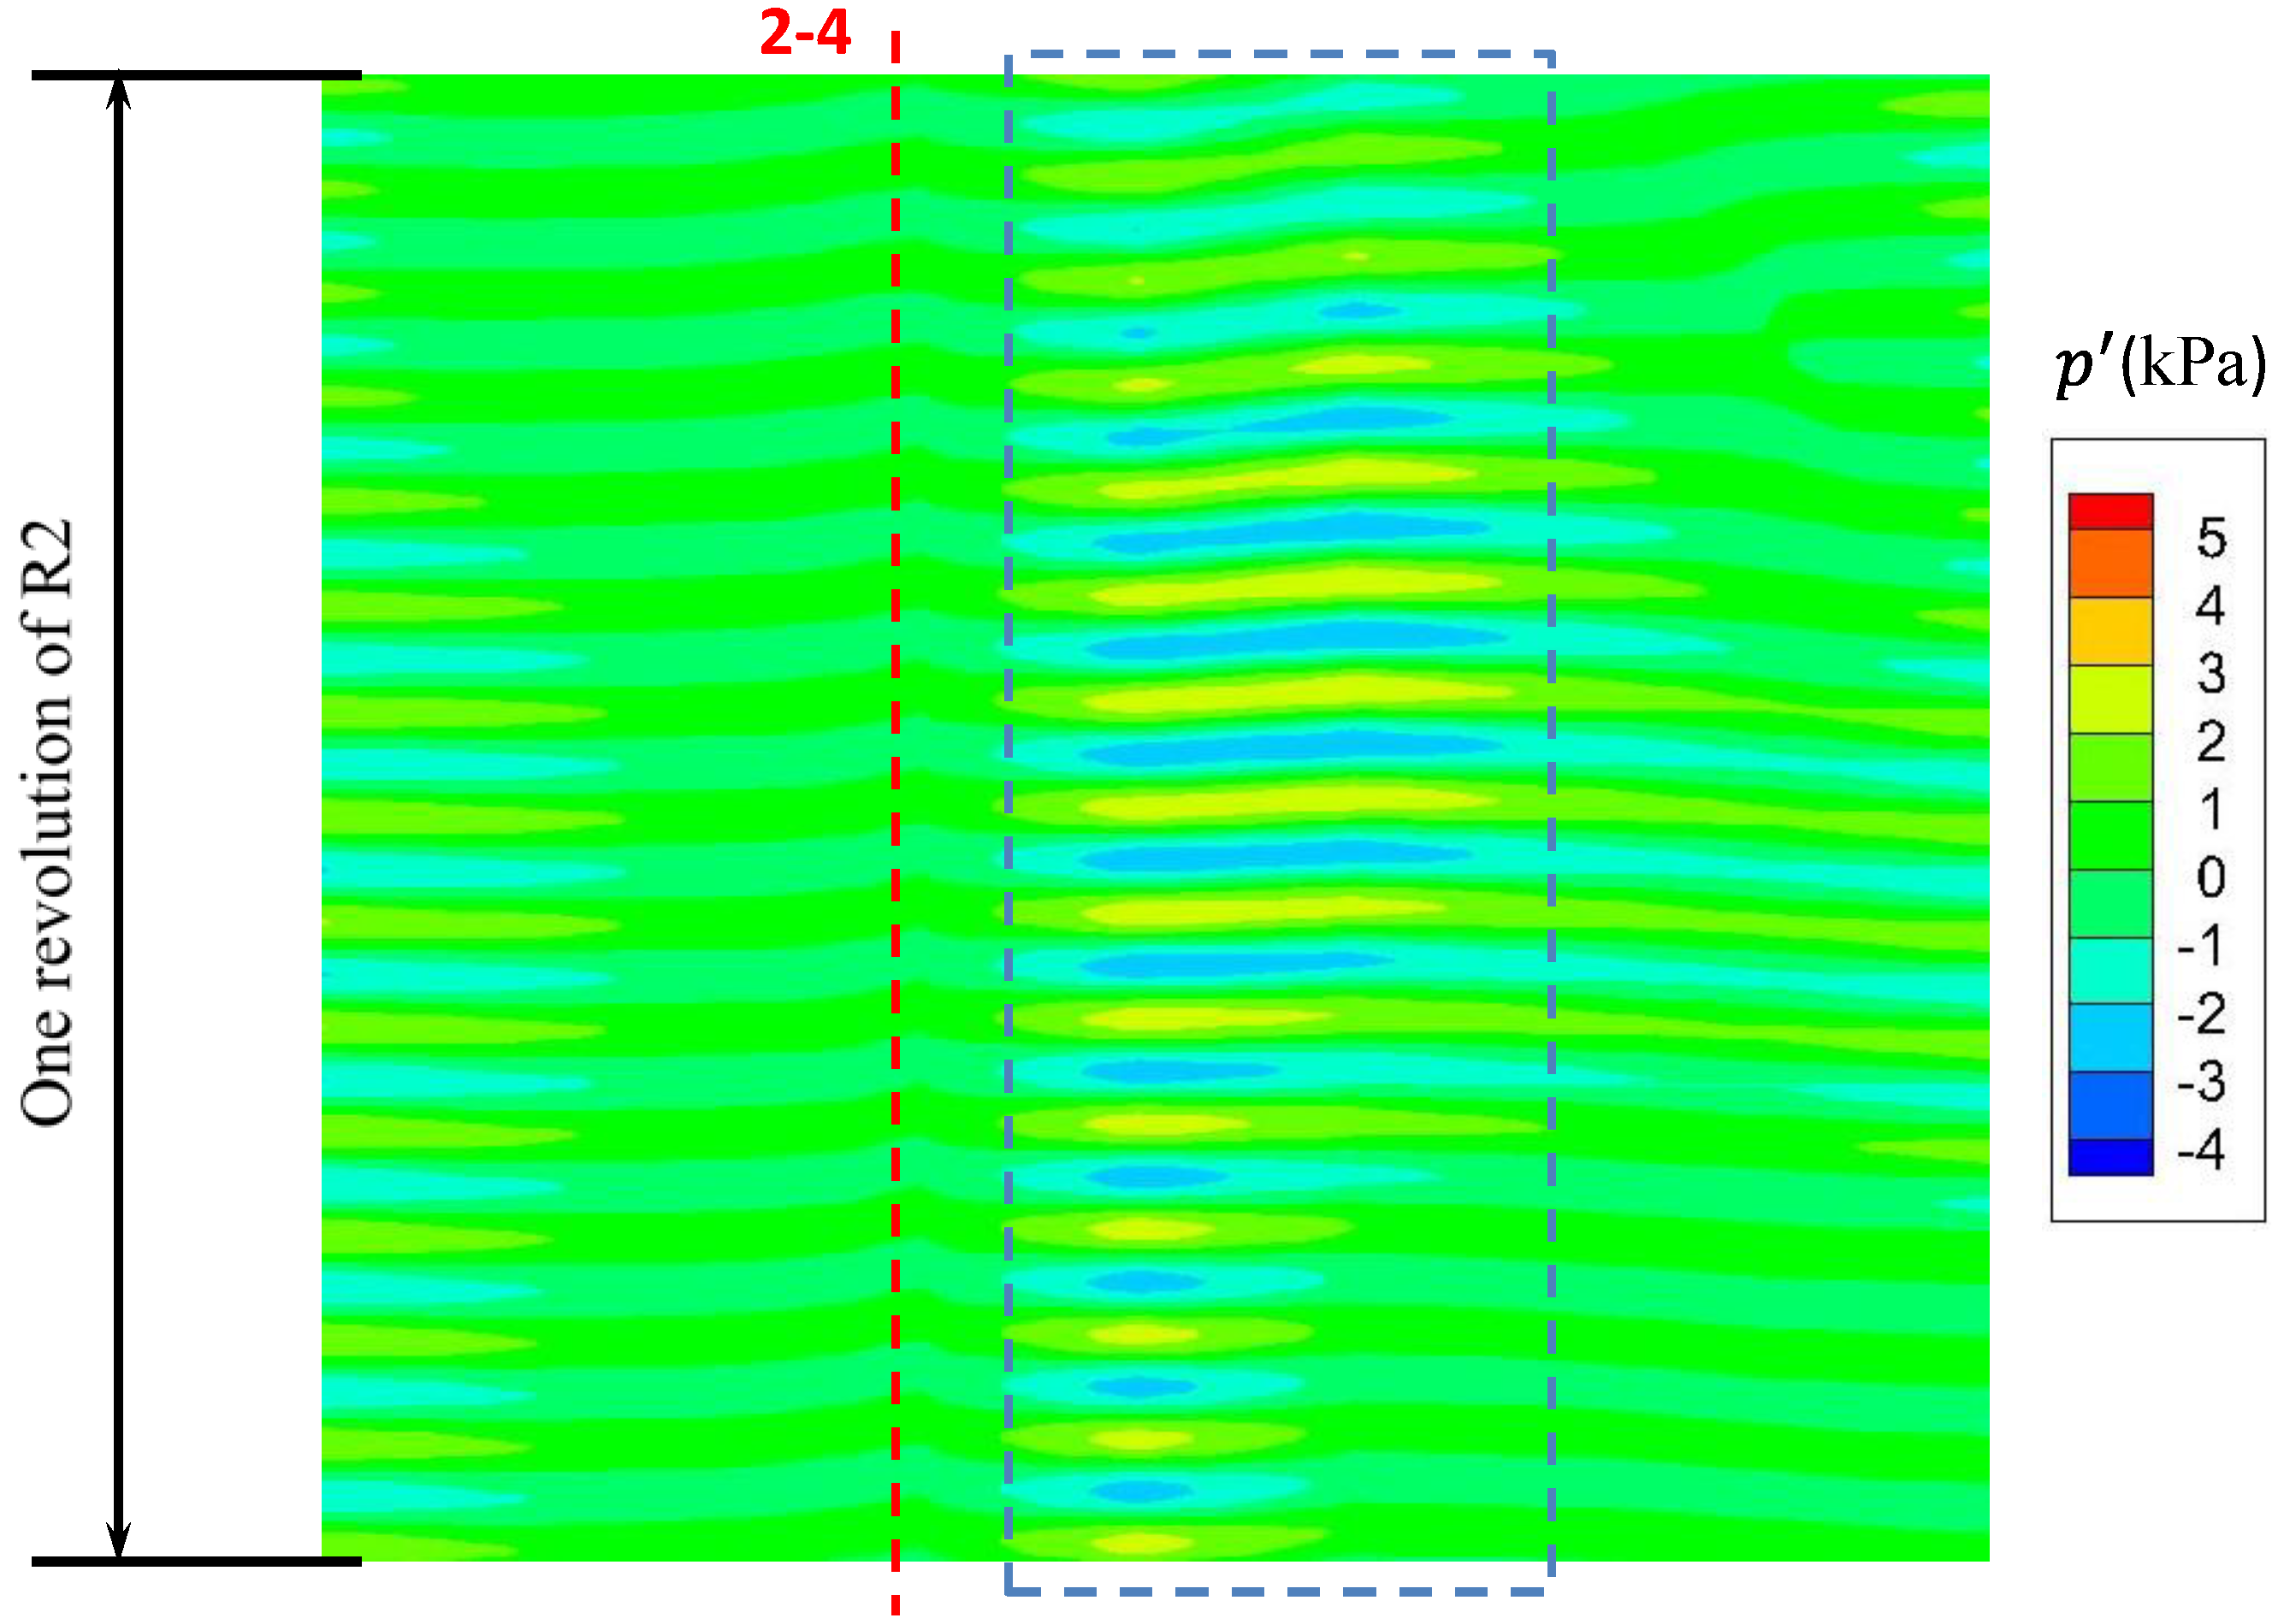
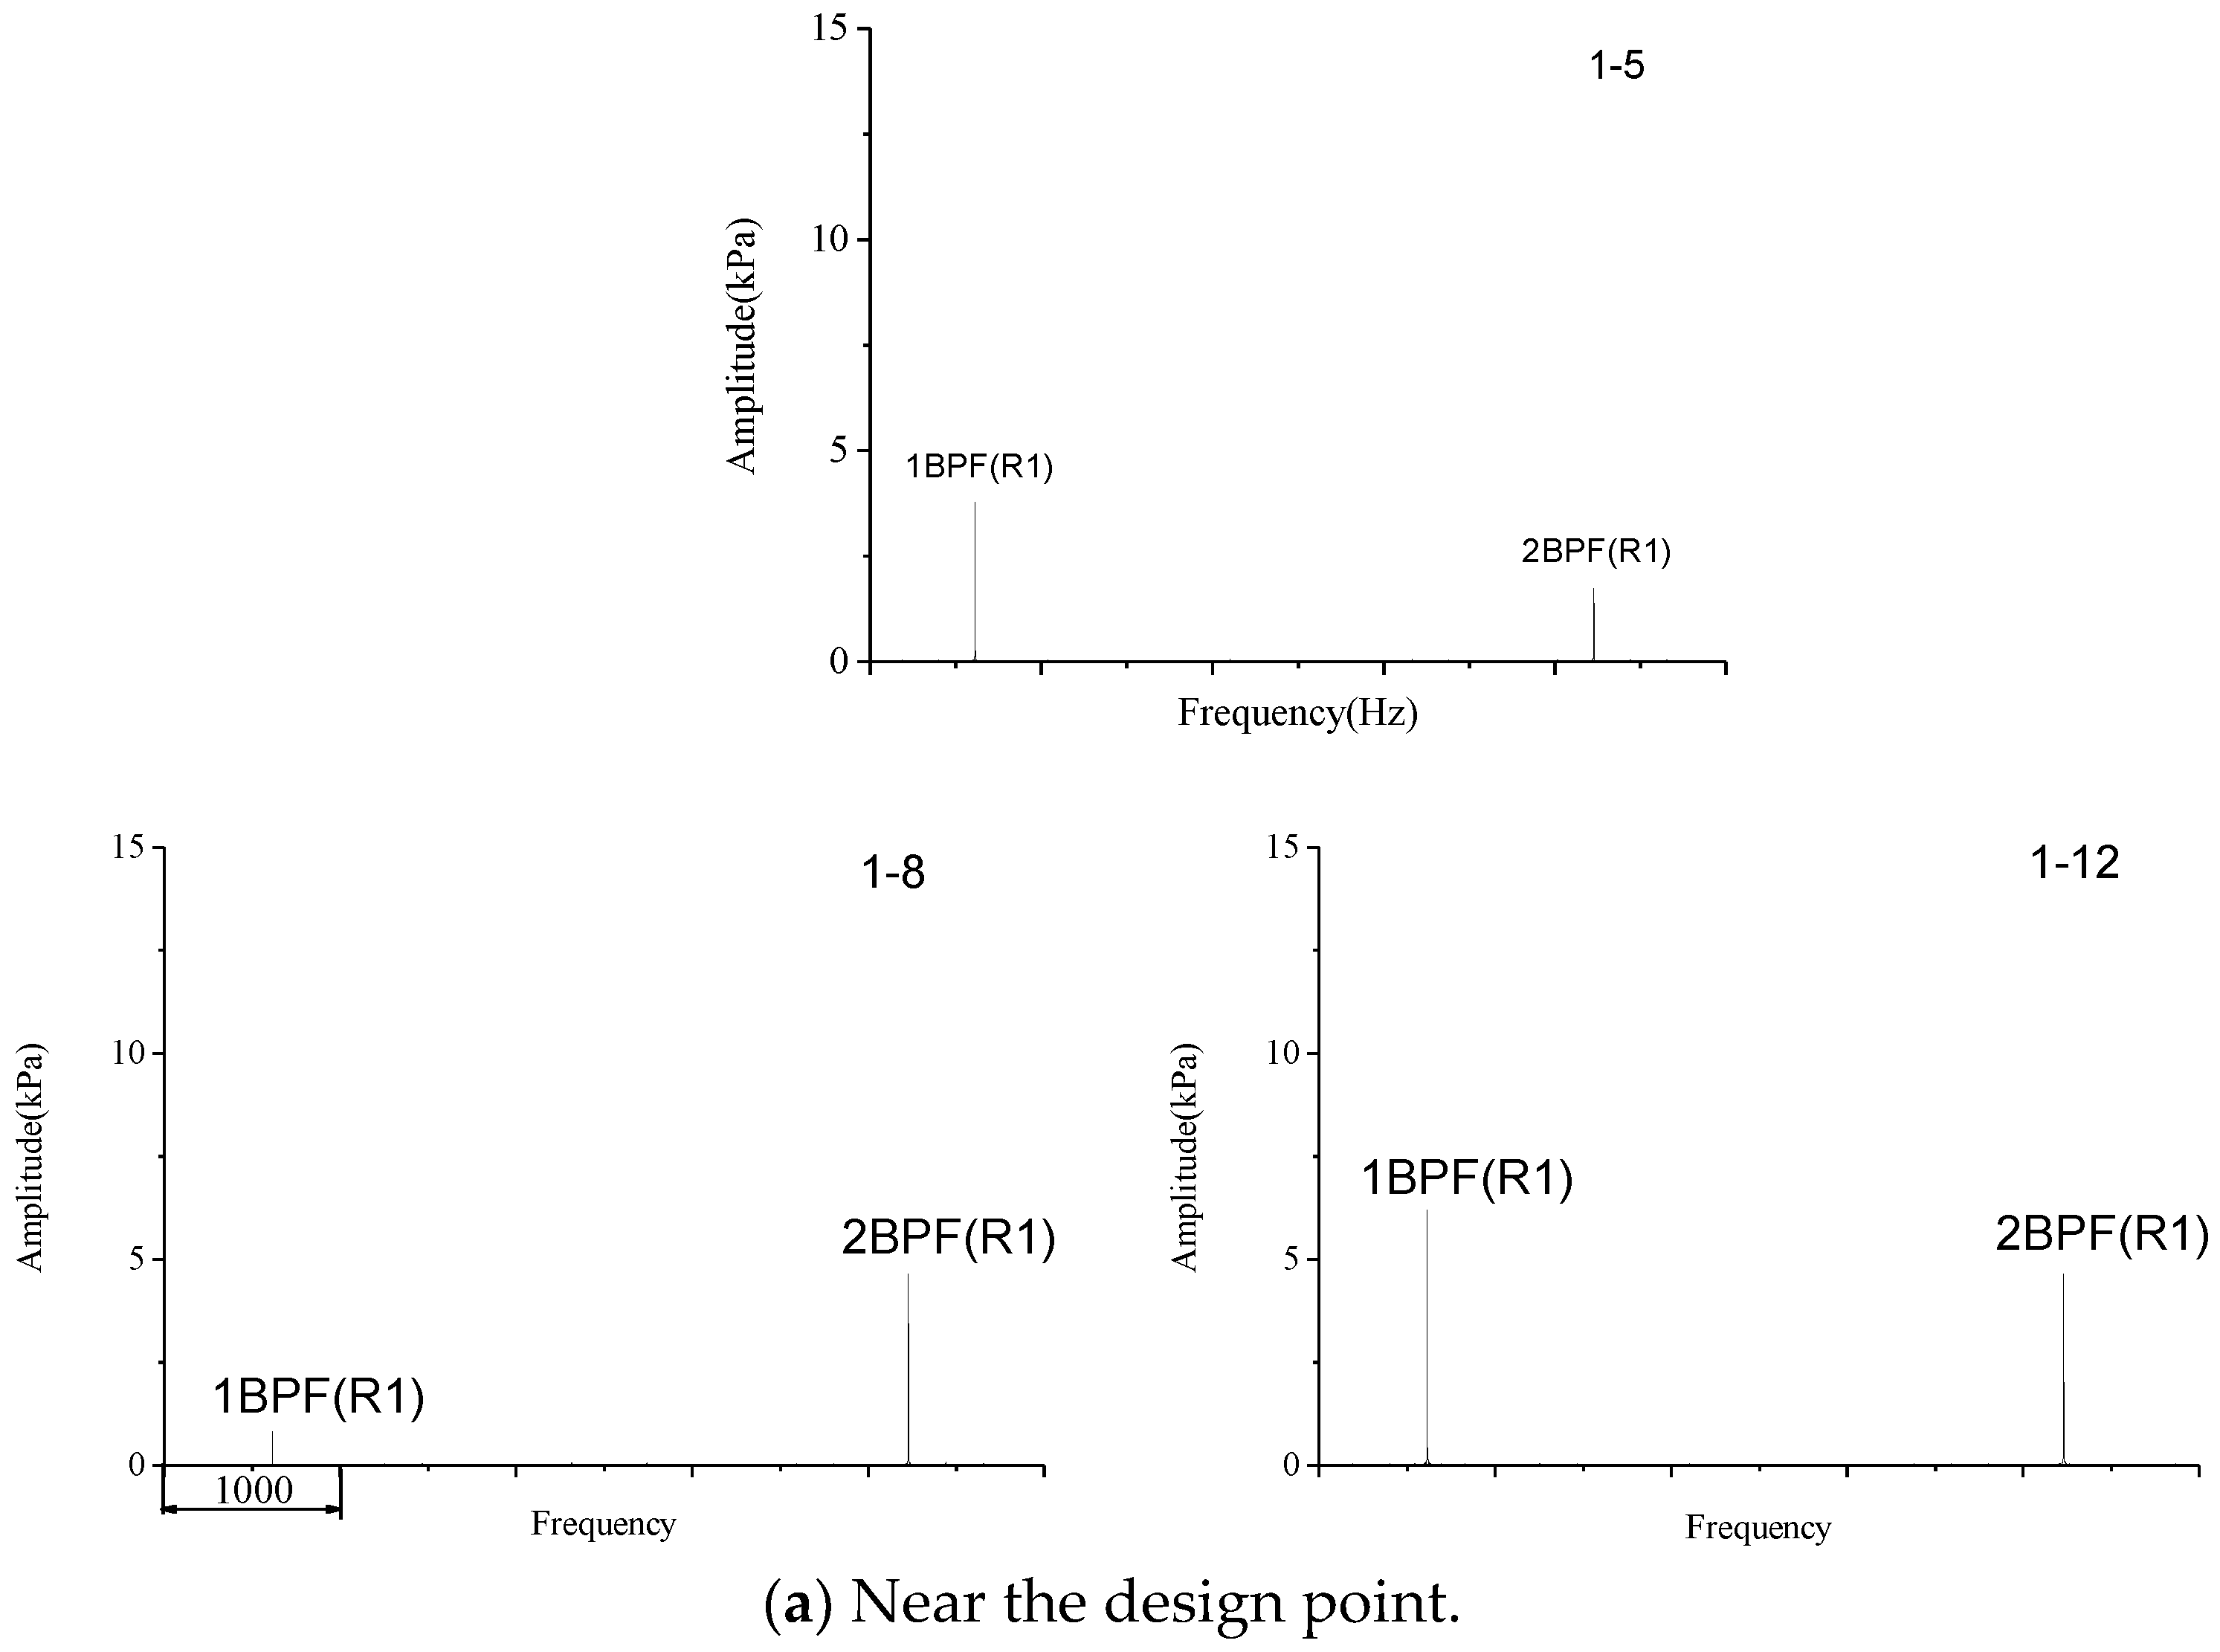
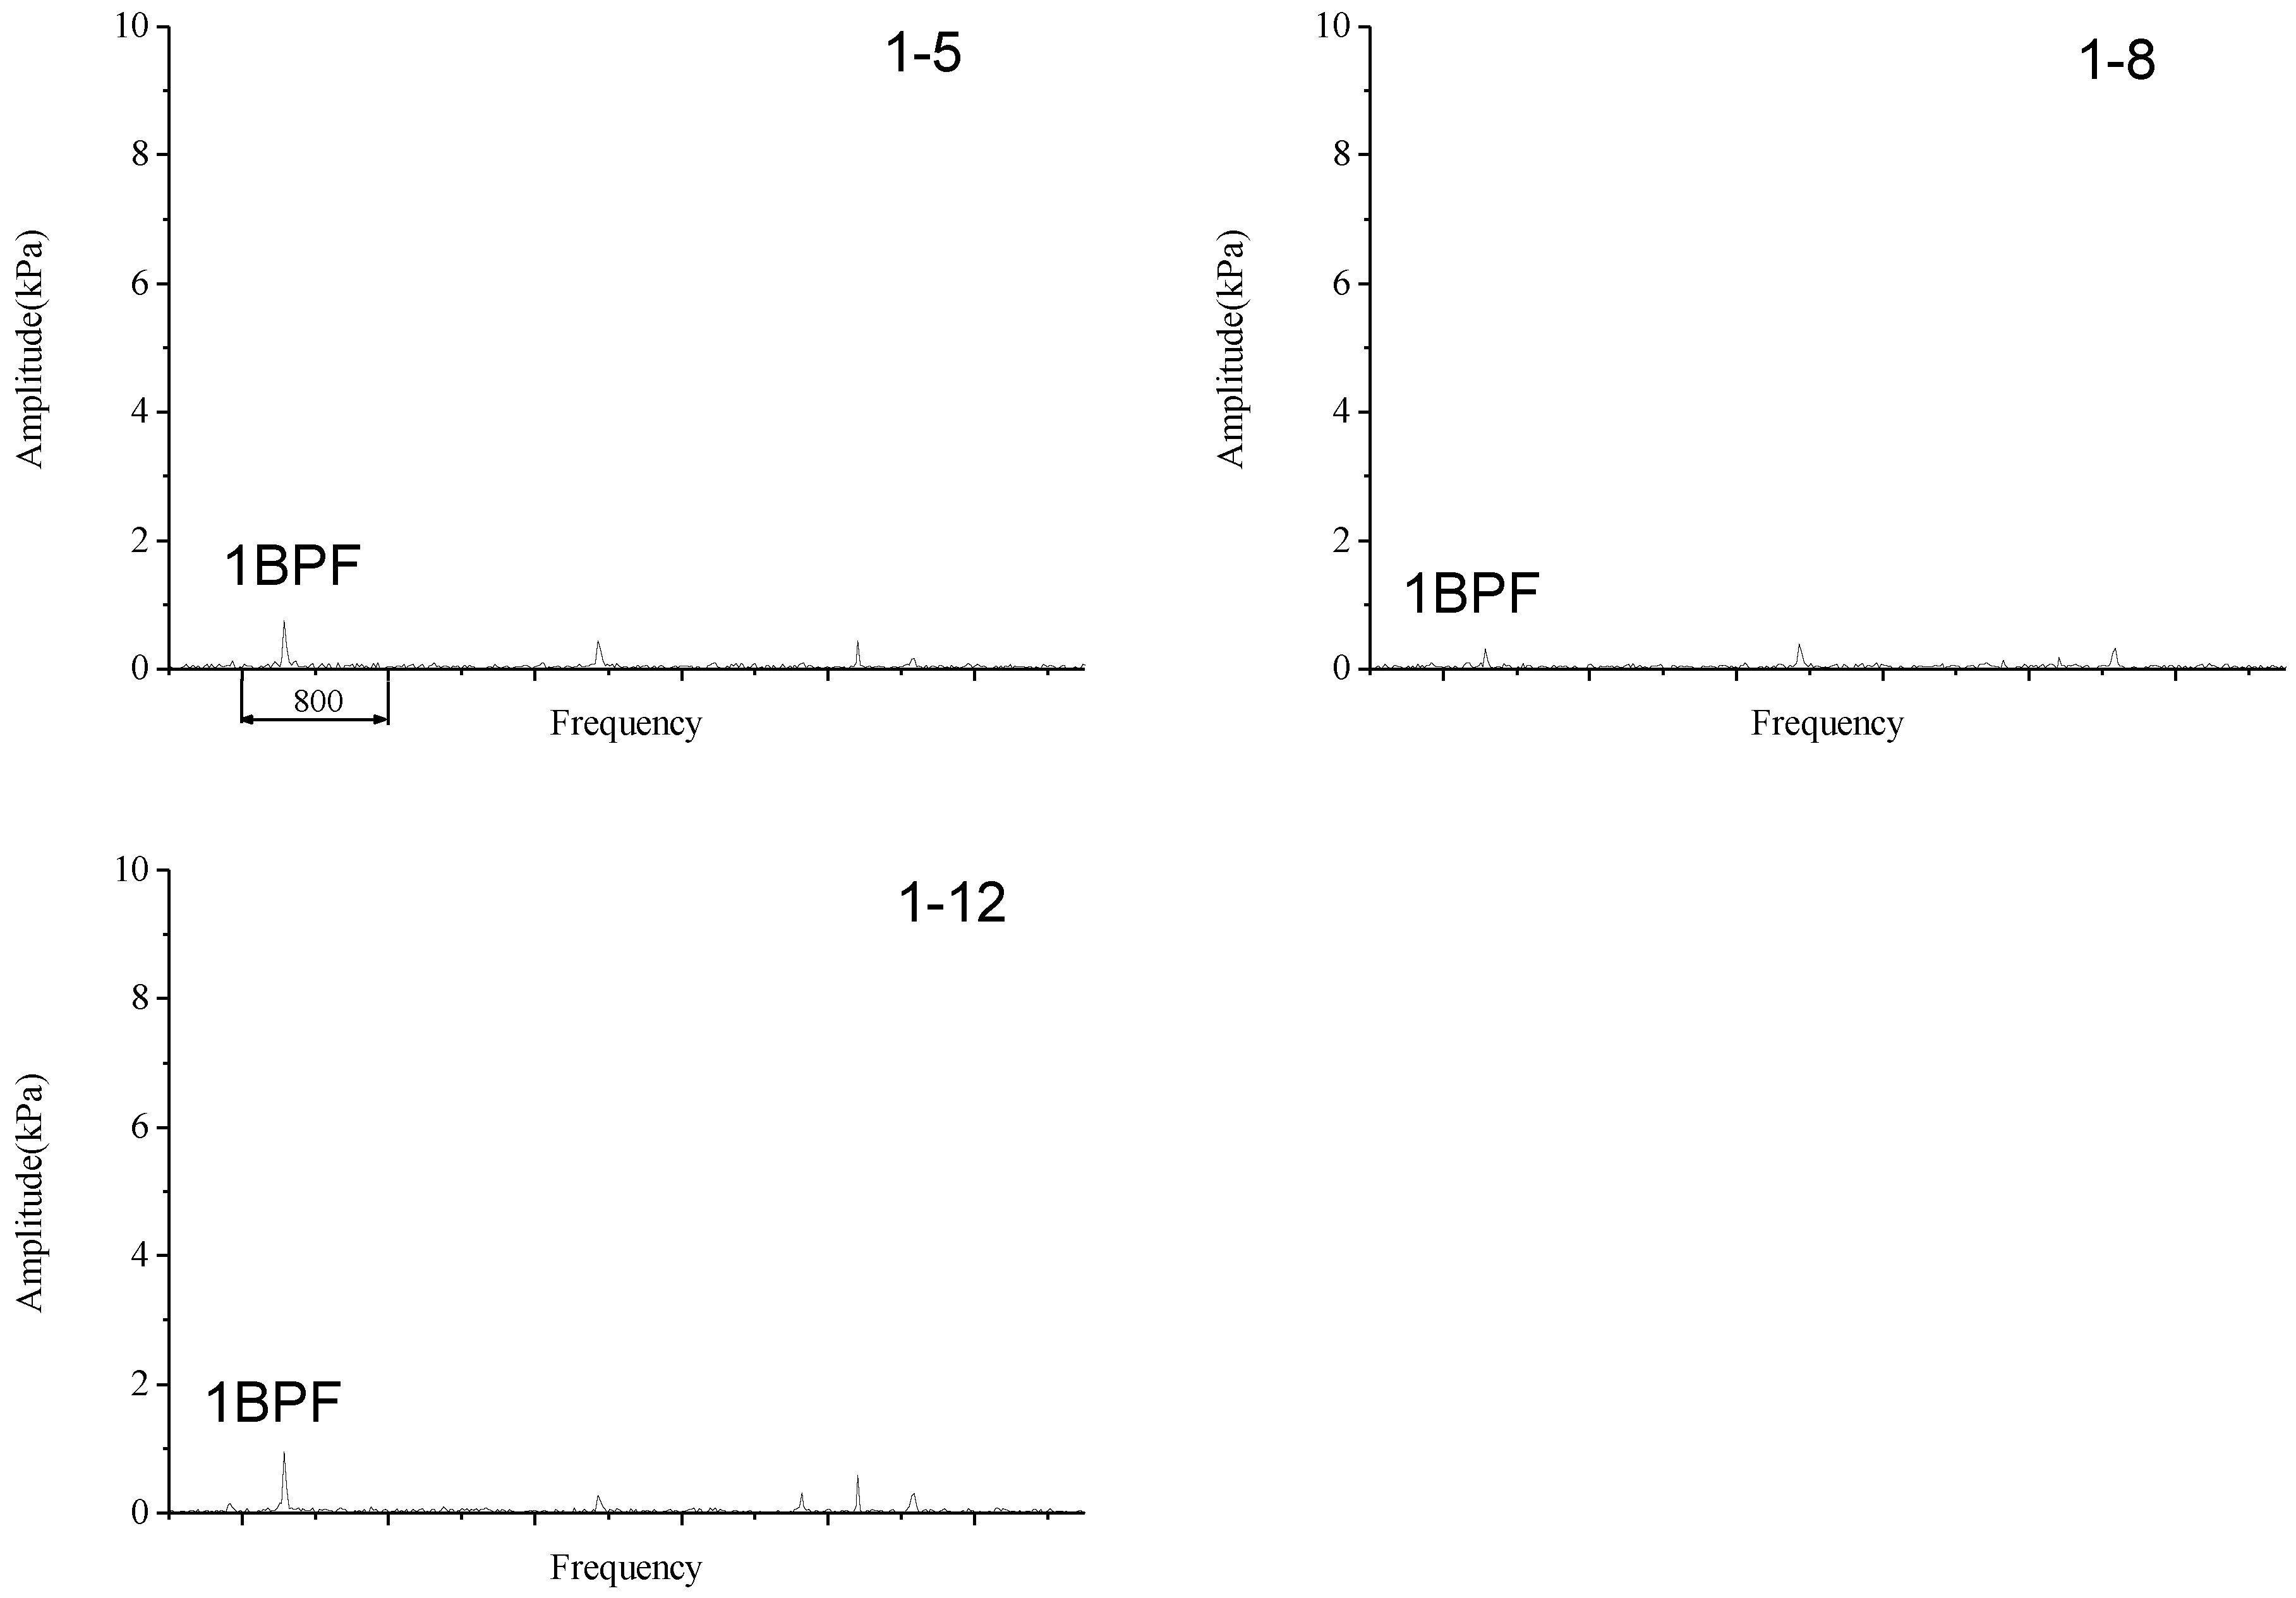
4.1. Frequency Spectrum inside R2

At the current stage, as the key point is the blade sweep effect, the power of which is mainly concentrated on the first two harmonics (namely the 1 blade-passing frequency (BPF) and the 2BPF), the spectrums induced by other flow structures are not discussed in this paper. The extracts of the 1BPF and 2BPF disturbances were conducted with the band pass technique based on the fast Fourier transform (FFT) method. The frequency spectrums of the experimental transient pressures at the 2-1, 2-4, 2-5, 2-6, and 2-9 locations are shown in Figure 6. The 100% rotational speed line and the near design condition were chosen first. It was noticed that the first two harmonics of the R1 blade sweep disturbance (the two harmonics are defined as R1-1BPF and R1-2BPF here) asynchronously varied and did not successively decline along the R1 chord. For example, at the 2-1 location, which is near the inlet of R2, both the R1-1BPF and R1-2BPF disturbances are notable (more than 9% of the p r o t 2 , where the p r o t 2 is the static pressure rise within R2) and the strength of R1-1BPF was evidently higher than that of R1-2BPF. As the measurement location moved downstream, both of the two disturbances became significantly weak at the location of 2-4. However, this trend was not held further and the strength of R1-1BPF grew again at the 2-5, 2-6, and 2-9 locations. Using location 2-5 as an example, the strength of R1-1BPF grew by 24% relative to the 2-1 location. Meanwhile, R1-2BPF had a similar trend (from the initial drop to the following increase), but its strength growth began at the 2-6 location instead of the 2-5 location. Additionally, it is shown that the sudden increase in R1-2BPF at the 2-6 location (the amplitude increased by about 68% compared to the 2-1 location) was higher than the situation of R1-1BPF at the 2-5 location. Moreover, as the figure depicts, the amplitude of R1-2BPF from the middle (location 2-6) to the rear part (location 2-9) of R2 was higher than R1-1BPF, indicating that the two disturbances propagated differently after their sudden increases. Inferred from the phenomena above, it is concluded that firstly, the strengths of R1 sweep disturbances do not always decrease along the streamline and will be obviously enhanced under the interaction effect of several flow structures at specific locations. Secondly, the flow structures inducing the R1-1BPF and R1-2BPF disturbances are not the same and the interference characteristics of these two structures are also different, the result of which is that the increasing trend of R1-1BPF at the middle part of R2 is not the same as that of R1-2BPF.

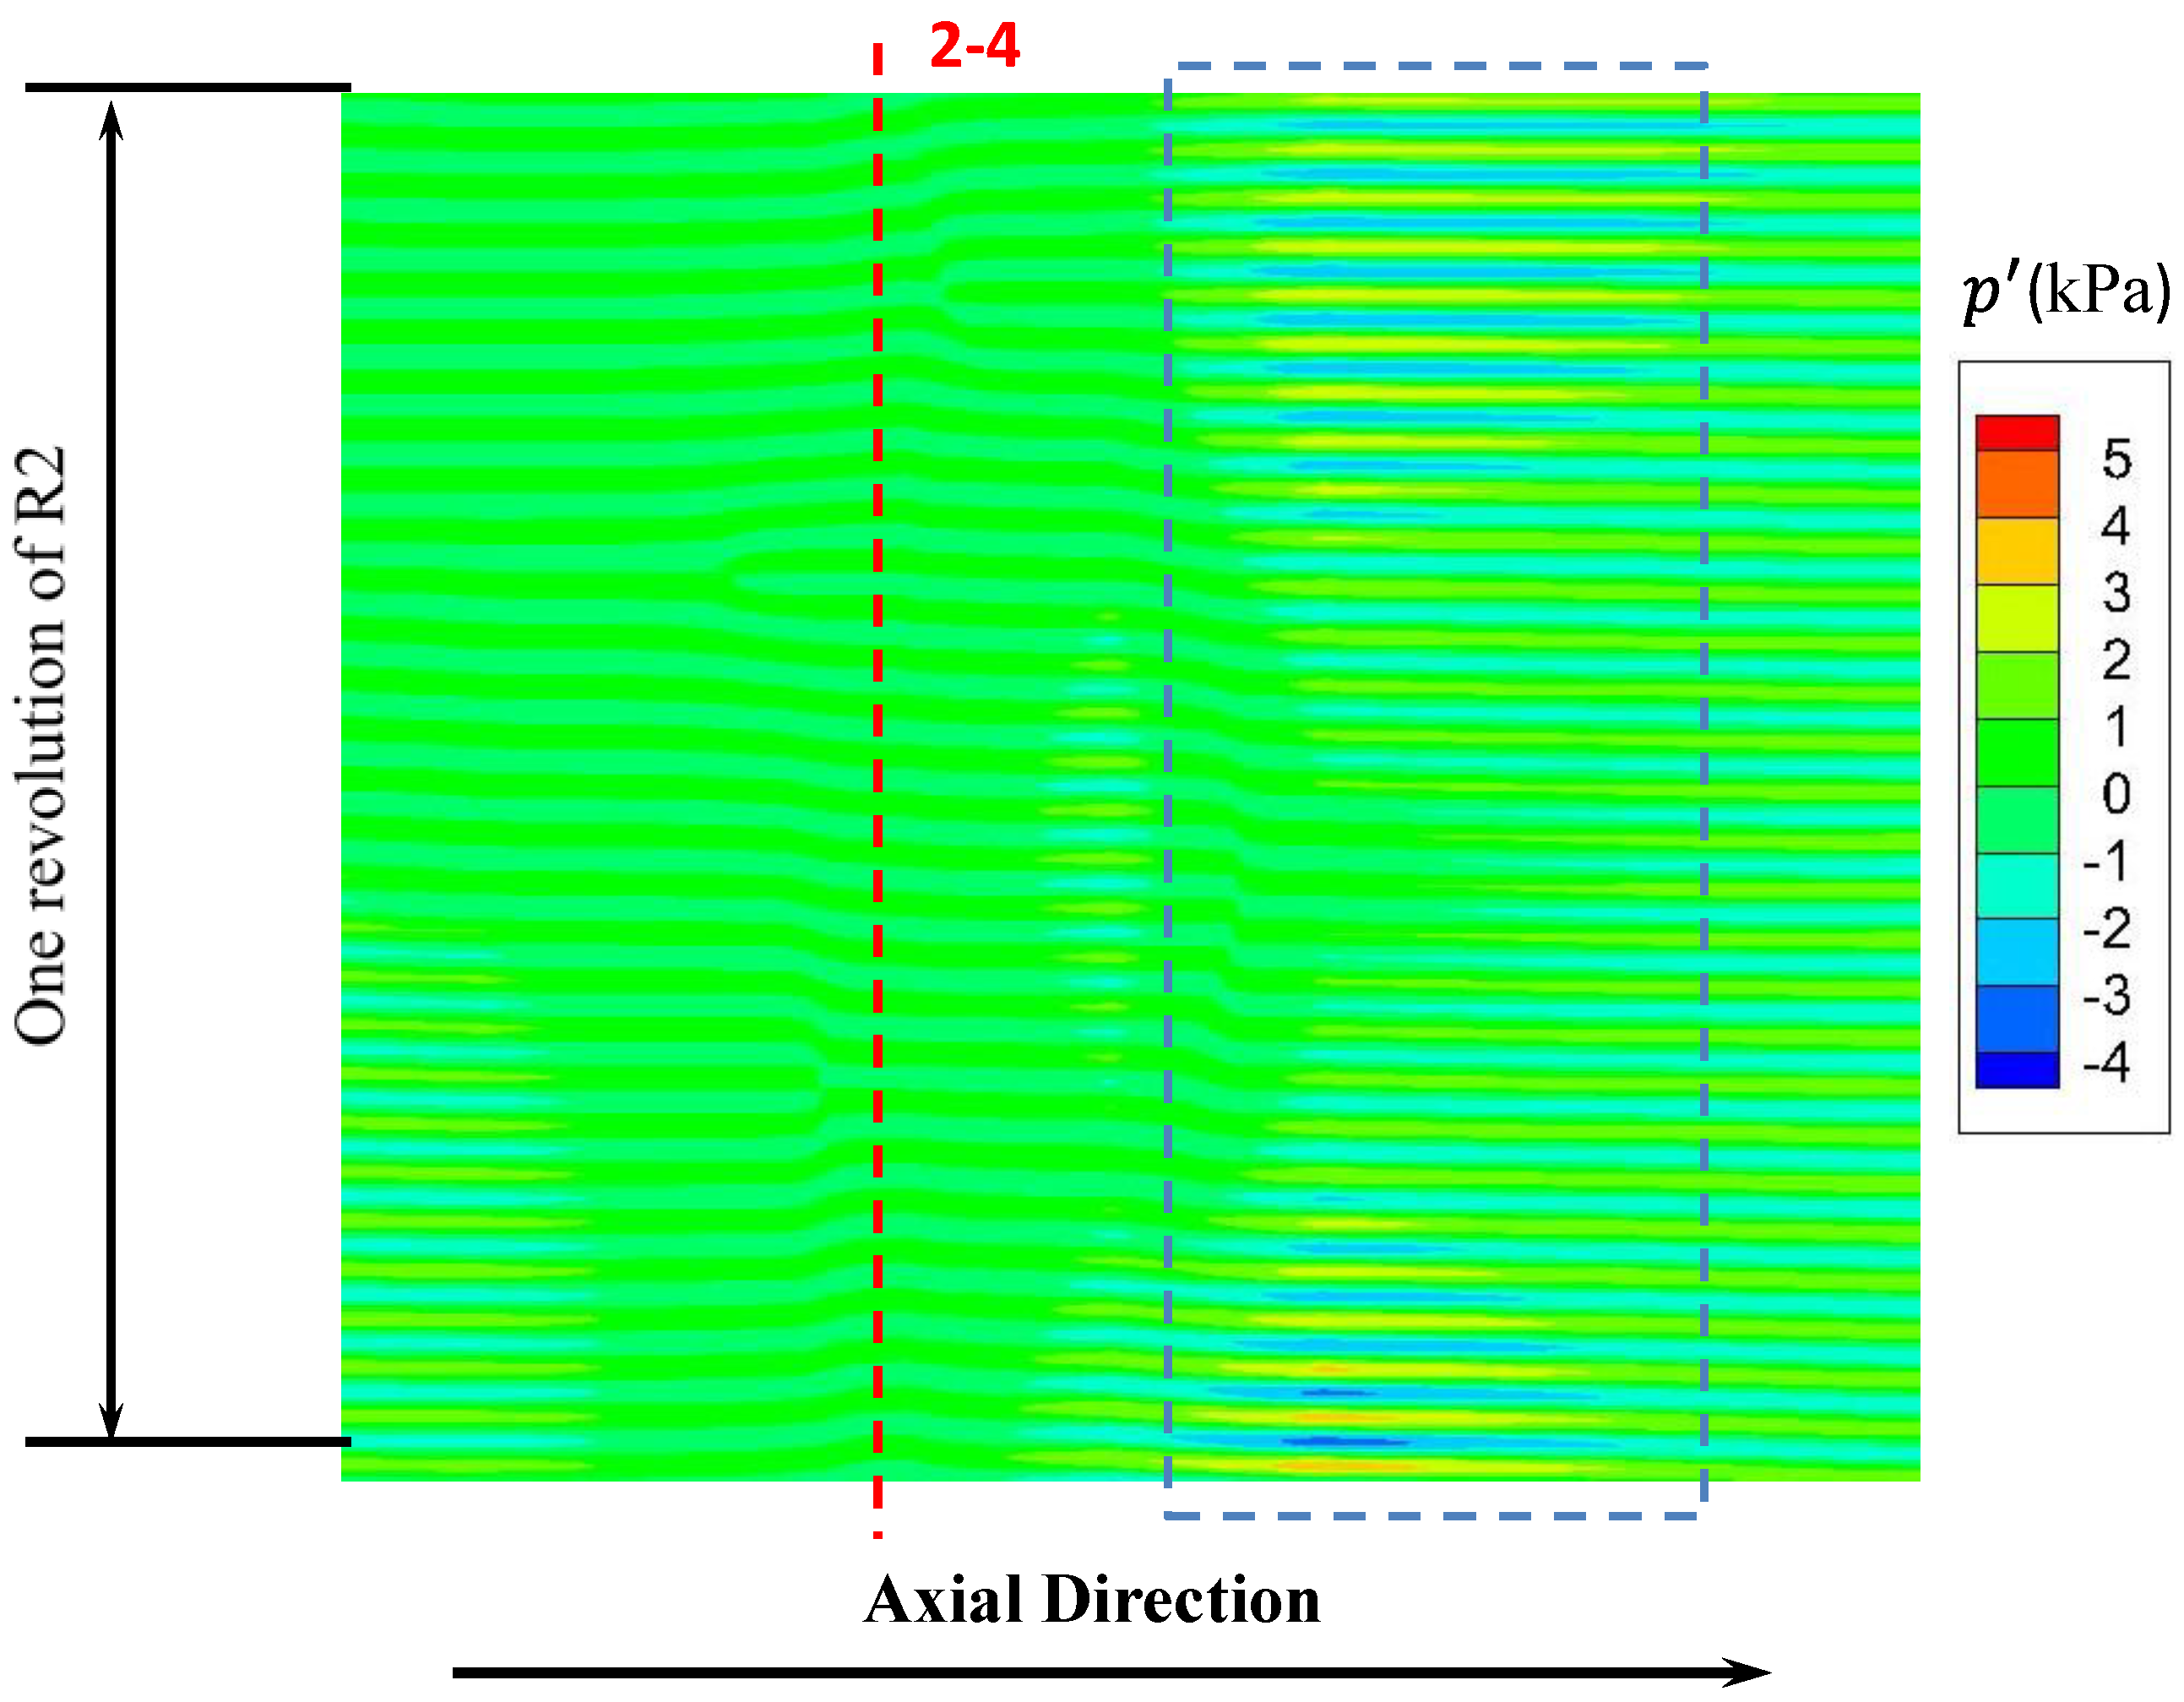
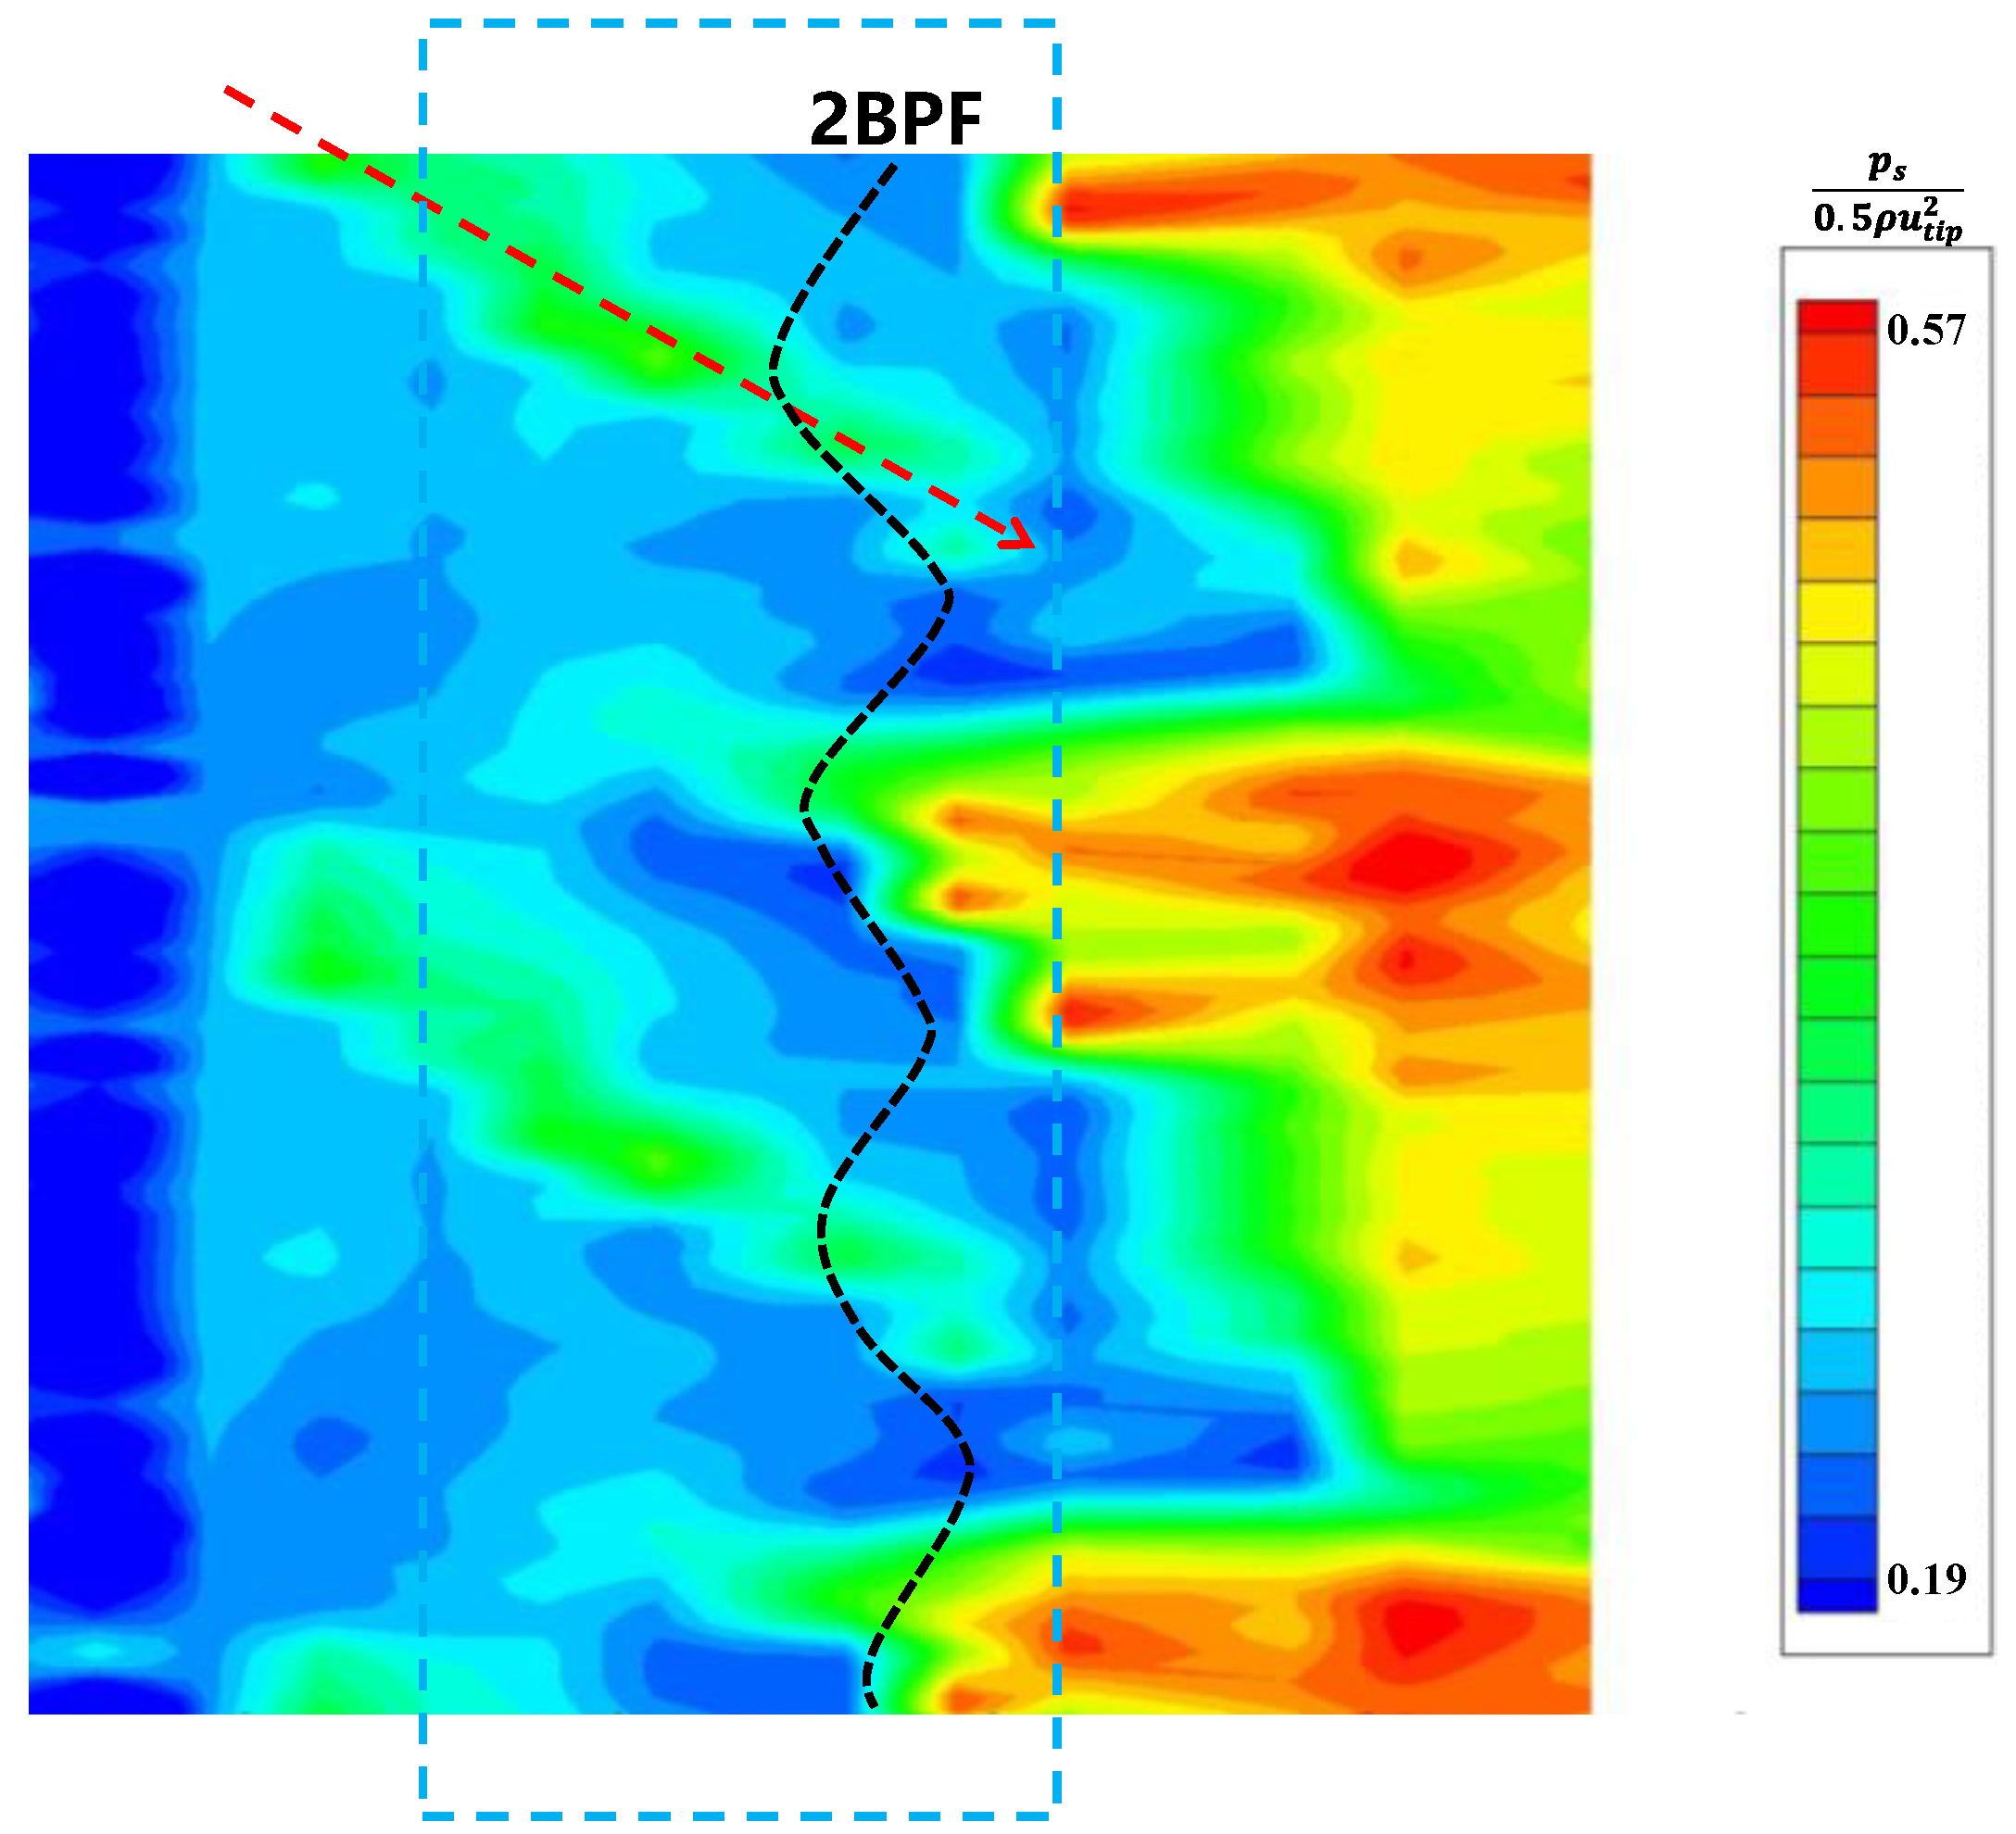
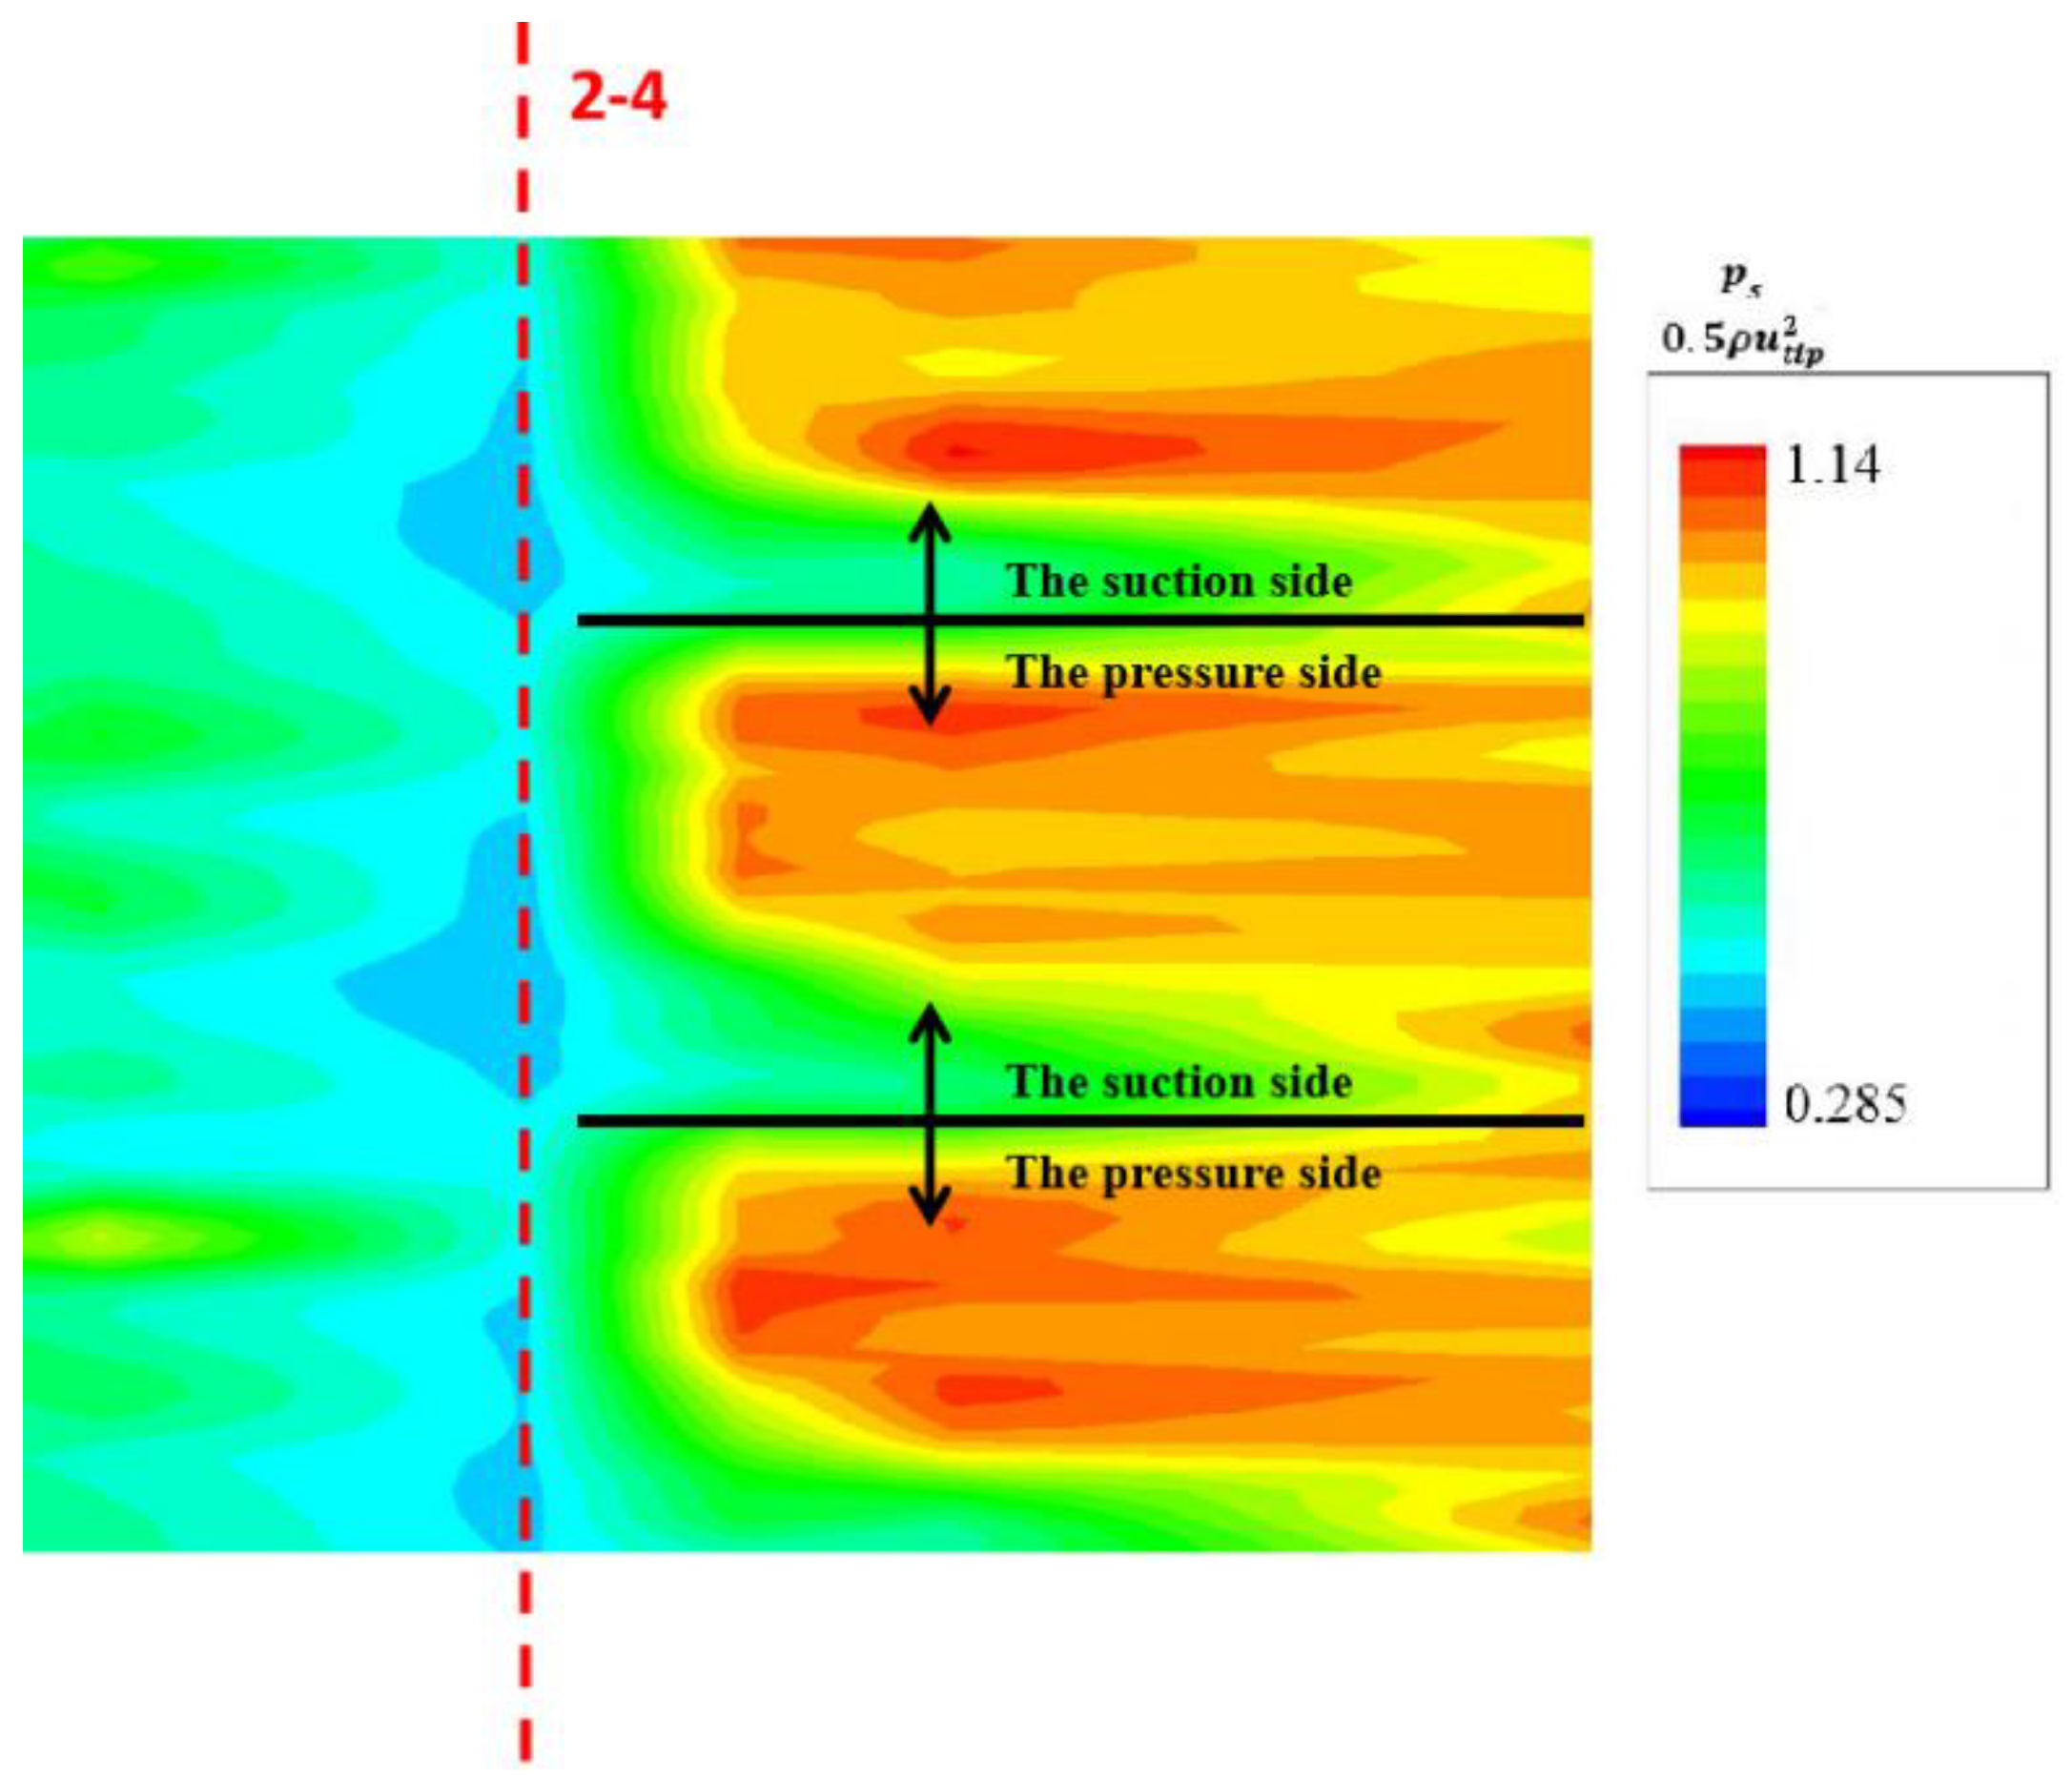
4.2. Flow Details inside R2

To reveal more flow details related to the change in the frequency spectrum in Figure 6, the distributions of the pressure coefficient and different R1 sweep disturbances inside the R2 passage are shown in Figure 7, Figure 8, Figure 9 and Figure 10. The circumferential distributions of the parameters are obtained by the phase-locked assemble average results, the process of which is presented by Equation (1) as follows:
p = 1 N 1 N p ( θ i )  
where the p is the assemble average pressure disturbance at a specific phase, p ( θ i ) is the phase pressure at different revolutions, which is calculated by Equation (2) as follows:
p ( θ i ) = p ( θ i ) p ¯
where p ( θ i ) is the phase transient pressure, p ¯ is the averaged circumferential pressure. According to the distribution of the pressure coefficient p ˜ = p s 0.5 ρ u t i p 2 (where the p s is the pressure rise from the inlet) in Figure 7 (the region of red color is the flow field near the pressure side of the blade), it is inferred that the leading-edge flow separation at the 2-4 location serves as the main reason for the significant drop in the R1-1BPF and R1-2BPF within this region. Moreover, in Figure 8, Figure 9 and Figure 10, it is found that both the R1-1BPF and R1-2BPF became obviously strong downstream of 2-4 and their influences were mainly located at the middle and rear parts of the R2 passage (as the blue dashed box shows), where the maximum deflection of the blade arc occurs. Additionally, several special phenomena that help discriminate the R1-1BPF and R1-2BPF structures should be noted. Firstly, it seems that the circumferential changes in R1-1BPF and R1-2BPF were asynchronous; for example, as R1-1BPF grew in the middle of the rotor revolution, R1-2BPF contrarily dropped. This indicates that some differences exist between the main structures of R1-1BPF and R1-2BPF. Then, as is shown by the disturbance distributions near the middle of the R2 passage (see the blue dashed box), the sudden increase in R1-2BPF was more prominent than R1-1BPF; however, the situation at the R2 inlet is the opposite, where R1-2BPF was weaker than R1-1BPF. This phenomenon shows that the propagation of R1-1BPF and R1-2BPF are not the same, nor are the mechanisms of their interference effect inside the R2 passage.
To understand the related mechanisms of the extraordinary R1-2BPF disturbance, its main origin was further studied. Firstly, it should be emphasized that the outstanding R1-2BPF disturbance had no relationship with the IGV–R1 interaction or the R1–S1 interaction, which can be inferred from the blade numbers of IGV, R1, and S1. Furthermore, the pressure coefficient distribution of the R1 passage in Figure 11 shows it is the interaction between the oblique shock wave (indicated by the red dashed arrow) at the leading edge and the pressure rise region on the blade pressure surface that amplified the R1-2BPF disturbance, which is exhibited by the blue dashed box. The strength changes in R1-1BPF and R1-2BPF along the R1 chord in Figure 12 indicate that the asynchronous phenomenon of R1-1BPF and R1-2BPF had already started from the rear part of R1. For example, as the R1-1BPF transferred from 1-11 to 1-13, the average amplitude of R1-1BPF decreased by about 25%. Meanwhile, the decrease in the R1-2BPF transfer from 1-11 to 1-13, which reached as much as 60%, is more notable. This is due to the fact that R1-1BPF and R1-2BPF propagate differently within the R1 passage. Referring to Figure 11, the critical location of the generation of the R1-2BPF disturbance was concentrated in the middle to the rear parts of the R1 passage. The propagation of R1-2BPF from the original location to the exit of R1 suffered from the mixing effect of the separation wake at the rear part of R1, which brought considerable flow losses that weakened the shock-induced R1-2BPF disturbance. Instead, the R1-1BPF disturbance downstream of the middle part of the R1 passage, which was brought by the pressure drop on the suction side (mainly caused by the separation wake), accumulated along the rear part of the R1 passage. What should also be considered is that the distance from the original location of R1-1BPF to the R1 exit is much shorter than R1-2BPF; thus, the loss of the propagation of R1-1BPF within the R1 passage was much lower than R1-2BPF.
The impact of the R1 oblique shock wave on the flow field downstream is presented by the distribution of the entropy rise in Figure 13. Three moments were picked, and it was noticed that the flow pattern stays nearly the same. In detail, the main flow loss (caused by the oblique shock and its interaction with the high-pressure region downstream, defined as the ‘A’ region) is focused at the top of the red dashed region. With the rotation of the rotor blade, the wake disturbances from the IGV arrived at the ‘A’ region, and the strength of the region was altered slightly. However, it appears that the flow structure of this phenomenon did not change. The ‘long tail’ structure (shown by the black arrow), which indicates the major influence of the ‘A’ region downstream, obviously reached the exit of R1, and that is why the R1-2BPF disturbance is still noticeable at the rear part of R1. Furthermore, because of the growth of the flow separation at the R1 trail (shown by the orange dashed region at T3), the expansion of the ‘long tail’ structure was constrained, which is in accordance with the experimental results showing that the intensity of R1-2BPF declined at the R1 exit.
The spread of the influence of the ‘long tail’ structure within the downstream components is shown in Figure 14. It should be pointed out that the influence of interest (shown by the red arrow and dashed region) could still be figured out even under the significant impact of the blade wake. The shock wave influence concentrated at the top half of the passage, and its range for the R2 passage, is more limited to the higher location when compared to the situation at the LE of S1.
Another rotor–rotor interaction of interest is the phenomenon that the strengths of R1-1BPF, R1-2BPF, and their combination effect appear to be circumferentially (namely the direction of the rotating blade) non-uniform. More information on this phenomenon is shown here. According to Figure 15 and Figure 16, in which the circumferential distributions of R1-1BPF and R1-2BPF at the 2-6 location are compared to the situation at the 1-13 location near the R1 exit, the circumferential non-uniformity of the R1-1BPF disturbance at the 2-6 location (defined as the amplitude difference between the dark green and purple arrows in Figure 15) sharply increased by about 350% compared to the location of 1-13 (defined as the difference between the light green and blue arrows in Figure 15). The situation of R1-2BPF was similar but more severe. As is shown in Figure 16, the circumferential non-uniformity of the R1-2BPF disturbance at the 2-6 location (defined as the difference between the dark green and purple arrows) remarkably increased by about 470% compared to the location of 1-13 (defined as the difference between the light green and blue arrows). Meanwhile, for both the R1-1BPF and R1-2BPF disturbances, the profile of the circumferential distribution at the 2-6 location significantly differed from that at the 1-13 location. All the details above point out that the intrinsic circumferential non-uniformity of the R1 sweep effect (for example, the circumferential non-uniformity caused by the circumferential non-uniform tip clearance during the machine operation) was not the main factor attributing to the circumferential non-uniformity of R1-1BPF and R1-2BPF within the R2 passage. Additionally, the change in the R2 sweep effect inside the R2 passage, which directly reflects the circumferential distribution of the tip clearance, is shown in Figure 17. The results show that a significant difference exists between the circumferential distributions of the tip clearance and the R1-1BPF and R1-2BPF disturbances, which helps exclude the effect of the R2 tip clearance on the non-uniformity of R1-1BPF and R1-2BPF. What is more, as the measurement sensors on the R2 casing wall stayed unmovable at the absolute coordinate system, their relative positions upstream of the S1 blade were fixed and the effect of circumferential non-uniformity of S1 should not be considered. According to Figure 18, the trend of the relative position between the R1 and R2 blades (referred to as the clocking position of C1 where the trailing edge of R1 corresponds to the leading edge of R2) is very similar to the non-uniformity of the R1 disturbance within R2 (shown by the red and black dashed curves). Considering all the evidence above, it is believed that the circumferential non-uniformity of R1-1BPF and R1-2BPF is primarily caused by the relative positions between the R1 and R2 blades.
The calculation results tell more about the mechanisms of this phenomenon. In Figure 19, it is noticed that both of the pressure fields at S1-TE and R2-LE exhibited different characteristics as the relative position between R1 and R2 changed. Firstly, it should be stated that for the selected parts of the R2 and S1 rows, the difference in the relative phases between the R2 and S1 blades was very limited, and such an effect should not be considered the main factor of the circumferential non-uniformity of the shock wave influence (R1-2BPF). When compared to the situation of position 1 at T1, the separation wake at S1-TE was weakened and the invasion of the high-pressure region from R2-LE appears to have been constrained at position 2. This is simply the coupling effect of these two flow structures that controls the passing-through of the shock wave influence from R1. Thus, what could be inferred is that the shock wave influence is altered in varying degrees as the coupling effect of S1-TE and R2-LE circumferentially changes. As is shown by the pressure field at T2, the relative position of the S1 blade only had effects on the intensity of the circumferential change in the coupling effect of S1-TE and R2-LE; however, the circumferential flow patterns at S1-TE and R2-LE do not essentially change.

4.3. Influence of Operating Conditions

As the compressor operating condition obviously deviated from the design point, the characteristics of the leading-edge shock wave and some other important flow structures changed, which inevitably influenced the generation of the R1-1BPF and R1-2BPF disturbances within the R1 passage and their propagations within the R2 passage. The distribution of the pressure coefficient near the choke condition is presented in Figure 20. Compared to the situation near the design point in Figure 11, it is noticed that the overall distribution of the pressure coefficient near the choke point was similar to that near the design point. Furthermore, some local differences should be considered. Firstly, for the near choke condition, the inclination of the oblique shock wave at the R1 leading-edge was higher than that near the design condition (shown by the comparison of the blue and red arrows in the figure). Then, the strength of the oblique shock wave was weaker than that near the design condition, however, with a more extensive stretching distance (shown by the comparison of the blue and red dashed lines in the figure). Additionally, the strength of the pressure rise region on the blade pressure surface dropped, while the separation wake region near the rotor exit significantly grew. The three characteristics indicate that, on one hand, the interaction between the leading-edge oblique shock wave and the pressure rise region on the blade pressure surface was weaker near the choke condition. This can be validated by Figure 21, in which the frequency spectrum analysis of the R1 sweep effect is presented, as the amplitude of the R1-2BPF spectrum at the 1-8 location near the design point (shown in Figure 21a) is higher than the one near the choke point shown by Figure 21b. On the other hand, an interesting phenomenon near the choke condition is that as the mixing effect of R1-BPF was enhanced for the growing of separation wake region, and contrarily, the R1-2BPF disturbance appears to have been more significant near the R1 exit (seen in the comparison of the R1-2BPF amplitudes at the location between Figure 21a,b). According to the range of the oblique shock wave near the choke condition shown in Figure 20, it was found that the end of the shock wave was relatively closer to the R1 exit (compared to the design condition), of which the enhanced effect on the rear part of the R1 passage compensated for the flow loss under the R1-BPF mixing effect. More information on this compensation near the choke condition is shown in Figure 22, in which the average amplitude of the R1-2BPF disturbance drops about 47% from the 1-11 to 1-13 location. Meanwhile, this value at the design condition (shown in Figure 12) was 59%, which is 25.5% higher than the value near the choke point.
Under the influence of the flow structure change in the R1 passage, several changes were noticed in the distribution of the R1-1BPF and R1-2BPF disturbances within the R2 passage, shown by the comparison between Figure 6 and Figure 23. For example, near the choke point, the amplitude of the R1-2BPF disturbance at the 2-5 location was much higher than the amplitude of the design point, and the declination of R1-2BPF from the 2-5 to the 2-9 location is less evident than the situation near the design point. The reason for the change can be concluded as the result of the stronger R1-2BPF fluctuation at the R1 exit described above. On the whole, as there were only quantitative differences (and not essential differences) in the R1 flow structure between the design and near choke conditions, the propagations of R1-1BPF and R1-2BPF within the R2 passage near the choke point were similar to the situations near the design point.
However, tremendous transformations occurred at the compressor surge limit. The distribution of the pressure coefficient in Figure 24 shows that the shock wave at the R1 leading edge spilled out as the surge limit was reached. At that moment, the R1 blade (as the black dashed box shows) circumferentially rotated, and the direction of the leading-edge shock wake was nearly parallel to the front of the R1 blade. A similar phenomenon at the surge limit has been reported in some other studies [25,26]. The investigation here mainly focused on its effect on the generation of the R1-1BPF and R1-2BPF disturbances within the R1 passage. Firstly, the interaction between the oblique shock wave and the pressure-rise region on the blade pressure surface, which appeared near the design and choke conditions, was no longer seen at the surge limit. Then, under the coupling effect of the spilled shock wave and the stall cells, the working ability of the R1 pressure side could not be maintained and the pressure difference between the pressure and suction sides decreased, accompanied by the increase in the turbulence inside the passage (shown by the disordered distribution of the pressure coefficient after the shock wave). The results are presented in Figure 25 in which both the R1-1BPF (representing the ordered pressure gradient between the pressure and suction side) and R1-2BPF (representing the ordered interaction between the oblique shock wave and the pressure-rise region on the blade pressure surface) disturbances almost vanish. Under such an influence, the interferences of both the R1-1BPF and R1-2BPF disturbances could be ignored inside the R2 passage, which is shown in Figure 26 (no R1-2BPF disturbance is found).

5. Conclusions

The main purpose of this study was to reveal the mechanisms of the unsteady characteristics of the rotor–rotor interactions inside a multi-stage transonic compressor, especially the interference of one special shock wave disturbance, which can help improve the design of transonic compressors. In the study, the transient pressures at R1 and R2 under different flow conditions, measured by a high-frequency sensor, were applied to analyze the propagation of different R1 sweep effects inside the R2 passage, as well as the origins of some critical flow structures. Several conclusions are drawn as follows:
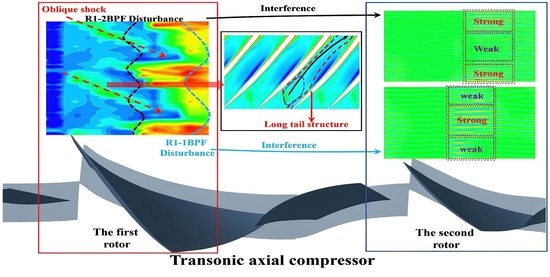
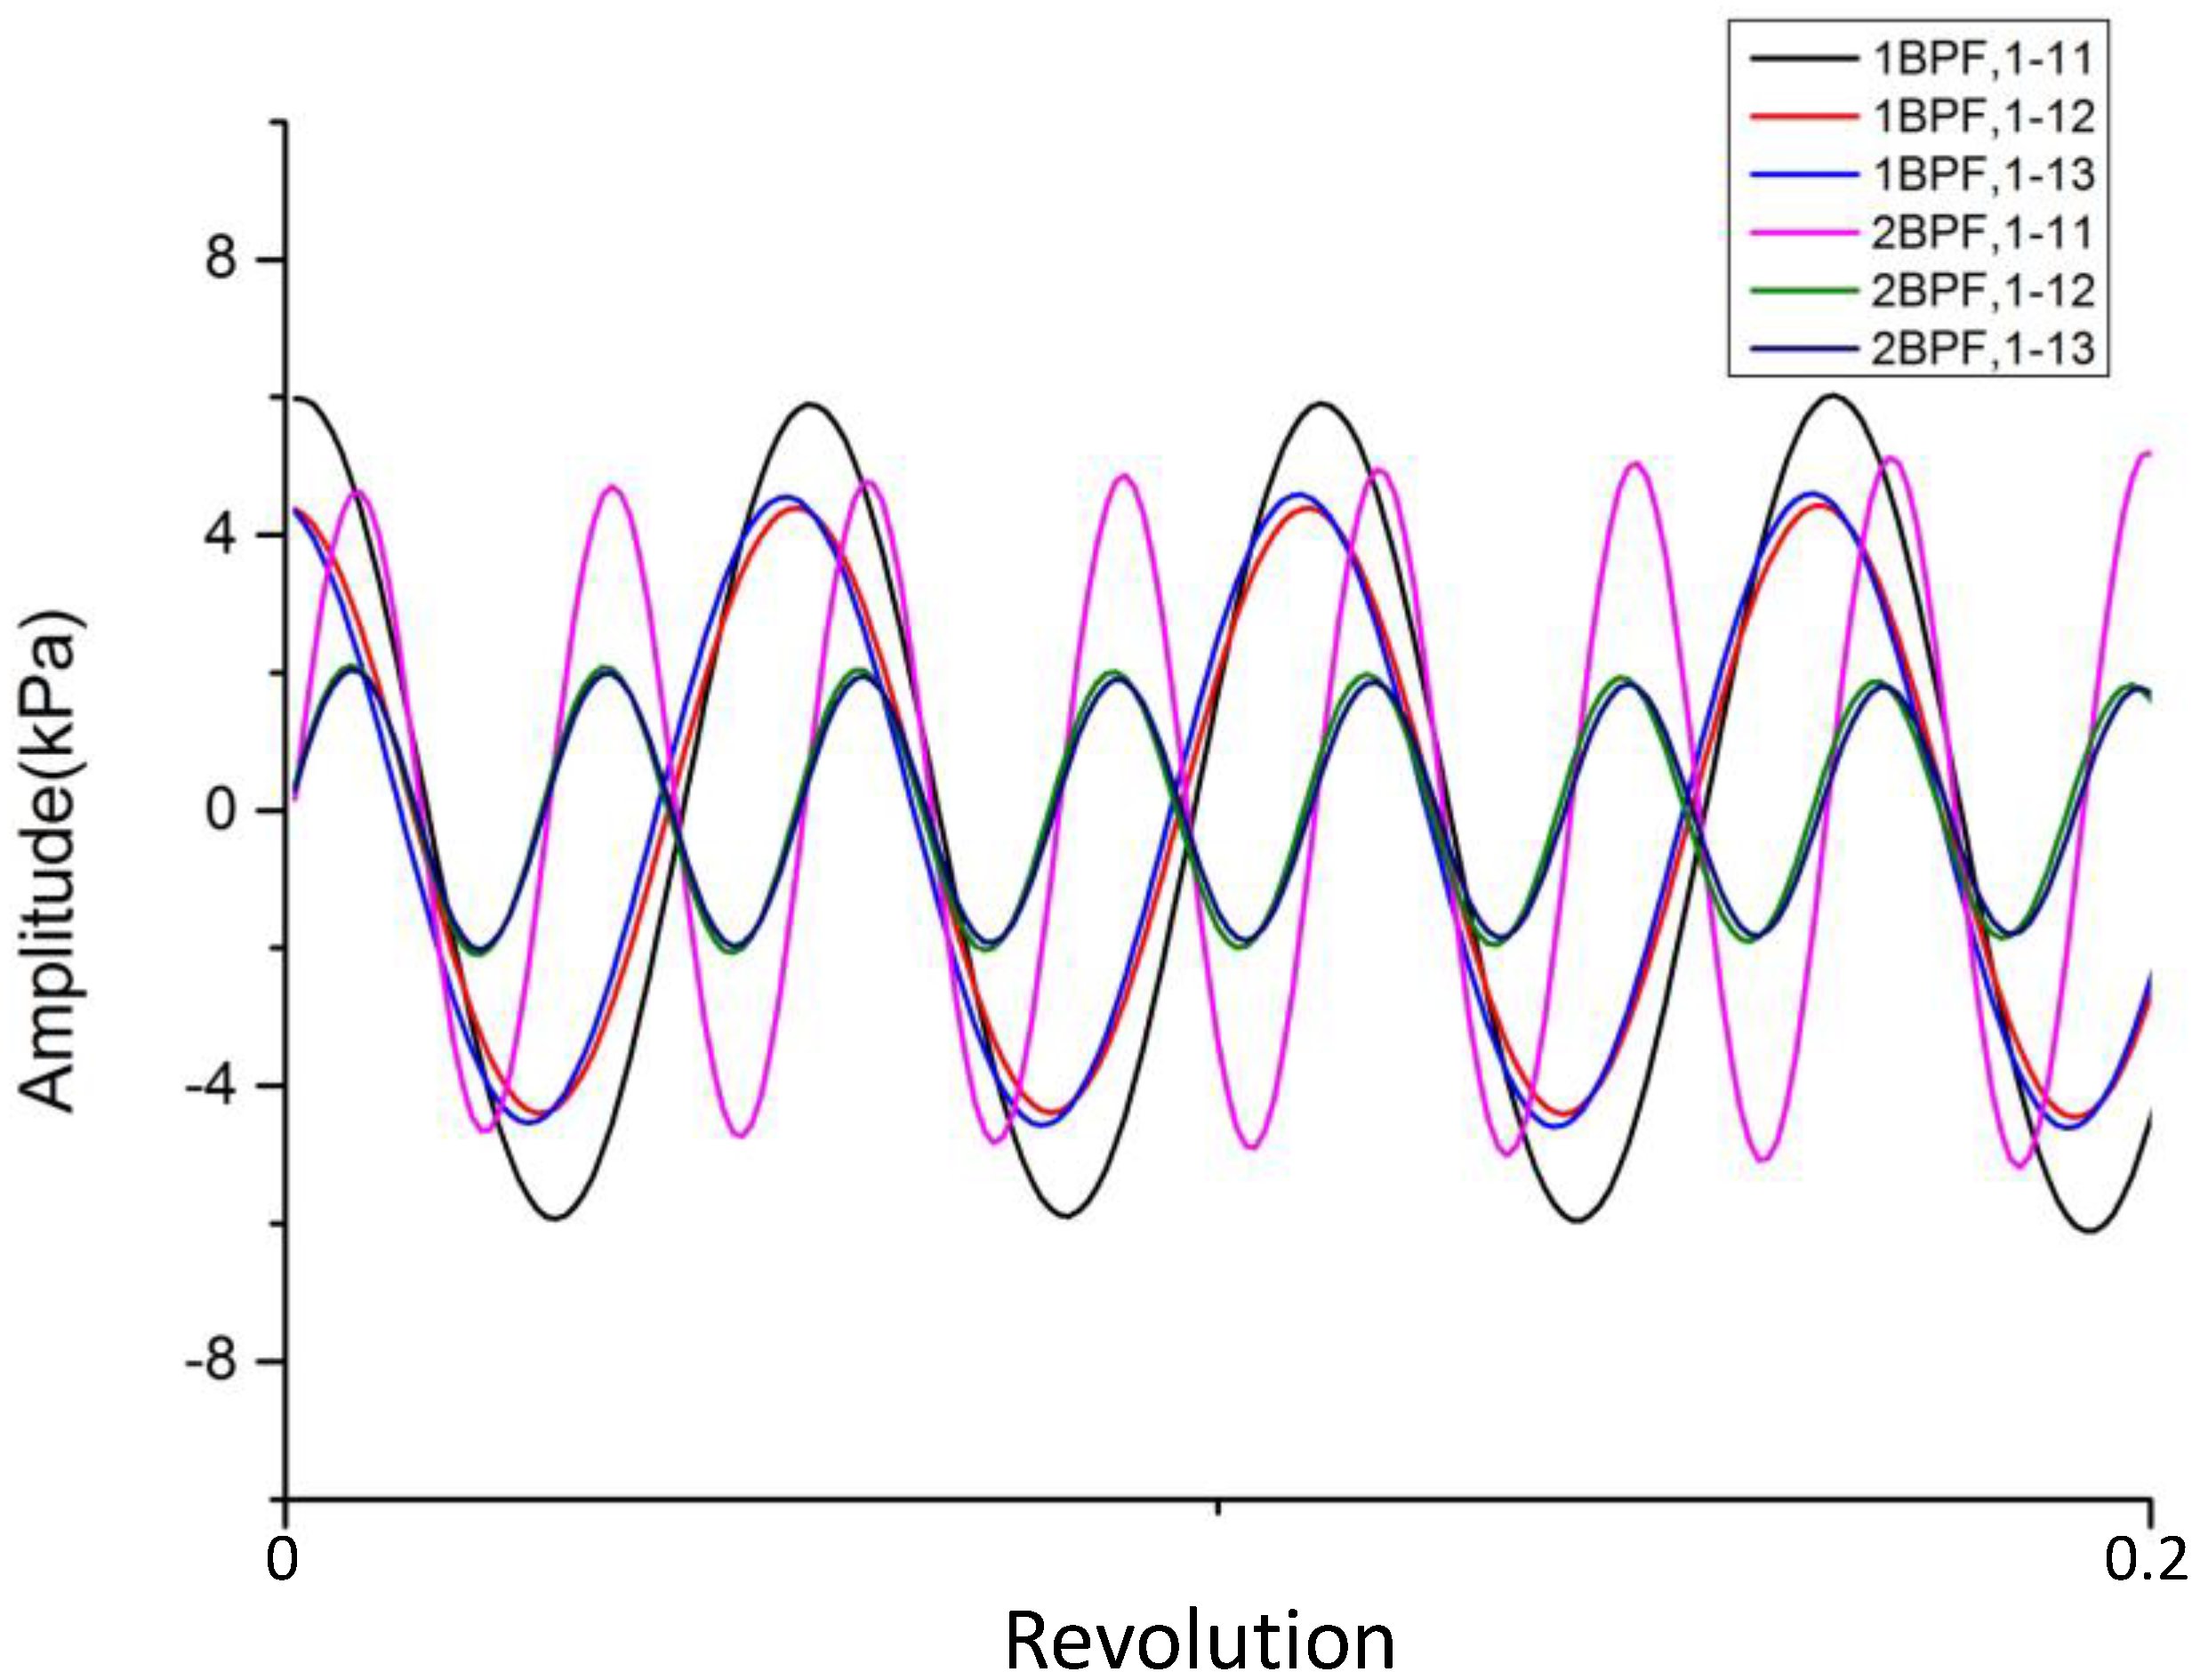
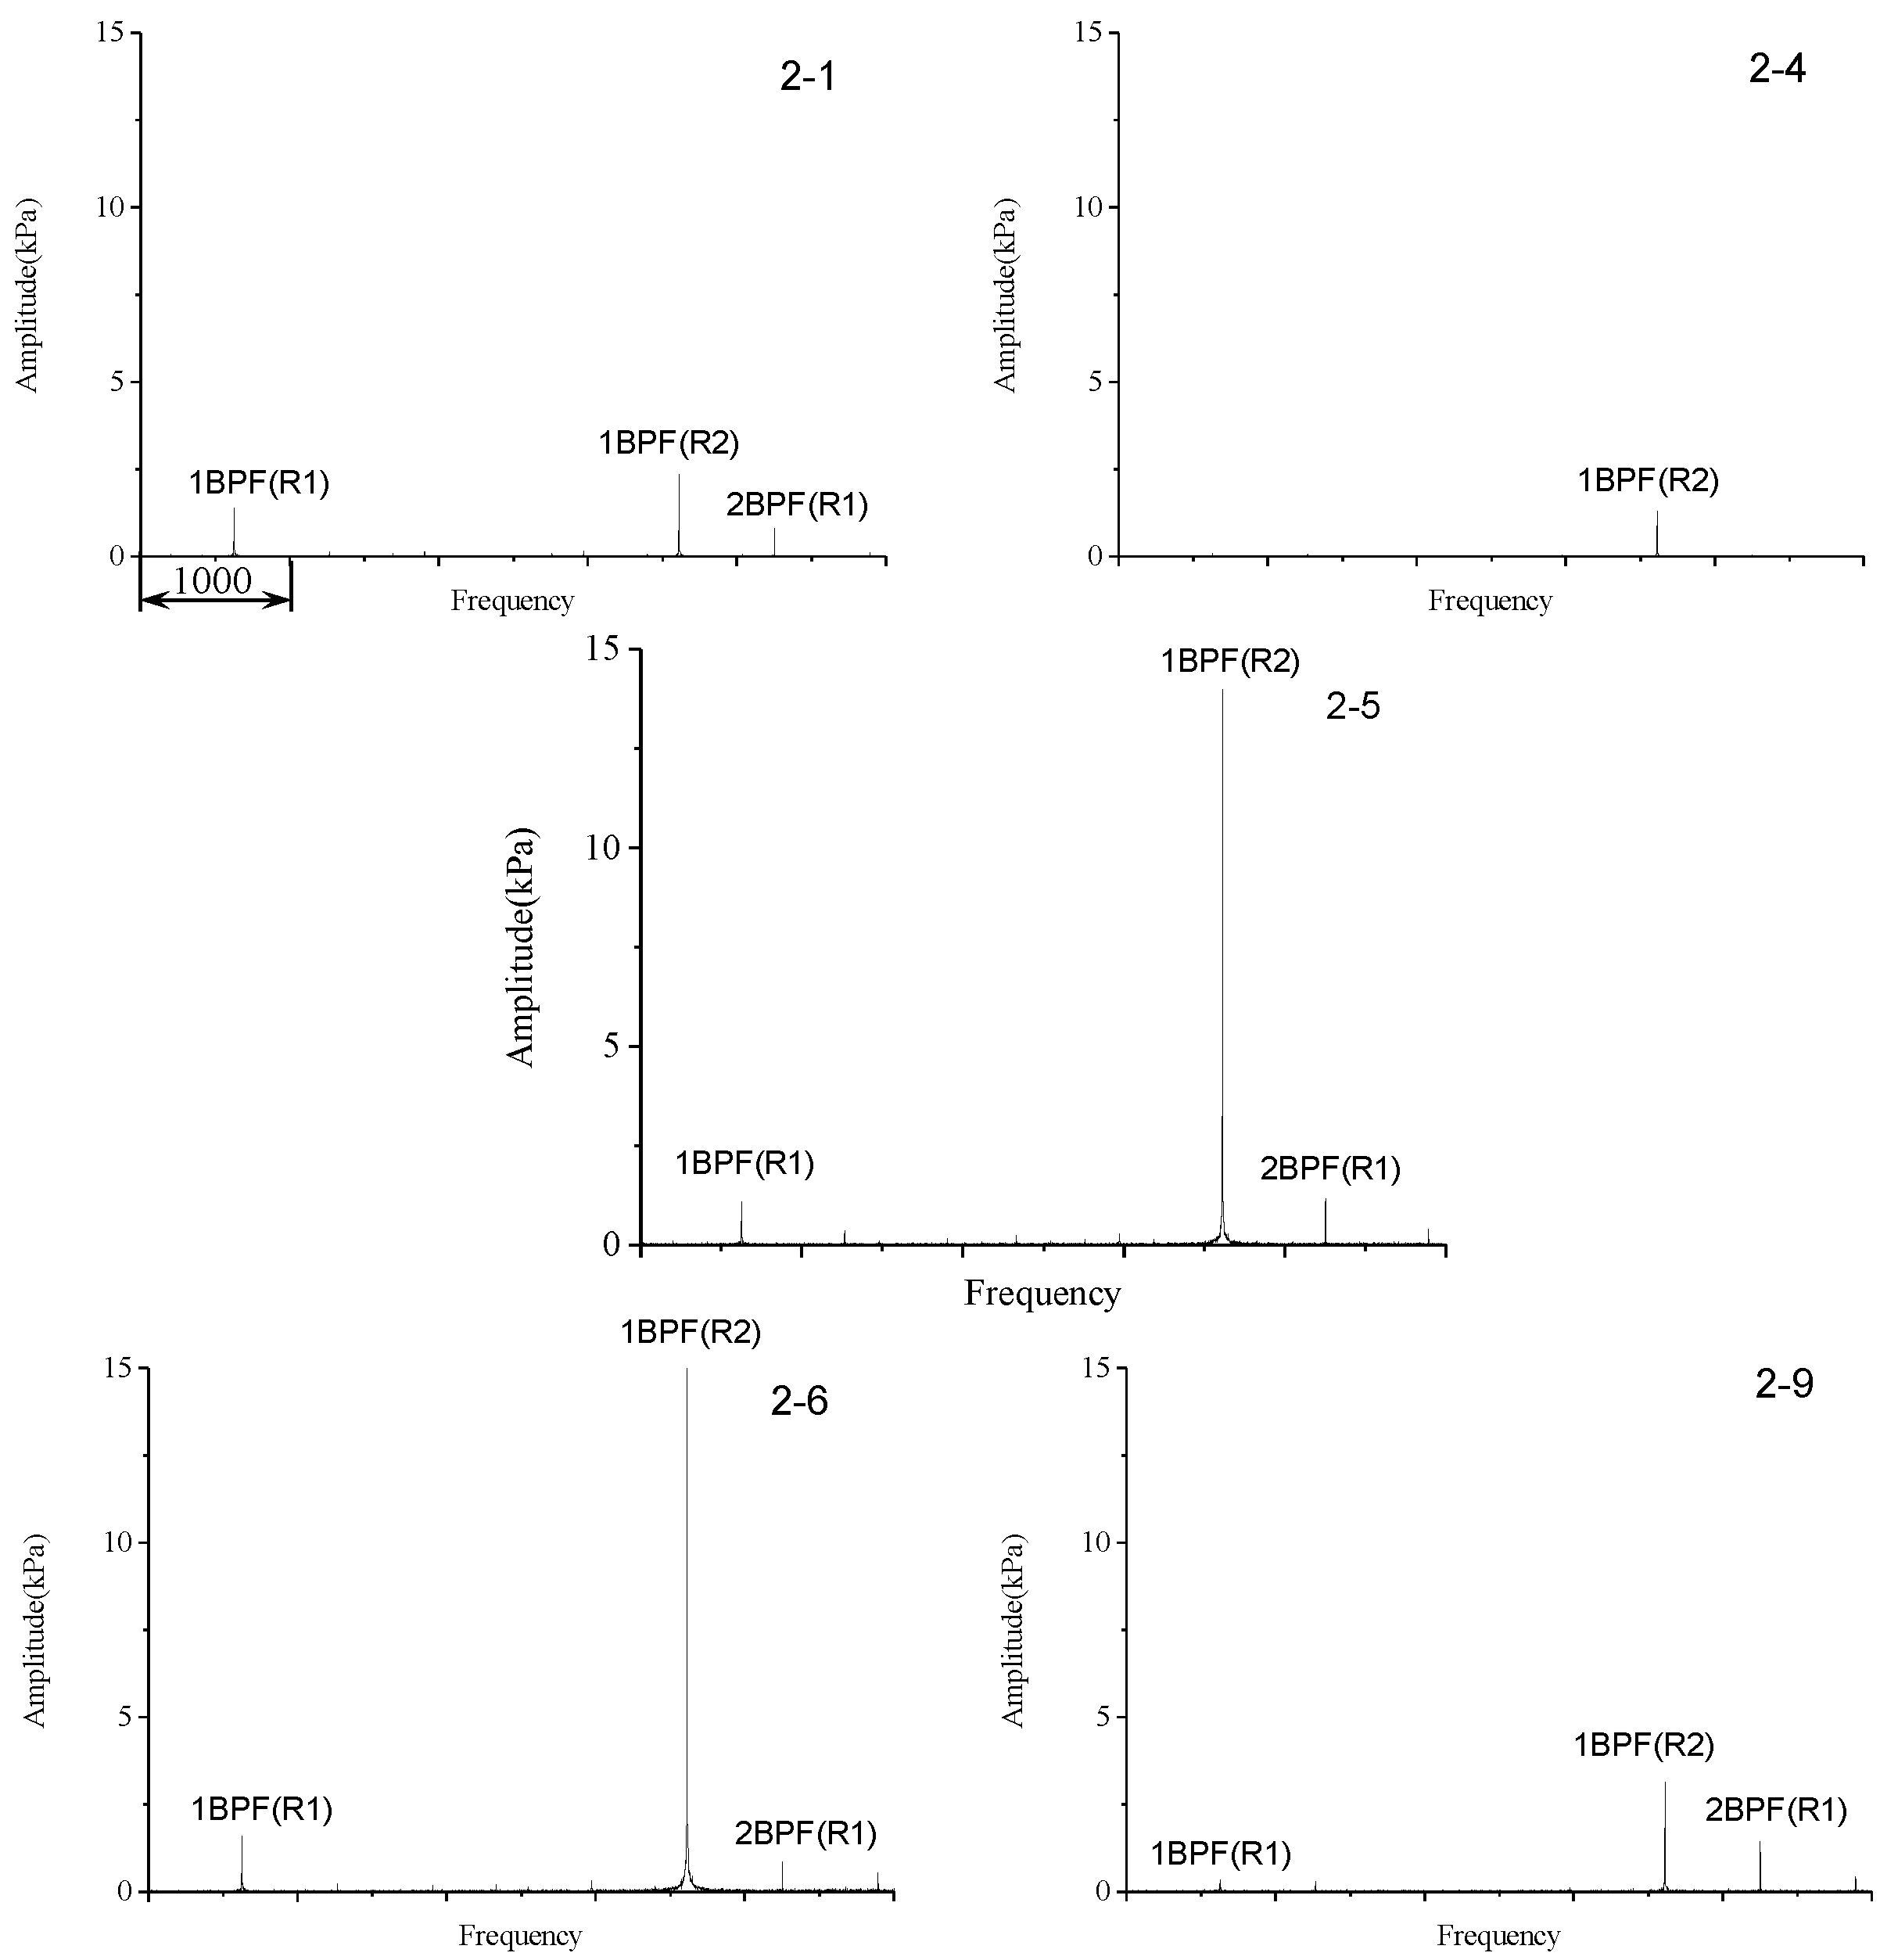
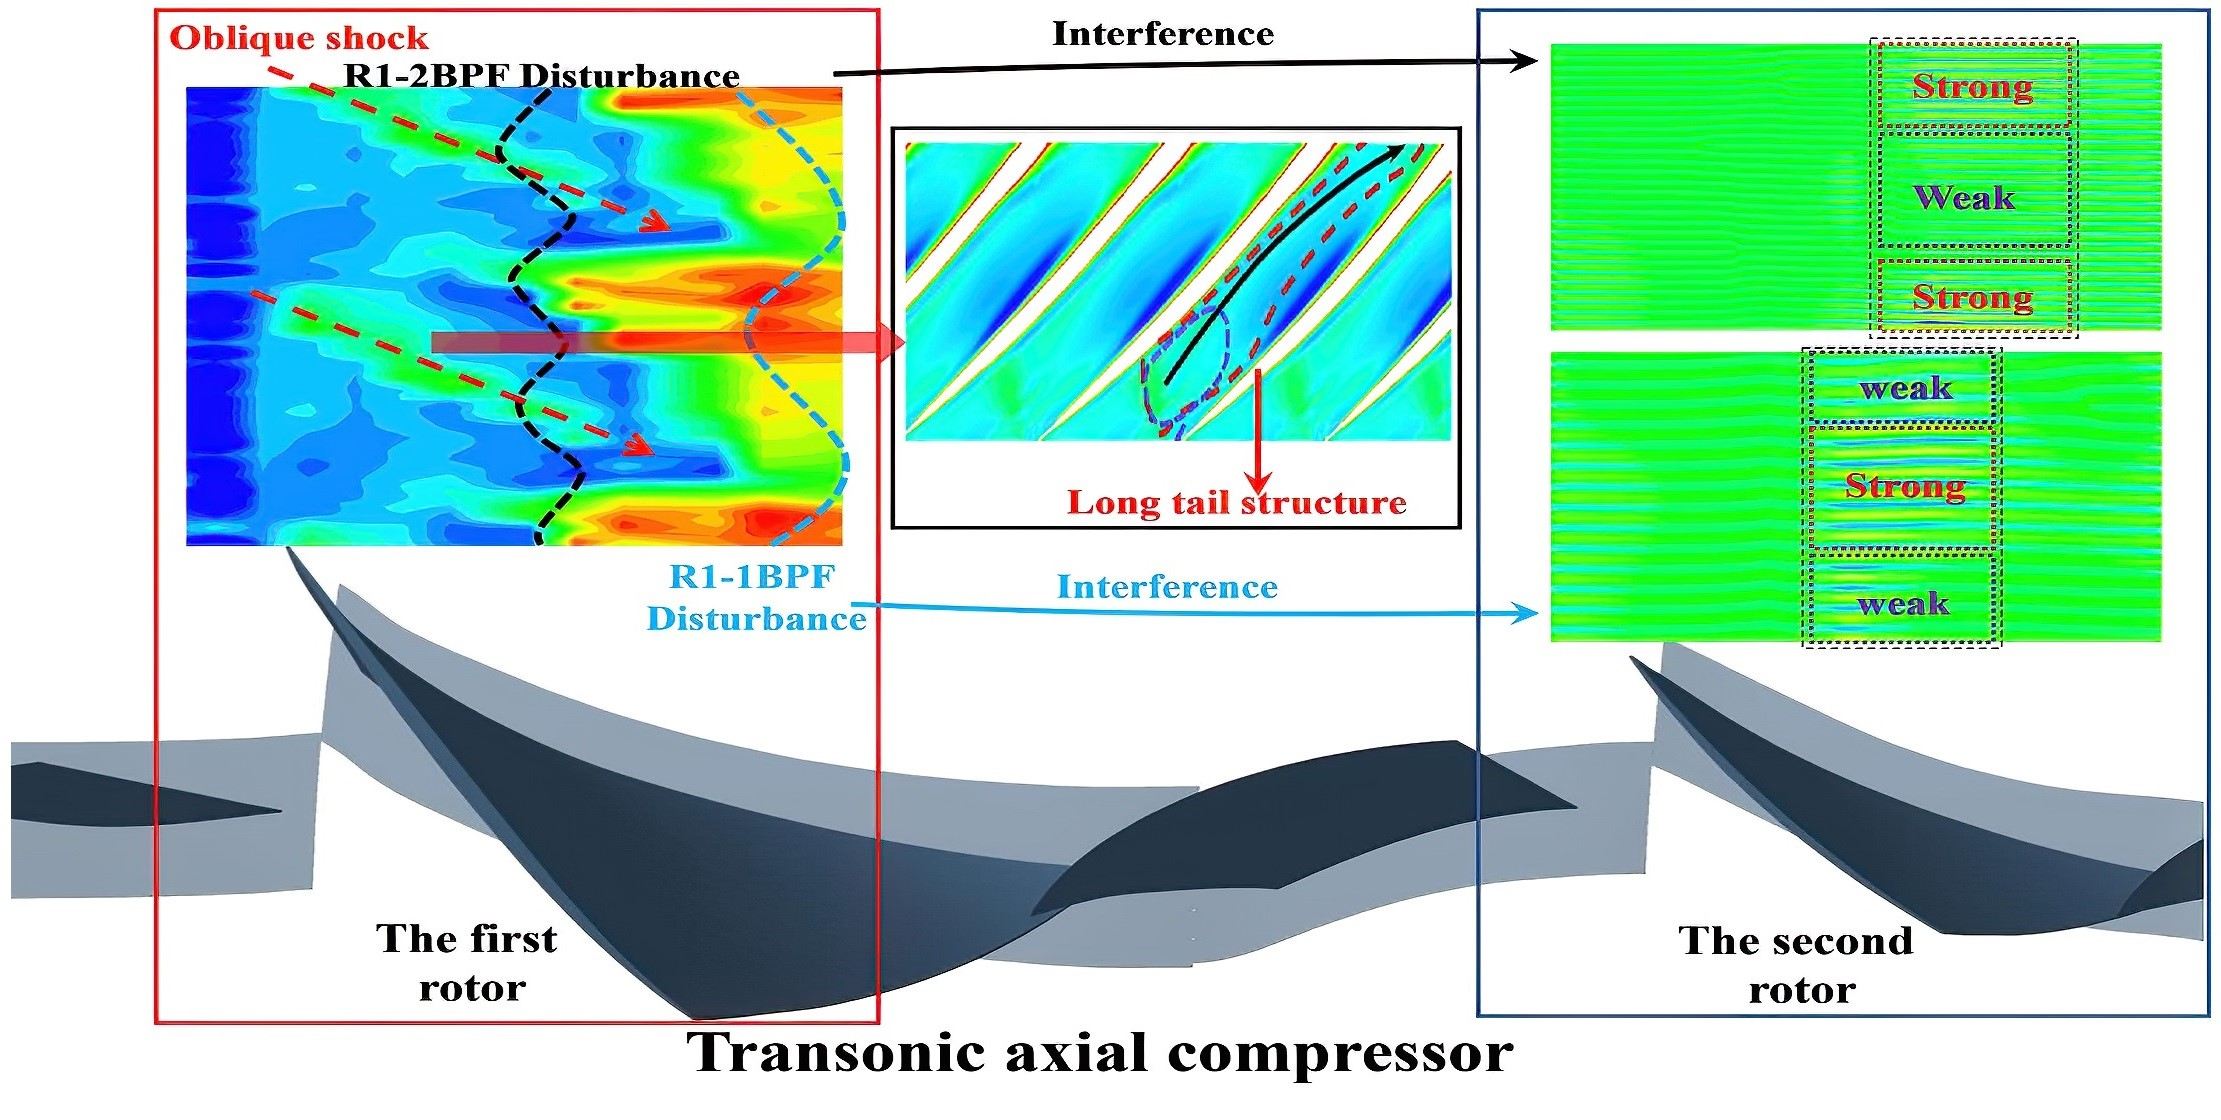
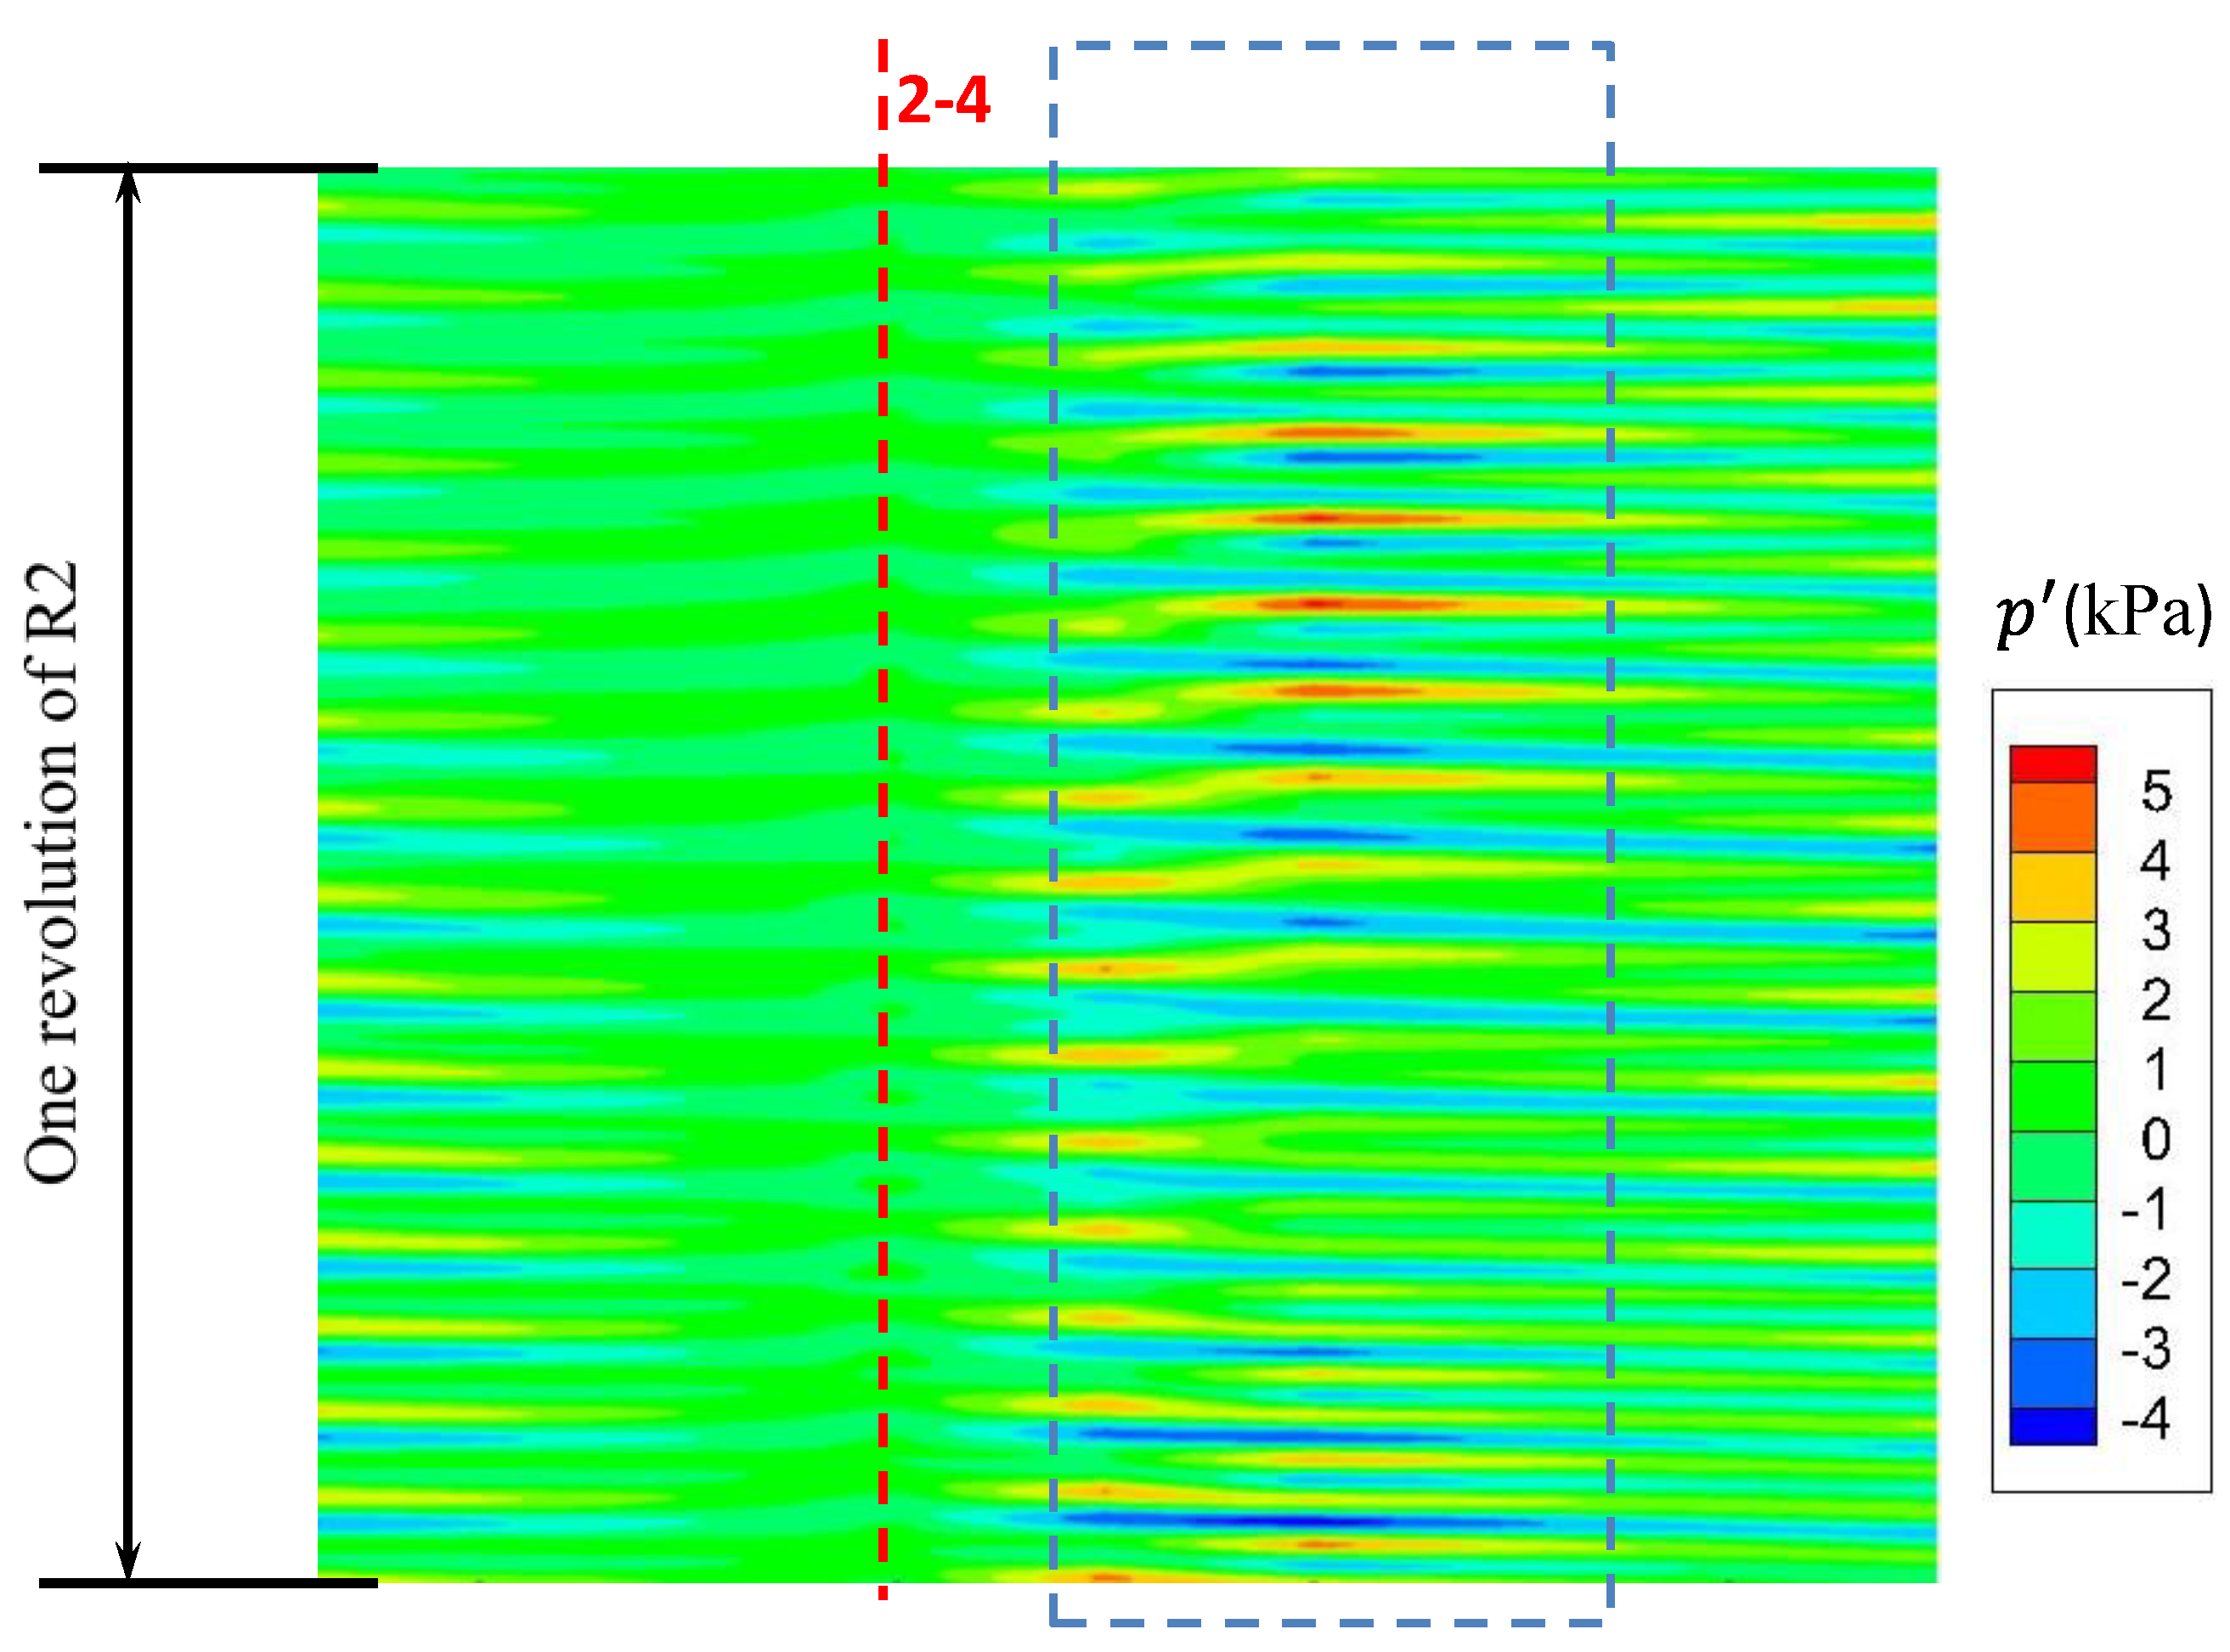
  • When away from the surge limit, the R1-1BPF and R1-2BPF pressure disturbances from the R1 rotor, which averagely exceed 9% of the pressure rise of R2, are prominently found in the R2 passage. As usual, the R1-1BPF disturbance is mainly caused by the separation wake effect at the rear part of R1. However, the R1-2BPF disturbance here does not characterize the harmonic of the R1 wake disturbance, but the interaction between the oblique shock wave and the high-pressure region on the blade pressure surface. Both of the disturbances asynchronously propagate inside the R2 passage.
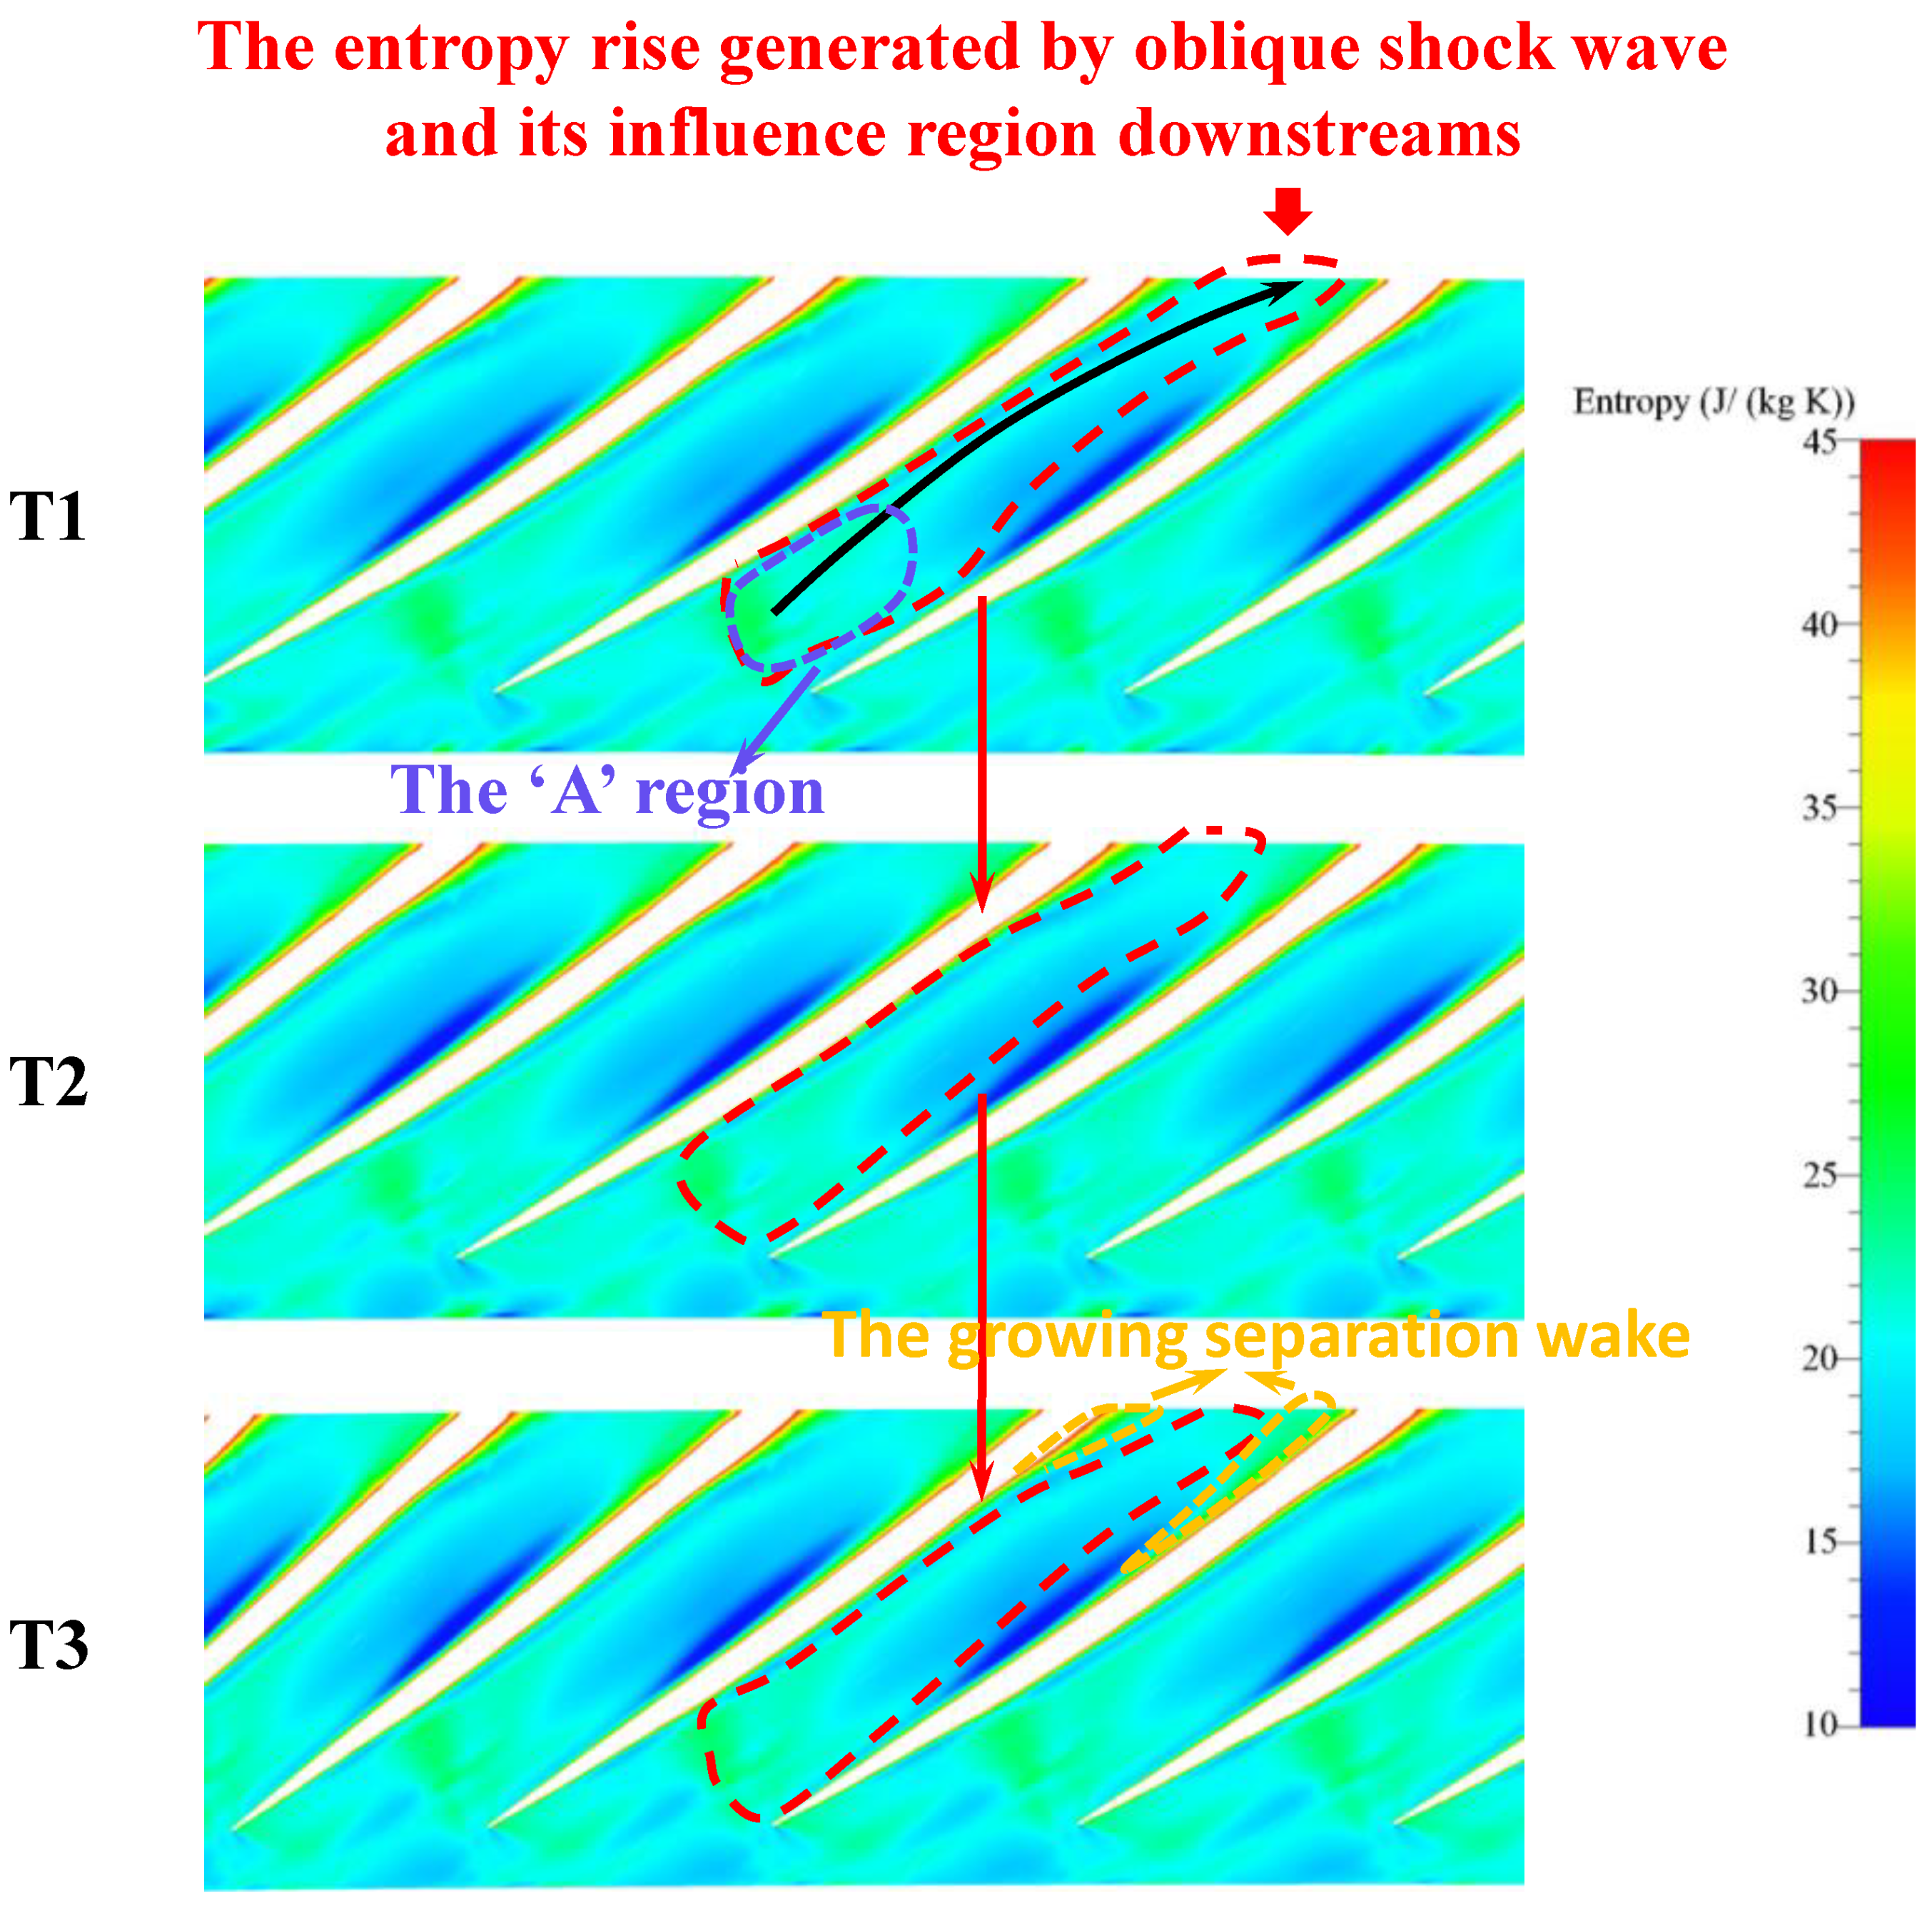
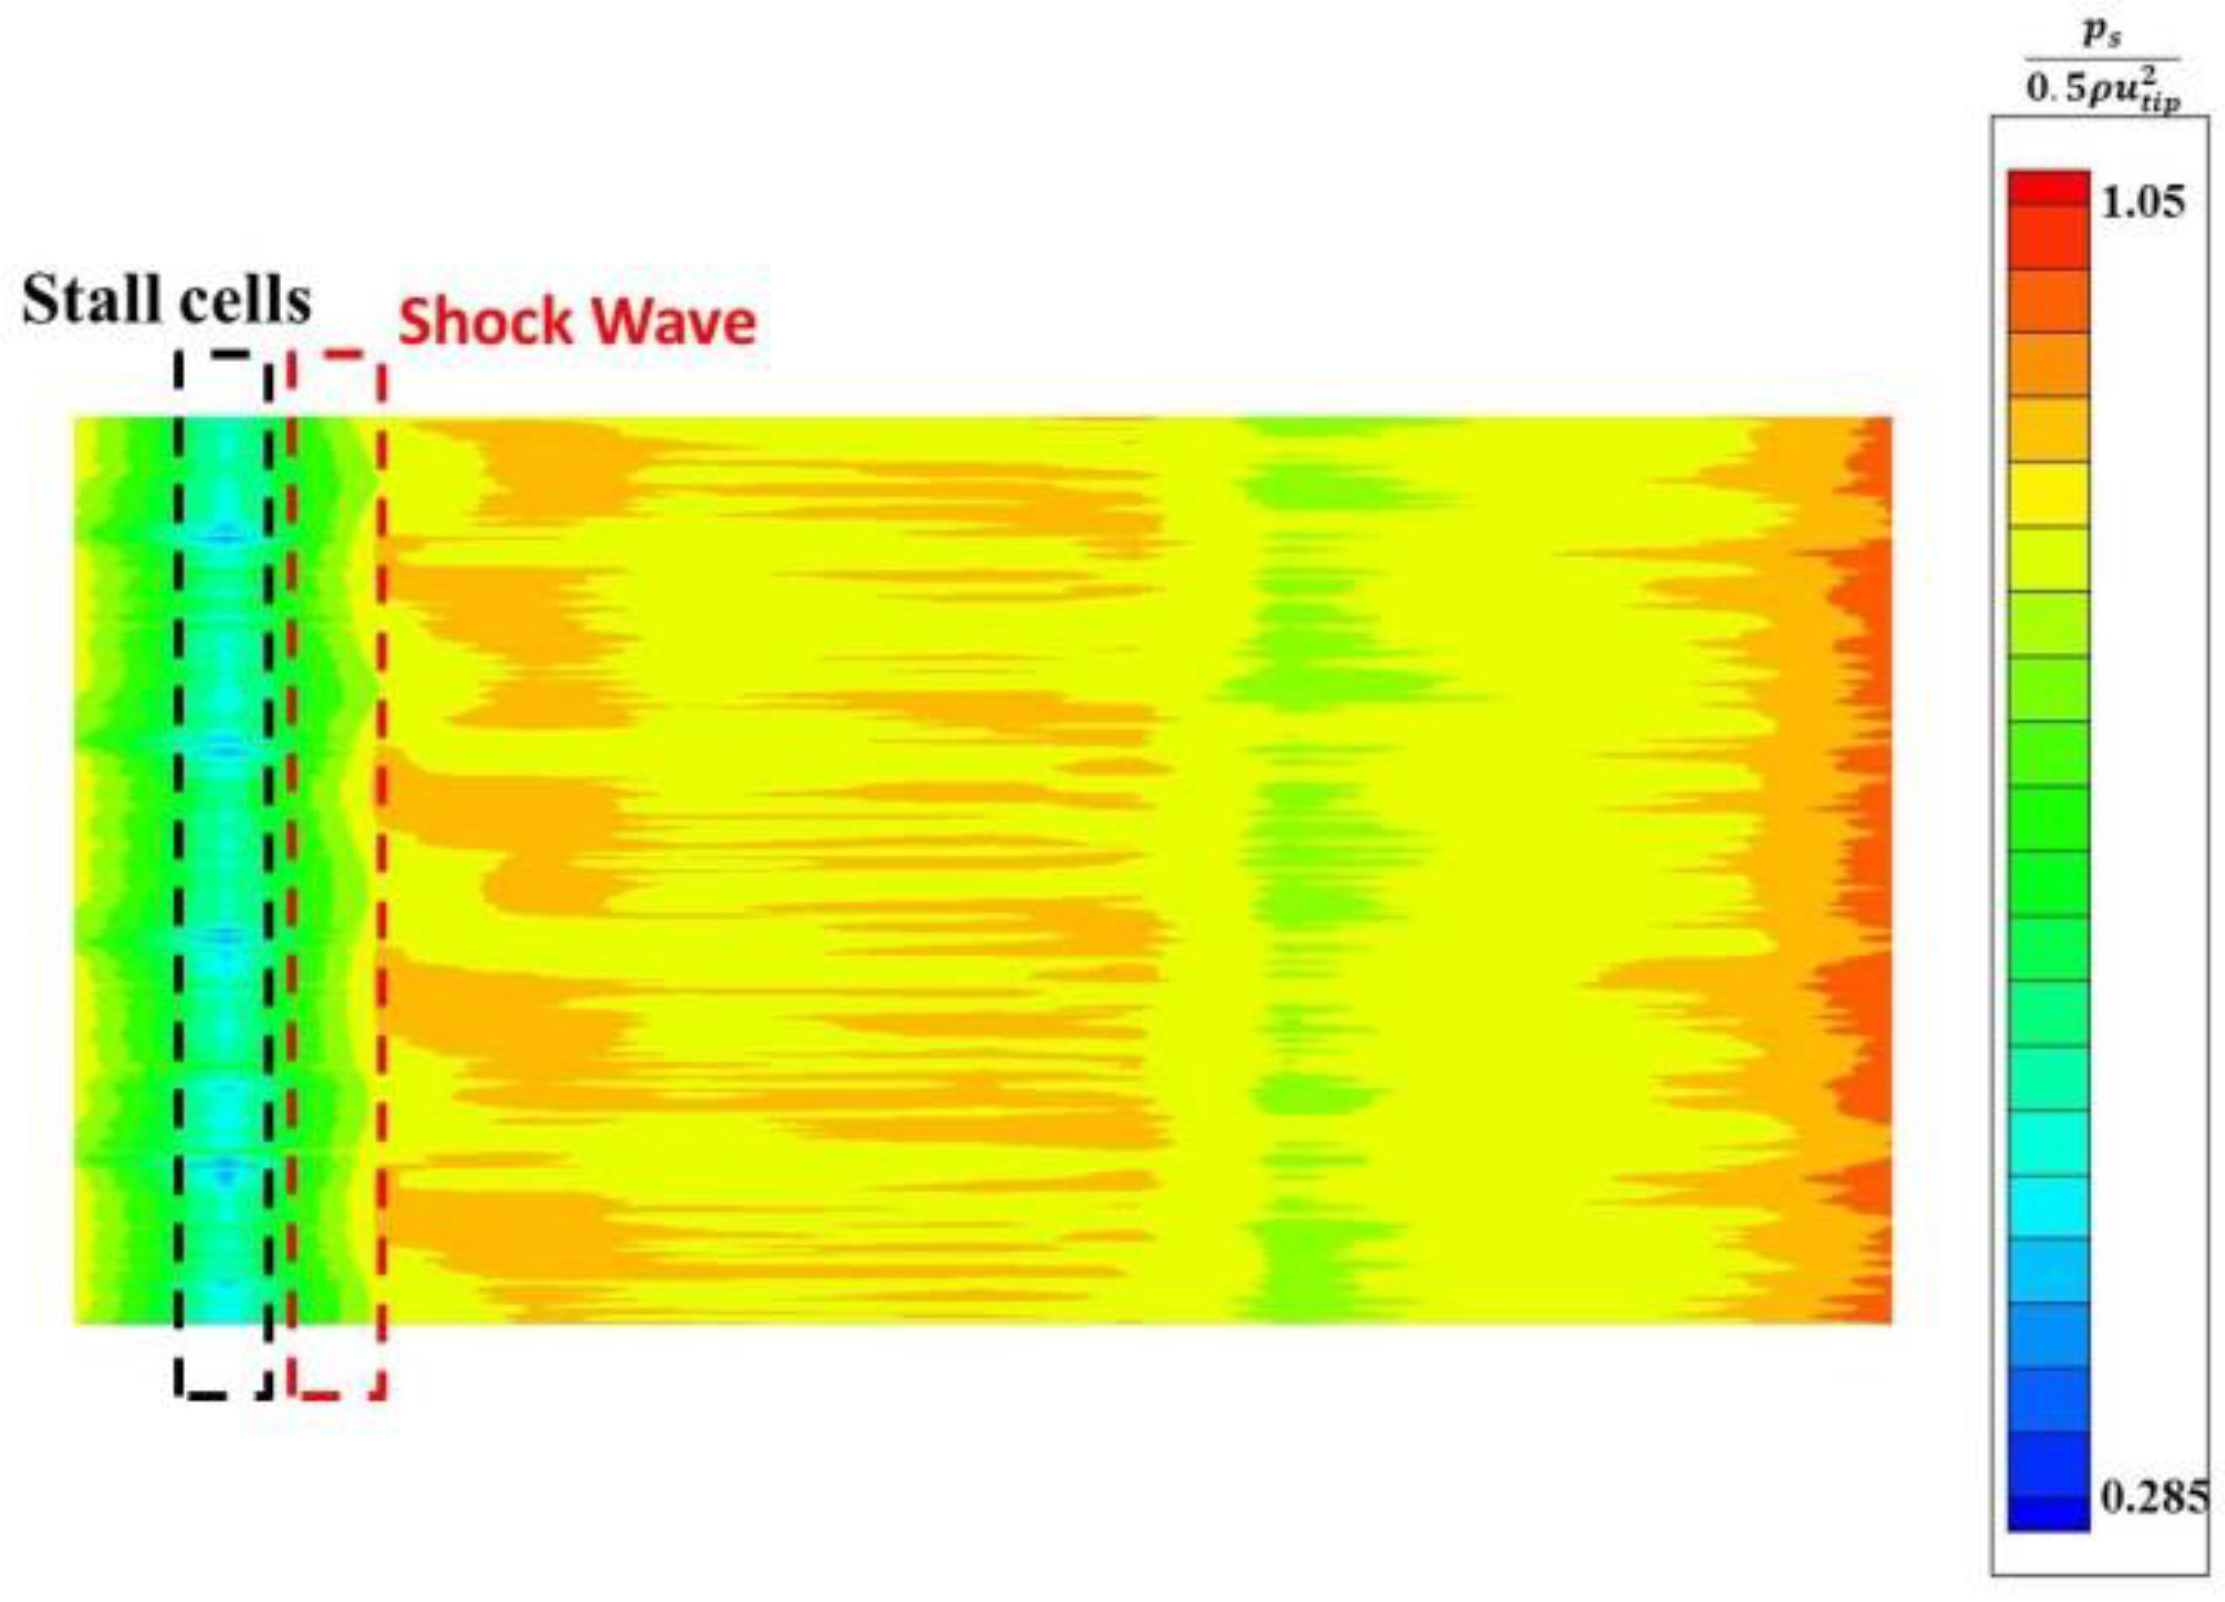
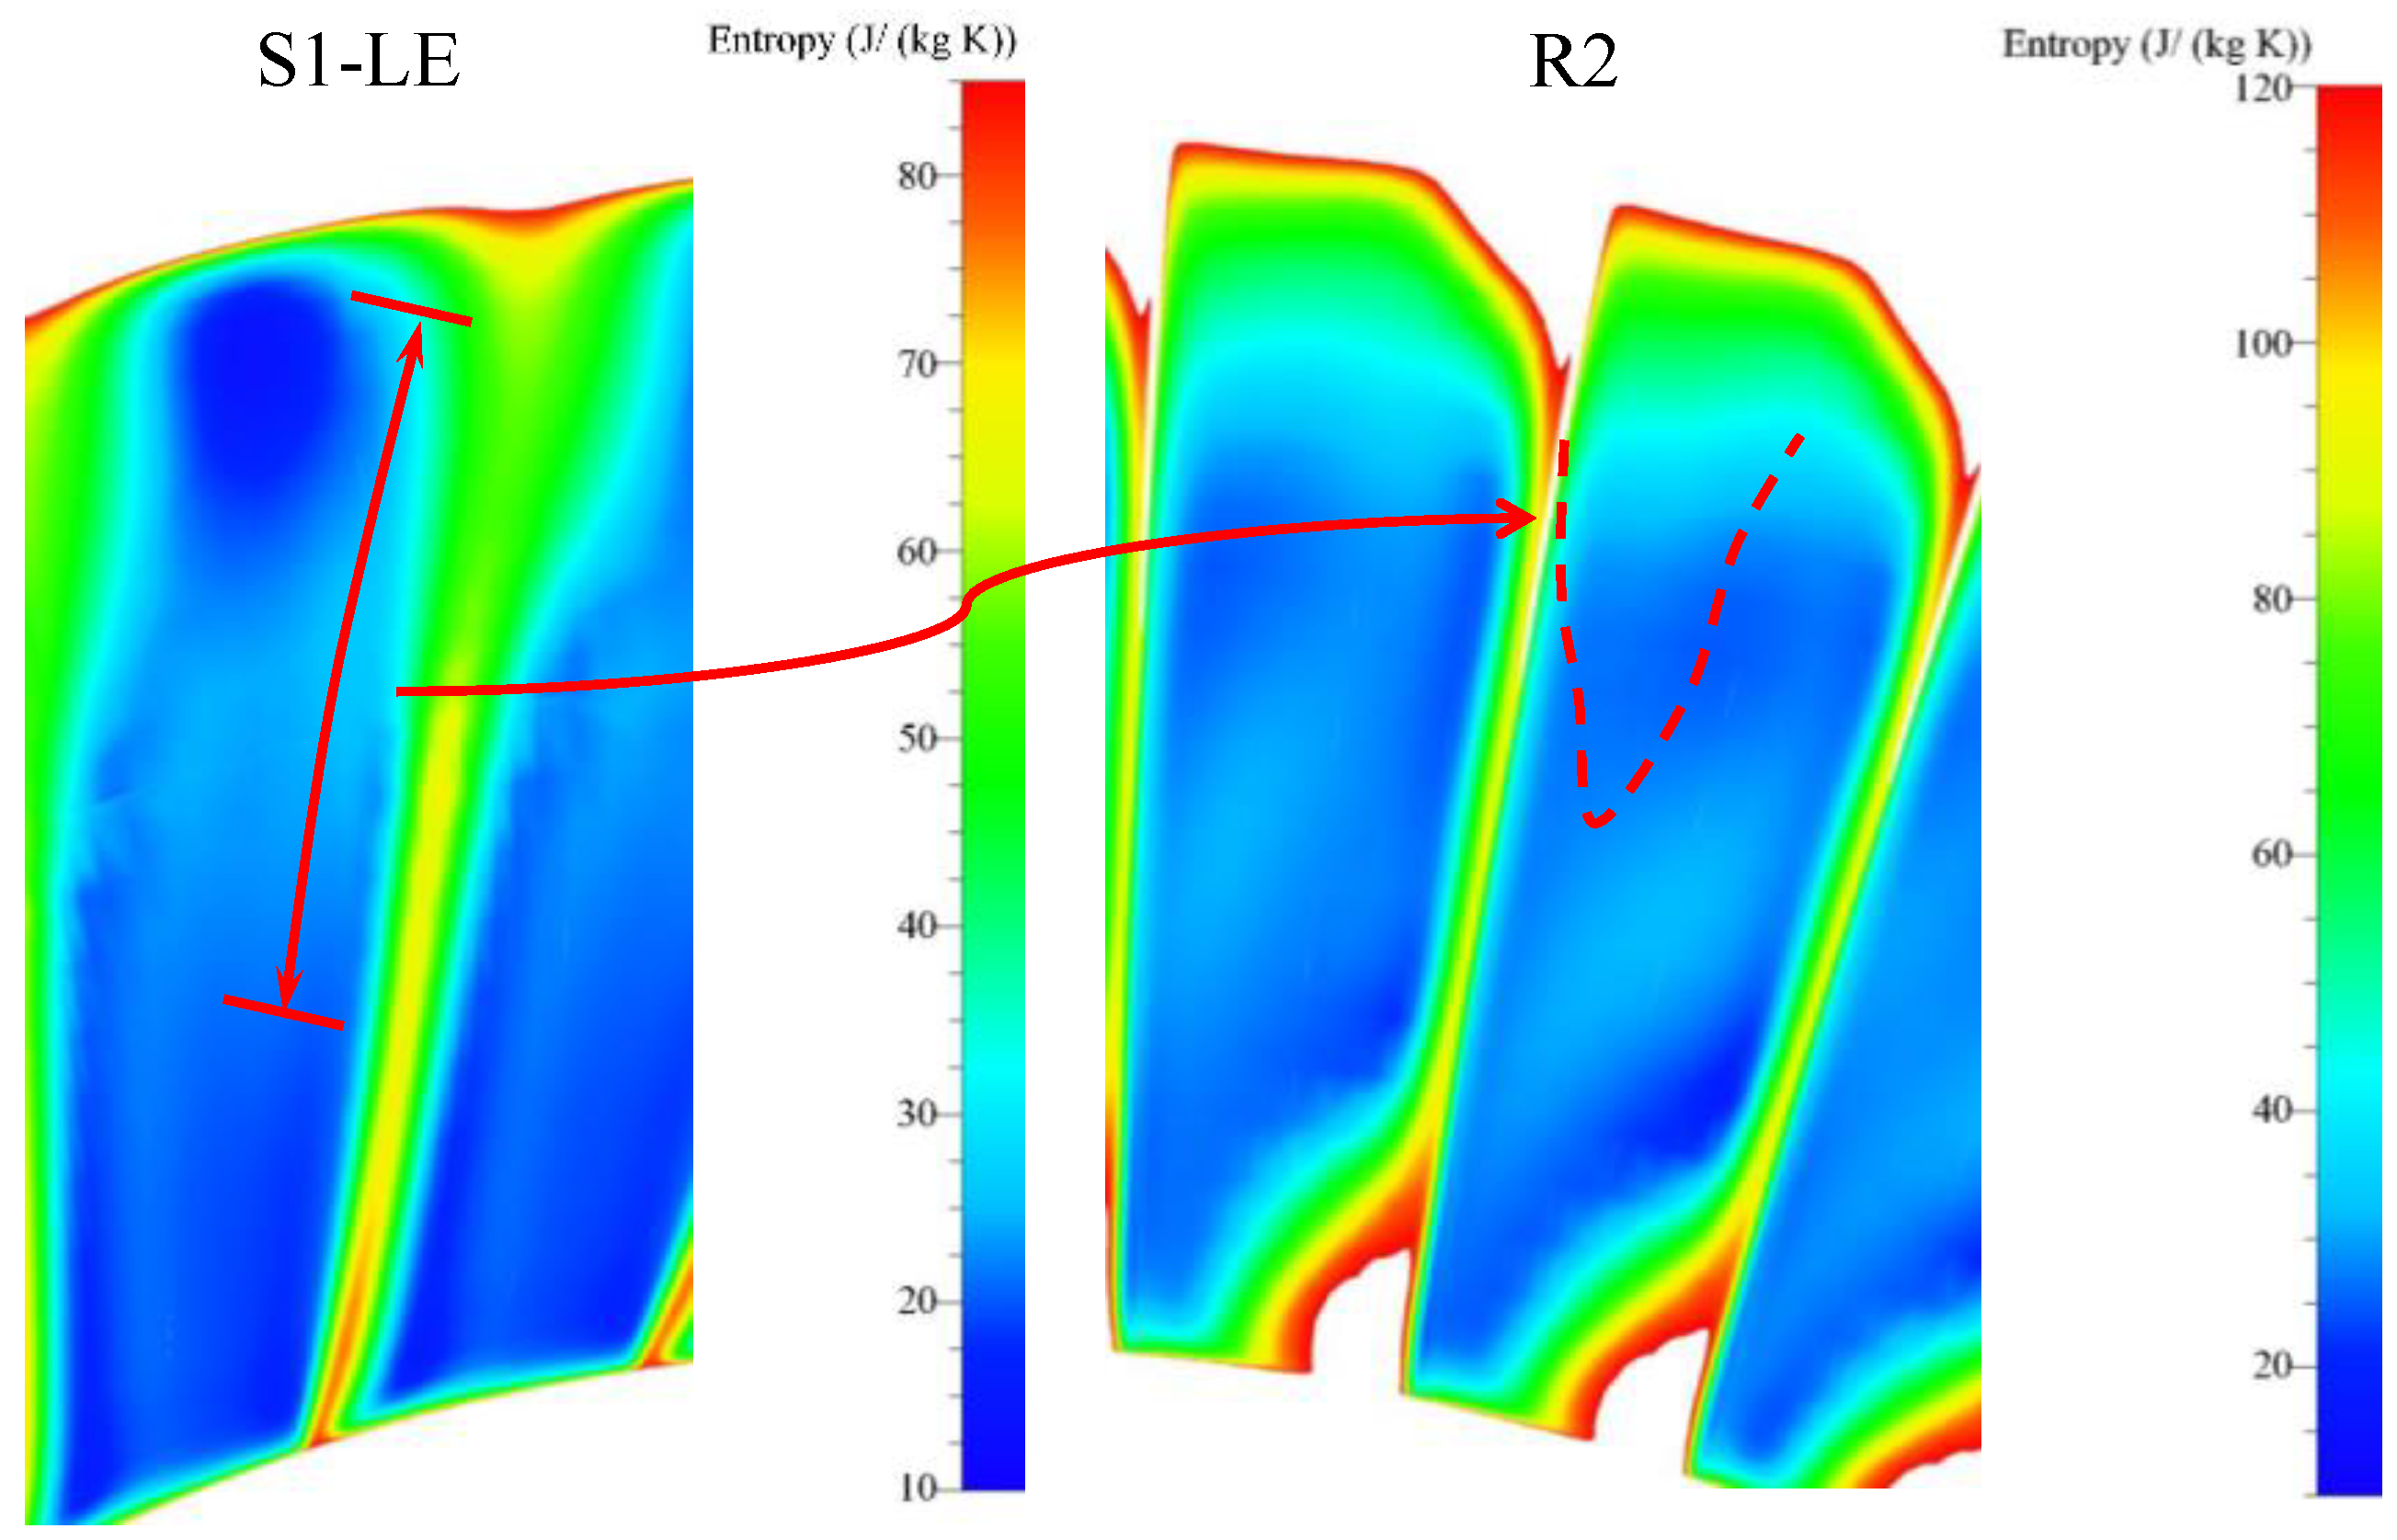
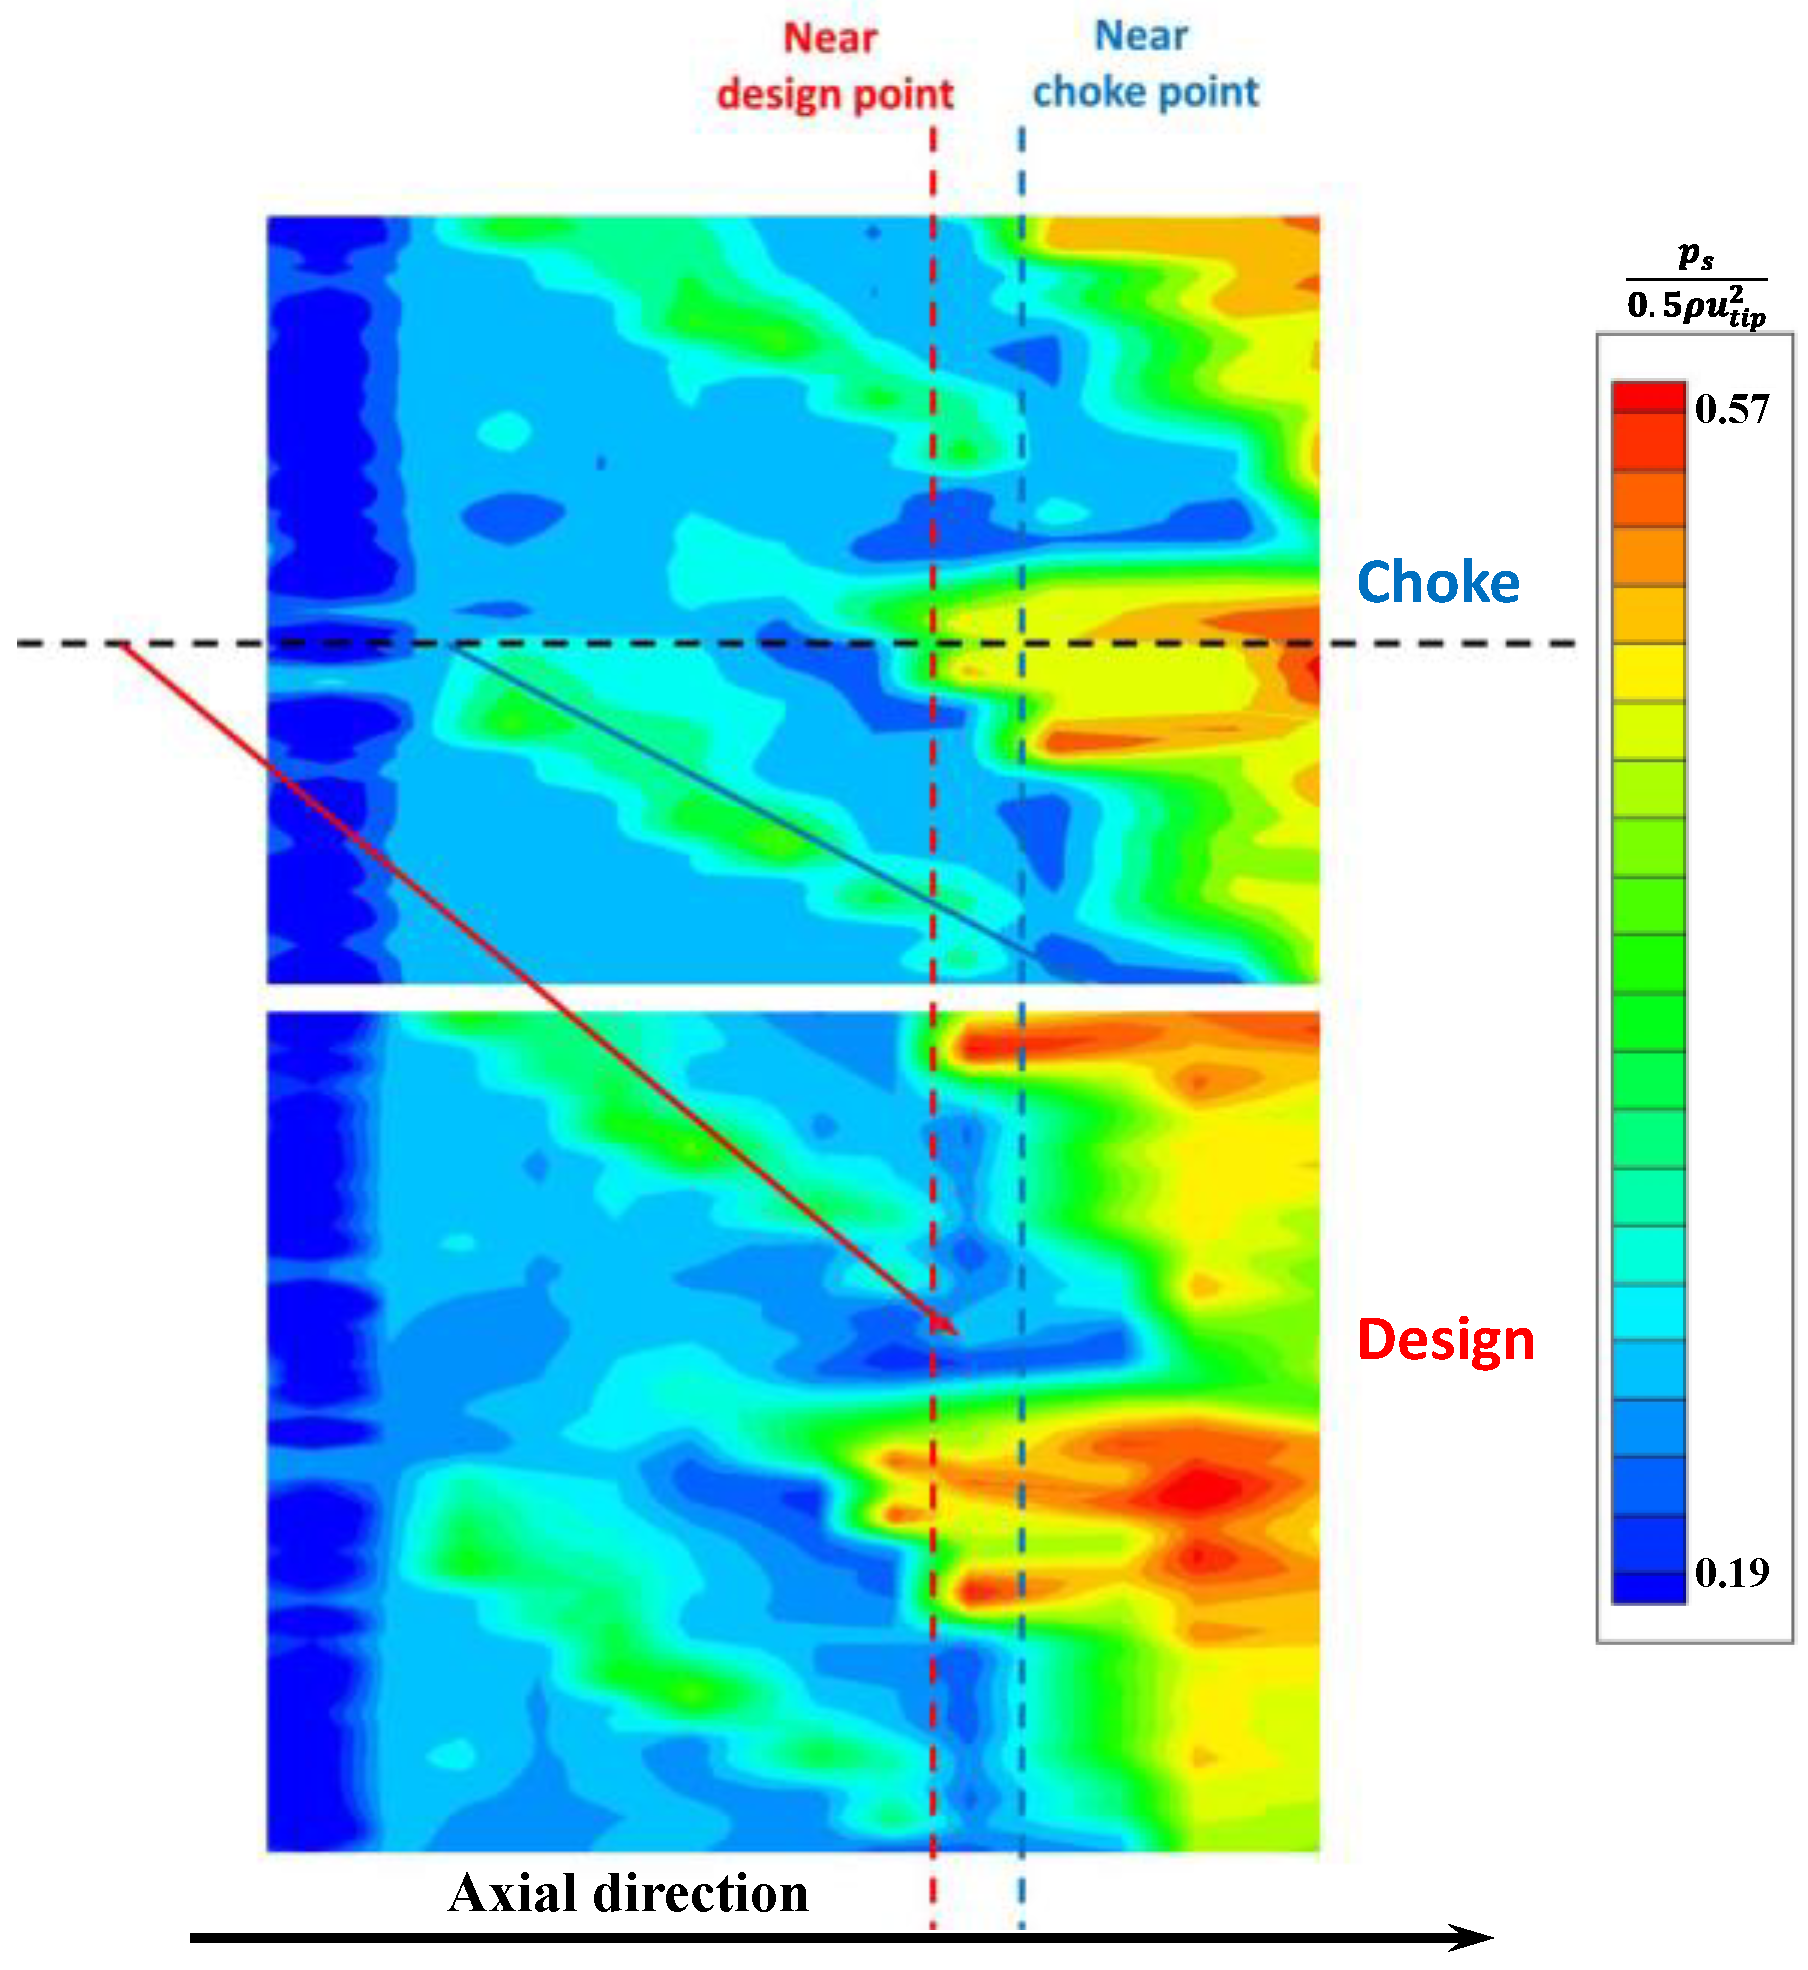
  • The major influence of the R1 shock wave, which is in the form of a ‘long tail’ flow structure, obviously reaches the exit of R1 and has effects on the upper parts of S1 and R2.
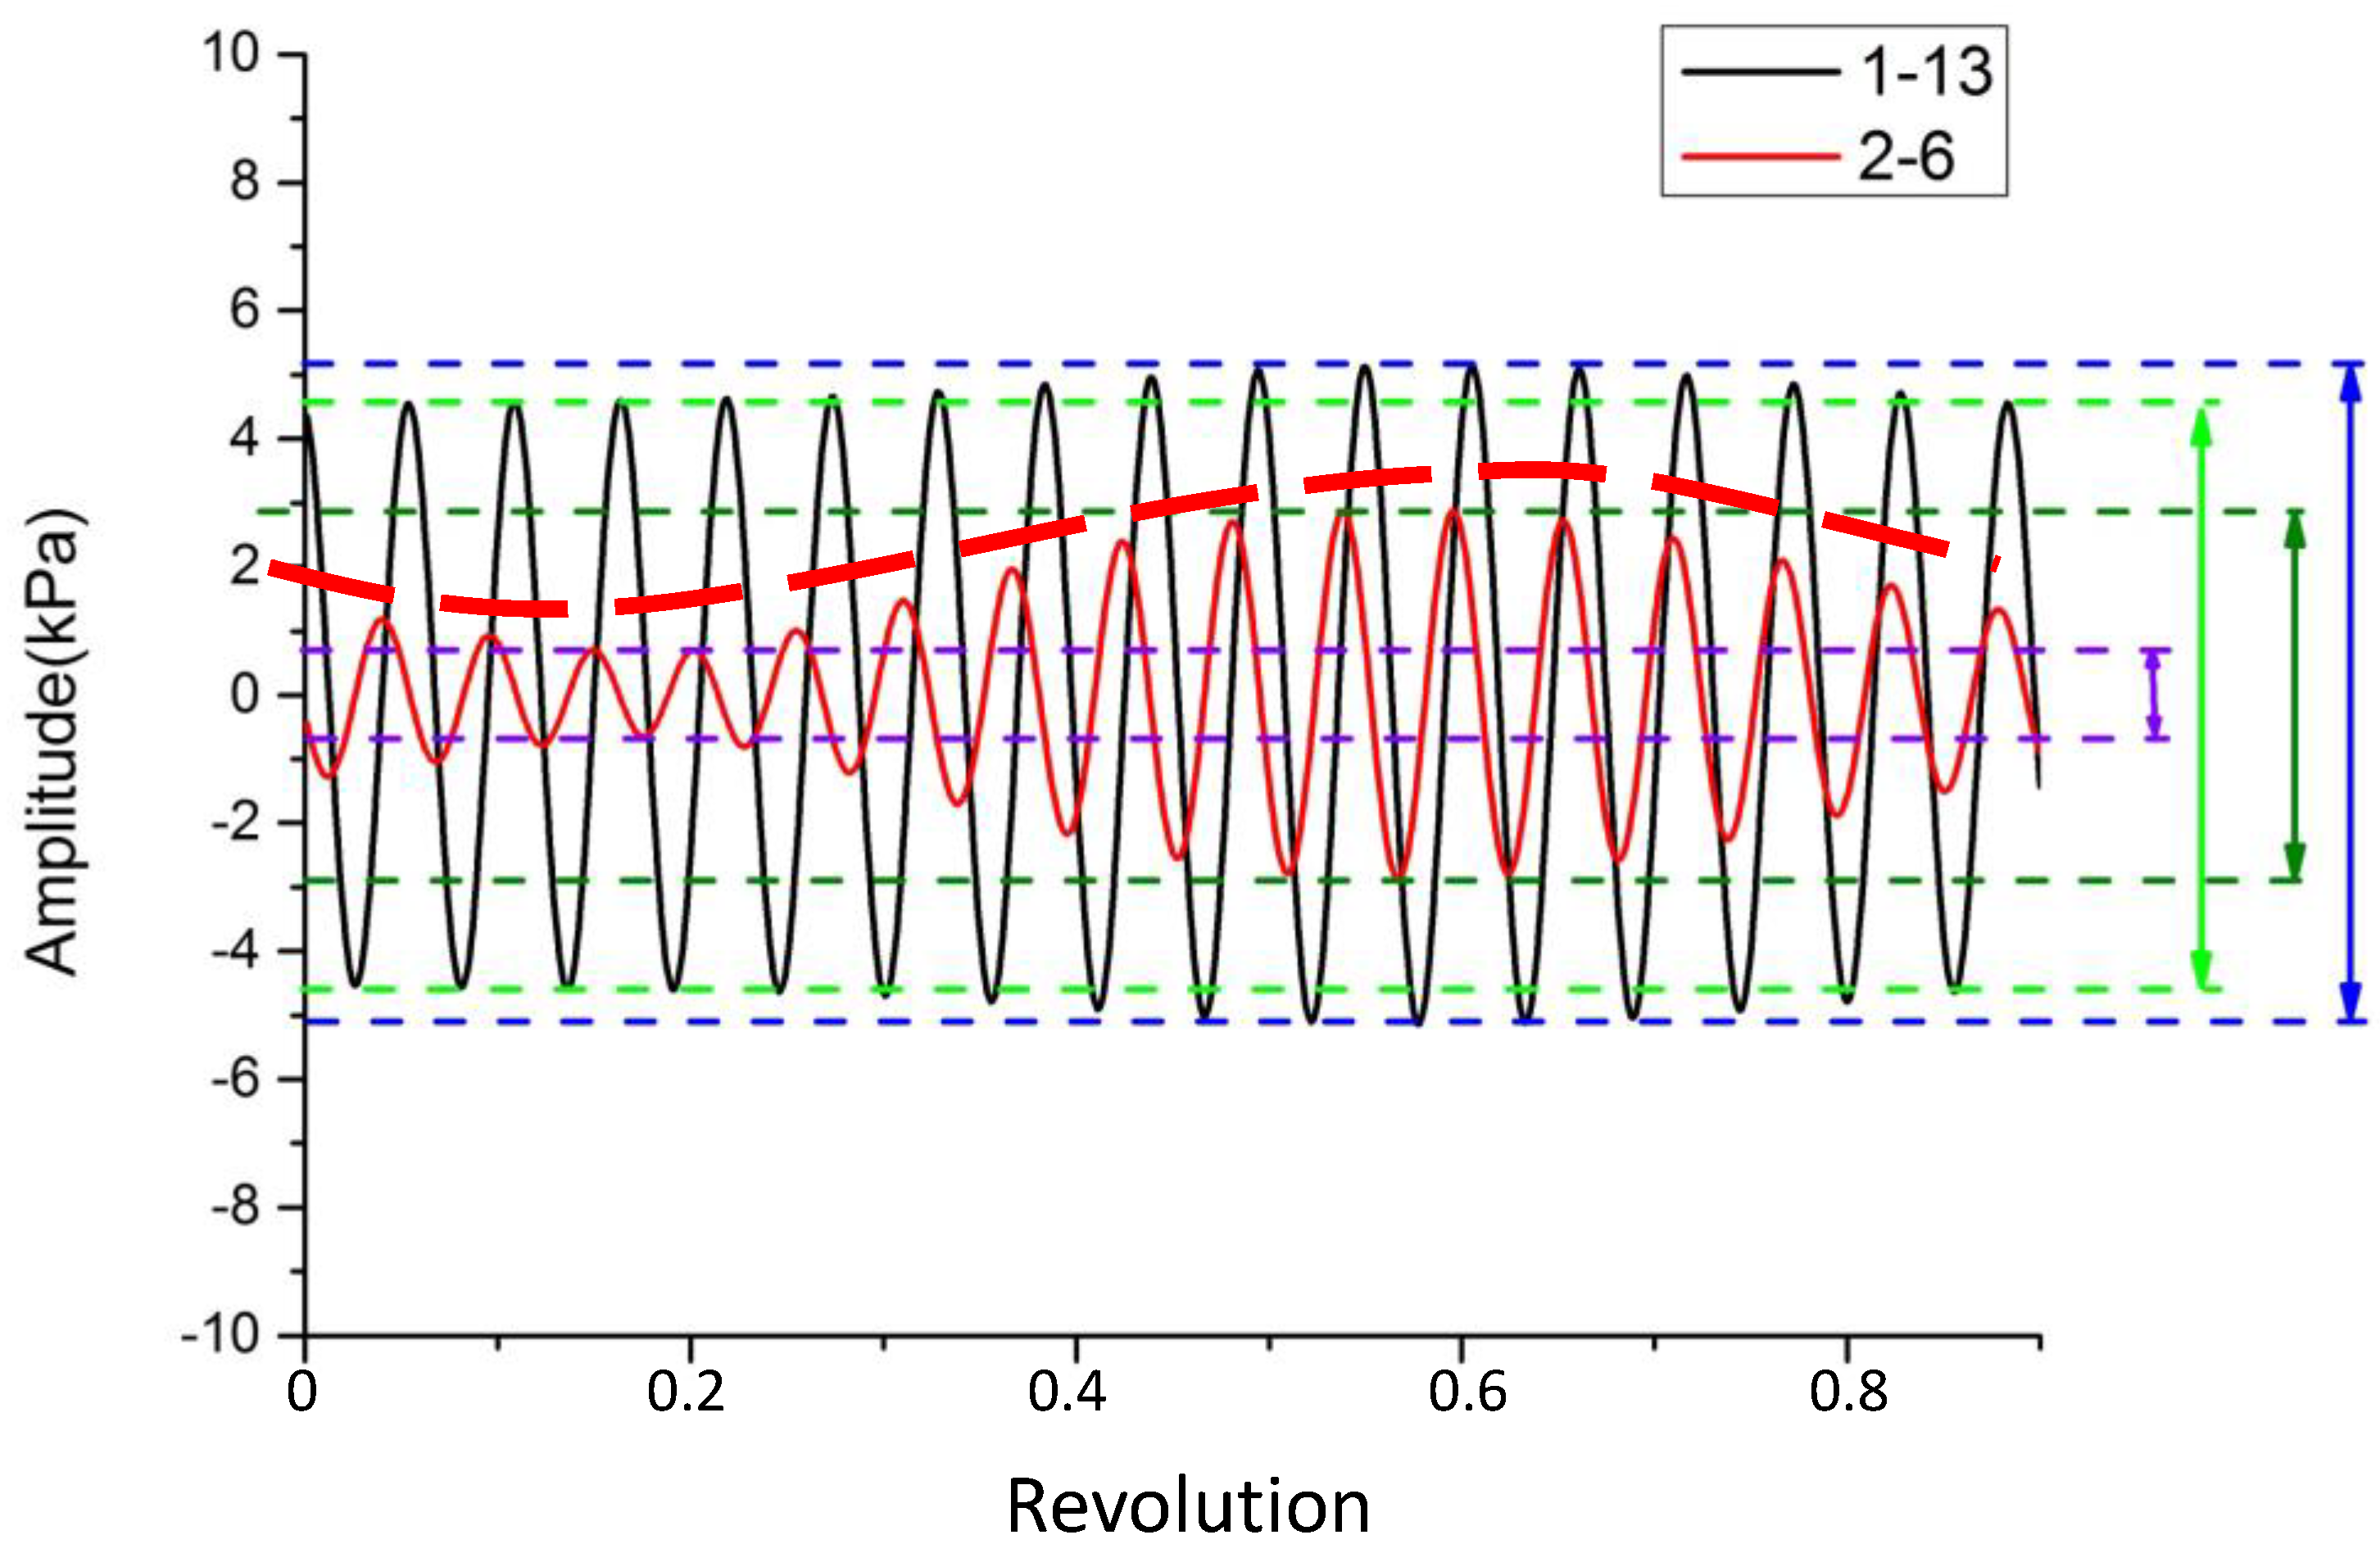
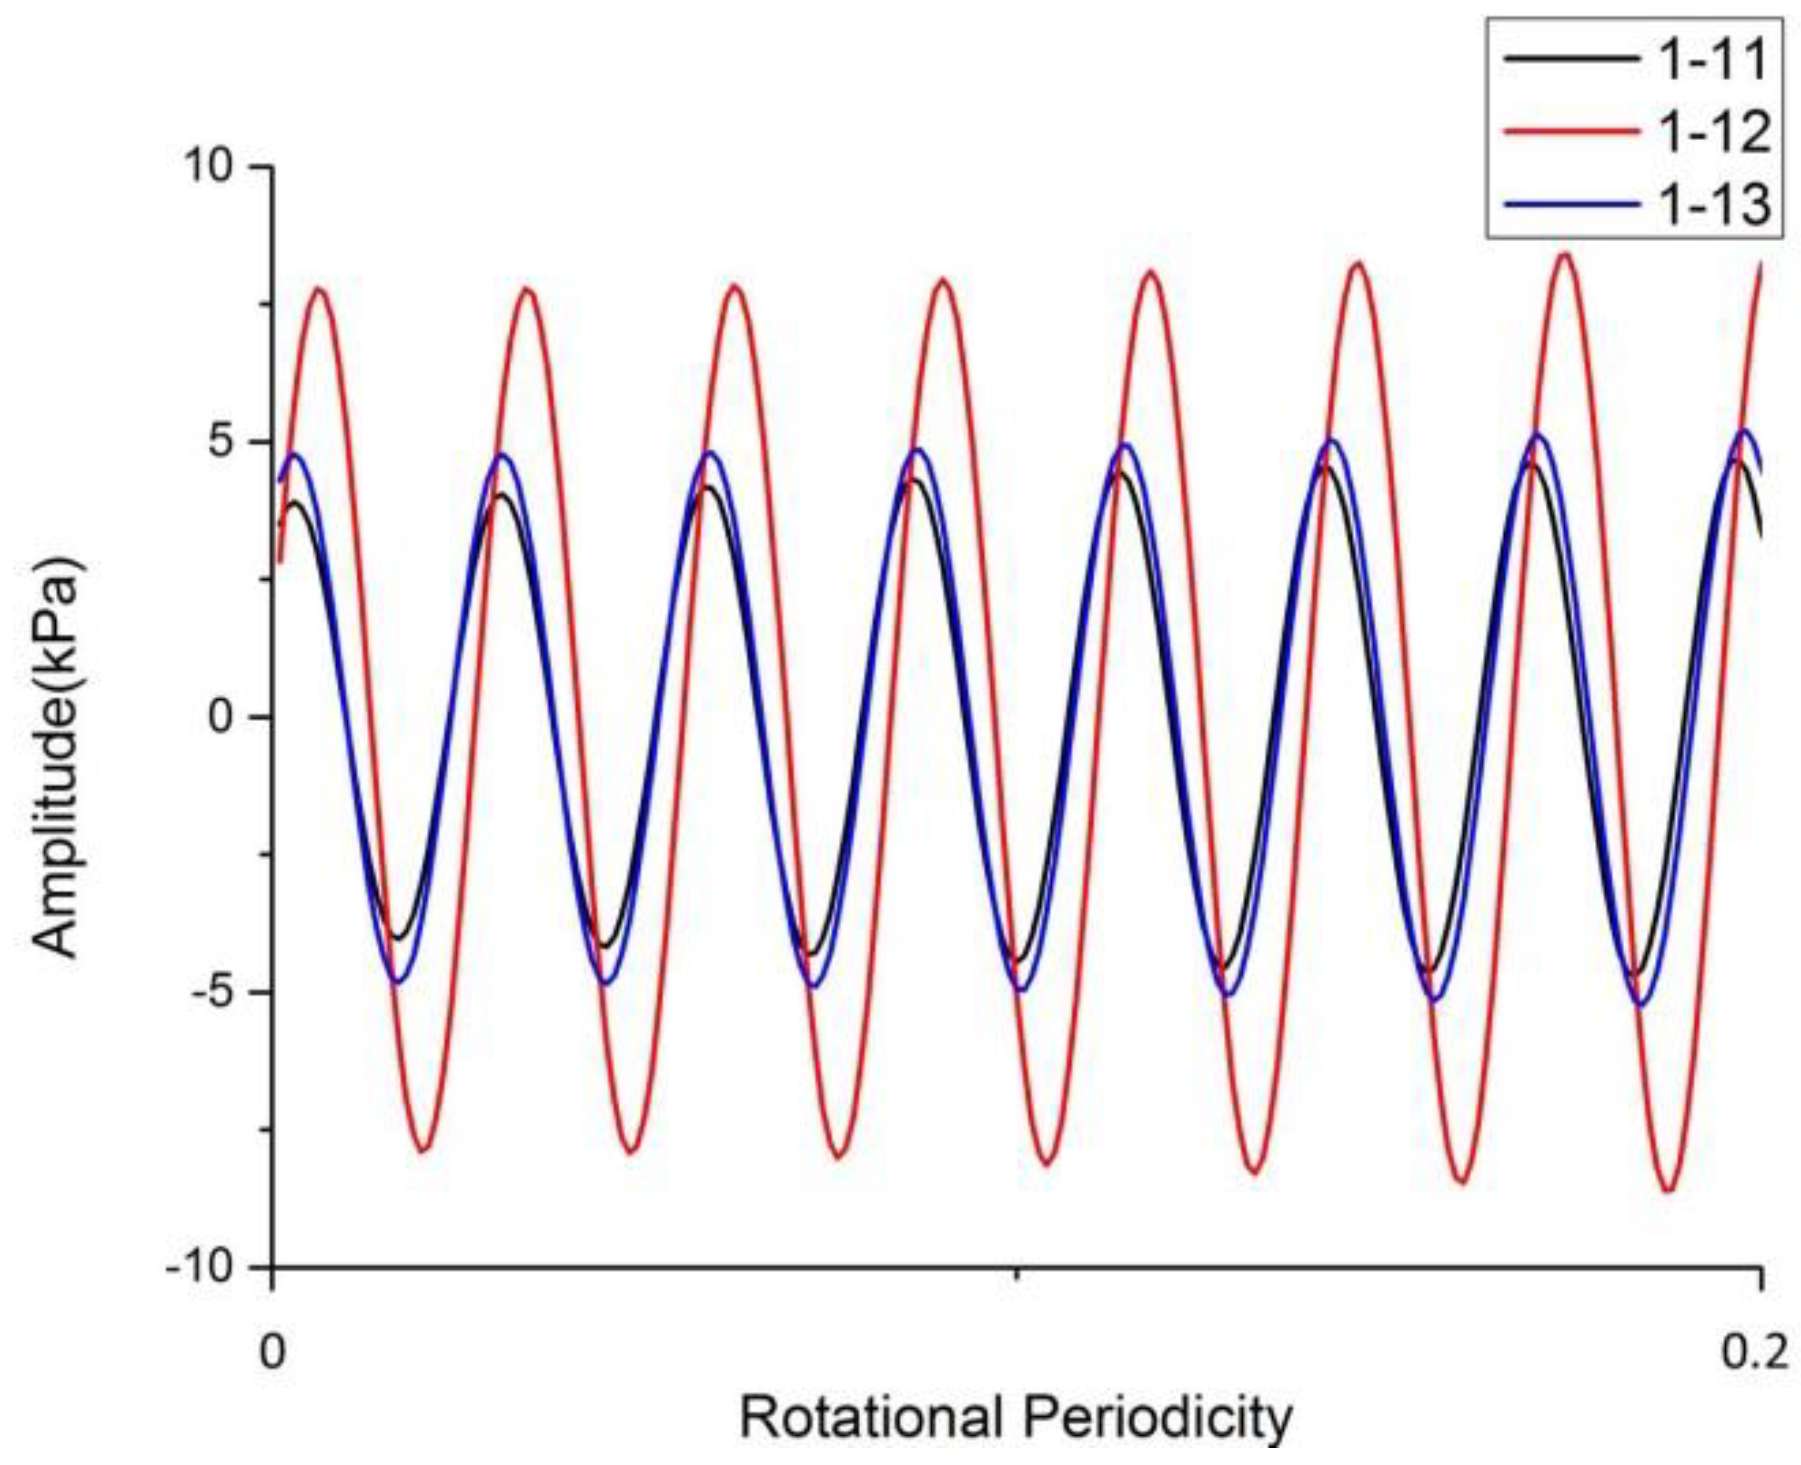
  • The amplitudes of R1-1BPF and R1-2BPF do not keep declining along the R2 chord, while a sudden increase is found near the middle of the chord, which is related to the coupling effect of the flow separation at the leading edge and the interference flow structures from R1. For R2, the region most sensitive to the R1-1BPF and R1-2BPF effect is concentrated in the part from the middle to the rear of the passage.
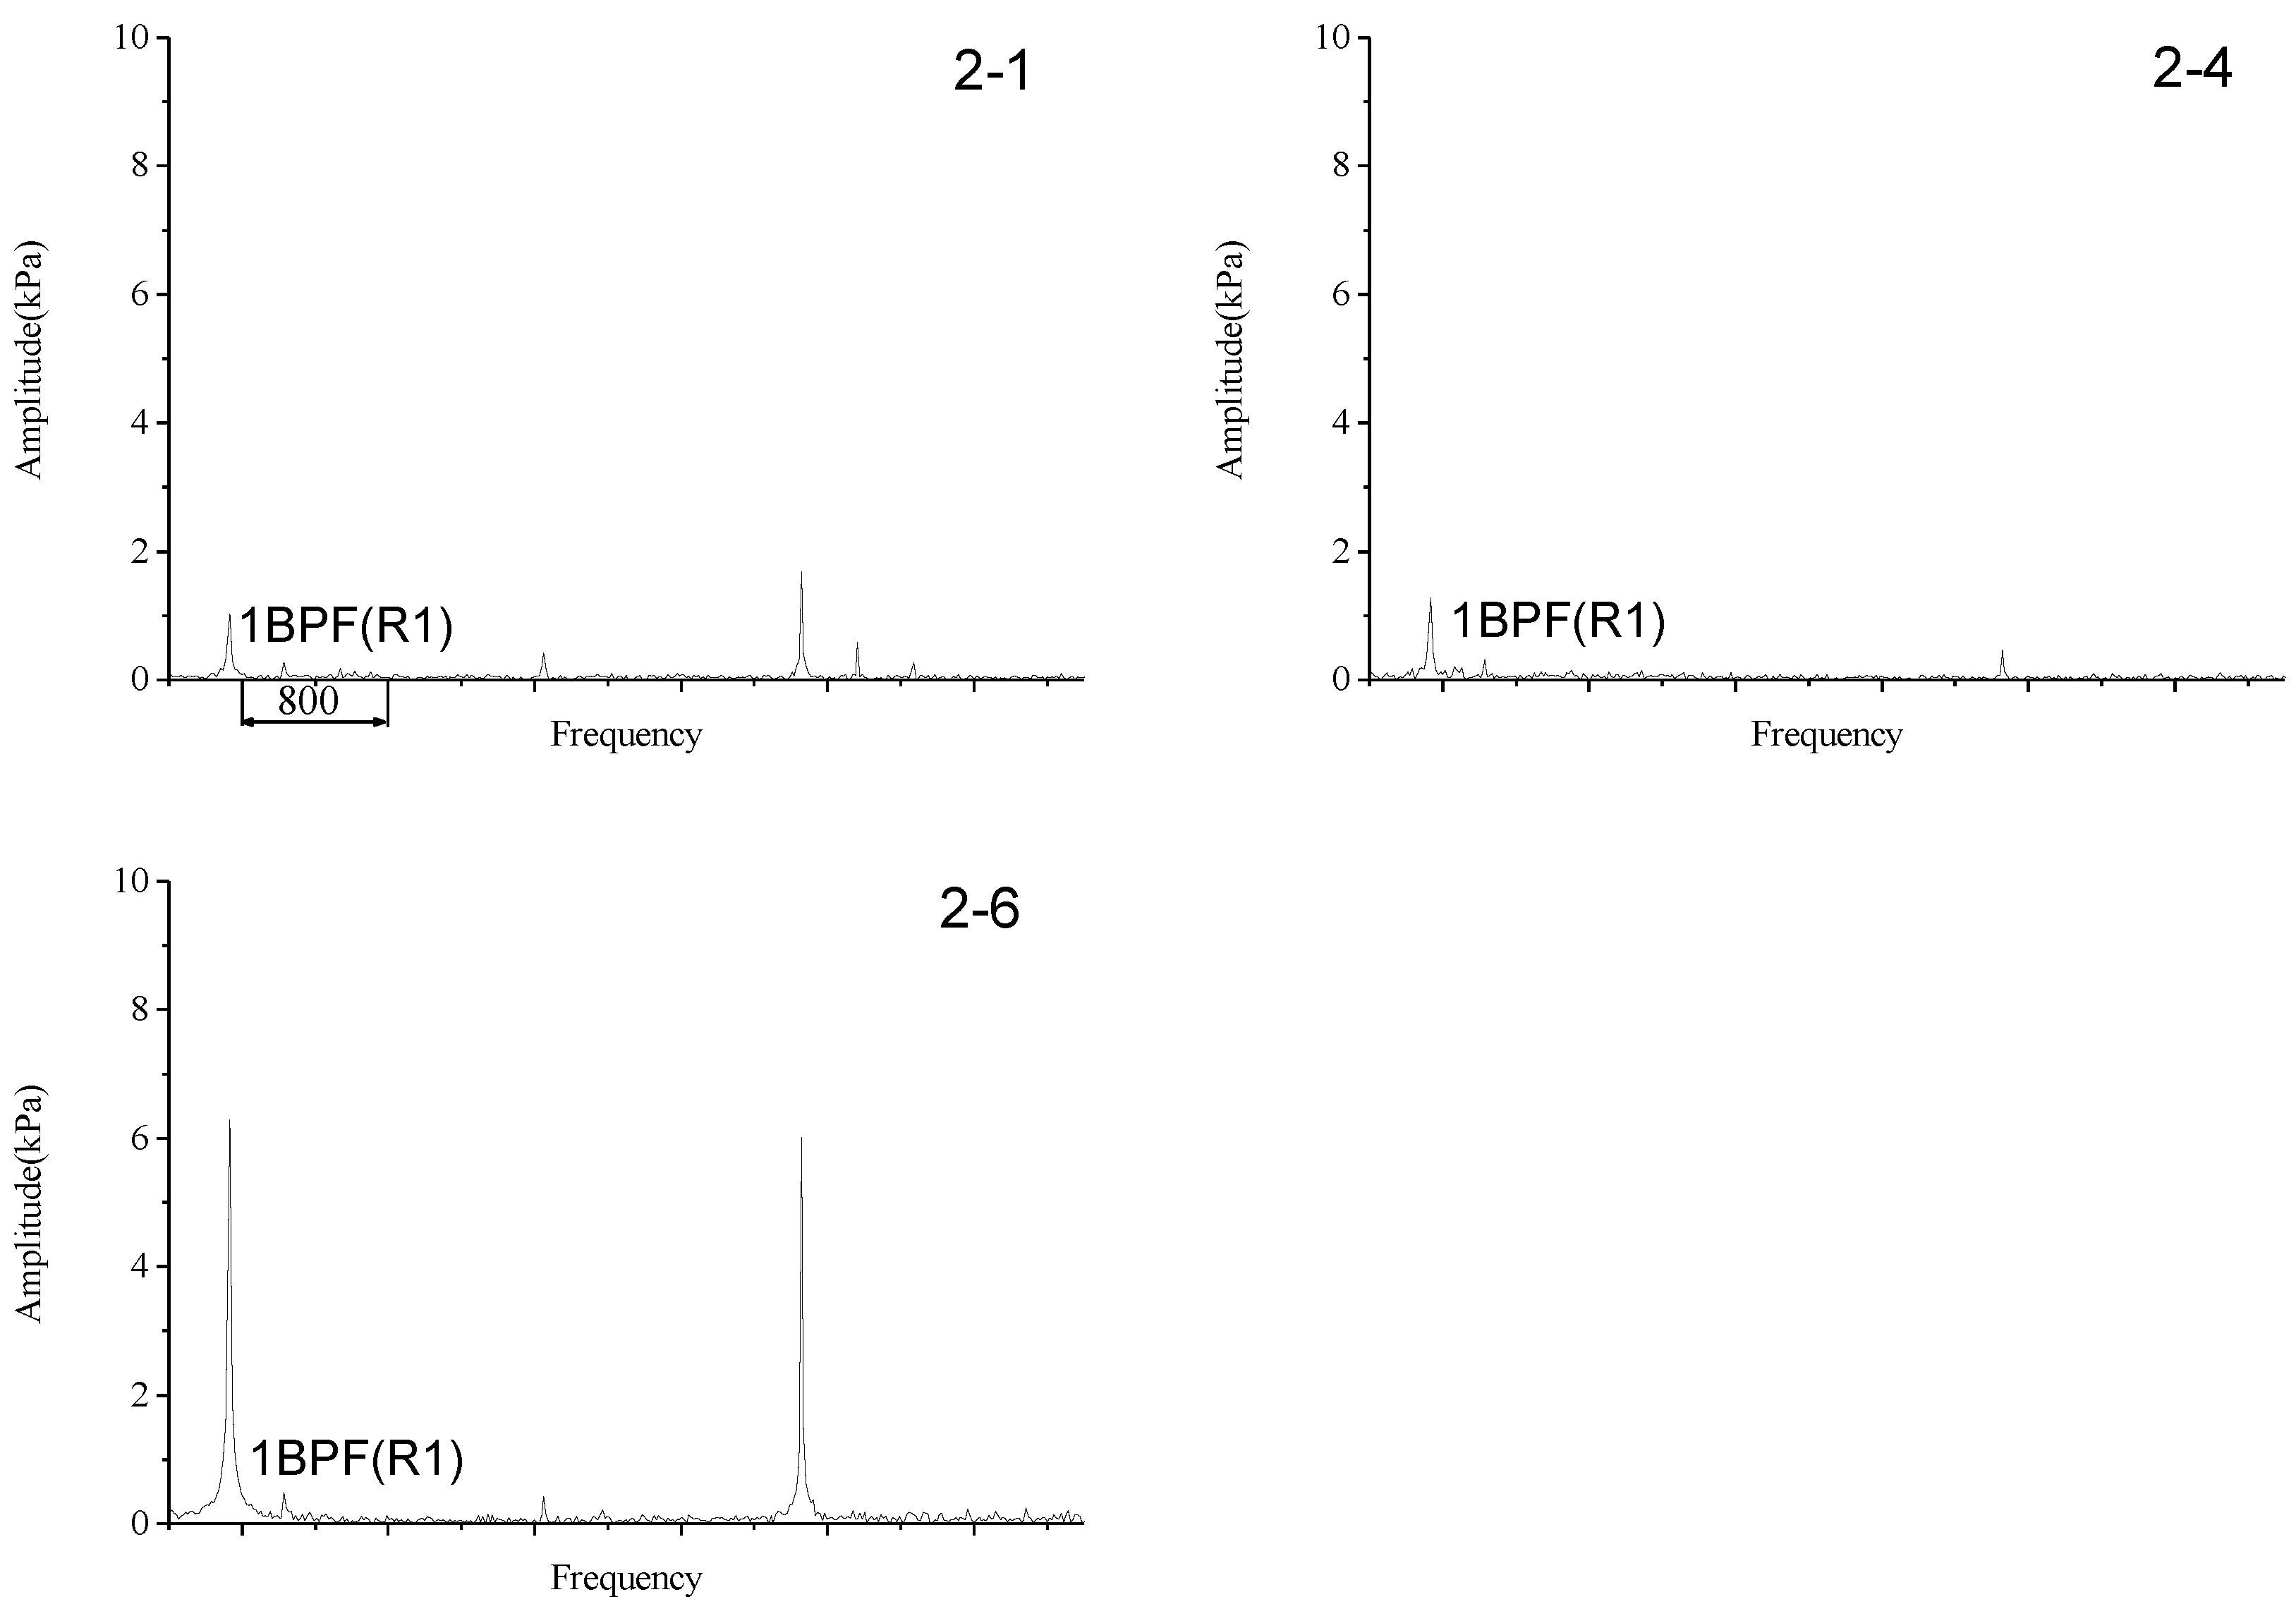
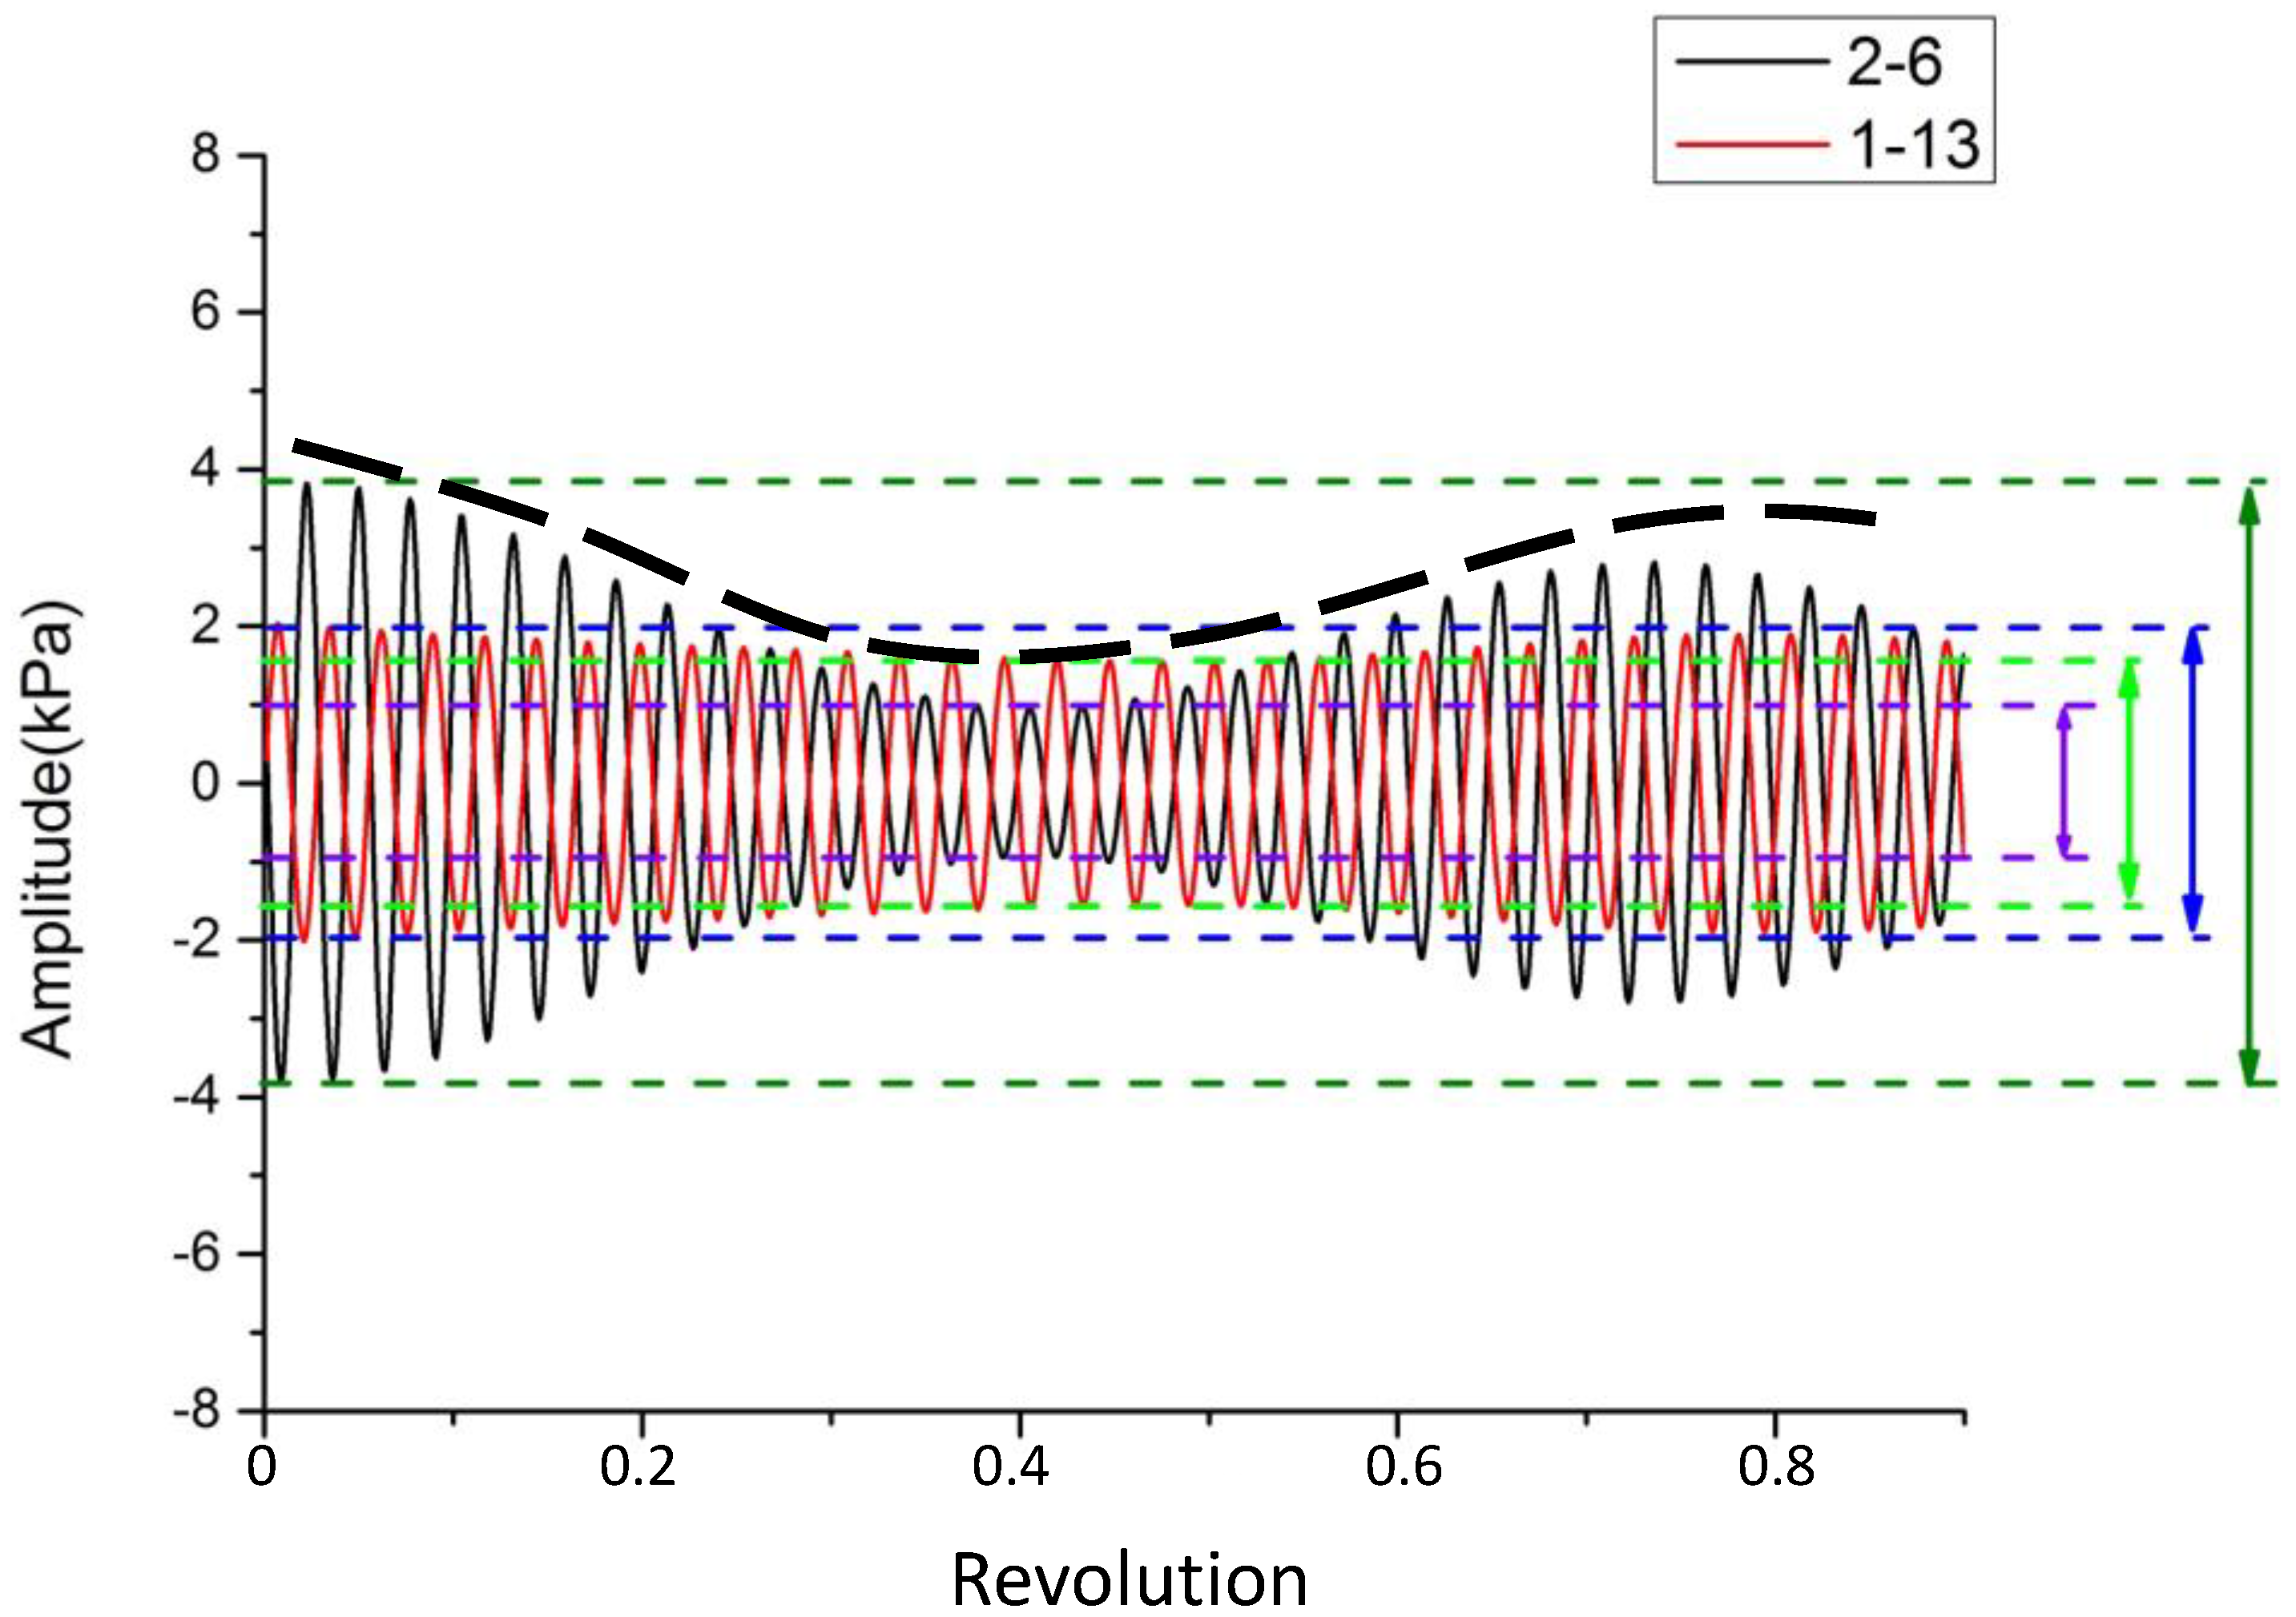
  • The characteristics of the interaction between R1and R2 near the design point are similar to those near the choke point, except for some quantitative differences. However, under the effects of the spilled shock wave and flow chaos inside R1, the R1-1BPF and R1-2BPF disturbances inside R2 almost vanish at the surge limit.
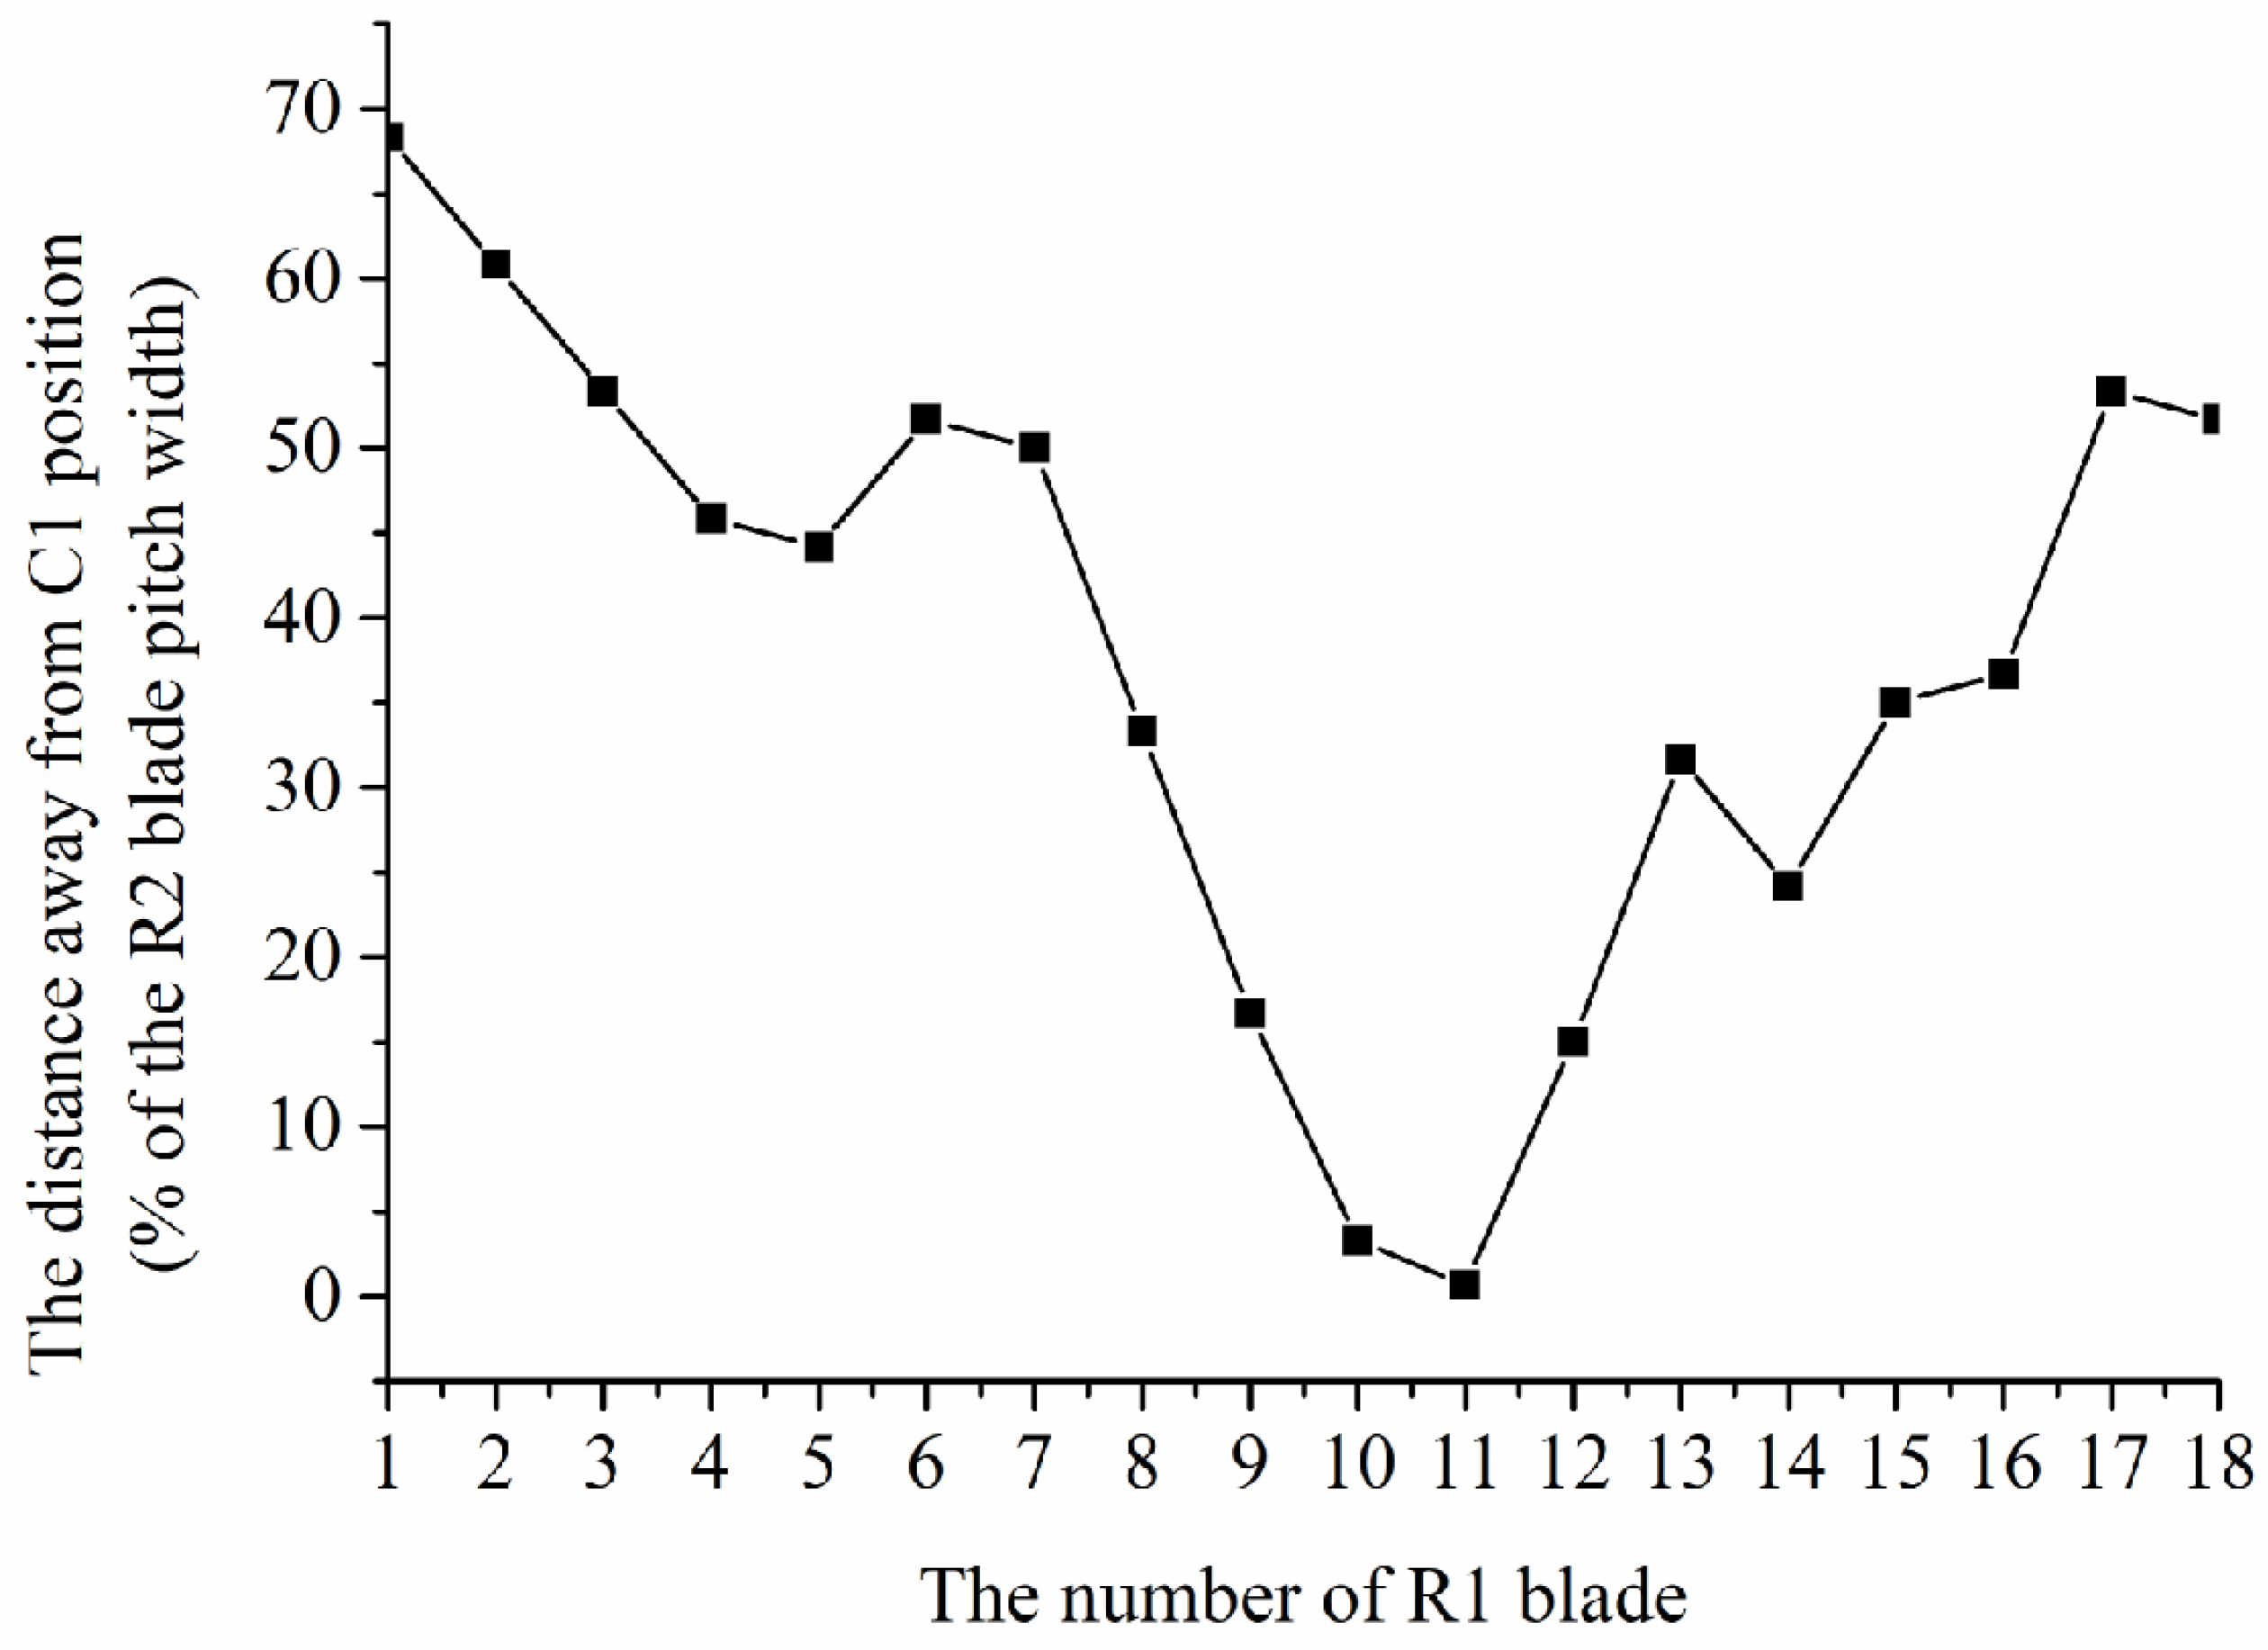
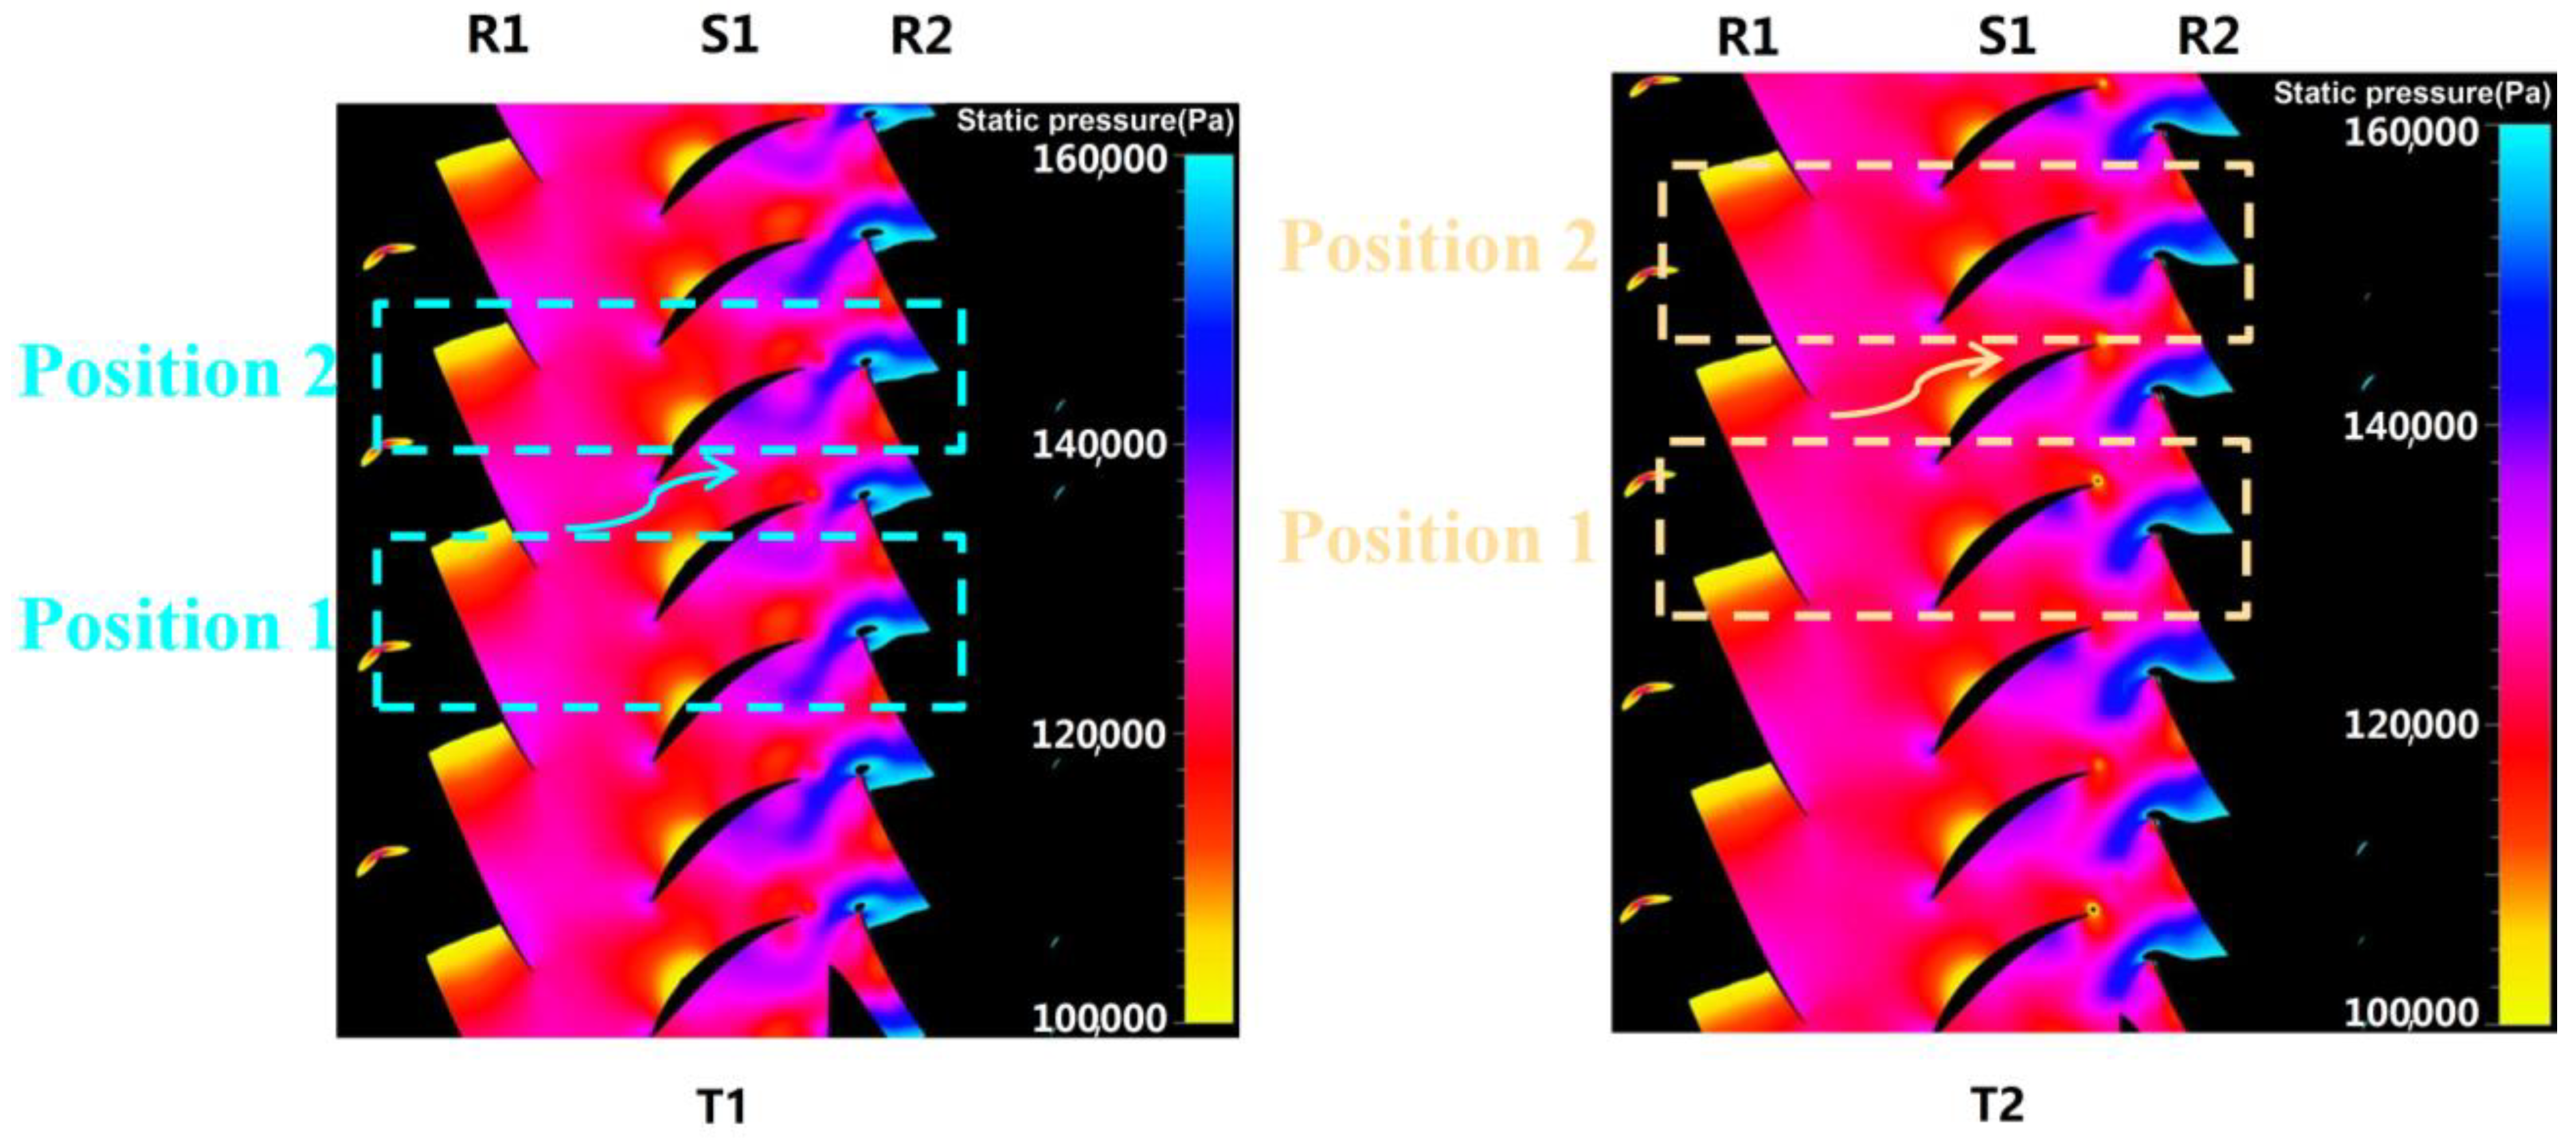
  • The relative clocking position of the R1 and R2 blades significantly influences the circumferential propagations of R1-1BPF and R1-2BPF inside the R2 passage. It is simply the coupling effect of the separation wake at S1-TE and the invasion of the high-pressure region from R2-LE that controls the passing-through of the shock wave influence from R1. Under such an effect, the pressure circumferential non-uniformity grows evidently from the R1 exit to the middle of R2.

Author Contributions

Conceptualization, J.Z. and Q.L.; methodology, D.Y.; investigation, J.Z. All authors have read and agreed to the published version of the manuscript.

Funding

This research was funded by the National Natural Science Foundation of China (No. 52130603).

Institutional Review Board Statement

Not applicable.

Informed Consent Statement

Not applicable.

Data Availability Statement

All data, models, and code generated or used during the study appear in the submitted article.

Acknowledgments

The authors would like to gratefully acknowledge the support of the National Natural Science Foundation of China (No. 52130603).

Conflicts of Interest

The authors declare that they have no competing interests.

Nomenclature

BPFblade-passing frequency
f r o t rotating frequency of the compressor shaft
LEleading edge
S1first stator
TEtrailing edge
p r o t 2 pressure rise within R2
p s pressure rise
p the assemble average pressure disturbance at a specific phase
p ˜ pressure coefficient
R1first rotor
R1-1BPFdisturbance of R1 at the blade-passing frequency
R1-2BPFdisturbance of R1 at the second harmonic of the blade-passing frequency
R2second rotor
u t i p tip tangential speed of R1
ρ density of air

References

  1. Ottavy, X.; Trebinjac, I.; Vouillarmet, A. Analysis of the interrow flow field within a transonic axial compressor: Part 1-Experimental investigation. ASME J. Turbomach. 2001, 123, 49–56. [Google Scholar] [CrossRef]
  2. Ottavy, X.; Trebinjac, I.; Vouillarmet, A. Analysis of the interrow flow field within a transonic axial compressor: Part 2-Unsteady flow analysis. ASME J. Turbomach. 2001, 123, 57–63. [Google Scholar] [CrossRef]
  3. Lecheler, S.; Schnell, R.; Stubert, B. Experimental and numerical investigation of the flow in a 5-stage transonic compressor rig. In Proceedings of the ASME Turbo Expo 2001: Power for Land, Sea, and Air, New Orleans, LA, USA, 4–7 June 2001. [Google Scholar]
  4. Gorrell, S.E.; Okiishi, T.H.; Copenhaver, W.W. Stator-Rotor interactions in a transonic compressor-Part 1: Effect of blade-row spacing on performance. ASME J. Turbomach. 2003, 125, 328–335. [Google Scholar] [CrossRef]
  5. Gorrell, S.E.; Okiishi, T.H.; Copenhaver, W.W. Stator-Rotor interactions in a transonic compressor-Part 2: Description of a loss-producing mechanism. ASME J. Turbomach. 2003, 125, 336–345. [Google Scholar] [CrossRef]
  6. Mailach, R.; Vogeler, K. Aerodynamic blade row interaction in an axial compressor-Part 1-Unsteady boundary layer development. ASME J. Turbomach. 2004, 126, 35–44. [Google Scholar] [CrossRef]
  7. Wheeler, A.P.S.; Miller, R.J. Compressor wake/leading-edge interactions at off-design incidences. In Proceedings of the ASME Turbo Expo 2008: Power for Land, Sea, and Air, Berlin, Germany, 9–13 June 2008. [Google Scholar]
  8. Wheeler, A.P.S.; Sofia, A.; Miller, R.J. The effect of leading-edge geometry on wake interactions in compressors. In Proceedings of the ASME Turbo Expo 2007: Power for Land, Sea, and Air, Montreal, QC, Canada, 14–17 May 2007. [Google Scholar]
  9. Yamagami, M.; Kodama, H.; Kato, D.; Tsuchiya, N.; Horiguchi, Y.; Kazawa, J. Unsteady flow effects in a high-speed multistage axial compressor. In Proceedings of the ASME Turbo Expo 2009: Power for Land, Sea, and Air, Orlando, FL, USA, 8–12 June 2009. [Google Scholar]
  10. Zhao, H.; Wang, Z.; Xi, G. Unsteady flow structures in the tip region for a centrifugal compressor impeller before the rotating stall. Sci. China Technol. Sci. 2017, 60, 924–934. [Google Scholar] [CrossRef]
  11. Stading, J.; Friedrichs, J.; Waitz, T.; Dobriloff, C.; Becker, B.; Gummer, V. The potential of rotor and stator clocking in a 2.5-stage low-speed axial compressor. In Proceedings of the ASME Turbo Expo 2012: Turbine Technical Conference and Exposition, Copenhagen, Denmark, 11–15 June 2012. [Google Scholar]
  12. Fruth, F.; Vogt, D.M.; Bladh, R.; Fransson, T.H. Unsteady forcing vs. efficiency-the effect of clocking on a transonic industrial compressor. In Proceedings of the ASME 2013 Fluids Engineering Division Summer Meeting, Incline Village, NV, USA, 7–11 July 2013. [Google Scholar]
  13. Milidonis, K.F.; Semlitsch, B.; Hynes, T. Effect of clocking on compressor noise generation. AIAA J. 2018, 56, 4225–4231. [Google Scholar] [CrossRef]
  14. Geng, S.J.; Chen, N.X.; Zhang, H.W.; Huang, W.G. An improvement on the efficiency of a single rotor transonic compressor by reducing the shock wave strength on the blade suction surfaces. J. Therm. Sci. 2012, 21, 127–135. [Google Scholar] [CrossRef]
  15. Hsu, S.T.; Wo, A.M. Reduction of unsteady blade loading by beneficial use of vertical and potential disturbances in an axial compressor with rotor clocking. ASME J. Turbomach. 1998, 120, 705–713. [Google Scholar] [CrossRef]
  16. He, L.; Chen, T.; Wells, R.G.; Li, Y.S.; Ning, W. Analysis of rotor-rotor and stator-stator interferences in multi-stage turbomachines. ASME J. Turbomach. 2002, 124, 564–571. [Google Scholar] [CrossRef]
  17. Mileshin, V.; Druzhinin, Y.; Stepanov, A. Numerical and experimental investigations of clocking effect in a two-stage compressor with π c = 3.7 . In Proceedings of the ASME Turbo Expo 2015: Turbine Technical Conference and Exposition, Montreal, QC, Canada, 15–19 June 2015. [Google Scholar]
  18. Miserda, R.F.B.; Reckziegel, F.S.; Balduino, L.F. Direct noise computation of the rotor-rotor interaction modes in counter-rotating cascades. In Proceedings of the 25th AIAA/CEAS Aeroacoustics Conference, Delft, The Netherlands, 20–24 May 2019. [Google Scholar]
  19. Huang, X.Q.; Wang, D.X. Time-space spectral method for rotor-rotor/stator-stator interactions. ASME J. Turbomach. 2019, 141, 111006. [Google Scholar] [CrossRef]
  20. Smith, N.R.; Key, N.L. Unsteady vane boundary layer response to rotor-rotor interactions in a multistage compressor. J. Propulus. Power 2014, 30, 416–425. [Google Scholar] [CrossRef]
  21. Ernst, M.; Michel, A.; Jeschke, P. Analysis of rotor-stator-interaction and blade-to-blade measurements in a two stage axial flow compressor. ASME J. Turbomach. 2011, 133, 011027. [Google Scholar] [CrossRef]
  22. Zhao, J.; Lu, Q.; Yang, D.; Xiang, H. The mechanism analysis of rotor/rotor interference phenomenon within the multistage transonic compressor. Exp. Tech. 2022. [Google Scholar] [CrossRef]
  23. Spalart, P.; Allmaras, S. A one-equation turbulence model for aerodynamic flows. In Proceedings of the 30th Aerospace Sciences Meeting and Exhibit, Reno, NV, USA, 6–9 January 1992. [Google Scholar]
  24. Celik, I.B.; Ghia, U.; Roache, P.J.; Freitas, C.J. Procedure of estimation and reporting of uncertainty due to discretization in CFD applications. ASME J. Fluid Eng. 2008, 130, 078001. [Google Scholar]
  25. Denton, J.D.; Xu, L. The effect of lean and sweep on transonic fan performance. In Proceedings of the ASME Turbo Expo 2002: Power for Land, Sea, and Air, Amsterdam, The Netherlands, 3–6 June 2002. [Google Scholar]
  26. Day, I.J. Stall, Surge, and 75 years of research. ASME J. Turbomach. 2016, 138, 011001. [Google Scholar] [CrossRef]
Figure 1. The test rig of research.
Energies 15 02627 g001
Figure 2. Setup of experiment.
Energies 15 02627 g002
Figure 3. Details of grid meshing for the front two stages.
Energies 15 02627 g003
Figure 4. The comparison between the CFD and experiment.
Energies 15 02627 g004
Figure 5. The grid independence analysis.
Energies 15 02627 g005
Figure 6. The change in the spectrum of R2 pressure fluctuation near the design point, from experimental results.
Energies 15 02627 g006
Figure 7. The distribution of the pressure coefficient inside R2.
Energies 15 02627 g007
Figure 8. The propagation of the R1-1BPF disturbance within the R2 passage.
Energies 15 02627 g008
Figure 9. The propagation of the R1-2BPF disturbance within the R2 passage.
Energies 15 02627 g009
Figure 10. The distribution of the combination of R1-1BPF and R1-2BPF inside R2.
Energies 15 02627 g010
Figure 11. The distribution of the pressure coefficient inside the R1 passage, near the design point.
Energies 15 02627 g011
Figure 12. The pressure fluctuation of the blade sweep at the rear part of the R1 passage.
Energies 15 02627 g012
Figure 13. The entropy distribution within the R1 passage; unsteady CFD results.
Energies 15 02627 g013
Figure 14. The propagation of the R1 shock wave influence.
Energies 15 02627 g014
Figure 15. The comparison of the 1BPF disturbance of the R1 blade sweep between locations 1-13 and 2-6.
Energies 15 02627 g015
Figure 16. The comparison of the 2BPF disturbance of the R1 blade sweep between locations 1-13 and 2-6.
Energies 15 02627 g016
Figure 17. The distribution of the 1st harmonic of the R2 sweep disturbance.
Energies 15 02627 g017
Figure 18. The relative clocking positions between the R1 and R2 blades (referred to as the C1 clocking position); experimental results.
Energies 15 02627 g018
Figure 19. The effects of the relative position between the R1 and R2.
Energies 15 02627 g019
Figure 20. The comparison of the distribution of the R1 pressure coefficient between the near choke and design conditions.
Energies 15 02627 g020
Figure 21. The comparison of the pressure frequency spectrums between the near choke and design conditions inside R1.
Energies 15 02627 g021aEnergies 15 02627 g021b
Figure 22. The time-resolved fluctuation of the R1-2BPF disturbance at the rear part of the R1 passage near the choke condition.
Energies 15 02627 g022
Figure 23. Changes in the pressure frequency spectrum inside R2; near choke condition.
Energies 15 02627 g023
Figure 24. The distribution of the pressure coefficient inside R1, at the surge limit.
Energies 15 02627 g024
Figure 25. Changes in the pressure frequency spectrum inside R1, at the surge limit.
Energies 15 02627 g025
Figure 26. Changes in the pressure frequency spectrum inside R2, at the surge limit.
Energies 15 02627 g026
Table 1. The uncertainty of performance simulation.
Normalized Mass Flow RateUncertainty of Efficiency
(S0 + R1)
Uncertainty of Efficiency
(S1 + R2)
Uncertainty of Pressure Ratio
(S0 + R1)
Uncertainty of Pressure Ratio
(S1 + R2)
1.02920.002140.006570.0001950.000849
1.02770.0002780.0005130.000450.004562
1.02150.0002790.0002870.0002280.001374
1.01850.000280.0007520.0002680.004593
1.00770.000730.000290.0002470.004625
0.99540.0002820.000150.0018690.000845
0.98770.001180.0000650.0012350.004625
Publisher’s Note: MDPI stays neutral with regard to jurisdictional claims in published maps and institutional affiliations.

