
Wave Energy in the Pacific Island Countries: A New Integrative Conceptual Framework for Potential Challenges in Harnessing Wave Energy


Abstract
:1. Introduction
1.1. PESTEL
1.2. SWOT and the PESTEL-SWOT Approaches
1.3. Novelty and Objectives
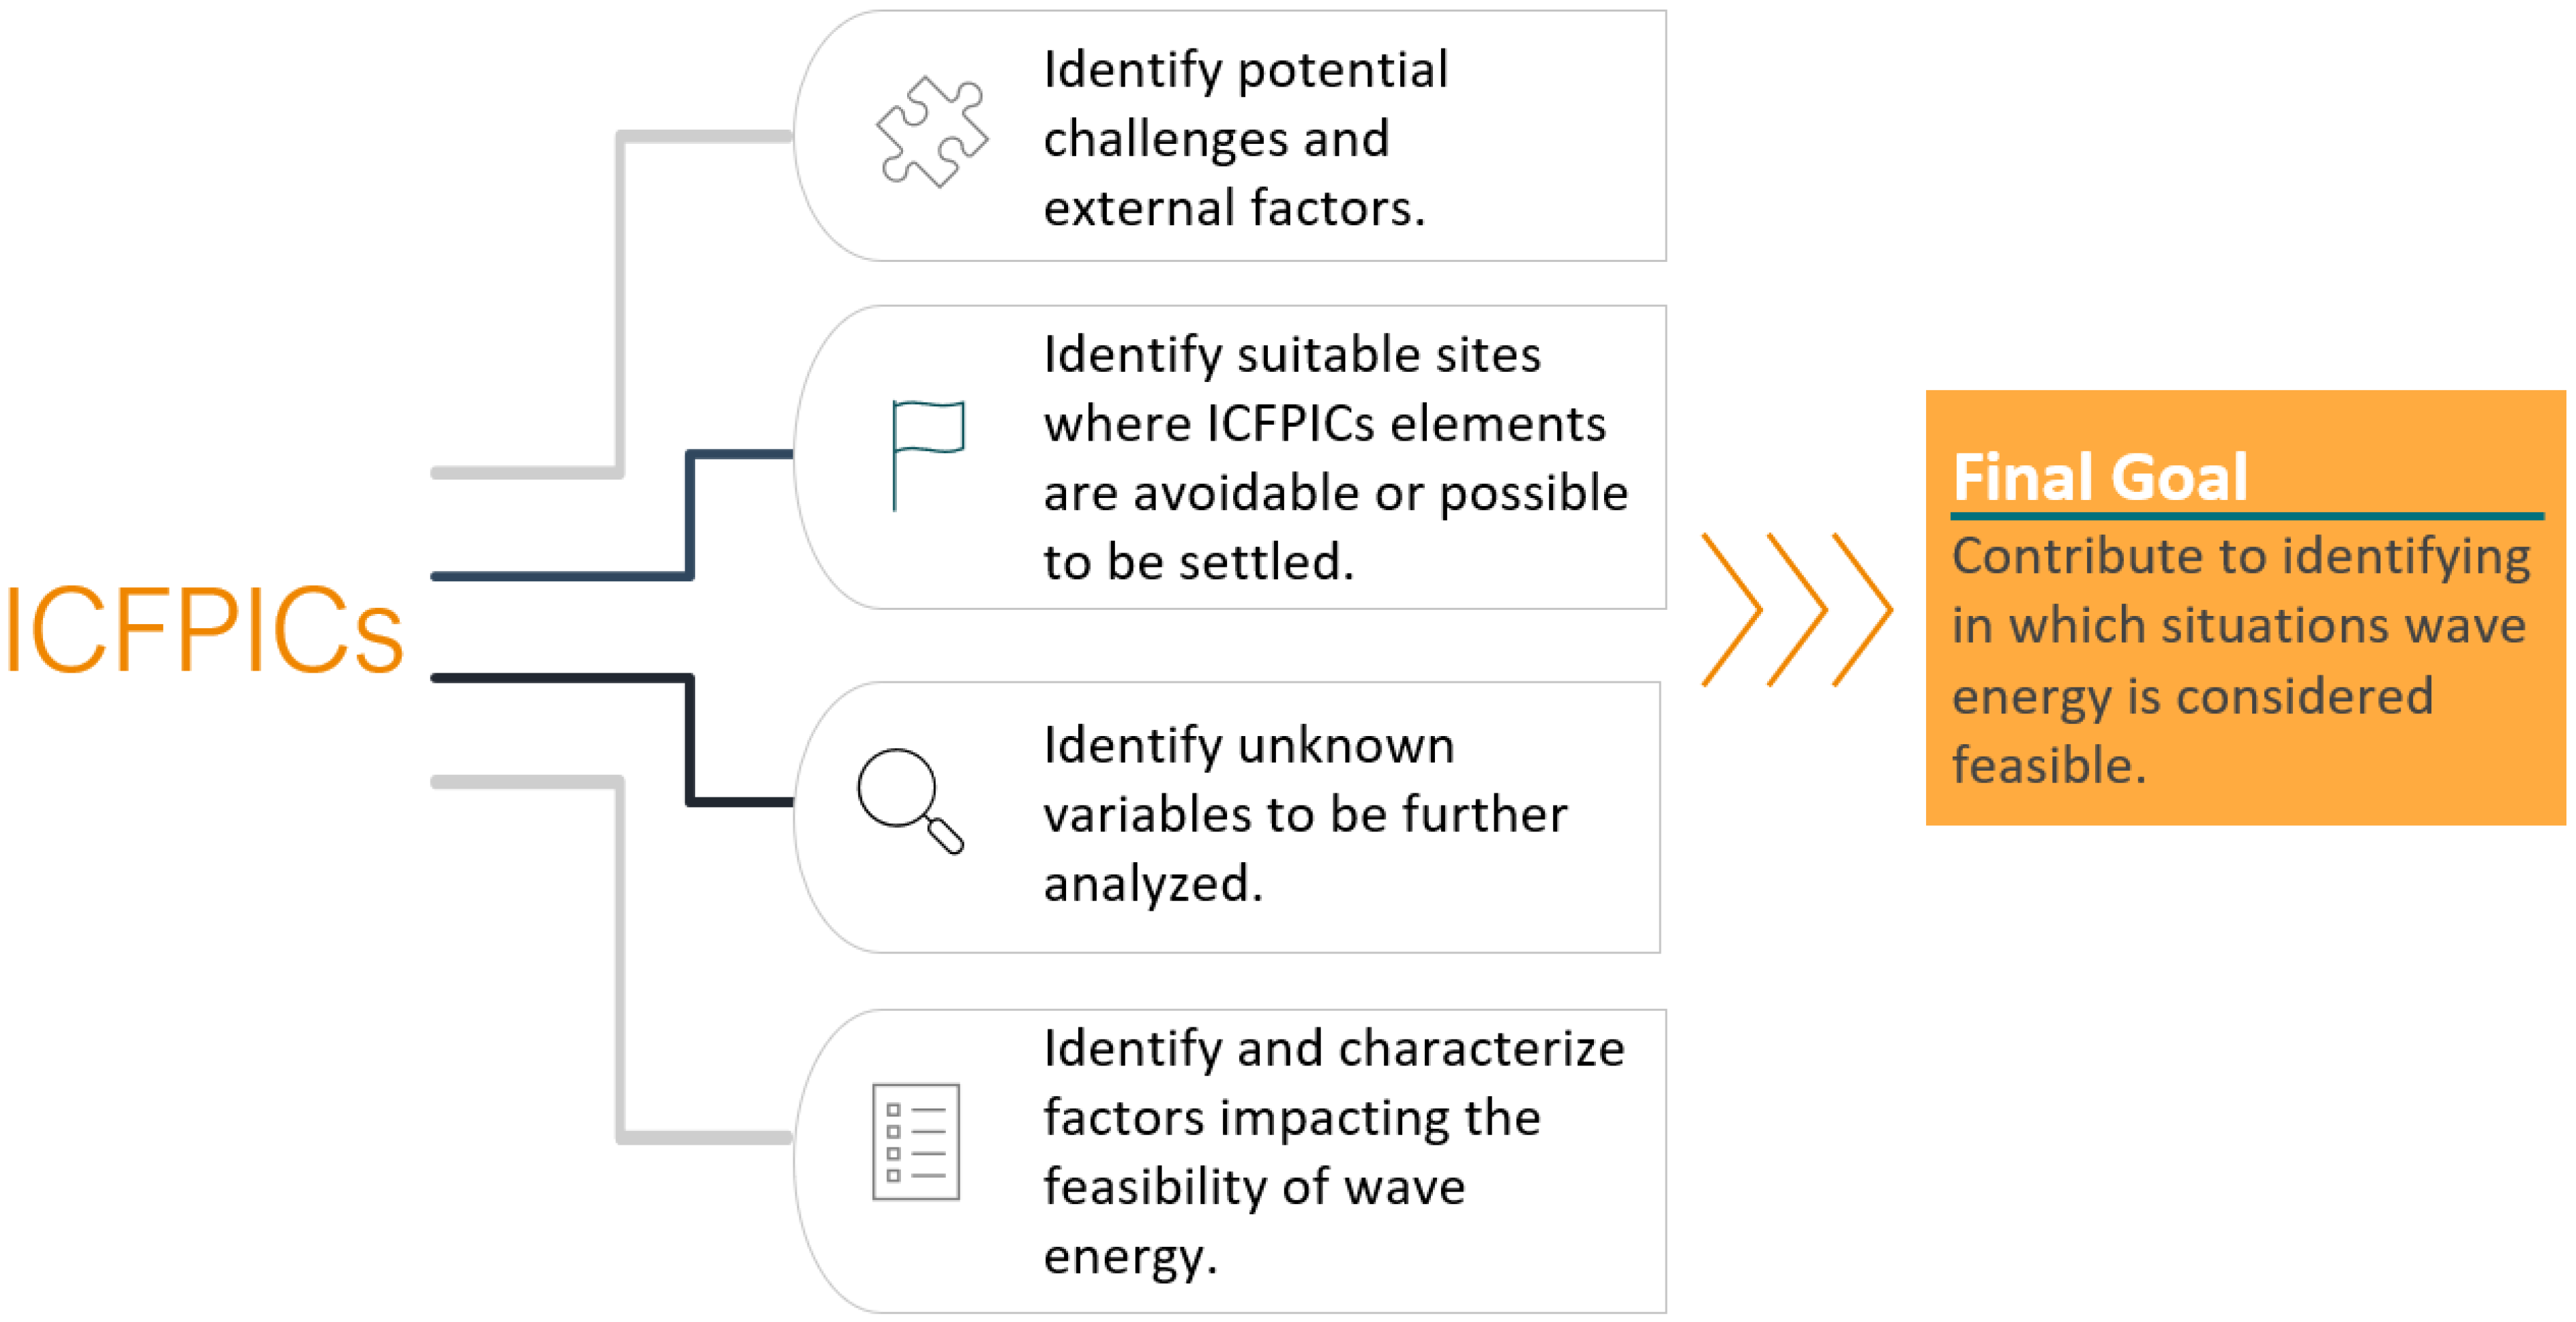
- Review the literature on wave energy harnessing and the Pacific Islands environment;
- Identify the potential challenges and important factors for wave energy in the Pacific;
- Structure the information found using the PESTEL approach by combining elements into the relevant clusters—the ICFPICs;
- Create a SWOT matrix using the identified factors from the ICFPICs as external factors.
2. Materials and Methods
2.1. Materials
2.1.1. Wave Energy Guidelines
2.1.2. Pacific Island Countries Reports
2.2. Methods
2.2.1. Integrated Conceptual Framework for the Pacific Island Countries
2.2.2. PESTEL-SWOT Combined Analysis
3. Results
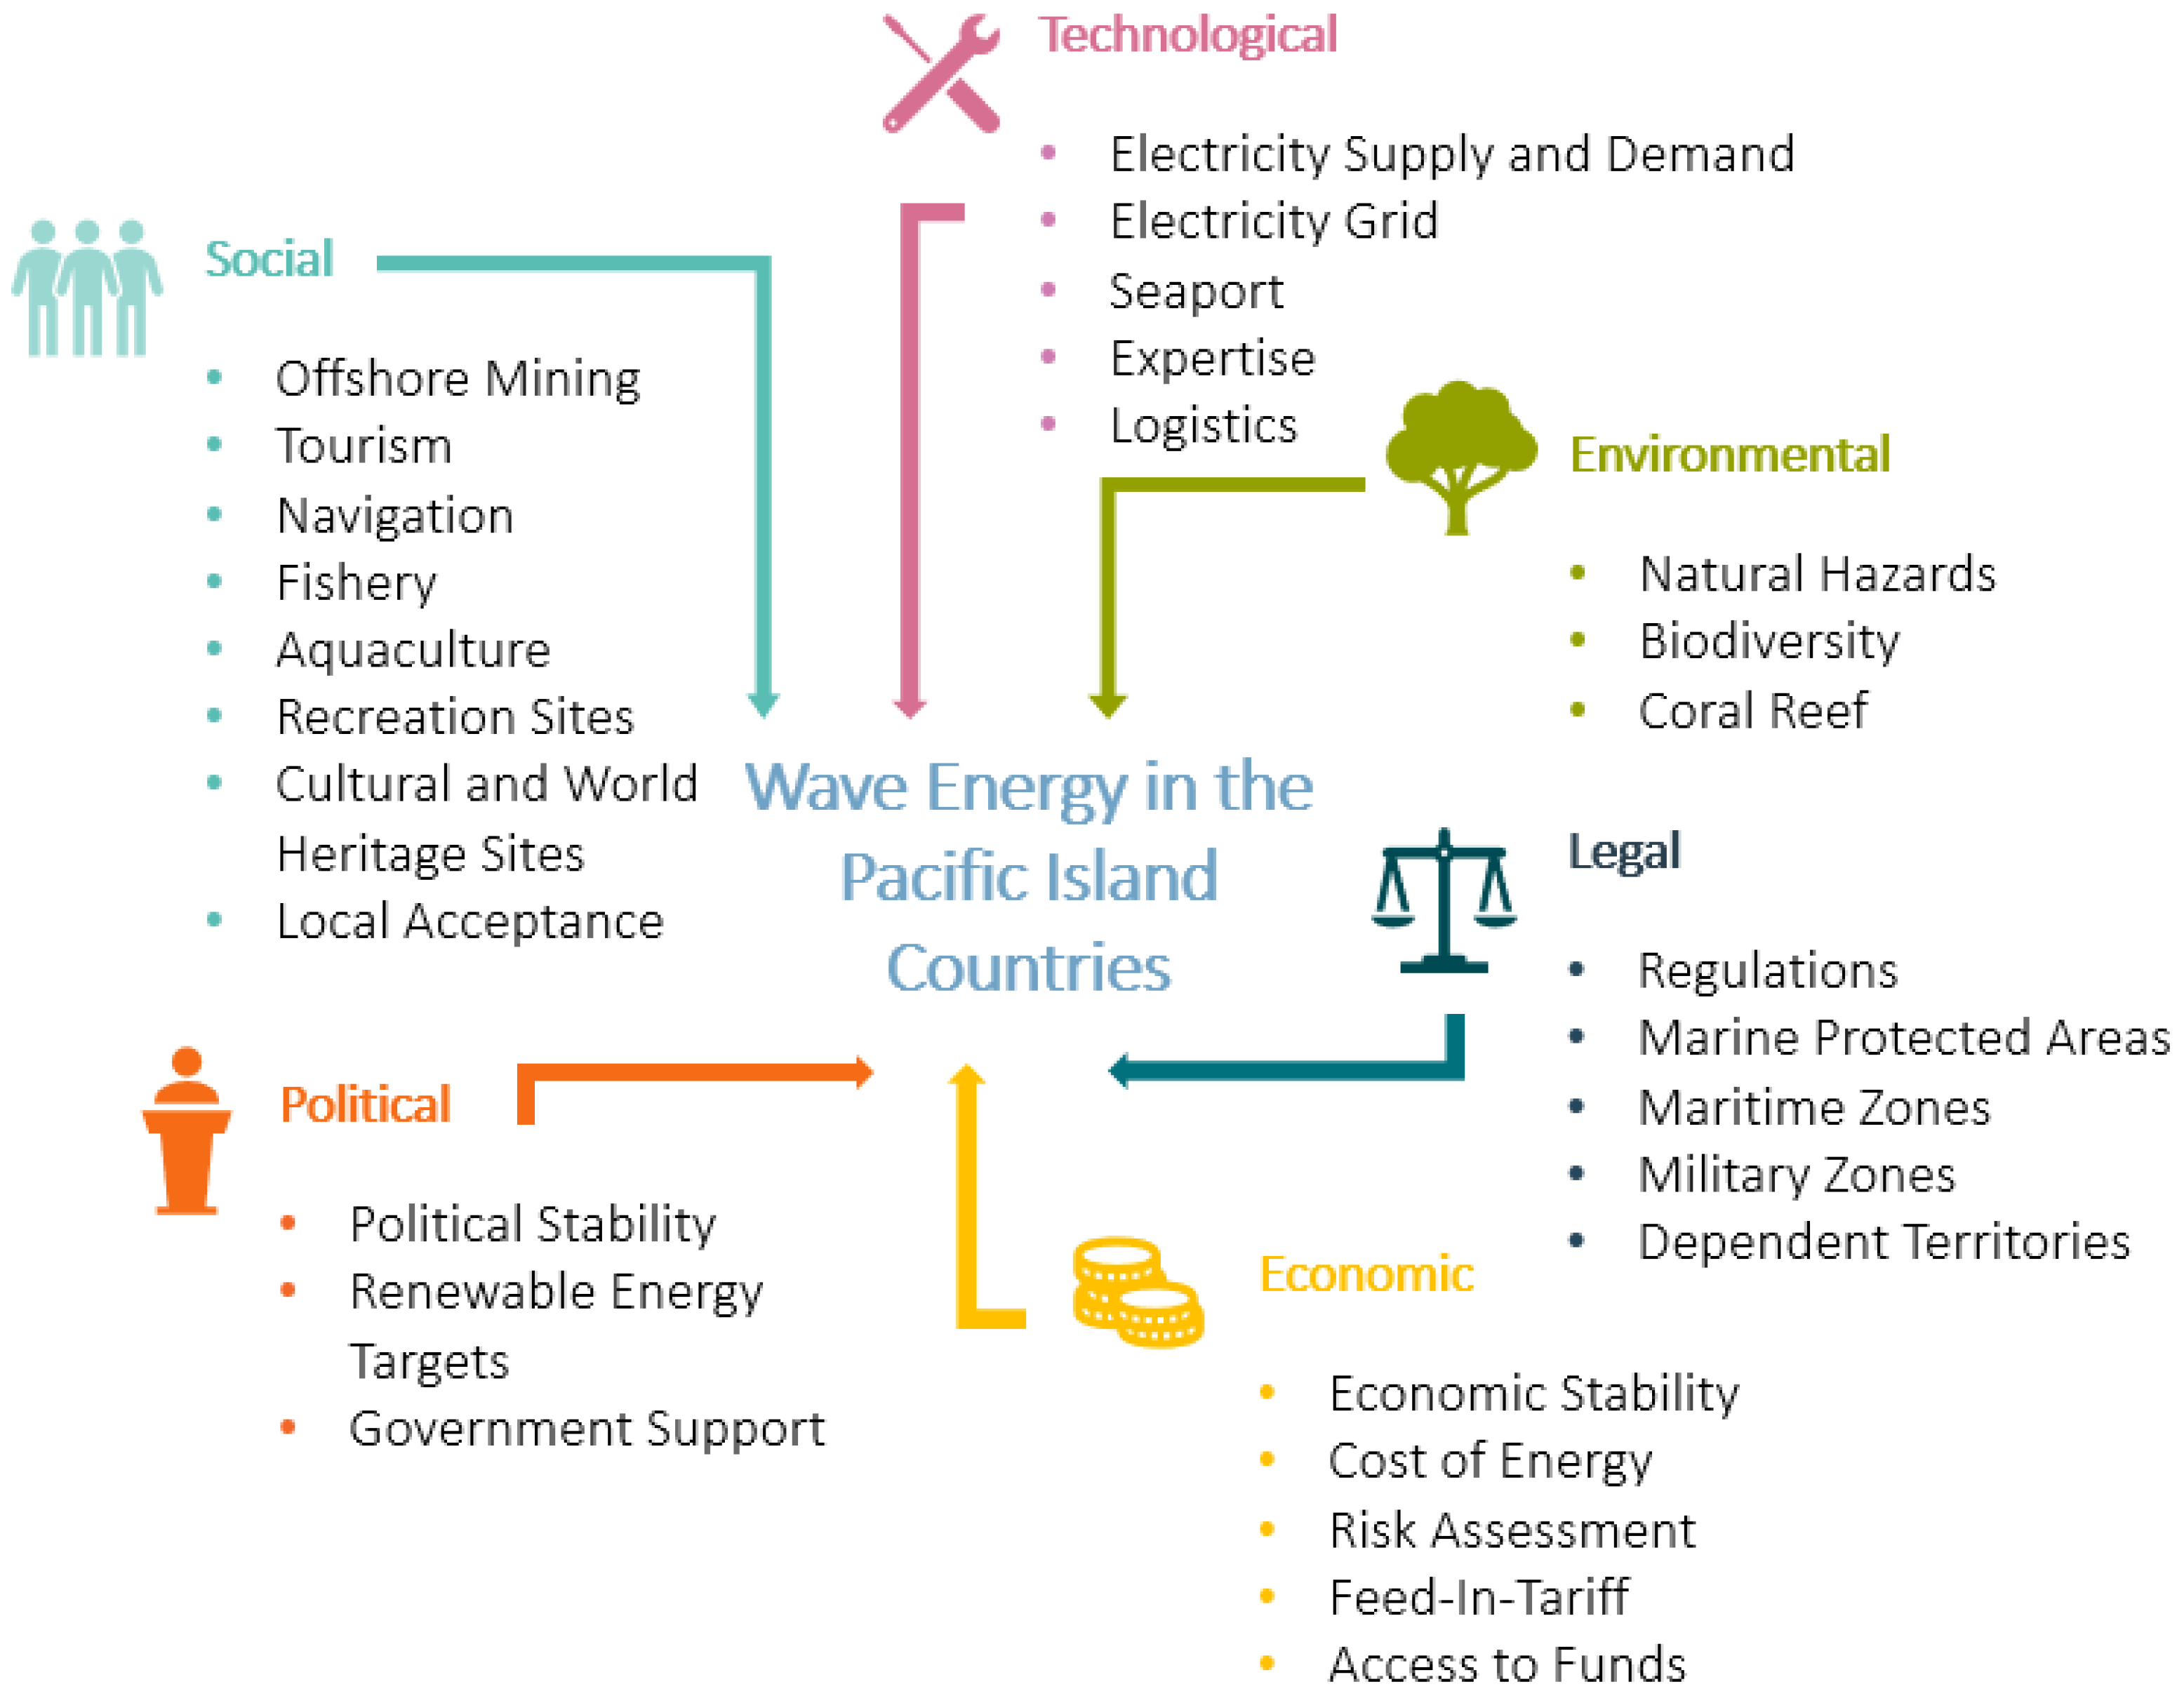
3.1. Integrative Conceptual Framework for the PICs (ICFPICs)
3.2. The Combined PESTEL-SWOT Analysis
4. Discussion
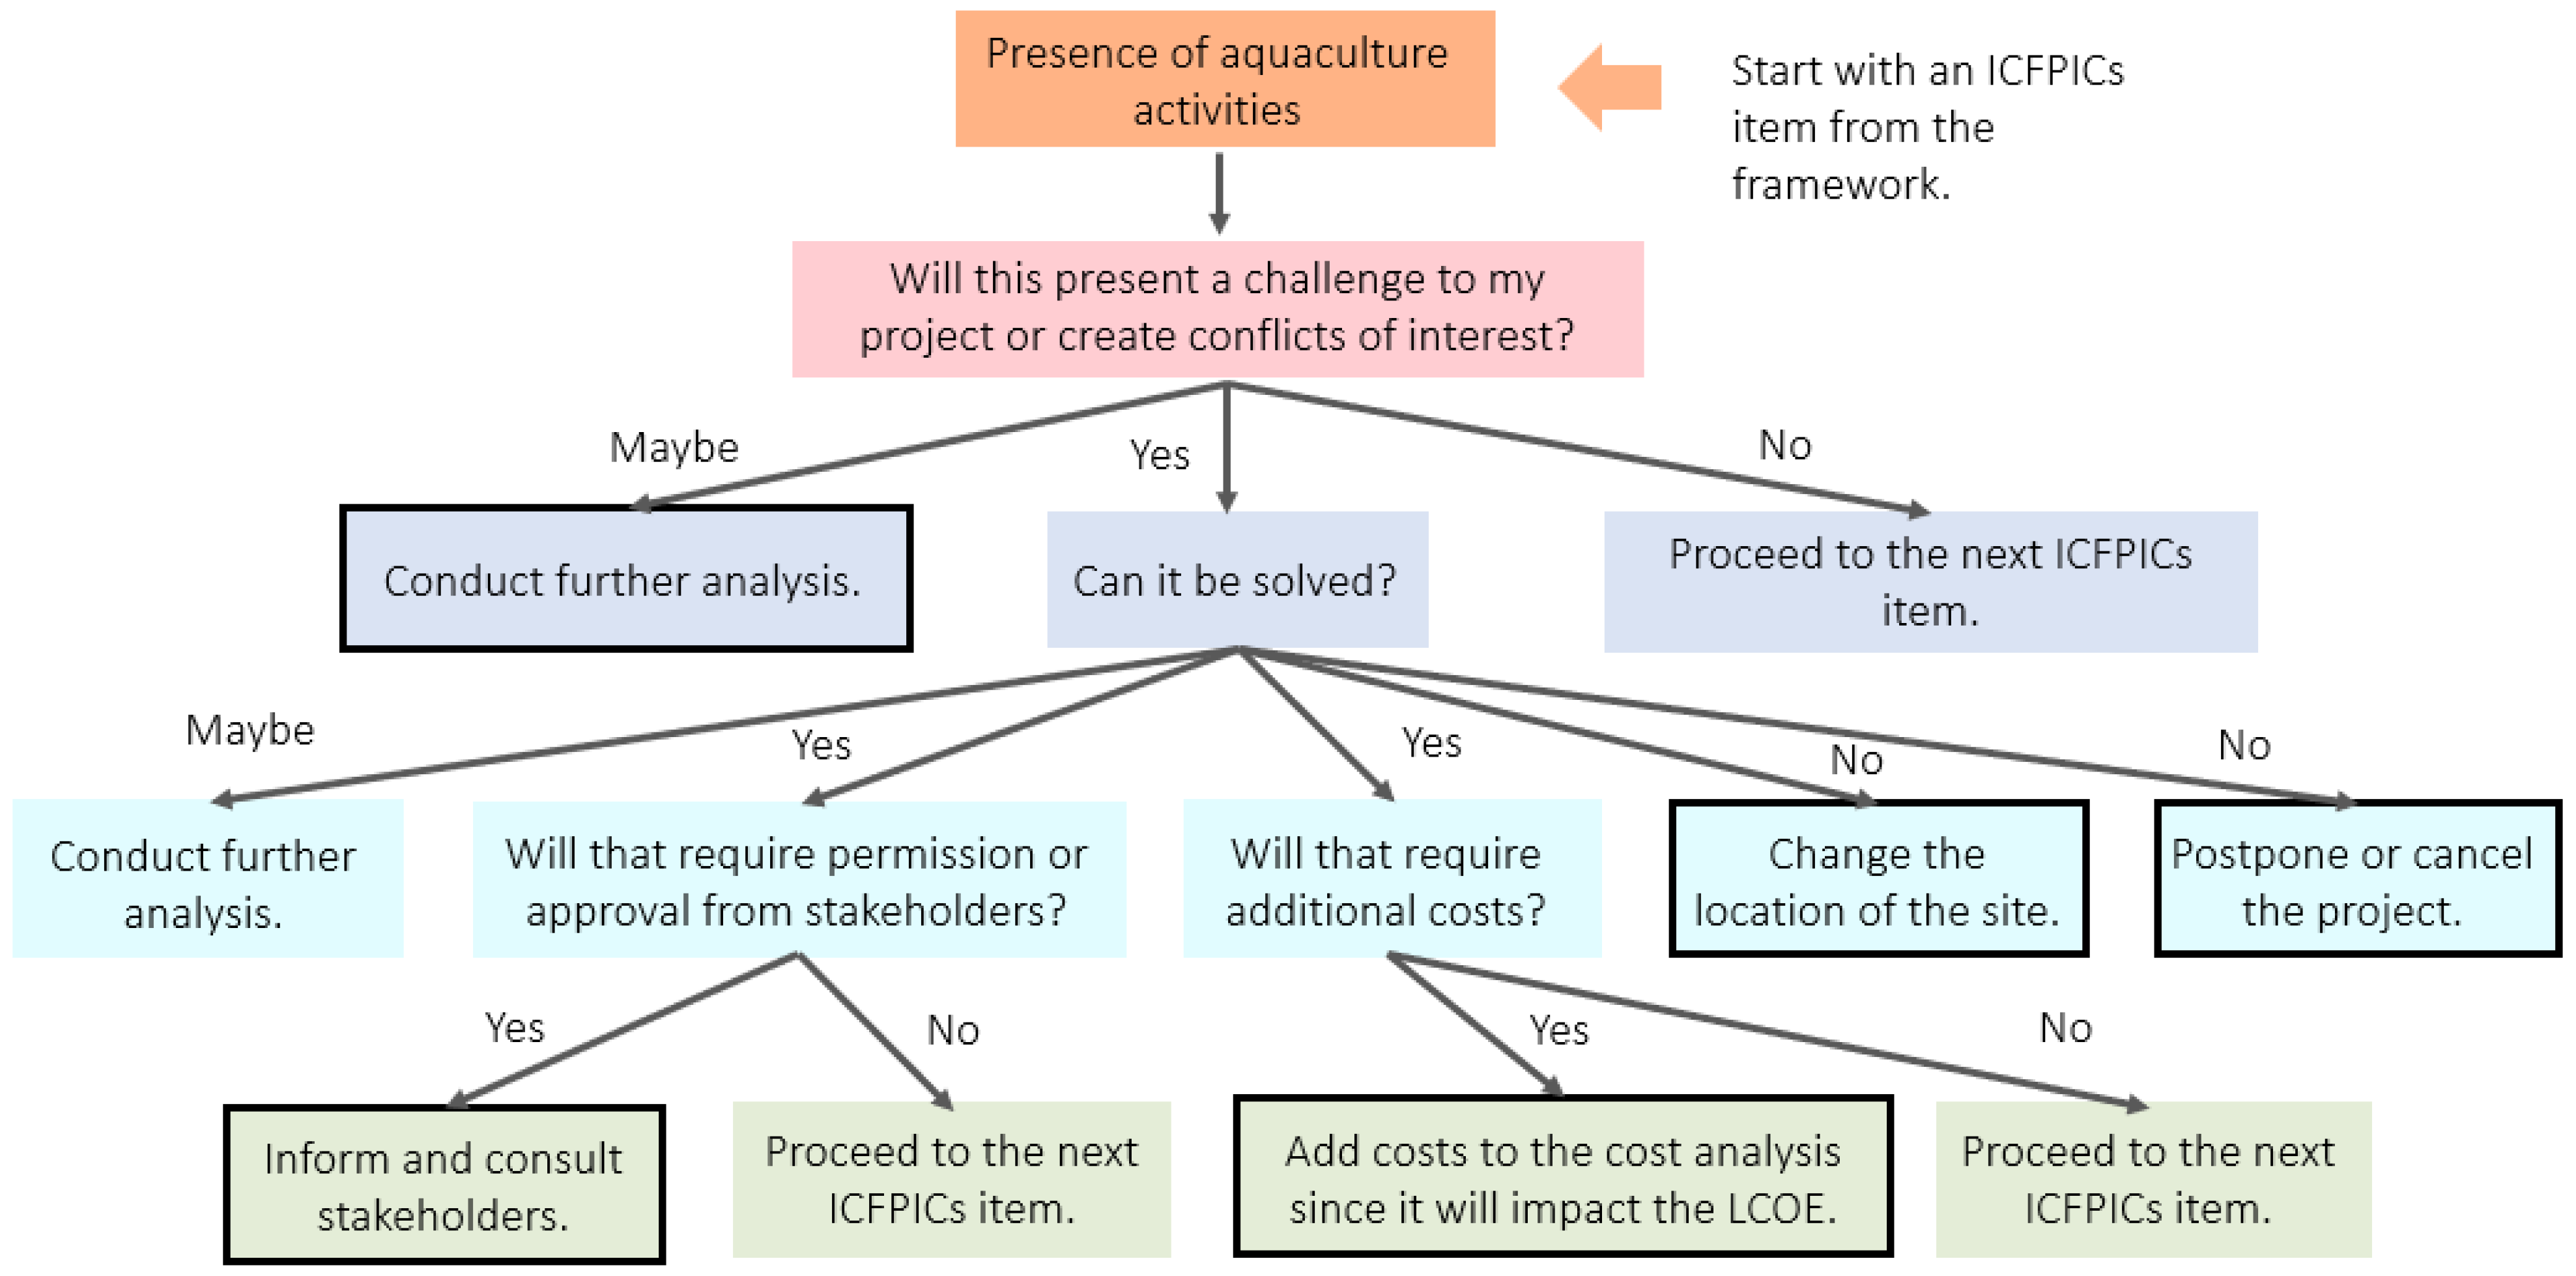
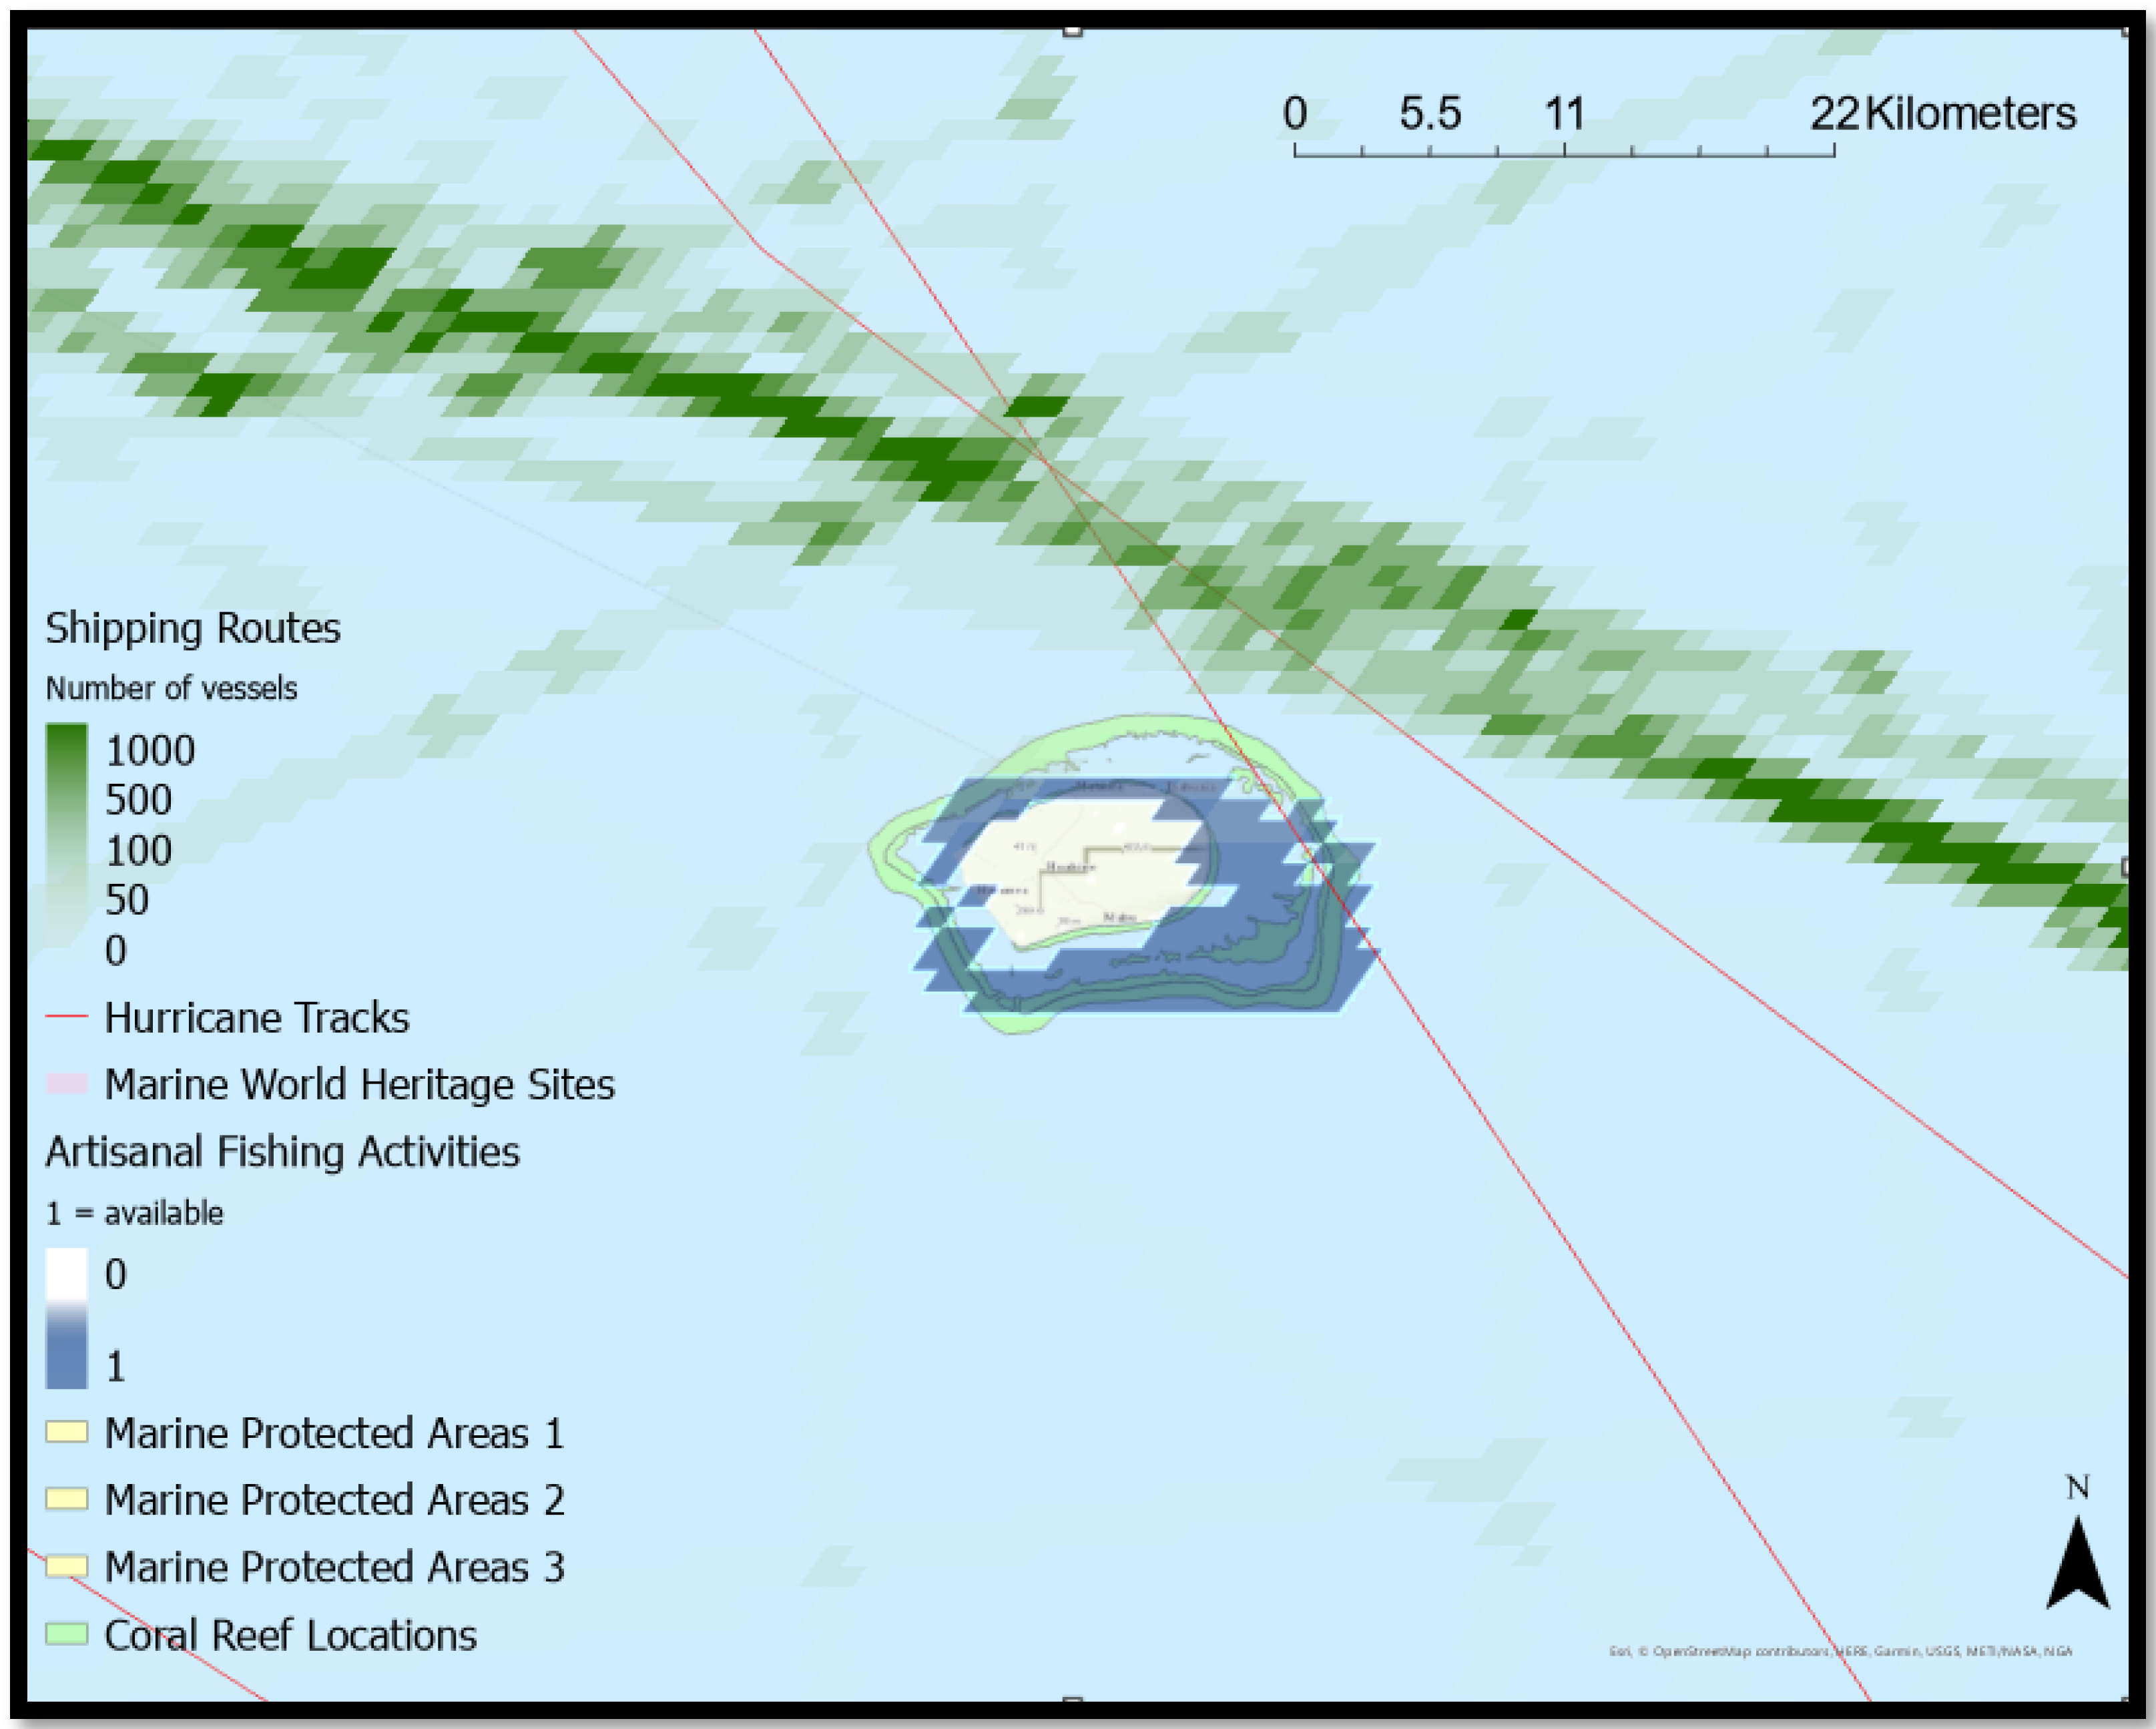
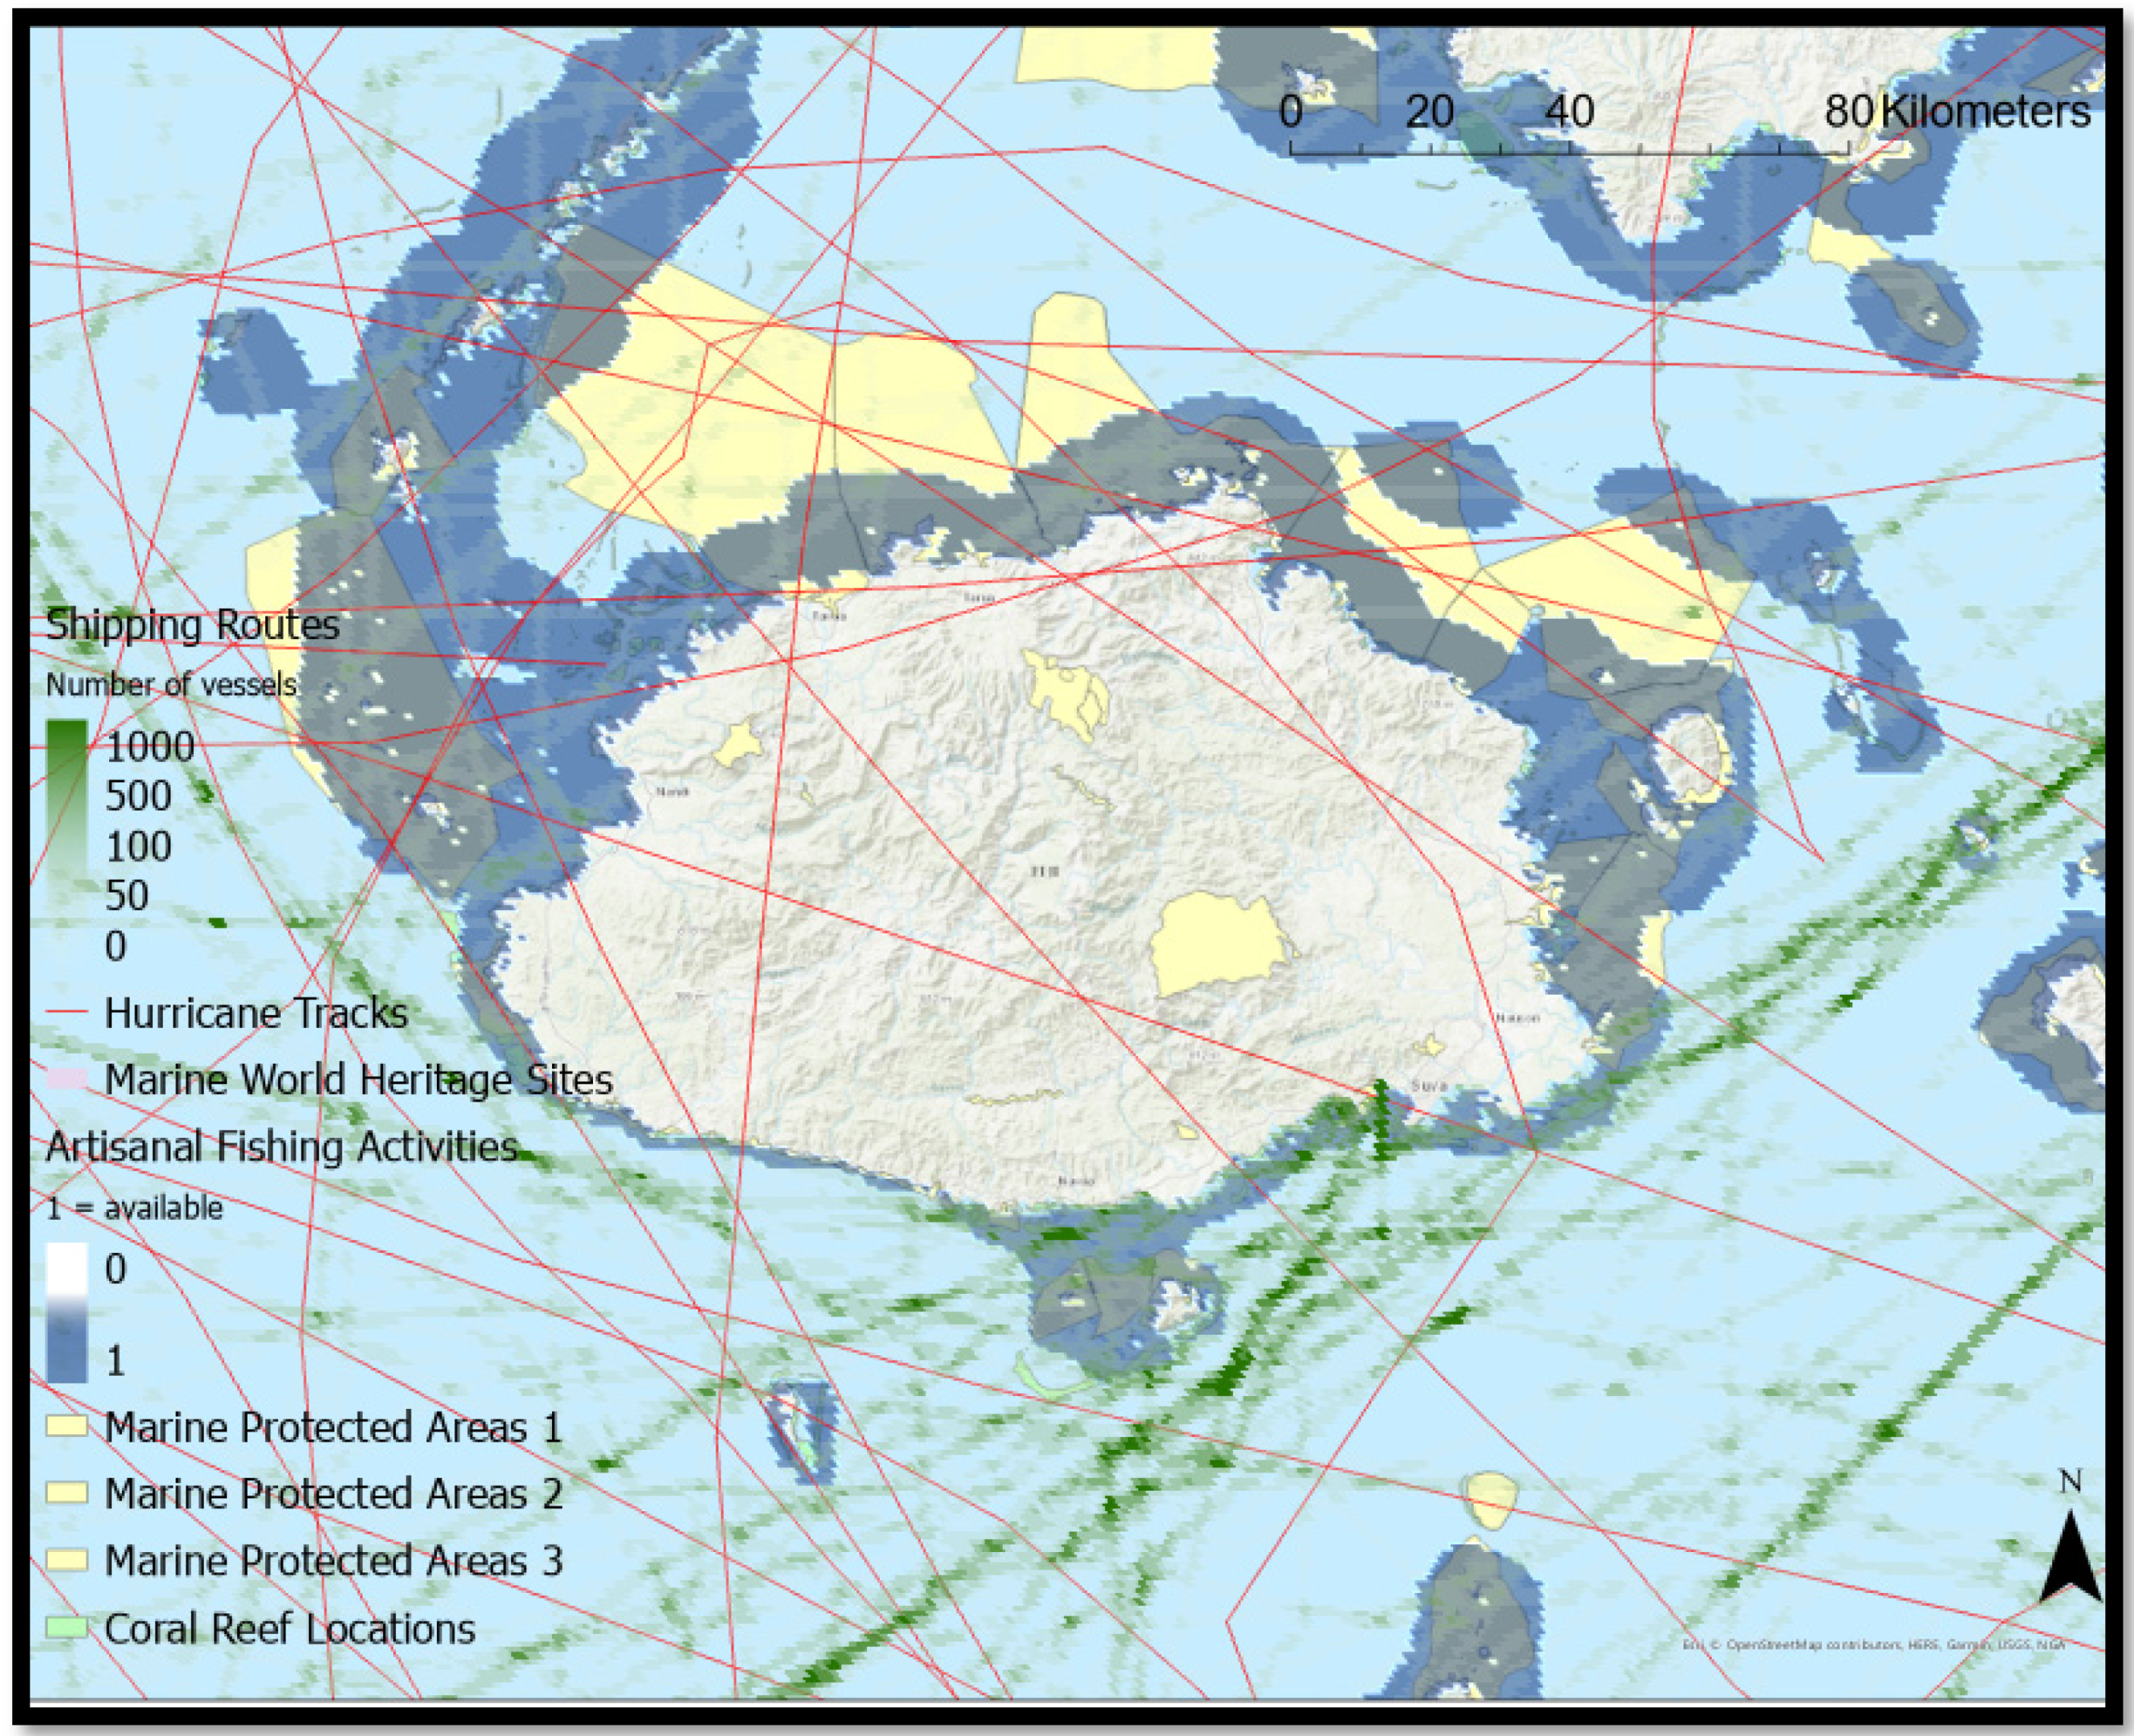
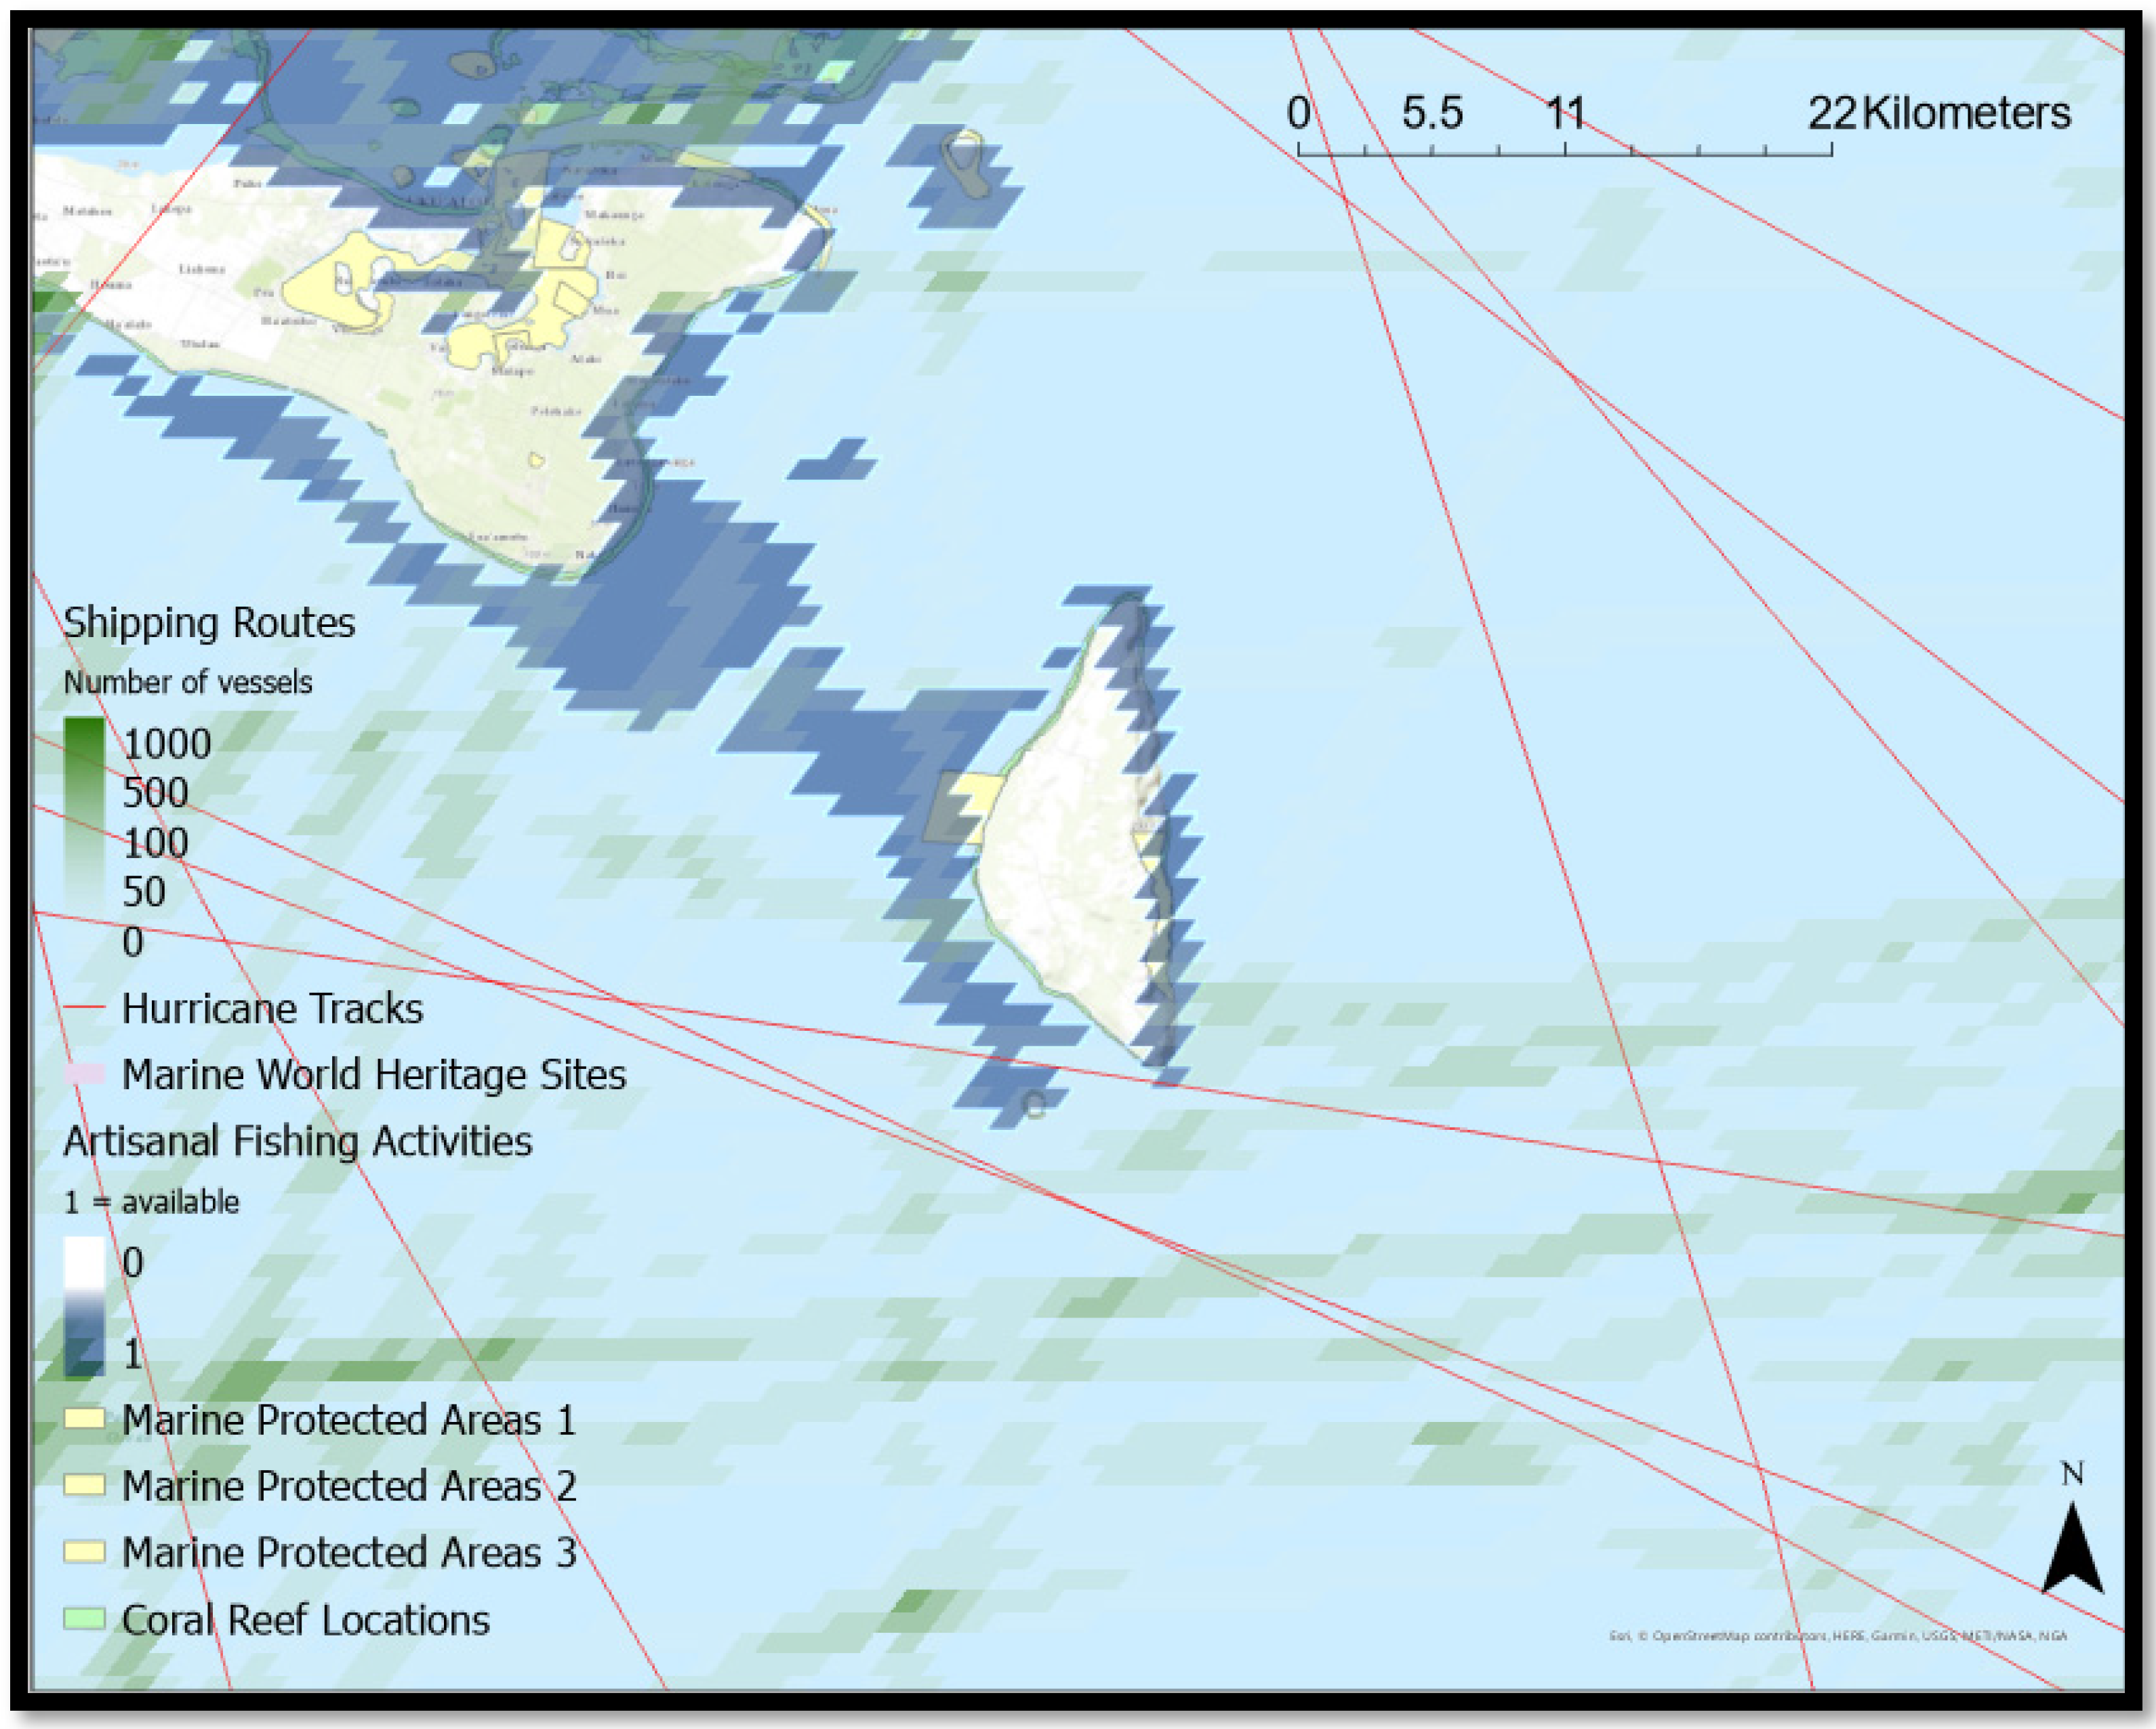
4.1. The ICFPICS Demonstrated for Four Case Studies
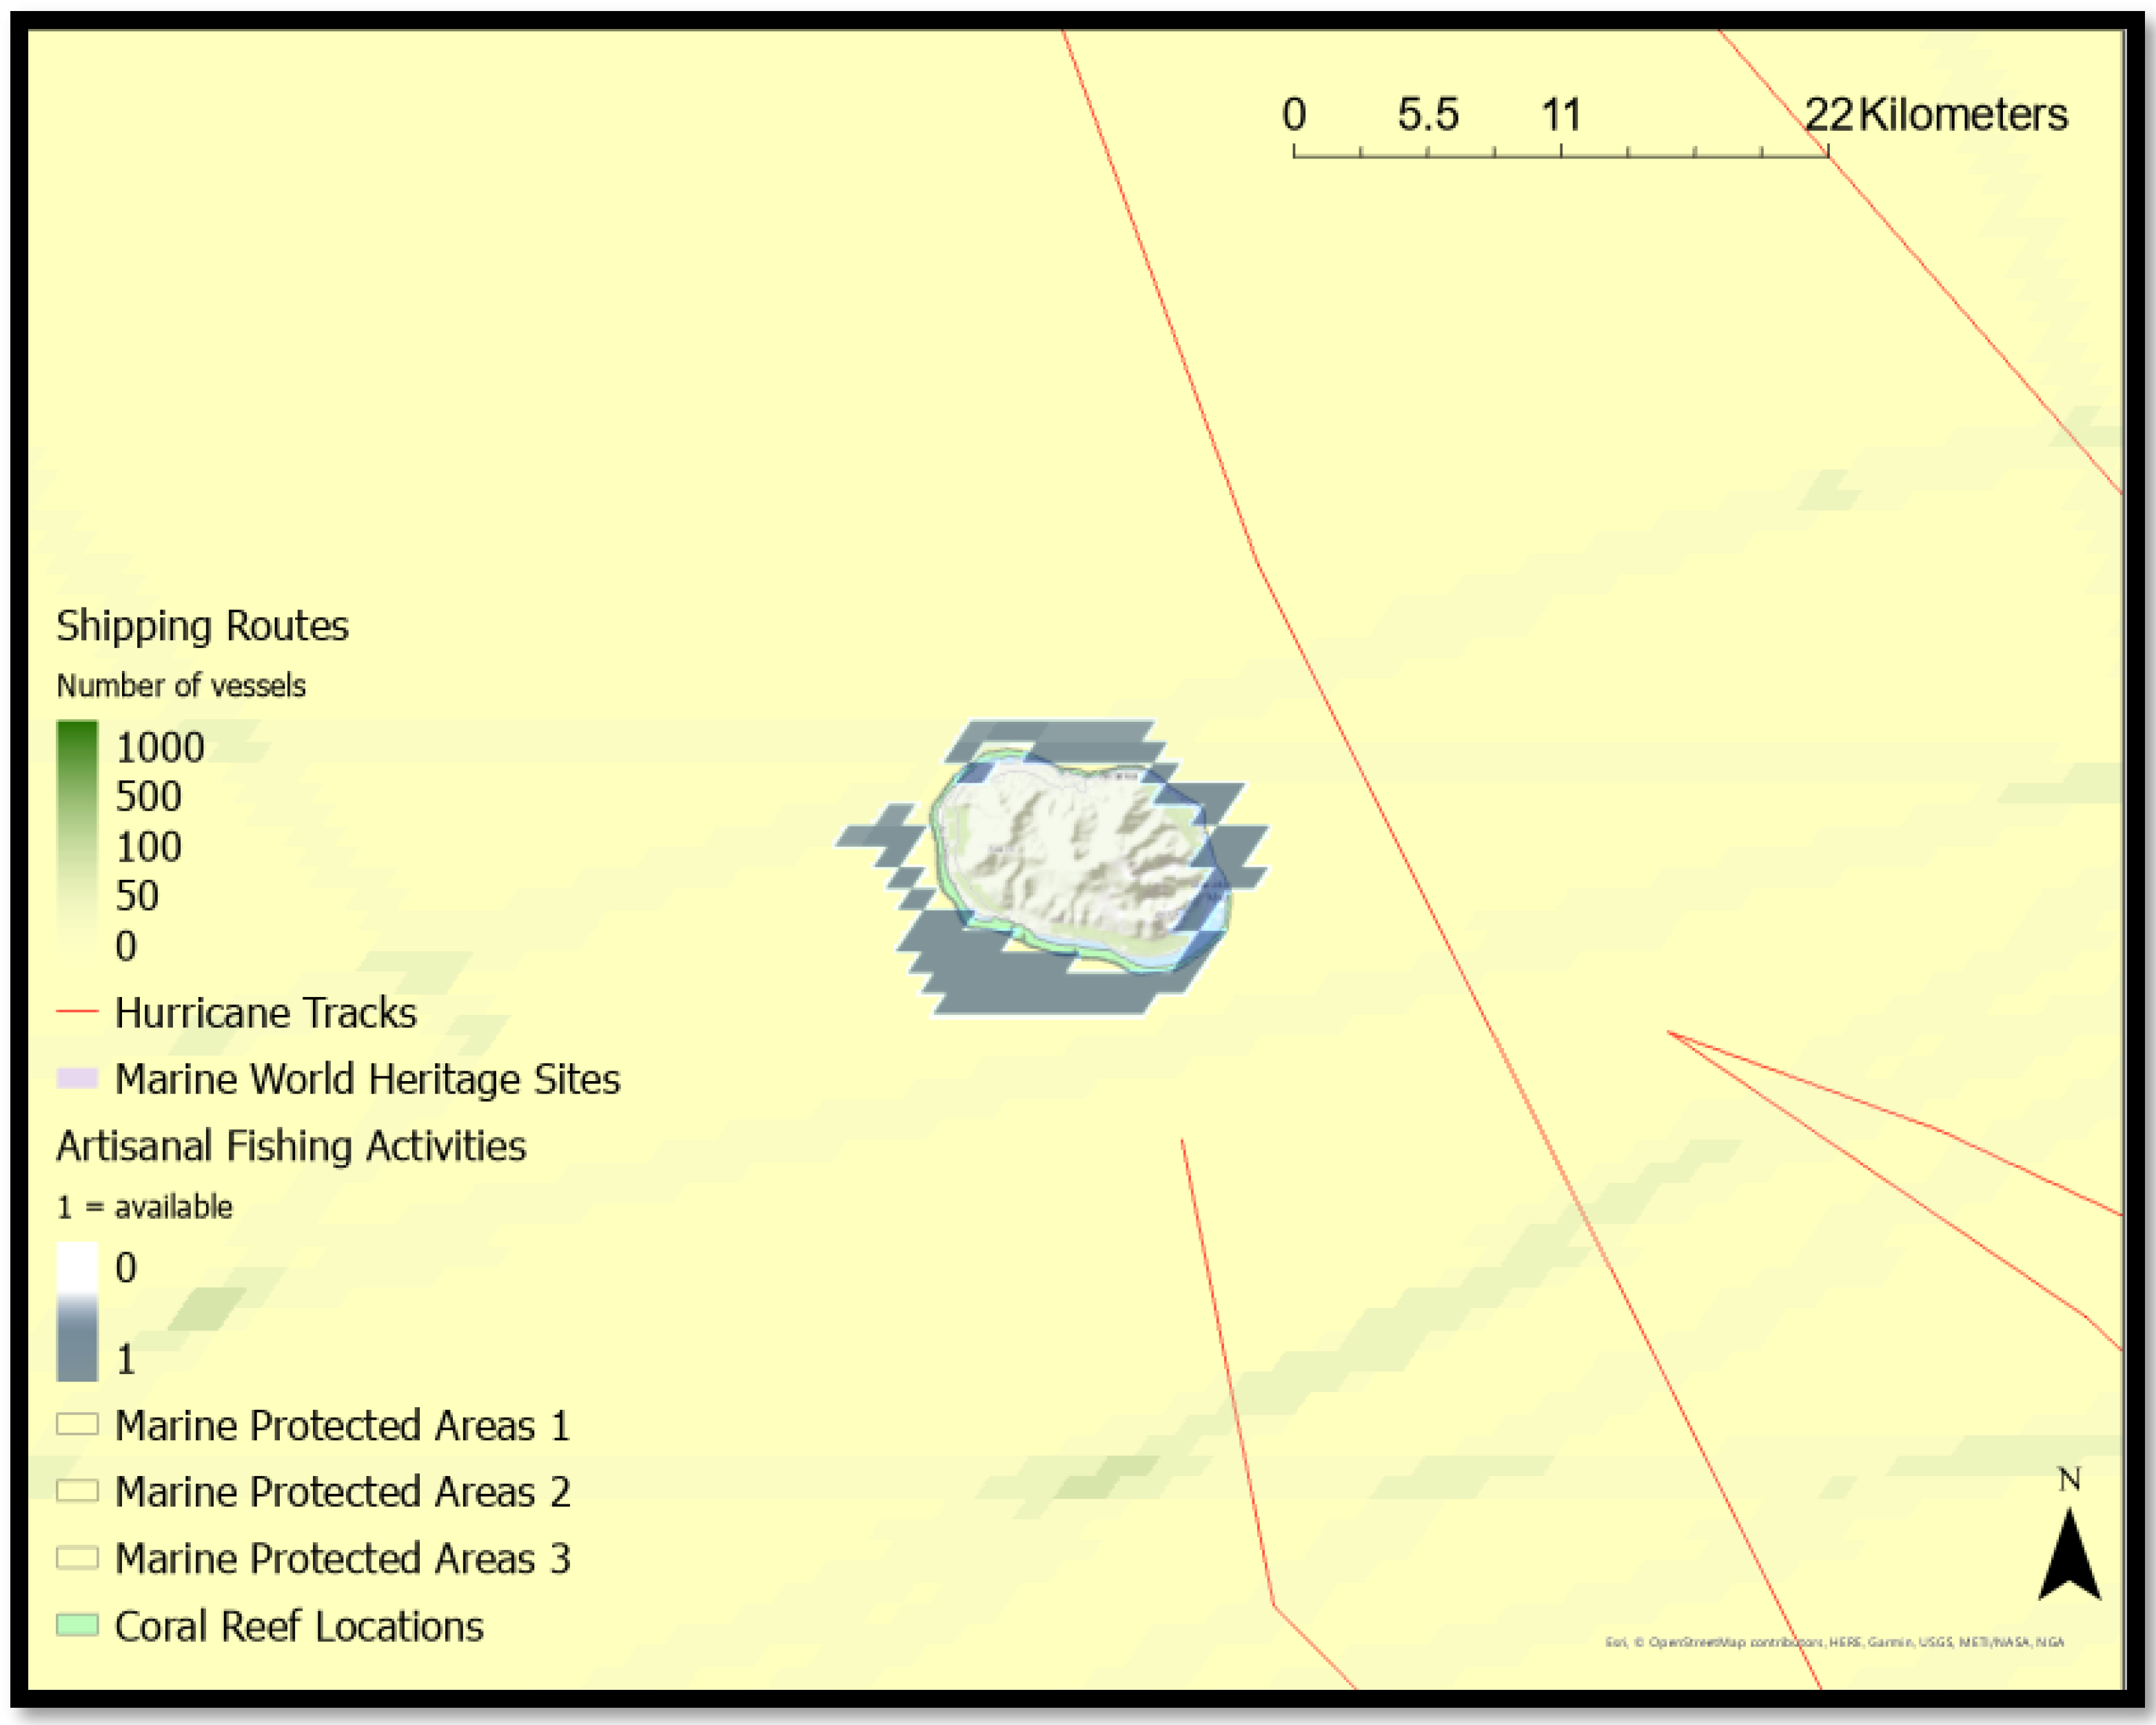
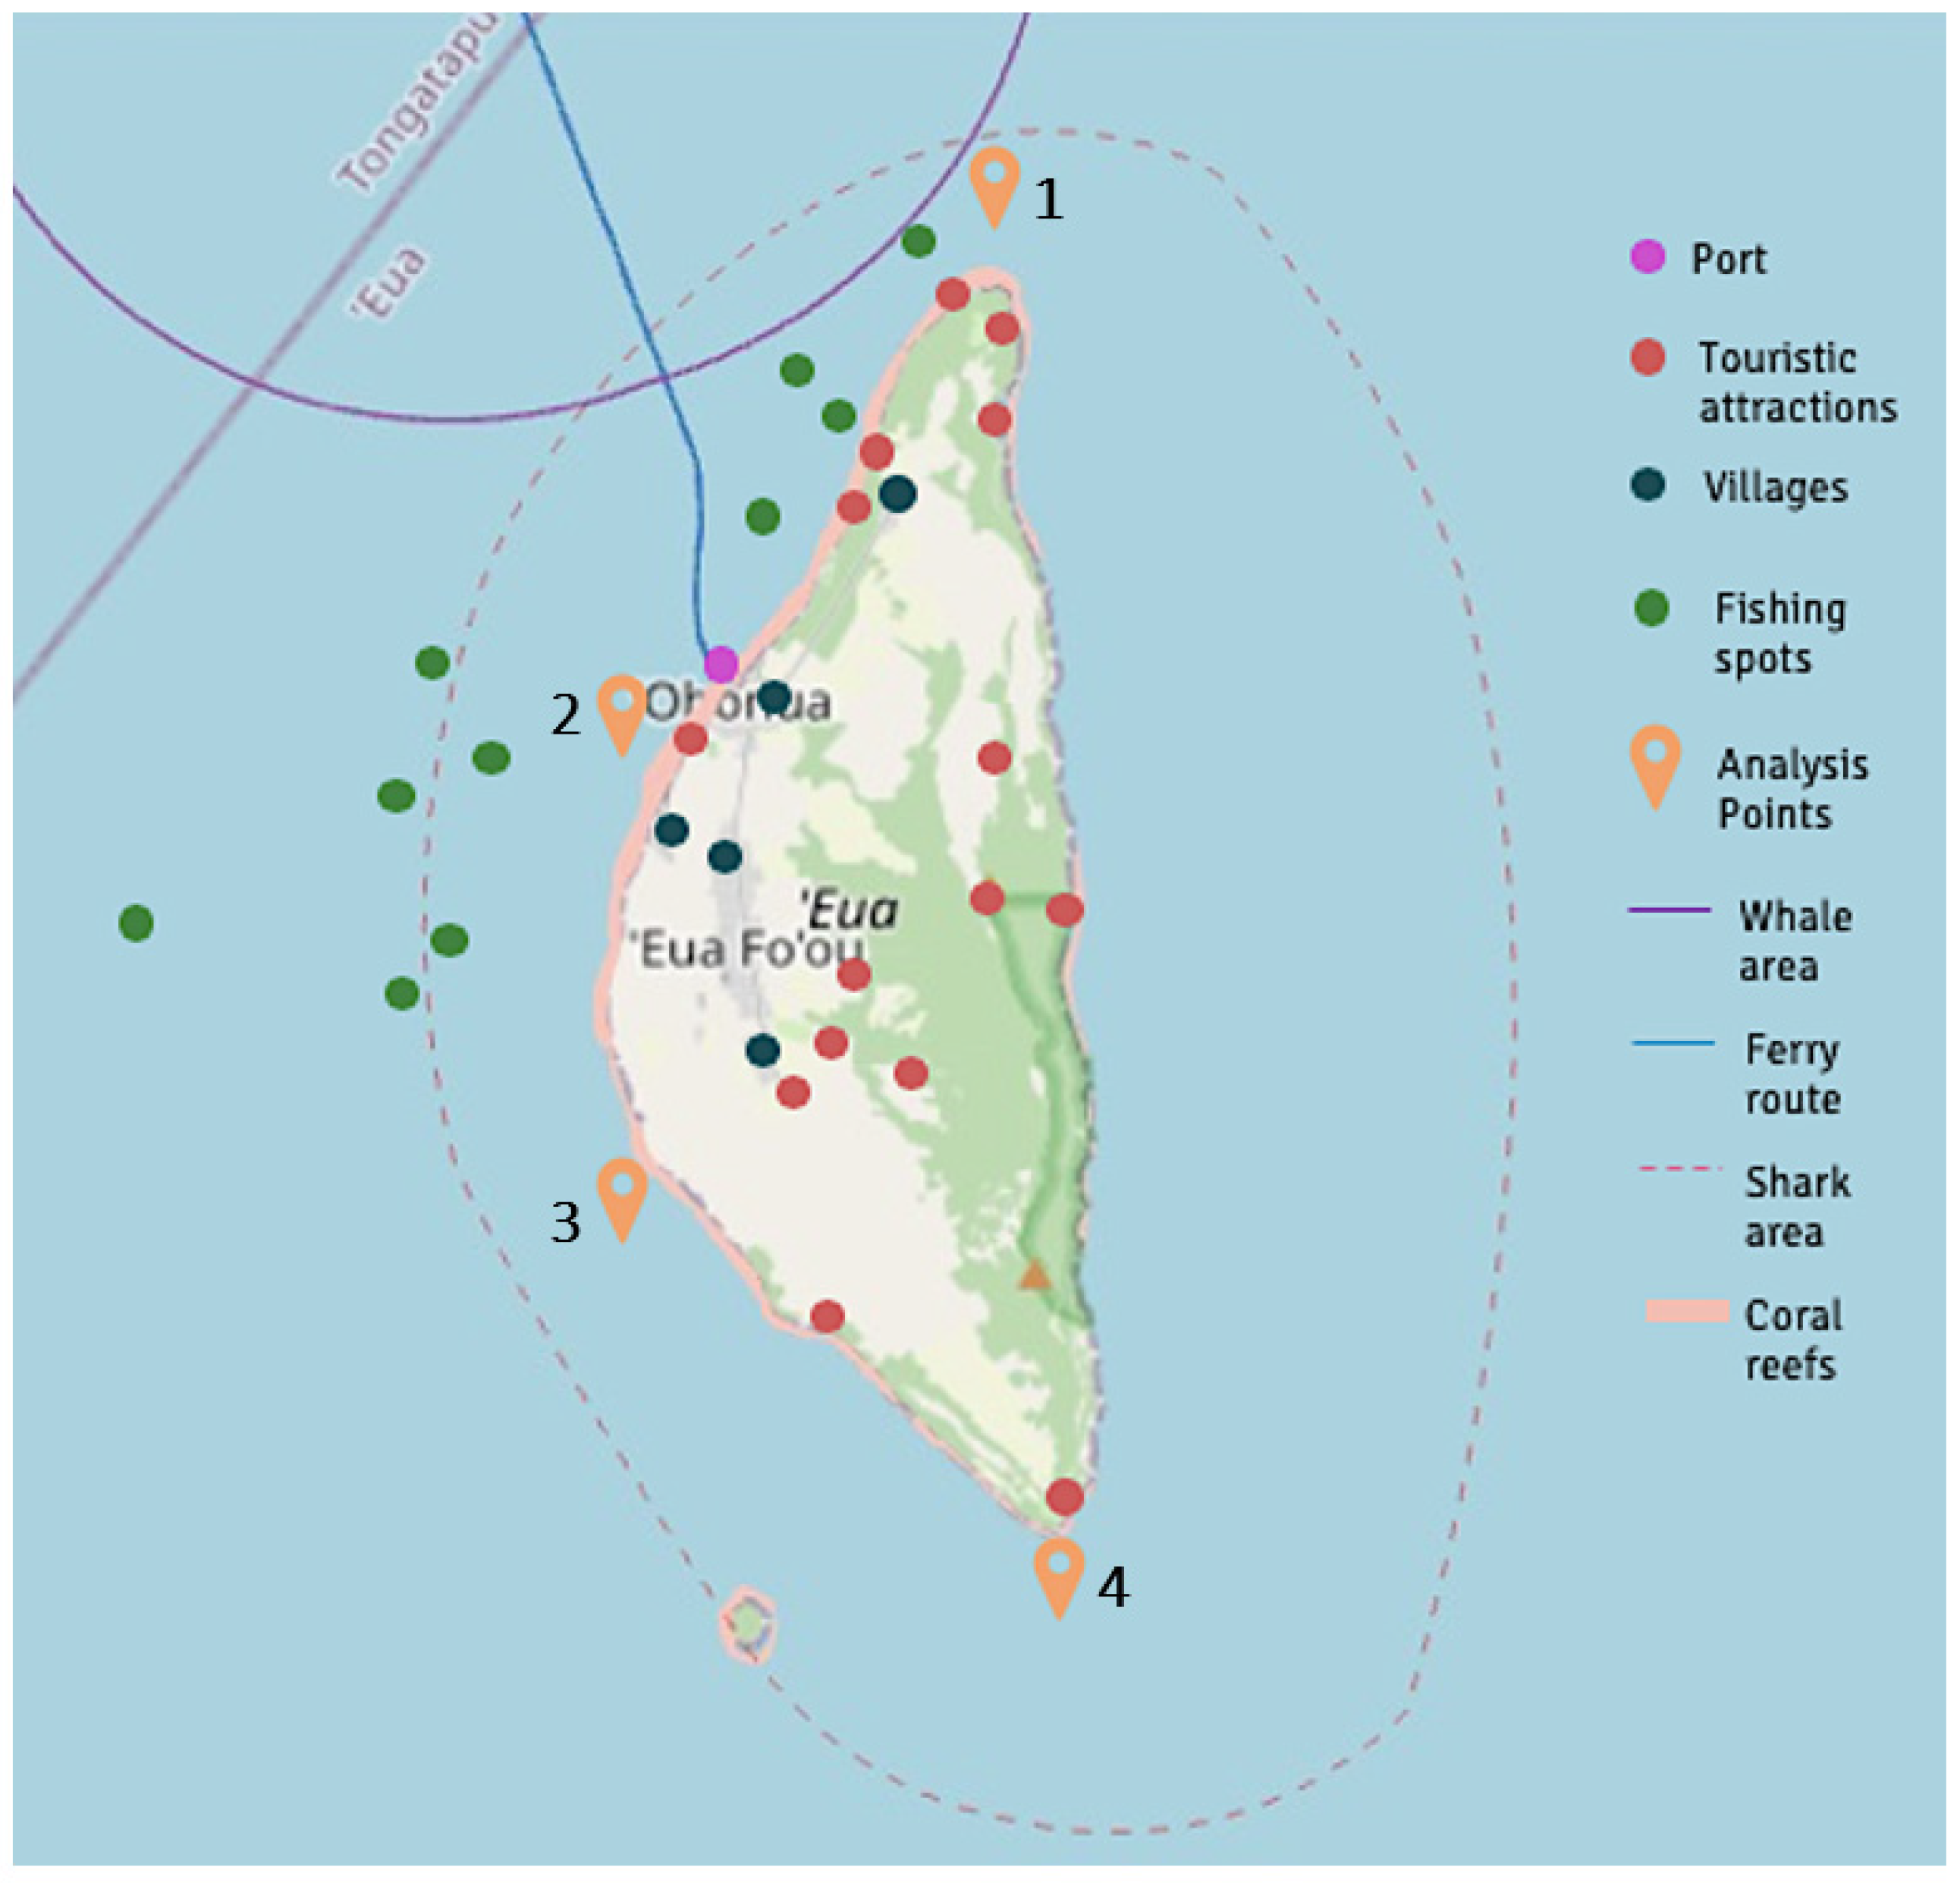
4.2. Further Analysis of ‘Eua Island
5. Conclusions
Author Contributions
Funding
Data Availability Statement
Acknowledgments
Conflicts of Interest
Appendix A
Appendix A.1. Potential Challenges
Appendix A.1.1. Political
Appendix A.1.2. Economic
Appendix A.1.3. Social
Appendix A.1.4. Technological
Appendix A.1.5. Environmental
Appendix A.1.6. Legal
References
- Barstow, S.F.; Falnes, J. Ocean Wave Energy in the South Pacific—The Resource and its Utilization; South Pacific Applied Geoscience Commission (SOPAC) in conjunction with the Government of Norway: Suva, Fiji, 1996. [Google Scholar]
- Bosserelle, C.; Reddy, S.; Kruger, J. Waves and Coasts in the Pacific: Cost Analysis of Wave Energy in the Pacific; Secretariat of the Pacific Community: Suva, Fiji, 2015. [Google Scholar]
- European Marine Energy Centre (EMEC). Guidelines for Project Development in the Marine Energy Industry; BSI: London, UK, 2009. [Google Scholar]
- Mendoza, E.; Lithgow, D.; Flores, P.; Felix, A.; Simas, T.; Silva, R. A framework to evaluate the environmental impact of OCEAN energy devices. Renew. Sustain. Energy Rev. 2019, 112, 440–449. [Google Scholar] [CrossRef]
- Aguilar, F.J. Scanning the Business Environment; Macmillan Publishers: New York, NY, USA, 1967. [Google Scholar]
- Yüksel, I. Developing a Multi-Criteria Decision Making Model for PESTEL Analysis. Int. J. Bus. Manag. 2012, 7, 52. [Google Scholar] [CrossRef] [Green Version]
- Sandberg, A.B.; Klementsen, E.; Muller, G.; de Andres, A.; Maillet, J. Critical Factors Influencing Viability of Wave Energy Converters in Off-Grid Luxury Resorts and Small Utilities. Sustainability 2016, 8, 1274. [Google Scholar] [CrossRef] [Green Version]
- Kolios, A.J.; Read, G. A political, economic, social, technology, legal and environmental (PESTLE) approach for risk identification of the tidal industry in the United Kingdom. Energies 2013, 6, 5023–5045. [Google Scholar] [CrossRef]
- Thompson, A.A.; Strickland, A.J.; Gamble, J.E. Crafting and Executing Strategy-Concepts and Cases, 15th ed.; McGrawHill/Irwin: New York, NY, USA, 2007. [Google Scholar]
- Gürel, E. Swot Analysis: A Theoretical Review. J. Int. Soc. Res. 2017, 10, 994–1006. [Google Scholar] [CrossRef]
- Weihrich, H. The TOWS matrix—A tool for situational analysis. Long Range Plan. 1982, 15, 54–66. [Google Scholar] [CrossRef]
- Stingheru, C.; Gasparotti, C.; Raileanu, A.; Rusu, E. A SWOT Analysis of the Marine Energy Sector at the European Level. Acta Univ. Danub. 2018, 14, 213–237. [Google Scholar]
- Damasceno, V.S.; Abreu, Y.V. Avaliação Da Energia Eólica No Brasil Utilizando a Análise SWOT e PESTEL. Interações 2018, 29, 503–514. [Google Scholar] [CrossRef] [Green Version]
- Shadman, S.; Chin, C.M.; Yap, E.H.; Sakundarini, N.; Velautham, S. The role of current and future renewable energy policies in fortifying Malaysia’s energy security: PESTLE and SWOT analysis through stakeholder engagement. Prog. Energy Environ. 2021, 16, 1–17. [Google Scholar]
- Islam, F.R.; Mamun, K.A. Possibilities and Challenges of Implementing Renewable Energy in the Light of PESTLE & SWOT Analyses for Island Countries. In Smart Energy Grid Design for Island Countries; Rabiul Islam, F.M., Al Mamun, K., Oo Amanullah, M.T., Eds.; Springer International Publishing: New York, NY, USA, 2017; pp. 1–19. [Google Scholar] [CrossRef]
- Davey, T.; Venugopal, V.; Smith, H.; Smith, G.; Lawrence, J.; Cavaleri, L.; Bertotti, L.; Prevosto, M.; Girard, F.; Holmes, B. Protocols for wave and tidal resource assessment (Report No. D2.7). Report by University of Southampton. Report for EquiMar, Southampton, England, 2010. Available online: https://www.wiki.ed.ac.uk/download/attachments/9142387/EquiMar+D2.7+Resource+Assessment+Protocol.pdf?version=1 (accessed on 4 July 2020).
- Stagonas, D.; Myers, L.E.; Bahaj, A.S. Impacts upon marine energy stakeholders (Report No. D5.8). Report by University of Southampton. Report for EquiMar, Southampton, England, 2011. Available online: https://www.wiki.ed.ac.uk/download/attachments/9142387/WP5_d5.8_final.pdf?version=1 (accessed on 4 July 2020).
- International Renewable Energy Agency (IRENA). Wave Energy Technology Brief; IRENA Ocean Energy Technology Brief 4: Abu Dhabi, United Arab Emirates, 2014; Available online: https://www.irena.org/-/media/Files/IRENA/Agency/Publication/2014/Wave-Energy_V4_web.pdf (accessed on 4 July 2020).
- International Renewable Energy Agency (IRENA). Renewable Energy Technology Innovation Policy: A Process Development Guide; IRENA: Abu Dhabi, United Arab Emirates, 2015. [Google Scholar]
- International Renewable Energy Agency (IRENA). A Path to Prosperity: Renewable Energy for Islands. Third Edition. In Proceedings of the 22nd session of the Conference of the Parties (COP 22) to the United Nations Framework Convention on Climate Change (UNFCCC), Marrakech, Morocco, 7–18 November 2016. [Google Scholar]
- International Renewable Energy Agency (IRENA). Renewable Energy Opportunities for Island Tourism; IRENA: Abu Dhabi, United Arab Emirates, 2014; Available online: www.irena.org (accessed on 15 August 2021).
- Sotta, C. Documentary summary of the environmental impact of renewable marine energy; Task 3,2 of the MERIFIC Project. Report prepared within the framework of the MERIFIC Project "Marine Energy in Far Peripheral Island Communities"; MERIFIC Marine Energy in Far Peripheral and Island Communities: Manche, France, 2012. [Google Scholar]
- Delvaux, P.A.G.; Rabuteau, Y.; Stanley, K. Civil Society Involvement and Social Acceptability of Marine Energy Projects: Best Practices of the Marine Energy Sector; Chapter 6.1.2; MERiFIC: Manche, France, 2013. [Google Scholar]
- Secretariat of the Pacific Regional Environment Programme (SPREP); SPREP: Apia, Samoa, 2019.
- Moritz, C.; Vii, J.; Lee Long, W.; Tamelander, J.; Thomassin, A.; Planes, S. Status and Trends of Coral Reefs of the Pacific; Global Coral Reef Monitoring Network; 2018. Available online: https://solomonislands-data.sprep.org/system/files/status-coral-reefs-pacific.pdf (accessed on 2 November 2021).
- Secretariat of the Pacific Regional Environment Programme (SPREP). Pacific Regional Energy Assessment 2004: An assessment of the Key Energy Issues, Barriers to the Development of Renewable Energy to Mitigate Climate Change, and Capacity Development Needs to Removing the Barriers; Wade, H., Johnston, P., Vos, J., Eds.; SPREP: Apia, Samoa, 2005. [Google Scholar]
- Commonwealth Marine Economics Programme (CMEP). Pacific Marine Climate Change Report Card 2018; CMEP: Washington DC, WA, USA, 2018; p. 12. [Google Scholar]
- Pacific Community (SPC). Pacific Community Results Report 2018; Pacific Community: New Caledonia, France, 2019. [Google Scholar]
- UNEP-WCMC and IUCN. Protected Planet: The World Database on Protected Areas (WDPA) and World Database on Other Effective Area-Based Conservation Measures (WD-OECM) [Online]; UNEP-WCMC and IUCN: Cambridge, UK, 2021; Available online: www.protectedplanet.net (accessed on 26 December 2021).
- Flanders Marine Institute. World Marine Heritage Sites (Version 1). 2013. Available online: https://www.marineregions.org/ (accessed on 3 November 2021).
- UNEP-WCMC, WorldFish Centre, WRI, TNC (2021). Global Distribution of Warm-Water Coral Reefs, Compiled from Multiple Sources including the Millennium Coral Reef Mapping Project. Version 4.1; Includes contributions from IMaRS-USF and IRD (2005), IMaRS-USF (2005) and Spalding et al. (2001); UN Environment World Conservation Monitoring Centre: Cambridge, UK, 2010. [Google Scholar] [CrossRef]
- NOAA’s International Best Track Archive for Climate Stewardship (IBTrACS) Data. Available online: https://www.ncei.noaa.gov/products/international-best-track-archive?name=ib-v4-access (accessed on 5 November 2021).
- Halpern, B.; Frazier, M.; Potapenko, J.; Casey, K.; Koenig, K.; Longo, C.; Lowndes, J.; Rockwood, C.; Selig, E.; Selkoe, K.; et al. Cumulative human impacts: Raw stressor data (2008 and 2013). Knowl. Netw. Biocomplex. 2015. [Google Scholar] [CrossRef]
- Institut De La Statistique De La Polynésie Française. Fiche Communale; Institut De La Statistique De La Polynésie Française: Papeete, French Polynesia, 2017. [Google Scholar]
- Petit, N.J.; Tanret, D.; Lagouy, E.; et Maxime Chan, P.D.P. Rāhui Nui nō Tuha’a Pae, Projet de grande réserve marine aux Iles Australes; The Pew charitable Trusts, FAPE: Tahiti, French Polynesia, 2016; 66p. [Google Scholar]
- Fiji Bureau of Statistics. 2017 Population and Housing Census; Fiji Bureau of Statistics: Suva, Fiji, 2018; p. 13.
- United Nations Educational, Scientific and Cultural Organization (UNESCO). Levuka Historical Port Town. Available online: https://whc.unesco.org/en/list/1399 (accessed on 14 April 2021).
- Ministry of Finance and Economic Management. Cook Islands Demographic Profile 2006–2011; Government of the Cook Islands, Ministry of Finance and Economic Management: Rarotonga, Cook Islands, 2011.
- Cook Islands Government. Marae Moana—Cook Islands Marine Park. United Nations, Ocean Conference, 2018. Available online: https://oceanconference.un.org/commitments/?id=15701 (accessed on 11 April 2021).
- Ministry of Fisheries. Personal Communication; Ministry of Fisheries: Nuku’alofa, Tonga, 2020. [Google Scholar]
- Ceccarelli, D.M.; Wendt, H.; Matoto, A.L.; Fonua, E.; Fernandes, L. Biophysically Special, Unique Marine Areas of Tonga; MACBIO: Suva, Fiji, 2017. [Google Scholar]
- Ministry of Tourism. Personal Communication; Ministry of Tourism: Nuku’alofa, Tonga, 2020. [Google Scholar]
- Firth, S. Instability in The Pacific Islands: A Status Report. Lowy Institute. 2018. Available online: https://www.lowyinstitute.org/publications/instability-pacific-islands-status-report (accessed on 30 June 2020).
- Tonga Statistics Department. Tonga 2016 Census of Population and Housing Volume 1: Basic Tables and Administrative Report; Tonga Statistics Department: Nuku’alofa, Tonga, 2017. [Google Scholar]
- Tonga Power Limited 1a. 2019. Annual Report 2019. Available online: www.tongapower.to (accessed on 23 May 2020).
- Tonga Meteorological Service. Facts About Natural Hazards in Tonga. Available online: http://www.met.gov.to/index_files/Disasterfacts.htm (accessed on 30 June 2020).
- Tonga Fisheries Division and Pacific Islands Forum Fisheries Agency. Kingdom Of Tonga National Plan of Action (NPOA) Shark-Plan (2014–2016); Department of Environment: Nuku’alofa, Tonga, 2013. [Google Scholar]
- Durrant, T.; Hemer, M.; Trenham, C.; Greenslade, D. CAWCR Wave Hindcast 1979–2010. CSIRO Serv. Collection 2013, 8. [Google Scholar] [CrossRef]
- Foresight Africa. Top Priorities for the Continent in 2016; Brookings Institute: Washington, WA, USA, 2017. [Google Scholar]
- International Electrotechnical Commission. IEC/FDIS 31010 Risk Management—Risk Assessment Techniques Gestion des Risques—Techniques D’évaluation des Risques (IEC/FDIS 31010:2009(E)); IEC: Geneva, Switzerland, 2009. [Google Scholar]
- International Renewable Energy Agency (IRENA). Unlocking Renewable Energy Investment: The Role of Risk Mitigation and Structured Finance; IRENA: Abu Dhabi, United Arab Emirates, 2016. [Google Scholar]
- Bruch, V.L. An Assessment of Research and Development Leadership in Ocean Energy Technologies; Sandia National Laboratories (SNL): Albuquerque, NM, USA, 1994. [Google Scholar] [CrossRef] [Green Version]
- Inniss, L.; Simcock, A.; Ajawin, A.Y.A.; Alcala, A.C.; Bernal, P.; Calumpong, H.P.; Araghi, P.E.; Green, S.O.; Harris, P.; Kamara, O.K.; et al. The First Global Integrated Marine Assessment World Ocean Assessment I; United Nations: Cambridge, England, 2016; Available online: www.un.org/Depts/los/woa (accessed on 18 June 2020).
- Chand, S. Managing natural resources in the Pacific Islands. In International and Development Economics Working Papers idec01-6; International and Development Economics: Suva, Fiji, 2001. [Google Scholar]
- Everett, H.; Simpson, D.; Wayne, S. Tourism as A Driver of Growth: A Pathway to Growth and Prosperity for Pacific Island Countries; Asian Development Bank: Mandaluyong, Philippines, 2018. [Google Scholar]
- Cascajo, R.; García, E.; Quiles, E.; Correcher, A.; Morant, F. Integration of Marine Wave Energy Converters into Seaports: A Case Study in the Port of Valencia. Energies 2019, 12, 787. [Google Scholar] [CrossRef] [Green Version]
- Gillett, R. Fisheries of the Pacific Islands: Regional and National Information; FAO Regional Office for Asia and the Pacific: Bangkok, Thailand, 2011; 279p. [Google Scholar]
- Adams, T.; Bell, J.; Labrosse, P. Current Status of Aquaculture in the Pacific Islands. In Proceedings of the Conference on Aquaculture in the Third Millennium, Bangkok, Thailand, 20–25 February 2000; pp. 295–305. [Google Scholar]
- Wingham, E.; Cooper, B. Our Pacific Heritage: The Future in Young Hands; New Zealand National Commission for the United Nations Educational, Scientific, and Cultural Organisation (UNESCO): Wellington, New Zealand, 2004. [Google Scholar]
- Simas, T.; Moura, A.; Batty, R.; Wilson, B.; Thompson, D.; Lonergan, M.; Norris, J. Uncertainties and Road Map (Report No. D6.3.2). Report by University of Southampton. Report for EquiMar, Southampton, England, 2010. Available online: https://www.wiki.ed.ac.uk/download/attachments/9142387/Equimar_D6-3-2.pdf?version=1 (accessed on 4 July 2020).
- Myers, L.; Bahaj, A.; Retzler, C.; Bittencourt, C.; Flinn, J.; Sorenson, H.; Gardner, F. Assessment of the present status and future scenarios of the supply chain for marine energy arrays (Report No. D5.7). Report by University of Southampton. Report for EquiMar, Southampton, England, 2011. Available online: https://www.wiki.ed.ac.uk/download/attachments/9142387/WP5+deliverable+5.7+_final.pdf?version=1 (accessed on 4 July 2020).
- Agarwal, A.; Venugopal, V.; Harrison, G.P. The assessment of extreme wave analysis methods applied to potential marine energy sites using numerical model data. Renew. Sustain. Energy Rev. 2013, 27, 244–257. [Google Scholar] [CrossRef] [Green Version]
- Frid, C.; Andonegi, E.; Depestele, J.; Judd, A.; Rihan, D.; Rogers, S.I.; Kenchington, E. The environmental interactions of tidal and wave energy generation devices. Environ. Impact Assess. Rev. 2012, 32, 133–139. [Google Scholar] [CrossRef]
- Kelleher, G.; Kenchington, R. Guidelines for Establishing Marine Protected Areas (pp.-U, p.79); A marine conservation and development report; IUCN: Gland, Switzerland, 1992. [Google Scholar]
- Goodall, B. Maritime zones. In Encyclopedia of Hydrology and Lakes; Springer: Dordrecht, The Netherlands, 1998. [Google Scholar]
- Lum, T.; Vaughn, B. The Pacific Islands. Congressional Research Service, IF11208 Version 1. 2019. Available online: https://fas.org/sgp/crs/row/IF11208.pdf (accessed on 2 July 2020).


| Strengths | Weaknesses |
| Alternative to importing fossil fuels. Robust structures that can survive harsh environments. Possibility of having a competitive cost of energy. Increases resilience through low-carbon development. Increases energy security by diversifying sources of energy. Island nations have ample ocean resources. High annual energy production that can cover energy demands of small islands. Several WEC devices are available to suit the local wave climate and geophysical conditions. | High discount rates. Uncertainty and risks are bound to the project. The wave energy sector is at the development stage. Significant distance from suppliers to the Pacific Island countries. Expertise is required to install, operate, and maintain the device. Lack of electricity grid in remote islands. A seaport is required to handle the equipment shipping. |
| Opportunities | Threats |
| Feed-in tariff scheme in practice. Local government support. Funding opportunities. Renewable energy targets. High wave energy resources distribution. Low seasonal, annual, and inter-annual variability. Multiple suitable locations for wave energy harnessing. Energy output can be used to power desalination plants. Job creation for different fields of expertise and training opportunities. Progress in the Sustainable Development Goals achievement through Goal 7. | Lack of regulation of wave energy. Marine protected areas, maritime zones, and military zones limiting the location of a WEC. Frequency of natural hazards such as hurricanes. Potential dangers to local biodiversity and coral reefs. Lack of sovereignty and additional bureaucracy. Political instability and economic instability. Presence of fishing, aquaculture, touristic, recreational, and offshore mining sites. Cultural and World Heritage sites with natural and cultural values. Lack of approval from the local communities. |
| Tubuai (French Polynesia) | Viti Levu (Fiji) | Rarotonga (Cook Islands) | ‘Eua (Tonga) | |
|---|---|---|---|---|
| Political | government support | government support | government support | government support |
| Economic | cost of energy risk assessment access to funds | cost of energy risk assessment access to funds | cost of energy risk assessment access to funds economic stability feed-in tariff | cost of energy risk assessment access to funds |
| Social | tourism fishery recreational sites local acceptance | tourism fishery recreational sites local acceptance offshore mining navigation aquaculture cultural and World Heritage Sites | tourism fishery recreational sites local acceptance offshore mining navigation aquaculture | tourism fishery recreational sites local acceptance |
| Technological | logistics expertise electricity supply and demand seaport electricity grid | logistics | logistics expertise | logistics expertise electricity supply and demand |
| Environmental | natural hazards biodiversity coral reef | natural hazards biodiversity coral reef | natural hazards biodiversity coral reef | natural hazards biodiversity coral reef |
| Legal | regulations maritime zones dependent territories | regulations marine protected areas military zones | regulations marine protected areas | regulations marine protected areas |
| Point 1 | Point 2 | Point 3 | Point 4 | |
|---|---|---|---|---|
| Mean Wave Height (m) | 1.50 | 1.19 | 1.28 | 1.78 |
| Mean Wave Period (s) | 8.65 | 9.19 | 9.23 | 8.76 |
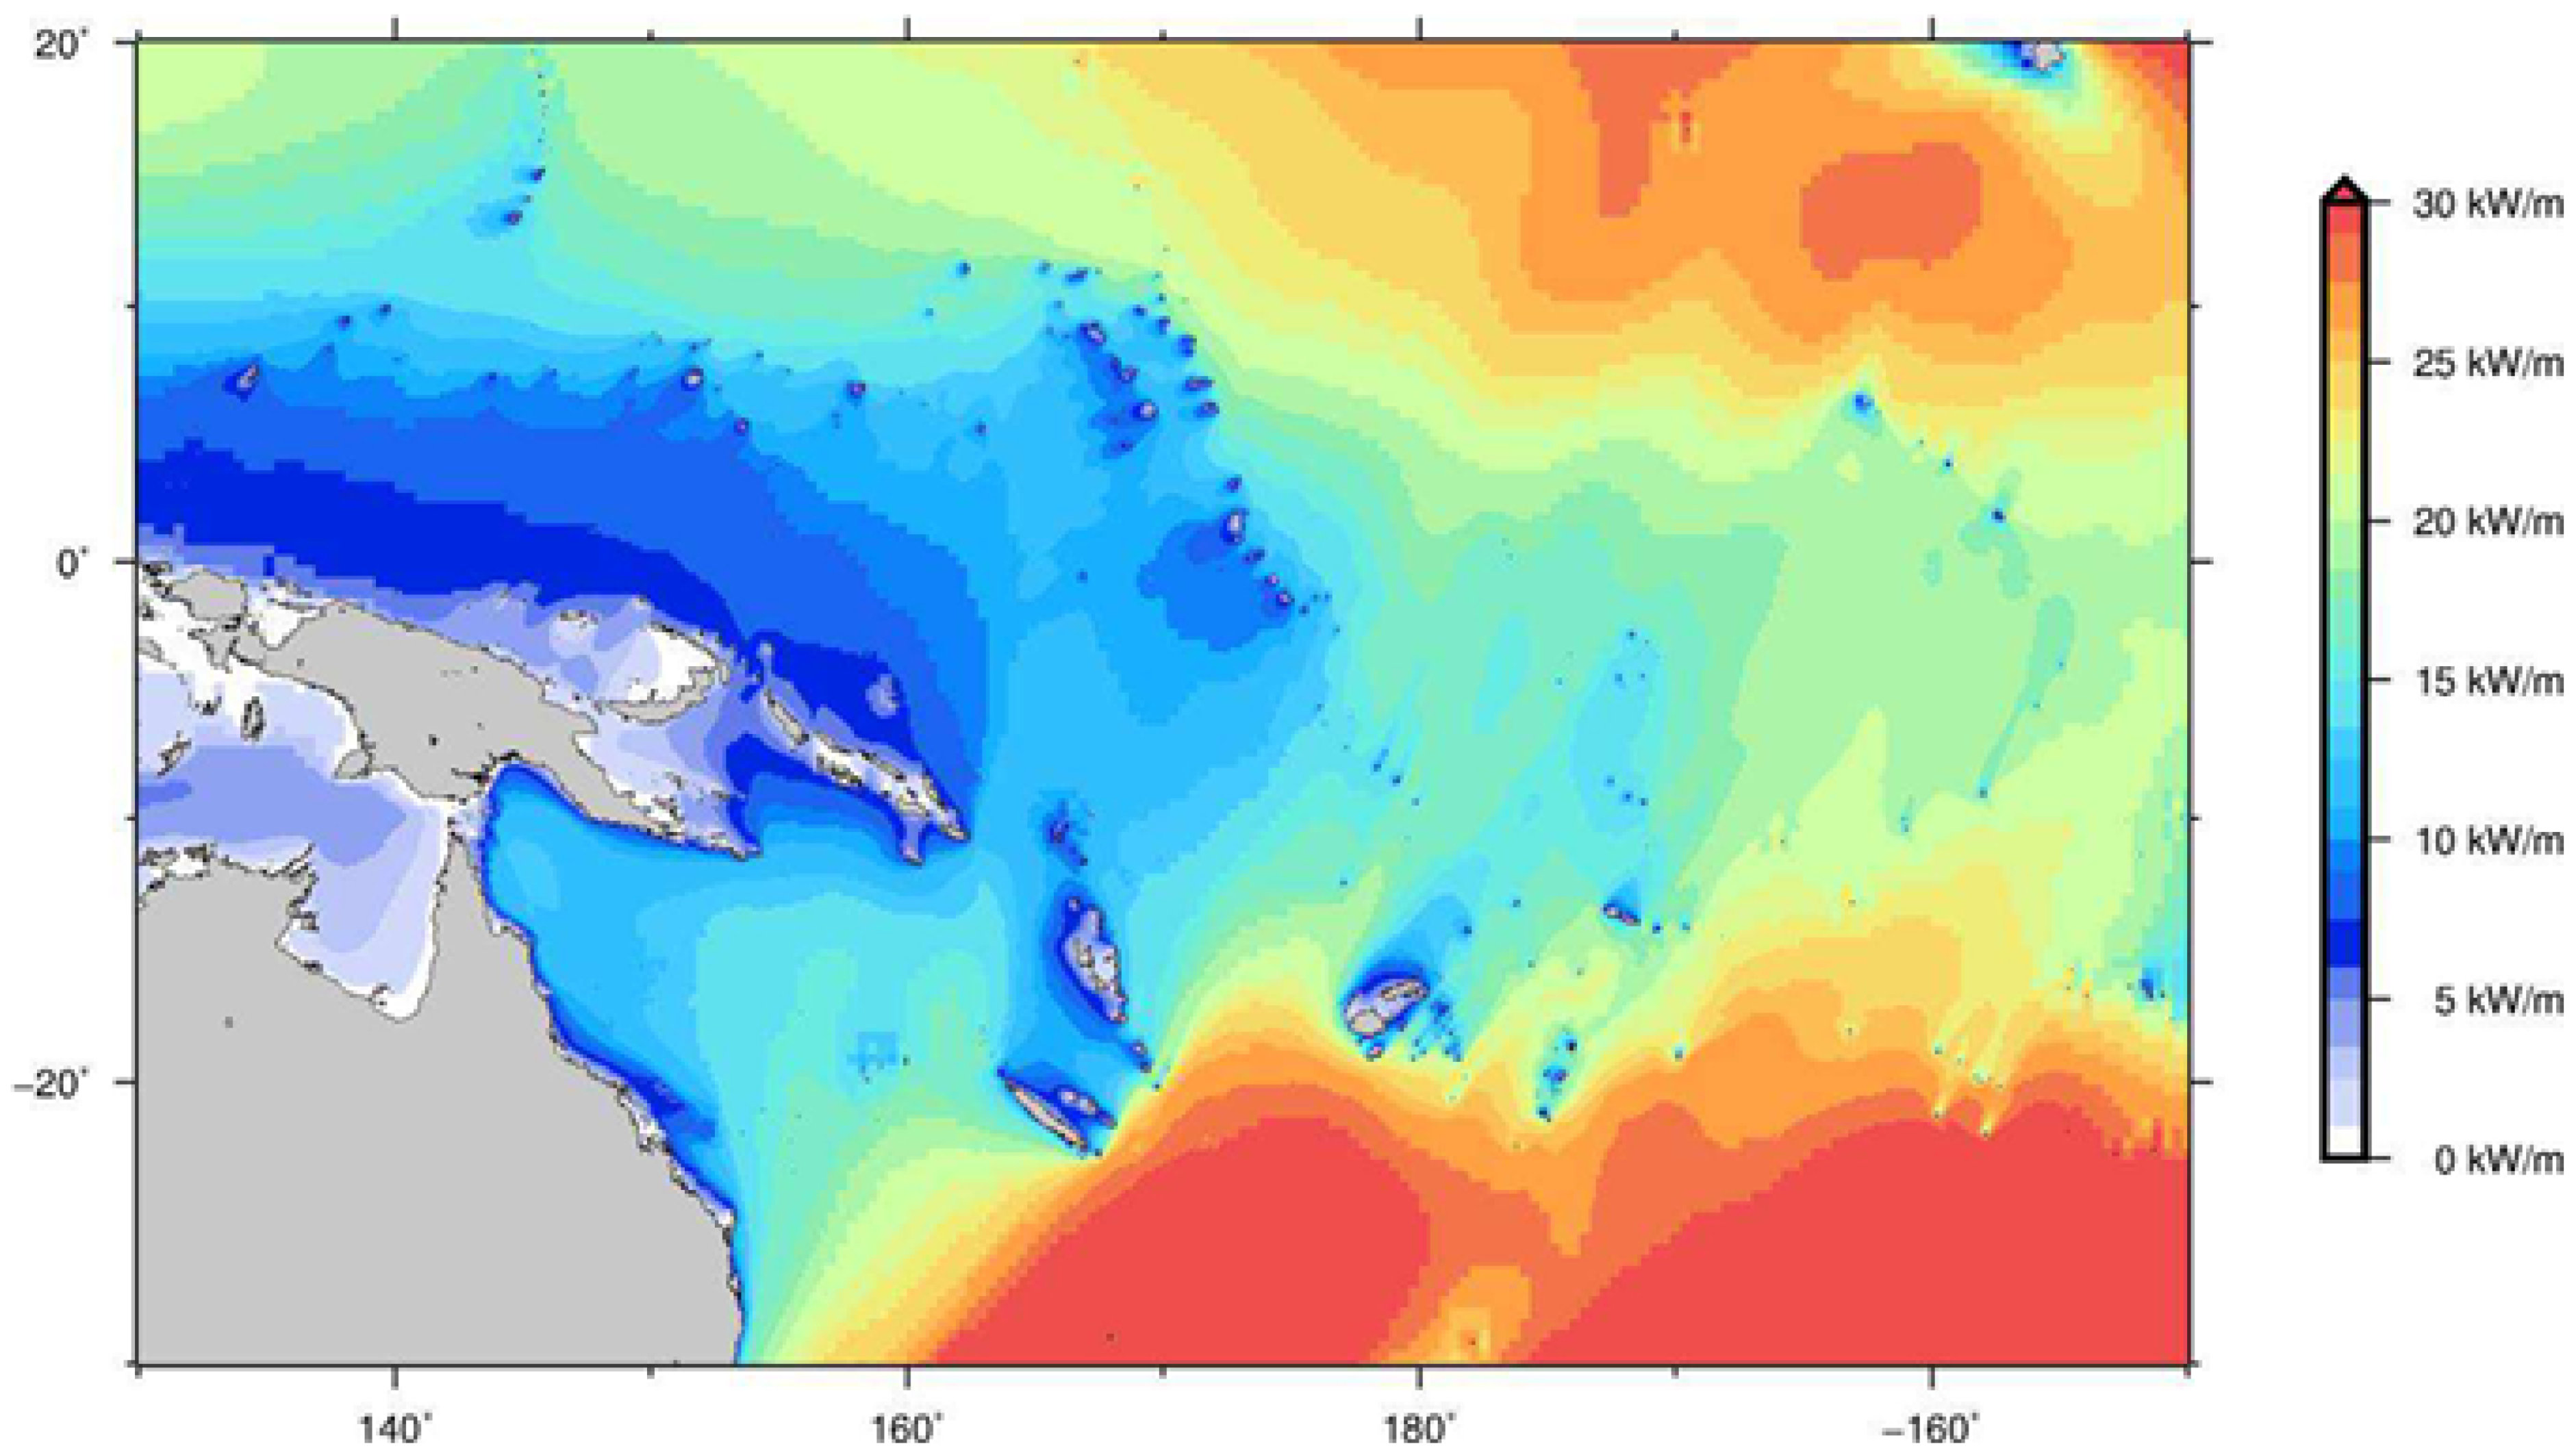
| Mean Wave Energy Flux (kW/m) | 10.94 | 11.02 | 12.96 | 19.66 |
| Inter-Annual Variability (%) | 7.75 | 9.52 | 9.13 | 5.87 |
| Seasonal Variability (%) | 14.67 | 29.99 | 30.89 | 24.77 |
Publisher’s Note: MDPI stays neutral with regard to jurisdictional claims in published maps and institutional affiliations. |
© 2022 by the authors. Licensee MDPI, Basel, Switzerland. This article is an open access article distributed under the terms and conditions of the Creative Commons Attribution (CC BY) license (https://creativecommons.org/licenses/by/4.0/).
Share and Cite
Borges Posterari, J.; Waseda, T. Wave Energy in the Pacific Island Countries: A New Integrative Conceptual Framework for Potential Challenges in Harnessing Wave Energy. Energies 2022, 15, 2606. https://doi.org/10.3390/en15072606
Borges Posterari J, Waseda T. Wave Energy in the Pacific Island Countries: A New Integrative Conceptual Framework for Potential Challenges in Harnessing Wave Energy. Energies. 2022; 15(7):2606. https://doi.org/10.3390/en15072606
Chicago/Turabian StyleBorges Posterari, Jessica, and Takuji Waseda. 2022. "Wave Energy in the Pacific Island Countries: A New Integrative Conceptual Framework for Potential Challenges in Harnessing Wave Energy" Energies 15, no. 7: 2606. https://doi.org/10.3390/en15072606
APA StyleBorges Posterari, J., & Waseda, T. (2022). Wave Energy in the Pacific Island Countries: A New Integrative Conceptual Framework for Potential Challenges in Harnessing Wave Energy. Energies, 15(7), 2606. https://doi.org/10.3390/en15072606