Article

Hotspot-Aware Workload Scheduling and Server Placement for Heterogeneous Cloud Data Centers

1
Department of Computer Science, COMSATS University Islamabad, Lahore Campus, Lahore 54000, Pakistan
2
Department of Software Engineering, School of Systems and Technology, University of Management & Technology Lahore, Lahore 54770, Pakistan
3
Department of Information and Communication Engineering, Yeungnam University, Gyeongsan 38541, Korea
*
Authors to whom correspondence should be addressed.
Energies 2022, 15(7), 2541; https://doi.org/10.3390/en15072541
Submission received: 16 February 2022 / Revised: 29 March 2022 / Accepted: 29 March 2022 / Published: 30 March 2022

Abstract

:
Data center servers located in thermal hotspot regions receive inlet air at a higher than the set temperature and thus generate comparatively high outlet temperature. Consequently, there is a rise in energy that is consumed to cool down the servers that otherwise would undergo reliability hazards. The workload deployment across the servers should be resilient to thermal hotspots to ensure smooth performance. In a heterogeneous data center environment, an equally important fact is the placement of the servers in a thermal hotspot-aware manner to lower the peak outlet temperatures. These approaches can be applied proactively with the help of outlet temperature prediction. This paper presents the hotspot adaptive workload deployment algorithm (HAWDA) and hotspot aware server relocation algorithm (HASRA) based on thermal profiling regarding outlet temperature prediction. HAWDA deploys workload on servers in a thermal-efficient manner and HASRA optimizes the server location in thermal hotspot regions to lower the peak outlet temperatures. Performance comparison is carried out to analyze the efficacy of HAWDA against the TASA and GRANITE algorithms. Results suggest that HAWDA provides average peak utilization of the servers similar to GRANITE and TASA without additional burden on the cooling mechanism, with and without server relocation, as HAWDA minimizes the peak outlet temperature.

1. Introduction

Wide use of internet data centers to provide uninterrupted access to cloud operations has substantially increased energy consumption over the past few years. Studies show that 40% of the total average energy consumed by a data center is utilized for cooling [1,2]. Due to unmanaged placement of servers and uneven server utilization, thermal hotspots are formed [3,4,5]. Thermal hotspots are regions of high air temperature that can occur frequently near the top of the racks due to heat recirculation [3,6] and/or due to the shortfalls of the cooling mechanism [5]. The rise in inlet temperature along with the server utilization has a corresponding effect over increasing outlet temperature of the servers [6]. Heat starts to accumulate more quickly inside server enclosures with higher inlet temperature as compared to servers with lower inlet temperature at the same utilization level [7]. At the same time, servers in the thermal hotspot regions conduct heat at a higher rate than their neighboring servers [8]. With the occurrence of heat recirculation, this situation can prolong the cooling process, resulting in increased cooling energy consumption and can cause reliability issues, and thus should be avoided [3].
The peak outlet temperature of the servers and the resultant cooling load can be lowered by either underutilizing the servers or keeping them idle [9]. Neither of these remedies works well as far as the heat generation is concerned because servers consume up to 60% of the peak power when in an idle state. Empirical studies from existing literature have observed that a typical server in an idle state consumes extensive energy due to its build and specifications [10,11,12]. Even if the power budget of the servers is capped to lower heat dissipation [13], it will result in lower performance due to low utilization of servers. Underutilization is not always the best solution unless the outlet temperature of the servers can be predicted. The servers can thus be adaptively utilized to maintain performance. Otherwise, the underutilization of servers may result in spending even more energy on computing than saved while cooling.
For adaptive utilization of servers generally, and for servers experiencing thermal hotspots particularly, a useful consideration is the heat dissipation behavior of each server. The heat dissipation from each server, in terms of the outlet temperature, can be profiled considering inlet air temperature and CPU utilization. The outlet temperature of the server at various utilization levels can be predicted using thermal profiling [14]. Thermal prediction can be used for energy-efficient proactive workload scheduling.
Most data centers today are heterogeneous, comprising servers of different generations and hardware specifications. This is because servers are added gradually to expand the capacity of the data center, data centers regularly go through maintenance, and existing servers are replaced with new servers. Two heterogeneous servers with different physical builds may have different outlet temperatures when receiving cold air at identical inlet temperatures and running workload at similar utilization levels [14]. Moreover, the physical location of each server also affects its outlet temperature. The temperature of heterogeneous servers residing within different regions of the data center hall can be predicted using thermal prediction models, and, by using this information, the best location for each server can be identified with respect to inlet temperature within different regions of the data center hall.
This paper aims to avoid thermal hotspot creation in the data center by lowering peak outlet temperature without causing an additional burden on the cooling mechanism and affecting the utilization of data center servers. To achieve these objectives, two algorithms are presented: (1) thermal-aware workload scheduling, and (2) thermal-aware server relocation. These algorithms use thermal profile-based thermal prediction [14]. The results demonstrate that by applying these algorithms individually or collectively, the peak outlet temperature of the data center is reduced significantly without any change in the overall utilization of data center servers.
This paper is organized into seven sections. Section 2 and Section 3 describe the related work and the background concepts of thermal-profiling, respectively. Section 4 describes our methodology and evaluation approach. It also presents a hotspot-aware scheduling algorithm and a hotspot-aware server location optimization algorithm. Experimental setup and results are discussed in Section 5. Section 6 presents a discussion on the results followed by conclusions in Section 7.

2. Related Work

A workload scheduling technique that prefers the most energy-efficient servers to schedule virtual machines (VMs) can save energy using frequency scaling, as each VM will be using a minimum frequency limit—just enough to avoid violating the service level agreement (SLA) [15]. Each server has to be evaluated for energy efficiency and graded accordingly. However, for heterogeneous servers, when energy-efficient servers are fully loaded, there is a need to utilize less efficient servers. This situation is prone to thermal hotspots unless the servers are profiled and located in a data center region according to their thermal behavior.
A few studies show the impact of server location and the rise in inlet air temperature on the creation of thermal hotspots. Bo et al. [5] and S. McIntosh et al. [16] identified the data center thermal hotspots as the rise in inlet air temperature due to multiple factors such as heat recirculation, the mixture of cold and hot air, physical flaws in the cooling mechanism, and central processing unit (CPU) utilization. They used regression analysis and interpolation of temperature data to identify the thermal hotspot regions inside the data center. However, they did not consider the thermal profiling of the servers to predict the occurrence of thermal hotspots or to link the thermal profiles with the location optimization of the servers. The traditional data centers’ thermal monitoring cannot correctly pinpoint a ‘thermal hotspot causing server’ without complex statistical analysis because of the sparseness of thermal monitoring sensors inside the data center hall [5,16]. However, thermal-profiling-based outlet temperature evaluation techniques can identify those thermal hotspot servers with comparatively more accuracy and speed. When using thermal sensors for temperature estimation and thermal modeling [17,18], it should be considered that if the server placement is not thermal-aware, some servers may undergo thermal hotspot conditions due to the rise in inlet air temperature. If the servers are located according to the inlet temperature sensitivity using thermal-profiling based outlet temperature estimation, the peak outlet temperature, and hence chances of thermal hotspot creation, across data center servers can be decreased.
A thermal-aware server provisioning approach for data centers [19,20] should consider that high inlet temperature can cause the underutilized servers to attain maximum temperature. Therefore, the average utilization rate of servers can be increased by thermal-aware relocation of the servers. In related approaches, Al-Qawasmeh et al. [21] used the decade-old logic of Moore et al. [13] to allocate power budgets to computing nodes according to the thermal and power constraints. Power is saved by allocating optimum power budgets to the computing nodes and using the power profiles of the tasks. The lack of thermal prediction makes this approach less effective when applied in real data centers. This is because the change in inlet temperature can increase the outlet temperature of the servers even in the idle state, as well as during utilization, and thus requires prediction modeling for temperature. In addition, the use of numerous processor states and task types makes the energy-efficient mapping of each task to a processor-core quite computer-intensive and thus impractical for an average-sized data center with hundreds of virtualized servers hosting multiple VMs.
Regression [21] based techniques are used to link CPU utilization with heat generation at constant inlet temperature using the heat imbalance model [7] to estimate heat generation from the related server based on outlet temperature. However, this technique may not work for high inlet temperatures because the cooling capacity of the air will be decreased [22] and therefore the server will start to accumulate heat. This decreases the prediction accuracy and hence the thermal efficiency of workload scheduling. The RC model [23] is used by Kumar et al. [24] to evaluate the ambient heat dissipation from the servers and the data center workload balancing approach of [25] is extended to this end. Power consumption is used to calculate the temperature of the servers that is then utilized for maintaining thermal balance across all servers and for optimizing the power consumption of the servers and computer room air conditioning (CRAC) unit. Although Kumar et al. [24] consider CRAC units’ set temperature as the inlet temperature, it is not possible to calculate heat recirculation and/or rise in inlet temperature, making the calculations unreliable because all the servers will be otherwise receiving the inlet air at higher than the set temperature. Further, the use of processor chip temperature to be equivalent to server temperature is debatable. Additionally, this approach is not used for the location optimization of the servers.
Some green cloud computing approaches [26] aiming for energy-efficient management of cloud infrastructure propose to save energy through server consolidation. The fact is that, to save power, if a few servers are overloaded with VMs, then this makes these servers prone to thermal hotspot conditions when exposed to increased inlet temperature unless a thermal-aware VM scheduling is followed. Furthermore, thermal-aware workload scheduling aimed at distributing and redistributing VMs across servers based on the thermal status of servers [26] may not achieve the target without thermal profiles. The variations in inlet temperature, power consumption, and CPU load have a combined effect on the outlet temperature. Without the use of a thermal profile, it is difficult to determine the thermal state of a server. The scheduling algorithm for back-to-back leasing of VM utilizes the servers at peak level, especially the backfilling infrastructure as a service (IAAS) resource scheduling [27]. Such situations may give rise to multiple thermal hotspots due to variations in inlet temperature and/or inefficient cooling.
Workload scheduling approaches that rely upon computational fluid dynamics simulations [6,19,28] can provide a better estimation of cooling power consumption if their respective energy models include the phenomenon of inlet temperature variation and the physical location of the servers. Simulator-based implementations of thermal-aware resource scheduling [26] or inferring the thermal effect of a resource allocation is limited because the physical world is quite different from simulation. The effect of power consumption and inlet temperature on outlet temperature may comparatively be more accurately demonstrable by using actual thermal profiles of physical servers. Thermal profiling-based techniques such as [22,29] either give inaccurate results or underutilize the servers unless the servers’ placement in the data center is thermal-aware. To achieve a high air conditioning thermostat setting [9,30], servers should be placed at optimum locations before the evaluation of the power consumption of the data center. Otherwise, the thermal-aware resource scheduling algorithm will tend to underutilize the servers in fear of thermal hotspots.
Workload scheduling techniques for data centers that use the RC-thermal model of heat exchange [31,32] should consider that workload backfilling might not help reduce the peak outlet temperature if inlet temperature variation is not considered. This is because the slight variation in inlet temperature substantially affects the coefficients of heat recirculation and heat extraction for data center servers [33]. In fact, backfilling-based workload scheduling may lead to thermal hotspot creation and thus may cause reliability issues [3]. Thermal-aware workload scheduling that is based on task-temperature profiles should consider the effect of variation in inlet temperature on physical servers, otherwise, the thermal map can be unexpected because of this scheduling [34]. In the presence of a large number of servers, heterogeneity, and heat recirculation, the frequency of thermal hotspots can increase. Server-based thermal profiling is more simple and more generic than task-based thermal profiling in such a diverse scenario. If the thermal profiles of severs are available, the chances of high outlet temperature as a result of workload scheduling can be predicted proactively, and thus can be avoided. Moreover, the servers can be relocated to lower the peak outlet temperature based on thermal prediction, as shown in this paper. This paper has the following contributions:
  • A generic approach for thermal hotspot-aware resource management of data centers using thermal profiles of servers is proposed. The proposed approach proactively predicts the outlet temperatures and helps avoid thermal hotspots in data centers.
  • Hotspot-adaptive workload deployment algorithm (HAWDA) and hotspot-aware server relocation algorithm (HASRA) are developed and evaluated in terms of outlet temperature, power consumption, and server utilization of data center servers.
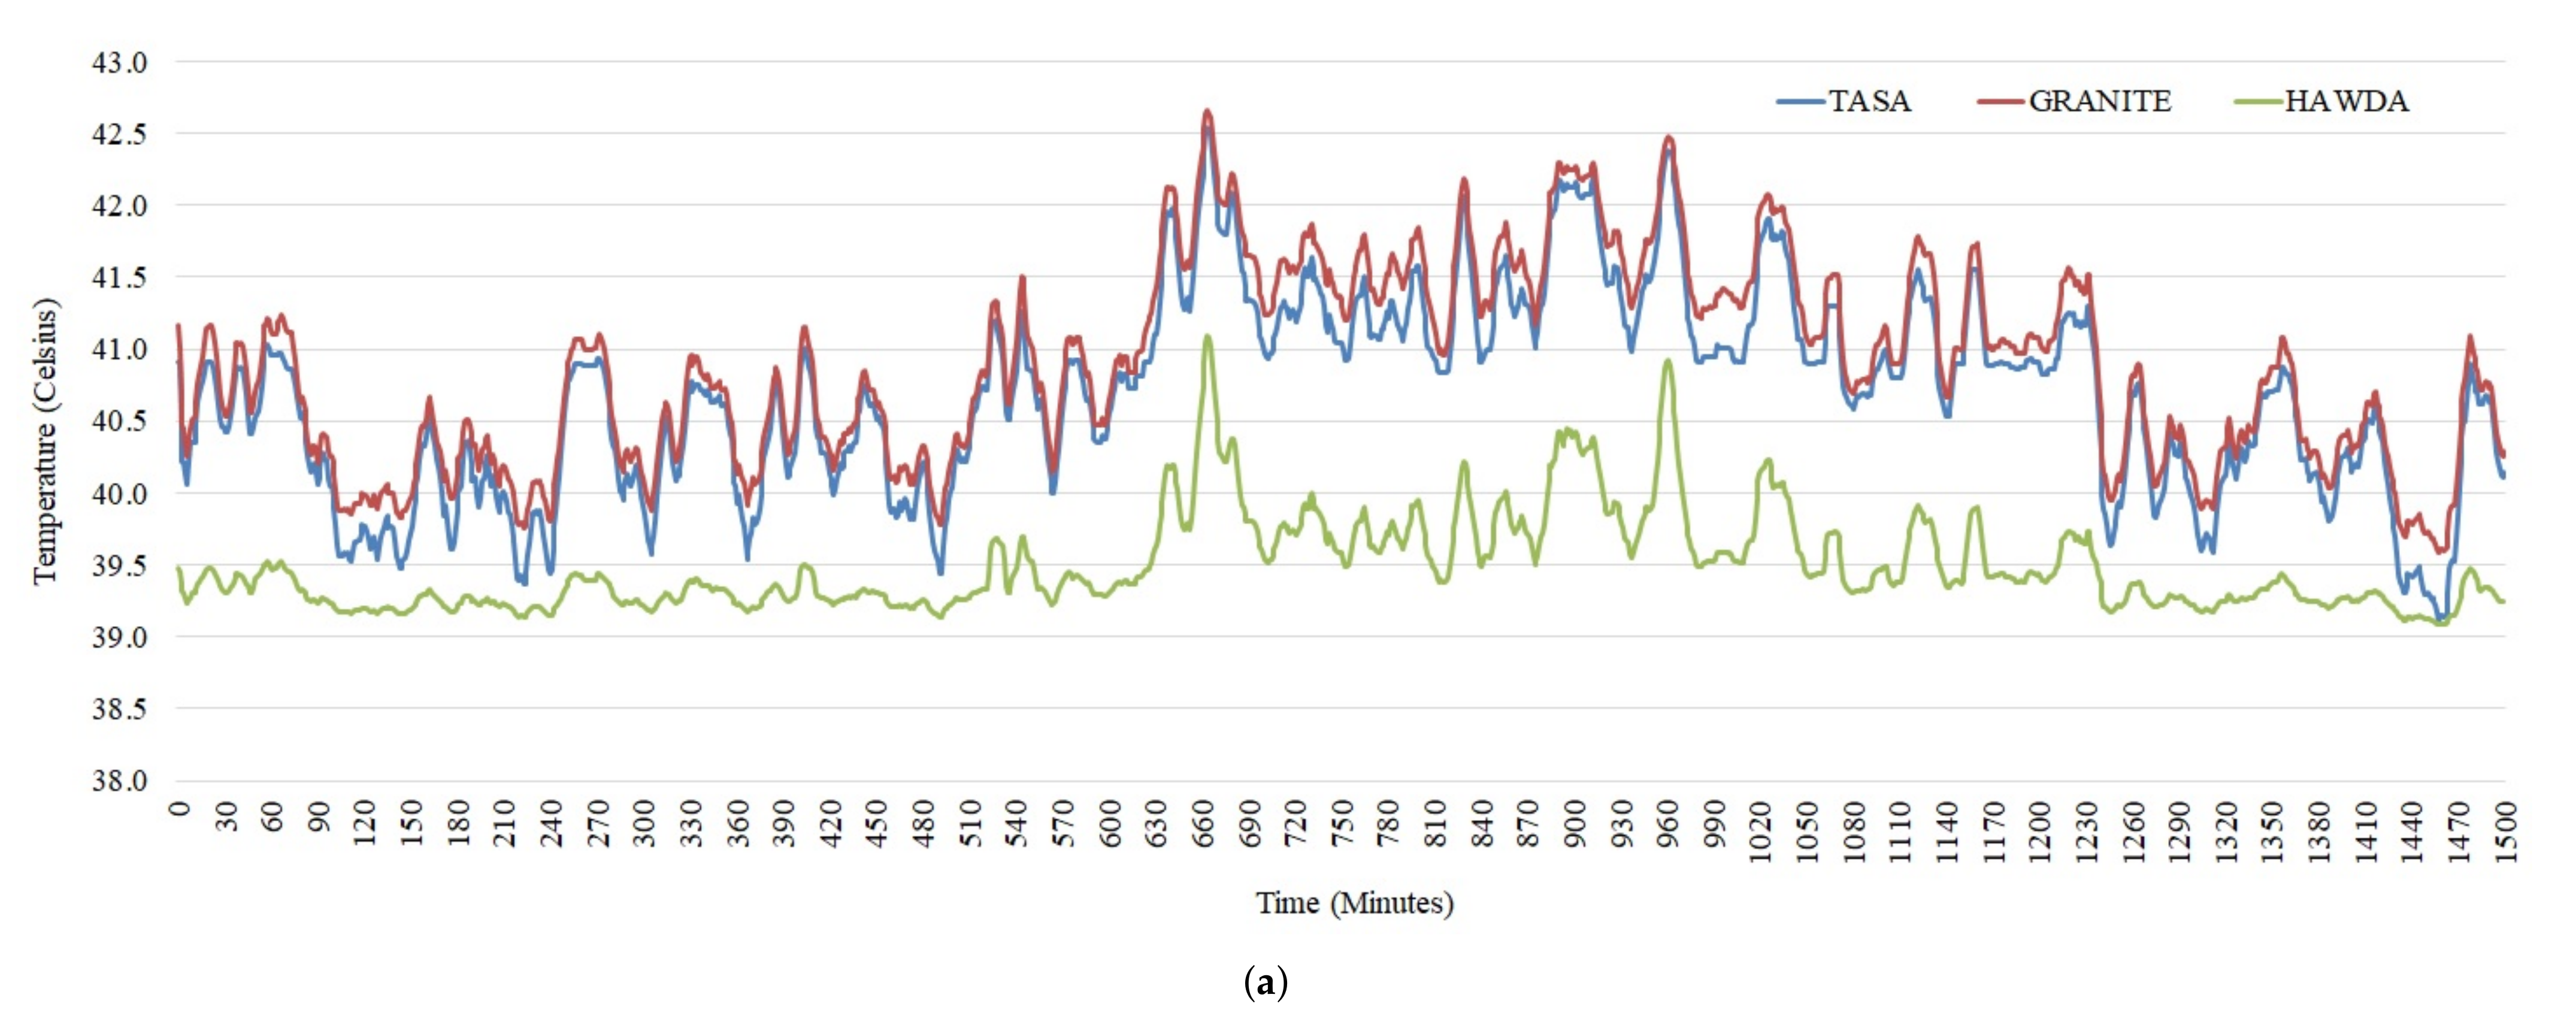
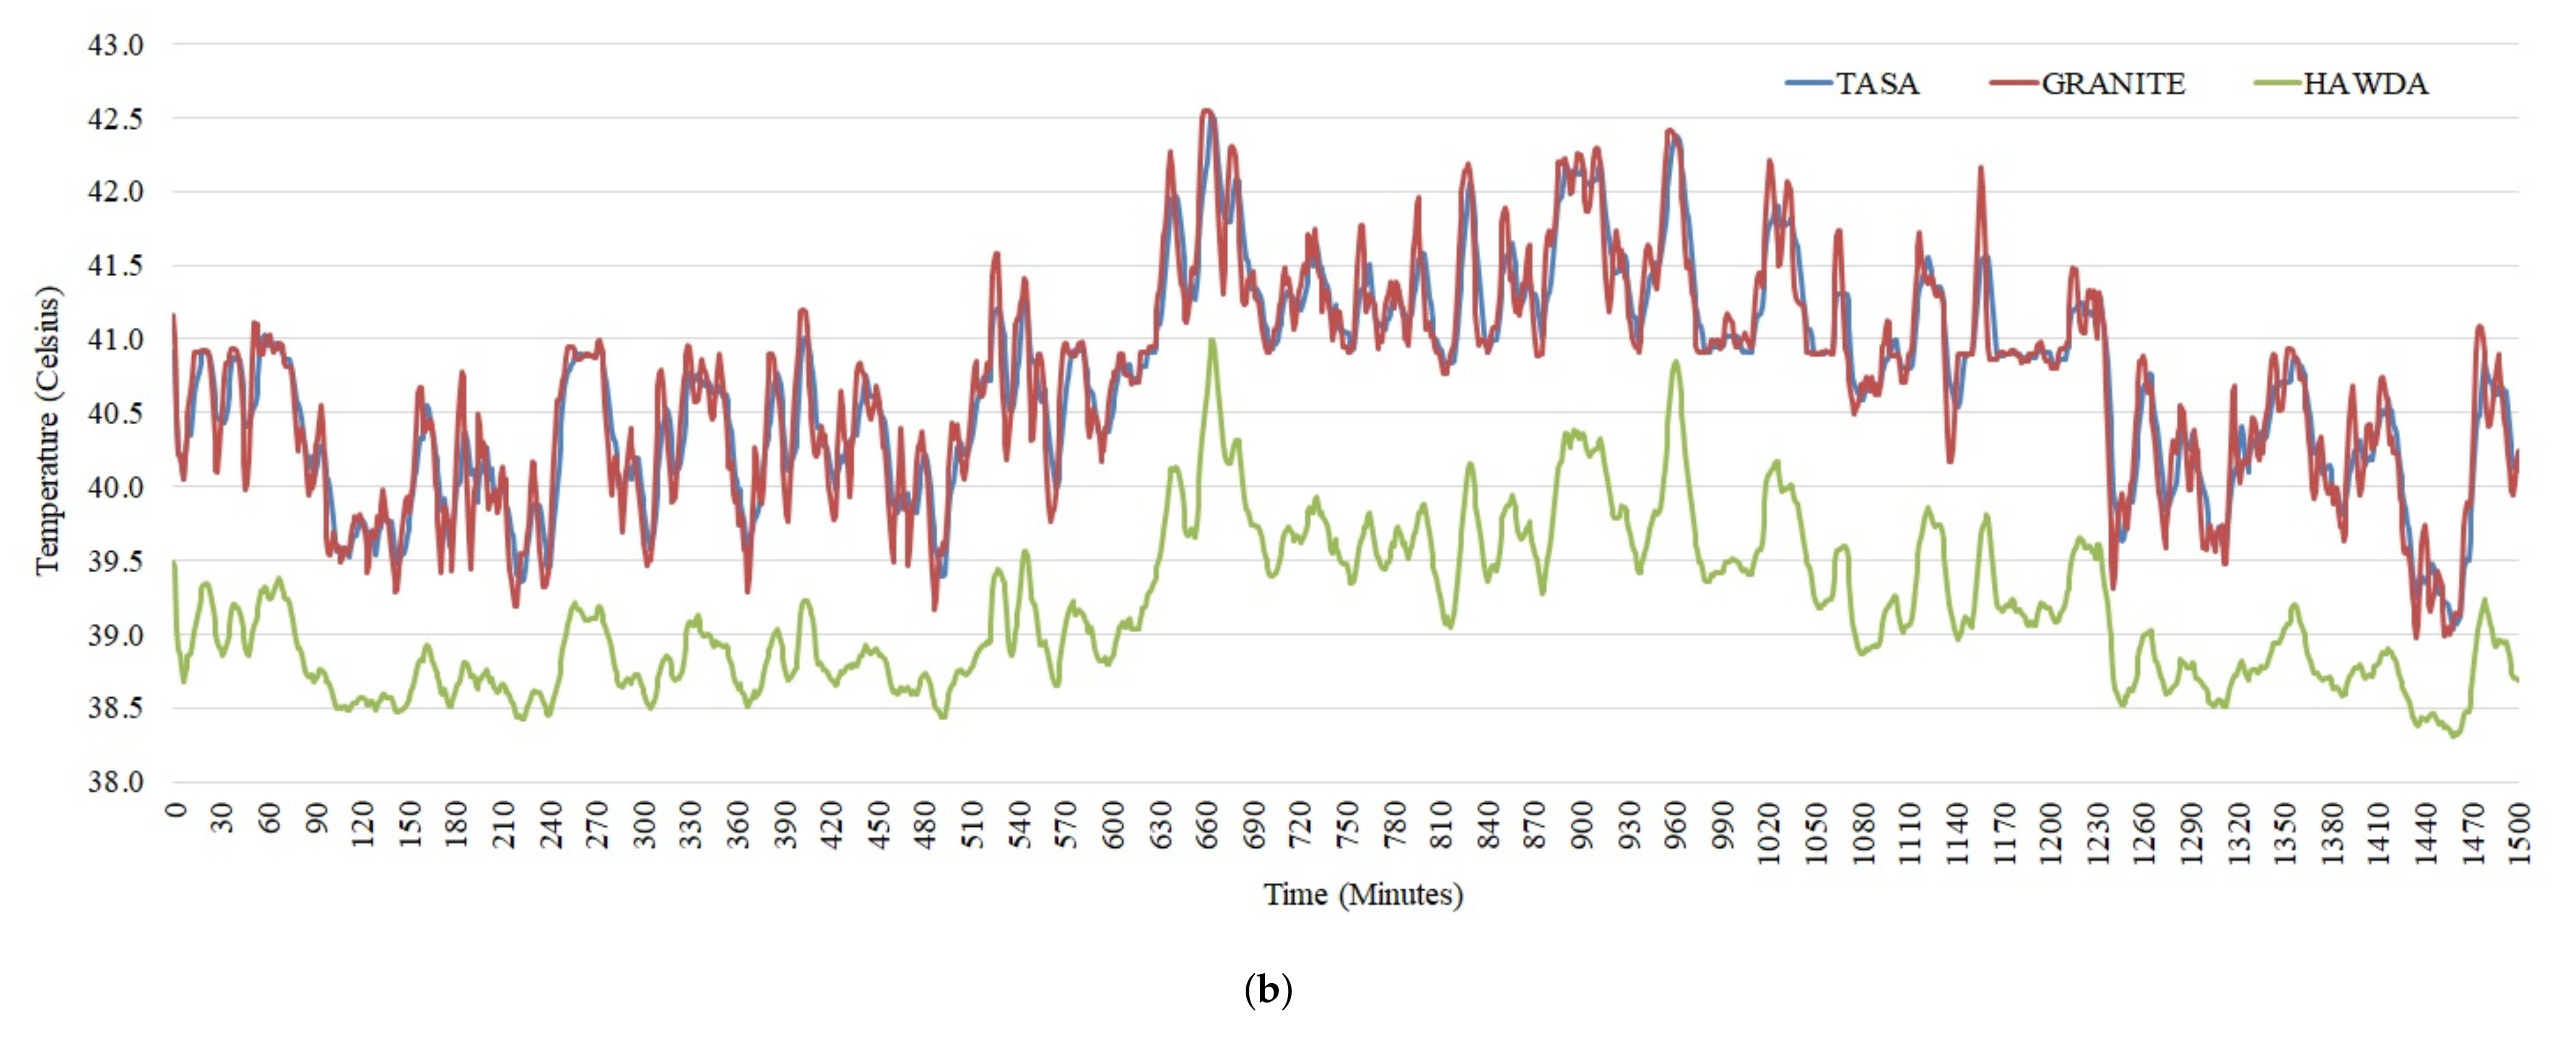
  • A simulation study is implemented with HAWDA and HASRA using Alibaba cloud workload traces. HAWDA and HASRA are compared with the existing thermal-aware scheduling algorithm (TASA) and greedy-based scheduling algorithm minimizing total energy (GRANITE).

3. Background

Thermal profiles of servers are created by stress-testing them at various utilization levels using thermal benchmarks by manipulating multiple VMs to imitate real-life computational load [14]. As shown in Table 1, a thermal profile that maintains the thermal and power data at certain levels of server utilization can be represented in tabular form. The second column represents the server utilization in terms of percentage and usable CPU frequency. Consider, for example, an octa-core processor with a processor core frequency of 2.66 GHz, making the maximum processing capacity 21.28 GHz. The hypervisor consumes some CPU cycles in addition to VMs, so the maximum available GHz for the server is approximately 20.97 GHz. The last column represents the inlet temperature received by the server. The third and fourth column represents the net increase in outlet temperature T Δ i and power consumed at various level of server utilization.
Suppose server i receives the cold air at temperature T r e c e i v e d i , which may be greater than the set temperature T s e t of the cooling mechanism. The servers receiving inlet air at a high temperature will cause an equivalent rise in the outlet air temperature, as shown in Equation (1).
Δ T i = T r e c e i v e d i T s e t
where Δ T i represents the change in inlet temperature of server i and causes the equivalent change in outlet temperature of the server.
High inlet temperature leads to corresponding high outlet temperature and may increase the intensity of recirculated heat [33]. The increased outlet temperature of server i due to Δ T i has two effects: extra burden on the cooling mechanism and reliability issues. The maximum inlet temperature for the thermal hotspot threshold can be determined [4,5,16,21] and can be avoided by distributing the workload, thus minimizing the maximum increase in inlet temperature [6,33,35]. This may lead to uniform outlet temperature and reduced heat recirculation but at the expense of underutilization of servers [13], and hence reduced performance in terms of effective CPU cycles provided to each t a s k / V M per unit time. The net increase in outlet temperature T Δ i of server i is the difference between the outlet and inlet temperature, as shown in Equation (2), and can be included in the thermal profile for various levels of server utilization for a range of inlet temperatures T r e c e i v e d i .
T Δ i = T o u l e t i T r e c e i v e d i
Given a thermal profile T P i of server i, the outlet temperature T o u l e t i of server i, with reference to server utilization, can be determined at run time using inlet temperature and interpolation [14]. For an m-slot (number of rows) thermal-profile, the server utilization is quantized into m levels. Intended utilization of the server can be used to predict the possible worst-case outlet temperature. For example, a server i running at utilization level x can be represented at C P U x i where i = 1 , 2 , . . . , n and x = 0 , . . . , m ; x = 0 is idle state whereas x = m represents maximum utilization of the server. The worst-case predicted outlet temperature at server utilization C P U y i , where y < x and x are the next higher utilization level of thermal profile immediately covering y (considering that y is the actual thermal reading and not a quantized level present in the thermal-profile) can be given as (3) [14]:
T p r e d i c t e d o u l e t i = T Δ i [ x ] + T r e c e i v e d i + β
where C P U y i C P U x i and β is the prediction error and is the difference between T o u t l e t i (at utilization level y) and the predicted temperature T ( p r e d i c t e d o u l e t ) i (at utilization level x). The value of β varies directly with the variation is inlet temperature and ranges between 0.2 °C and 0.4 °C.

4. Proposed Methodology

Thermal-aware workload scheduling is used to lower the maximum increase in inlet temperature and avoid thermal hotspots in data centers. This is achieved at the cost of underutilization of servers, thereby reducing performance in terms of server utilization. This paper proposes a thermal hotspot adaptive workload scheduling algorithm based on thermal prediction and compares it with two algorithms: (1) a thermal aware scheduling algorithm (TASA) [34] that allocates workloads to the current coolest server to minimize cooling energy, and (2) greedy based scheduling algorithm minimizing total energy (GRANITE) [36] that allocates workloads on the server that result in the least increase in total power consumption after workload placement. Additionally, in some cases, the workload cannot be scheduled on a server even if computing capacity is available because the thermal requirements are not met. In this case, the server can be relocated to a cooler area (with a lower inlet temperature) within the data center hall. This paper also proposes a server relocation algorithm, which in combination with our thermal hotspot adaptive workload scheduling algorithm shows better performance in terms of utilization without much effect on the cooling mechanism and is an alternative approach to server underutilization in thermal hotspot regions [3,4,33,34,36].

4.1. Workload Characterization

This paper considers the workload of cloud hosting data centers in the form of VMs for the rendering of IaaS over physical servers. This workload is composed of batches of multiple heterogeneous VM requests, where a single batch is the unit of workload scheduling. These VM batches are lined up in a job queue of IaaS ready for deployment on the available servers. The maximum CPU usage demand in terms of CPU cycles for all VMs in a single batch can be represented as b a t c h G H z k . The maximum CPU cycle demand by all VM batches is represented by BatchList[K], which is the list of all VM batches to be deployed.

4.2. Evaluation Approach

This paper proactively evaluates the possible distribution of VM batches across the servers in terms of predicted outlet temperatures at the maximum theoretical workload of each batch. The list of all n servers along with relevant information on the current state of the server is represented as server [n]. This information include server ID, computing capacity C P U m a x i ( G H z ) , computing capacity currently available C P U a v a i l a b l e i ( G H z ) , inlet temperature at current time T r e c e i v e d i , and outlet temperature at current time T o u t l e t i . The thermal-profile TP of the server containing relevant information, as described previously, is also stored. The current utilization of the server can be calculated by subtracting C P U a v a i l a b l e i from C P U m a x i .
To consider the worst case, the predicted maximum outlet temperature T P M O i of server i running at predicted utilization level x is calculated by adding the current inlet temperature T r e c e i v e d i to the predicted outlet increase in temperature T Δ i [ x ] at that utilization level, as given in Equation (4):
T P M O i = T Δ i [ x ] + T r e c e i v e d i
where the predicted utilization T Δ i [ x ] of server i with respect to the current utilization and b a t c h G H z k is given as in Equation (5).
T Δ i [ x ] = C P U m a x i C P U a v a i l a b l e i   +   b a t c h G H z k
Because we use 8-core servers for our experiments and a maximum of 8-core VM for our workload, the thermal profiles used in this paper have nine quantized utilization levels; therefore, the value of T Δ i [ x ] can be any one element of the set { i d l e , 12.5 % , 25 % , 37.5 % , 50 % , 62.5 % , 75 % , 87.5 % , f u l l } for each server. For outlet temperature prediction purposes, interpolation can be used for in-between values. For the current study, we define a term T m a x , which is the highest T P M O i of all the servers at hand and is the maximum limit for making scheduling decisions because T m a x supposedly belongs to a server that is located inside a thermal hotspot region. The value of T m a x can be calculated as
T m a x = m a x T P M O i 1 i n x ( { i d l e , . . . , f u l l } )

4.3. Hotspot Adaptive Workload Deployment Algorithm

This section presents the proposed thermal hotspot-resistant adaptive workload deployment algorithm (HAWDA). HAWDA uses the worst-case prediction model, as shown in Equation (4), to predict the chances of peak outlet temperature and deploys a batch b a t c h G H z k on the server that shows the least increase in predicted temperature. Due to this reason, the proposed approach can work comparatively better in thermal hotspot regions than the non-prediction-based workload scheduling. For each server 1 i n , HAWDA has the following objective functions:
m a x ( C P U m a x i C P U a v a i l a b l e i )
m i n ( T P M O i ) , T P M O i < T m a x
HAWDA algorithm (Algorithm 1) takes the list of servers (along with their thermal profiles) and the list of batches as input parameters. For each b a t c h G H z k in B a t c h L i s t [ K ] , the algorithm iterates through all the servers and finds a suitable server with enough computing capacity such that all three objective functions are satisfied. If the objective functions are satisfied, b a t c h G H z k is deployed on the selected server. If there is no thermal hotspot-resistant deployment possible (three objective functions are not satisfied), the algorithm does not deploy the batch despite the availability of CPU capacity on the server. The time complexity of HAWDA is O ( n m ) , where n is the number of servers and m is the total number of cores across the data center servers.
Algorithm 1 The pseudocode of HAWDA.
INPUT: Server [ n ] , BatchList [ K ]
OUTPUT: Mapping of Batches deployed on Servers
1: Sort Server [ n ] according to ascending order of inlet temperature and calculate T m a x
2: for b a t c h G H z k in B a t c h L i s t [ K ]  do
3:   for  s e r v e r i in S e r v e r [ n ]  do
4:      if  ( b a t c h G H z k C P U a v a i l a b l e i )  then
5:         Calculate T P M O i for b a t c h G H z k
6:         if  ( T P M O i < T m a x )  then
7:            T e m p P M O = m i n ( T P M O i , T e m p P M O )
8.           if  ( T P M O i T e m p P M O )  then
9:               j = i
10:           end if
11:         end if
12:      end if
13:    end for
14:     C P U a v a i l a b l e j = C P U a v a i l a b l e j b a t c h G H z k
        // b a t c h G H z k is assigned to s e r v e r j
15: end for

4.4. Hotspot Aware Server Relocation Algorithm

As discussed in the previous section, even in the case of the availability of CPU capacity on a server, if the objective functions of the HAWDA algorithm are not met, a batch is not deployed. To increase utilization of servers and deploy maximum batches (with the possibility of homogeneous and lower outlet temperatures), the servers can be relocated according to their thermal profiles and the regional inlet temperature. This section presents an optimized server relocation algorithm for thermal hotspot-aware server arrangement using a thermal-prediction model that identifies the location for server relocation by using the current inlet temperature and thermal profile of the servers under test. The model is named hotspot aware server relocation algorithm (HASRA) and presented in Algorithm 2.
Algorithm 2 The pseudocode of HASRA.
INPUT: Server [ n ] , T s e t
OUTPUT: Relocation of hot servers to cooler regions.
1: Sort Server [ n ] according to descending order of inlet temperature and calculate T m a x
2: for s e r v e r i in S e r v e r [ n ] for i = 1 to n / 2  do
3:    Calculate T m a x for s e r v e r i at maximum utilization
4:    if  ( T m a x T P M O i )  then
5:      for  s e r v e r j in S e r v e r [ n ] from j = n down to n / 2  do
6:         Calculate T P M O j for s e r v e r j at maximum utilization
7:         if  ( T P M O j < T P M O i & T r e c e i v e d j < T r e c e i v e d i )  then
8:           if  ( T P M O j after relocvation < T P M O i & T P M O i after relocation < T P M O i )  then
9:              switch location of s e r v e r i and s e r v e r j
10:           end if
11:         end if
12:      end for
13:    end if
14: end for
The objective of the HASRA algorithm is to identify a server i whose T P M O i at the current location, regarding maximum utilization is likely to approach T m a x , and exchange server i with server j from the cooler regions of the data center, such that after relocation
m i n | T P M O j T P M O i | , T P M O i < T m a x , T P M O j < T P M O i
The HASRA algorithm takes the list of servers (along with their thermal profiles) as the input parameter. The HASRA algorithm ensures the homogeneity of outlet temperature of the relocated servers. The servers are arranged according to the decreasing order of their inlet temperature. The value of T m a x is calculated from the upper half of the servers.
The algorithm iterates through the first half of the servers (placed in the hotter region) and finds a server i whose T P M O i may approach T m a x at the current location. Once identified, another server j is searched from the second half of servers (placed in a cooler region than server i) so that if the locations of both the servers are switched, the three objective functions of the algorithm are fulfilled. In line 8 of HASRA algorithm, the T P M O j is calculated with T r e c e i v e d i and similarly T P M O i is calculated at T r e c e i v e d j . In short, HASRA only recommends server relocation after ensuring that the server relocation will bring down the thermal gradient and a decline in T m a x . The HASRA algorithm allows level 2 assurance of minimizing the peak outlet temperature. However, it is worth noting that for data centers comprising homogeneous servers, HASRA will not be applicable. Even when server relocation is not possible, HAWDA still provides level 1 assurance for minimizing the chances of T m a x and hence the thermal hotspots. Thus, both techniques are complementary to each other and together provide maximum utilization of servers even at thermal hotspots causing high inlet temperatures. The time complexity of HASRA is O ( n ) , where n is the number of servers in the data center.

5. Results

5.1. Experiment Setup

For this study, we chose two heterogeneous server types (A and B). The specifications of these servers are given in Table 2. For this study, the workload is composed of sixteen 8-core, thirty-two 4-core, sixty-four 2-core, and hundred and twenty-eight single-core VMs. Alibaba cloud workload traces [37] are used for this purpose. Because we use 8-core servers for the simulation experiments and a maximum of 8-core VM for our workload, the thermal profiles used in this paper have nine quantized utilization levels for each server, i.e., idle, 12.5%, 25%, 37.5%, 50%, 62.5%, 75%, 87.5%, and full, as shown in Table 3. We abstract the overall CPU utilization of the server in terms of physical core utilization, e.g., a 4-core VM running at full utilization on an 8-core server represents 50% utilization of the server regardless of which four cores of the server it is mapped to.
The experimental setup comprises a data center with a total of 96 servers placed in 8 server racks. Out of these 96 servers, 43 are type A servers ( S A ) and 53 are type B servers ( S B ). These servers are randomly placed in the data center racks as shown in Figure 1a. As per the experiment results, the hypervisor running on a server consumes some CPU cycles in addition to the VMs, so the maximum useable processing power of S A and S B are approximately 20.8 GHz and 14.1 GHz, respectively. The combined usable CPU capacity of the 96 servers for workload scheduling is 1641.7 GHz. The cooling temperature of the CRAC unit T s e t is set to 22.9 °C. Figure 1b shows the inlet temperature T r e c e i v e d i for each server i in the data center. We consider the inlet air temperature for the severs to be higher than T s e t to emulate heat recirculation [13]. The top two servers of each rack are assumed to be in the thermal hotspot region.
HAWDA and HASRA algorithms rely upon predicted outlet temperature T P M O i calculated through Equation (4). Consider, for example, the bottom-most server in rack 4. It is an S A server with an inlet temperature of 23.5 °C. Assuming it is idle, and we want to schedule a 4-core VM of this server, the T P M O i after scheduling this VM will be 39.1 °C (23.5 + 15.6). This is because a 4-core machine is utilizing 50% of the 8-core server, at the maximum, and according to the thermal profile of S A (see Table 3), the net increase in the outlet temperature at 50% utilization is 15.6 °C. The assumption in this study is that once a batch has been deployed on the server, it will run indefinitely, and T P M O i is the worst-case outlet temperature prediction. The T P M O i of all servers is calculated, and the T m a x belongs to the top two servers of rack 4 (44.42 °C).

5.2. Workload Scheduling

The workload of all VM batches is deployed on the data center servers using TASA [34], GRANITE [36], and HAWDA algorithms. Before deployment, the VMs are sorted in decreasing order of their score count. Because TASA and HAWDA are thermal-aware algorithms, the servers are sorted according to ascending order of outlet temperature at an idle state. TASA deploys the VM batches to the coolest server first. HAWDA deploys VM batches to servers in the best fit manner (see Algorithm 1). A batch is deployed on a server that would result in the least T P M O i after the batch is deployed. GRANITE deploys the VM batches to the server resulting in the minimum increase in total power consumption.
Figure 2 shows the plots of outlet temperature, power consumption, and percentage utilization of data center servers after deployment of all VM batches for all algorithms. The box plots in Figure 2a,b show the variance in peak outlet temperature and power consumption, respectively. The red dot represents the mean value. The lower and upper whiskers represent the lower and upper 25% data values, with the endpoints of whiskers being the minimum and maximum data value, respectively. The boxes represent the middle 50% data values, and the boundary between the two boxes represents the median data value. From Figure 2a it is observed that HAWDA reduces the maximum outlet temperature of the data center servers. This is because it uses a proactive approach of predicting the outlet temperature before deploying workload on the servers. From thermal profiles of S A and S B , it is observed that S B produces more heat while doing the same task as compared to S A at all utilization levels. HAWDA proactively deploys more workload on the cooler S A servers, hence reducing the overall outlet temperature of the data center. Conversely, TASA deploys workload on the next available coolest server, which can be the S B server (see Figure 2c) leading to higher outlet temperature.
Additionally, there is a lower power difference between utilization slots for the S B server as compared to the S A servers, as seen in the thermal profile, hence GRANITE deploys more workload on S B rather than S A servers, underutilizing S A servers, as observed in Figure 2c. Because S B servers consume more power and generate more heat, this results in a large variation in outlet temperature and power consumption across servers, as observed in Figure 2a,b. Similarly, as observed from Figure 2b, the overall power consumption is reduced using the HAWDA algorithm as compared to TASA and GRANITE. Moreover, HAWDA utilizes more servers to their peak capacity without increasing the outlet temperature and thermal hotspot creation, whereas TASA and GRANITE avoid thermal hotspot creation by underutilizing the servers in the thermal hotspot region to lower the overall maximum outlet temperature of the servers that cause heat recirculation, at the cost of performance.

5.3. Workload Scheduling with Server Relocation

As discussed previously, hotspot-aware workload scheduling will underutilize servers to avoid thermal hotspot creation. To increase the utilization without the creation of thermal hotspots, a possible solution is to use the HASRA server relocation algorithm (see Algorithm 2), which identifies the hottest servers and replaces them with the cooler servers such that the predicted outlet temperature of the cooler servers remains less than the hotter servers after relocation.
Table 4 shows the updated locations of the servers in the data center after HASRA is applied. The T P M O i of all servers is calculated again after the relocation of servers and the T m a x value is 43.42 °C, which is 1 °C less than before server relocation. It is interesting to note that the T m a x value does not belong to any server at the top of the racks where the inlet temperature is high. This is because HASRA relocates cooler S A servers to locations where the inlet temperature is high. The T m a x value still belongs to all S B servers placed in rack 3 to rack 6 that all have inlet temperature of 23.3 °C. After the relocation of servers using HASRA, the workload of all VM batches is deployed on the data center servers using TASA, GRANITE, and HAWDA algorithms. Before deployment, the VMs are sorted in decreasing order of their score count.
Figure 3 shows the plots of outlet temperature, power consumption, and percentage utilization of data center servers after deployment of all VM batches for all algorithms after applying the HASRA algorithm. The box plots in Figure 3a,b show the variance in peak outlet temperature and power consumption, respectively. The red dot represents the mean value. The lower and upper whiskers represent the lower and upper 25% data values, with the endpoints of whiskers being the minimum and maximum data value, respectively. The boxes represent the middle 50% data values, and the boundary between the two boxes represents the median data value. When comparing Figure 2 with Figure 3, it is observed that by applying the HASRA algorithm, the overall outlet temperature for all scheduling algorithms is reduced. This is because hotter S B servers are relocated in the cooler regions of the data center, resulting in reduced outlet temperature. When comparing power consumption after server relocation, it is observed that the overall power consumption is slightly reduced while using TASA and HAWDA. This is because after applying HASRA, S B servers are relocated to the cooler region, resulting in increasing utilization of S B servers, whereas relocating S A servers to the hotter regions results in decreasing utilization of S A servers as seen in Figure 2c and Figure 3c. There is a negligible effect of HASRA on GRANITE, as GRANITE is temperature agnostic.

6. Discussion

In this section, we simulate Alibaba cloud workload for 25 h using the workload scheduling algorithms considered in this paper and compare these scheduling algorithms based on total computing capacity utilization, peak outlet temperature, and energy consumption.

6.1. Computing Capacity Utilization

Table 5 shows the maximum possible combined computing power utilization of all servers in terms of gross GHz available for each scheduling algorithm for the given workload. The total capacity of the data center is 1641.7 GHz. HAWDA and HAWDA+HASRA algorithms use the maximum computing capacity with minimum peak outlet temperature. This is because HAWDA schedules more workload on S A servers having higher clock speed than that of SB servers. Therefore, HAWDA provisions more computing capacity at lower outlet temperatures.

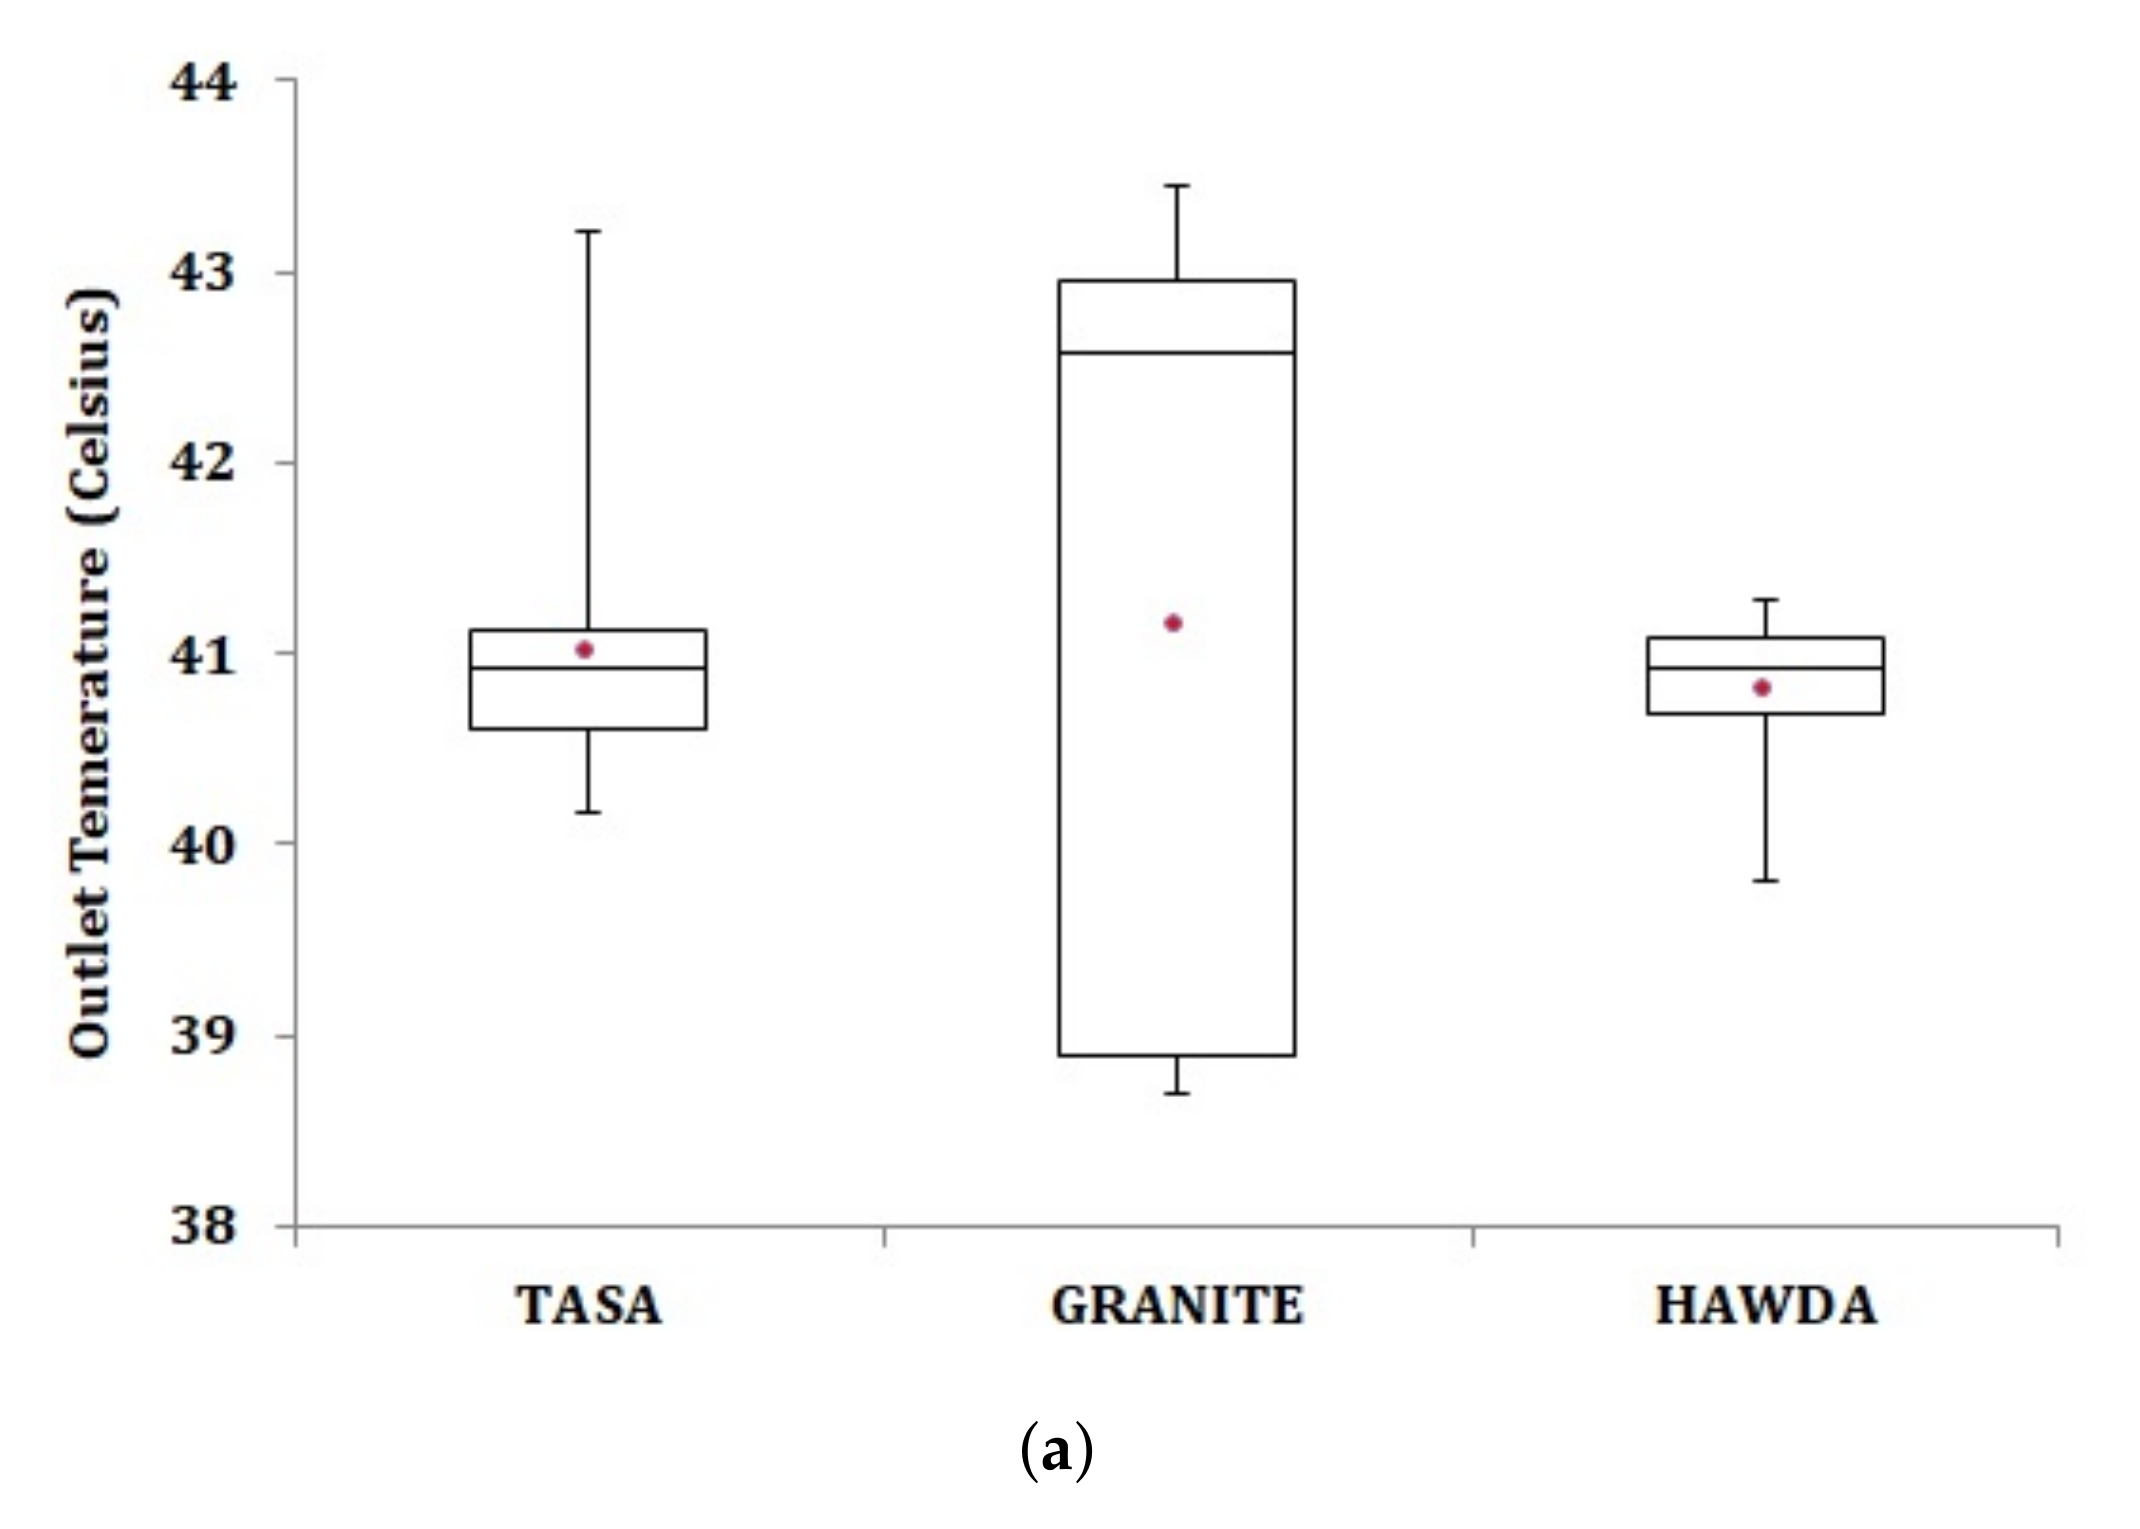
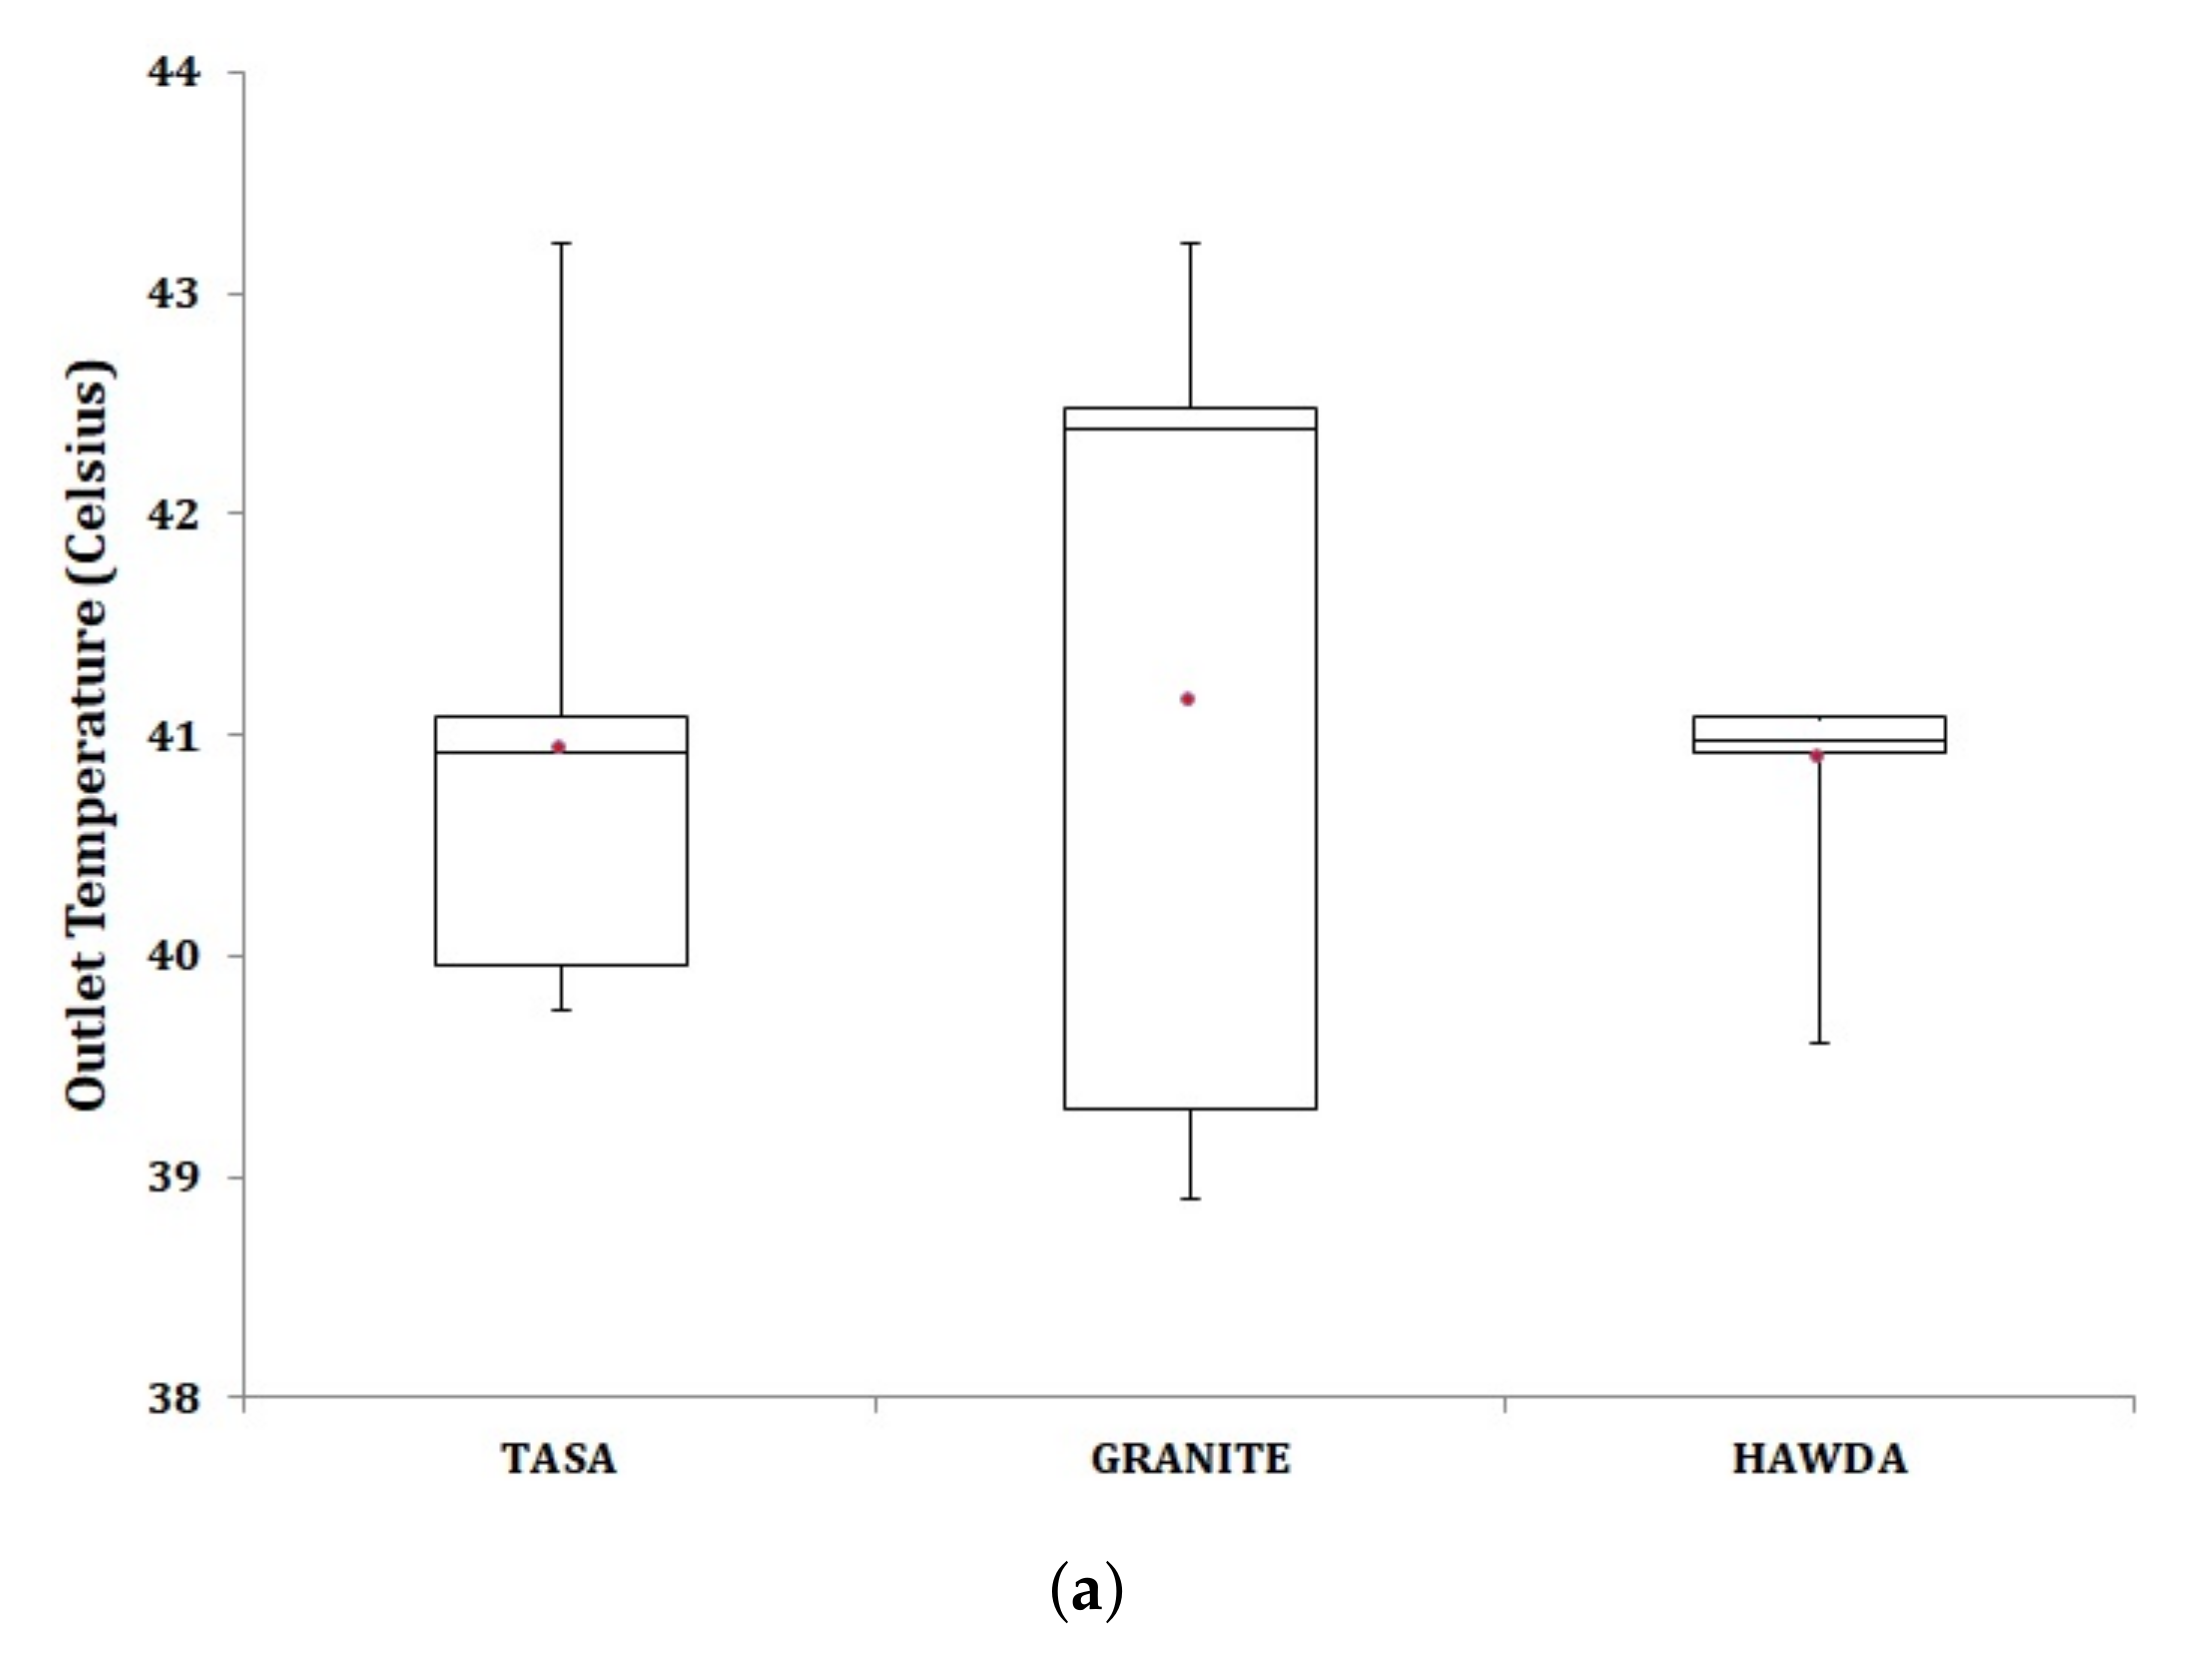
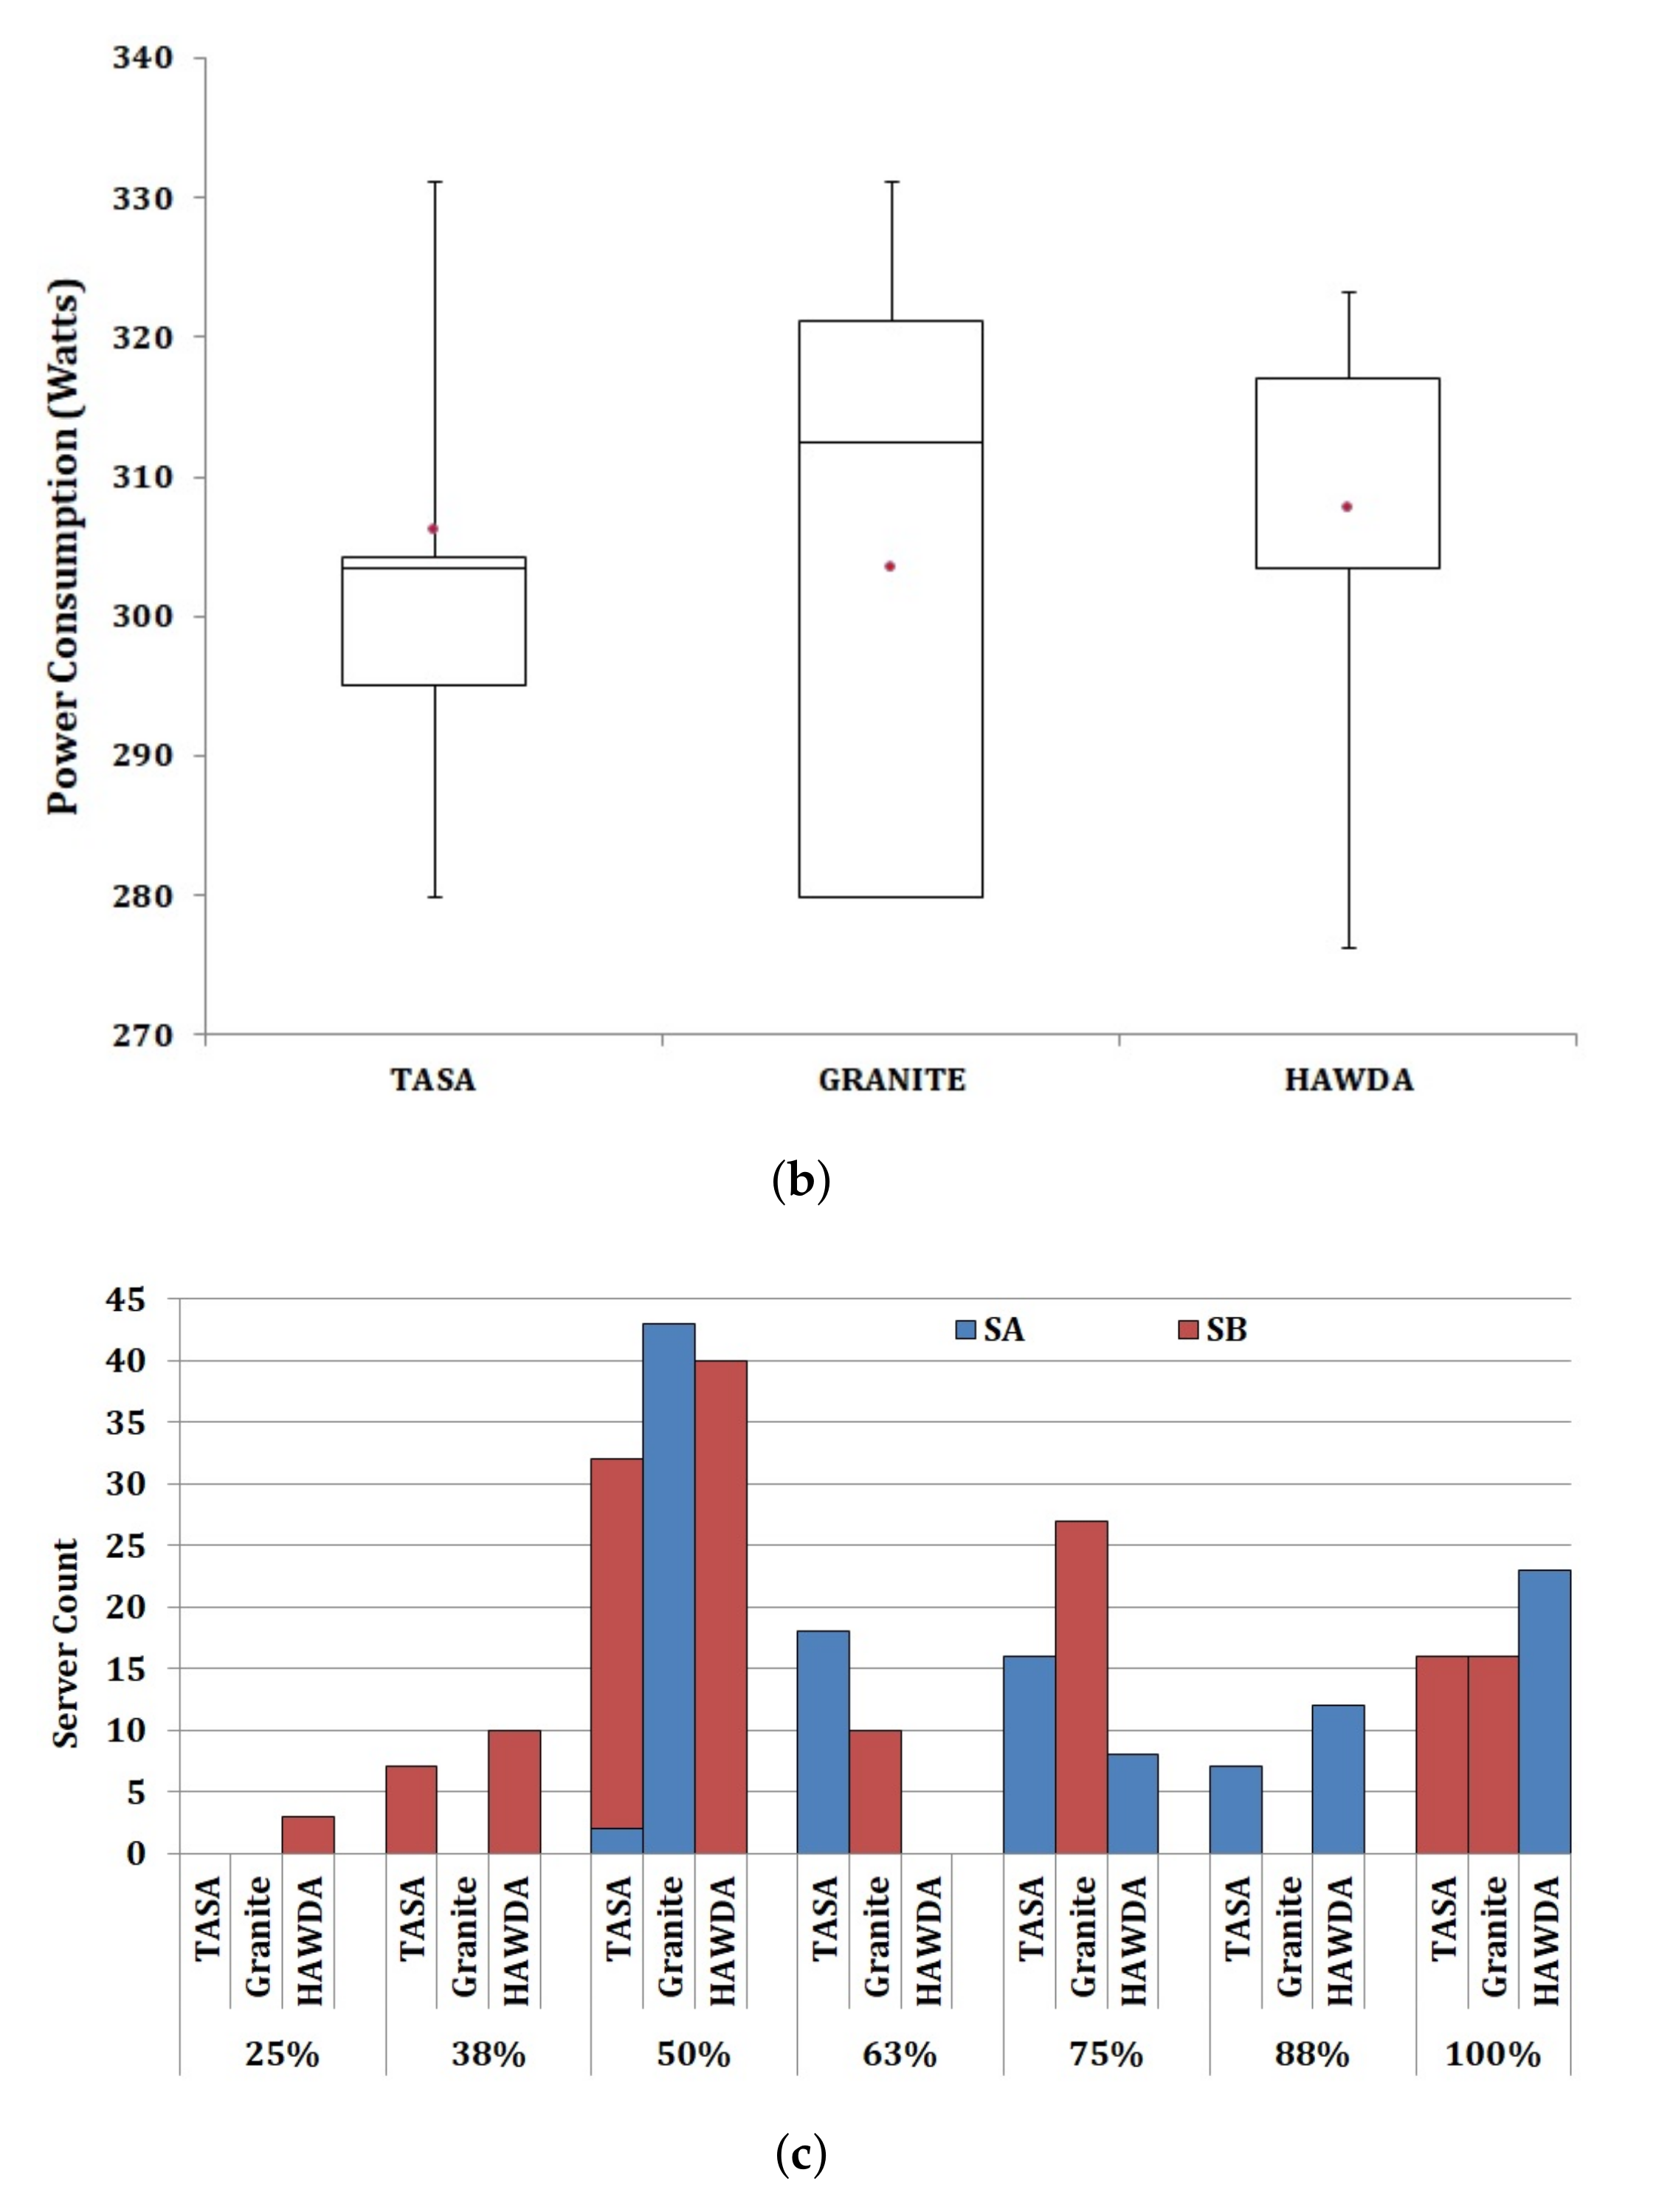
6.2. Peak Outlet Temperature

It is highly desirable that there should be no thermal hotspots, but ideal situations do not always exist. Because thermal hotspots (in terms of heat recirculation) may occur due to the peak outlet temperature of the servers, to resist the thermal hotspot conditions, it is most desirable that the T m a x be lowered. Figure 4a,b show the peak outlet temperature (maximum outlet temperature from all the servers) for each workload scheduling algorithm before and after server relocation. As GRANITE is not thermal-aware (not sensitive to T r e c e i v e d i of the server), the deployment of VM batches to servers brings about more hot air from the servers and increase the chances of high inlet temperatures due to heat recirculation and burden on the cooling mechanism as well. Due to the reactive nature of TASA, the workload is deployed on a cooler server without considering if that workload will increase the outlet temperature of the server, leading to heat recirculation. TASA and GRANITE have a similar peak outlet temperature as compared to HAWDA, which is thermal hotspot aware and sensitive to T r e c e i v e d i of the server based on T P M O i . The advantage of this combined approach of server relocation (HASRA) and workload scheduling (HAWDA) is the decrease in peak outlet temperature by more than one degree celsius.
The time of the day can also affect the peak outlet temperature and cooling power consumption inside the data center facility; e.g., during the daytime, solar radiation may lead to heat propagation inside the data center facility, leading to higher peak outlet temperature resulting in higher cooling energy. This phenomenon is observed in Figure 4a,b between 630 and 1170 min, where a higher peak outlet temperature is observed.

6.3. Heat Flow from Servers

It is worth noting that the workload scheduling based on heat flow calculation may not be as fruitful as the inlet temperature ( T r e c e i v e d i ) based workload scheduling model used in this paper. This is because the amount of heat Q i flowing through a server i is represented by
Q i = p f i C p T Δ i
where p is the density of air (typically 1.19 kg/m 3 ), f i is the airflow rate inside server i (at 520 CFM or 0.2454 m 3 /s), and C p is the specific heat of air (normally 1.005 J Kg 1 K 1 ) [33]. If the value of p f i C p is considered to be constant, then it is evident from Equation (10) that the higher the value of T Δ i the higher is the heat impact on the cooling system. This is independent of the location of the server because the power consumption of the server remains the same at any location. Therefore, Equation (10) will calculate similar heat for two homogeneous or heterogeneous servers at similar utilization levels but receiving the cold air at different temperatures. Hence it is better to use the inlet temperature as a reference for modeling the workload scheduler as proposed in this paper. Following are some limitations of our workload scheduling model:
i.
We consider that the heat discharged from the server does not flow back into the server,
ii.
The heat generated by the memory, disk, and the motherboard is negligible, and
iii.
We consider that no external factor contributes to heat propagation in the data center facility.

6.4. Energy Consumption

The amount of cooling energy spent on a server can be calculated regarding the power being consumed by that server and the coefficient of performance (COP) of the inlet temperature [13], where COP is the amount of work done to remove the amount of heat dissipated by server i and is calculated using Equation (11):
C O P ( T ) = 0.0068 T 2 + 0.0008 T + 0.458
It can be noted that the higher the inlet temperature, the higher will be the wastage of cooling energy because the energy spent to cool down the air at T s e t is higher than T r e c e i v e d if the latter value is larger than the former value. As the rise in inlet temperature leads to a corresponding rise in outlet temperature, the corresponding outlet air temperature for each server with T r e c e i v e d > T s e t will be an added burden on CRAC. Hence, the cooling energy wasted for each server with reference to T r e c e i v e d and T s e t at energy consumption E c o m p u t i n g i for server i with T r e c e i v e d > T s e t can be calculated as (12)
E c o o l i n g _ w a s t e d _ i n l e t i = E c o m p u t i n g i C O P ( T s e t ) E c o m p u t i n g i C O P ( T r e c e i v e d )
Table 6 and Table 7 show the statistics of computing energy and cooling energy for the 25 h simulation of workload execution. The value of T s e t is considered to be 22.9 °C. Column 2 shows the total energy consumed (in KWh) over 25 h; columns 3 to 6 show the minimum, maximum, average, and standard deviation of energy consumed per minute (in Watts), respectively. It can be seen from Table 6 that there is not much difference in energy consumption across each workload scheduling algorithm. For TASA, a minor decrease in energy consumption is observed after server relocation as compared to before server relocation. However, for HAWDA, a minor increase in energy consumption is observed after server relocation as compared to before server relocation. This is because HAWDA schedules more workload on S A servers (higher computing capacity provisioning due to higher clock speed), which after relocation have been moved to the hotter region. Moreover, for GRANITE, there is no change, as GRANITE is not thermal-aware and schedules the VMs on the same machines after server relocation as scheduled before server relocation. Because GRANITE schedules more VMs on S B servers, which were in hotter regions before relocation, a decrease in cooling energy for GRANITE is observed in Table 7. Hence, before and after server relocation, HAWDA helps reduce the peak outlet temperature significantly without a notable increase in computation energy and additional load on the cooling mechanism.

7. Conclusions and Future Work

This paper shows the importance of spatio-thermal consideration for workload scheduling across data center servers, including servers affected by thermal hotspots. When allocating workload batches, the location and outlet temperature of the server should be considered to resist the thermal hotspots. A useful tool for the implementation of such an approach is a thermal-profile-based outlet temperature prediction. Scheduling approaches such as GRANITE that are not thermal-aware may lead to elevating the utilization of servers that generate more heat and thus result in the generation of higher maximum outlet temperatures. A reactive approach like TASA can lead to assigning workload on servers that generate more heat but are in the cooler regions, resulting in higher peak outlet temperatures. A more flexible approach is the hotspot-resistant workload scheduling algorithm HAWDA, proposed in this paper, which can significantly reduce the maximum peak outlet temperature while ensuring performance in servers with high inlet temperatures through the adaptive allocation of workload. The servers that are left underutilized for being prone to thermal hotspot conditions can be relocated according to the hotspot-aware server relocation algorithm HASRA, presented in this paper, to complement HAWDA. As shown in this paper, the combined approach provides the same level of average peak utilization of the servers as GRANITE and TASA without causing an additional burden on the cooling mechanism, as the peak outlet temperature of HAWDA is much lower. For more realistic results, in the future we intend to make associations with practical computation workloads of an already tested calculation (atomic relaxations of a structured lattice), which needs a particular time to a specific computing configuration using the resource allocation algorithms TASA, GRANITE, and HAWDA, with and without HASRA and consider the associated energy consumption for computation, the cooling system concerning the outside temperature, etc.

Author Contributions

Conceptualization, M.H.J. and M.T.C.; data curation, M.H.J. and M.T.C.; formal analysis, M.H.J. and I.A.; funding acquisition, S.H.; investigation, U.T. and F.R.; methodology, U.T. and F.R.; project administration, F.R.; resources, S.H.; supervision, I.A.; validation, U.T.; visualization, S.H.; writing—original draft, M.T.C.; writing—review and editing, I.A. All authors have read and agreed to the published version of the manuscript.

Funding

This research was supported by Basic Science Research Program through the National Research Foundation of Korea(NRF) funded by the Ministry of Education(NRF-2021R1A6A1A03039493).

Institutional Review Board Statement

Not applicable.

Informed Consent Statement

Not applicable.

Data Availability Statement

Not applicable.

Conflicts of Interest

The authors declare that there are no conflict of interest.

References

  1. Khalaj, A.H.; Scherer, T.; Halgamuge, S.K. Energy, environmental and economical saving potential of data centers with various economizers across Australia. Appl. Energy 2016, 183, 1528–1549. [Google Scholar] [CrossRef]
  2. Ni, J.; Bai, X. A review of air conditioning energy performance in data centers. Renew. Sustain. Energy Rev. 2017, 67, 625–640. [Google Scholar] [CrossRef]
  3. Li, X.; Jiang, X.; Garraghan, P.; Wu, Z. Holistic energy and failure aware workload scheduling in Cloud datacenters. Future Gener. Comput. Syst. 2018, 78, 887–900. [Google Scholar] [CrossRef] [Green Version]
  4. Chen, Y.; Gmach, D.; Hyser, C.; Wang, Z.; Bash, C.; Hoover, C.; Singhal, S. Integrated management of application performance, power and cooling in data centers. In Proceedings of the 2010 IEEE Network Operations and Management Symposium-NOMS 2010, Osaka, Japan, 19–23 April 2010; pp. 615–622. [Google Scholar]
  5. Yang, B.; Hamann, H.; Kephart, J.; Barabasi, S. Hotspot diagnosis on logical level. In Proceedings of the 2011 7th International Conference on Network and Service Management, Paris, France, 24–28 October 2011; pp. 1–5. [Google Scholar]
  6. Tang, Q.; Gupta, S.K.; Varsamopoulos, G. Thermal-aware task scheduling for data centers through minimizing heat recirculation. In Proceedings of the 2007 IEEE International Conference on Cluster Computing, Austin, TX, USA, 17–20 September 2007; pp. 129–138. [Google Scholar]
  7. Lee, E.K.; Kulkarni, I.; Pompili, D.; Parashar, M. Proactive thermal management in green datacenters. J. Supercomput. 2012, 60, 165–195. [Google Scholar] [CrossRef]
  8. Artman, P.; Moss, D.; Bennett, G. Dell™ Power-Edge™ 1650: Rack Impacts on Cooling for High Density Servers. 2002. Available online: http://www.dell.com/downloads/global/products/pedge/en/rack_coolingdense.doc (accessed on 22 December 2021).
  9. Banerjee, A.; Mukherjee, T.; Varsamopoulos, G.; Gupta, S.K. Cooling-aware and thermal-aware workload placement for green HPC data centers. In Proceedings of the International Conference on Green Computing, Chicago, IL, USA, 15–18 August 2010; pp. 245–256. [Google Scholar]
  10. Barroso, L.A.; Hölzle, U. The case for energy-proportional computing. Computer 2007, 40, 33–37. [Google Scholar] [CrossRef]
  11. Fan, X.; Weber, W.D.; Barroso, L.A. Power provisioning for a warehouse-sized computer. ACM SIGARCH Comput. Archit. News 2007, 35, 13–23. [Google Scholar] [CrossRef]
  12. Lefurgy, C.; Wang, X.; Ware, M. Server-level power control. In Proceedings of the 4th International Conference on Autonomic Computing (ICAC’07), Jacksonville, FL, USA, 11–15 June 2007; p. 4. [Google Scholar]
  13. Moore, J.D.; Chase, J.S.; Ranganathan, P.; Sharma, R.K. Making scheduling “Cool”: Temperature-aware workload placement in data centers. In Proceedings of the USENIX Annual Technical Conference, General Track, Marriot Anaheim, CA, USA, 10–15 April 2005; pp. 61–75. [Google Scholar]
  14. Chaudhry, M.T.; Chon, C.Y.; Ling, T.; Rasheed, S.; Kim, J. Thermal prediction models for virtualized data center servers by using thermal-profiles. Malays. J. Comput. Sci. 2016, 29, 1–14. [Google Scholar] [CrossRef]
  15. Wu, C.M.; Chang, R.S.; Chan, H.Y. A green energy-efficient scheduling algorithm using the DVFS technique for cloud datacenters. Future Gener. Comput. Syst. 2014, 37, 141–147. [Google Scholar] [CrossRef]
  16. McIntosh, S.; Kephart, J.O.; Lenchner, J.; Yang, B.; Feridun, M.; Nidd, M.; Tanner, A.; Barabasi, I. Semi-automated data center hotspot diagnosis. In Proceedings of the 2011 7th International Conference on Network and Service Management, Paris, France, 24–28 October 2011; pp. 1–7. [Google Scholar]
  17. Jonas, M.; Varsamopoulos, G.; Gupta, S.K. On developing a fast, cost-effective and non-invasive method to derive data center thermal maps. In Proceedings of the 2007 IEEE International Conference on Cluster Computing, Austin, TX, USA, 17–20 September 2007; pp. 474–475. [Google Scholar]
  18. Jonas, M.; Varsamopoulos, G.; Gupta, S.K. Non-invasive thermal modeling techniques using ambient sensors for greening data centers. In Proceedings of the 2010 39th International Conference on Parallel Processing Workshops, San Diego, CA, USA, 13–16 September 2010; pp. 453–460. [Google Scholar]
  19. Mukherjee, T.; Banerjee, A.; Varsamopoulos, G.; Gupta, S.K.; Rungta, S. Spatio-temporal thermal-aware job scheduling to minimize energy consumption in virtualized heterogeneous data centers. Comput. Netw. 2009, 53, 2888–2904. [Google Scholar] [CrossRef]
  20. Abbasi, Z.; Varsamopoulos, G.; Gupta, S.K. Thermal aware server provisioning and workload distribution for internet data centers. In Proceedings of the 19th ACM International Symposium on High Performance Distributed Computing, Chicago, IL, USA, 20–25 June 2010; pp. 130–141. [Google Scholar]
  21. Al-Qawasmeh, A.M.; Pasricha, S.; Maciejewski, A.A.; Siegel, H.J. Power and thermal-aware workload allocation in heterogeneous data centers. IEEE Trans. Comput. 2013, 64, 477–491. [Google Scholar] [CrossRef] [Green Version]
  22. Rodero, I.; Viswanathan, H.; Lee, E.K.; Gamell, M.; Pompili, D.; Parashar, M. Energy-efficient thermal-aware autonomic management of virtualized HPC cloud infrastructure. J. Grid Comput. 2012, 10, 447–473. [Google Scholar] [CrossRef]
  23. Zhang, S.; Chatha, K.S. Approximation algorithm for the temperature-aware scheduling problem. In Proceedings of the 2007 IEEE/ACM International Conference on Computer-Aided Design, San Jose, CA, USA, 4–8 November 2007; pp. 281–288. [Google Scholar]
  24. Kumar, M.R.V.; Raghunathan, S. Heterogeneity and thermal aware adaptive heuristics for energy efficient consolidation of virtual machines in infrastructure clouds. J. Comput. Syst. Sci. 2016, 82, 191–212. [Google Scholar] [CrossRef]
  25. Beloglazov, A.; Buyya, R. Optimal online deterministic algorithms and adaptive heuristics for energy and performance efficient dynamic consolidation of virtual machines in cloud data centers. Concurr. Comput. Pract. Exp. 2012, 24, 1397–1420. [Google Scholar] [CrossRef]
  26. Buyya, R.; Beloglazov, A.; Abawajy, J. Energy-efficient management of data center resources for cloud computing: A vision, architectural elements, and open challenges. arXiv 2010, arXiv:1006.0308. [Google Scholar]
  27. Nathani, A.; Chaudhary, S.; Somani, G. Policy based resource allocation in IaaS cloud. Future Gener. Comput. Syst. 2012, 28, 94–103. [Google Scholar] [CrossRef]
  28. Ahuja, N. Datacenter power savings through high ambient datacenter operation: CFD modeling study. In Proceedings of the 2012 28th Annual IEEE Semiconductor Thermal Measurement and Management Symposium (SEMI-THERM), San Jose, CA, USA, 18–22 March 2012; pp. 104–107. [Google Scholar]
  29. Rodero, I.; Lee, E.K.; Pompili, D.; Parashar, M.; Gamell, M.; Figueiredo, R.J. Towards energy-efficient reactive thermal management in instrumented datacenters. In Proceedings of the 2010 11th IEEE/ACM International Conference on Grid Computing, Brussels, Belgium, 25–28 October 2010; pp. 321–328. [Google Scholar]
  30. Banerjee, A.; Mukherjee, T.; Varsamopoulos, G.; Gupta, S.K. Integrating cooling awareness with thermal aware workload placement for HPC data centers. Sustain. Comput. Informatics Syst. 2011, 1, 134–150. [Google Scholar] [CrossRef]
  31. Wang, L.; von Laszewski, G.; Dayal, J.; Furlani, T.R. Thermal aware workload scheduling with backfilling for green data centers. In Proceedings of the 2009 IEEE 28th International Performance Computing and Communications Conference, Scottsdale, AZ, USA, 14–16 December 2009; pp. 289–296. [Google Scholar]
  32. Wang, L.; von Laszewski, G.; Dayal, J.; He, X.; Younge, A.J.; Furlani, T.R. Towards thermal aware workload scheduling in a data center. In Proceedings of the 2009 10th International Symposium on Pervasive Systems, Algorithms, and Networks, Kaoshiung, Taiwan, 14–16 December 2009; pp. 116–122. [Google Scholar]
  33. Tang, Q.; Gupta, S.K.S.; Varsamopoulos, G. Energy-efficient thermal-aware task scheduling for homogeneous high-performance computing data centers: A cyber-physical approach. IEEE Trans. Parallel Distrib. Syst. 2008, 19, 1458–1472. [Google Scholar] [CrossRef]
  34. Wang, L.; Khan, S.U.; Dayal, J. Thermal aware workload placement with task-temperature profiles in a data center. J. Supercomput. 2012, 61, 780–803. [Google Scholar] [CrossRef]
  35. Wang, Z.; Bash, C.; Hoover, C.; McReynolds, A.; Felix, C.; Shih, R. Integrated management of cooling resources in air-cooled data centers. In Proceedings of the 2010 IEEE International Conference on Automation Science and Engineering, Toronto, ON, Canada, 21–24 August 2010; pp. 762–767. [Google Scholar]
  36. Li, X.; Garraghan, P.; Jiang, X.; Wu, Z.; Xu, J. Holistic virtual machine scheduling in cloud datacenters towards minimizing total energy. IEEE Trans. Parallel Distrib. Syst. 2017, 29, 1317–1331. [Google Scholar] [CrossRef] [Green Version]
  37. Ding, H. Alibaba Cluster Trace Program. 2018. Available online: https://github.com/alibaba/clusterdata/tree/v2018 (accessed on 22 December 2021).
Figure 1. Initial placement of servers in the data center and their inlet temperatures: (a) initial placement of SA and SB servers, and (b) inlet temperature of data center servers (°C).
Energies 15 02541 g001
Figure 2. Outlet temperature, power consumption, and percentage utilization of servers on deployment of all VM batches: (a) outlet temperature, (b) power consumption, and (c) percentage utilization of servers.
Energies 15 02541 g002aEnergies 15 02541 g002b
Figure 3. Outlet temperature, power consumption, and percentage utilization of servers on deployment of all VM batches after server relocation: (a) outlet temperature after server relocation, (b) power consumption after server relocation, and (c) percentage utilization of servers after server relocation.
Energies 15 02541 g003aEnergies 15 02541 g003b
Figure 4. Peak outlet temperature from all the servers for a 25 h simulation running Alibaba cloud workload: (a) before server relocation, and (b) after server relocation.
Energies 15 02541 g004aEnergies 15 02541 g004b
Table 1. A sample thermal profile of a server.
Server IDCPU Usage% (GHz)Net Increase in Outlet Temperature T Δ i ( ° C ) Power (Watt)Inlet Temperature T received i ( ° C )
S1IDLE (4.76)12.124223.7
33.3 (10.16)13.8274
66.6 (15.57)14.3295
100.0 (20.97)15.7320
Table 2. Specification of servers.
AttributesServer A (SA)Server B (SB)
Server makeHP ProLiantHP ProLiant
Processor typeIntel Xeon 5430Intel Xeon 5320
No. of processors22
No. of cores/processor44
Clock speed2.66 GHz1.86 GHz
Total processing power21.28 GHz14.88 GHz
HypervisorVMware ESXi 5.1VMware ESXi 5.1
HyperthreadingDisabledDisabled
Table 3. A sample thermal profile of a server.
Server IDCPU Utilization (%)Net Increase in Outlet Temperature T Δ i ( ° C ) Power (Watt)Inlet Temperature T received i ( ° C )
IDLE11.72203.44
12.512.43223.98
2513.22243.87
37.514.7265.5
SA5015.6279.82See Figure 1b
62.516.16295.03
7516.25304.16
87.517.17317.04
10017.58323.16
IDLE14.46231.78
12.515.24255.06
2516.3276.22
37.517.79290.64
SB5017.82303.49See Figure 1b
62.519.15312.51
7519.28321.19
87.519.62327.7
10020.12331.14
Table 4. Updated placement of servers after applying HASRA.
Server/Rack12345678
1AAAAAAAA
2AAAAAAAA
3BBAAAABB
4BBAAAABB
5BBAAAABB
6BBAAAABB
7BBBAABBB
8BBBAABBB
9BBBABABB
10BBBABBBB
11BBBABBBB
12BBBAAABB
Table 5. Computing capacity utilization.
AlgorithmUtilization (GHz)Utilization (%)
TASA1158.6870.6
GRANITE1046.4563.7
HAWDA1185.4872.2
TASA+HASRA1105.9167.4
GRANITE+HASRA1046.4563.7
HAWDA+HASRA1167.0571.1
Table 6. Computing energy consumed for 25 h workload execution.
Computation EnergyMinimumMaximumAverageStandard Deviation
(KWh)(W)(W)(W)(W)
TASA391.7045662.2137076.8636263.088275.942
GRANITE390.2505676.7137028.7616239.840252.557
HAWDA391.6915657.3477086.0496262.888275.016
TASA+HASRA391.6855672.5907083.1926262.791274.083
GRANITE+HASRA390.2505676.7137028.7616239.840252.557
HAWDA+HASRA391.7235656.8537094.0536263.389279.618
Table 7. Cooling energy consumed for 25 h workload execution.
Cooling EnergyMinimumMaximumAverageStandard Deviation
(KWh)(W)(W)(W)(W)
TASA14.238207.468255.949227.6609.453
GRANITE14.324208.727257.707229.0299.165
HAWDA14.217206.867255.741227.3159.389
TASA+HASRA14.175204.709259.007226.64910.590
GRANITE+HASRA13.720200.418248.842219.3748.991
HAWDA+HASRA14.224202.845261.198227.42711.396
Publisher’s Note: MDPI stays neutral with regard to jurisdictional claims in published maps and institutional affiliations.

