
Thermal Stability Calculation and Experimental Investigation of Common Binary Chloride Molten Salts Applied in Concentrating Solar Power Plants


Abstract
1. Introduction
2. Materials and Methods
2.1. Vapor Liquid Phase Equilibrium Thermodynamic Theory
2.2. Adiabatic Flash Calculation Theory
2.2.1. Adiabatic Flash Calculation


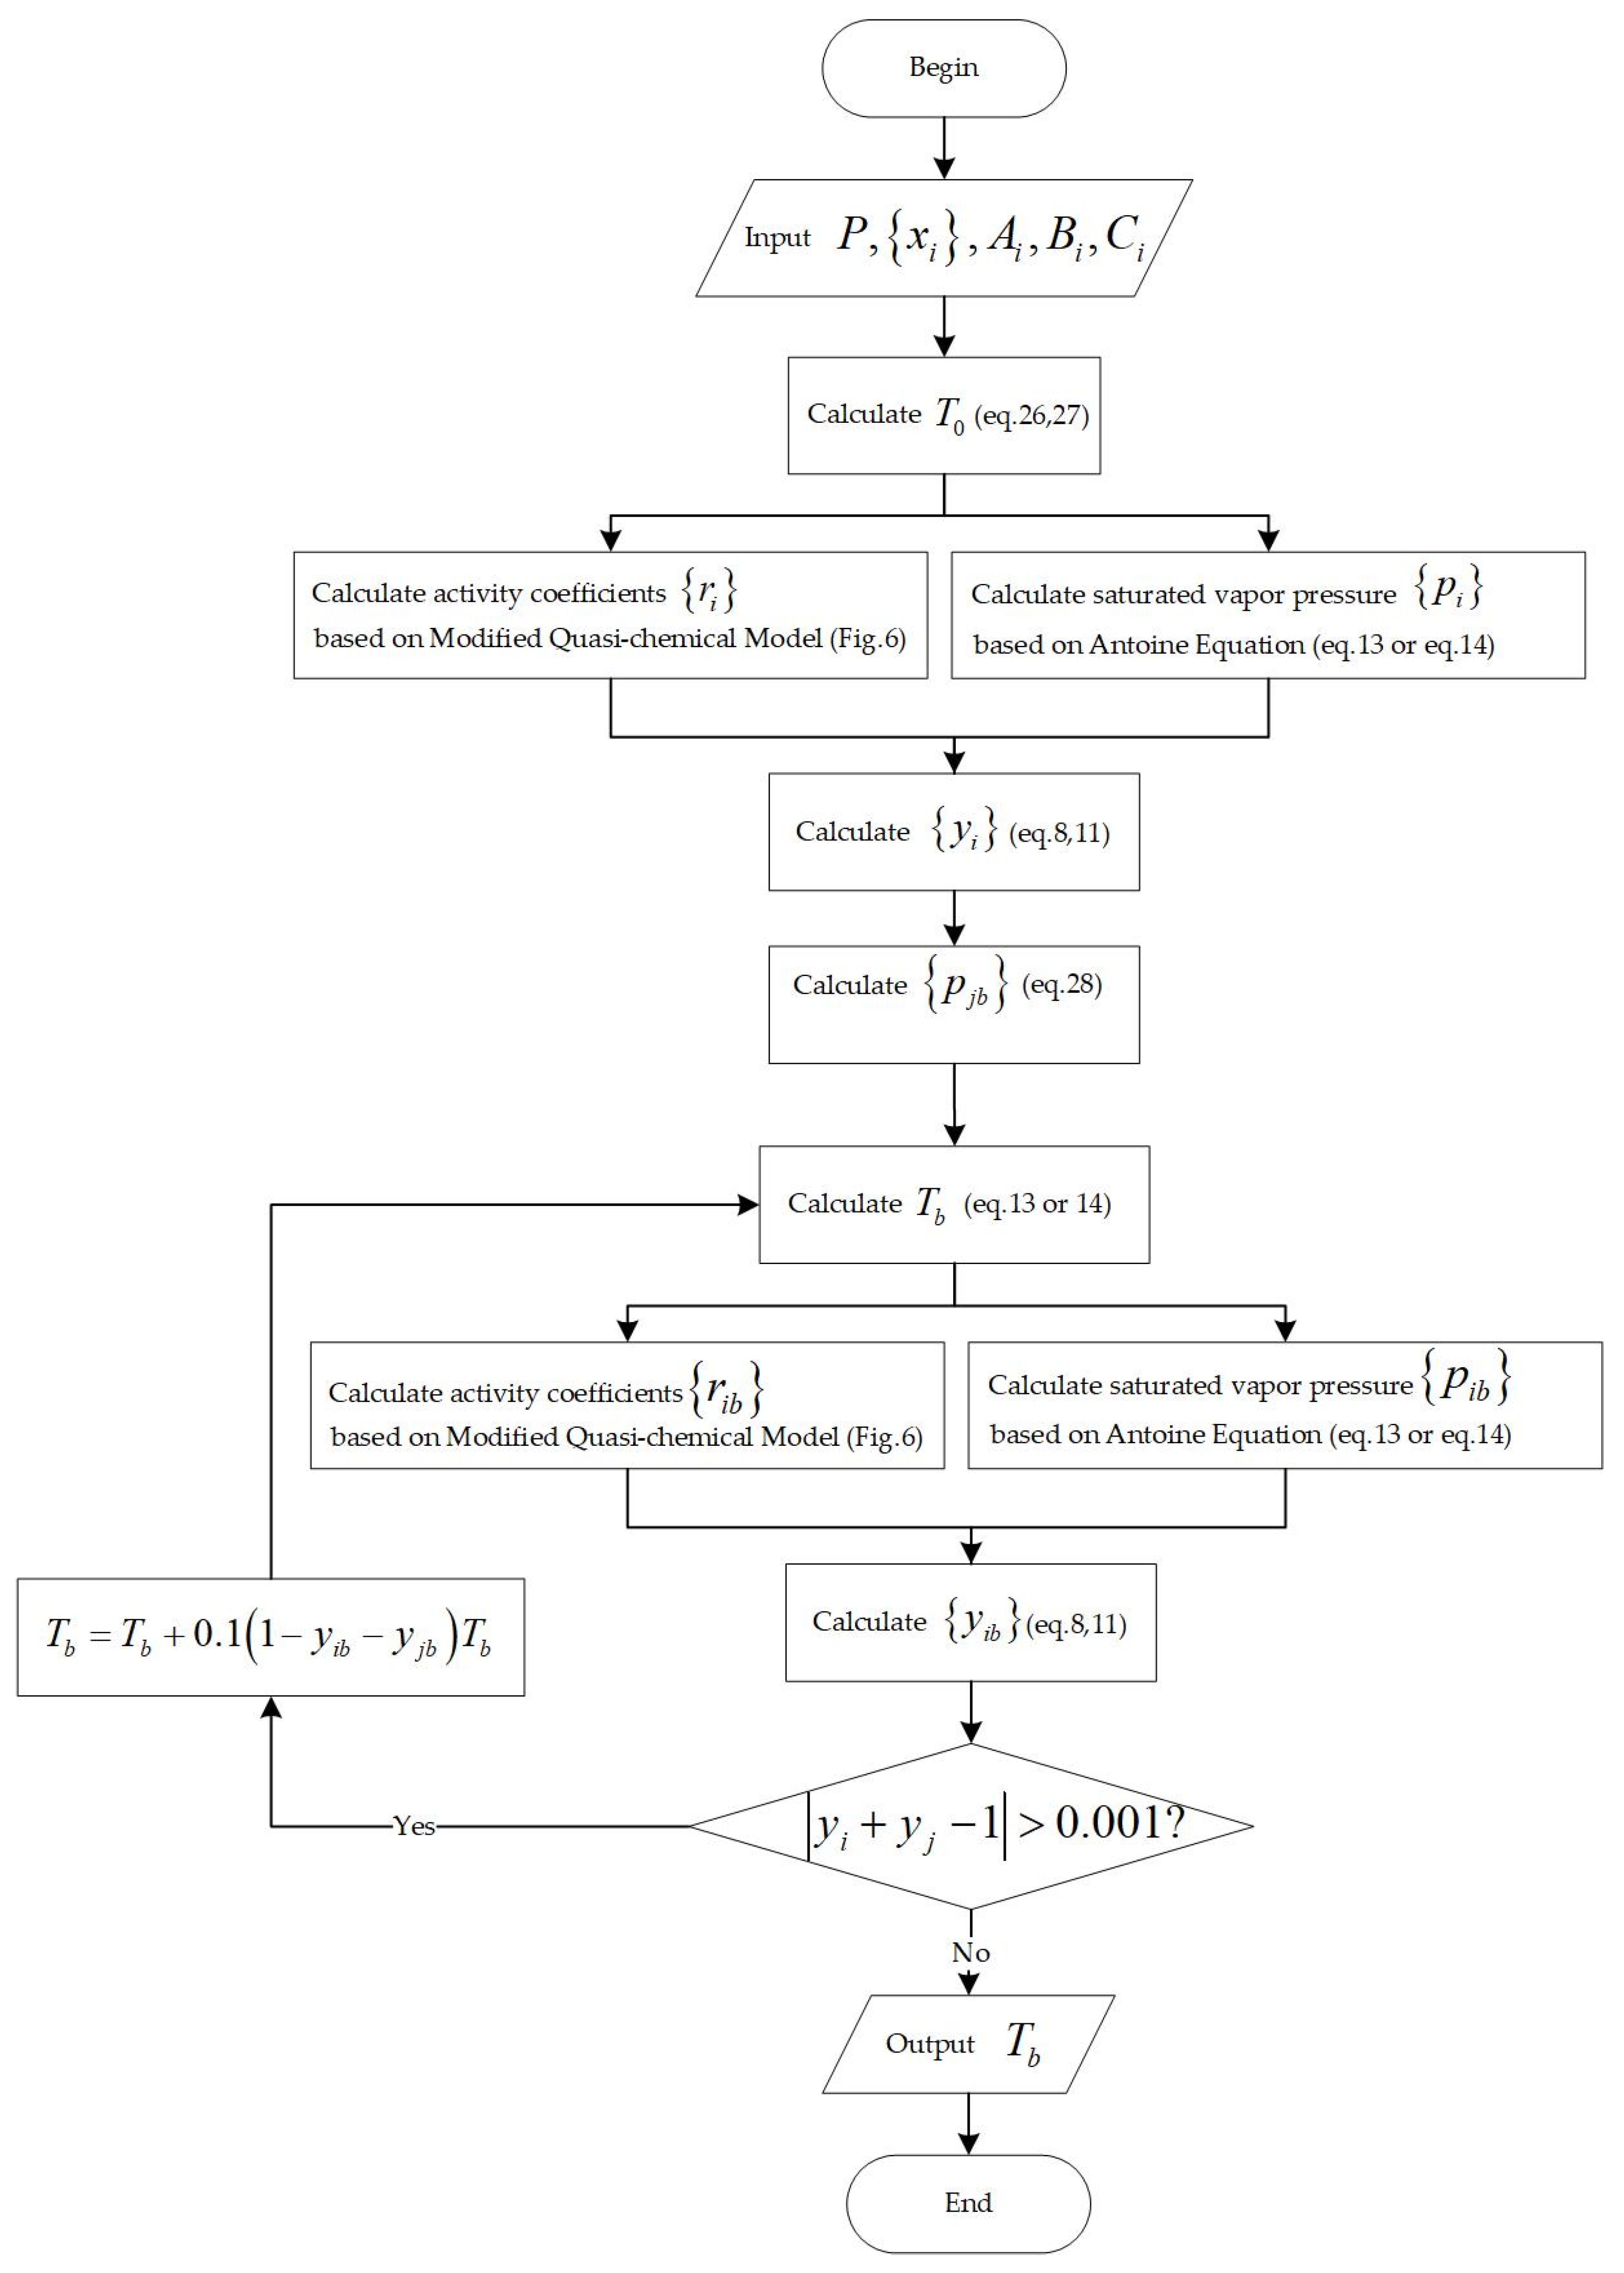
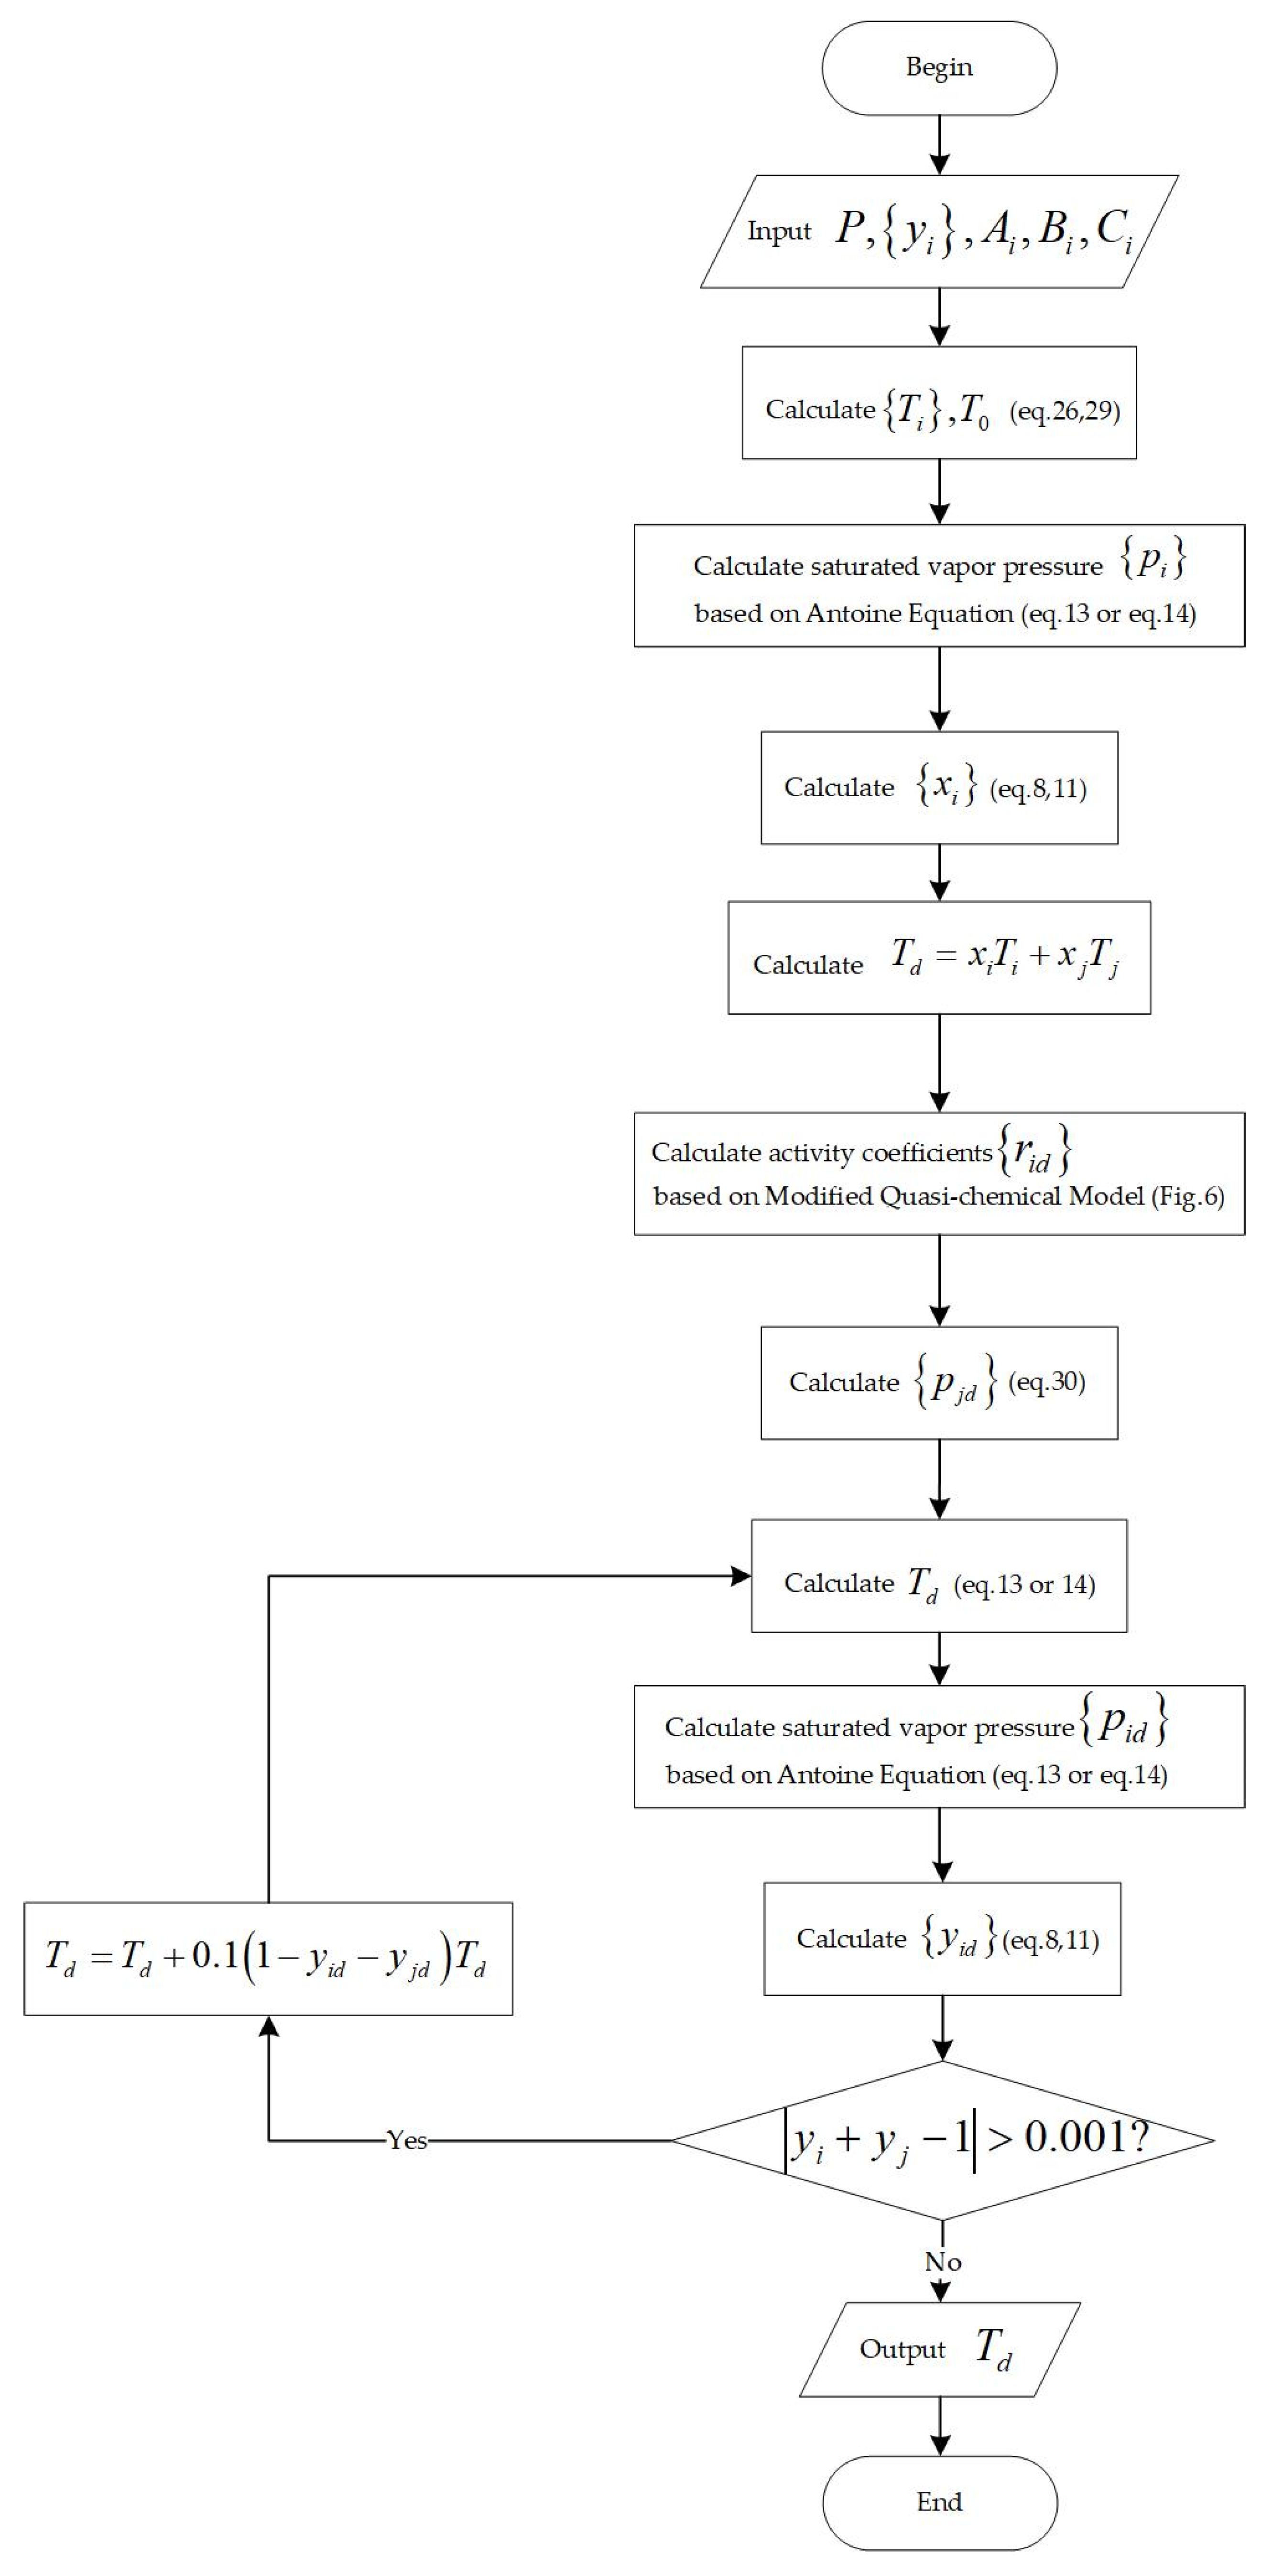
2.2.2. Bubble Point and Dew Point Temperature Calculation


2.2.3. Modified Quasi-Chemical Model
2.3. Materials and Synthesis
2.4. Measurements and Procedure
3. Results and Discussion
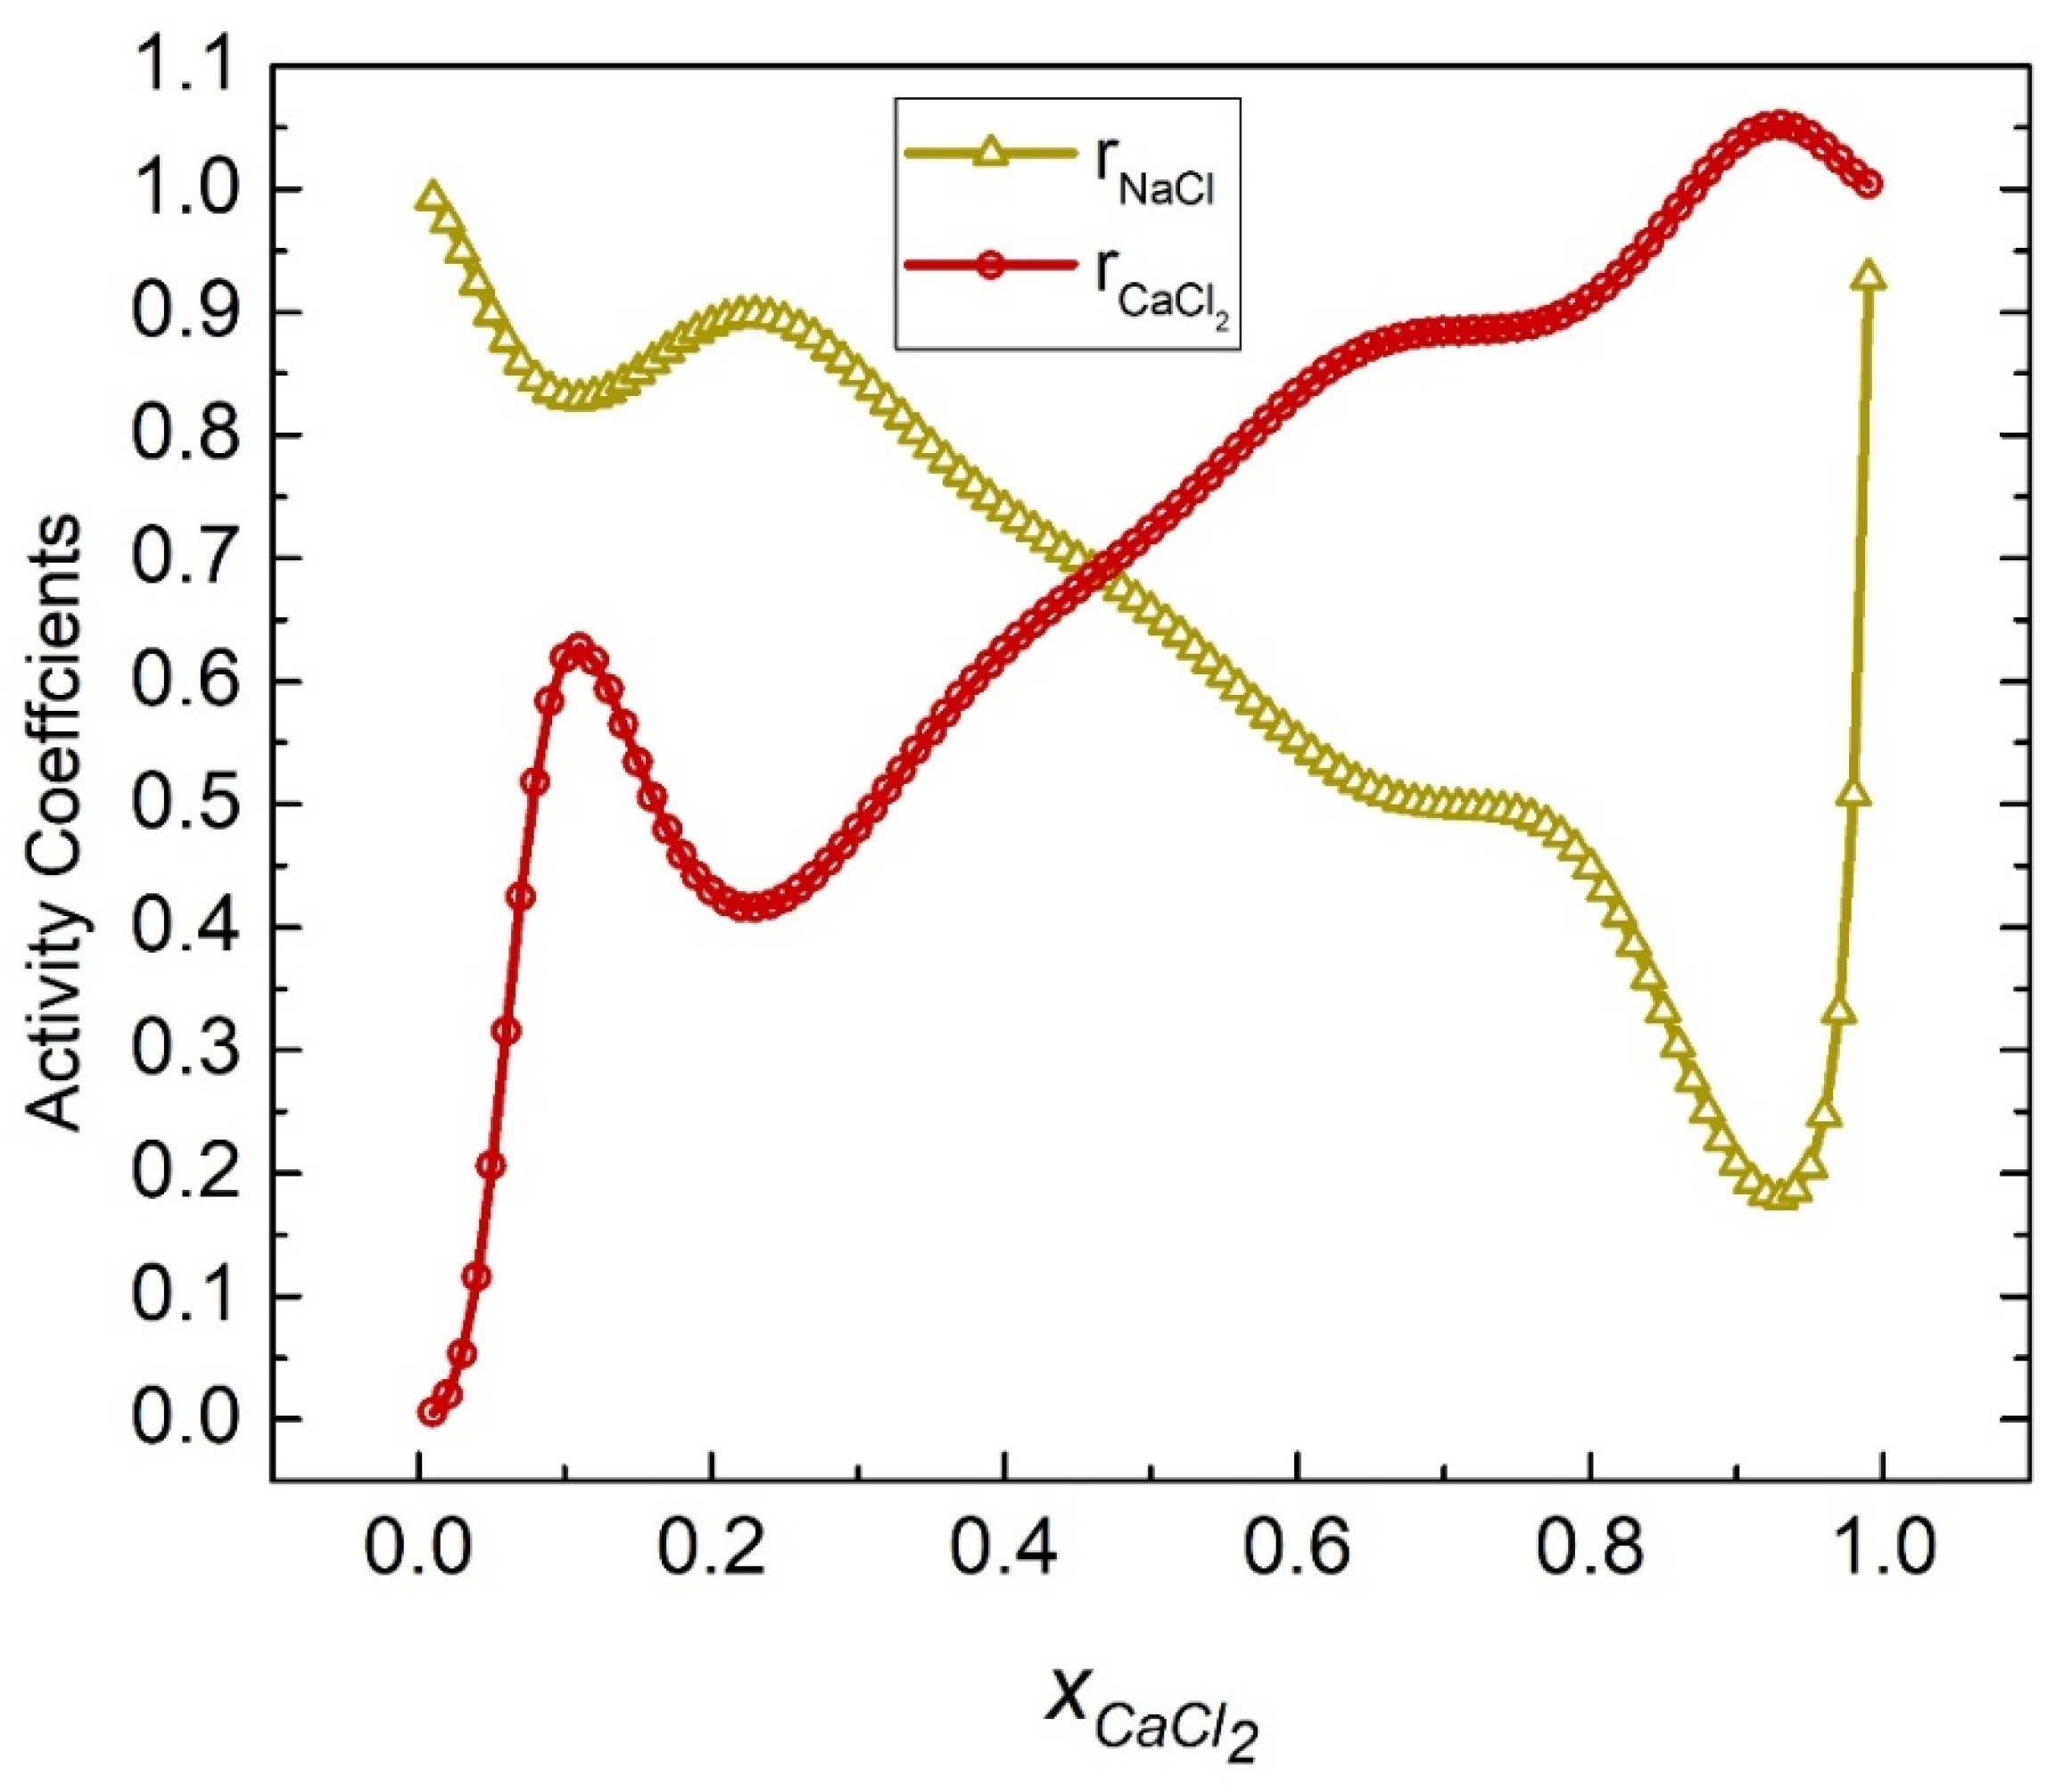
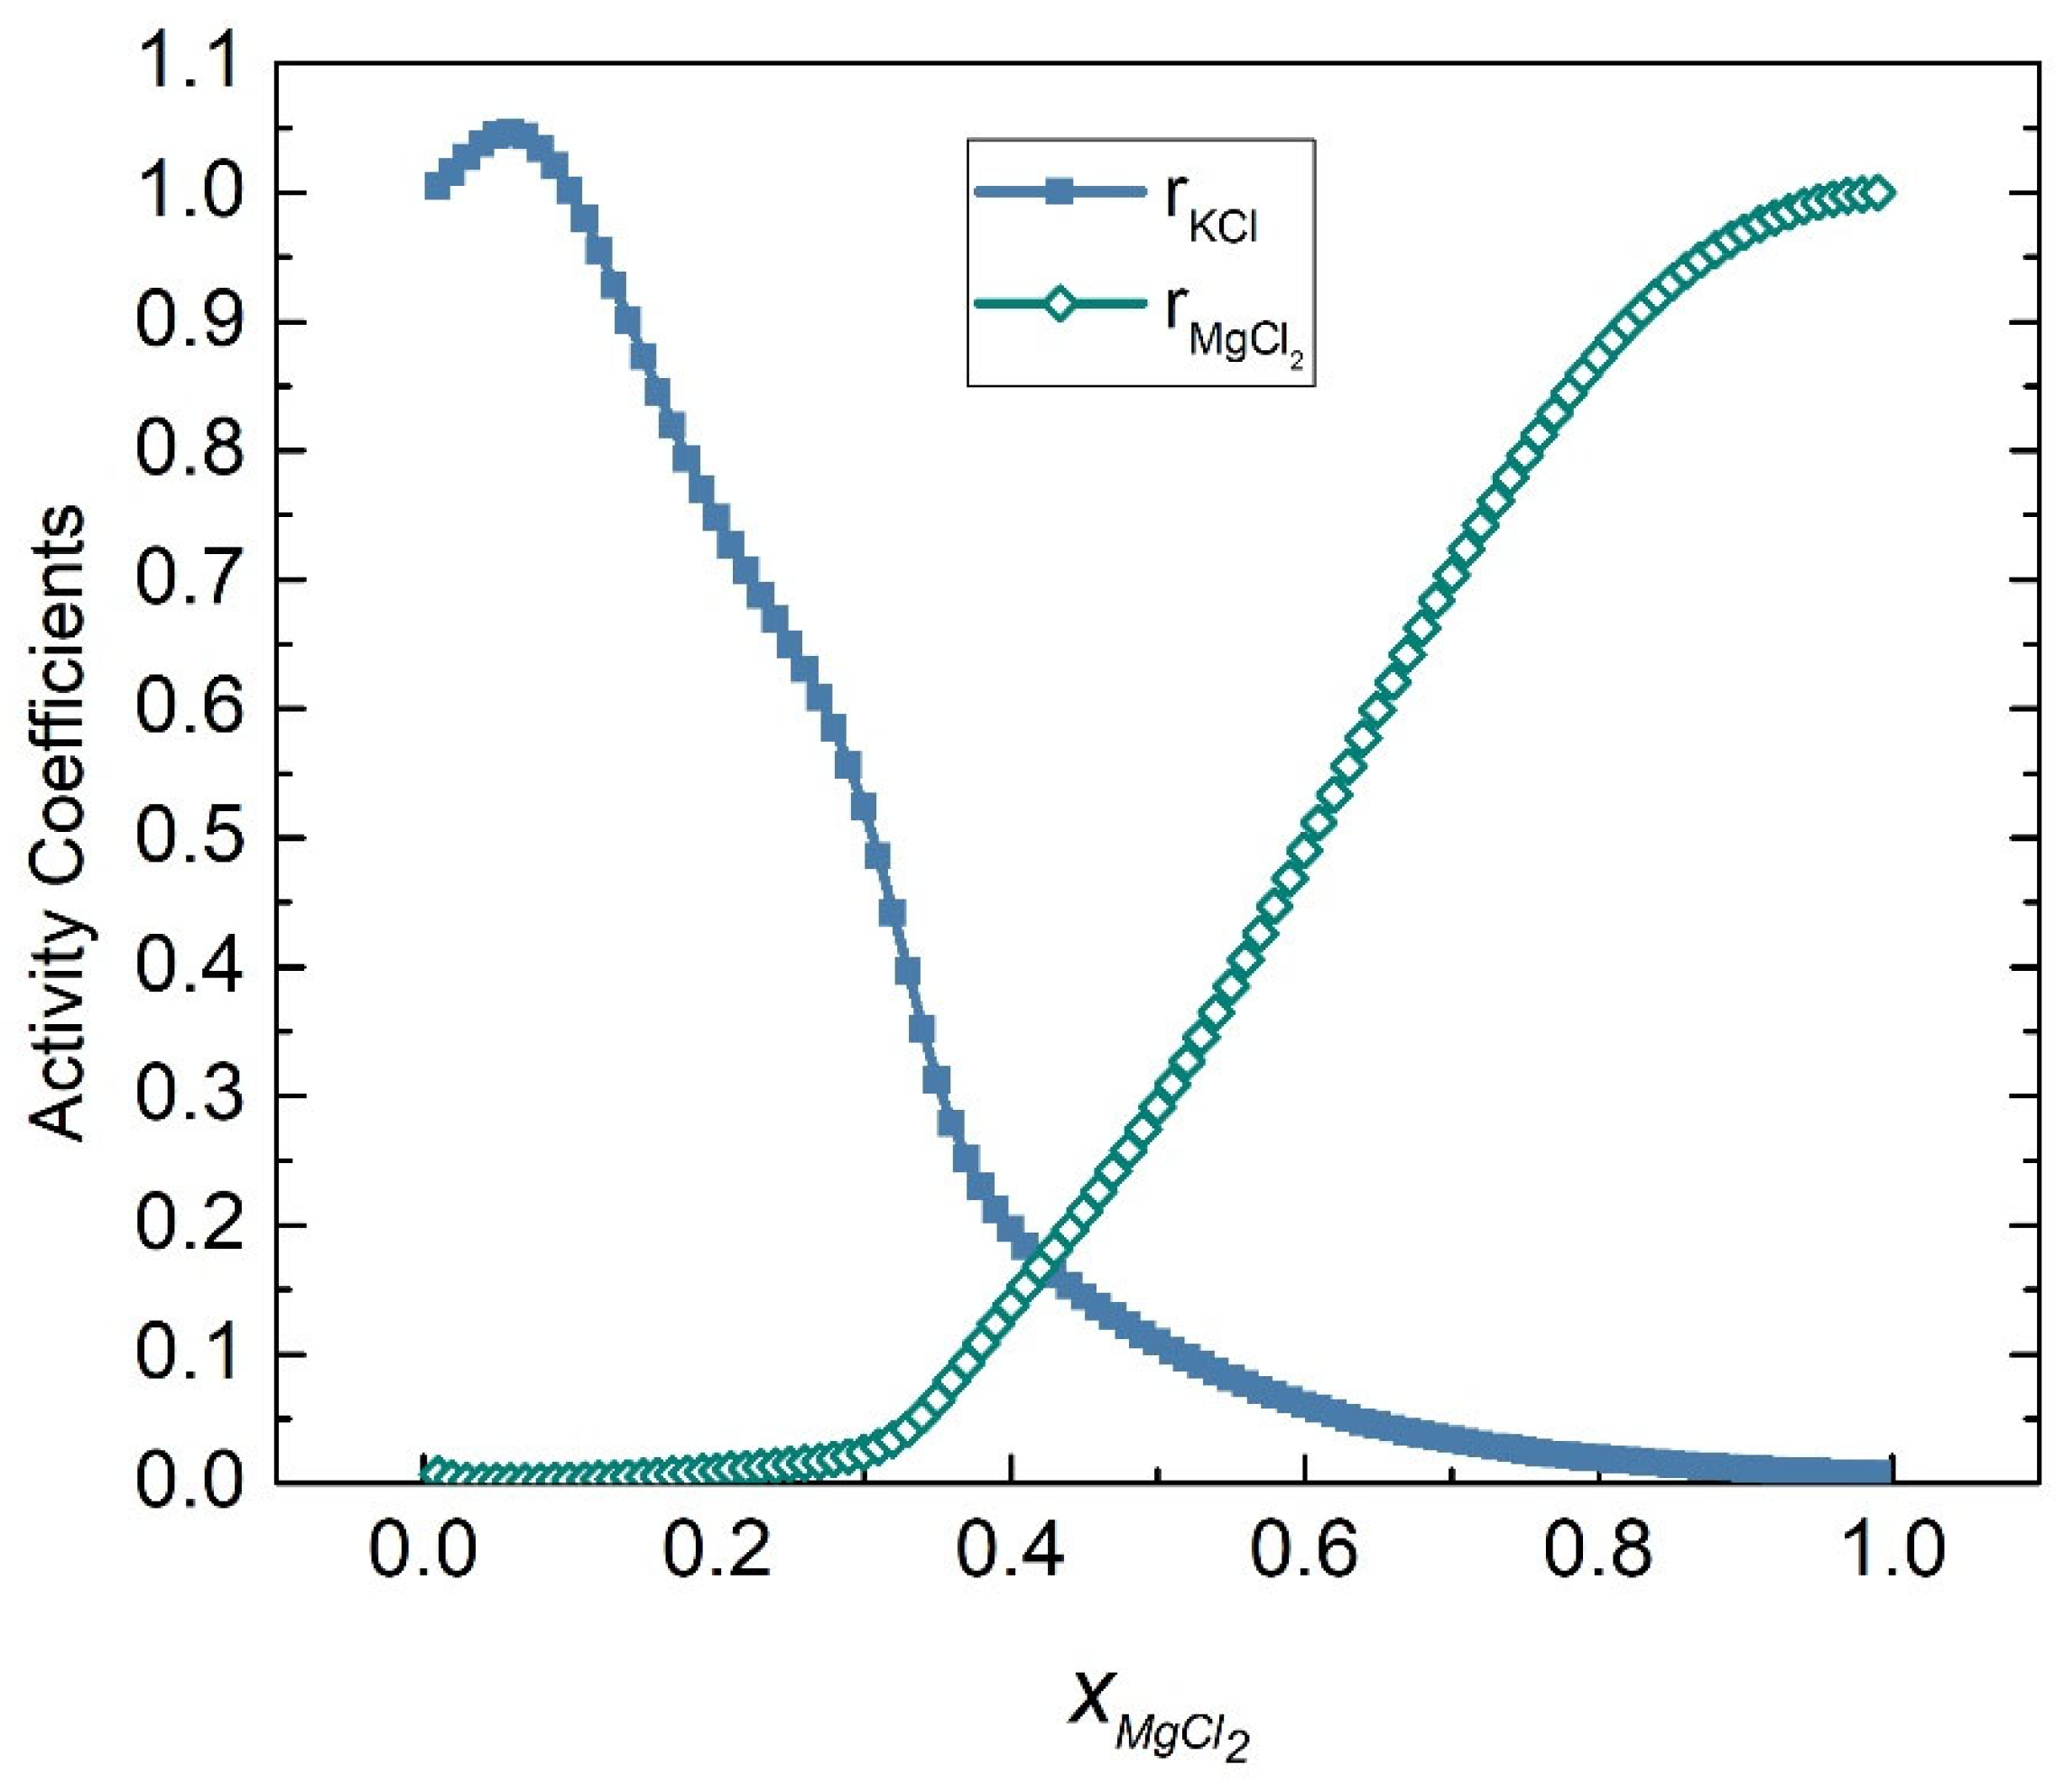
3.1. Verification of the Modified Quasi-Chemical Model in Binary Chloride Molten Salts System
3.2. Calculation of the P-T Phase Diagram
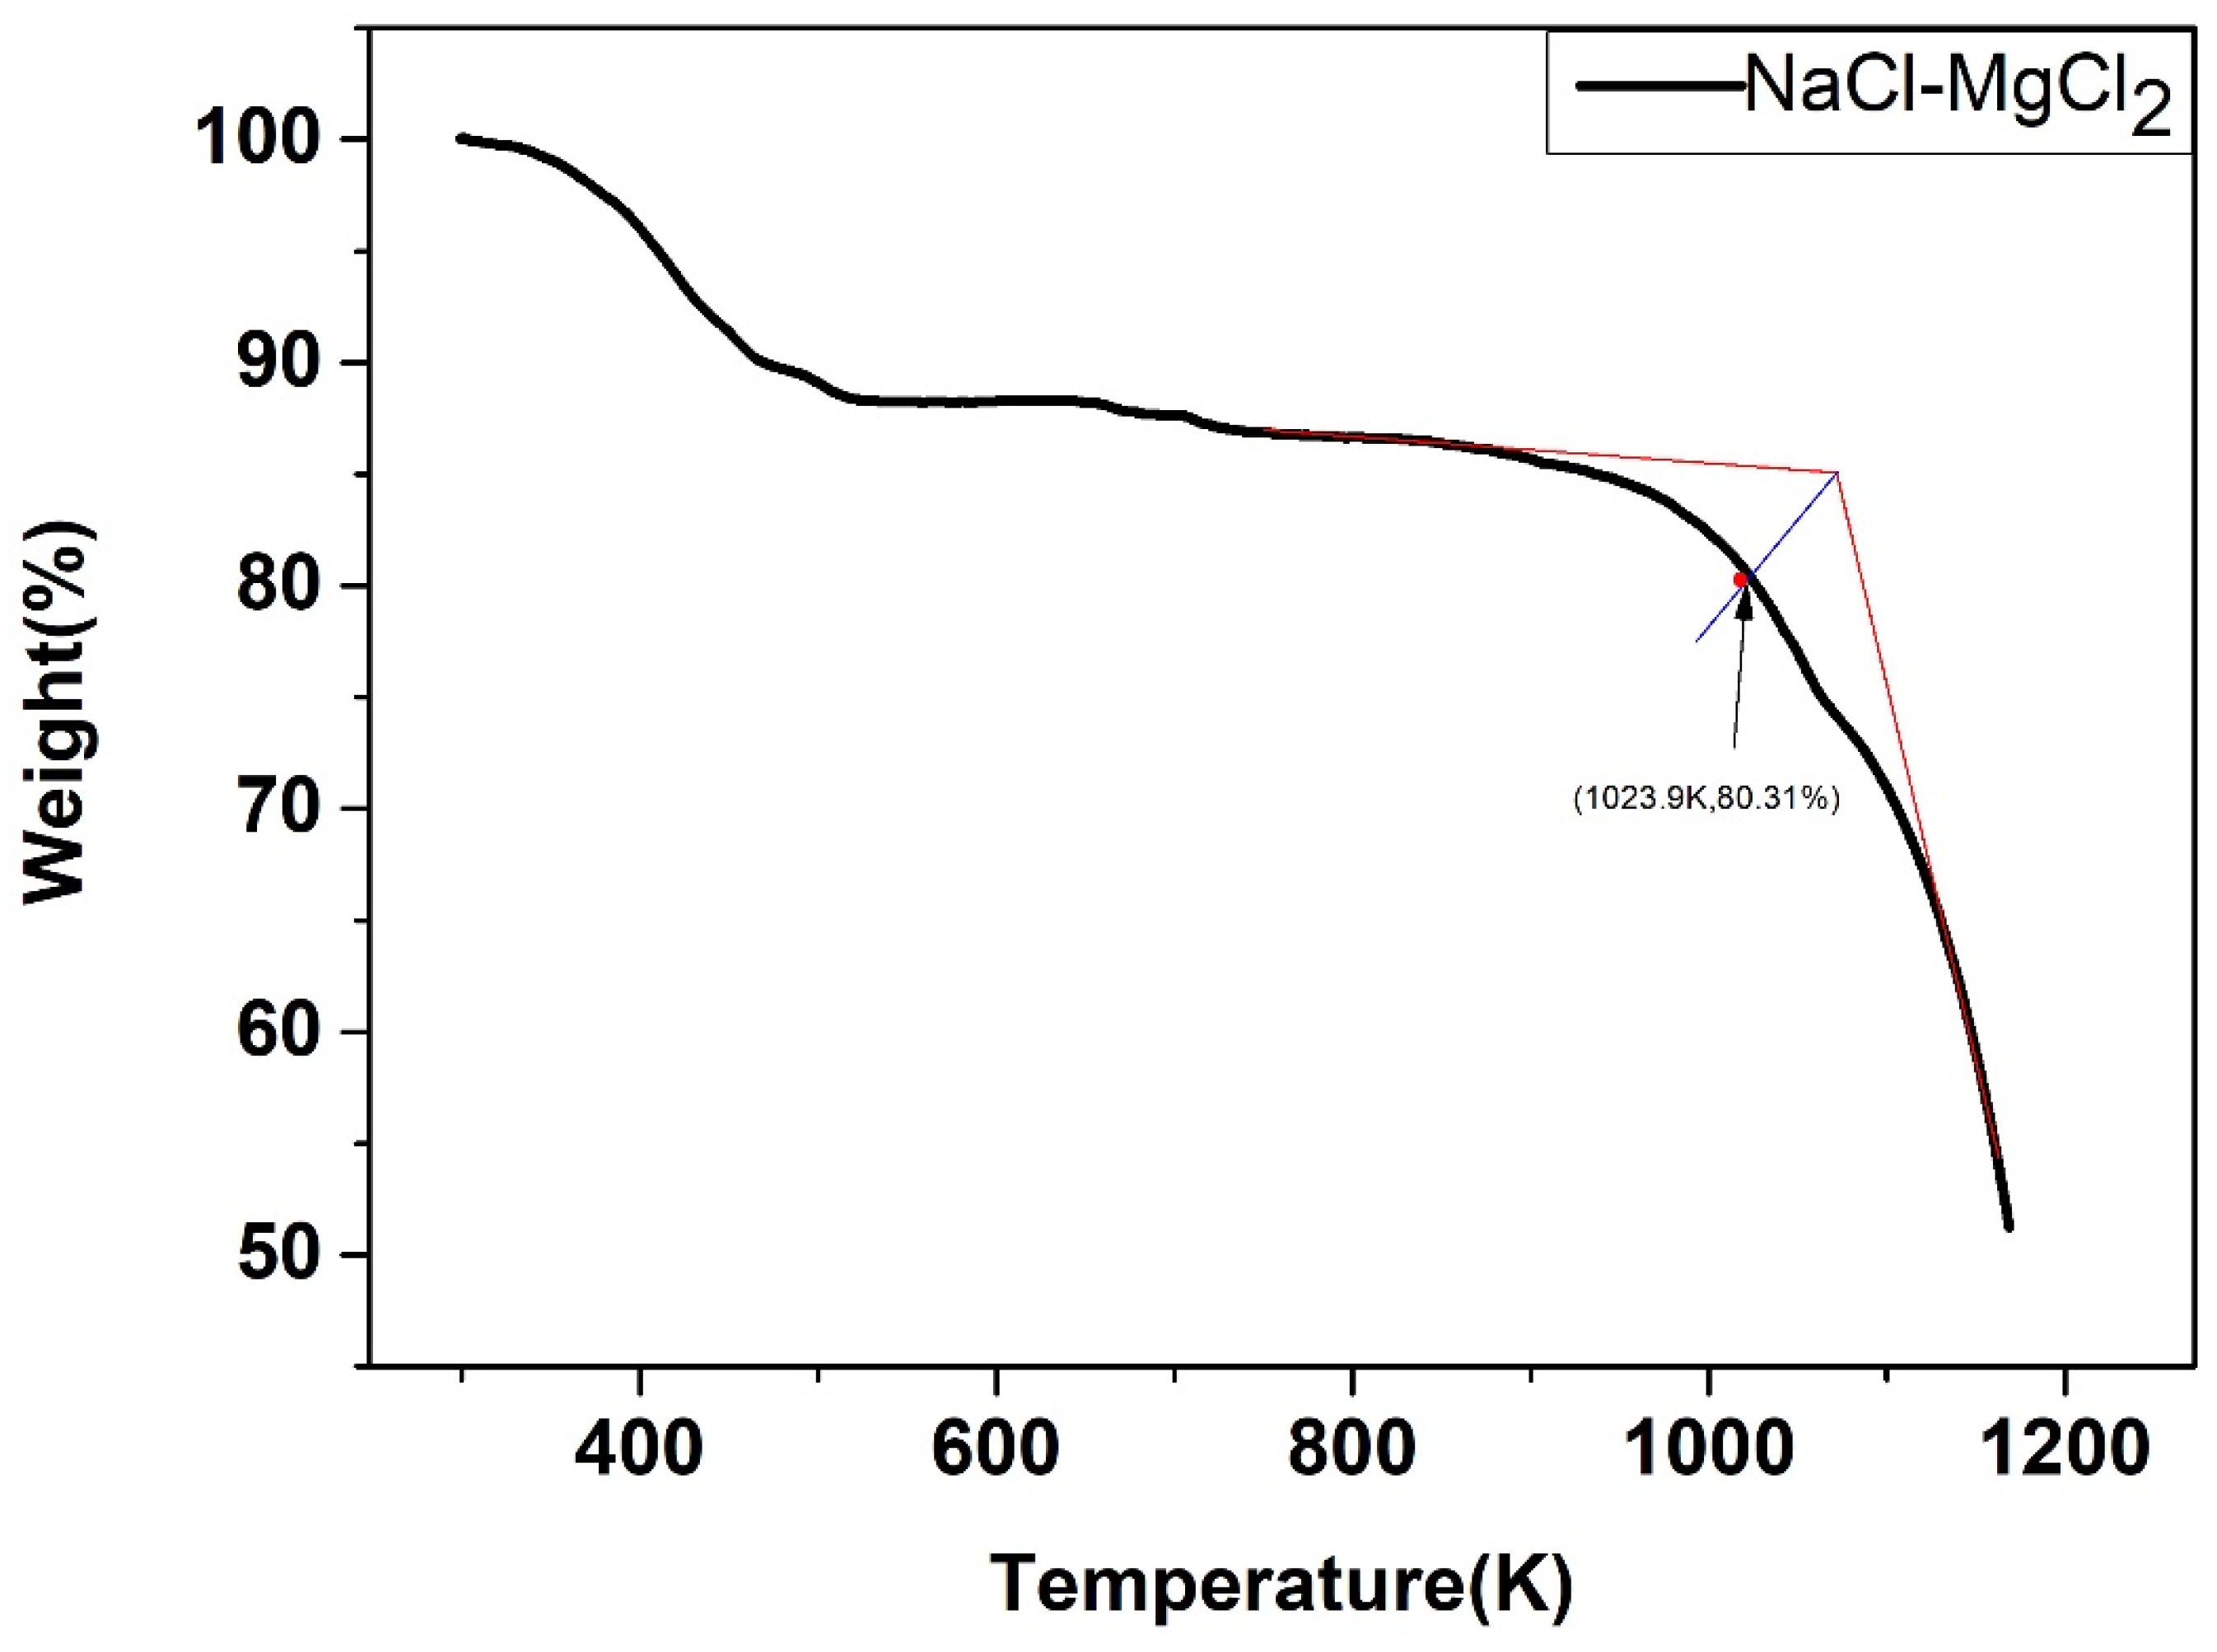
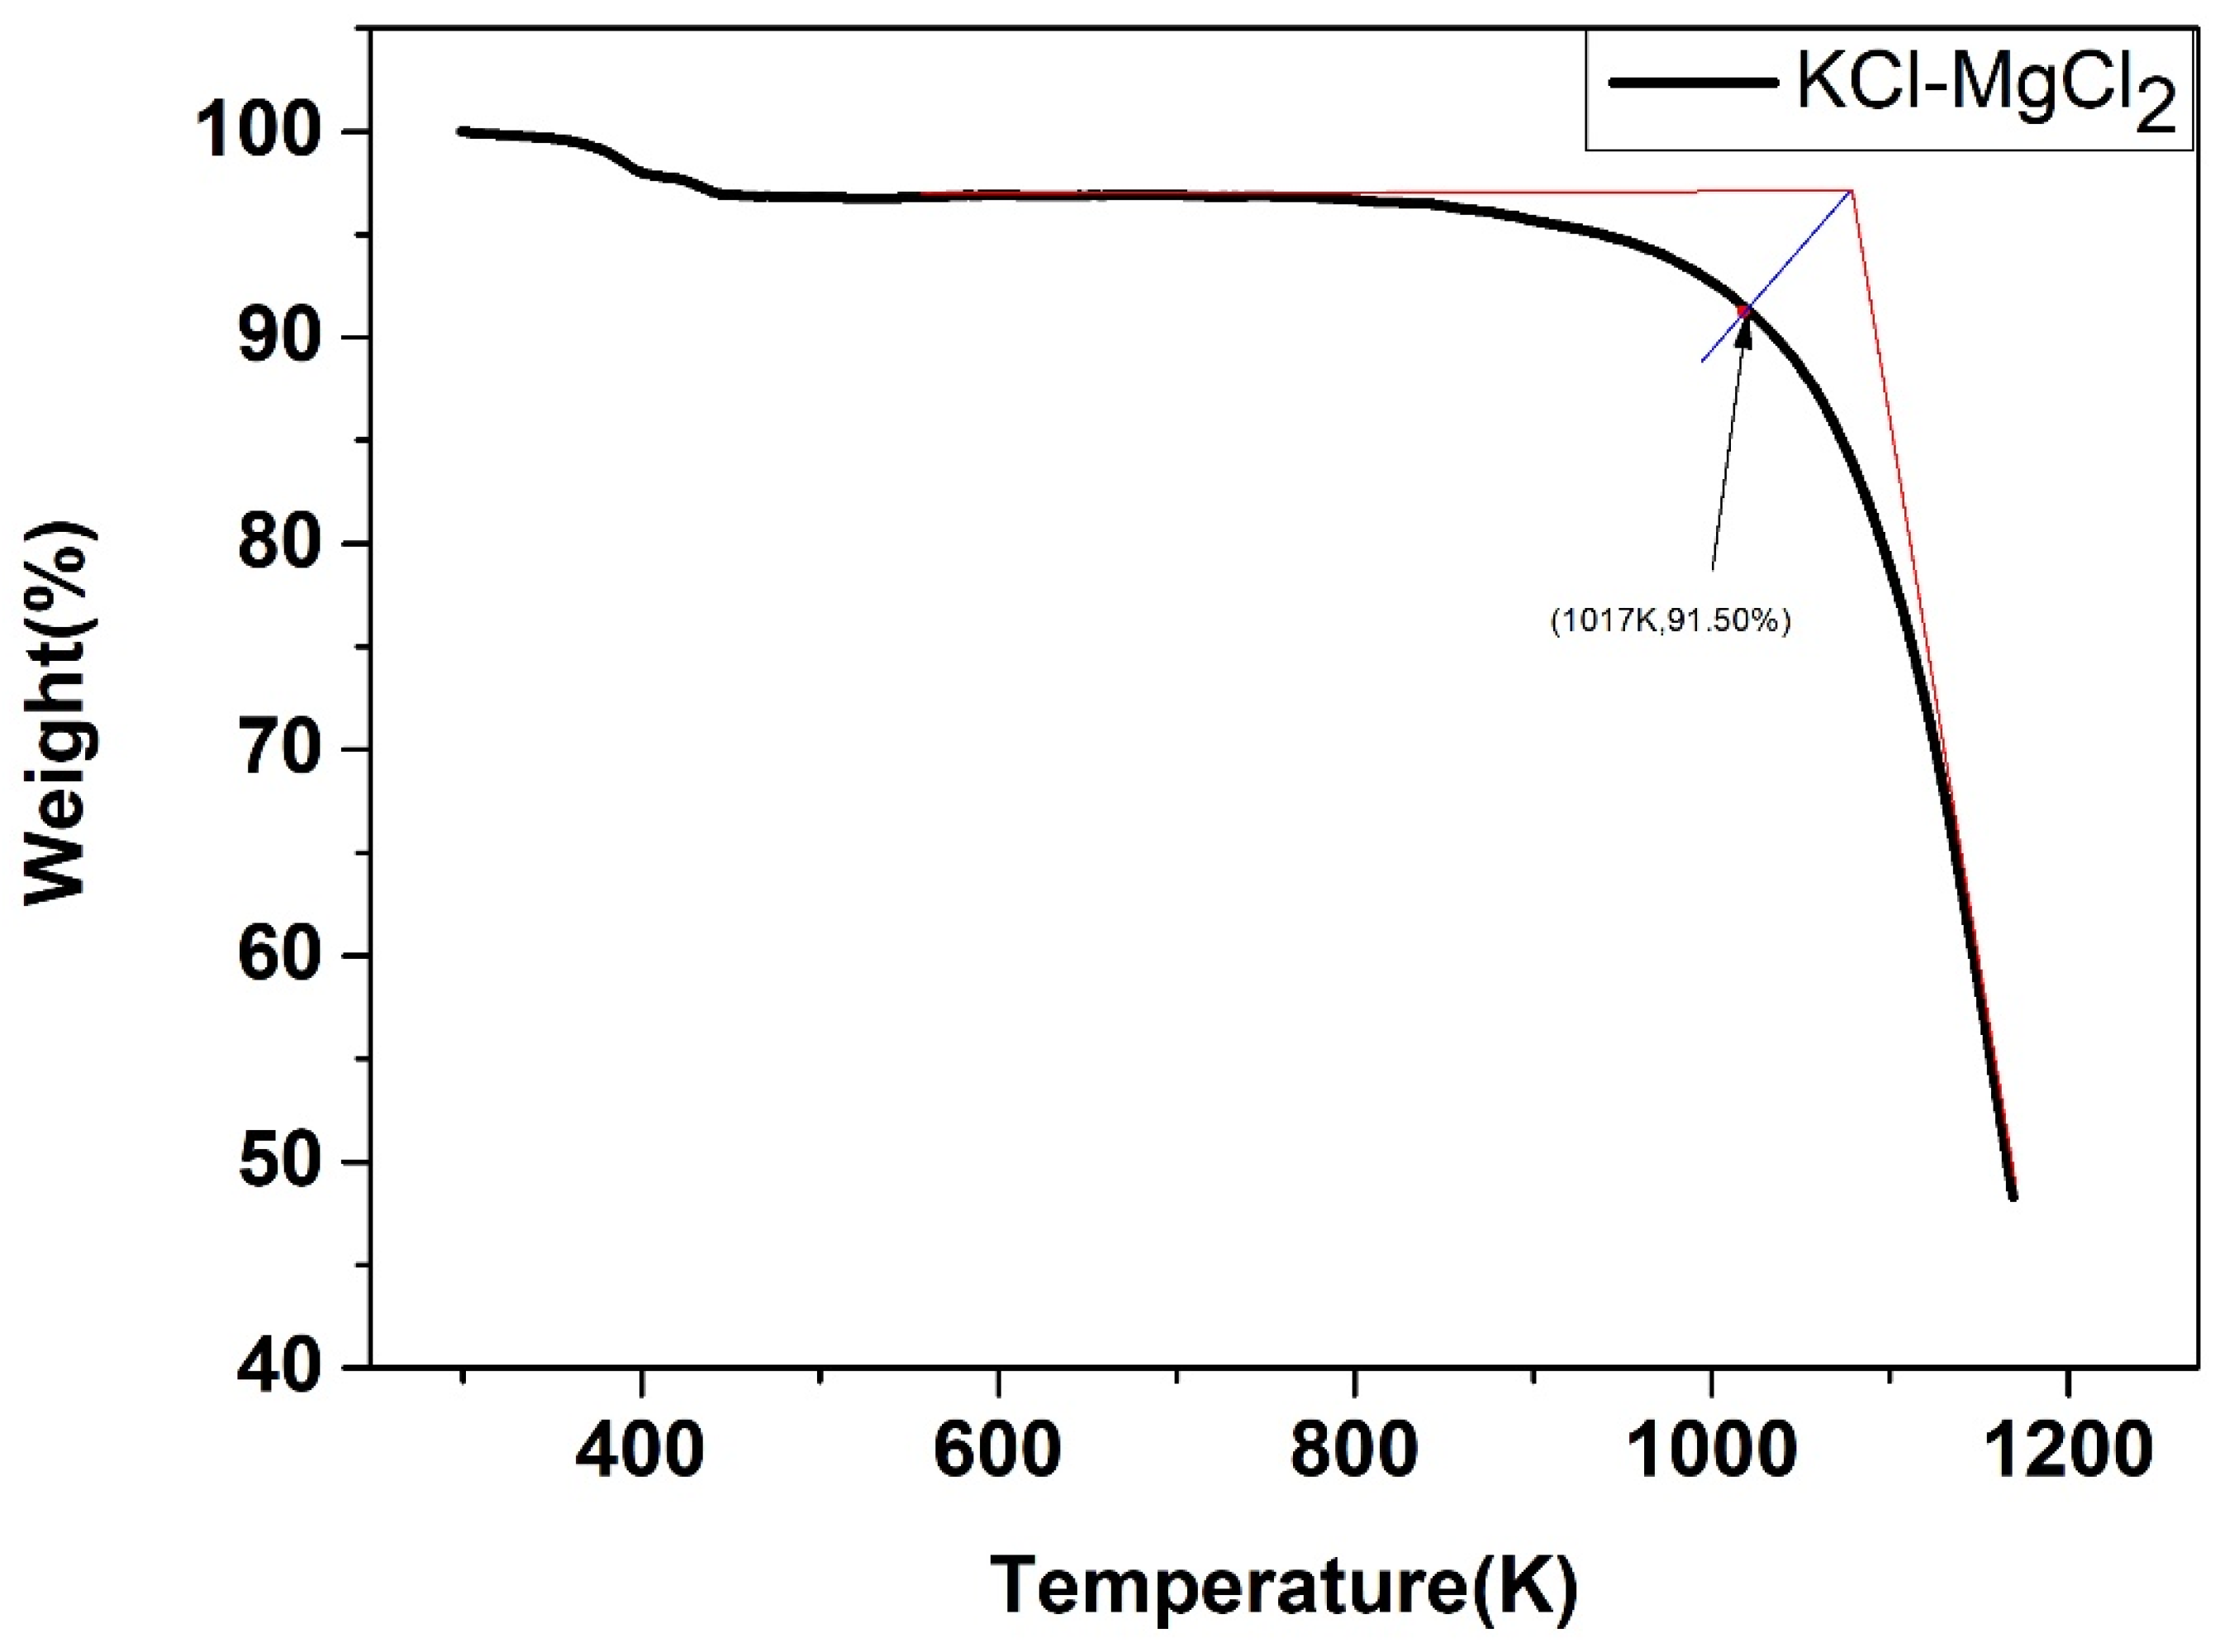
3.3. Thermal Gravimetric Analysis of the Binary Chloride Salts
4. Conclusions
Author Contributions
Funding
Institutional Review Board Statement
Informed Consent Statement
Data Availability Statement
Conflicts of Interest
Nomenclature
| Antoine constants of component | |
| Antoine constants of component | |
| Antoine constants of component | |
| Liquid specific heat capacity of component | |
| Vapor specific heat capacity of component | |
| Total amount of the system | |
| Molar excess free energy | |
| Partial molar excess free energy of component | |
| Molar enthalpies of the mixture | |
| Molar enthalpies of the liquid | |
| Molar enthalpies of the vapor | |
| Enthalpy change | |
| Molar enthalpy of the system before operation | |
| Vapor-liquid equilibrium ratio of component | |
| System pressure (mmHg) | |
| Endothermic heat of the process | |
| Thermodynamic constant | |
| Standard deviation (SD) | |
| Average relative deviation (ARD) | |
| Temperature (K) | |
| Bubble point temperature | |
| Dew point temperature | |
| Saturated temperature of the component | |
| Initial value of | |
| Molar volume of pure component | |
| Equivalent fraction | |
| Activity of component | |
| Calculated value of activities of component | |
| Literature data of activities of component | |
| Constant of equivalent fraction | |
| Constant of equivalent fraction | |
| Derivative of enthalpy change | |
| Fugacity of component in the liquid phase | |
| Fugacity of component in the vapor phase | |
| Number of literature data | |
| Vapor pressure of component | |
| Saturated vapor pressure of component | |
| Saturated vapor pressure of component in dew point temperature calculation | |
| Saturated vapor pressure of component in bubble point temperature calculation | |
| Saturated vapor pressure of component in dew point temperature calculation | |
| Activity coefficient of component in the liquid phase | |
| Activity coefficient of component in dew point temperature calculation | |
| Vaporization rate | |
| Mole fraction of component in the liquid phase | |
| Mole fraction of component in the vapor phase | |
| Mole fraction of component in the vapor phase in dew point temperature calculation | |
| Coordination number | |
| Total composition before operation of component | |
| Fugacity coefficient of component in the liquid phase | |
| Saturated liquid fugacity coefficient of component | |
| Fugacity coefficient of component in the vapor phase | |
| Composition of the system with maximum order | |
| Non-configurational entropy change | |
| Molar enthalpy change | |
| Total excess Gibbs free energy | |
| Poynting factor of component |
References
- Dias, P.; Vilanova, A.; Lopes, T.; Andrade, L.; Mendes, A. Extremely stable bare hematite photoanode for solar water splitting. Nano Energy 2016, 23, 70–79. [Google Scholar] [CrossRef]
- Tian, H.; Du, L.; Wei, X.; Deng, S.; Wang, W.; Ding, J. Enhanced thermal conductivity of ternary carbonate salt phase change material with Mg particles for solar thermal energy storage. Appl. Energy 2017, 204, 525–530. [Google Scholar] [CrossRef]
- Islam, M.T.; Huda, N.; Abdullah, A.B.; Saidur, R. A comprehensive review of state-of-the-art concentrating solar power (CSP) technologies: Current status and research trends. Renew. Sustain. Energy Rev. 2018, 91, 987–1018. [Google Scholar] [CrossRef]
- Ferreira, A.; Kunh, S.S.; Fagnani, K.C.; De Souza, T.A.; Tonezer, C.; Dos Santos, G.R.; Coimbra-Araújo, C.H. Economic overview of the use and production of photovoltaic solar energy in brazil. Renew. Sustain. Energy Rev. 2018, 81, 181–191. [Google Scholar] [CrossRef]
- Sun, J.; Liu, Q.; Hong, H. Numerical study of parabolic-trough direct steam generation loop in recirculation mode: Characteristics, performance and general operation strategy. Energy Convers. Manag. 2015, 96, 287–302. [Google Scholar] [CrossRef]
- Myers, P.D., Jr.; Goswami, D.Y. Thermal energy storage using chloride salts and their eutectics. Appl. Therm. Eng. 2016, 109, 889–900. [Google Scholar] [CrossRef]
- Aneke, M.; Wang, M. Energy storage technologies and real life applications—A state of the art review. Appl. Energy 2016, 179, 350–377. [Google Scholar] [CrossRef]
- Liu, M.; Tay, N.S.; Bell, S.; Belusko, M.; Jacob, R.; Will, G.; Saman, W.; Bruno, F. Review on concentrating solar power plants and new developments in high temperature thermal energy storage technologies. Renew. Sustain. Energy Rev. 2016, 53, 1411–1432. [Google Scholar] [CrossRef]
- Zavoico, A.B. Solar Power Tower Design Basis Document; Sandia National Laboratories: Livermore, CA, USA, 2001. [CrossRef]
- Badger Energy Corporation. Design, Handling, Operation and Maintenance Procedures for Hitec Molten Salt; SAND81-8179; Sandia National Laboratories: Livermore, CA, USA, 1981.
- Kearney, D.; Kelly, B.; Herrmann, U.; Cable, R.; Pacheco, J.; Mahoney, R.; Price, H.; Blake, D.; Nava, P.; Potrovitza, N. Engineering aspects of a molten salt heat transfer fluid in a trough solar field. Energy 2004, 29, 861–870. [Google Scholar] [CrossRef]
- Fernández, A.; Ushak, S.; Galleguillos, H.; Perez-Trujillo, F.J. Development of new molten salts with LiNO3 and Ca(NO3)2 for energy storage in CSP plants. Appl. Energy 2014, 119, 131–140. [Google Scholar] [CrossRef]
- Nunes, V.M.B.; Queirós, C.S.; Lourenço, M.J.V.; Santos, F.J.V.; De Castro, C.N. Molten salts as engineering fluids—A review: Part I. Molten alkali nitrates. Appl. Energy 2016, 11, 603–611. [Google Scholar] [CrossRef]
- Peng, Q.; Yang, X.; Ding, J.; Wei, X.; Yang, Y. Experimental study and mechanism analysis for high-temperature thermal stability of ternary nitrate salt. CIESC J. 2013, 64, 1507–1512. [Google Scholar] [CrossRef]
- Ding, J.; Du, L.; Pan, G.; Lu, J.; Wei, X.; Li, J.; Wang, W.; Yan, J. Molecular dynamics simulations of the local structures and thermodynamic properties on molten alkali carbonate K2CO3. Appl. Energy 2018, 220, 536–544. [Google Scholar] [CrossRef]
- Villada, C.; Ding, W.; Bonk, A.; Bauer, T. Engineering molten Mg2–KCl–NaCl salt for high-temperature thermal energy storage: Review on salt properties and corrosion control strategies. Sol. Energy Mater. Sol. Cells 2021, 232, 111344. [Google Scholar] [CrossRef]
- Fernández, A.G.; Gomez-Vidal, J.; Oró, E.; Kruizenga, A.; Solé, A.; Cabeza, L.F. Mainstreaming commercial CSP systems: A technology review. Renew. Energy 2019, 140, 152–176. [Google Scholar] [CrossRef]
- Sau, S.; Tizzoni, A.; Corsaro, N.; Veca, E.; Navas, M.; Martinez-Tarifa, A. Report on protocols for standardized testing procedures and data analysis criteria (Version 1). Zenodo 2015. [Google Scholar] [CrossRef]
- Raade, J.W.; Padowitz, D. Development of Molten Salt Heat Transfer Fluid With Low Melting Point and High Thermal Stability. J. Sol. Energy Eng. 2011, 133, 031013. [Google Scholar] [CrossRef]
- Xu, X.; Wang, X.; Li, P.; Li, Y.; Hao, Q.; Xiao, B.; Elsentriecy, H.; Gervasio, D. Experimental Test of Properties of KCl–Mg2 Eutectic Molten Salt for Heat Transfer and Thermal Storage Fluid in Concentrated Solar Power Systems. J. Sol. Energy Eng. 2018, 140, 051011. [Google Scholar] [CrossRef]
- Du, L.; Ding, J.; Tian, H.; Wang, W.; Wei, X.; Song, M. Thermal properties and thermal stability of the ternary eutectic salt NaCl-Ca2-Mg2 used in hightemperature thermal energy storage process. Appl. Energy 2017, 204, 1225–1230. [Google Scholar] [CrossRef]
- Maksoud, L.; Bauer, T. Experimental investigation of chloride molten salts for thermal energy storage applications. In Proceedings of the 10th International Conference on Molten Salt Chemistry and Technology, Shenyang, China, 10–14 June 2015; pp. 273–280. [Google Scholar]
- Mohan, G.; Venkataraman, M.; Gomez-Vidal, J.; Coventry, J. Assessment of a novel ternary eutectic chloride salt for next generation high-temperature sensible heat storage. Energy Convers. Manag. 2018, 167, 156–164. [Google Scholar] [CrossRef]
- Pelton, A.D.; Chartrand, P. Thermodynamic evaluation and optimization of the LiCl-NaCl-KCl-RbCl-CsCl-Mg2-Ca2 system using the modified quasi-chemical model. Metall. Mater. Trans. A 2001, 32, 1361–1383. [Google Scholar] [CrossRef]
- Robelin, C.; Chartrand, P.; Pelton, A.D. Thermodynamic evaluation and optimization of the (NaCl+KCl+Mg2+Ca2+Mn2+Fe2+Co2+Ni2) System. J. Chem. Thermodyn. 2004, 36, 809–828. [Google Scholar] [CrossRef]
- Robelin, C.; Chartrand, P. Thermodynamic evaluation and optimization of the (NaCl+KCl+Mg2 +Ca2+ZnCl2) system. J. Chem. Thermodyn. 2011, 43, 377–391. [Google Scholar] [CrossRef]
- Foosnaes, T.; Oestvold, T.; Oeye, H.A. Calculation of charge asymmetric additive ternary phase diagrams with and without compound formation. Acta Chem. Scand. Ser. A Phys. Inorg. Chem. 1978, 32, 973–987. [Google Scholar] [CrossRef][Green Version]
- Fried, V.; Hameka, H.F.; Blukis, U. Physical Chemistry; Macmillan Publishing Co., Inc.: New York, NY, USA, 1977. [Google Scholar]
- Bilski, P.; Bobrowicz-Sarga, L.; Czarnecki, P.; Marczak, A.; Wasicki, J. The p–T phase diagram for new ferroelectric bis-thiourea pyridinium bromide. J. Chem. Thermodyn. 2013, 59, 182–187. [Google Scholar] [CrossRef]
- Nipan, G.D. p–T–x–y phase diagram of the Cd–Zn–Te system. J. Alloy. Compd. 2004, 371, 160–163. [Google Scholar] [CrossRef]
- Smith, J.M.; Van Ness, H.C.; Abbott, M.M. Introduction to Chemical Engineering Thermodynamics, 6th ed.; McGraw-Hill Book Co.: New York, NY, USA, 2001. [Google Scholar]
- Poling, B.E.; Prausnitz, J.M.; O’Connell, J.P. The Properties of Gases and Liquids, 5th ed.; McGraw-Hill Book Co.: New York, NY, USA, 2001. [Google Scholar]
- Pelton, A.D.; Blander, M. Proceedings of the AIME Symposium on Molten Salts and Slags, Nevada, 1984; Tahoe, L., Ed.; TMS-AIME: Warrendale, PA, USA, 1984; pp. 281–294. [Google Scholar]
- Pelton, A.D.; Blander, M. Thermodynamic analysis of ordered liquid solutions by a modified quasichemical approach-Application to silicate salgs. Metall. Trans. B 1986, 17, 805–815. [Google Scholar] [CrossRef]
- Blander, M.; Pelton, A.D. Thermodynamic analysis of binary liquid silicates and prediction of ternary solution properties by modified quasichemical equations. Geochim. Cosmochim. Acta 1987, 51, 85–95. [Google Scholar] [CrossRef]
- Peng, Q.; Ding, J.; Wei, X.; Yang, J.; Yang, X. The preparation and properties of multi-component molten salts. Appl. Energy 2010, 87, 2812–2817. [Google Scholar] [CrossRef]
- Li, R.; Gu, W. Calculation of thermodynamic properties of NaCl-KCl system. Eng. Chem. Metall. 1989, 10, 24–30. [Google Scholar]
- Bale, C.W.; Bélisle, E.; Chartrand, P.; Decterov, S.A.; Eriksson, G.; Gheribi, A.; Hack, K.; Jung, I.-H.; Melançon, J.; Pelton, A.D.; et al. Recent Developments in factsage thermochemical software and databases. In Celebrating the Megascale; Springer: Cham, Switzerland, 2014; pp. 141–148. [Google Scholar] [CrossRef]
- Egan, J.J.; Bracker, J. Thermodynamic properties of some binary fused chloride mixtures obtained from e.m.f. measuerments. J. Chem. Thermodyn. 1974, 6, 9–16. [Google Scholar] [CrossRef]
- Janz, G.J.; Allen, C.B.; Downey, J.R., Jr.; Tomkins, R.P.T. Physical Properties Data Compilations Relevant to Energy Storage. 1. Molten Salts: Eutectic Data; U.S. Government Printing Office: Washington, DC, USA, 1978.
- Janz, G.J.; Allen, C.B.; Bansal, N.P.; Murphy, R.M.; Tomkins, R.P.T. Physical Properties Data Compilations Relevant to Energy Storage. 2. Molten Salts: Data on Single and Multi-Component Salt Systems; U.S. Government Printing Office: Washington, DC, USA, 1981.


| NaCl-KCl at 1083 K | ||||
|---|---|---|---|---|
| 0.1 | 0.898 | 0.896 | 0.086 | 0.088 |
| 0.2 | 0.794 | 0.797 | 0.177 | 0.175 |
| 0.3 | 0.695 | 0.690 | 0.267 | 0.271 |
| 0.4 | 0.582 | 0.584 | 0.371 | 0.370 |
| 0.5 | 0.477 | 0.479 | 0.477 | 0.471 |
| 0.6 | 0.371 | 0.373 | 0.580 | 0.578 |
| 0.7 | 0.270 | 0.271 | 0.687 | 0.686 |
| 0.8 | 0.172 | 0.175 | 0.796 | 0.792 |
| 0.9 | 0.084 | 0.082 | 0.899 | 0.902 |
| NaCl-CaCl2 at 998 K | ||||
|---|---|---|---|---|
| 0.1 | 0.729 | 0.748 | 0.078 | 0.062 |
| 0.2 | 0.729 | 0.712 | 0.078 | 0.086 |
| 0.3 | 0.587 | 0.595 | 0.149 | 0.144 |
| 0.4 | 0.447 | 0.444 | 0.247 | 0.250 |
| 0.5 | 0.326 | 0.328 | 0.365 | 0.361 |
| 0.6 | 0.224 | 0.221 | 0.495 | 0.500 |
| 0.7 | 0.142 | 0.149 | 0.632 | 0.619 |
| 0.9 | 0.044 | 0.021 | 0.858 | 0.934 |
| KCl-CaCl2 at 1058 K | ||||
|---|---|---|---|---|
| 0.1 | 0.867 | 0.862 | 0.009 | 0.010 |
| 0.2 | 0.704 | 0.707 | 0.031 | 0.035 |
| 0.3 | 0.524 | 0.534 | 0.074 | 0.085 |
| 0.4 | 0.353 | 0.366 | 0.155 | 0.170 |
| 0.5 | 0.218 | 0.232 | 0.280 | 0.287 |
| 0.6 | 0.133 | 0.139 | 0.418 | 0.423 |
| 0.7 | 0.073 | 0.075 | 0.579 | 0.577 |
| 0.8 | 0.035 | 0.034 | 0.735 | 0.738 |
| 0.9 | 0.012 | 0.012 | 0.884 | 0.879 |
| NaCl-MgCl2 at 1098 K | ||||
|---|---|---|---|---|
| 0.10 | 0.880 | 0.929 | 0.006 | 0.004 |
| 0.15 | 0.797 | 0.787 | 0.012 | 0.012 |
| 0.20 | 0.705 | 0.688 | 0.021 | 0.021 |
| 0.25 | 0.600 | 0.606 | 0.039 | 0.032 |
| 0.30 | 0.494 | 0.502 | 0.061 | 0.052 |
| 0.35 | 0.391 | 0.386 | 0.099 | 0.088 |
| 0.40 | 0.309 | 0.288 | 0.148 | 0.144 |
| 0.45 | 0.240 | 0.219 | 0.211 | 0.209 |
| 0.50 | 0.186 | 0.172 | 0.276 | 0.275 |
| 0.55 | 0.135 | 0.137 | 0.364 | 0.342 |
| 0.60 | 0.103 | 0.107 | 0.448 | 0.413 |
| 0.65 | 0.077 | 0.080 | 0.529 | 0.496 |
| 0.75 | 0.040 | 0.038 | 0.684 | 0.688 |
| 0.85 | 0.020 | 0.016 | 0.831 | 0.861 |
| 0.90 | 0.013 | 0.012 | 0.897 | 0.879 |
| KCl-MgCl2 at 998 K | ||||
|---|---|---|---|---|
| 0.1 | 0.860 | 0.902 | 0.0004 | 0.0002 |
| 0.2 | 0.630 | 0.598 | 0.002 | 0.002 |
| 0.3 | 0.346 | 0.367 | 0.012 | 0.007 |
| 0.4 | 0.149 | 0.118 | 0.058 | 0.055 |
| 0.5 | 0.067 | 0.055 | 0.155 | 0.146 |
| 0.6 | 0.028 | 0.024 | 0.315 | 0.294 |
| 0.7 | 0.012 | 0.010 | 0.501 | 0.493 |
| 0.8 | 0.004 | 0.004 | 0.702 | 0.698 |
| 0.9 | 0.0012 | 0.0011 | 0.873 | 0.873 |
| T/K | |||||
|---|---|---|---|---|---|
| NaCl-KCl | 1083 | 0.00267 | 0.00318 | 0.052 | 0.056 |
| NaCl-CaCl2 | 998 | 0.01282 | 0.02815 | 5.888 | 0.710 |
| KCl-CaCl2 | 1058 | 0.00775 | 0.00727 | 1.806 | 5.750 |
| NaCl-MgCl2 | 1098 | 0.01642 | 0.01696 | 2.884 | 6.604 |
| KCl-MgCl2 | 998 | 0.02200 | 0.00841 | 8.014 | 12.387 |
| Component | K | J/(mol·K) | J/(mol·K) |
|---|---|---|---|
| NaCl | 1734 | 77.763824 − 7.5312 × 10⁻³T (298–1500 K) 66.944 (1500–2000 K) | 37.333832 + 7.36384*10−4T − 158573.6T−2 |
| KCl | 1693 | 73.59656 | 37.145552 + 9.49768*10−4T − 84098.4T−2 |
| MgCl2 | 1685 | 193.40893 − 0.36201388T −3788503.9T−2 + 3.19987074T2 (298–660 K) 92.048 (660–2500 K) | 62.3647 − 695753.73T−2 + 67611239T−3 |
| CaCl2 | 1873 | 81.479332 − 0.00254166793T −2789.1275T−1 (298–700 K) 102.533 (700–3000 K) | 62.382104 − 100.35854T−1 − 244513.85T−2 |
| Component | Antoine Constant A | Antoine Constant B | Antoine Constant C |
|---|---|---|---|
| NaCl | 8.4459 | 9565 | / |
| KCl | 8.28 | 9032 | / |
| CaCl2 | 8.4073 | 12622 | / |
| MgCl2 | 23.15 | 11735 | 4.076 |
| Species | Lowest Eutectic Temperature K | Molar Mass Ratio |
|---|---|---|
| NaCl-KCl | 841.14 | 0.47:0.53 |
| NaCl-CaCl2 | 749.7 | 0.51:0.49 |
| KCl-CaCl2 | 874.4 | 0.75:0.25 |
| NaCl-MgCl2 | 732.16 | 0.57:0.43 |
| KCl-MgCl2 | 695.69 | 0.7:0.3 |
| Species | Calculated Value of Upper-Temperature Limit K | Experimental Value of Upper-Temperature Limit K | Relative Error % |
|---|---|---|---|
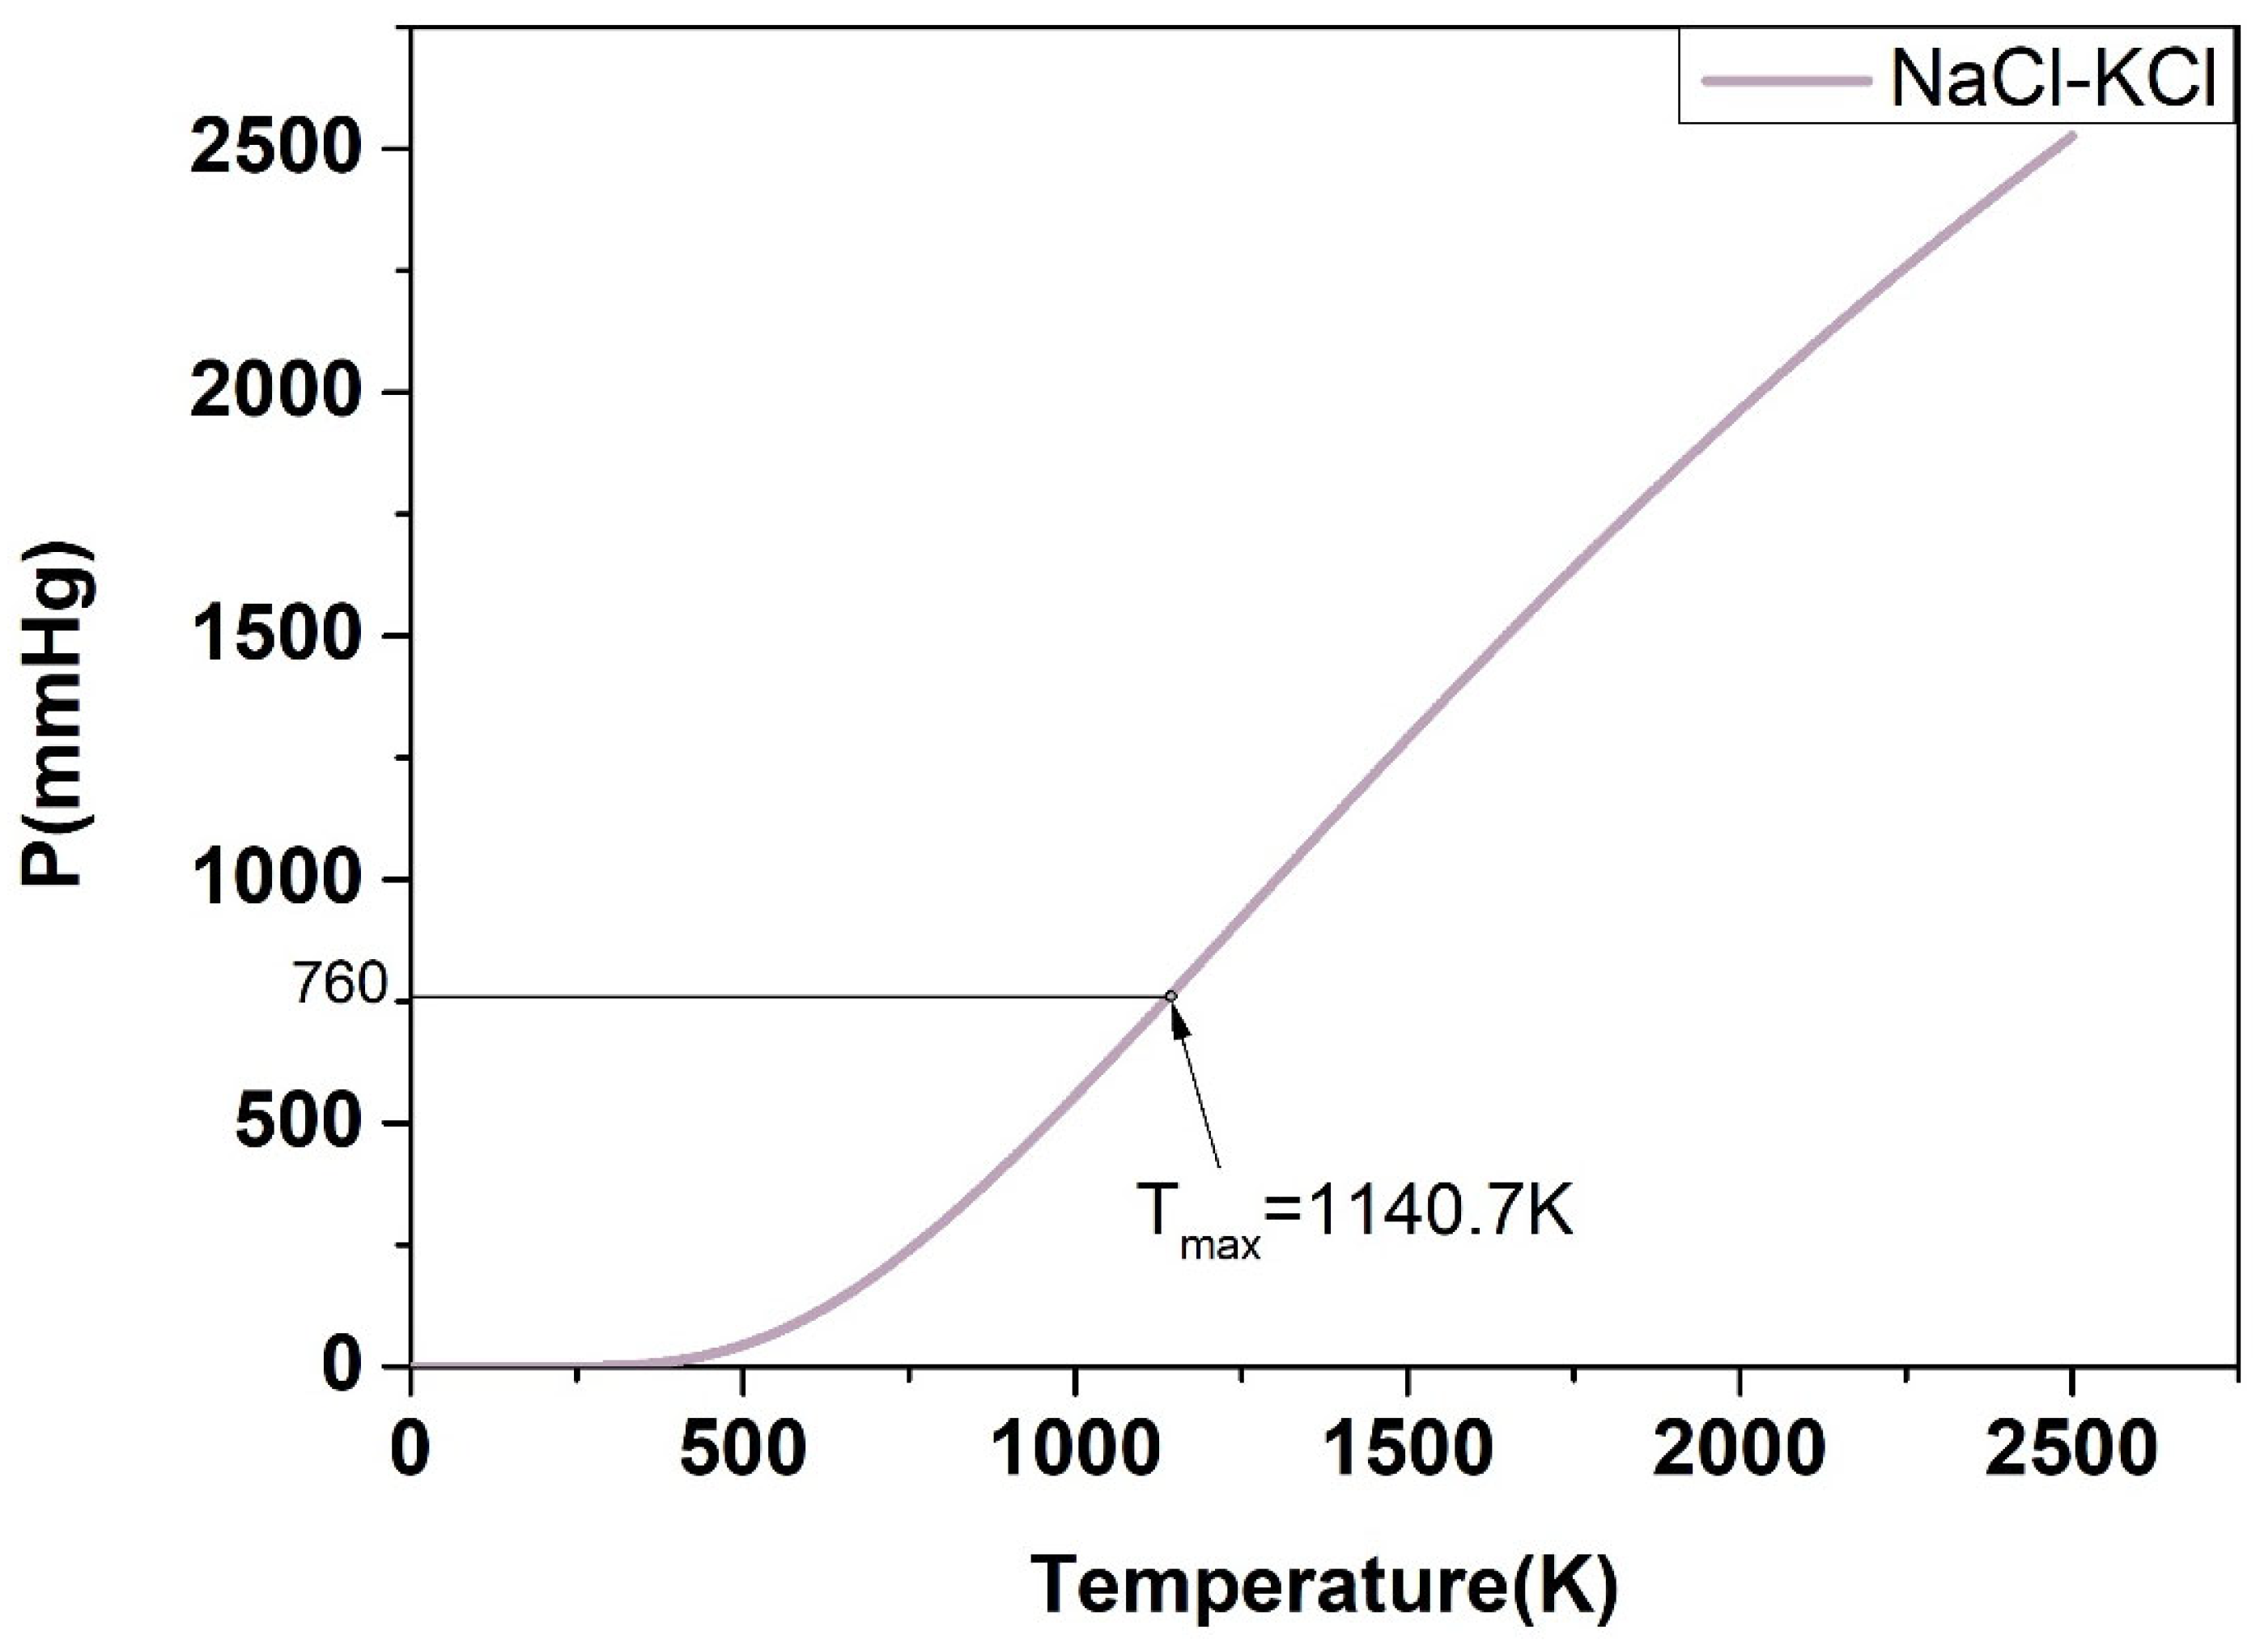
| NaCl-KCl | 1140.7 | 1126.2 | 1.29 |
| NaCl-CaCl2 | 1150.6 | 1117.9 | 2.93 |
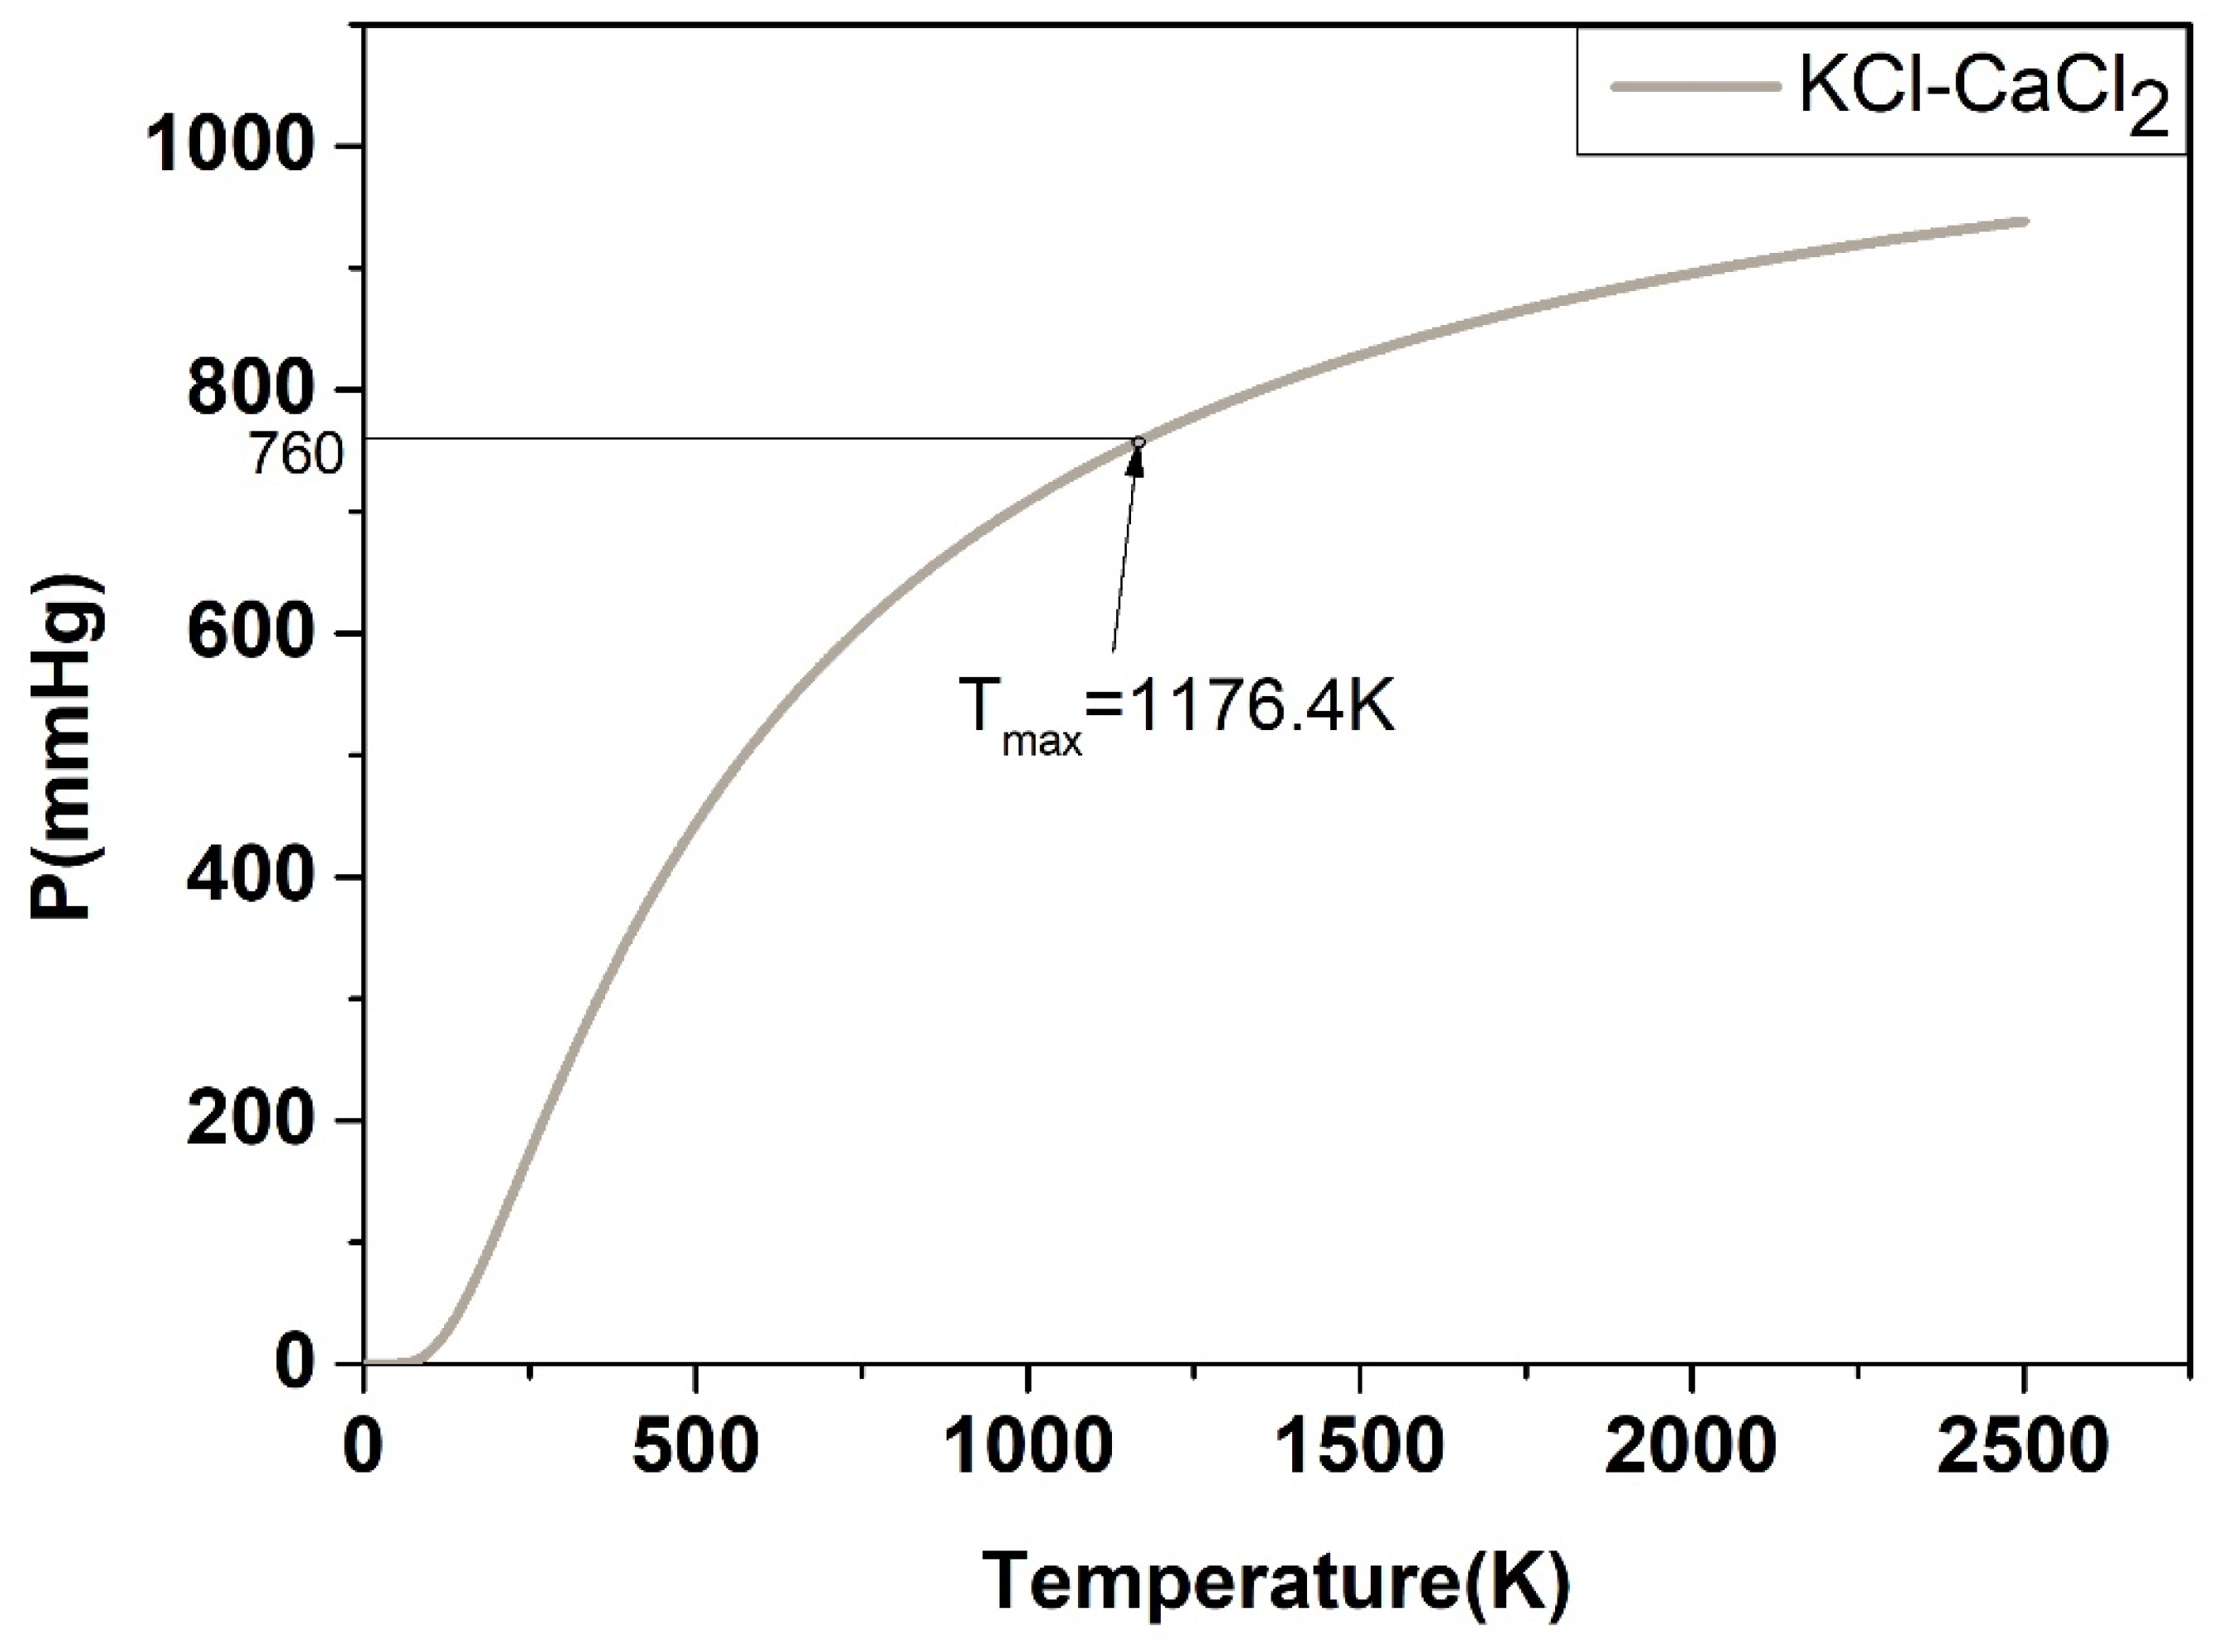
| KCl-CaCl2 | 1176.4 | 1124.1 | 4.65 |
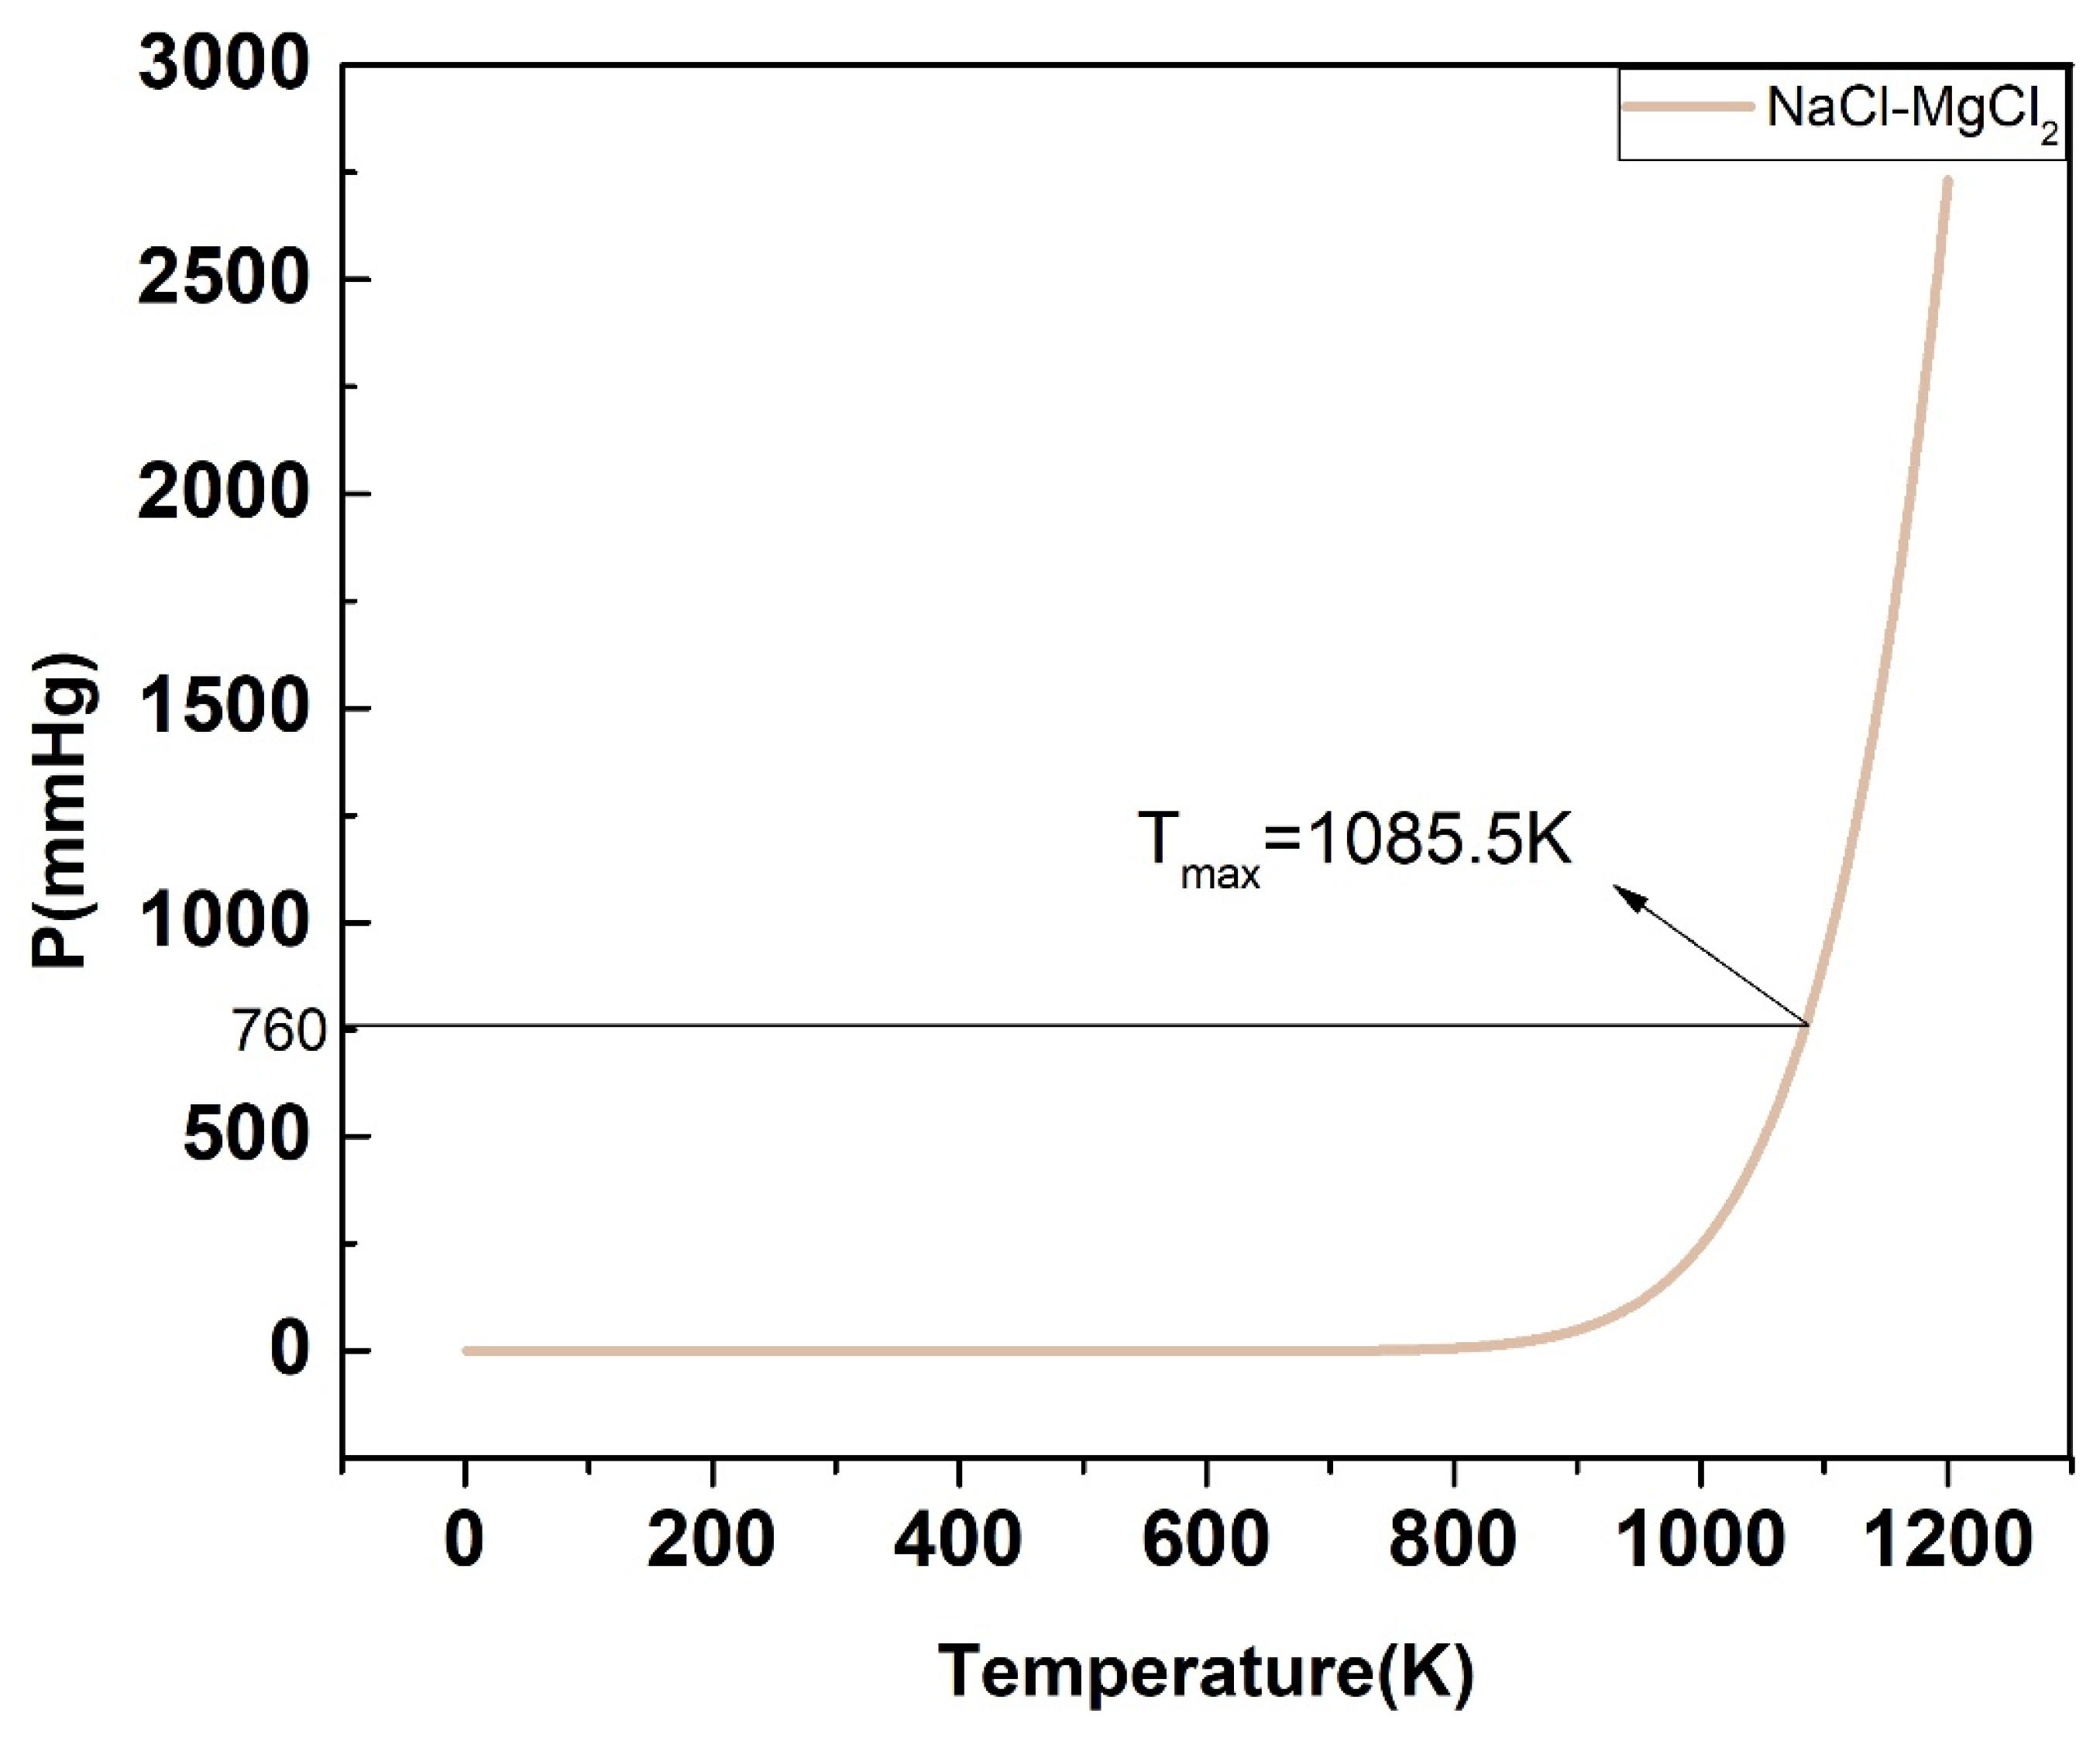
| NaCl-MgCl2 | 1085.5 | 1023.9 | 6.02 |
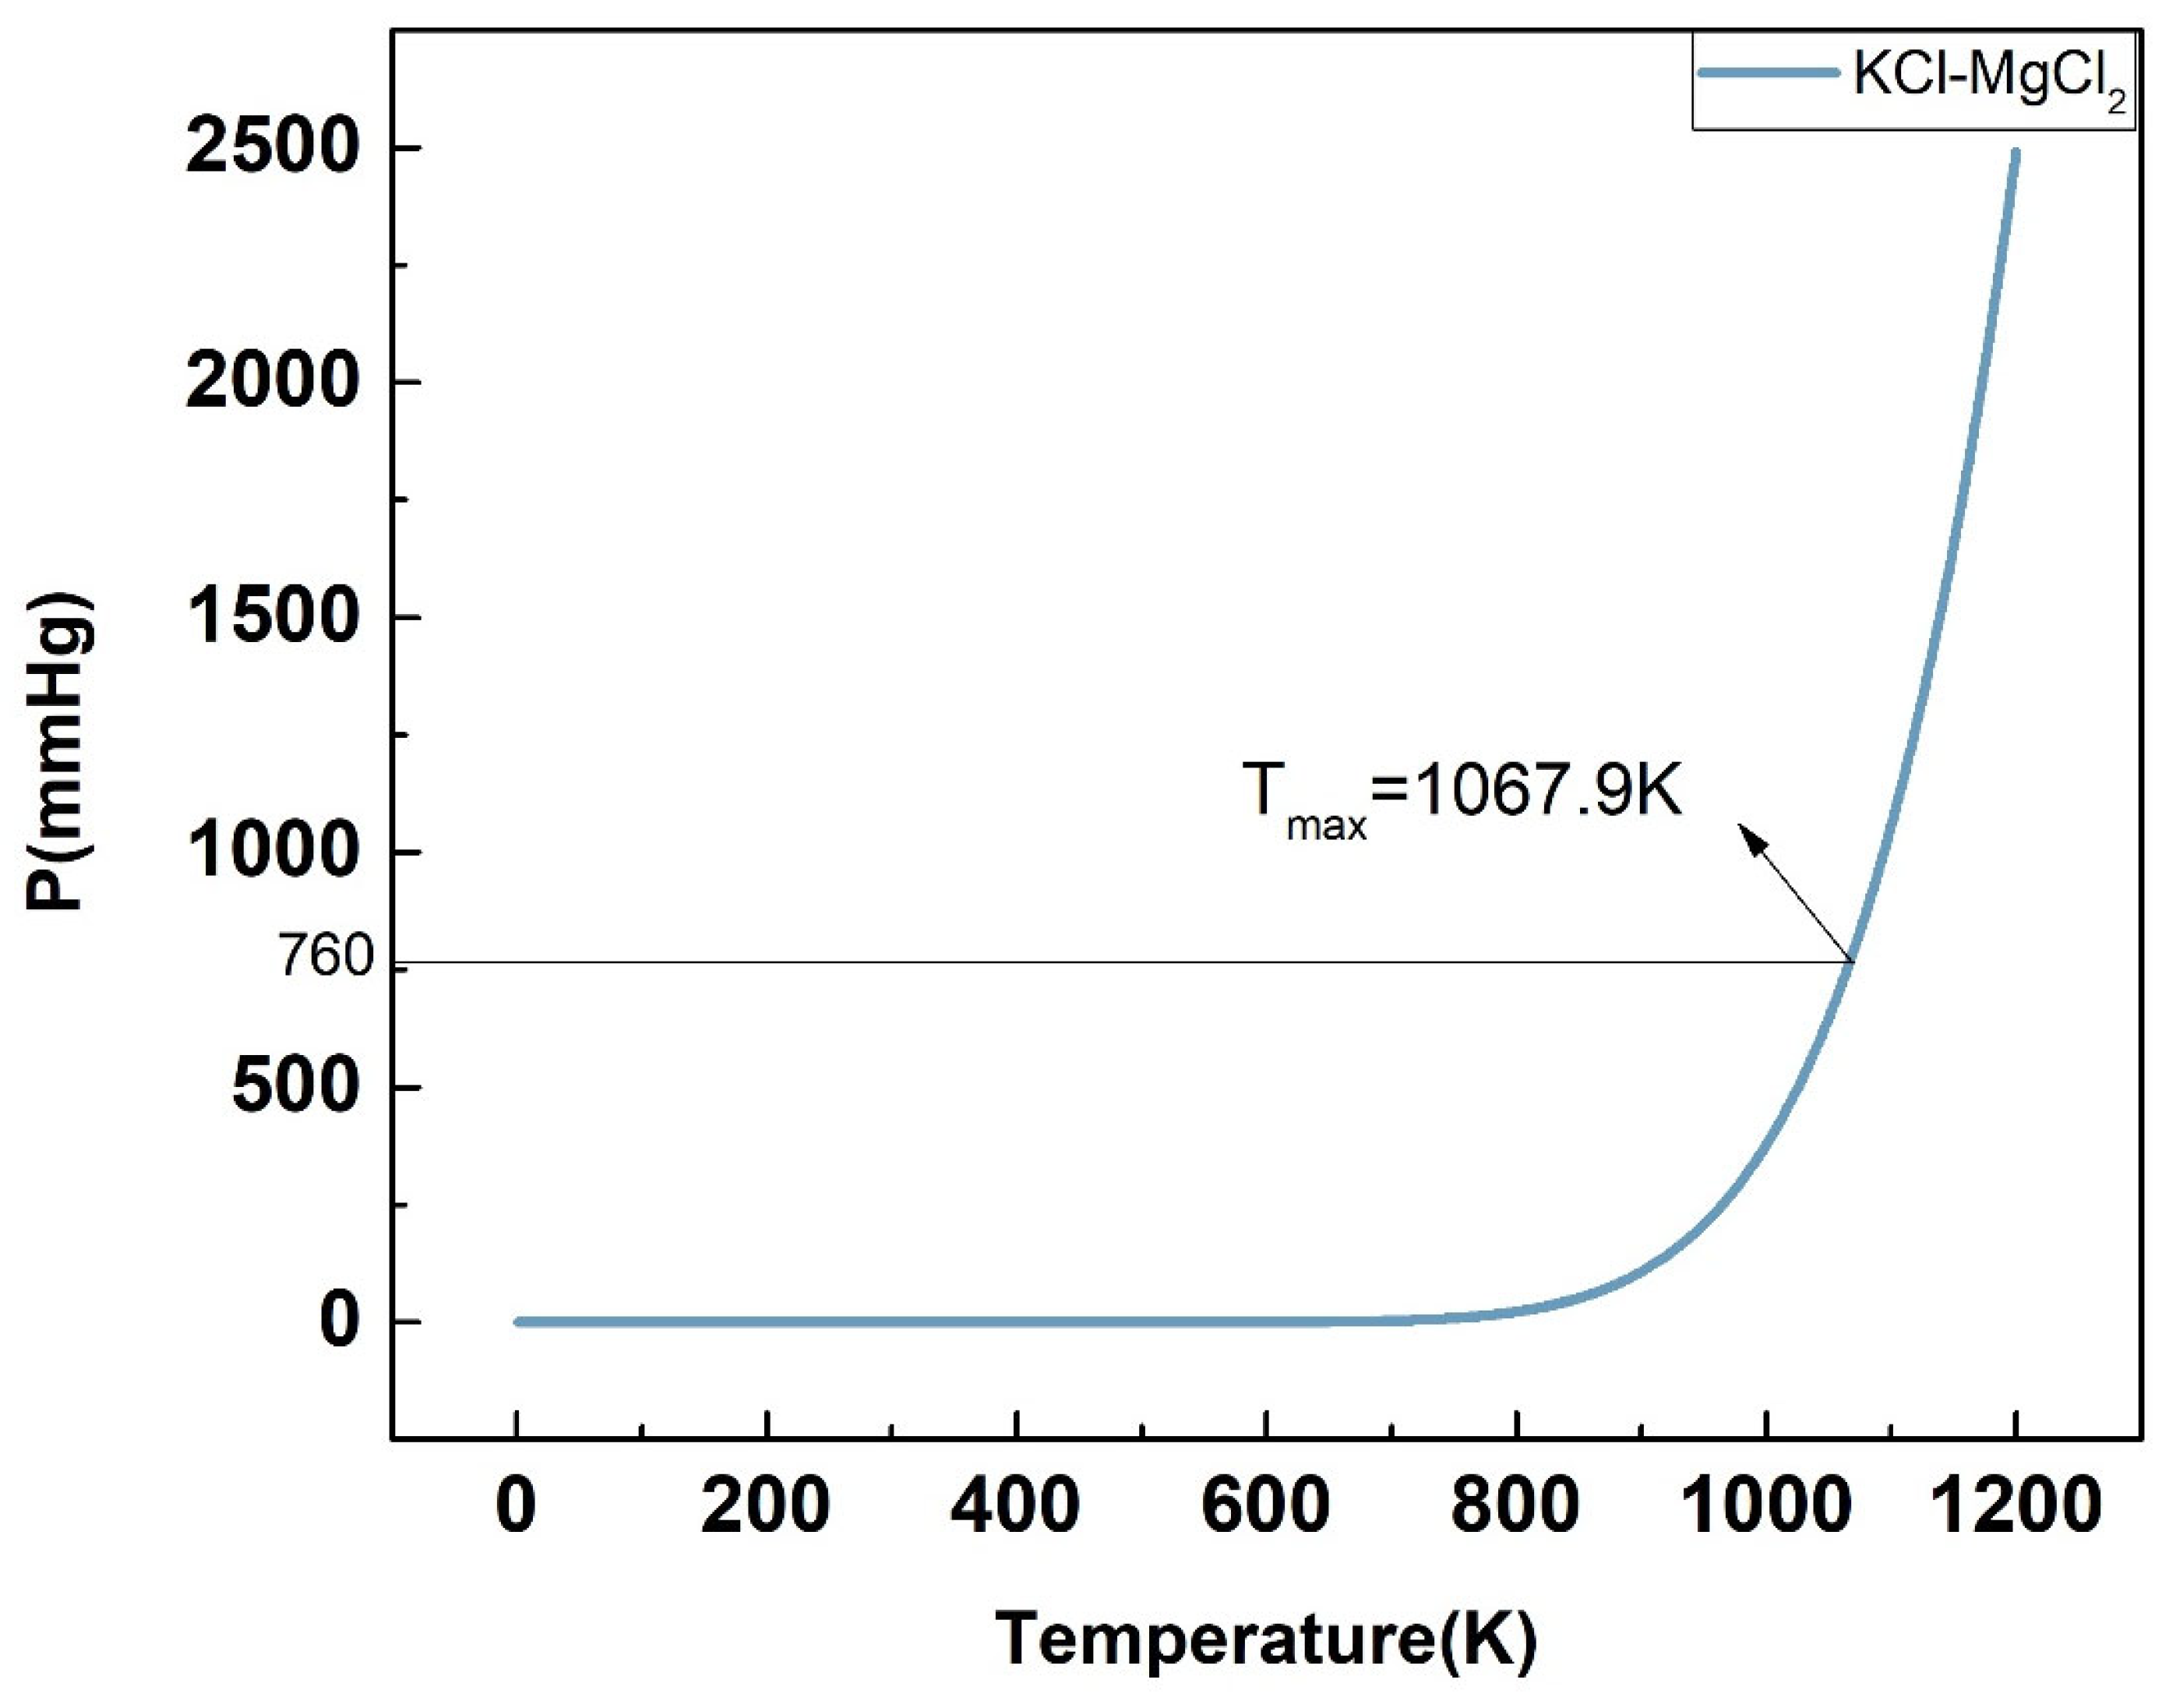
| KCl-MgCl2 | 1067.9 | 1017.9 | 4.91 |
Publisher’s Note: MDPI stays neutral with regard to jurisdictional claims in published maps and institutional affiliations. |
© 2022 by the authors. Licensee MDPI, Basel, Switzerland. This article is an open access article distributed under the terms and conditions of the Creative Commons Attribution (CC BY) license (https://creativecommons.org/licenses/by/4.0/).
Share and Cite
Zhong, J.; Ding, J.; Lu, J.; Wei, X.; Wang, W. Thermal Stability Calculation and Experimental Investigation of Common Binary Chloride Molten Salts Applied in Concentrating Solar Power Plants. Energies 2022, 15, 2516. https://doi.org/10.3390/en15072516
Zhong J, Ding J, Lu J, Wei X, Wang W. Thermal Stability Calculation and Experimental Investigation of Common Binary Chloride Molten Salts Applied in Concentrating Solar Power Plants. Energies. 2022; 15(7):2516. https://doi.org/10.3390/en15072516
Chicago/Turabian StyleZhong, Jingyu, Jing Ding, Jianfeng Lu, Xiaolan Wei, and Weilong Wang. 2022. "Thermal Stability Calculation and Experimental Investigation of Common Binary Chloride Molten Salts Applied in Concentrating Solar Power Plants" Energies 15, no. 7: 2516. https://doi.org/10.3390/en15072516
APA StyleZhong, J., Ding, J., Lu, J., Wei, X., & Wang, W. (2022). Thermal Stability Calculation and Experimental Investigation of Common Binary Chloride Molten Salts Applied in Concentrating Solar Power Plants. Energies, 15(7), 2516. https://doi.org/10.3390/en15072516