Article

Numbers, Please: Power- and Voltage-Related Indices in Control of a Turbine-Generator Set

1
Faculty of Automatic Control, Robotics and Electrical Engineering, Poznań University of Technology, ul. Piotrowo 3a, 60-965 Poznań, Poland
2
Faculty of Electrical and Control Engeneering, Gdańsk University of Technology, ul. Gabriela Narutowicza 11/12, 80-233 Gdańsk, Poland
3
Faculty of Environmental Engineering and Energy, Poznań University of Technology, ul. Piotrowo 5, 61-138 Poznań, Poland
*
Author to whom correspondence should be addressed.
Energies 2022, 15(7), 2453; https://doi.org/10.3390/en15072453
Submission received: 22 February 2022 / Revised: 15 March 2022 / Accepted: 22 March 2022 / Published: 27 March 2022
(This article belongs to the Special Issue Challenge and Research Trends of Power System Simulation)

Abstract

:
This paper discusses the proper selection and interpretation of aggregated control performance indices values mirroring the quality of electrical energy generation by a turbine-generator set cooperating with a power system. Typically, a set of basic/classical and individual indices is used in energy engineering to ensure the mirroring feature and is related to voltage, frequency and active or reactive power deviations from their nominal values desired in the power system. In this paper, aggregated indices based on the sum of weighted integral indices are proposed, verified and built based on the well-known indices originating from control theory. These include an integral of the squared error (ISE) and an integral of the squared error multiplied by time (ITSE), applicable whenever an in-depth analysis and evaluation of various control strategies of the generation system is to be performed. In the reported research, the computer simulation tests verified their effectiveness in assessing the generated electricity on the example of a turbine-generator set controlled using a predictive control technology as well as applicability, proven by numerous simulation results to take various and different in nature requirements into account efficiently, in the form of a single aggregated index.

1. Introduction

1.1. Preliminaries

The energy policy of the European Union forces progressive modernization changes in the structure of generation sources in power systems related to reducing the impact of energy on the environment, especially for technologies related to the energy combustion of fuels. The generation system in Poland is based 70% on coal-fired power plants. Due to the high emissivity of these sources and the high costs of the fluid gas treatment installation, the Polish Energy Policy by 2040 [1] aims to introduce progressive changes in the energy generation structure. According to the assumptions [1], the transformation of the generation system in Poland is to be based on the replacement of conventional power plants with renewable energy sources and nuclear energy. The first block of the nuclear power plant with a capacity of 1–1.6 GW is to be commissioned in 2033, for which the location was already selected at the end of 2021. The government company, Polish Nuclear Power Plants, selected the coastal location of Lubiatowo-Kopalino in the Choczewo commune in Pomerania for the first nuclear reactor [2]. In the following years, it is planned to launch another five such units at intervals of 2–3 years. As for renewable energy sources, it is expected that by 2040 the installed capacity of renewable sources will increase almost twice, from the current 15% to 28.5% [3]. However, due to rapid climate changes, the transition towards a non-nuclear renewable energy system remains a major political challenge, which can be made even worse by increases in energy supply chain uncertainty given rise by the shift away from fossil fuels [3]. The described development activities are aimed at replacing the shut down of conventional power plants in a way that conditions the fulfillment of the power balance in the system, as well as a significant reduction in the national emission of greenhouse gases and air pollutants. However, from the point of view of introducing a significant share of renewable sources, it is necessary to take the stochasticity of their work and significant fluctuations in generated power into account, which are associated with the need to equip classic coal or nuclear units with modern control systems capable of responding to dynamic changes in the power generated in the system power industry. Therefore, the optimization and analysis of dynamic responses of power unit control systems is a critical issue from the point of view of the planned development and upgrade in the generation structure of the Polish Power System. The latter has been carried out in the reported application by the use of integral-based performance indices.
There is a number of indices for evaluation of electrical energy quality, which differ in their nature and allow simultaneous, and yet independent from one another, evaluation of various characteristics of the electric power generation process. In the case of control system design, a single performance index is usually needed to clearly mirror the control quality. Introduction of the indices is, however, necessary both for the evaluation of the operation of control systems and the synthesis of controllers.
The aim of the research work described in this paper is to find the index which is related to a set of those used hitherto, as per relation to the same phenomena, and which is at the same time useful for implementation and analysis of control systems.
As the quality of electrical energy is a major factor when the development of modern societies is concerned, as well as there is a growing demand on the generation of electric power in accordance with the speed of economic development of societies, one can clearly identify a growing need to increase power plants’ efficiency and improve electrical energy quality.
In order to develop solutions improving this quality, it is necessary to have appropriate methods for their assessment. Thanks to the suitably selected indices, it is possible to compare solutions and seek the superior one which satisfies all the requirements. Currently, various indices are used, derived from the control theory and energy engineering. To facilitate the synthesis and analysis of control systems, one aggregated index is needed. This article proposes to use the integral of the squared error (ISE) or integral of the squared error multiplied by time (ITSE) indices as candidates to mirror the quality of operation of the turbine-generator control system. Obviously, the performance of the turbine-generator control loop is a function of a suitable design and tuning of its controller.
In addition, as far specific characteristics of a turbine-generator set are concerned, using the proposed control method (by appropriate tuning of performance indices) clearly leads to improvement in the quality of energy generated by the turbine-generator set. It reduces rotor speed fluctuations in dynamic conditions for arbitrary load changes or for changes in a shaft torque, being typical cases in the system with renewable energy sources present. A proper tuning of controllers is followed by the possibility to fix the properties of transient- and steady-state performance in closed-loop systems [4]. To be able to evaluate the properties of such systems in a qualitative manner, performance measures need to be introduced first. These should be related to the desired properties of specific responses, and thus should be expressed in terms of both transient- and steady-state performance [5].
The obtained closed-loop system, after tuning, is a result of a compromise between the aforementioned factors, as usually steady-state error rejection is the adverse requirement with respect to the stability margins one, and it is impossible to meet contradictory aims simultaneously [6]. A shortlist of these might include: good regulation against disturbances, desirable response to commands, maintaining low amplitudes of critical signals, etc. To override this problem, it is advantageous to introduce integral performance indices to conveniently mirror the performance of the control system [7].
The integral indices assessing the control performance are widely used at the optimization stage in a minimization task of a selected performance-related cost function. To make the results portable across various platforms and applications, asymptotic tracking is usually evaluated for a span of different types of reference signals, such as a unit step, ramp or parabolic inputs, as a basic control task in feedback systems [8]. In such an application, the presented integral performance-related indices, using the information concerning the tracking error in the closed-loop system, are used as quantitative measures of the control quality. In this case, the attained minimum, coupled with selection of controller gains, mirrors the fact that optimal control policy is obtained [9].
Typically, quality indices found in the literature focus either on long-term quality assessment in order to analyze the network or on evaluating electric power suppliers. In [10], the indices are proposed to analyze the quality of electricity every month to give scores to different utility companies, whereas in [11], the authors analyze the situation in the Italian power system in the long term, looking into the continuity of supply and differences in quality between the north and the south of the country. In [12], the usage of wavelet packet transforms to measure non-stationary power quality disturbances, and in [13], wavelets are used to visualize time-varying power quality indices. Some authors use probabilistic methods to assess the power quality using Markov models [14] or the Monte Carlo method [15]. The authors of [16] use neural networks to classify the disturbances occurring in the system offline. Paper [17] contains an overview of commonly used voltage characteristics such as 10 min voltage and total harmonic distortion factor (THD) averages, 10 s frequency averages or 2 h long-term voltage fluctuation analysis. What is more, the authors of [18] use machine learning and artificial neural networks to analyze the power quality in a specific site using common parameters counted as 10 min averages as input. The aforementioned approaches focus on a single power quality index (e.g., total harmonic distortion). On the contrary, the global quality indices (GPQI) [19] proposed in the literature are based on 10/15 min time frames for which quality indices are calculated and then aggregated into a single index showing the global quality.
Despite a very valuable analysis of power quality indices, all of these approaches have, unfortunately, general (site assessment and company assessment) and long-term (10 min, months and years) focus and cannot be used in the case of control system analysis and synthesis where physical processes occur within milliseconds. Therefore, a new approach focused primarily on this particular issue is needed, which constitutes the motivation to undertake the proposed research project. The proposed quality index is expected to be able to properly assess power quality but at the same time must be useful for control systems analysis, synthesis and parameter tuning.
The presented literature review shows some separation of electrical engineering from control engineering. New publications in the field of control engineering analyze new approaches in isolation from the specific case of controlling the turbine-generator set of a nuclear power plant. Publications in the field of electrical engineering, in turn, focus on a detailed analysis of individual energy parameters, or on a global analysis of energy quality but over long periods of time. The presented article connects the achievements of control theory with the achievements of electrical engineering, and thus fills a certain gap between these areas. The conducted research is the starting point for further development of better control systems in the power industry.
The main novelty of the solution presented in the paper is the use of global quality indices with characteristics suitable for use in the synthesis of used control systems. The presented solution takes the analysis of critical parameters from the point of view of the control system of the turbine-generator set and analyzes the data taking very high resolution into account. This is to correctly assess the quality of the control system and to find the optimal controller parameters, which is not possible with the use of widely used individual, classic quality indices.
The main contribution of the work is the confirmation that the integral indices of electric power quality developed in this paper allow to determine the quality of the control system with a single value capturing its viable characteristics. This type of approach significantly facilitates the analysis and synthesis of control systems. The model predictive control technique was applied to control the turbo-generator set, and its synthesis is based on the proposed indices.
The paper is structured as follows: Section 1.2 describes the electrical power quality definition used within this paper. Section 2 discusses the problem including the description of the power quality indices that can be found in the literature. Section 3 describes the turbine-generator set control problem which is the basis for further considerations, while Section 3.2 presents the proposed integral index. Simulation results of computing indices’ values for several control systems with different parameters are presented in Section 4. The article ends with a conclusion resulting from the conducted research and lists the directions for further research.

1.2. Electrical Power Quality

As per the selected subject of the presented research, it is to be mentioned that the definition of energy generation quality depends on the loads considered and the way in which energy parameter deviations affect their final values. The definition is very customer-oriented, where a quality-related problem is defined as follows [20]:
Any power problem manifested in voltage, current, or frequency deviations that results in failure or misoperation of customer equipment.
A few types of such quality problems can be found in the literature, for example, see [17,21], among which one can list amplitude related, waveform disruption related, balance related and frequency related (Figure 1).
As a nearly perfect sine-wave, voltage is generated by the generator [20], the current- and harmonics-related problems are omitted in this paper, since the turbo-generator set control system has no influence on these quality problems, and hence, including these phenomena in the control-oriented indices would not result in any solution improvement. Therefore, only voltage dips, swells, undervoltage, overvoltage, voltage fluctuations and frequency variations are considered in the paper, (highlighted in bold in the previous paragraph).
The turbo-generator set control system should not introduce such problems as they can influence a large group of energy consumers [17], namely: CNC machines, adjustable speed drives, personal computers, programmable logic controllers (PLCs), relays, contactors, motor starters, fax machines, metal-halid and high pressure sodium lighting, telcom switching equipment, electronic ballast fluorescent lighting, etc.
When solving voltage and frequency stabilization control problems resulting with no disruptions in the electrical power system (EPS) given rise by the turbine-generator set, all the considerations presented above must be taken into account. To ensure high quality of stabilization, quality indices must be introduced to properly measure the results of the controller’s actions, and mirror the expectations of the designer. From this viewpoint, the power quality index for control purposes is defined in the paper as:
The index that can quantify the behavior of the power system assessing the scale of power problems manifested in voltage, current, or frequency and that can be used for control system synthesis and evaluation.
The next Sections describe the details of the introduced control problem and introduce such control-oriented indices in a form of ISE/ITSE integrals.

2. Problem Description

Conditions of normal operation usually stipulate nominal values of signals from the networked system. These have also been used here to construct performance indices measuring the degree of deterioration from the expected conditions of work.
In contrast to the energy-generation perspective, the following time-related indices can be listed from a control-engineering-oriented point of view among others from this discipline:
  • Overshoot—the largest, transient, deviation from the voltage set point;
  • Stabilization time—the time after which the error is smaller than a certain deviation ϵ r ;
  • Rise time—the time for the controlled variable to rise from 10% to 90% of its final value or Δ Y / Δ t rise rate.
The instruction for operation and exploitation of the transmission network [22] gives the value t r 0.3 s for the generator voltage controller U g for ϵ r 0.5 % and a jump of 10% of the value and ϵ p 10 % at generator idle state and ϵ p 15 % at start-up, and the regulation speed must be greater than 1.5 U n / s .
In the literature [23], one can also find a presentation of the criteria for assessing the quality of regulation for electrical energy production, split into the following sub-criteria:
  • Standard deviation
    for which (1) is calculated for n measurements every 15 min during one month
    δ = 1 n i = 1 n ( f i f ref ) 2 ;
  • Amount and time of deviations greater than 50 mHz from the nominal frequency;
  • Trumpet characteristics
    must be met by the control system and are the requirement to contain the frequency waveform inside the trumpet characteristic after a sudden load step change. The curve is described by a pair of Equations (2) and (3),
    H ( t ) = f 0 ± A e t / T for t 900 s ,
    H ( t ) = ± 20 mHz for t 900 s ,
    and defines an envelope-like bound on the transients where:
    • t = 900 s is a stabilization time of 15 min;
    • the constant A defines the trumpet characteristic width factor depending on the size of the power disturbance and the characteristics of the power system.
The Polish power system belongs to the European UCTE system, for which the above-mentioned width of the trumpet characteristic is defined as (4).
A = 1.2 | Δ P 0 | α K fMW / Hz + 0.030
where:
  • α is a share of the regulatory area in energy production,
  • K fMW / Hz denotes the power frequency equivalent defining the change in power in MW for a change in frequency by 1 Hz determined for the entire system.
On the basis of these requirements, it can be determined that with jumps of several hundred MW (e.g., failure of a generating unit) the permissible temporary frequency change is several dozen mHz , and after 15 min the deviation should be less than 20 mHz [23].
Additionally, a harmonic distortion can be evaluated by calculating the total harmonic distortion (THD) factor [17], but as mentioned, this type of disruption is be analyzed for control purposes in this paper.
In the literature, the aggregated global power quality indices (GPQI) can also be found. In [19,24,25], two such indices are proposed and used in a form of:
  • ADI— Aggregated Data Index;
  • FDI— Flagged Data Index.
ADI is a sum of a set of quality parameters calculated in the 10-min time frames:
ADI = n = 1 7 k i W i
where:
  • i is the number of the quality index;
  • k i are the weights to balance all the components;
  • W i are power quality parameters such as frequency change, voltage level, voltage variation, flicker severity, voltage unbalance, harmonic distortion and voltage change.
The second index, FDI, is used to aggregate all the event-related quality problems, i.e., dips, swells and interruptions. This index determines in percent how many of the 10 min periods were disrupted:
FDI = f n × 100 %
where:
  • f is the number of the 10 min period with disruptions,
  • n is the number of all 10 min periods.
ADI and FDI are used in [19,24,25] for the network with distributed generation analysis. The cons of this global power quality indices in this form are that they are calculated over a longer period of time using long time frames and that they also include quality parameters not essential for control purposes.
Therefore, for the control system synthesis, a more precise index is needed. The paper proposes using the integral power quality indices that operate on the shorter time frames and leverage only the control-related parameters. The integral indices assessing the control performance are widely used in the controllers’ analysis and synthesis to optimize the performance of the control system and—as a result of that—the whole controlled plant. As mentioned above, optimizing the operation of nuclear power plants is an important issue due to the dynamic development of renewable energy and thus control-oriented indices are needed to properly assess the power quality and performance of the plant. Said indices are presented in the following section.

3. Model and Methods

The classic generator regulation system consists of an excitation controller; its task is to maintain a constant value of the generator voltage and a power system stabilizer (PSS). The additional system of the system stabilizer, through the correction of the set value, minimizes the oscillations of the active power transferred to the power system caused by the operation of the excitation controller. The system stabilizer generates an additional control signal for the generator controller, which dampens potential electromechanical oscillations and improves the dynamic stability of the turbine-generator set connected to the power grid.
In most cases, linear generator controllers are used, which in majority are based on the proportional–integral control (PI) principle. These systems are additionally equipped with a number of modifications and artificial constraints as to ensure safe operation of the turbine set. In addition, these systems receive voltage and power set values from external control systems that ensure appropriate parameters throughout the whole electrical power system (EPS) and appropriate load distribution between generating units.
The steam turbine works with a synchronous generator connected to the power grid. The turbine PI controller regulates the active power of the generator by manipulating the steam flow to the turbine and consequently affecting the torque on the assembly shaft. The active power of the generator is proportional to the torque, so the supplied mechanical energy and the received electrical energy must be in balance with the accuracy of losses—mechanical, thermal and other.
On the other hand, a PI controller of a generator regulates the voltage at the generator terminals by manipulating the excitation voltage (the non-linear relationship between the controller signal and the rectifier voltage is compensated accordingly). As shown in Figure 2:
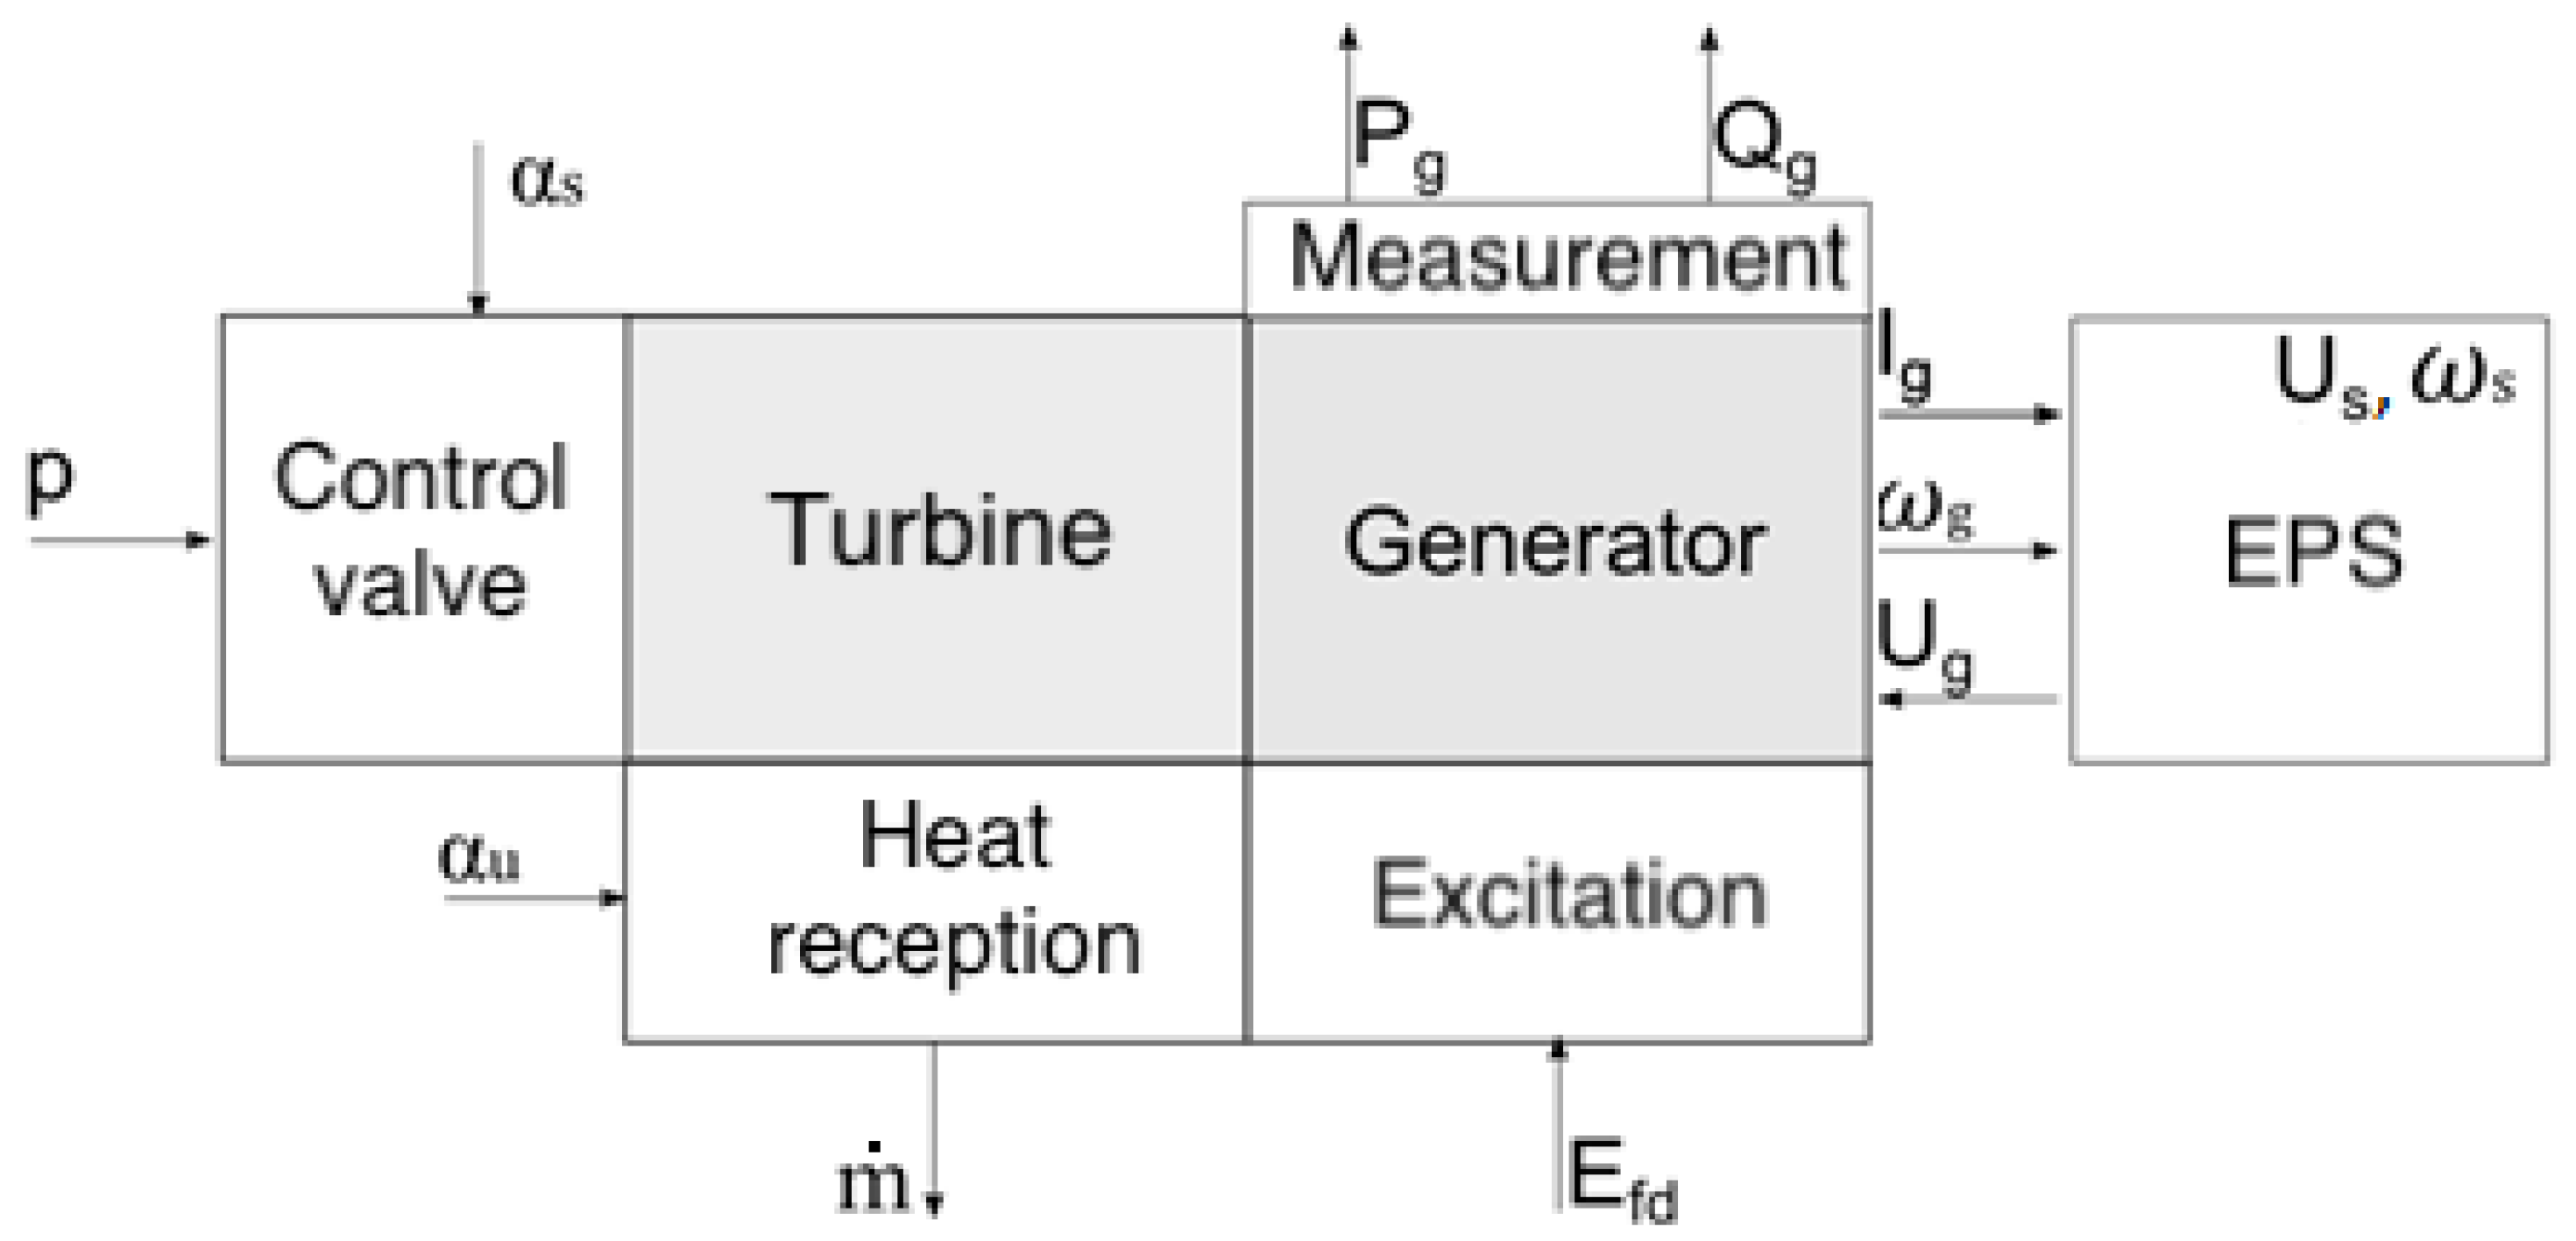
Figure 3 presents a turbine-generator block diagram, where:
  • P g —active power;
  • Q g —reactive power;
  • U g —generator’s voltage;
  • I g —generator’s current;
  • ω g —generator’s angular speed;
  • E f d —excitation voltage;
  • U s —Power system’s voltage;
  • ω g —Power system’s voltage frequency;
  • p—steam pressure;
  • α s —control valve opening;
  • α u —steam vent valve opening for the heat generation;
  • m ˙ —mass flow of the steam for heat generation;
  • α s —control valve opening.
As already mentioned in the study, appropriate models of simplified components were used for the synthesis of the turbine set control systems. The starting point for their development was the structure of the turbine set input–output model (Figure 3), which input quantities were the control valve opening degree ( α ) and the generator excitation voltage ( E f d ), respectively. The outputs can be listed as the power and voltage of the generator ( P g and U g ), with the thermal load (Q) being treated as a disturbing input. Such a departure naturally leads to the internal structure of a simplified model built on the basis of four main information processing paths in the following input–output configurations: α P g , α U g , E f d P g and E f d U g .

3.1. Model Predictive Control

In this paper, instead of the typical integral-derivative blocks of the controller, the quadratic dynamic matrix control (QDMC) variant of an MPC controller for the purpose of control of a synchronous generator is suggested [26]. In order to obtain improved quality in the closed-loop system, i.e., the quality in a control loop taking the performance of the turbo-generator, some extent of the exchange in information between the quadratic dynamic matrix controller and the environment form is required. This is performed by introducing an additional signal between the controllers, i.e., rotational speed ω , active power P g or the steam turbine’s control valve opening degree α . In addition, in order to also take the continuously changing setpoint of the system, a recursive least-squares (RLS) algorithm is adopted here.
The proposed approach is not standard in the power generation industry or in power plant control, though it offers an easy replacement to the PID control-based algorithms [26]. As per the optimized solution of the MPC problem, not only does it take a complete set of plant-related constraints into consideration [27], but it also offers the optimal solution of the defined control problem. Since this approach can be easily reconfigured (for example by stipulating appropriate horizons of control, prediction, etc), the performance of the control law can easily mirror the expected behavior of the closed-loop system. In this paper, the parameters are adopted as to mimic the requested properties of the process.
The block diagram of the system consisting of a predictive controller (MPC) and the recursive estimation scheme (RLS) is presented in Figure 4. The solutions obtained for this considered control law, are compared among one another for various sets of configuration parameters to distinguish between those offering poor, moderate and superior performance.
The linear step-response model of the process is used in classical QDMC methods to estimate its future states [28,29]. Taking both free and forced response components for a multi-variable system with s inputs and r outputs, the following model is considered:
y ̲ k + 1 k = y ̲ k + 1 k 1 + A Δ u ̲ k + y ̲ k + 1 k d ,
with sample number denoted as k and conditional estimate of the future sample as y ̲ k + 1 k . The sought sequence of control signal updates calculated in m steps ahead is denoted as Δ u ̲ k
Δ u ̲ k = [ ( Δ u 1 ( k ) , , Δ u s ( k ) ) , , ( Δ u 1 ( k + m 1 ) , , Δ u s ( k + m 1 ) ) ] T ,
comprising m values for all s inputs. For the details of the derivation of the model, and for the sake of brevity of this paper, please consult [30,31,32,33]. The optimal control update is found by solving the following problem at every sample k [28,29]
min Δ u ̲ k J = [ y ̲ k ref y ̲ k + 1 k ] T Γ [ y ̲ k ref y ̲ k + 1 k ] + [ Δ u ̲ k ] T Λ [ Δ u ̲ k ] , s . t . y ̲ min y ̲ k 1 k y ̲ max , Δ u ̲ min Δ u ̲ k Δ u ̲ max , u ̲ min u ̲ k u ̲ max ,
with u ̲ k as a vector of control signals calculated on the basis of updates, Γ > 0 as a weight matrix and Λ 0 as control update penalty term. The notation from Table 1 is used for the described model.
The constrained quadratic programming task in (9) is used to calculate optimal control updates, implemented to the plant on the basis of a receding horizon rule. The control updates are found with a sampling period compatible with the documentation of the GTHW-600 generator [34], of which the dominating time constant is estimated at T ^ = 0.0017 s . As per a rule of thumb, to ensure at least 10 sampling periods in a dominating time constant of a model, the sampling period of T = 0.00001 s was selected. In relation to this period, the output prediction horizon should fall within 10 ÷ 20 samples, or 0.0001 ÷ 0.0002 s in the time domain.
The QDMC scheme can be adopted in the structure as in Figure 5. In order to obtain an optimized performance, the time-related response of the model is calculated on the basis of its identified model, following possible changes in operating points. The discussion considering a proper selection of the orders of the model of the system can be found in [30,31,32,33].
At every discrete time instant (i.e., every action taken by the QDMC controller), and for the considered structure of a discrete-time model of the plant, its parameters are estimated via RLS scheme, the step response of the multi-variable model is calculated and adopted into the MPC scheme.
It is to be mentioned here that solving an MPC problem via QDMC framework is not a bottleneck, as the solution is obtained on the basis of either efficient interior-point algorithms or on the basis of an active-set method.
At the moment, the MPC algorithms are implemented in FPGAs or efficient microcontrollers [35] and microcontrollers [36,37] to allow real-time performance, or to offer a distributed approach to MPC control of the nuclear power plant turbine set in real time.

3.2. Methodology

In order to develop an MPC controller, it is necessary to define a cost function that is used in searching for the optimal control updates which, in the context of this paper, are such that a signal for which a minimal control deviation is attained while stabilizing the voltage and angular speed of the generator while following the set active power trajectory. Each of the criteria presented in Section 2 is of a different nature and are responsible for limiting the impact of disturbances on the controlled quantities (frequency, amplitude and decay time of voltage and power and generator angular speed oscillations) or takes parameters calculated over longer periods of time into consideration. It is necessary to find the appropriate function that allows to aggregate all the requirements resulting from the operation and operating instructions. An additional component of the criterion function, which it can be extended with, are the values of control signal updates (change in the excitation voltage Δ E f d and change in the opening of the control valve Δ α ). Such an extension of the criterion allows one to determine the quality of the regulation in relation to its cost (energy expenditure on control effort).
Advanced control systems can use the model of the power plant’s turbo generator set as a whole, and thus, the quality indices must take the impact on the quality of both the amplitude and the frequency of the voltage into account. Therefore, ISE- and ITSE-related indices are proposed for assessing the quality of regulation. The ISE criterion takes the following controlled quantities: voltage U g , power P g and frequency ω g combined into a sum of squares-like expressions with a set of weights that determine the share of each component in the sum. Meanwhile, the ITSE index should additionally allow one to assess the accuracy of voltage amplitude and frequency stabilization (minimization of the error in normal operation) and to take the stabilization time into account by increasing the error severity at later times (reduction in disturbances according to trumpet characteristic). Contrary to the ISE index, which is an integral of the squared error (10), it allows not only the amplitude of the disturbances to be taken into account but also the rate of their suppression, as per the weighting factor interpretation of the time product. The proposed ITSE index is used to compare the quality of various analyzed control systems. This criterion can be represented as (11). It is a starting point for further considerations regarding the selection of the best control system selected by means of—first—parameter optimization for a proposed control structure—and next—comparison of a series of different solutions (i.e., selecting the one that provides the lowest value of the index compared with the others).
Criteria (10) and (11) aggregate quality indices (1)–(4) by taking into account deviations from the set points of voltage U g , active power P g and frequency ( ω g ). Thanks to this, all deviations and oscillation fluctuations of these quantities are taken into account. The authors have decided to use the above-listed criteria, modified with the use of a linear combination of sub-integral expressions, as per their ability to capture viable properties of the well-tuned control system in power generation tasks. Control performance in this case replaces a number of classical power generation-related criteria, with a single number capturing important characteristics.
In order to assess the deviations of various origin in a single criterion, it is necessary to assign appropriate weights. Therefore, relative values of these quantities related to their nominal values were used. Additionally, the weights ( a , b , c , d , e ) were used to enable the change in the influence of each component of the sum on the final value of the index in order to increase the impact of one of the component’s criteria.
The article analyzes two different sets of weights to illustrate their impact on the results and usability of the proposed indices. As the base case, a set of weights equal to one was selected ( a = 1 , b = 1 , c = 1 ). Since the sum component responsible for the active power P g (weight a) is significantly dominant, the second case was chosen, in which a lot of emphasis is placed on changes in the ω g speed and changes in the voltage U g , i.e., with the weight a = 1 , the weights b = 1000 and c = 1000 were adopted. This is to increase the sensitivity of the index to the appearance of unwanted oscillations in the system.
f ISE = a ( U g , ref U g ) 2 + b ( ω g , ref ω g ) 2 + c ( P g , ref P g ) 2 d t
where:
P g , P g , ref are the active power and active power set-point;
U g , U g , ref are the voltage and voltage set-point;
ω g , ω g , ref are the angular speed and angular speed set-point;
a , b , c are the weights.
f ITSE = a ( U g , ref U g ) 2 + b ( ω g , ref ω g ) 2 + c ( P g , ref P g ) 2 t d t
The weights a, b and c were selected so that it is possible to:
(a)
Equalize the effect of factors on the overall result, as the power set point following error is of a much greater value (different order of magnitude) than the voltage amplitude and frequency fluctuations. Increasing the weights b and c allows taking the influence of these factors on the final result into account;
(b)
Distinguish between two contradictory tasks of the control system: following the active power set point and stabilizing the voltage amplitude and frequency. Due to internal interactions in the turbine-generator set, minimizing the power set point following error leads to the appearance of voltage amplitude oscillations. Therefore, further increasing b and c weights allows giving these components of the equation a dominant influence on the solution, i.e., to enhance the stabilizing effect of the system.
The next Section presents the results of simulation tests for three different sets of weights to show these three types of behavior:
  • Active power following;
  • Balancing the components of the equation;
  • Stabilization of the amplitude and the frequency.

4. Results and Discussion

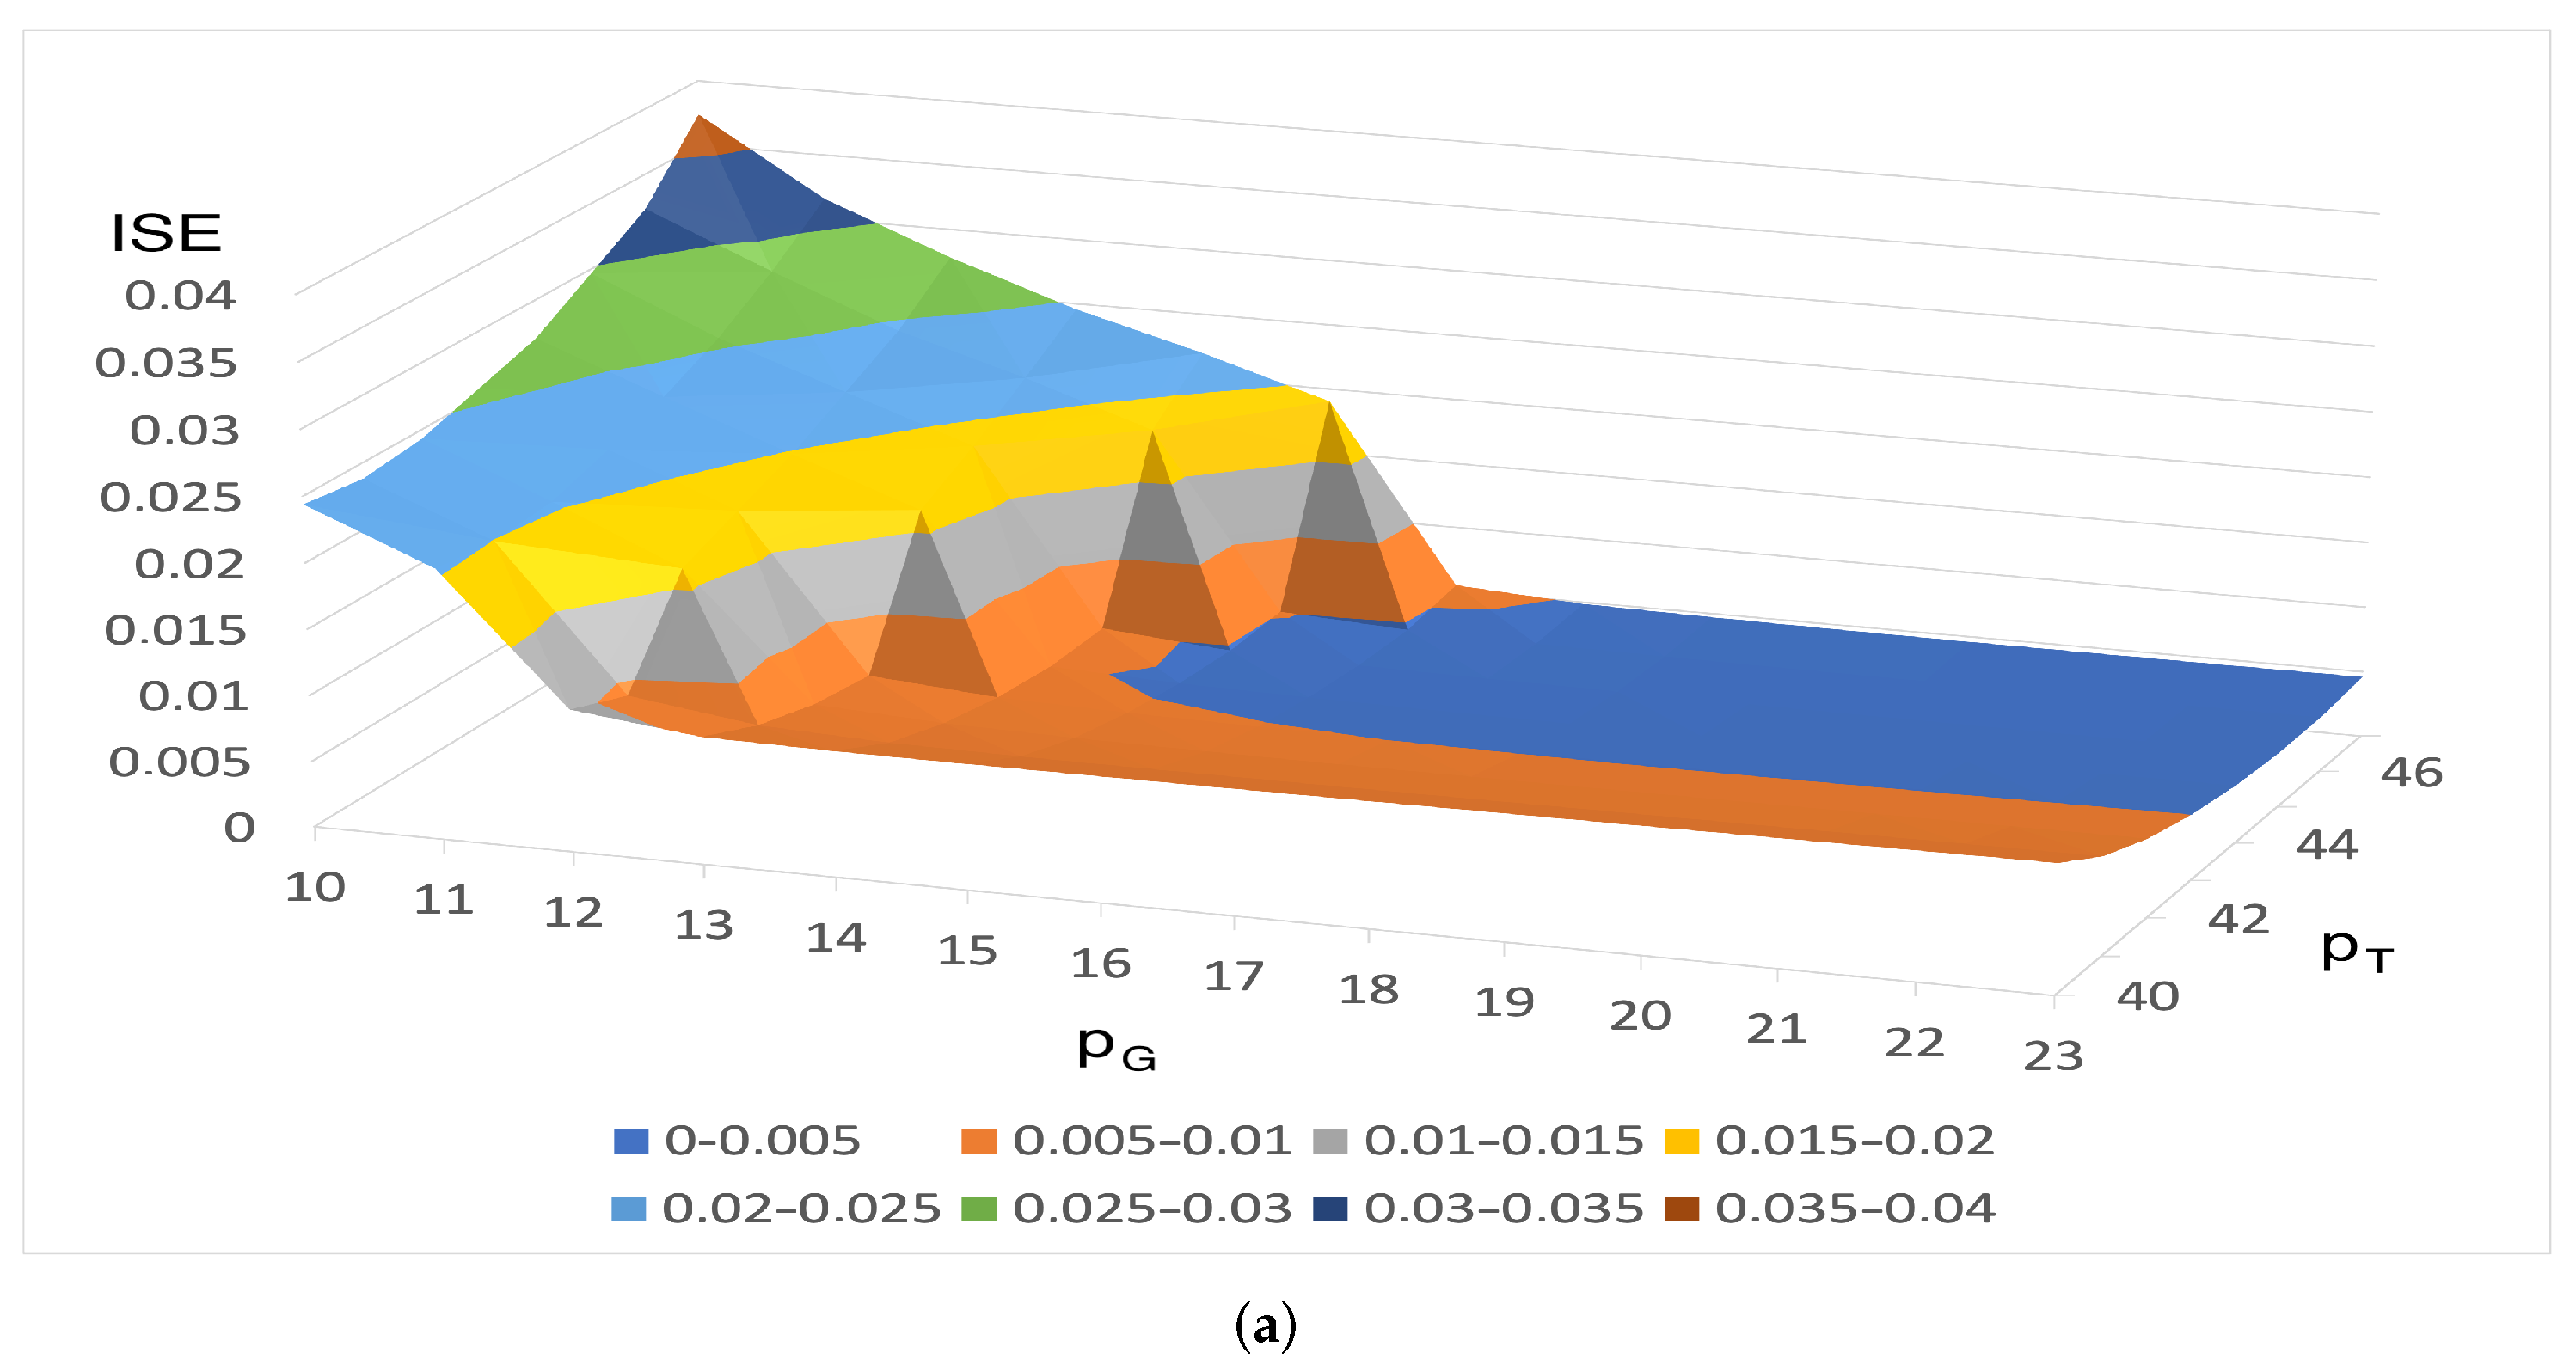
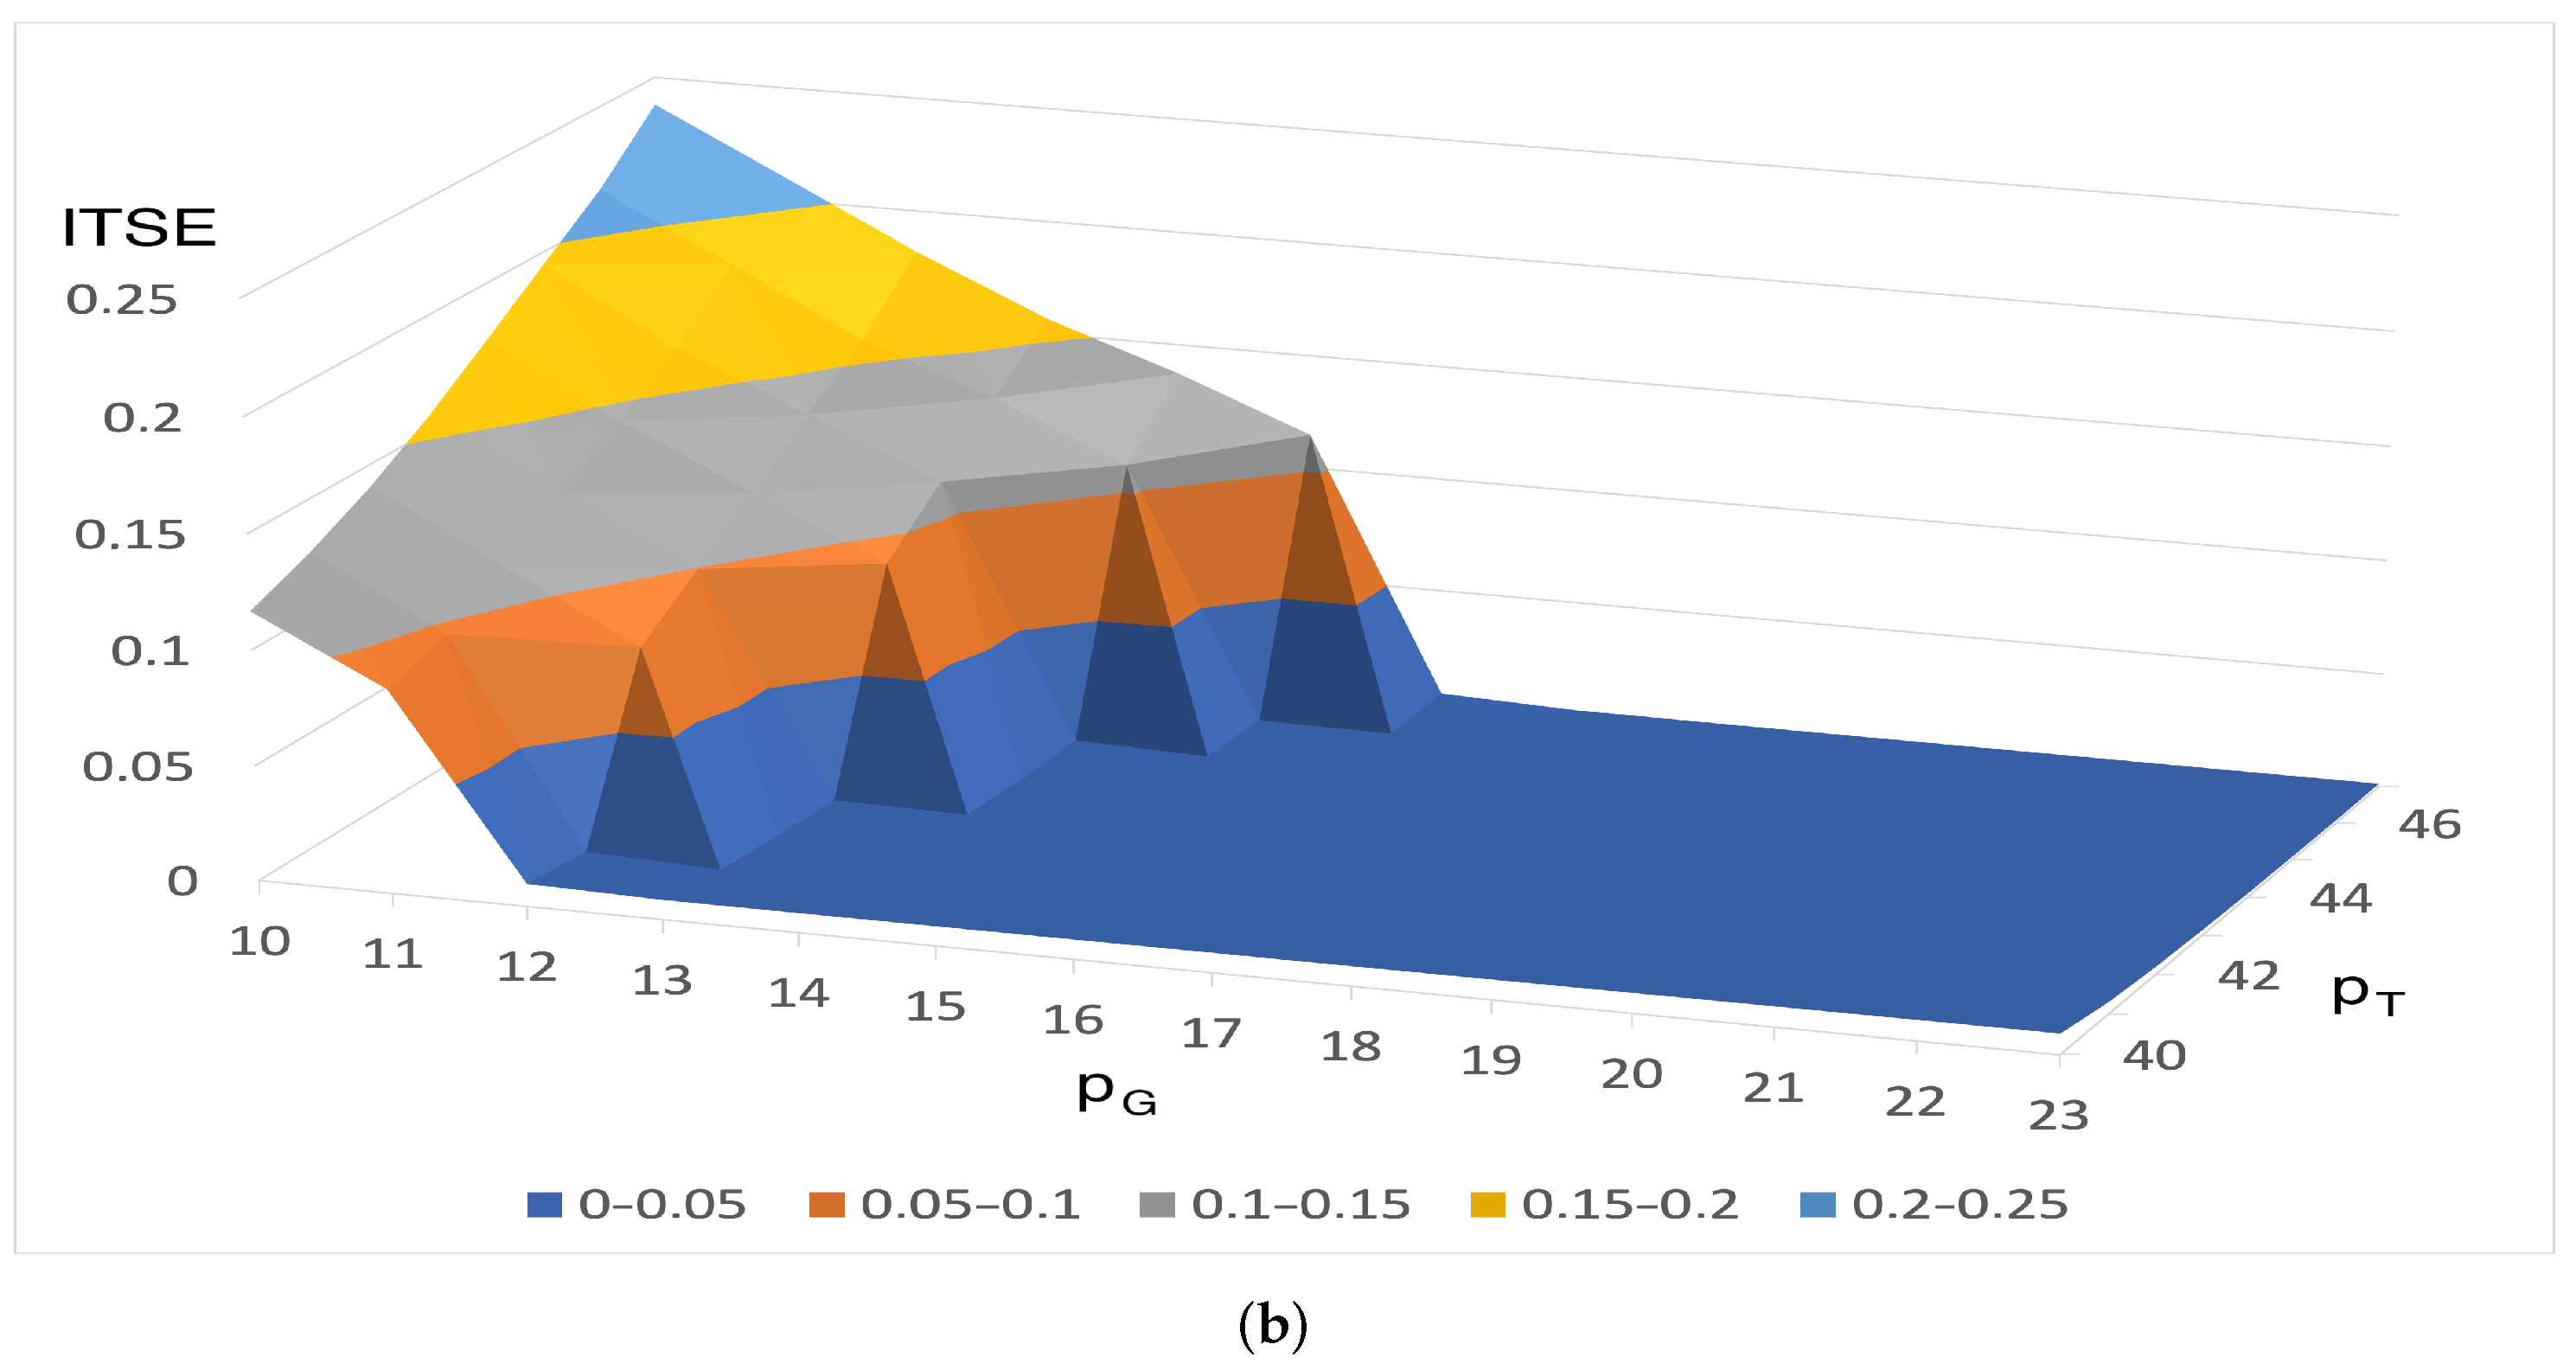
Two types of experiments were performed. The first one was to generate two dimensional surfaces of the ISE/ITSE indices’ values for a control system with two parameters (turbine controller’s prediction horizon p T and generator controller’s prediction horizon p G ). The latter allowed the analysis of the ISE and ITSE indices in a wide range of control cases (672 values—2 indices, 3 sets of weights and 112 different simulations). Based on these results, it is possible to select the best and worst pair of values p G p T for each of the cases (please refer to Table 2):
  • Best/worst based on ISE for weights’ set 1 ( a = 1 , b = 1 , c = 1 );
  • Best/worst based on ITSE for weights’ set 1 ( a = 1 , b = 1 , c = 1 );
  • Best/worst based on ISE for weights’ set 2 ( a = 1 , b = 1000 , c = 1000 );
  • Best/worst based on ITSE for weights’ set 2 ( a = 1 , b = 1000 , c = 1000 );
  • Best/worst based on ISE for weights’ set 3 ( a = 1 , b = 100 , 000 , c = 100 , 000 );
  • Best/worst based on ITSE for weights’ set 3 ( a = 1 , b = 100 , 000 , c = 100 , 000 ).
The received results are shown in Table A1, Table A2 and Table A3 (Appendix A) and in graphical form in Figure 6, Figure 7 and Figure 8.
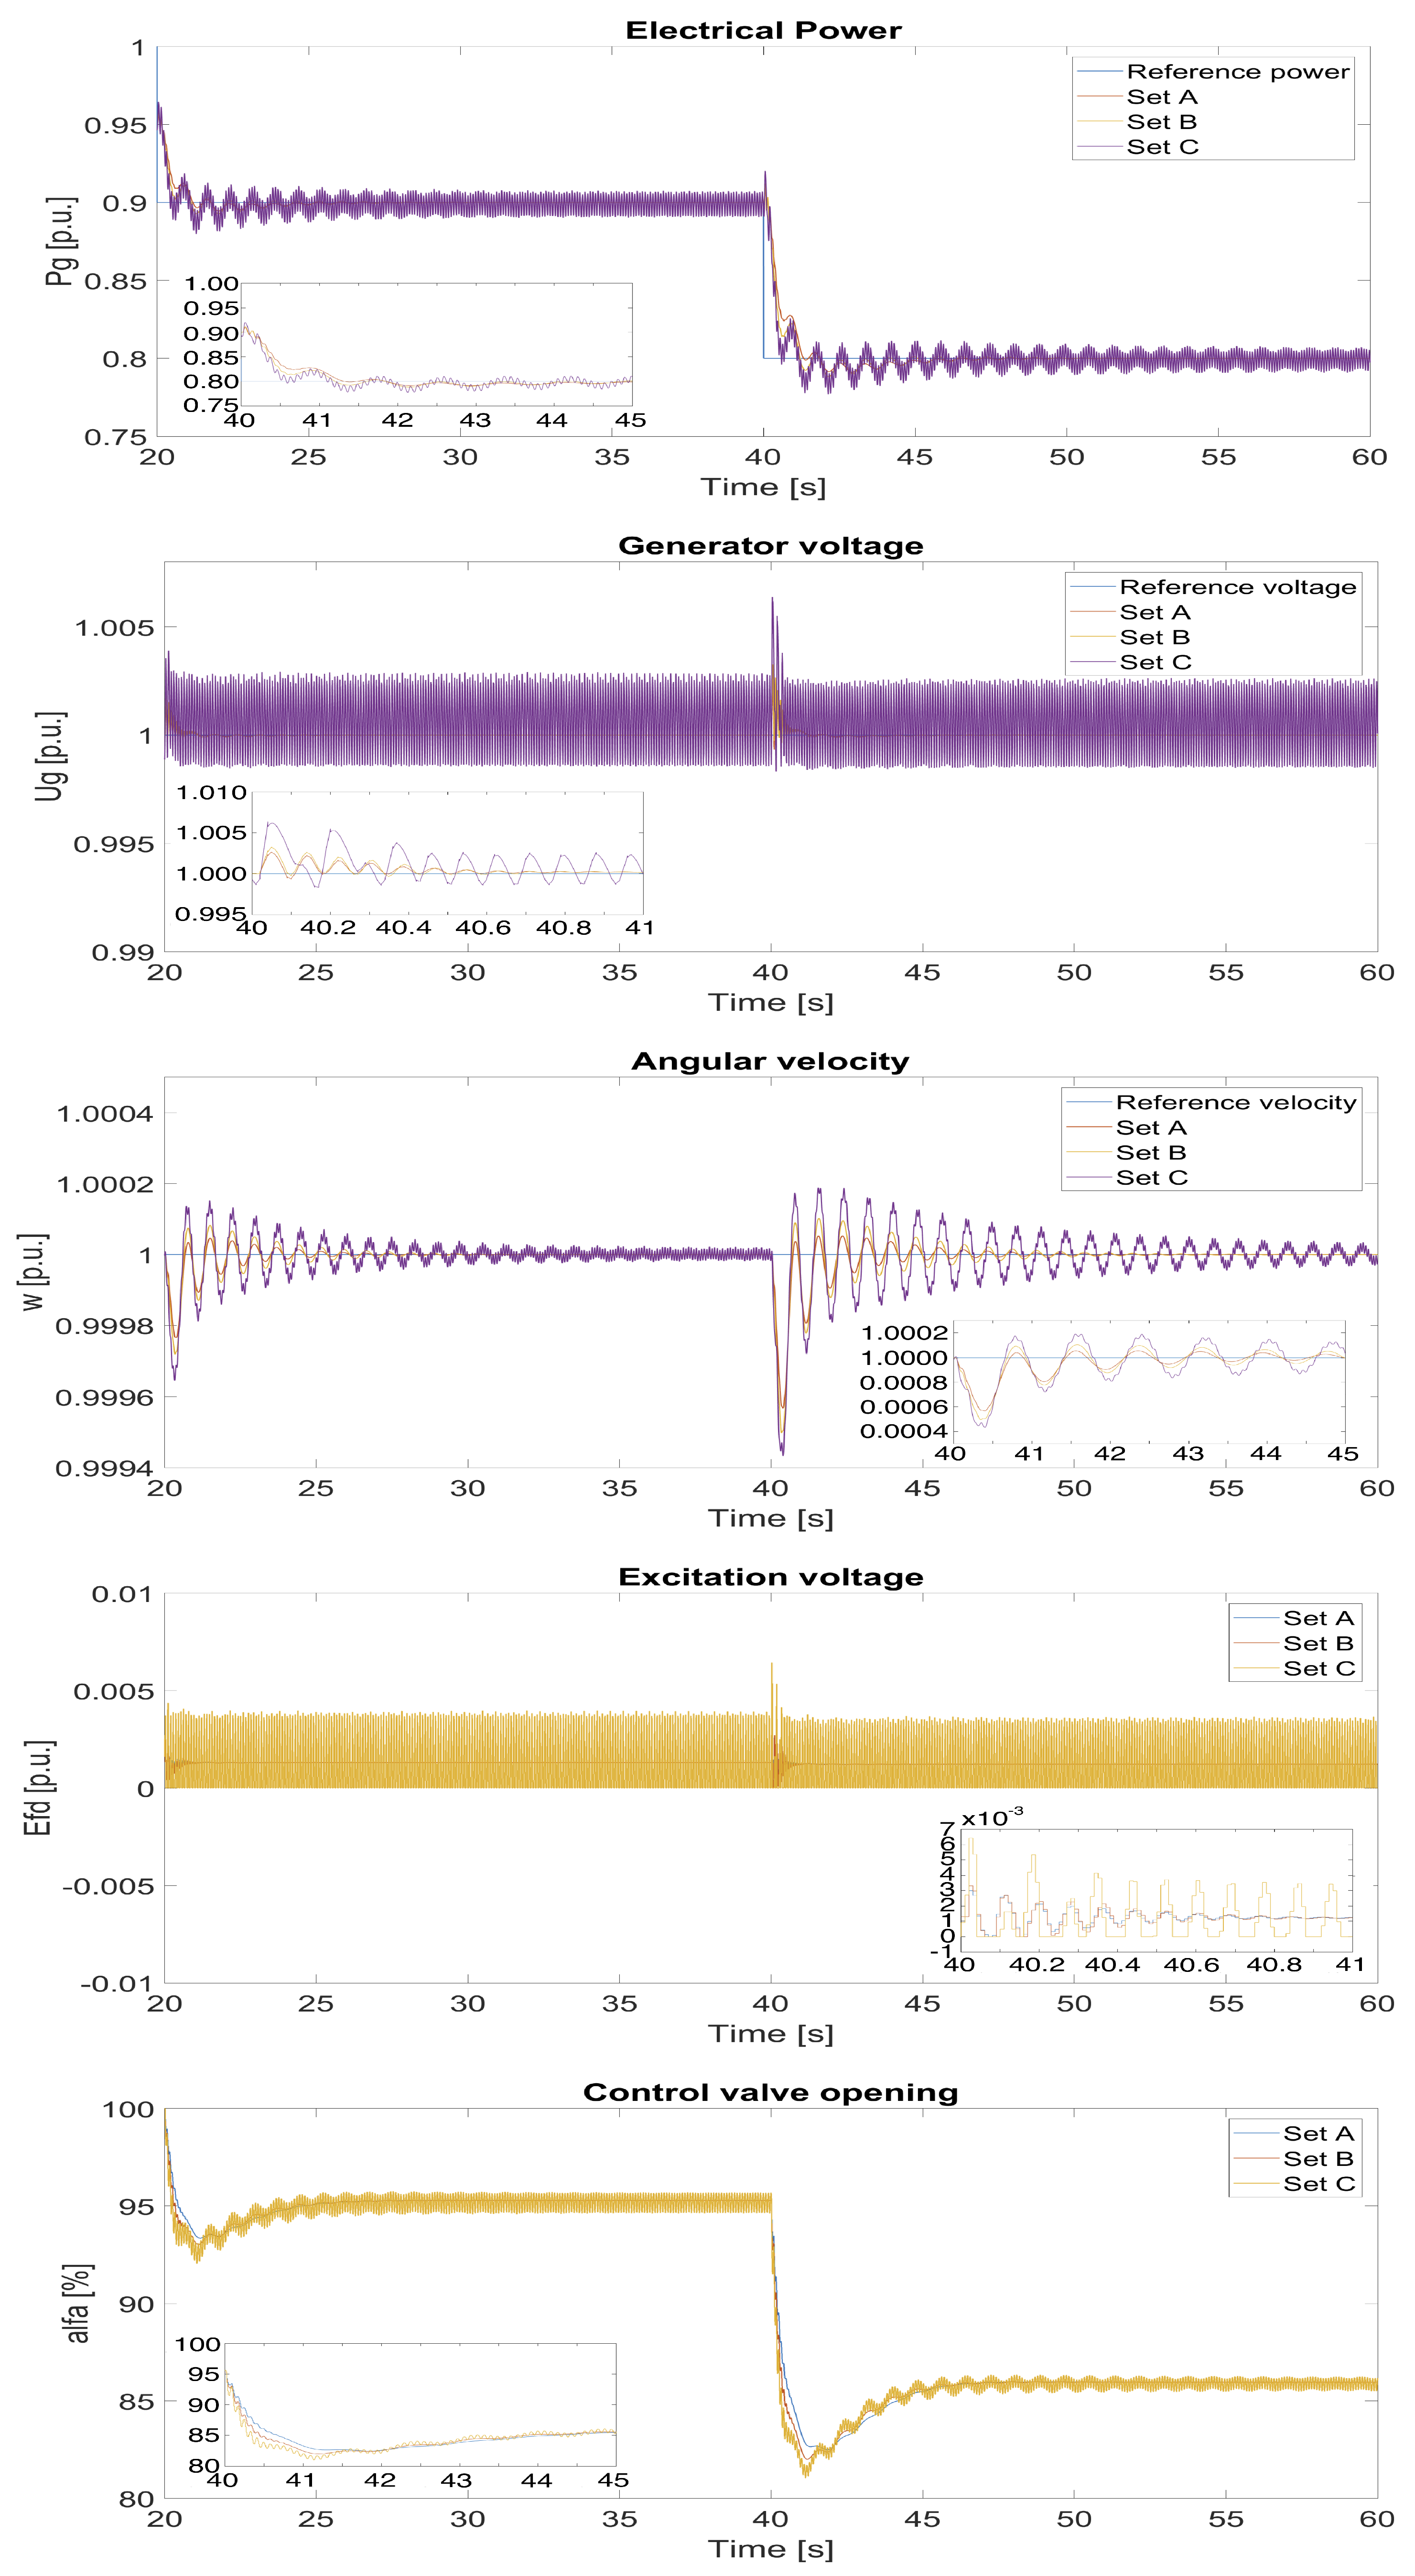
In the second experiment, the simulations were performed in order to compare the process values from the turbine-generator set for those nine cases: the best and worst values of the different indices. The aim of this experiment was to find the relation between the indices and the performance of the plant (specified as the analysis of the waveforms of active power P g , generator’s voltage U g and generator’s angular speed ω g ). The results are presented in Figure 9, Figure 10 and Figure 11.
In the first case (Figure 9), the biggest oscillations are generated by the control system C (the worst ISE/ITSE value). The system B follows the active power trajectory faster but at the cost of the higher angular speed and voltage oscillations. Similarly, in the second case (Figure 10), the system with the worst ISE/ITSE values generates the biggest oscillations. Due to internal interactions between the generator and the turbine, also in this case a slightly better active power control of the system E, worse angular power and voltage stabilization (which is nevertheless better with the system E) is caused. In this case, the differences are not as significant as in the first case. Finally, in the third case (Figure 11), system I introduces the oscillations with the biggest amplitude, while system H follows the active power trajectory best and system G introduces the oscillations with the smallest amplitude. In all the cases (Figure 9 and Figure 10), the oscillations are reflected by the rapid changes of the control signals (control valve opening and excitation voltage), which in real-life application would damage the actuators. Therefore, the systems C, F and I can only serve as an image of the wrong selection of the controller parameters and not systems that may be used in practice. This undesired system behavior is also reflected by the values of the ISE/ITSE indices.
The simulations performed for each group show that the behavior of the system with the worst parameters according to the ISE/ITSE criteria is, as expected, the worst (C, F, I), i.e., there are significant oscillations both in power, amplitude and voltage frequency (angular velocity). The increase in the value of integral indices is clearly reflected in the deterioration of the course of the controlled values. The waveforms for the simulation with the use of the best parameter sets for ISE (sets A, D and G) and ITSE (sets B, E and H) are characterized by much smaller oscillations, lesser overshoot and shorter stabilization time. Improved values of ISE/ITSE indices correspond to better parameters from the point of view of control quality (i.e., classic indices of the control system quality). This also translates into the improvement in the quality of electricity by reducing the amplitude and frequency fluctuations of the voltage.
For the best pairs of ISE/ITSE results for A/B and G/H sets (reduced influence of active power P g on indices in relation to voltage U g and angular velocity ω g ), the power stabilization time is shorter for the best ITSE sets than for ISE sets, but at the cost of increasing oscillations in the amplitude and frequency of the voltage. For the E/F case, i.e., ISE/ITSE, the indices for all weights a, b and c are equal to 1 (equal share of components in the criterion); the waveforms for the ITSE index (set F) are characterized by both shorter regulation times and smaller oscillations of the voltage amplitude and frequency (angular velocity).
The above results are combined together to show the best ISE/ITSE cases for three different sets of weights a, b and c, i.e., comparison for ISE:
  • The best ISE for weights’ set A ( a = 1 , b = 1000 , c = 1000 );
  • The best ISE for weights’ set D ( a = 1 , b = 1 , c = 1 );
  • The best ISE for weights’ set G ( a = 1 , b = 100 , 000 , c = 100 , 000 ).
Comparison for ITSE:
  • The best ITSE for weights’ set B ( a = 1 , b = 1000 , c = 1000 );
  • The best ITSE for weights’ set E ( a = 1 , b = 1 , c = 1 );
  • The best ITSE for weights’ set H ( a = 1 , b = 100 , 000 , c = 100 , 000 ).
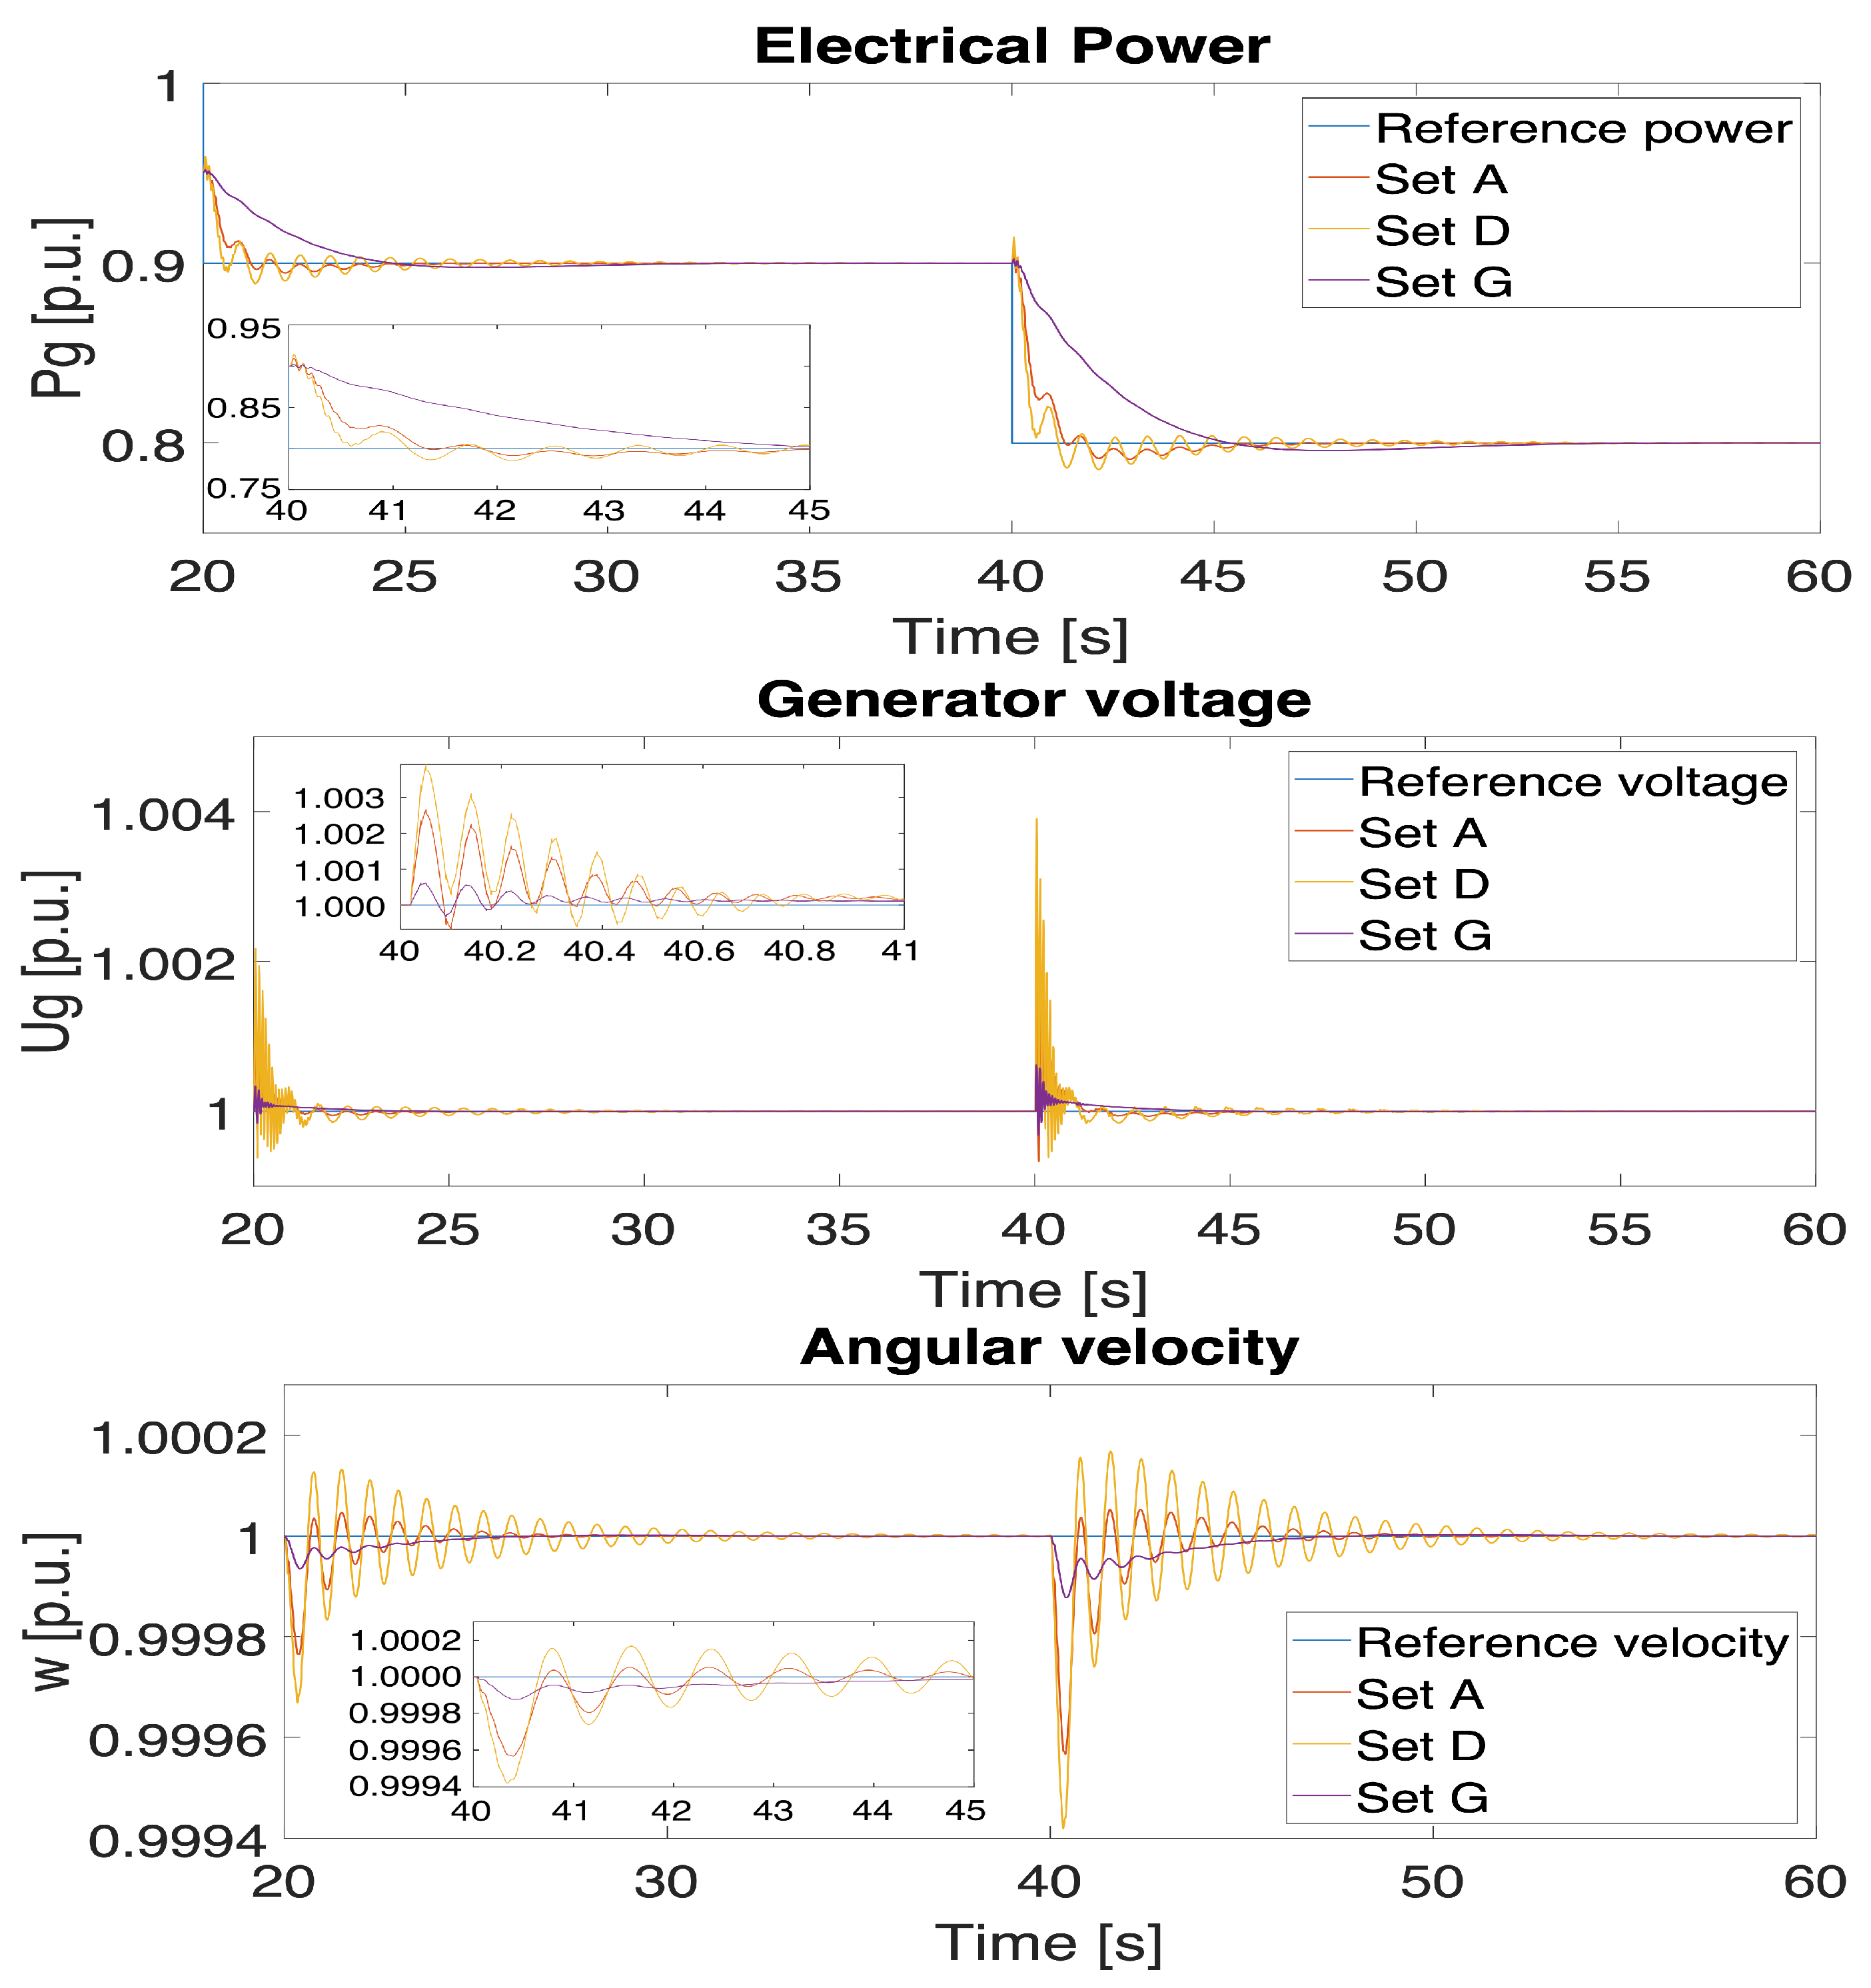
The results in this approach are presented in Figure 12.
Stabilization time of the active power P g for the set D (weights a = 1 , b = 1 , c = 1 ) is shorter as the power takes the dominant part in the index formulation (as mentioned, the active power error has a larger order of magnitude than the other components). Increasing the weights for the generator voltage U g and angular velocity w results in smaller oscillations but also worsens the active power stabilization time. It is caused by aforementioned interactions inside the turbine-generator set.
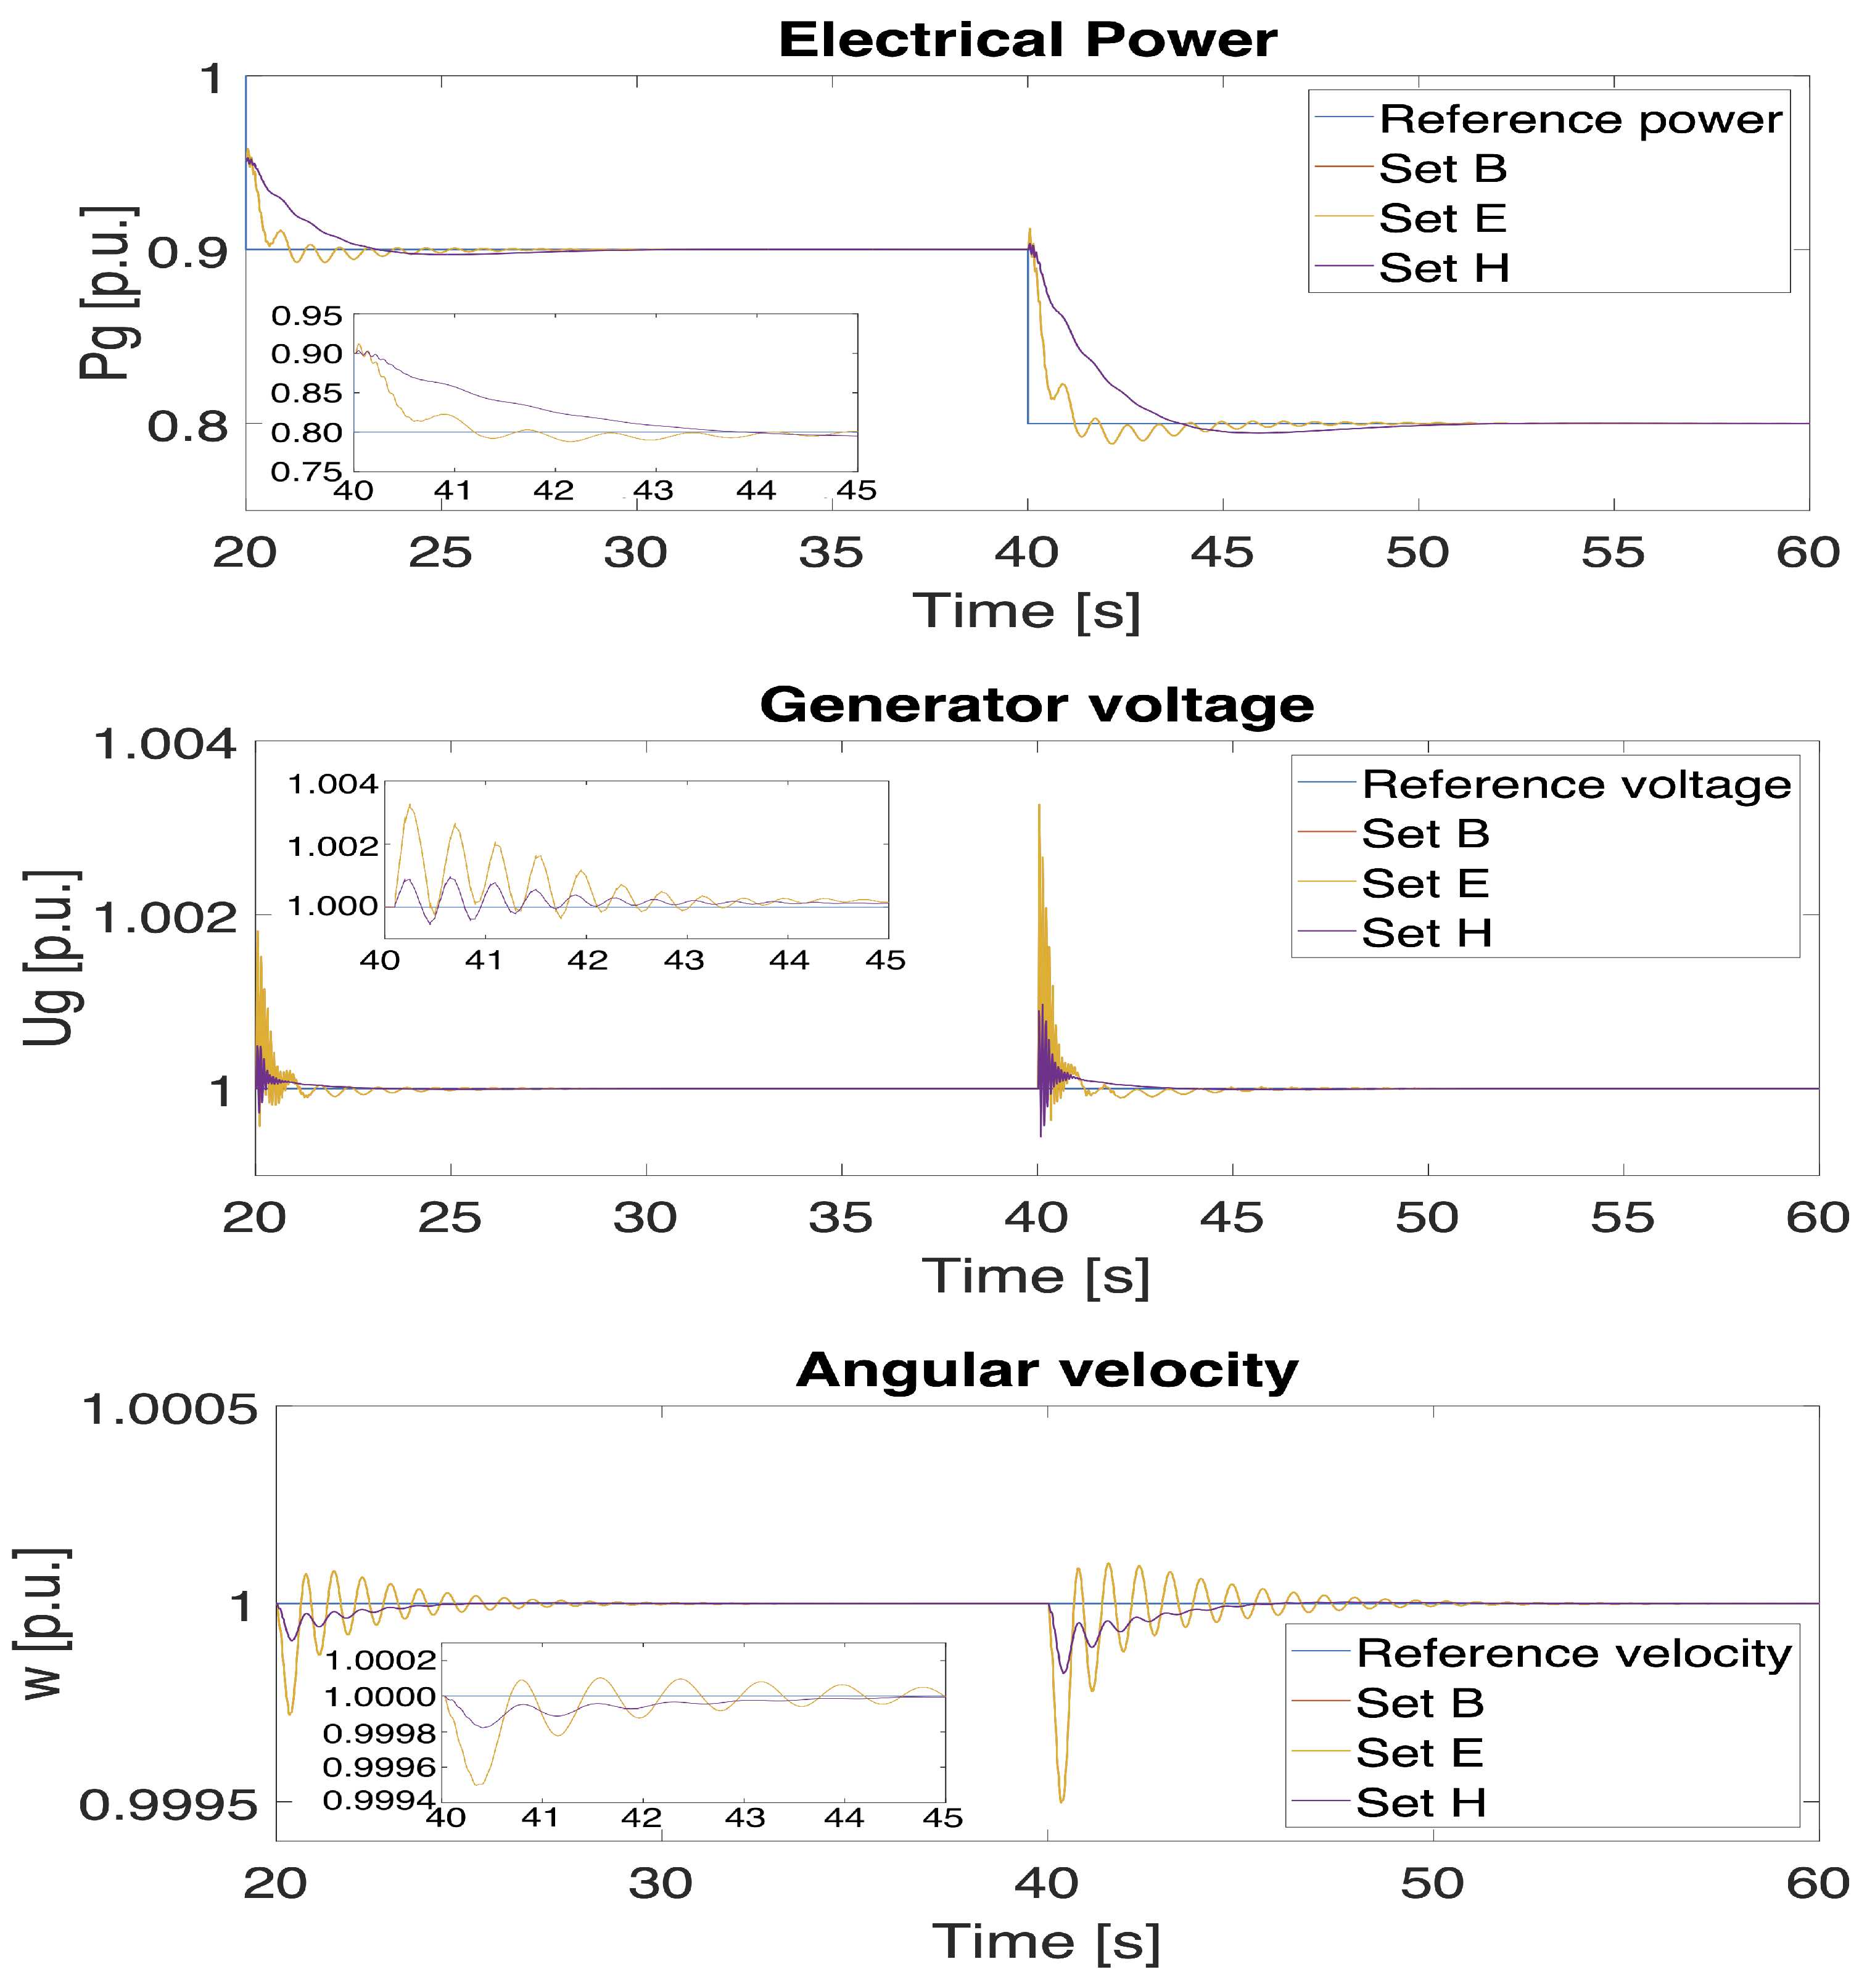
The ITSE index sets B and E are similar (in both cases the same set of parameters resulted in the smallest ITSE value) and, therefore, the graphs coincide (Figure 13).
As in the ISE case, higher values of the b and c weights results in smaller oscillations of the amplitude and frequency (angular velocity) of the generator’s voltage (set H). For ITSE, smaller differences in weights resulted in equal parameters and outputs. Only after drastic weight changes the expected reduction in oscillations is obtained. As mentioned before, this reduction is the desired behavior of the turbine-generator set’s controller and, therefore, this set of parameters results in better quality electrical energy, despite the stabilization time of the active power.
Taking all the results into account, set G mirrors the most desired control system behavior as wave-forms resulting from usage of this parameters’ set are characterized by the smallest oscillations of all cases (at the expense of slower power regulation). The change in the turbine’s control valve opening and the excitation voltage is also milder for this set of parameters, which has a big impact on the actuators exploitation and their up time.

5. Conclusions

The paper presents the electric energy quality indices typically used to define energy quality and proposes the use of the integral index for the synthesis of control systems. Despite the fact that multiple and various indices of the quality of electricity can be found in the literature, they still most often define quality for the purposes of long-term evaluation of energy suppliers, or in fifteen-minute terms for the purpose of checking compliance with the requirements. Both approaches are not sufficient for the synthesis of control systems.
For these purposes, a preferably single index is needed to take the transient states occurring in the system into account, i.e., changes over a period of milliseconds. This paper proposes ISE/ITSE indices in the synthesis of control systems as they are able to combine a set of different requirements in one value, also taking into consideration fast changing values. The paper consists of a in-depth analysis of the proposed indices taking a number of different approaches into consideration, such as the distinction between ISE and ITSE and three different sets of weights in each of the criteria. The presented simulation results are to illustrate how the proposed solution can be used to compare different power and voltage waveforms and what the relation between the values of the ISE/ITSE indices and the actual quality of electricity is.
The proposed solution was designed for control systems synthesis and their quality assessment and is not designed to replace existing indices used to assess compliance with the regulations. As being control oriented, these indices were used to design a set of controllers of a turbine-generator set in a nuclear power plant: a QDMC model predictive controller [38], a distributed model predictive controller [30], a fuzzy controller [39] and a controller using gain scheduling [40]. They were used to tune the control systems, i.e., to optimize the parameters of controllers, and to compare the quality of several different solutions. The results obtained during the aforementioned studies show the practical usability of the proposed indices in the control system synthesis.
The next step should be to define the range of proper, acceptable and bad values, which would enable an independent assessment of the operation of the control system. Without specific standard values for the index, they are only useful in the comparative analysis of two or more systems and cannot be used as an objective point of reference.
The novelty of the presented paper is the use of knowledge in the field of control theory in practice and the use of known ISE/ITSE indices to solve the problem of unambiguous assessment of electrical quality for the needs of the turbine set control system. Although these indices are widely used in automation, they are not used for this purpose in power engineering. This is to facilitate the synthesis of better control systems and the improvement of the quality of control in the power industry in the face of challenges related to the changing nature of the energy sector, i.e., the growth of renewable energy generation.

Author Contributions

Conceptualization, P.S., B.C. and D.H.; methodology, P.S.; software, P.S.; validation, P.S., B.C., T.A.R., D.Z. and D.H.; formal analysis, D.H., P.S.; investigation, B.C., P.S.; resources, P.S., B.C.; writing—original draft preparation, P.S., B.C., D.H.; writing—review and editing, B.C., D.H., T.A.R., D.Z.; visualization, P.S.; supervision, D.H., B.C.; funding acquisition, D.H. All authors have read and agreed to the published version of the manuscript.

Funding

This research was funded in part by the Poznan University of Technology under Grant 214/SBAD/0237.

Institutional Review Board Statement

Not applicable.

Informed Consent Statement

Not applicable.

Data Availability Statement

Not applicable.

Conflicts of Interest

The authors declare no conflict of interest.

Nomenclature

PSPower system
PSSPower system stabilizer
MPCModel predictive control
DMCDynamic matrix control—a version of an MPC algorithm
RLSRecursive least squares
DMPCDistributed MPC
QDMCQuadratic dynamic matrix control
QPQuadratic programming
ISEIntegral of squared error
ITSEIntegral of time-weighted squared error
P g Active power
U g RMS voltage
p G Generator QDMC controller’s prediction horizon
p T Turbine QDMC controller’s prediction horizon
ω g Angular speed
THDTotal harmonic distortion

Appendix A

Table A1. Performance indices for a = 1 , b = 1000 , c = 1000 .
ISE
p G / p T 4041424344454647
102.438732.378982.431502.568772.706162.967703.232373.73933
112.045851.994232.038292.182942.339462.549662.827093.15873
121.076850.913851.617631.800371.983922.214082.447622.78032
130.963770.780820.670220.621971.639171.881552.163272.45595
140.949980.740870.618220.547160.517920.550531.841832.19676
150.948610.730700.599270.520670.478320.467320.507241.90370
160.949450.728810.589980.506700.461860.443230.455280.54513
170.950850.728750.586740.498900.451720.430830.438310.48706
180.953380.729950.586190.495590.444580.423070.428730.47208
190.957130.732030.587000.494030.440110.417340.422620.46456
200.961380.734630.588610.494160.437980.413730.418600.46040
210.965890.737500.590480.495110.437340.411650.416230.45844
220.970460.740380.592720.496730.437660.410740.415560.45826
230.974980.743480.595050.498660.438900.411190.415930.45957
ITSE
p G / p T 4041424344454647
1011.6721312.7270314.0428415.6736717.5390219.4642921.3710523.79873
118.854709.6822511.0833412.8561714.4544816.2821818.5430921.00278
120.979770.734848.080749.9576811.8048413.7998615.6690518.17686
130.849060.516280.364960.318029.2185811.3312613.5712815.66790
140.844800.493340.321170.231740.197700.3284511.1030513.71235
150.846170.491010.312900.216520.164810.147930.1924711.47752
160.848850.491840.310920.211380.156460.130620.133130.36332
170.851800.493000.310840.209490.152720.124240.120140.15896
180.856510.495060.311770.209230.150670.113700.114240.14463
190.863470.498120.313330.209640.149910.119110.110880.13771
200.871170.501460.315130.210580.149860.118070.108480.13298
210.879210.504950.317130.211650.150230.117660.107050.12948
220.887380.508600.319110.212870.150850.117640.106350.12735
230.895590.512190.321150.214300.151720.117990.106190.12645
Table A2. Performance indices for a = 1 , b = 1 , c = 1 .
ISE
p G / p T 4041424344454647
100.956980.743640.588840.484690.424880.365210.336800.32282
110.947700.730960.587150.489100.419520.373080.344690.33463
120.930250.709900.579140.482220.413670.368150.339010.32995
130.938230.711270.562110.460270.407630.362420.334530.32543
140.940510.714030.563260.459890.387130.338210.328910.32118
150.941610.715320.564340.460260.386790.336630.304400.31599
160.943110.716410.565430.460950.386880.336210.303150.29056
170.944610.717310.566120.461540.387170.336200.302440.28870
180.947010.718710.567020.462240.387660.336190.302130.28759
190.950510.720610.568220.463030.388250.336380.301920.28678
200.954410.722810.569620.463930.388850.336780.301720.28598
210.958510.725110.570920.464730.389450.337180.301820.28528
220.962610.727310.572320.465630.389950.337570.301910.28478
230.966610.729610.573620.466430.390450.337970.302110.28468
ITSE
p G / p T 4041424344454647
101.060620.726510.553700.466020.431530.408680.405190.42899
110.991570.659030.501390.425640.384880.373130.383180.41791
120.820960.478760.442050.374490.342770.338380.346540.38911
130.836510.479440.299170.198120.297130.297550.316870.35783
140.840210.483410.300720.197330.135860.103530.276440.33050
150.842100.485110.301910.197820.135430.099670.084230.29370
160.844700.486510.303110.198510.135570.099210.082370.09652
170.847400.487610.303810.199110.135920.099190.081370.09113
180.851810.489410.304810.199710.136310.091720.080960.08899
190.858410.492100.306110.200410.136810.099350.080600.08740
200.865710.495010.307510.201210.137210.099620.080200.08576
210.873310.498010.309010.201910.137610.099900.080100.08416
220.881010.501110.310410.202610.138010.100120.079950.08304
230.888710.504110.311810.203410.138410.100320.079960.08250
Table A3. Performance indices for a = 1 , b = 100 , 000 and c = 100 , 000 .
ISE
p G / p T 4041424344454647
101.492781.644401.850372.090992.287792.608732.901813.42312
111.108711.271831.458451.700421.926042.182472.488322.83025
120.156050.211241.045311.324281.575941.8514402.114092.45610
130.034950.076730.113840.166471.236831.524251.833892.13588
140.018880.034010.060650.091950.134790.215911.517701.88065
150.016430.022550.040620.065070.095490.134180.206081.59244
160.015790.019570.030230.050410.078930.110490.155310.25773
170.015700.018620.026300.042020.068500.098090.139030.20145
180.015850.018440.024860.038010.060860.090330.129750.18755
190.016140.018630.024480.035660.055790.084400.123840.18083
200.016520.019060.024700.034900.053070.080400.120010.17746
210.016970.019650.025290.035060.051840.077920.117540.17619
220.017490.020350.026140.035780.051660.076620.116780.17651
230.018050.021180.027200.036920.052410.076660.116950.17792
ITSE
p G / p T 4041424344454647
1010.6326312.0196713.5080415.2273817.1287619.0785920.9906923.39719
117.880849.038810.5974512.4471014.0873915.9285518.181720.60945
120.167170.261137.650699.5964311.4768513.4782115.3411617.80927
130.020920.041680.068850.122008.9332611.0476313.2707115.32883
140.013000.014780.023480.036410.063260.2261910.8401113.39842
150.012490.010760.014020.020700.030770.049310.1091911.19785
160.012600.010200.010850.014870.022270.032430.051630.26803
170.012870.010280.010070.012380.018180.026070.039620.06881
180.013230.010550.010020.011530.015730.022920.034120.05659
190.013660.010940.010290.011240.014480.020770.031110.05123
200.014130.011410.010700.011380.014030.019460.029110.04813
210.014640.011930.011220.011760.014010.018780.027820.04621
220.015190.012510.011810.012290.014230.018540.027230.04518
230.015780.013130.012470.012940.014710.018700.027060.04482

References

  1. Energy Policy of Poland until 2040. Available online: https://www.gov.pl/web/klimat/polityka-energetyczna-polski (accessed on 4 January 2022).
  2. Polskie Elektrownie Jądrowe sp. z o.o. (Polish Nuclear Power Plants). Available online: https://ppej.pl (accessed on 9 March 2022).
  3. Wurster, S.; Hagemann, C. Expansion of Renewable Energy in Federal Settings: Austria, Belgium, and Germany in Comparison. J. Environ. Dev. 2020, 29, 147–168. [Google Scholar] [CrossRef]
  4. Mešanović, A.; Münz, U.; Szabo, A.; Mangold, M.; Bamberger, J.; Metzger, M.; Heyde, C.; Krebs, R.; Findeisen, R. Structured controller parameter tuning for power systems. Control Eng. Pract. 2020, 101, 104490. [Google Scholar] [CrossRef]
  5. Sobbouhi, A.; Vahedi, A. Transient stability prediction of power system; A review on methods, classification and considerations. Electr. Power Syst. Res. 2020, 190, 106853. [Google Scholar] [CrossRef]
  6. Gündeş, A.; Özbay, H. Controller redesign for delay margin improvement. Automatica 2020, 113, 108790. [Google Scholar] [CrossRef]
  7. Zhang, B.; Tan, W.; Li, J. Tuning of linear active disturbance rejection controller with robustness specification. ISA Trans. 2019, 85, 237–246. [Google Scholar] [CrossRef] [PubMed]
  8. Fadali, M.; Visioli, A. Chapter 3—Modeling of digital control systems. In Digital Control Engineering, 3rd ed.; Academic Press: Cambridge, MA, USA, 2020; pp. 60–102. [Google Scholar] [CrossRef]
  9. Dorf, R.C.; Bishop, R.H. Modern Control Systems, 14th ed.; Pearson: London, UK, 2022. [Google Scholar]
  10. Passos, A.; Souza, R.C. Defining a quality index for electric power utilities using multiple criteria decision support and time series analysis. GestãO Produção 2013, 20, 1–13. [Google Scholar] [CrossRef]
  11. Fumagalli, E.; Schiavo, L. Regulating and improving the quality of electricity supply: The case of Italy. Eur. Rev. Energy Mark. 2009, 3, 1–27. [Google Scholar]
  12. Morsi, W.G.; El-Hawary, M.E. Novel power quality indices based on wavelet packet transform for non-stationary sinusoidal and non-sinusoidal disturbances. Electr. Power Syst. Res. 2009, 80, 753–759. [Google Scholar] [CrossRef]
  13. Thirumala, K.; Shanatu, T.; Jain, T.; Umarikar, A.C. Visualizing time-varying power quantity indices using generalized empirical wavelet transform. Electr. Power Syst. Res. 2017, 143, 99–109. [Google Scholar] [CrossRef]
  14. Kaddah, S.S.; Abo-Al-Ez, K.M.; Megahed, T.F.; Osman, M.G. Probabilistic power quality indices for electric grids with increased penetration level of wind power generation. Electr. Power Energy Syst. 2016, 77, 50–58. [Google Scholar] [CrossRef]
  15. Rodriguez-Pajaron, P.; Bayo, A.H.; Milanovic, J.V. Probabilistic assessment of the influence of transformer rating on power quality indices in future residual networks. Int. J. Electr. Power Energy Syst. 2021, 135, 107582. [Google Scholar] [CrossRef]
  16. Zhang, Y.; Zhang, Y.; Zhou, X. Classification of power quality disturbances using visual attention mechanism and feed-forward neural network. Measurement 2021, 188, 110390. [Google Scholar] [CrossRef]
  17. Tesarova, M. Power Quality and Quality of Supply; University of West Bohemia: Pilsen, Czech Republic, 2011. [Google Scholar]
  18. Raptis, T.; Vokas, G.; Langouranis, P.; Kaminaris, S. Total Power Quality Index for Electrical Networks Using Neural Networks. Energy Procedia 2015, 74, 1499–1507. [Google Scholar] [CrossRef] [Green Version]
  19. Jasiński, M.; Sikorski, T.; Kostyła, P.; Borkowski, K. Global power quality indices for assessment of multipoint Power quality measurements. In Proceedings of the Conference: 2018 10th International Conference on Electronics, Computers and Artificial Intelligence (ECAI), Iasi, Romania, 28–30 June 2018. [Google Scholar] [CrossRef]
  20. Dugan, R.; McGranaghan, M.; Santoso, S. Electrical Power Systems Quality; McGraw Hill: New York, NY, USA, 2012. [Google Scholar]
  21. Watson, N.; Miller, A. Power Quality Indices Power Quality Indices: A Review. In Proceedings of the Electricity Engineers’ Association Conference, Wellington, New Zealand, 24–26 June 2015. [Google Scholar]
  22. Instrukcja Ruchu i Ekspoatacji Sieci Przesyłowej; Polskie Sieci Elektroenergetyczne, 2006; Available online: https://www.gaz-system.pl/fileadmin/pliki/iriesp/pl/IRiESP_czI_26062006.pdf (accessed on 20 February 2022).
  23. Machowski, J. Regulacja Systemu Elektroenergetycznego; Oficyna Wydawnicza Politechniki Warszawskiej: Warszawa, Poland, 2017. [Google Scholar]
  24. Jasiński, M.; Sikorski, T.; Kaczorowska, D.N.; Rezmer, J.; Suresh, V.; Leonowicz, Z.; Kostyła, P.; Szymańda, J.; Janik, P. A case study on power quality in a virtual power plant: Long term assessment and global index application. Energies 2020, 13, 6578. [Google Scholar] [CrossRef]
  25. Jasiński, M.; Sikorski, T.; Kostyła, P.; Leonowicz, Z.; Borkowski, K. Combined cluster analysis and global power quality indices for the qualitative assessment of the time-varying condition of power quality in an electrical power network with distributed generation. Energies 2020, 13, 2050. [Google Scholar] [CrossRef] [Green Version]
  26. Sokólski, P.; Rutkowski, T.A.; Ceran, B.; Horla, D.; Złotecka, D. Power System Stabilizer as a Part of a Generator MPC Adaptive Predictive Control System. Energies 2020, 14, 6631. [Google Scholar] [CrossRef]
  27. Gallieri, M.; Maciejowski, J. Model predictive control with prioritised actuators. In Proceedings of the 2015 European Control Conference (ECC), Linz, Austria, 15–17 July 2015. [Google Scholar] [CrossRef] [Green Version]
  28. Camacho, E.; Alba, C. Model Predictive Control; Springer Science & Business Media: Berlin/Heidelberg, Germany, 2013. [Google Scholar]
  29. Jana, A.; Samanta, A.; Ganguly, S. Globally linearized control system design of a constrained multivariable distillation column. J. Process Control 2005, 15, 169–181. [Google Scholar] [CrossRef]
  30. Sokólski, P.; Rutkowski, T.; Duzinkiewicz, K. The distributed model predictive controller for the nuclear power plant turbo-generator set. In Proceedings of the 2017 22nd International Conference on Methods and Models in Automation and Robotics (MMAR), Miedzyzdroje, Poland, 28–31 August 2017. [Google Scholar]
  31. Power System Dynamic Performance Committee. Dynamic Models for Turbine–Governors in Power System Studies. IEEE Power Energy Soc. 2013. [Google Scholar]
  32. Loo, C.; Vanfretti, L.; Liceaga-Castro, E.; Acha, E.E. Synchronous Generators Modeling and Control Using the Framework of Individual Channel Analysis and Design: Part 1. Int. J. Emerg. Electr. Power Syst. 2007, 8, 1–26. [Google Scholar] [CrossRef]
  33. Sokolski, P.; Rutkowski, T.; Duzinkiewicz, K. Simplified, multiregional fuzzy model of a nuclear power plant steam turbine. In Proceedings of the 21ST International Conference on Methods and Models in Automation and Robotics (MMAR), Miedzyzdroje, Poland, 29 August–1 September 2016; pp. 379–384. [Google Scholar]
  34. Imieliński, A. Mathematical Model of Synchronous Generator for Full-Scope Simulator; Gdañsk University of Technology, Faculty of Electrical and Control Engineering: Gdańsk, Poland, 1987; unpublished. [Google Scholar]
  35. Wojtulewicz, A. Implementation of Dynamic Matrix Control Algorithm Using Field Programmable Gate Array: Preliminary Results. In Trends in Advanced Intelligent Control, Optimization and Automation; Springer: Cham, Switzerland, 2017. [Google Scholar]
  36. Wojtulewicz, A. Implementation of DMC algorithm in embedded controller—Resources, memory and numerical modifications. In Trends in Advanced Intelligent Control, Optimization and Automation; Springer: Cham, Switzerland, 2017. [Google Scholar]
  37. Chaber, P.; Ławryńczuk, M. Implementation of Analytical Generalized Predictive Controller for Very Fast Applications Using Microcontrollers: Preliminary Results. In Trends in Advanced Intelligent Control, Optimization and Automation; Springer: Cham, Switzerland, 2017. [Google Scholar]
  38. Sokólski, P.; Rutkowski, T.A.; Duzinkiewicz, K. The QDMC Model Predictive Control. In Advances in Intelligent Systems and Computing; Springer: Cham, Switzerland, 2017. [Google Scholar]
  39. Sokólski, P.; Kobylarz, A.; Kulkowski, K.; Duzinkiewicz, K.; Rutkowski, T.; Grochowski, M. Advanced control structures of turbo generator system of nuclear power plant. Acta Energetica 2015, 3, 83–96. [Google Scholar] [CrossRef] [Green Version]
  40. Sokolski, P.; Rutkowski, T.; Duzinkiewicz, K. The excitation controller with gain scheduling mechanism for synchronous generator control. In Proceedings of the 2015 20th International Conference on Methods and Models in Automation and Robotics (MMAR), Miedzyzdroje, Poland, 24–27 August 2015; pp. 23–28. [Google Scholar]
Figure 1. Different disturbance types.
Energies 15 02453 g001
Figure 2. Turbine-generator set with a control system connected to the power system through a transformer and transmission line with heat reception.
Energies 15 02453 g002
Figure 3. Inputs and outputs of the model.
Energies 15 02453 g003
Figure 4. Structure of a QDMC controller with RLS model estimation [26].
Energies 15 02453 g004
Figure 5. Model identification for the generator QDMC controller [30].
Energies 15 02453 g005
Figure 6. Indices for a = 1 , b = 1000 , c = 1000 [ · 10 2 ]; (a) ISE, (b) ITSE.
Energies 15 02453 g006aEnergies 15 02453 g006b
Figure 7. Indices for a = 1 , b = 1 , c = 1 [ · 10 2 ]; (a) ISE, (b) ITSE.
Energies 15 02453 g007
Figure 8. Indices for a = 1 , b = 100 , 000 , c = 100 , 000 [ · 10 2 ]; (a) ISE, (b) ITSE.
Energies 15 02453 g008
Figure 9. Results for controllers tuned using parameters: a = 1 , b = 1000 and c = 1000 .
Energies 15 02453 g009
Figure 10. Results for controllers tuned using parameters: a = 1 , b = 1 and c = 1 .
Energies 15 02453 g010
Figure 11. Results for controllers tuned using parameters: a = 1 , b = 100 , 000 and c = 100 , 000 .
Energies 15 02453 g011
Figure 12. Electric power, generator voltage and angular speed (data set A, D, G).
Energies 15 02453 g012
Figure 13. Electric power, generator voltage and angular speed (data set B, E, H).
Energies 15 02453 g013
Table 1. Notation used throughout the paper.
FeatureNotation/RangesExplanation
outputs y ̲ = [ P g , U g , ω g ] power, voltage, frequency
set values y ̲ ref = [ P g , ref , U g , ref , ω g , ref ] reference power,
constant set voltage
and frequency values
control signals u ̲ = [ α , E f d ] control valve opening,
excitation voltage
constraints α [ 0 , 100 ] , E f d [ 0.1 , 0.1 ] minimum/maximum:
valve opening (0–100%),
excitation system voltage
( ± 10 % )
Table 2. Analyzed sets of parameters.
SetabcIndexValueCommentpTpG
A110001000ISE0.004107Best4522
B110001000ITSE0.00106Best4623
C110001000ISE/ITSE0.03739/0.23799Worst4710
D111ISE0.00285Best4723
E111ITSE0.0008Best4623
F111ISE/ITSE0.00975/0.01061Worst4010
G1100,000100,000ISE0.0157Best4017
H1100,000100,000ITSE0.010202Best4116
I1100,000100,000ISE/ITSE3.42312/23.3972Worst4710
Publisher’s Note: MDPI stays neutral with regard to jurisdictional claims in published maps and institutional affiliations.