Article

Performance Comparison of Long Short-Term Memory and a Temporal Convolutional Network for State of Health Estimation of a Lithium-Ion Battery using Its Charging Characteristics

Department of Mechanical Engineering, Keimyung University, Daegu 42601, Korea
*
Author to whom correspondence should be addressed.
Energies 2022, 15(7), 2448; https://doi.org/10.3390/en15072448
Submission received: 21 February 2022 / Revised: 21 March 2022 / Accepted: 23 March 2022 / Published: 26 March 2022
(This article belongs to the Topic Safety of Lithium-Ion Batteries)

Abstract

:
The market for eco-friendly batteries is increasing owing to population growth, environmental pollution, and energy crises. The widespread application of lithium-ion batteries necessitates their state of health (SOH) estimation, which is a popular and difficult area of research. In general, the capacity of a battery is selected as a direct health factor to characterize the degradation state of the battery’s SOH. However, it is difficult to directly measure the actual capacity of a battery. Therefore, this study extracted three features from the current, voltage, and internal resistance of a lithium-ion battery during its charging–discharging process to estimate its SOH. A battery-accelerated aging test system was designed to obtain time series battery degradation data. A performance comparison of lithium-ion battery SOH fitting results was conducted for two different deep learning architectures, a long short-term memory (LSTM) network and temporal convolution network (TCN), which are time series deep learning networks based on a recurrent neural network (RNN) and convolutional neural network (CNN), respectively. The results showed that the proposed method has high prediction accuracy, while the performance of the TCN was 3% better than that of the LSTM regarding the average maximum relative error in SOH estimation of a lithium-ion battery.

1. Introduction

In the 21st century, resource scarcity and environmental pollution have become prominent problems restricting human development [1]. Consequently, countries around the world have gradually attached importance to the development of renewable energy. The future of energy consumption is increasingly associated with the development of the so-called green energy [2]. Lithium-ion batteries have been widely used and developed because of their excellent performance. Lithium-ion batteries are widely used in mobile electronics, electric vehicles, and spacecrafts [3,4,5,6]. Health assessments of batteries under normal operation have become a key issue in practical application processes [7,8]. The state prediction of a battery mainly includes the prediction of its state of charge (SOC) and state of health (SOH) [9]. The indicators commonly used to measure battery aging are the remaining useful life (RUL) and SOH [10]. These indicators are predicted by calculating the decay in battery capacity from experimental data on the current, voltage, and temperature of the battery, among others. According to the use of information, the prediction methods for the SOH for lithium-ion batteries can be divided into two categories: physical-model-based and data-based approaches [11].
Physical-model-based approaches use a physical model that can describe battery degradation, then the physical model is combined with actual battery measurement data and usage conditions to identify the model parameters and predict the future degradation of the actual battery. Degradation mechanism models, equivalent circuit models, and empirical decay models are commonly used in physical-model-based approaches. In [12], Ashwin et al. proposed a pseudo two-dimensional electrochemical lithium-ion battery model to study its capacity fading under cyclic charge–discharge conditions. A distributed thermal model coupled with internal chemical heating was used to accurately predict the temperature change inside the battery cell. The growth of solid electrolyte interphase (SEI) films, first discovered in 1979 by Peled [13], was estimated based on different cut-off voltages and charging current rates. Rational use of this model can effectively improve the performance and service life of batteries under various operating conditions. However, the temperature, electrolyte, active materials, separator, electrode and crosstalk in actual lithium-ion batteries will affect the growth of the cathode electrolyte interphase (CEI) and SEI, thereby affecting the battery life and leading to prediction errors in the model [14,15,16]. In [17], a state–space model with non-integer derivatives was proposed, which is a combination of electrochemical impedance spectroscopy and an RC model. The authors adopted a particle swarm optimization algorithm and identified three model parameters using time domain test data. The experimental data showed that the proposed model had good accuracy and robustness and was suitable for the study of battery SOC, SOH estimation, and charge control. In the empirical decay model, some researchers have used the Bayesian Monte Carlo framework [18] and relevance vector machine (RVM) algorithm [19]. In addition, most had used a statistical random filter algorithm to track the decay information of the battery to obtain optimal parameters; therefore, it is also called the statistical filter model [20,21,22,23,24].
Data-driven approaches use information from currently measured and historical data to identify the currently measured degradation states and predict future trends. The data-driven method does not require consideration of the physical and chemical changes inside the battery. It can directly analyze the implicit SOH information and its evolution law from the external characteristic parameters of the battery. Existing methods include time series analysis, neural network (NN), support vector machine (SVM), RVM, Gaussian process regression (GPR), and prediction methods of fusion models. The authors in [25] used the AR model combined with the PF algorithm to predict the battery life. First, they analyzed the nonlinear degradation characteristics of the battery capacity and extracted the nonlinear accelerated degradation factor, which improved the prediction ability of the linear AR model. Finally, a regularized particle filter was used to design the RUL framework for lithium-ion battery fusion. The experiments showed that the prediction results of the model had good accuracy. The authors in [26] proposed an online synthesis method based on the fusion of partial incremental capacity and artificial neural networks to estimate the SOH and RUL under constant current charging conditions. An advanced filtering method was used to smoothen the initial incremental capacity curve. Simultaneously, strongly correlated eigenvalues were extracted from the partial incremental curves using the correlation analysis method. A neural network model of the SOH and RUL was established to estimate the SOH and RUL simultaneously. Reference [27] proposes a new method for the accurate estimation of battery SOH using the terminal voltage response characteristics of lithium-ion batteries under current pulse tests by SVM. Because the terminal voltage measured under the same conditions changes with the battery aging process, the feature was extracted from the voltage response under a specific current pulse test for SOH estimation. The authors in [28] used wavelet denoising and a differential evolution algorithm to improve RVM, wherein the RUL of the battery was estimated from the denoised data. The experiments verified that the method can accurately predict the battery capacity and the battery capacity decline trend. The study focused on short-term battery SOH estimation and long-term RUL prediction. A hybrid method combining partial incremental capacity with Gaussian process regression was proposed in [29], wherein a double GPR model was used to predict battery health. The authors in [30] proposed that the battery equivalent model parameters be estimated based on the least-squares method to determine the internal resistance of the battery. They studied the effect of temperature on the decay rate of the battery life. This method can be used to predict the battery SOH under a normal operating state within a specific time interval and can correct the calculation results according to the temperature change.
With the rapid development of machine learning and artificial intelligence, data-driven methods have received increasing attention [31,32]. In recent years, the rapid development of computational capabilities has enabled the calculation using deep-learning algorithms to be faster. The emergence of an increasing number of deep learning algorithms has made the prediction of battery SOH very accurate [33,34,35,36]. However, for data-driven methods, many researchers still use various filters and GPR algorithms [37,38,39], and only a few studies have used deep-learning algorithms [40,41]. During battery SOH prediction, the capacity of the battery and the calendar degradation data are used for prediction.
Considering the above research gaps, the main contributions of this work are as follows: (a) to deduce three groups of characteristic variables that have an obvious correlation with SOH through the battery charge–discharge data curve; (b) to verify the features determined in this study using the LSTM and TCN algorithms in deep learning and predict the battery SOH; (c) to build a battery accelerated aging experimental device for conducting battery aging charge and discharge experiments and to verify the three features proposed in this paper through experimental data; (d) to compare the performance of the deep learning algorithms LSTM and TCN through the NASA experimental data and data obtained from actual experiments.
The remainder of this paper is organized as follows. Section 2 discusses the trend of the lithium-ion battery SOH versus the charge–discharge time, wherein the charge–discharge voltage variation is presented in Section 2.1 and the extraction of suitable feature variables that are significantly correlated with the SOH is presented in Section 2.2. Section 3 introduces the deep learning algorithms used in this study. Section 4 demonstrates the use of the LSTM and TCN algorithms in deep learning to verify the three sets of features determined in this study that can predict the battery SOH. Section 5 presents the battery aging charge and discharge experiment by building a battery-accelerated aging experimental device. Subsequently, the three features proposed in this study are verified via the deep learning algorithms using the data obtained from the experiment. Finally, the summary and conclusions of this study are presented in Section 6.

2. Charge and Discharge Feature Extraction

2.1. SOH and Charging Characteristics of Lithium-Ion Batteries

Lithium-ion batteries have a limited cycle life, which is affected by many factors. Regarding the working mechanism of a lithium-ion battery, as the number of cycles increases, irreversible chemical reactions occur inside the battery. This can decrease the electrical energy storage capacity of the battery. Throughout the cycle of a lithium-ion battery, the electrodes and electrolytes undergo chemical reactions [42]. The continuous formation of passivation films at the solid–liquid interface of the battery lead to an increased contact resistance. Simultaneously, the dissolution of lithium metal and reduction in active materials reduce the capacity of the battery, and as a result the battery life declines. This is mainly manifested as a continuous decline in the actual capacity of the battery from the perspective of the external characteristics. The SOH of the battery will consequently show a downward trend. In many lithium battery performance evaluations, the SOH represents the battery life.
To develop a high-power lithium-ion battery, the National Aeronautics and Space Administration (NASA) has established various working conditions to conduct aging tests on 18,650 lithium-ion batteries and posts experimental battery data on its website [43]. This study used the experimental data for B0005, B0006, B0007, and B0018 batteries charged under CC-CV mode at room temperature to analyze the relationship between the charge and discharge characteristics of the lithium batteries and their SOH. In the charging stage, the batteries were first charged to a voltage of 4.2 V with a constant current of 1.5 A. The voltage was held constant at 4.2 V until the current dropped to 0.02 A. Subsequently, the batteries were discharged with a constant current of 2 A until the voltage dropped to 2.7 V, 2.5 V, 2.2 V, and 2.5 V for batteries B0005, B0006, B0007, and B0018, respectively. The detailed charging conditions are presented in Table 1.
The features that can reflect the SOH based on the changes in charge and discharge time and voltage during the entire life cycle of a lithium battery were extracted. Figure 1 show the cyclic changes for a single battery in the charging and discharging times and voltages for the same type of lithium-ion battery.
Figure 1a shows the changes in the charging voltage curve throughout the battery life cycle. It can be seen from the figure that with the continuous increase in the number of cycles, the constant-current charging time decreases, the constant voltage charging time increases, and the entire charging cycle is shortened. The times spent in different charging periods indicate the aging state of the battery. The shape of the curve between the charge time and voltage also changes with the increasing number of cycles. In the early stage of the charging cycle, the voltage in the constant-current charging stage first increases rapidly for a period of time and then increases slowly until it reaches the cut-off voltage. The increasing voltage trend is linear. The shape of the charge time and voltage changes slowly over the life cycle. For the same charging time, the battery voltages for different cycles differ. This is because with the cyclic use of the battery, the internal electrode material ages, and the ohmic resistance increases, resulting in a higher electromotive force across the electrodes. Therefore, the change between the charge time and voltage reflects the attenuation of a lithium-ion battery’s SOH.
Figure 1b shows the voltage drop curve for the constant-current discharge rate over the entire life cycle of the lithium-ion battery. Similar to the charging voltage, the discharging voltage also exhibits a slowly decreasing voltage plateau. After this plateau period, the voltage drops rapidly and quickly reaches the discharging cut-off voltage. The duration of this voltage plateau slowly decreases as the battery cycle increases. It can be seen that this change is slow and linear when synthesizing all of the discharge voltage curves over the entire life cycle of the battery.

2.2. Charge and Discharge Feature Extraction

Feature extraction is important in data-driven modelling. The model training samples were determined based on extracted features that can reflect the lithium-ion battery SOH in each cycle. In this study, three features that can reflect the lithium-ion battery SOH were selected when analyzing the experimental data based on the charge and discharge characteristics. When a battery is charged and discharged, the data that can be easily obtained are the current, voltage, temperature, and time data. These data alone cannot be used as features to predict the SOH values of various batteries. To facilitate SOH prediction for various batteries, the following features were selected in this paper: feature 1, the ratio of the constant current charge time to the total charge time; feature 2, the ratio of the charge time to the discharge time; feature 3, the voltage increase rate when the battery is charging. The above features increase the amount of data when charging and discharging and avoid the problem of insufficient diversity of training data in machine learning.

2.2.1. Ratio of Constant-Current Charging Time to Total Charging Time

The constant-current charging time constantly decreases throughout the life cycle of a lithium-ion battery. However, different batteries have different charging times owing to their different capacities. Therefore, the charging time cannot reflect the performance of a lithium-ion battery. To predict the SOH values of various batteries, in this study, the ratio of the constant-current charging time to the total charging time was extracted as feature. This feature unifies the constant-current charging time, constant-voltage charging time, and total charging time, thereby avoiding feature redundancy. The characteristic curves for the entire life cycles of NASA batteries 5, 6, 7, and 18 are shown in Figure 2. The decay trend for this characteristic gradually decreases with an increase in the number of cycles. This also shows that this feature is correlated with the SOH. The SOH at this time can be estimated by calculating the ratio of the constant-current charging time to the total charging time in each cycle.

2.2.2. Ratio of Charging Time to Discharge Time

Throughout the life cycle of a lithium-ion battery, the cross-current discharging time decreases continuously. In addition, because the discharging time of a battery is proportional to its capacity, it cannot be used alone as a feature to predict the battery life. In order to be applicable to various batteries, this study extracts the ratio of the charging time to the discharging time as a feature. The characteristic curves for the entire life cycles for NASA 5, 6, 7, and 18 are shown in Figure 3, wherein the abscissa indicates the number of cycles and the ordinate represents the ratio of the charging time to the discharging time.
As the cycle progresses, the ratio of the charging time to discharging time increases; that is, as the life cycle of the lithium-ion battery gradually increases, the ratio of the charge time to the discharge time gradually increases and the battery SOH gradually decreases.

2.2.3. Rising Rate of Battery Voltage during Charging

During the entire battery aging period, the voltage increase for a battery is not the same even after the same charging time. In each cycle, by calculating the battery-voltage rise based on the same timeframe, one can effectively determine the SOH of the battery. However, the electrical parameters of different batteries are not the same. To make the features transferable between different lithium-ion battery cells, in this study the average voltage rise during the entire charging period of the battery was used as a feature. The feature curves for the entire life cycles of NASA 5, 6, 7, and 18 are shown in Figure 4, wherein the abscissa represents the number of cycles and the ordinate represents the rate at which the average voltage rises during charging. As the cycle continues, the rate of the average voltage rise increases.

3. Introduction to the Deep Learning Algorithms

In this study, we compared two different architectures—one based on a recurrent neural network (RNN) and the other based on a convolutional neural network (CNN). For the RNN architecture, we used a long short-term memory (LSTM) algorithm and implemented a temporal convolution network (TCN) for the CNN architecture [44]. This section introduces the two deep learning algorithms used in this study to predict the residual SOH values of lithium-ion batteries.

3.1. Long Short-Term Memory

LSTM is an improved RNN that overcomes a common problem of RNNs—they cannot handle long-distance dependencies. Compared with the basic RNN model, LSTM has two main improvements:
(1)
The algorithm includes special variables, C t , to store the cell state information so that the network has long-term memory;
(2)
The “gate operation” is introduced to change the multiplication of gradients into accumulation to solve the problem of gradient disappearance.
In the RNN model, the input is the hidden layer state h t 1 at the previous moment, the input value is x t at the current moment, and the output is the hidden layer state h t at the current moment. The intermediate operation contains only one activation function.
In the LSTM model, the input is the hidden layer state h t 1 at the previous moment, the element state is C t 1 at the previous moment, the input value is x t at the current moment, and the outputs are the hidden layer state h t at the current moment and the element state C t 
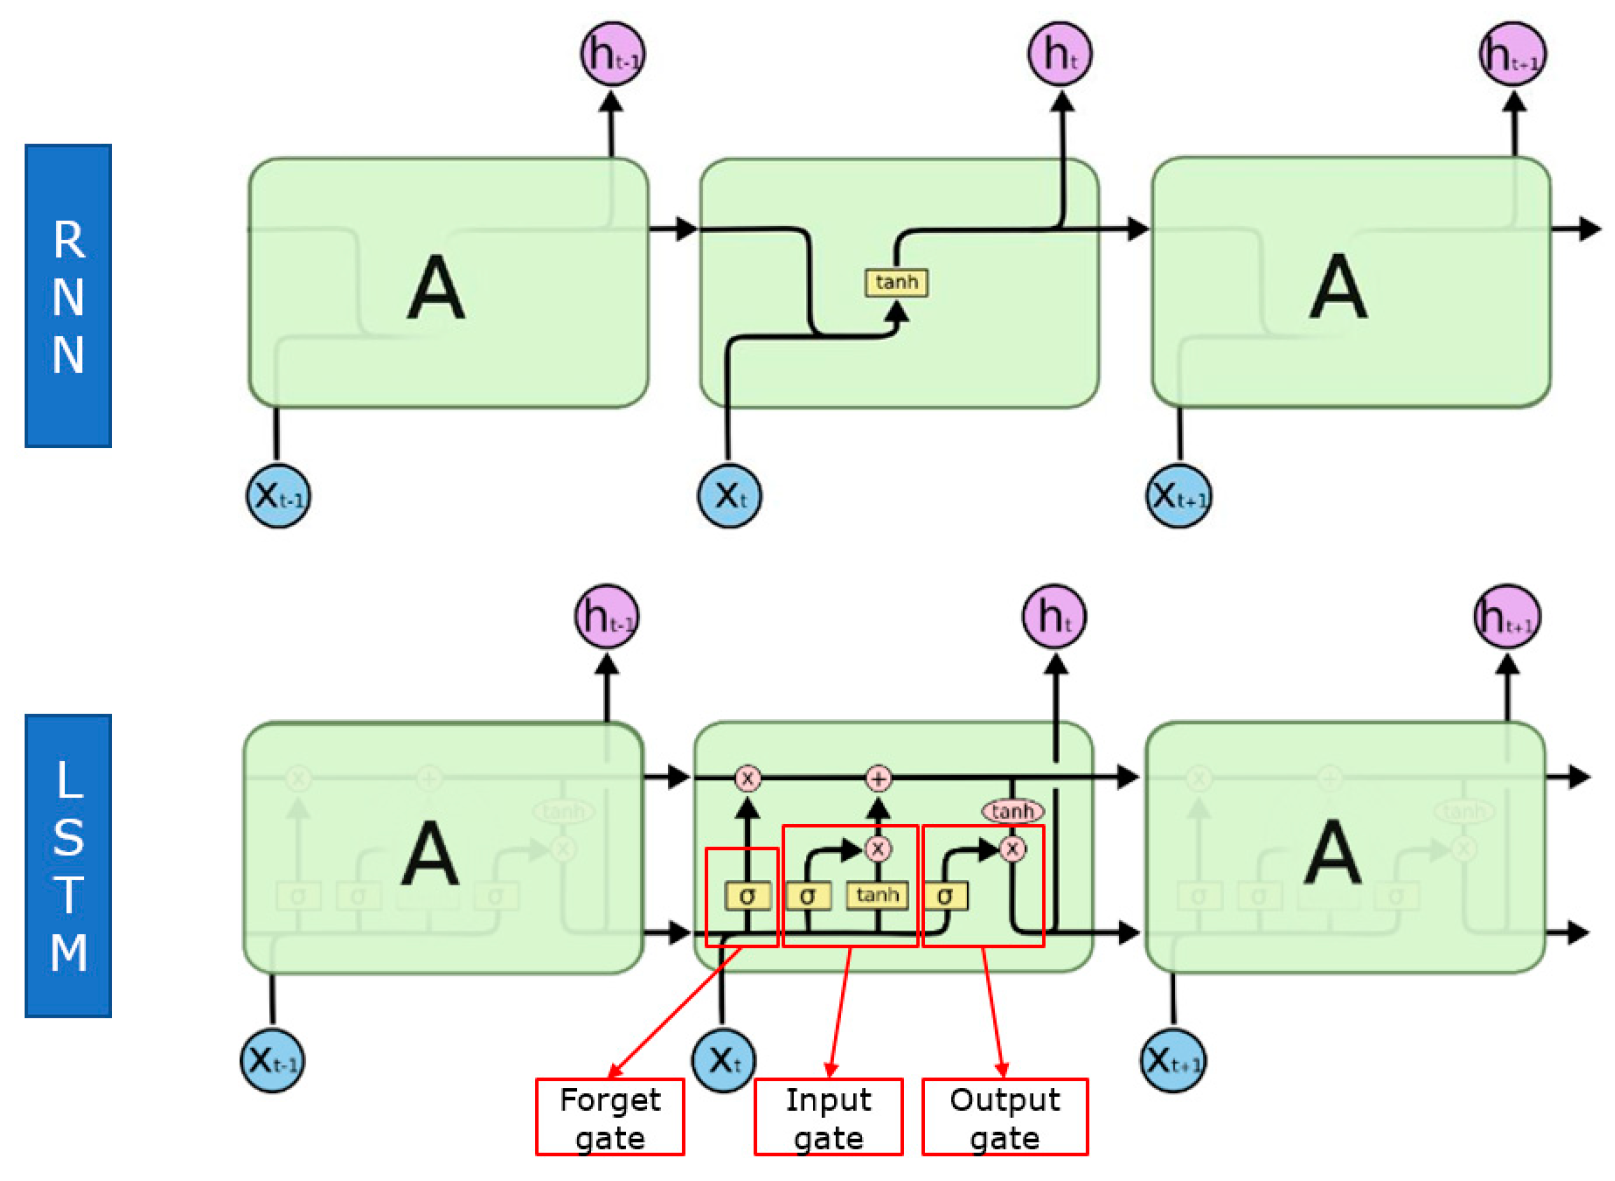
at the current moment. The calculation is more complicated than that inside the RNN. It is usually considered to be a three-gate operation: a forget gate, an input gate, and an output gate. The three gates are marked by red lines in Figure 5.

3.2. Temporal Convolutional Network

The TCN model is based on the CNN model with the following improvements:
(1)
Applicable sequence model: causal convolution;
(2)
Memory history: dilated convolution, residual block.
Because the research object is the time series data, the designed TCN uses a 1-D convolutional network. 
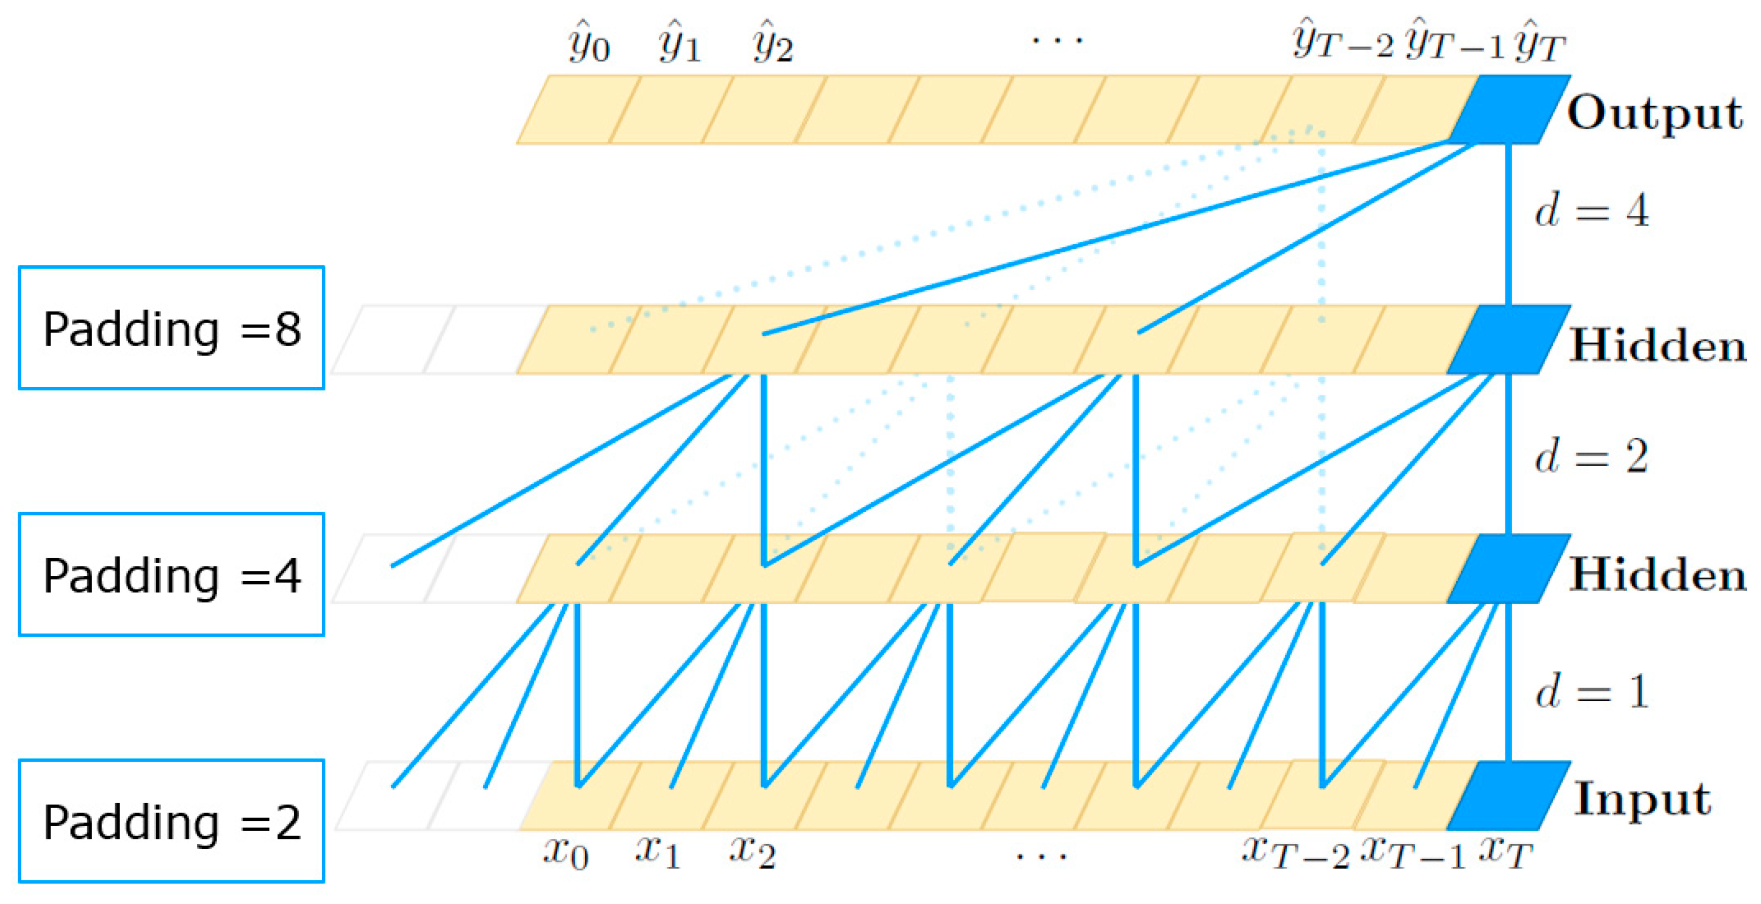
Figure 6 illustrates the causal and dilated convolutions in the TCN architecture. It can be observed that the value of each layer at moment t only depends on the value of the previous layer’s moment t , t 1 , …, which reflects the characteristics of the causal convolution. The extraction of information from one layer to the previous layer is skipped, and the layer-by-layer dilated rate increases exponentially by a factor of two, reflecting the characteristics of dilated convolution. Owing to the use of dilated convolution, each layer must have padding (usually padded with 0); the size of the padding is ( k 1 ) d .
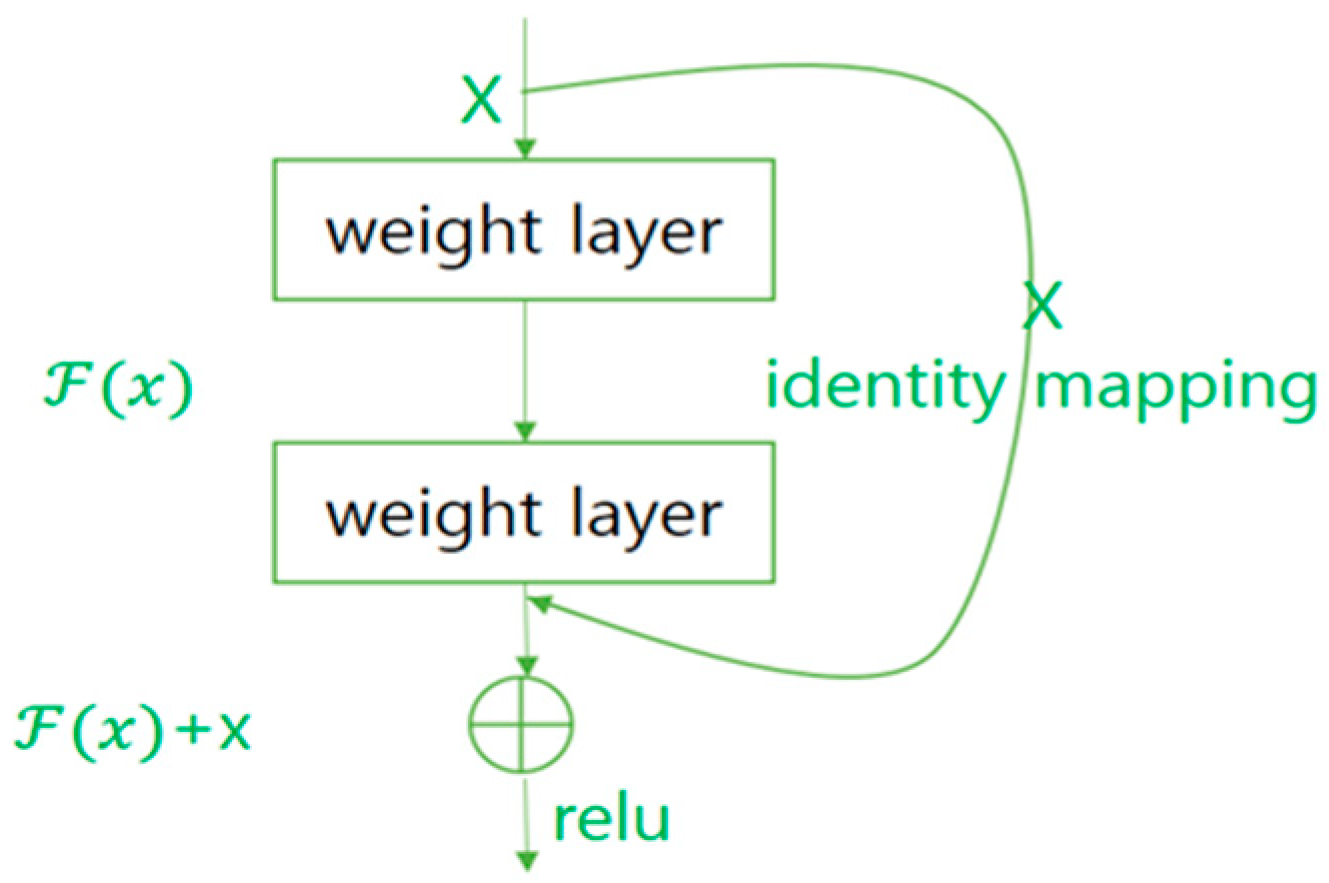
To solve the problem of network degradation, the redundant layer of a network produces an identity mapping function (where a deep network is equivalent to a shallow network). In general, it is difficult for a layer of the network to learn the identity mapping function H ( x ) = x , but if the network is designed as H ( x ) = F ( x ) + x , the learning of the identity mapping function can be converted into the learning of the residual function F ( x ) = H ( x ) x . F ( x ) = 0 represents identity mapping and H ( x ) = x . When the parameters are initialized, the general weight parameters are relatively small, which is suitable for learning F ( x ) = 0 ; therefore, it is easier to fit the residuals, which is the basic idea behind a residual network.
Figure 7 shows the structure of the residual module. The module provides two choices: identity mapping (x, curved line on the right side, called the shortcut link) and residual mapping ( F ( x ) ). If the network has already converged to an optimum, the algorithm continues to deepen the network and the residual mapping is pushed to 0; that is, only identity mapping proceeds. In theory, this means the network has reached an optimal condition. In addition, this means the network performance did not degrade with the increase in depth.

3.3. Training Model

Both algorithms must be slightly tuned to achieve good performance on the validation set. Here, each algorithm uses the first 20 datasets for the model training because the time series algorithms and the amount of data are small. Therefore, the training data are subjected to decreasing gradient data before training. For example, when the 1st–5th datasets are used as the training data, the 2nd–6th datasets are used as the validation data; when the 2nd–6th datasets are used as the training data, the 3rd–7th datasets are used as the validation data. This procedure is followed up to the 20th dataset. Subsequently, predictions are made for the datasets beyond the 20th dataset. These 20 datasets cover features 1, 2, and 3 of the first 20 SOH of each battery. When feature 1 is used to predict the SOH of battery B0005, the first 20 data points for feature 1 and the SOH need to be trained and then predicted. The inputs are the different features proposed in this paper, and the outputs are the SOH of the lithium-ion battery in LSTM and TCN algorithms. The plots of the predicted results are displayed in Section 4.

4. SOH Prediction Based on Battery Charging and Discharging Time Feature

The algorithm uses time series data from NASA battery datasets that run until failure to train the model and for estimation of the SOH of a lithium-ion battery. In this study, we predicted the SOH of the battery by extracting the features from the battery charging and discharging properties. The SOH of the NASA lithium-ion is based on the available capacity data given in dataset, described by Equation (1):
SOH = C a C n  
where C a is the current capacity of the battery and C n is the rated capacity of the battery. As the battery ages, the SOH gradually decreases. According to IEEE standard 1188–1996, when the SOH of a lithium battery drops to 80%, the battery needs to be replaced. Therefore, the SOH threshold used in this paper is 80% of the rated capacity of the battery. 
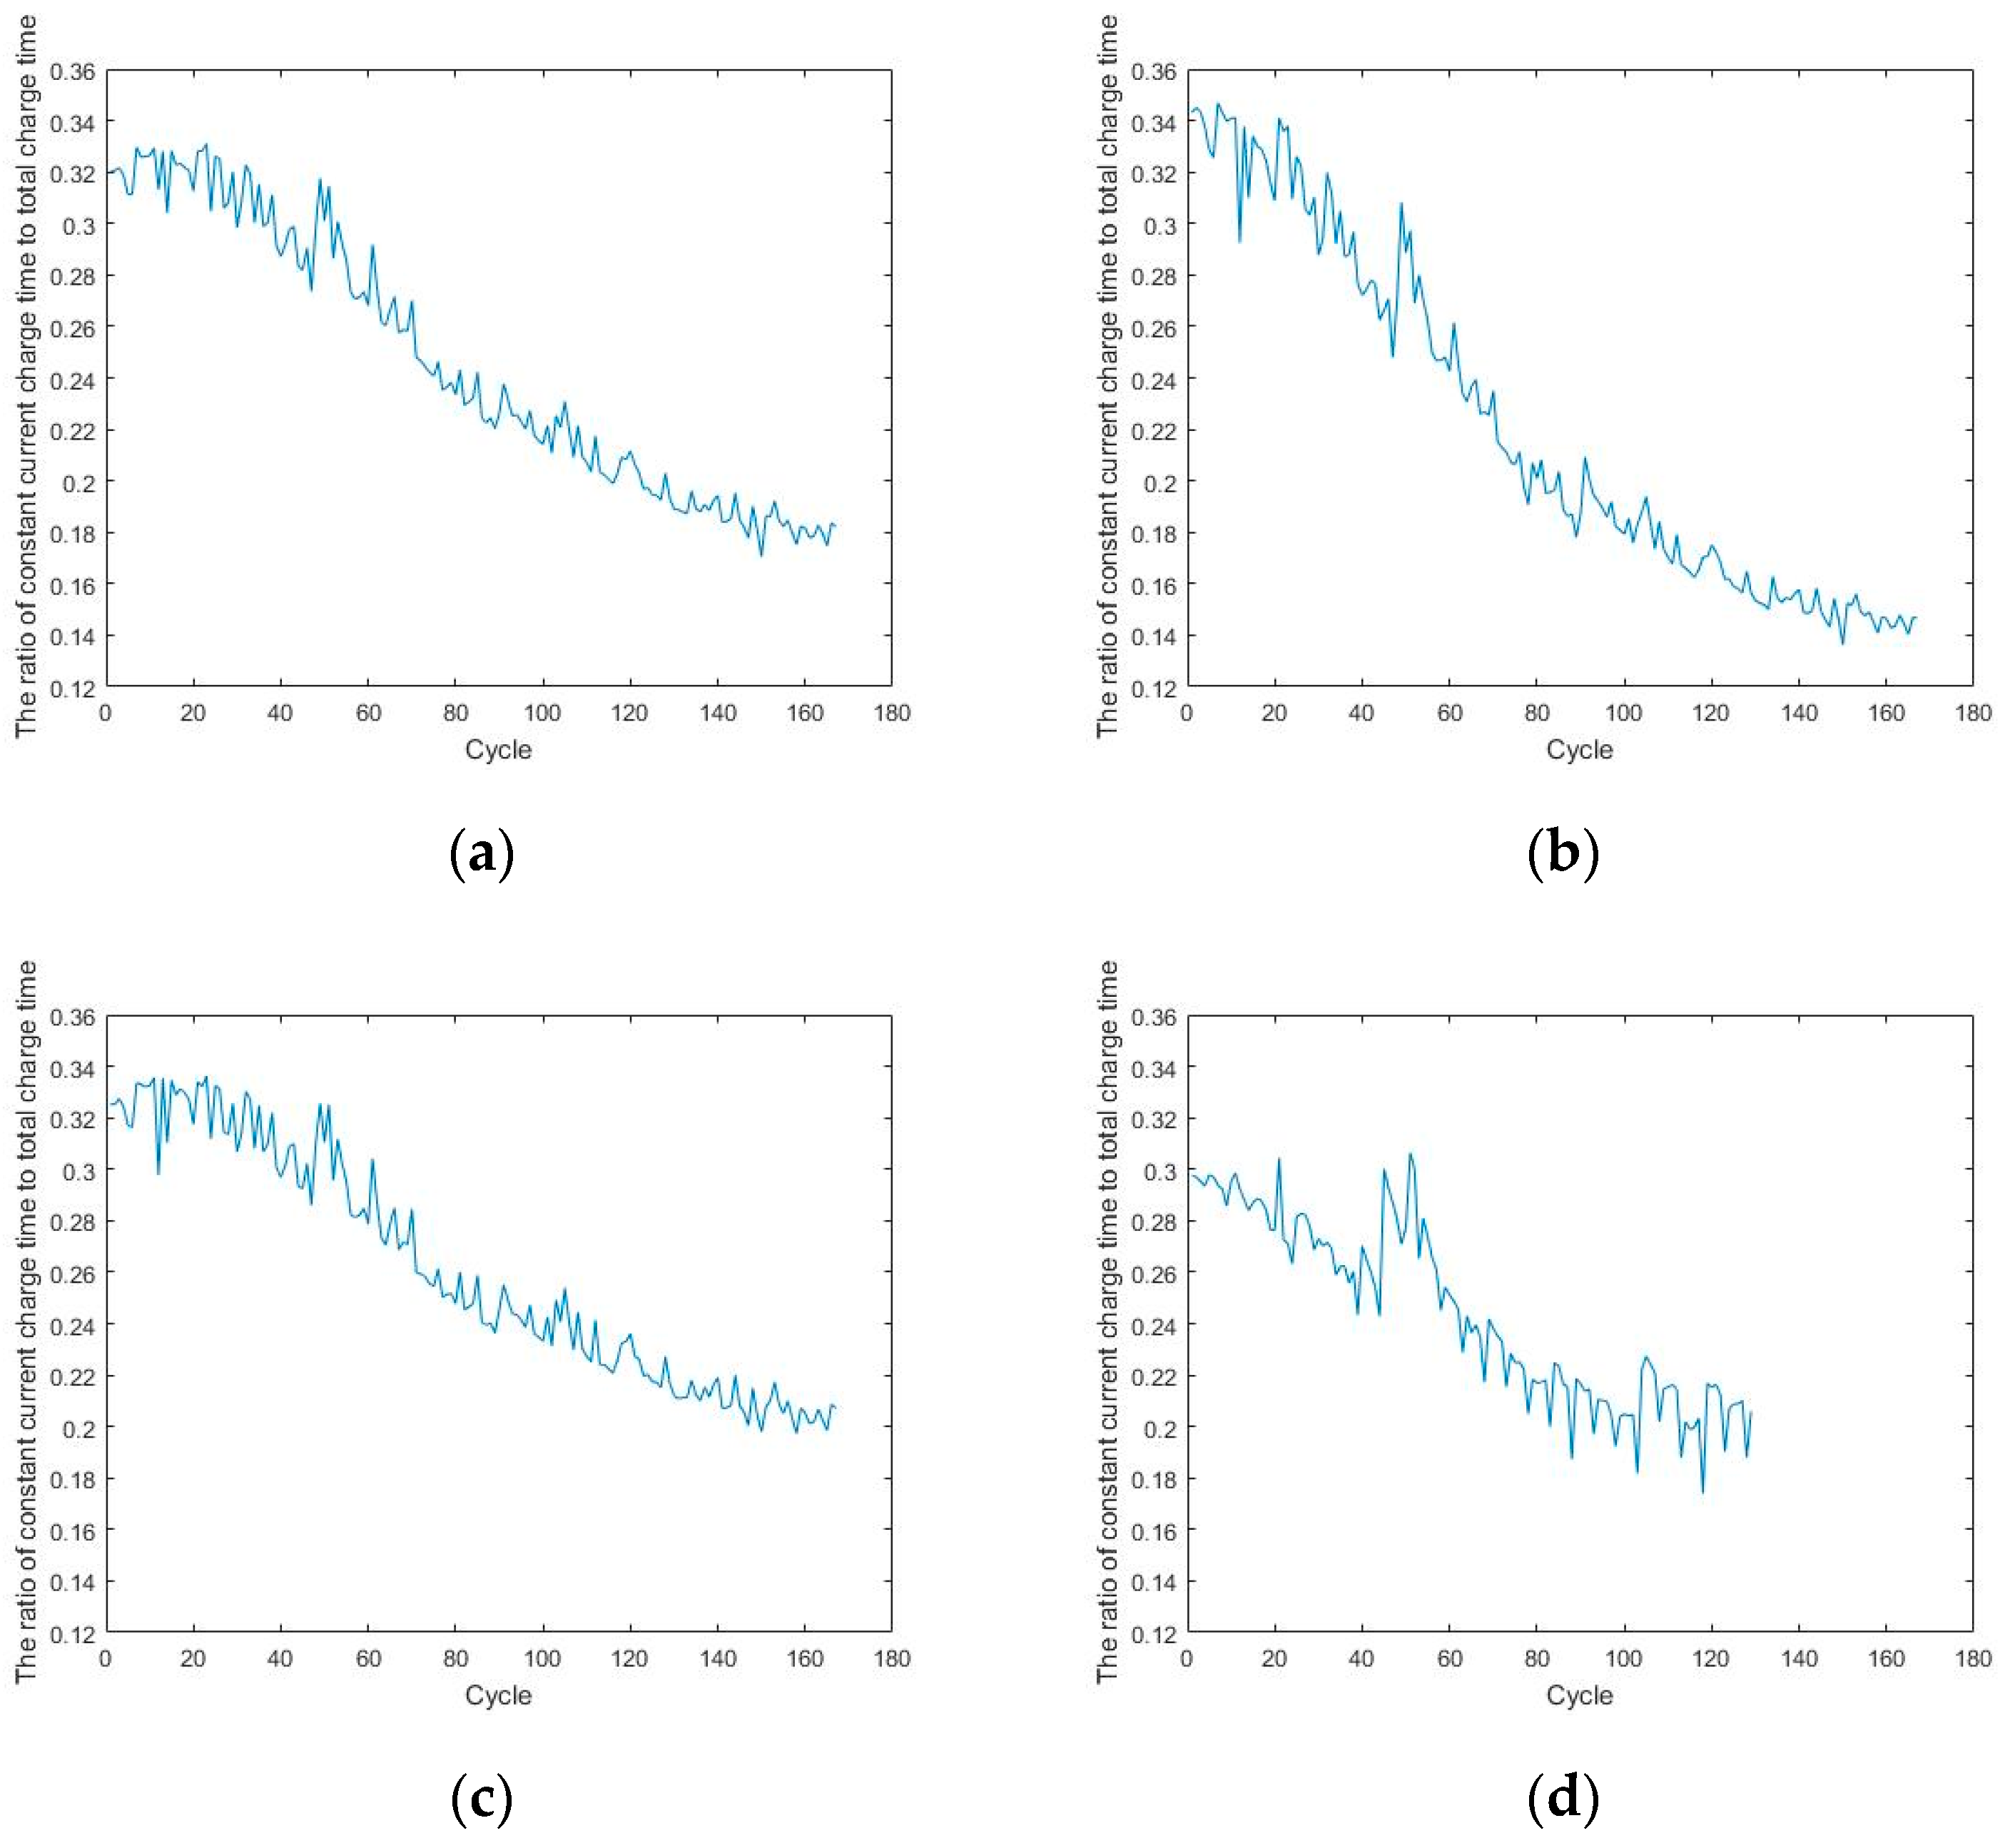
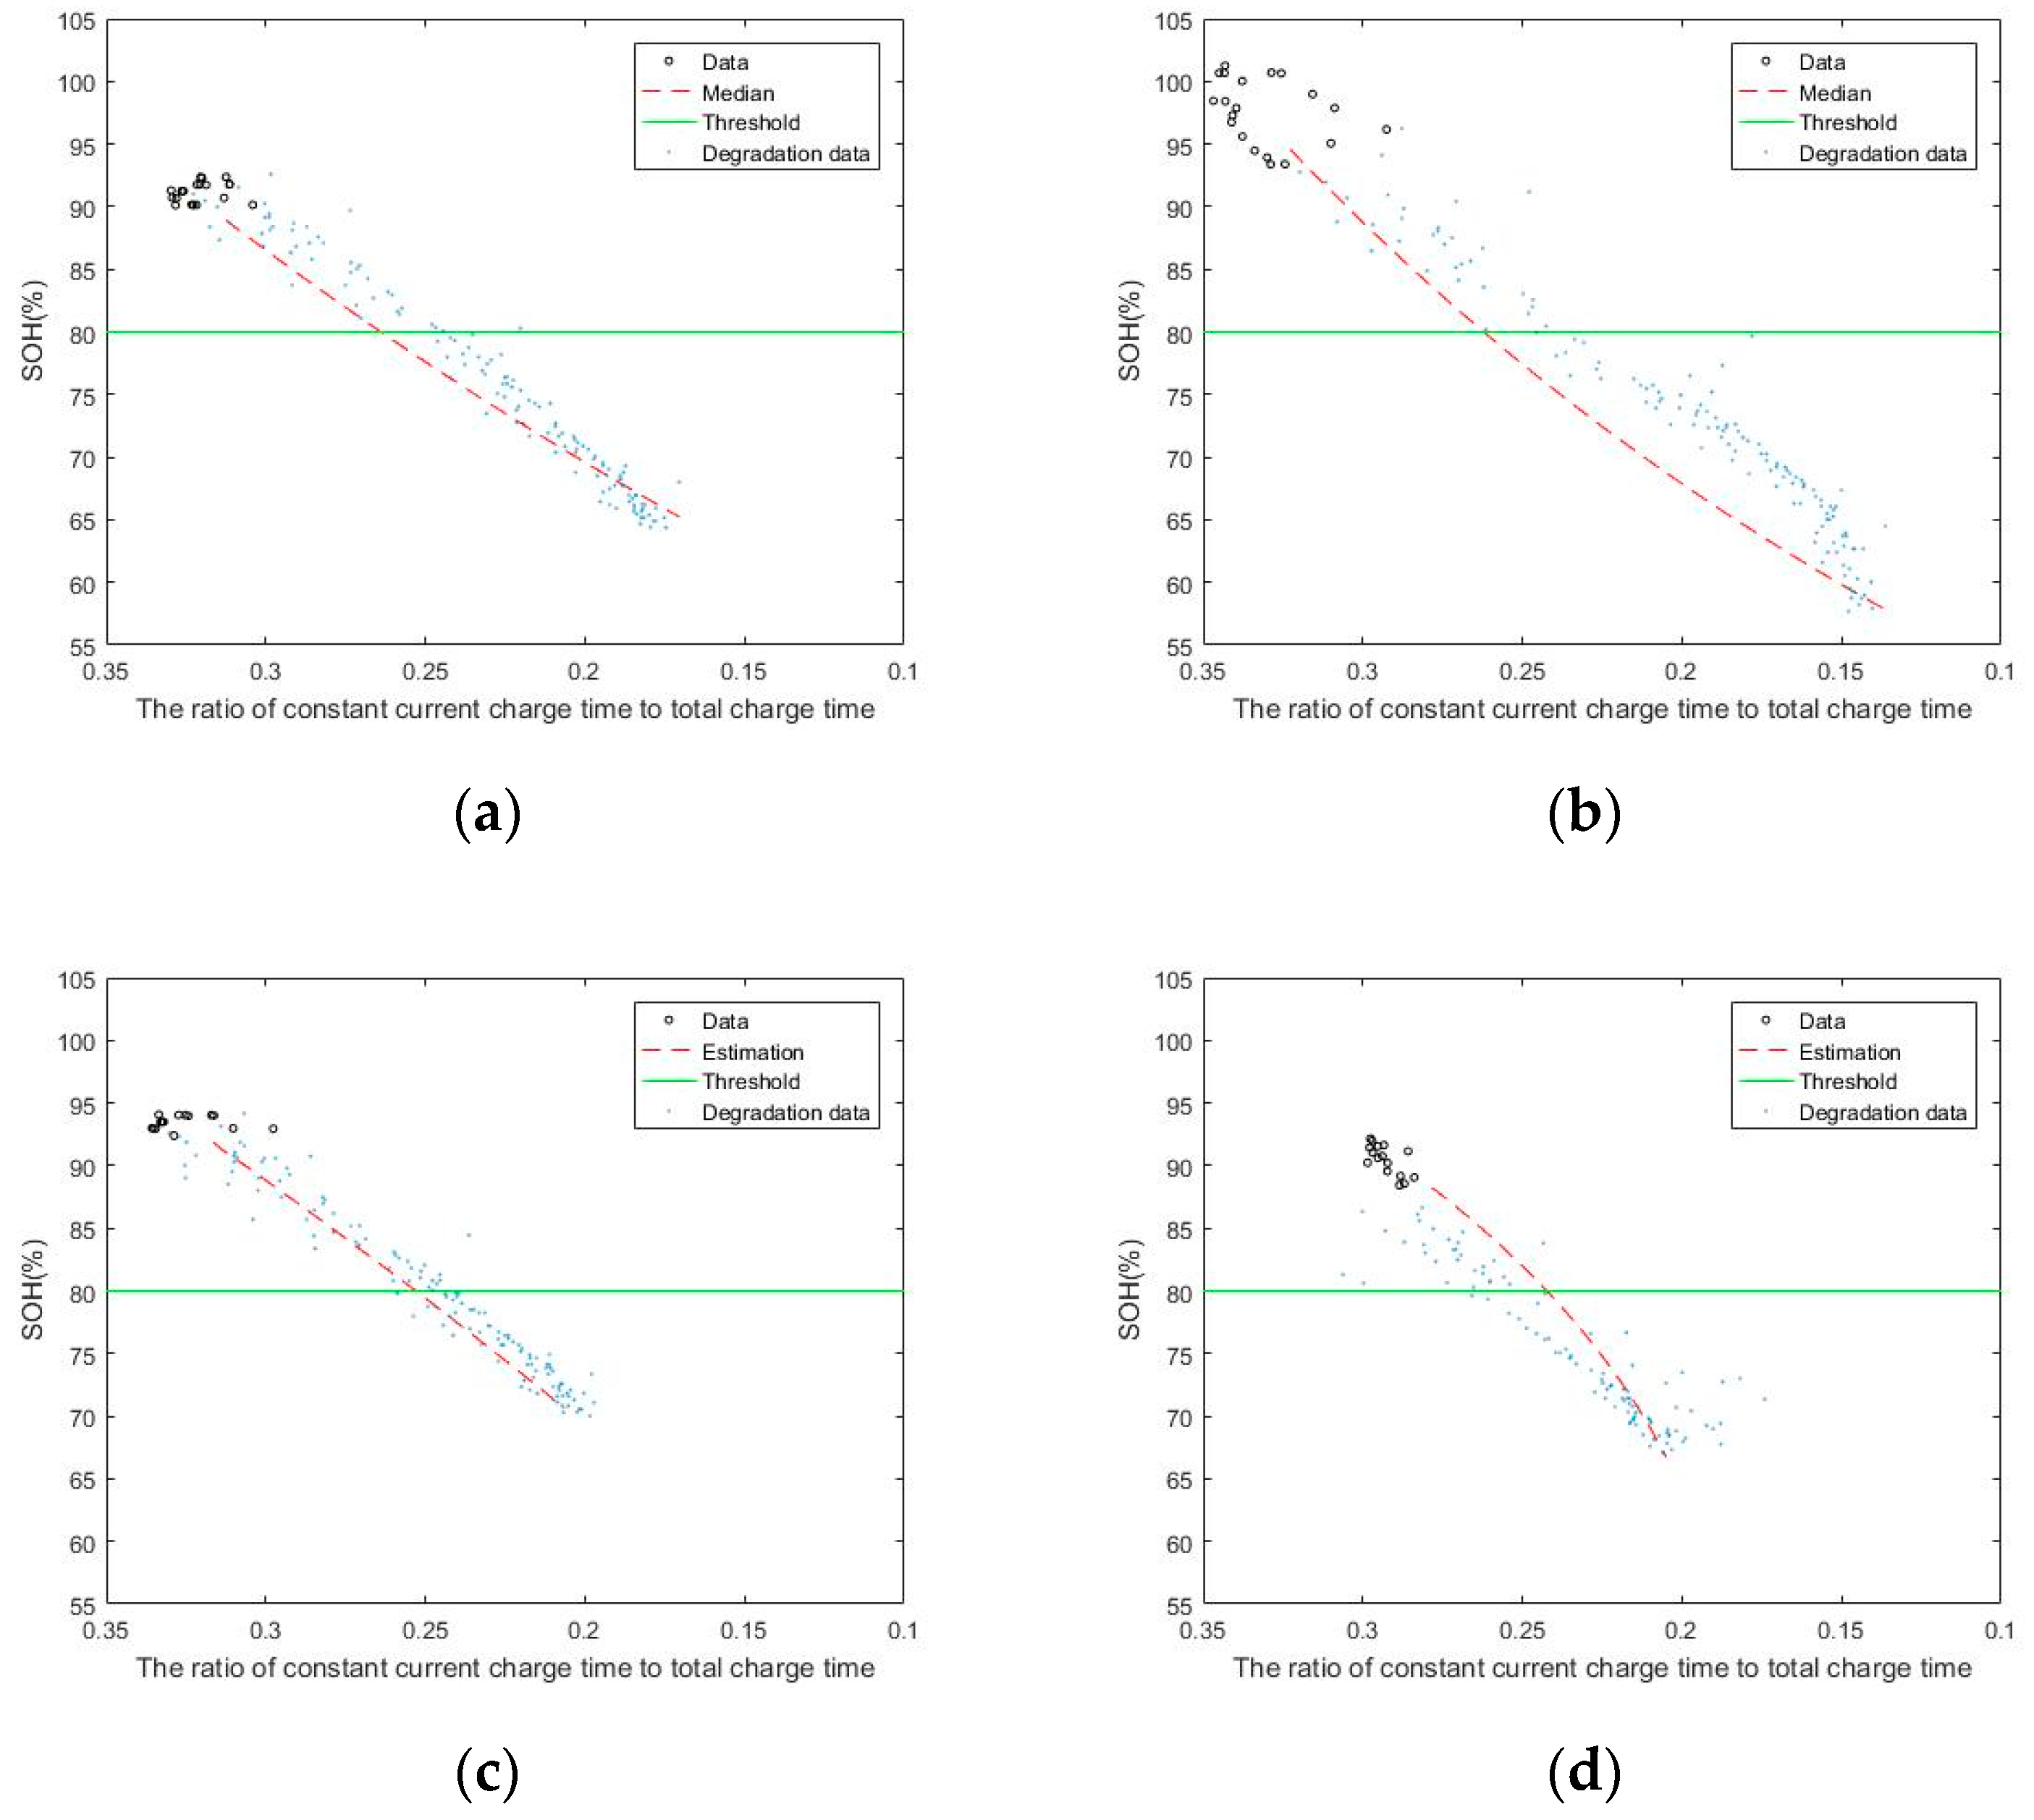
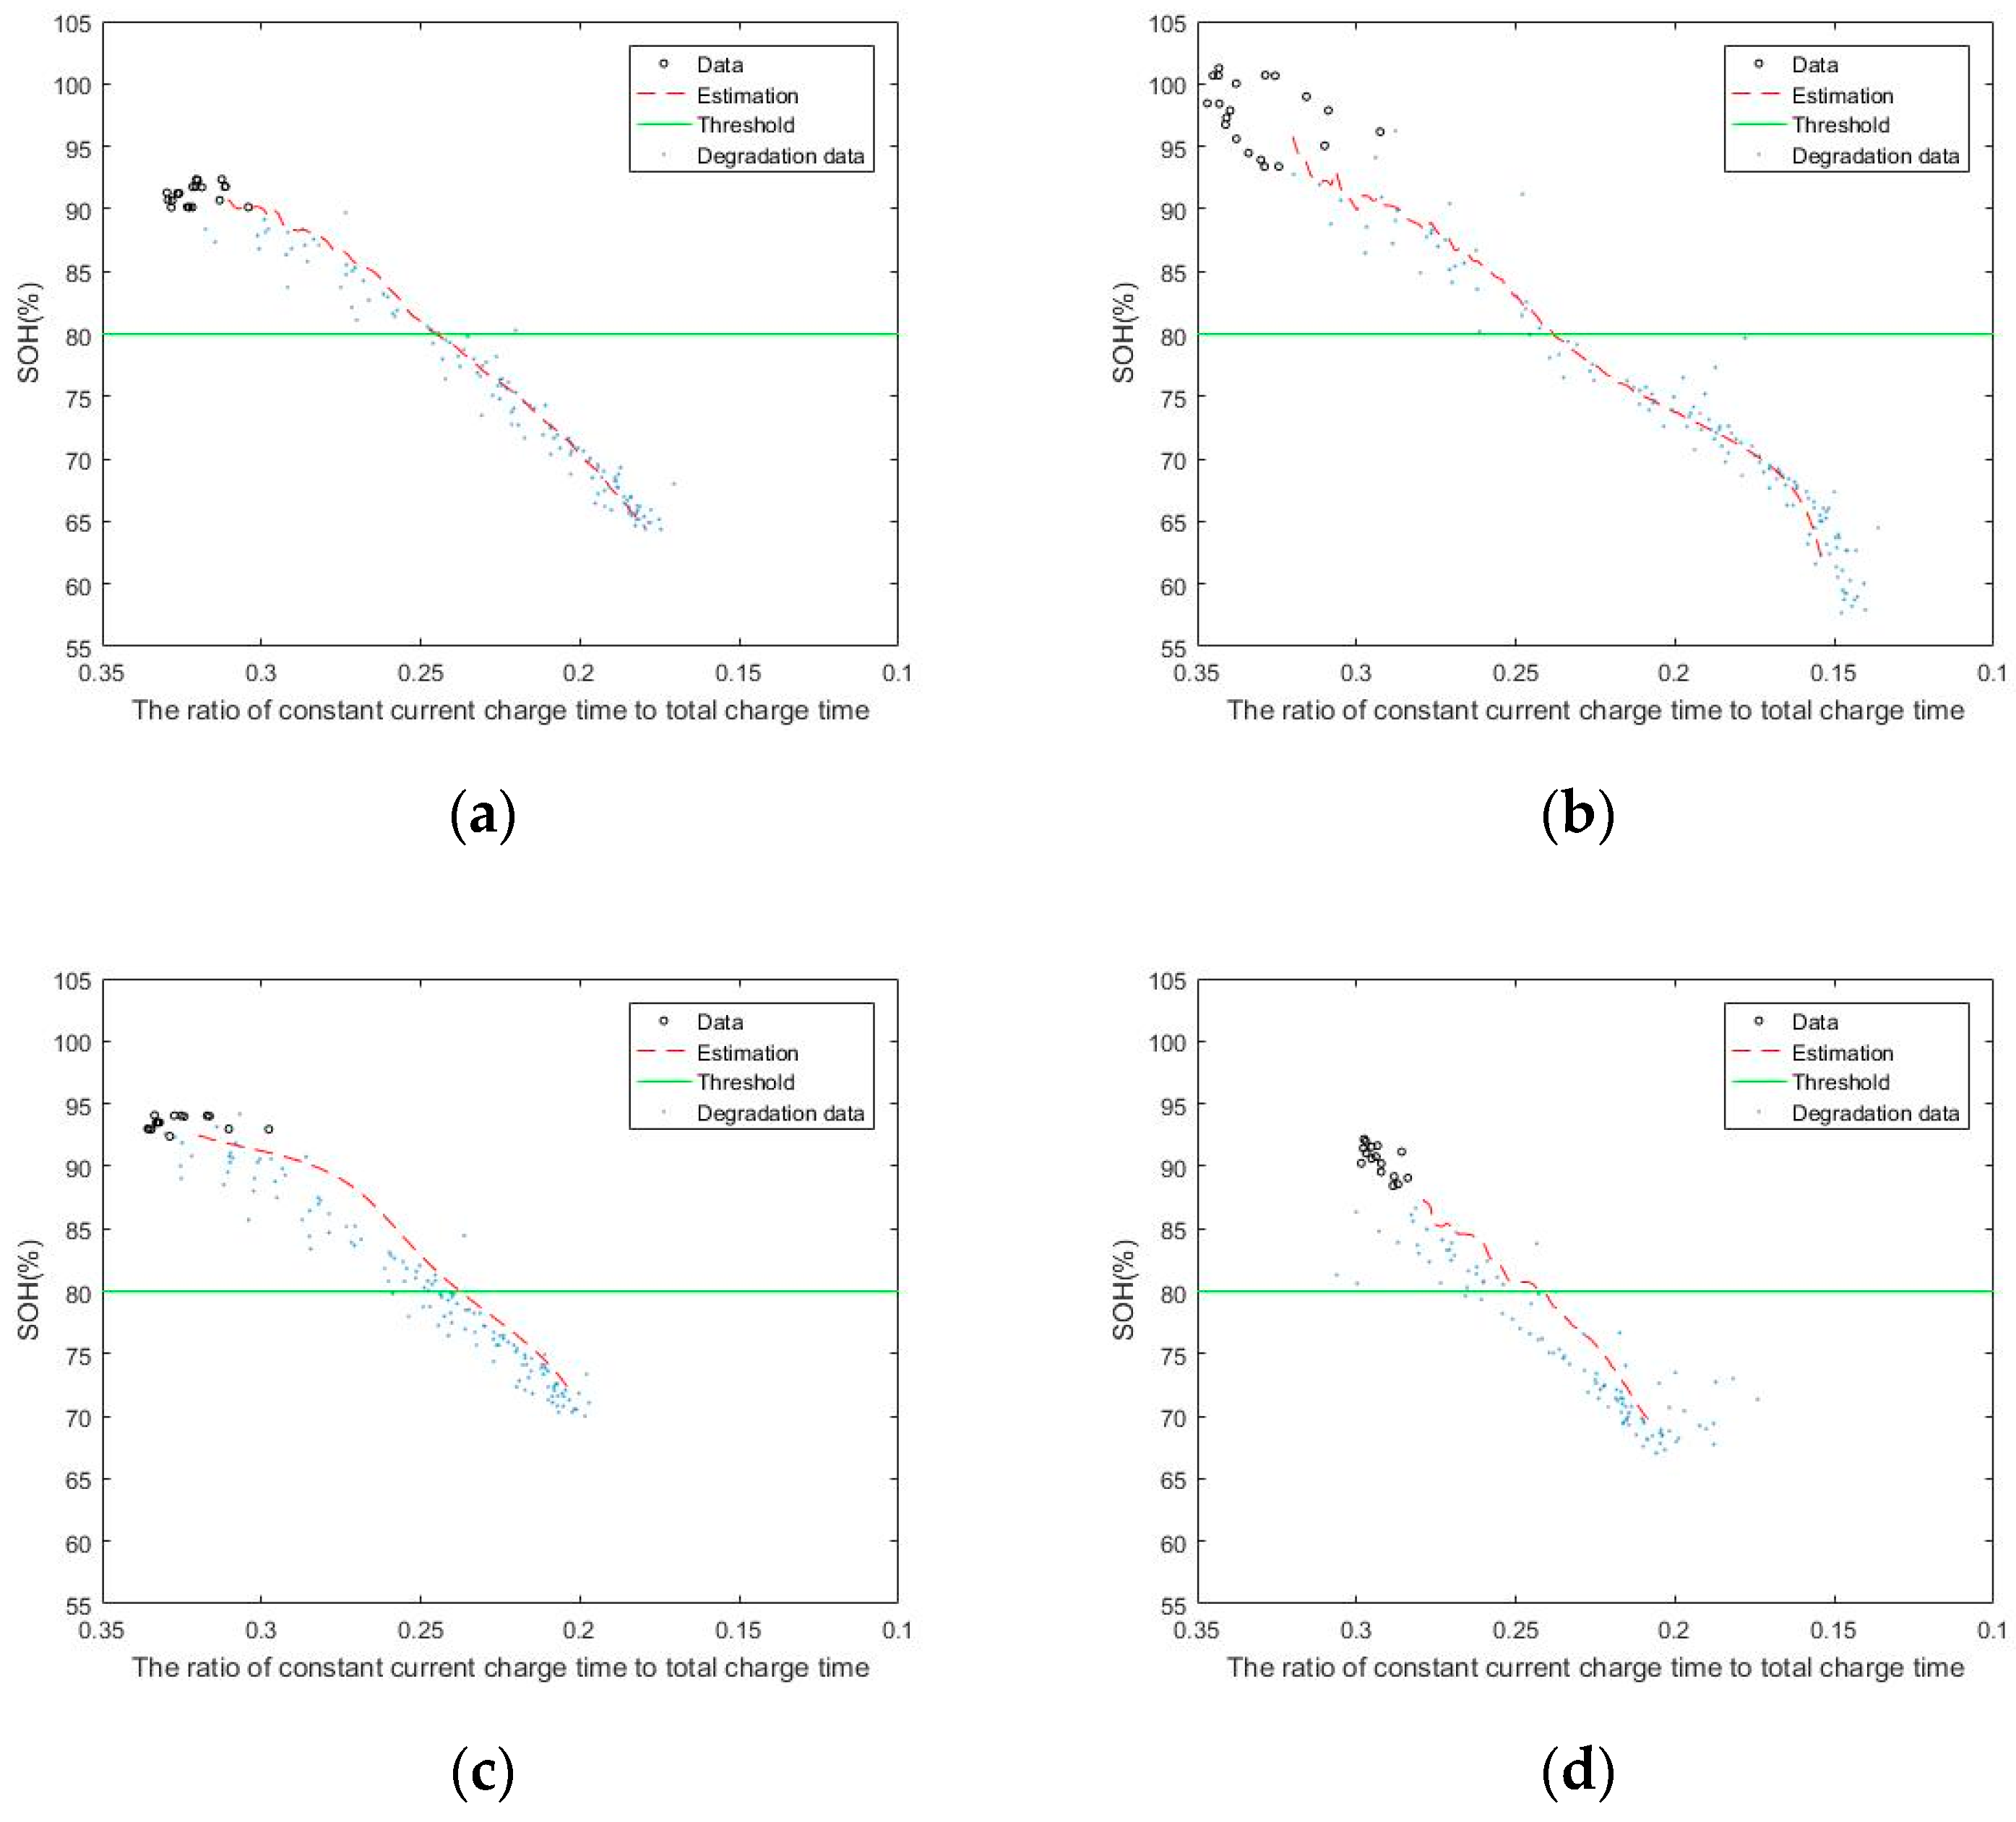
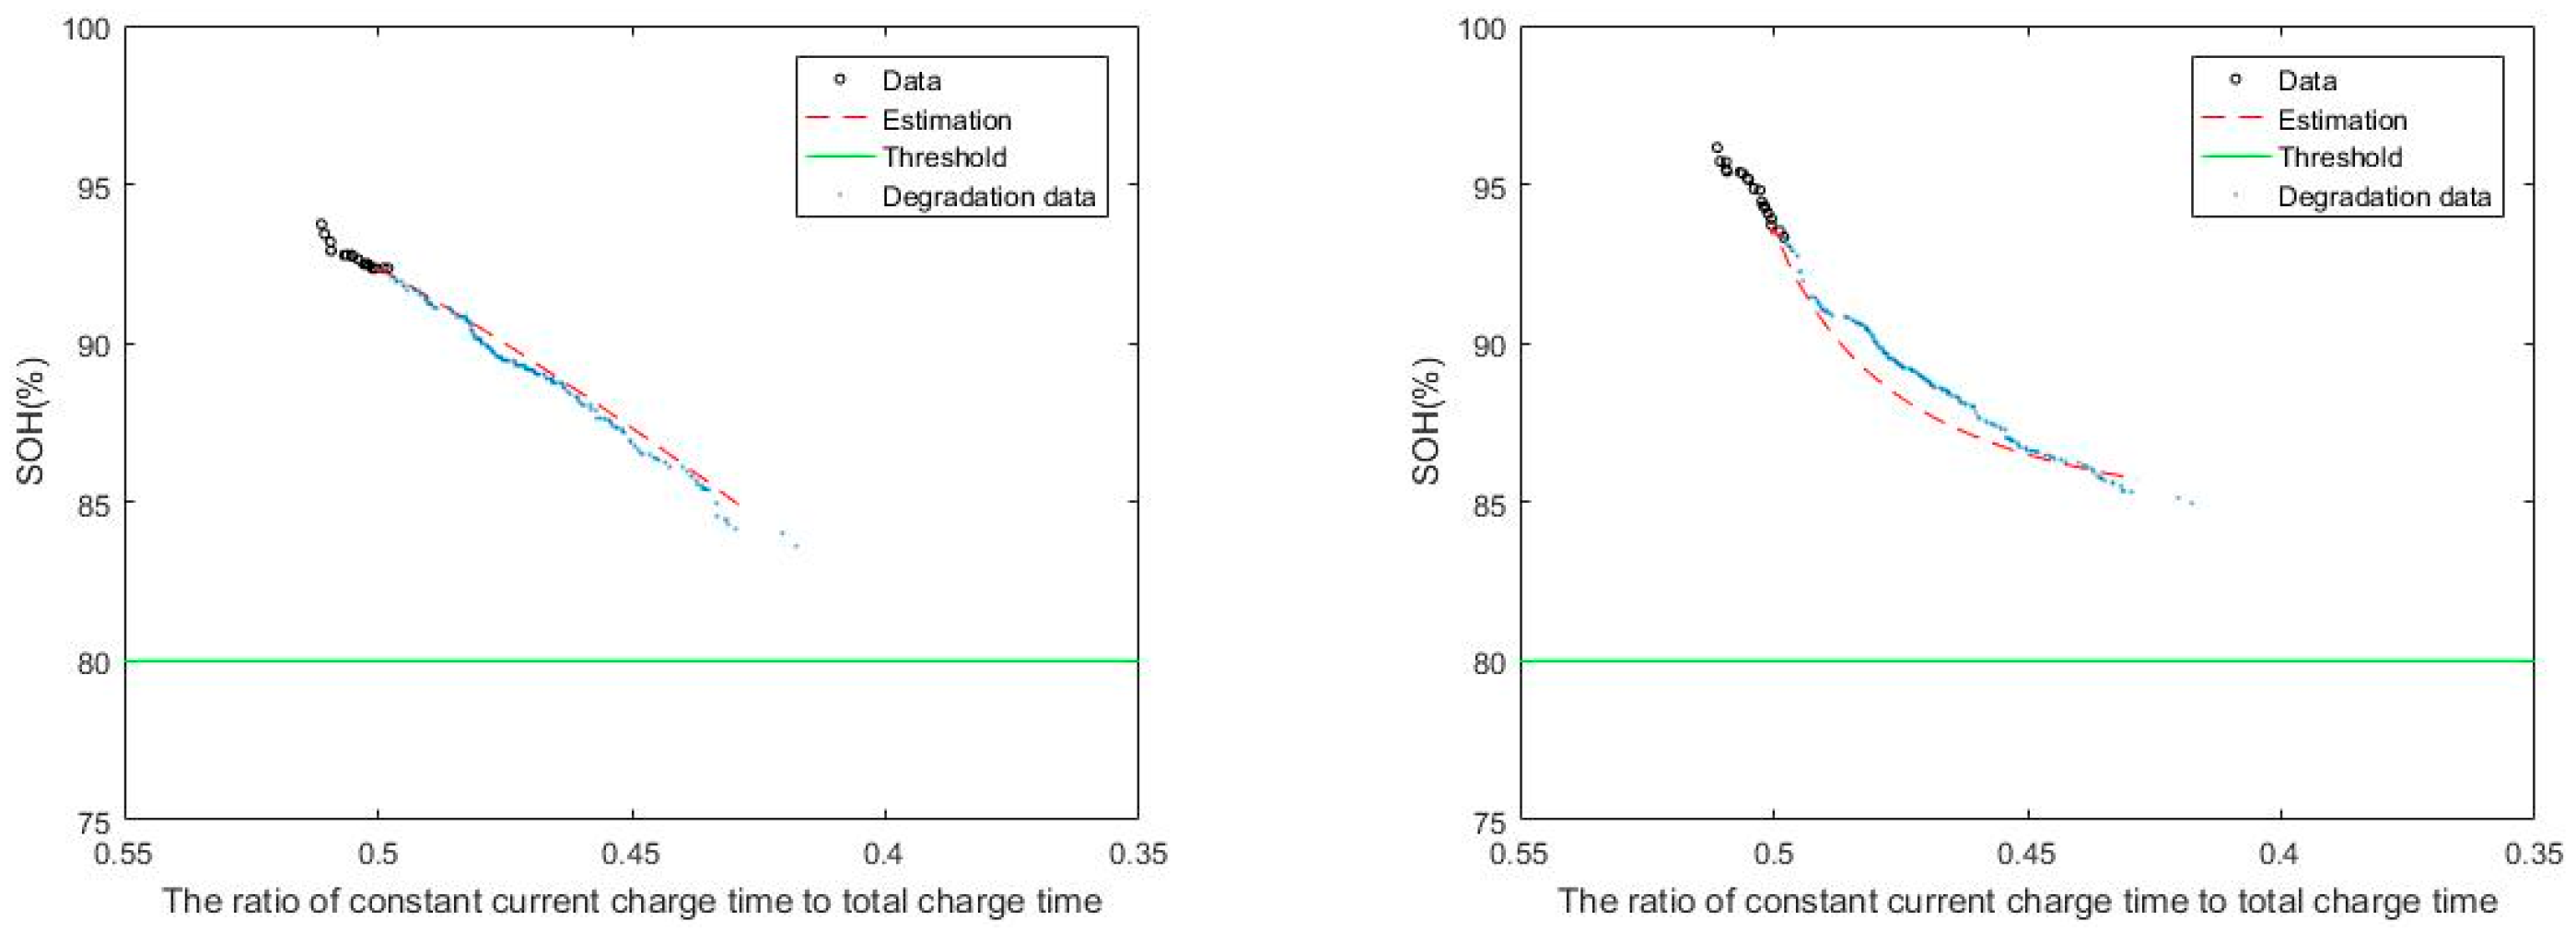
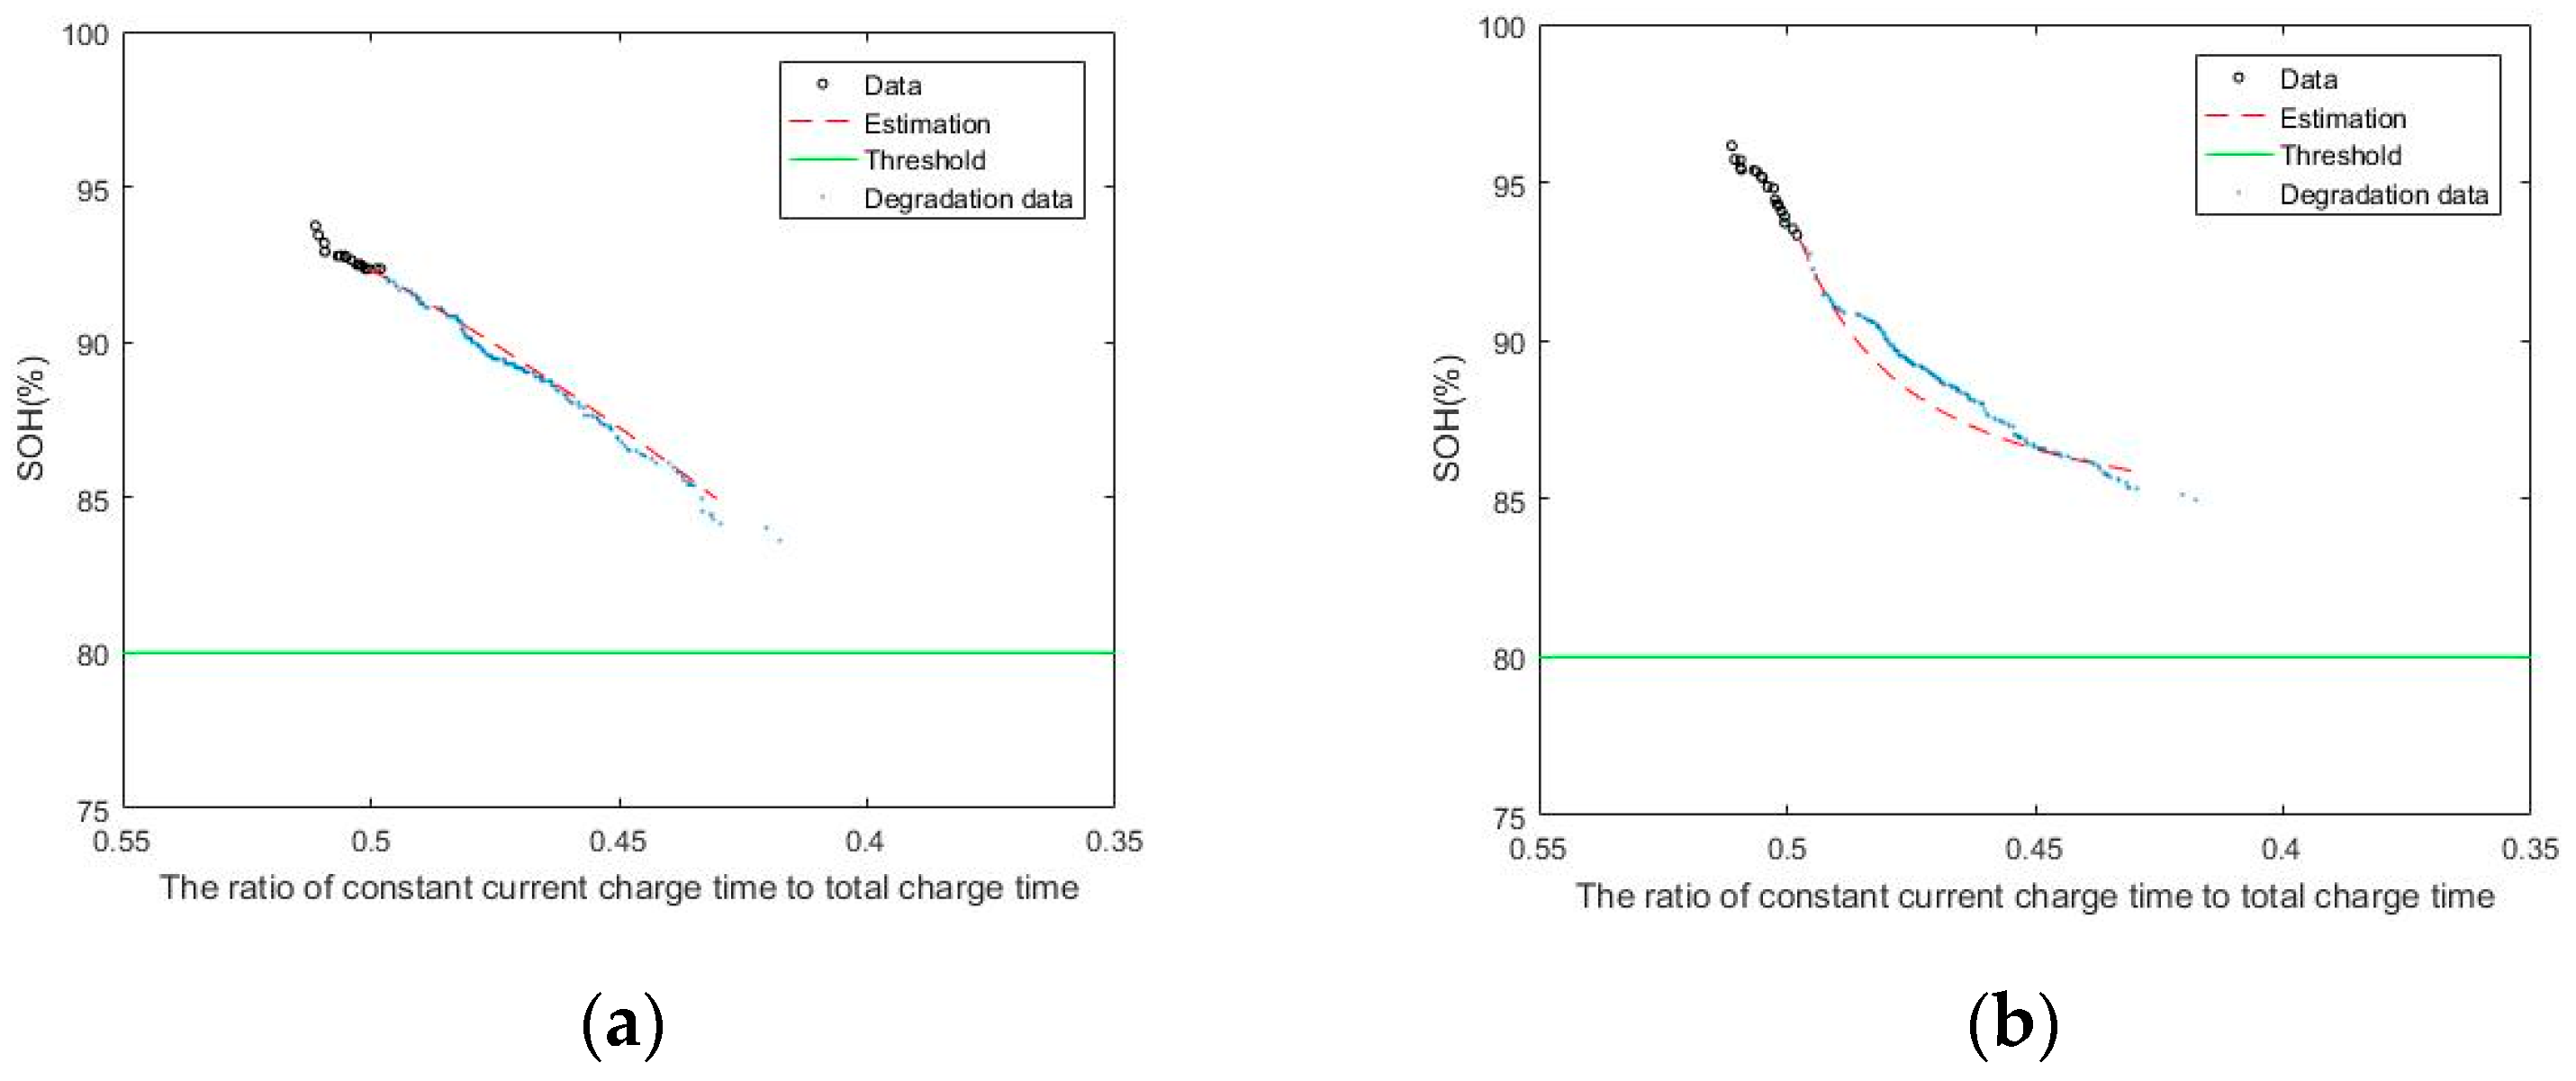
Figure 8 shows the predicted results for NASA 5, 6, 7, and 18 batteries using feature 1, which is the ratio of the constant-current charging time to the total charging time obtaining using the LSTM.
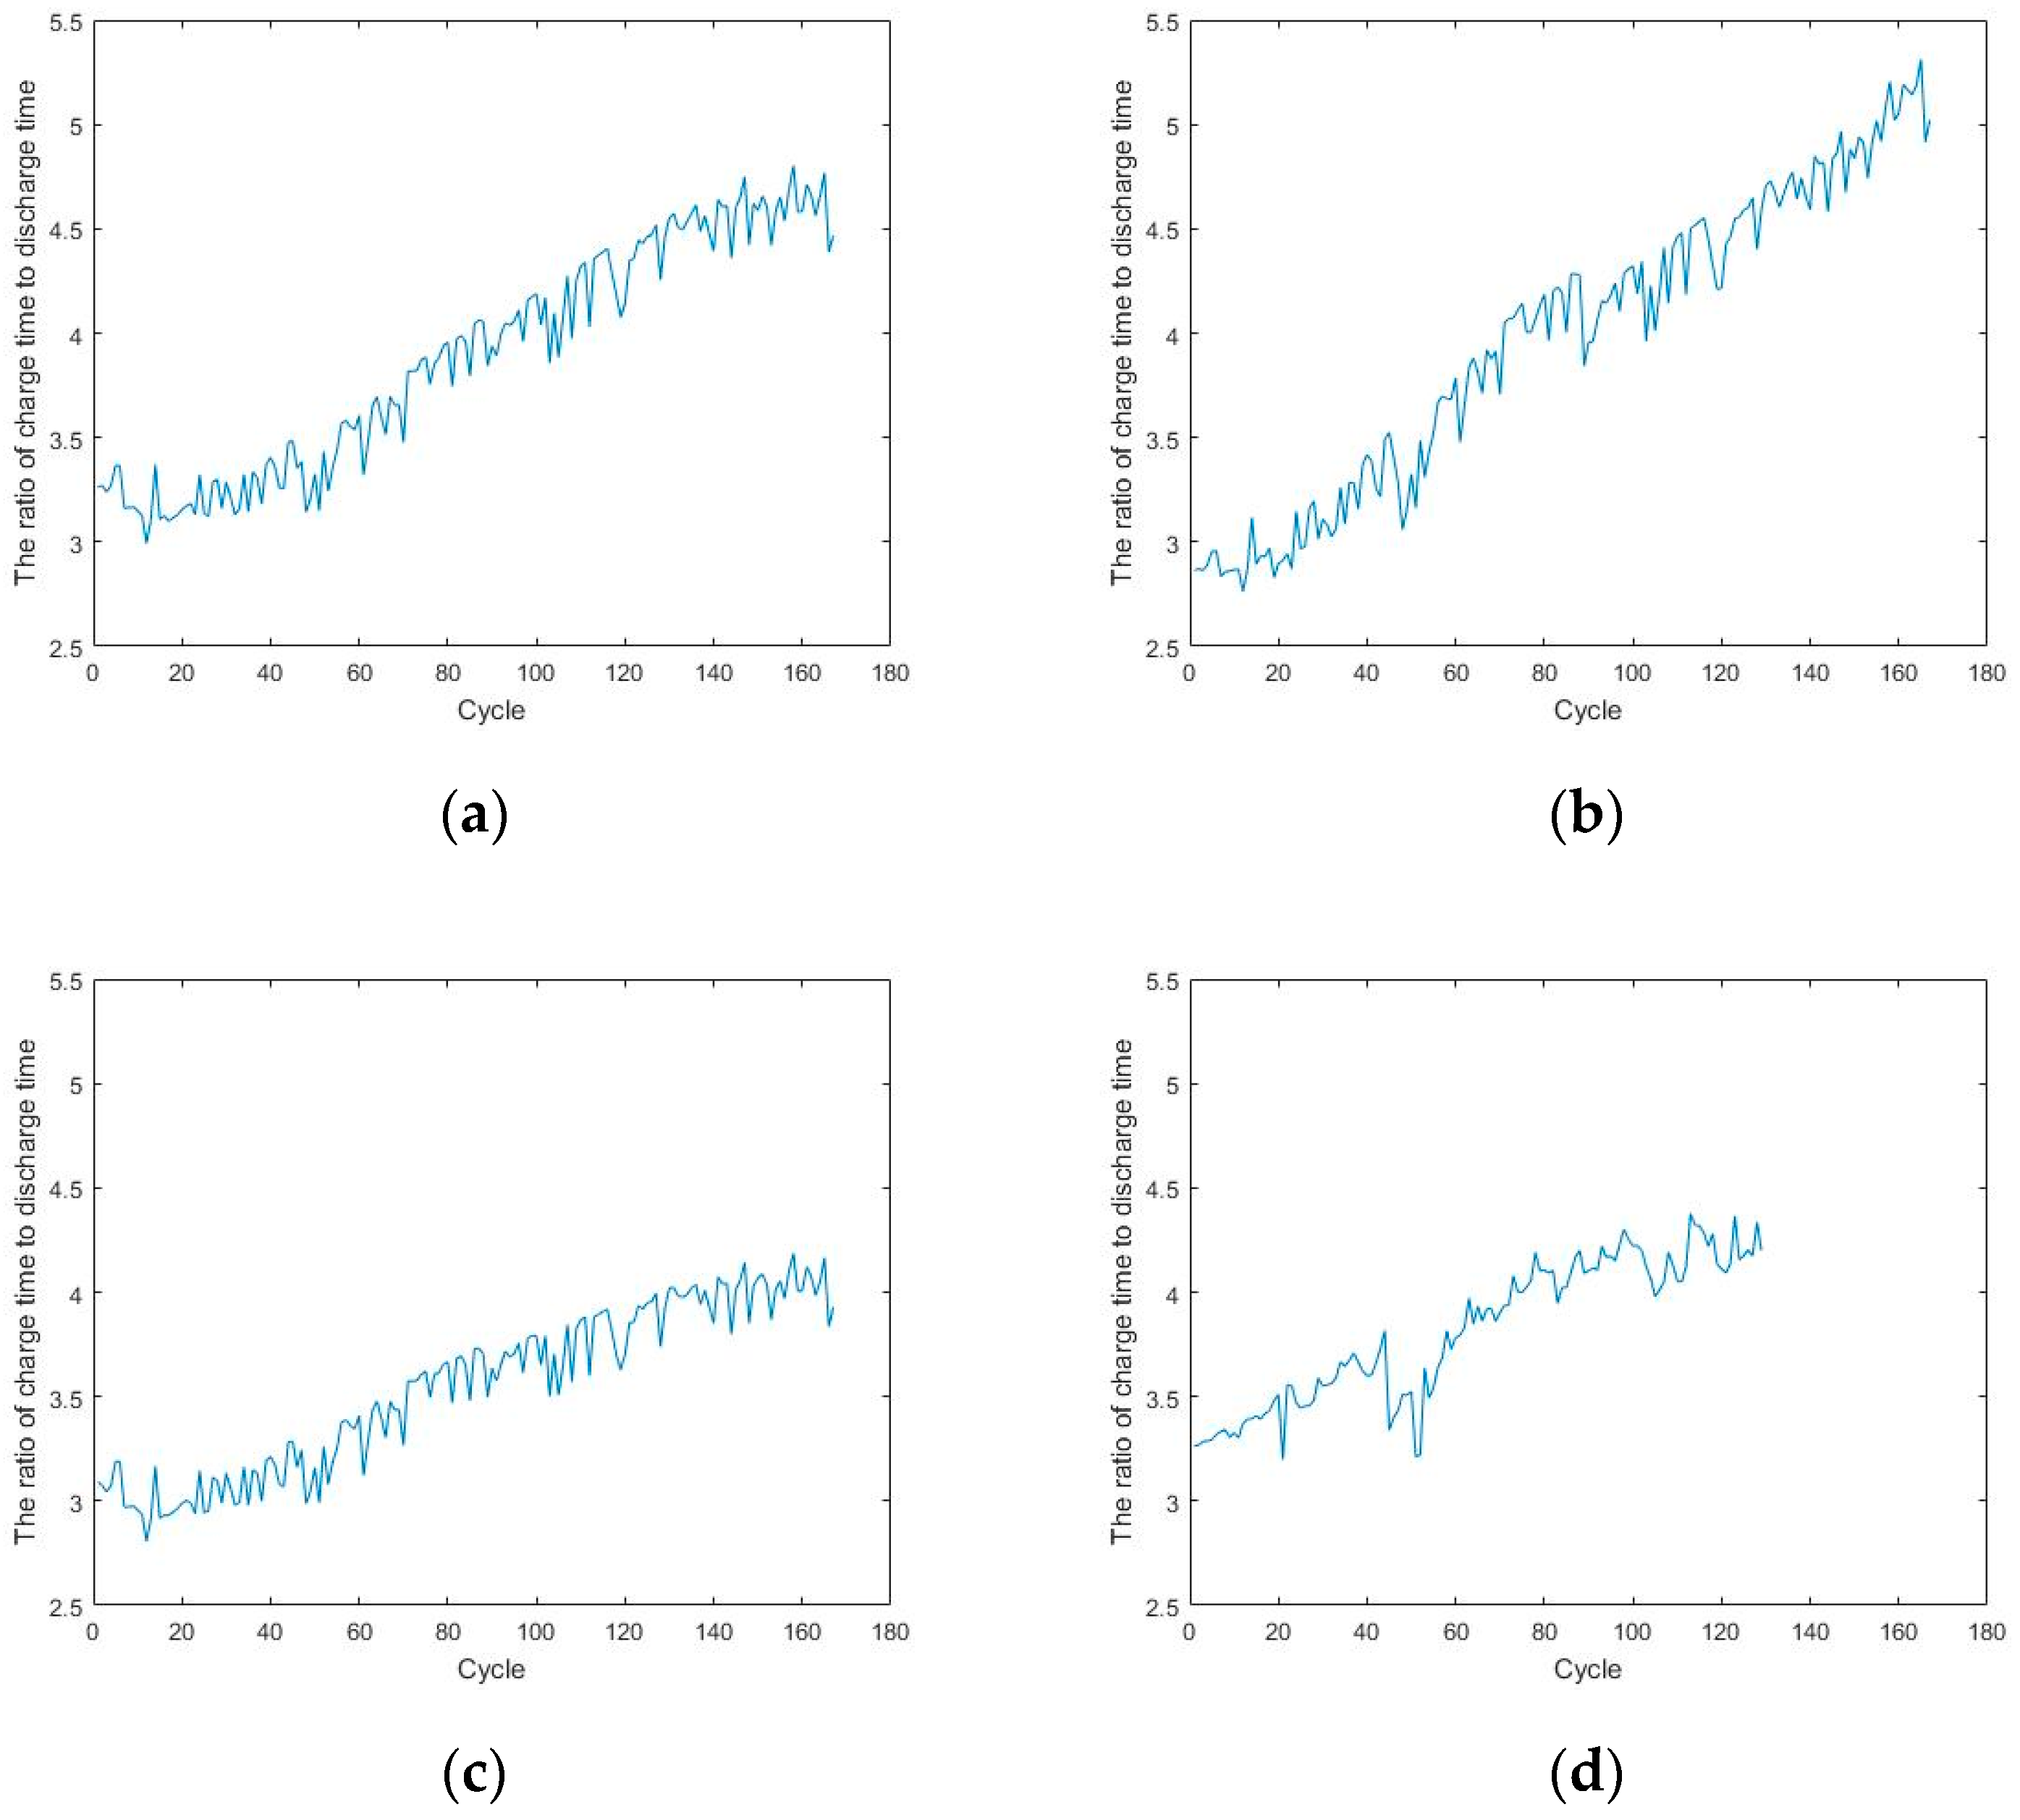
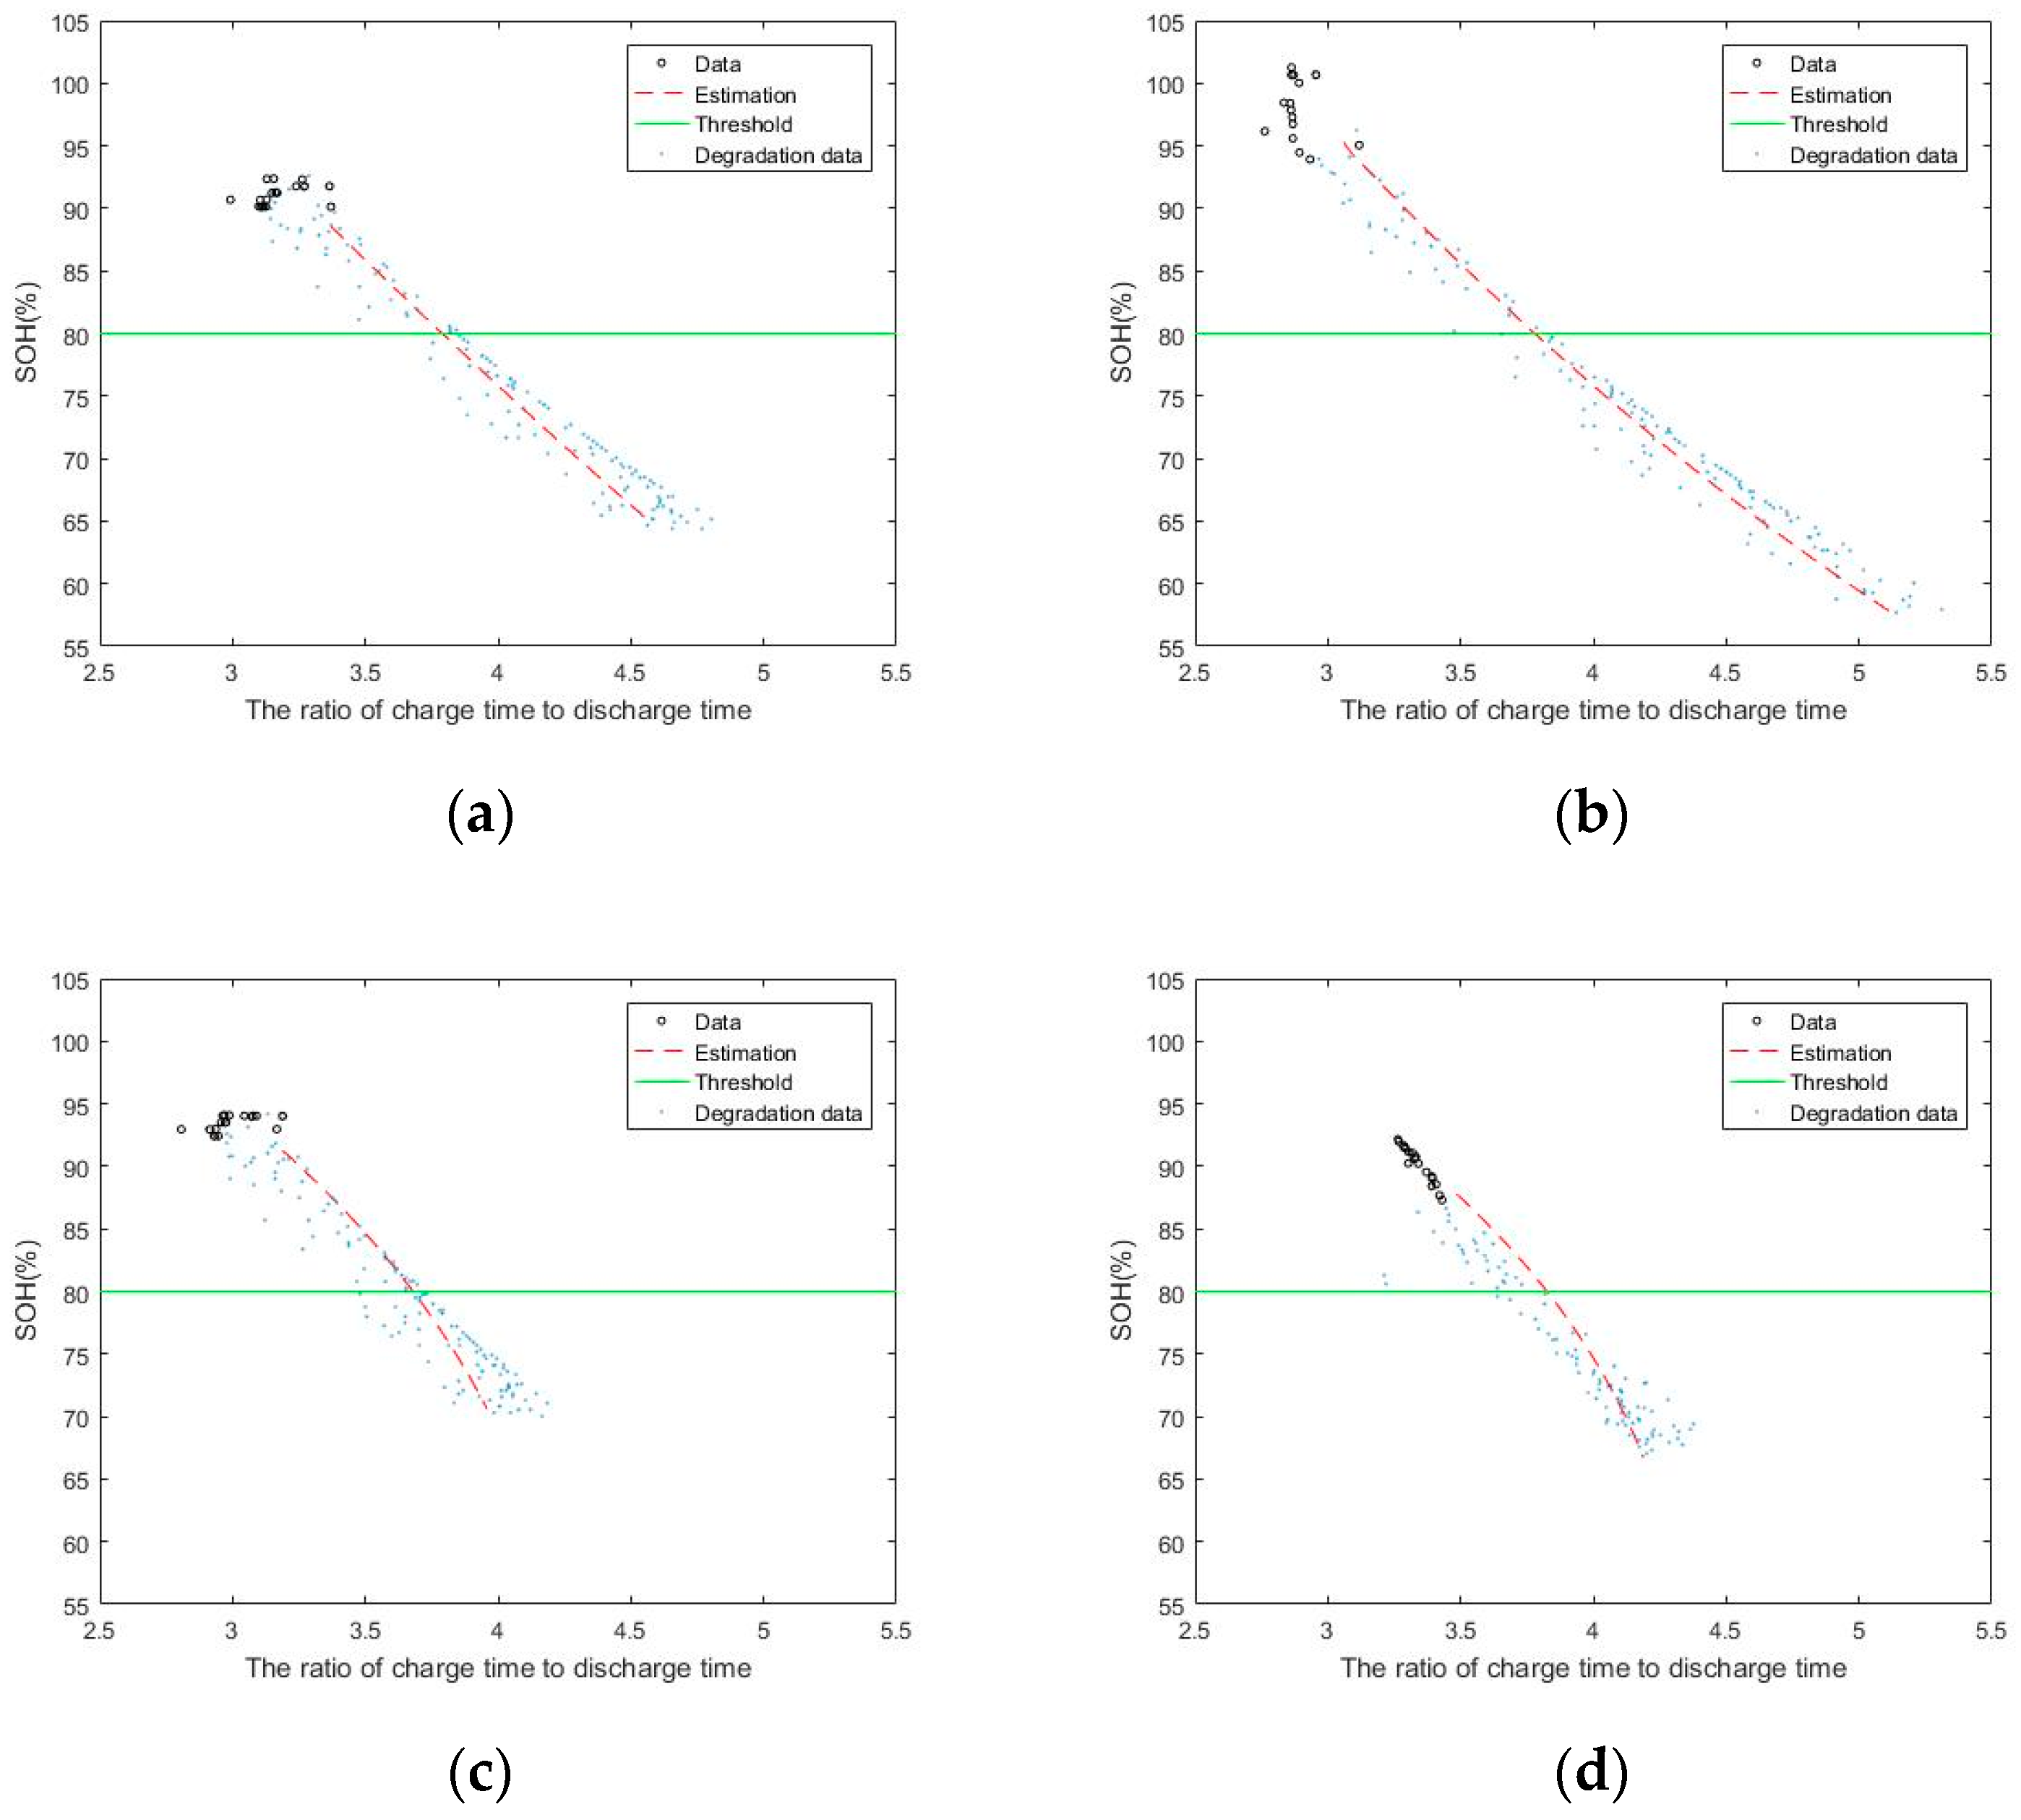
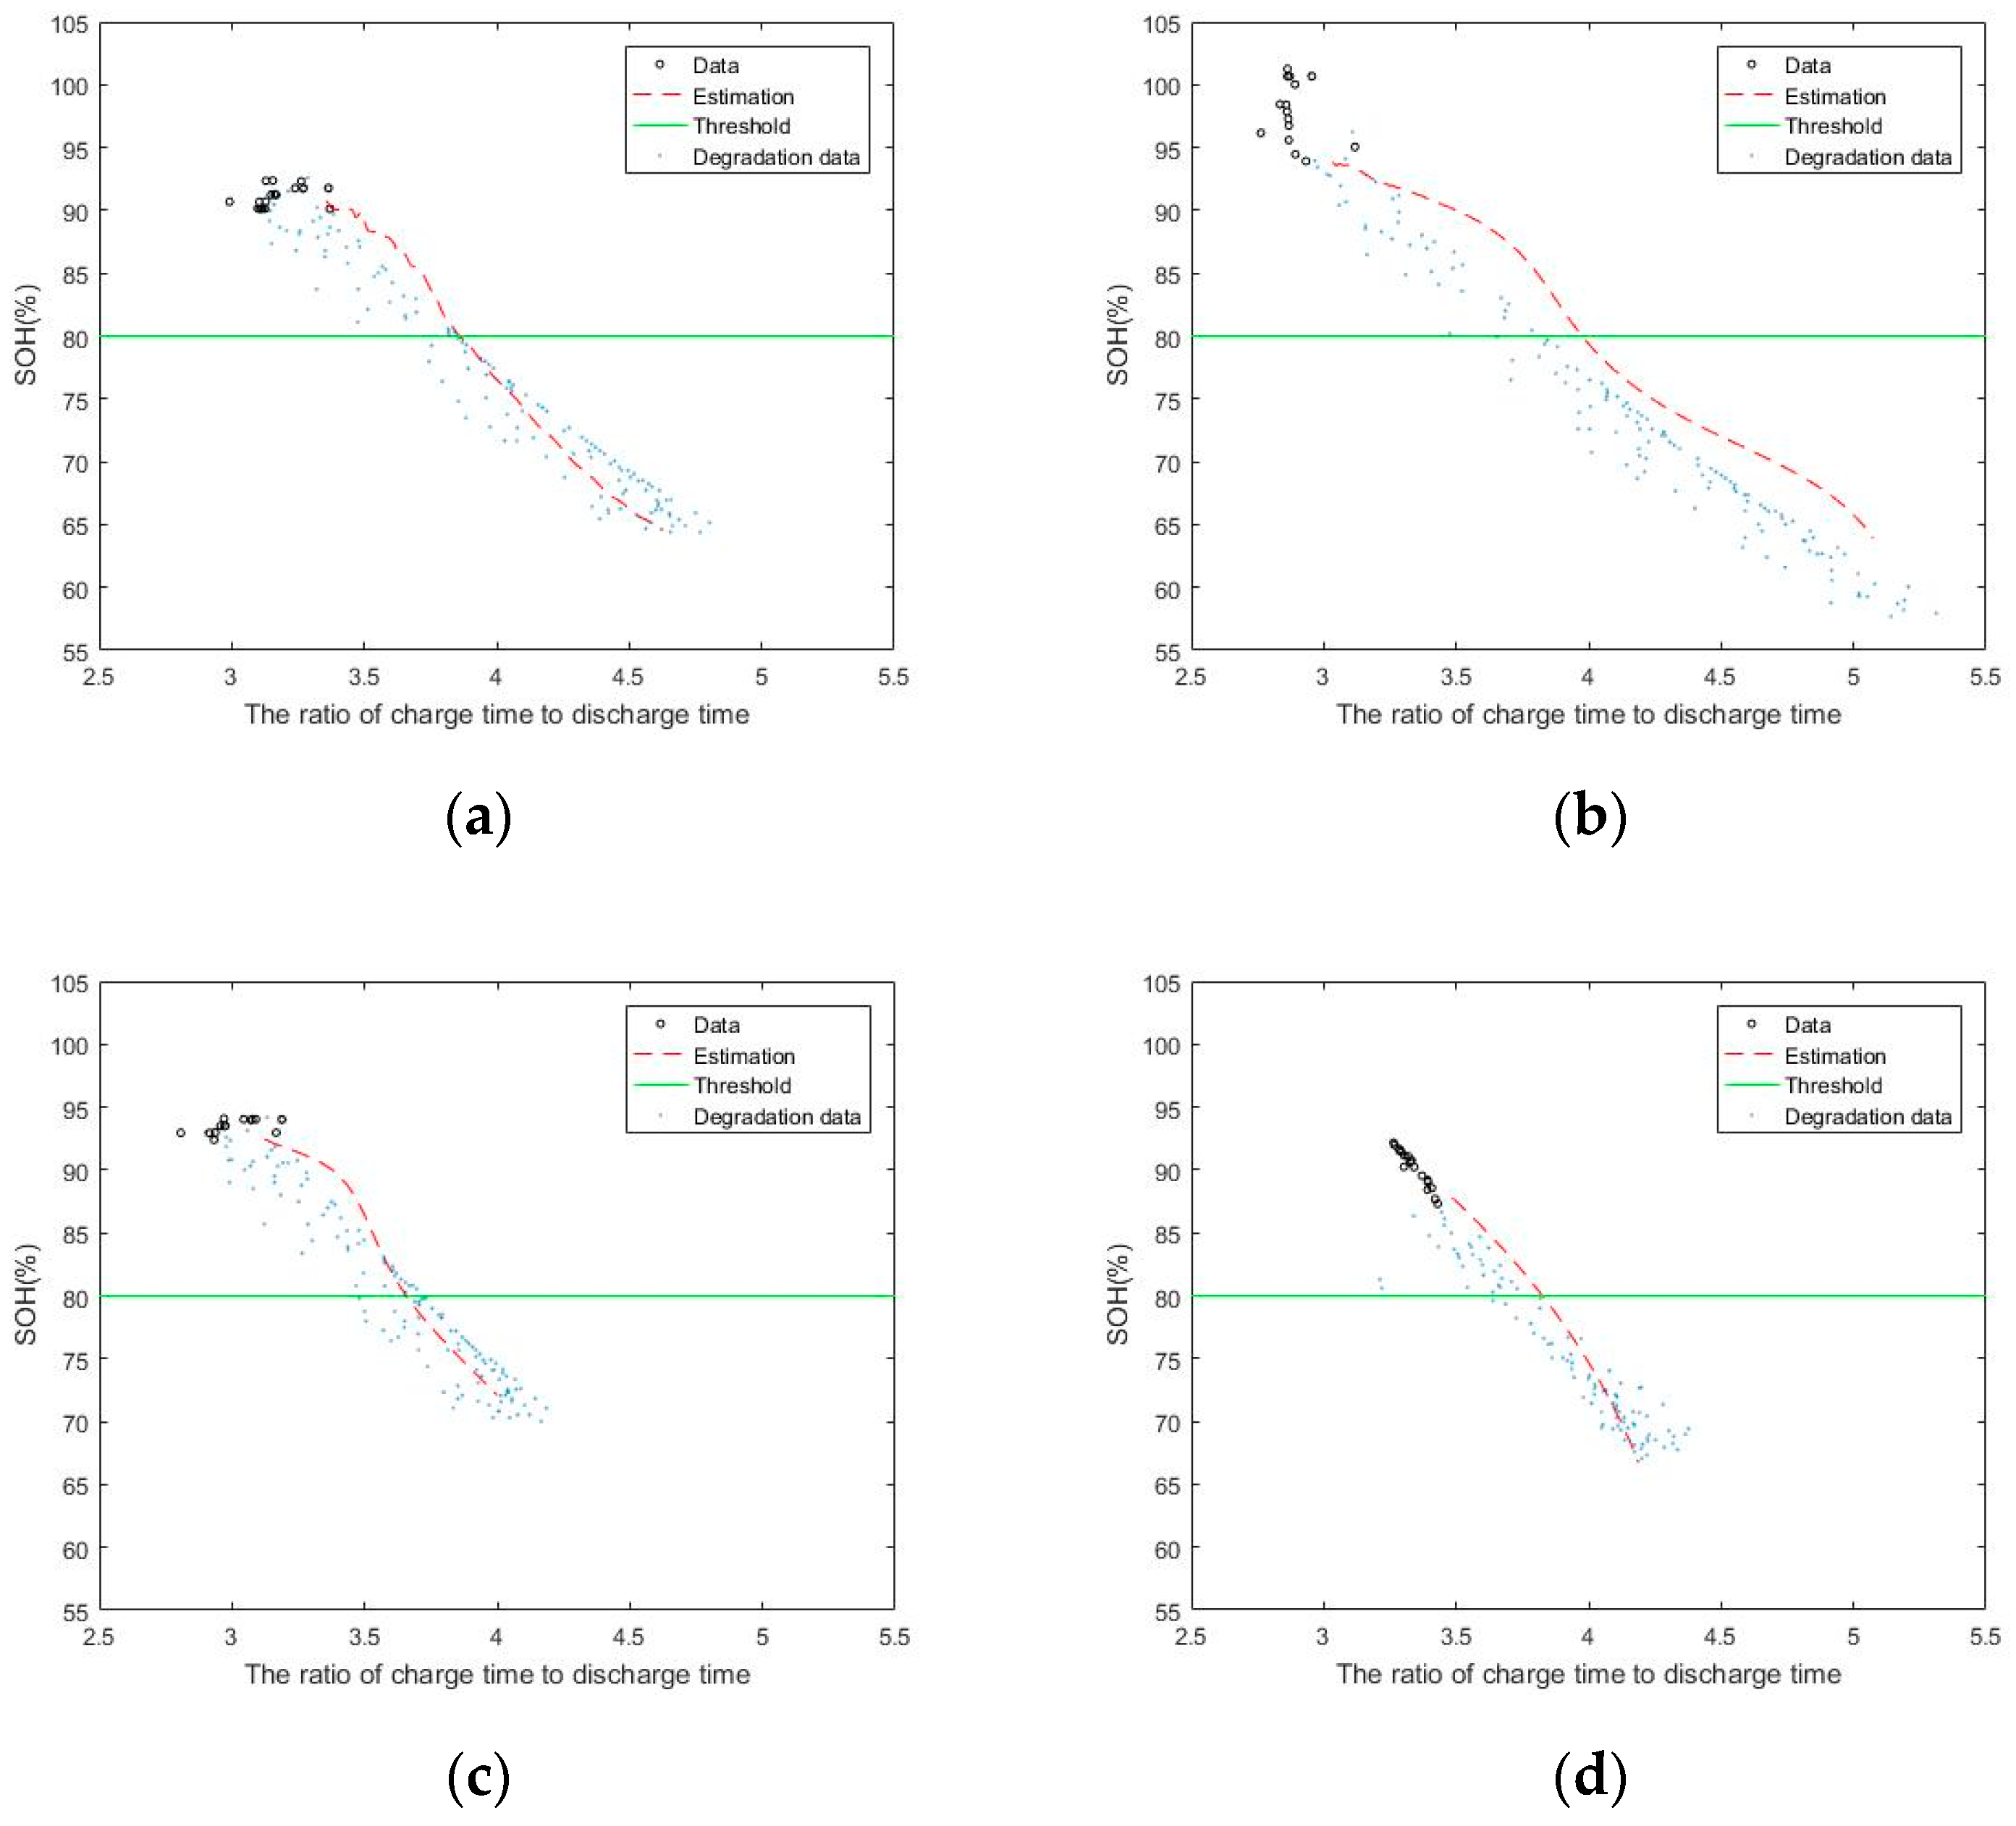
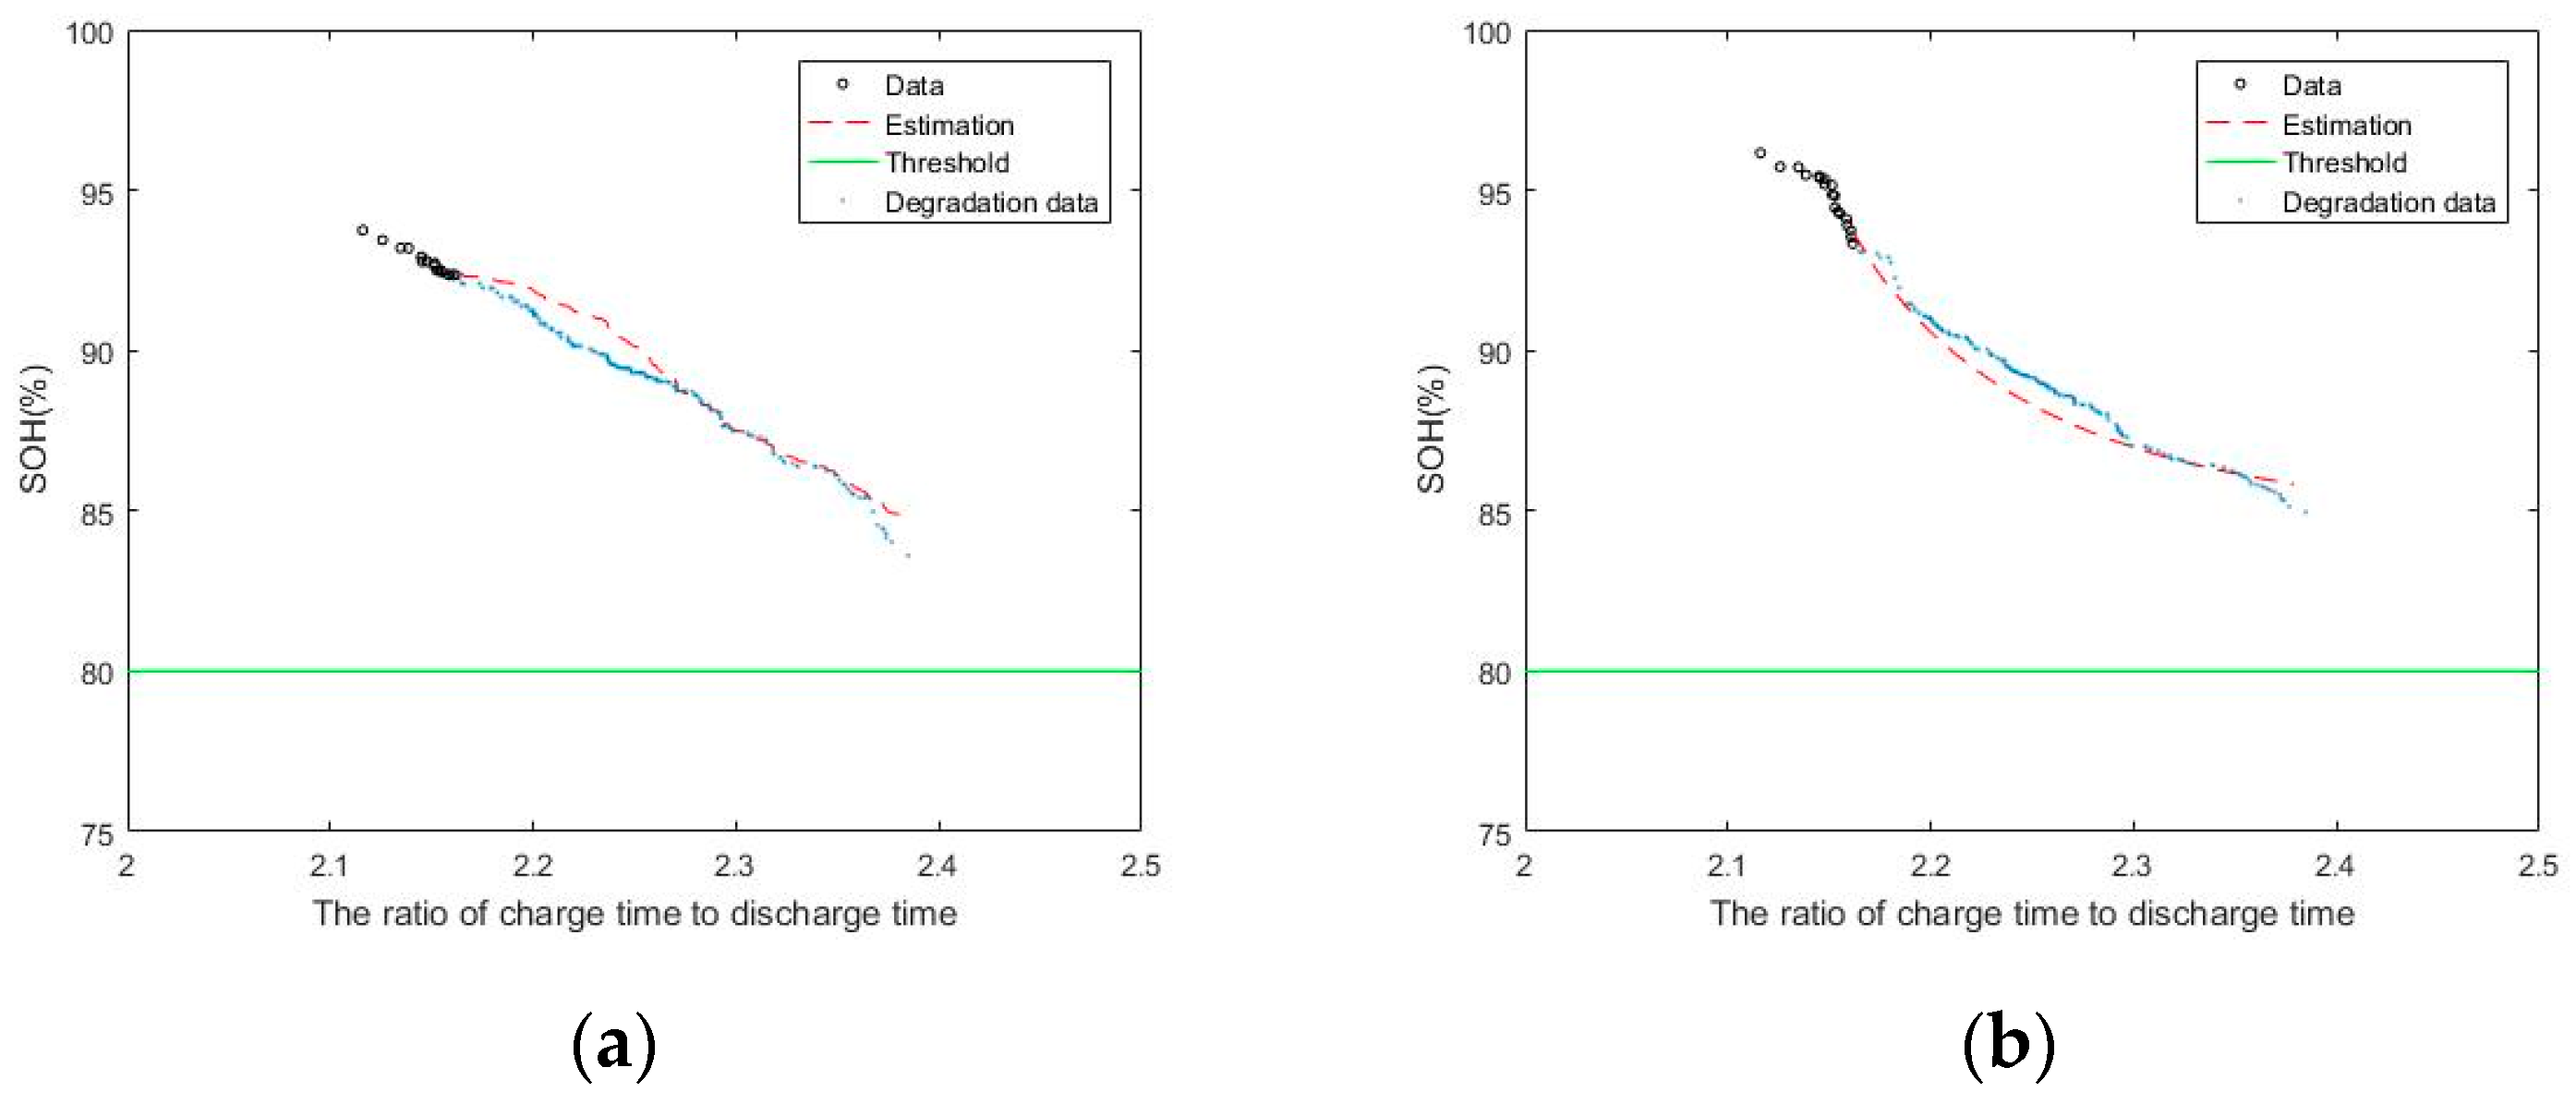
The battery SOH values were predicted well using feature 1. Extracted feature 2 is the ratio of the charge time to discharge time. The prediction results for batteries 5, 6, 7, and 18 obtained by the LSTM using feature 2 are shown in Figure 9.
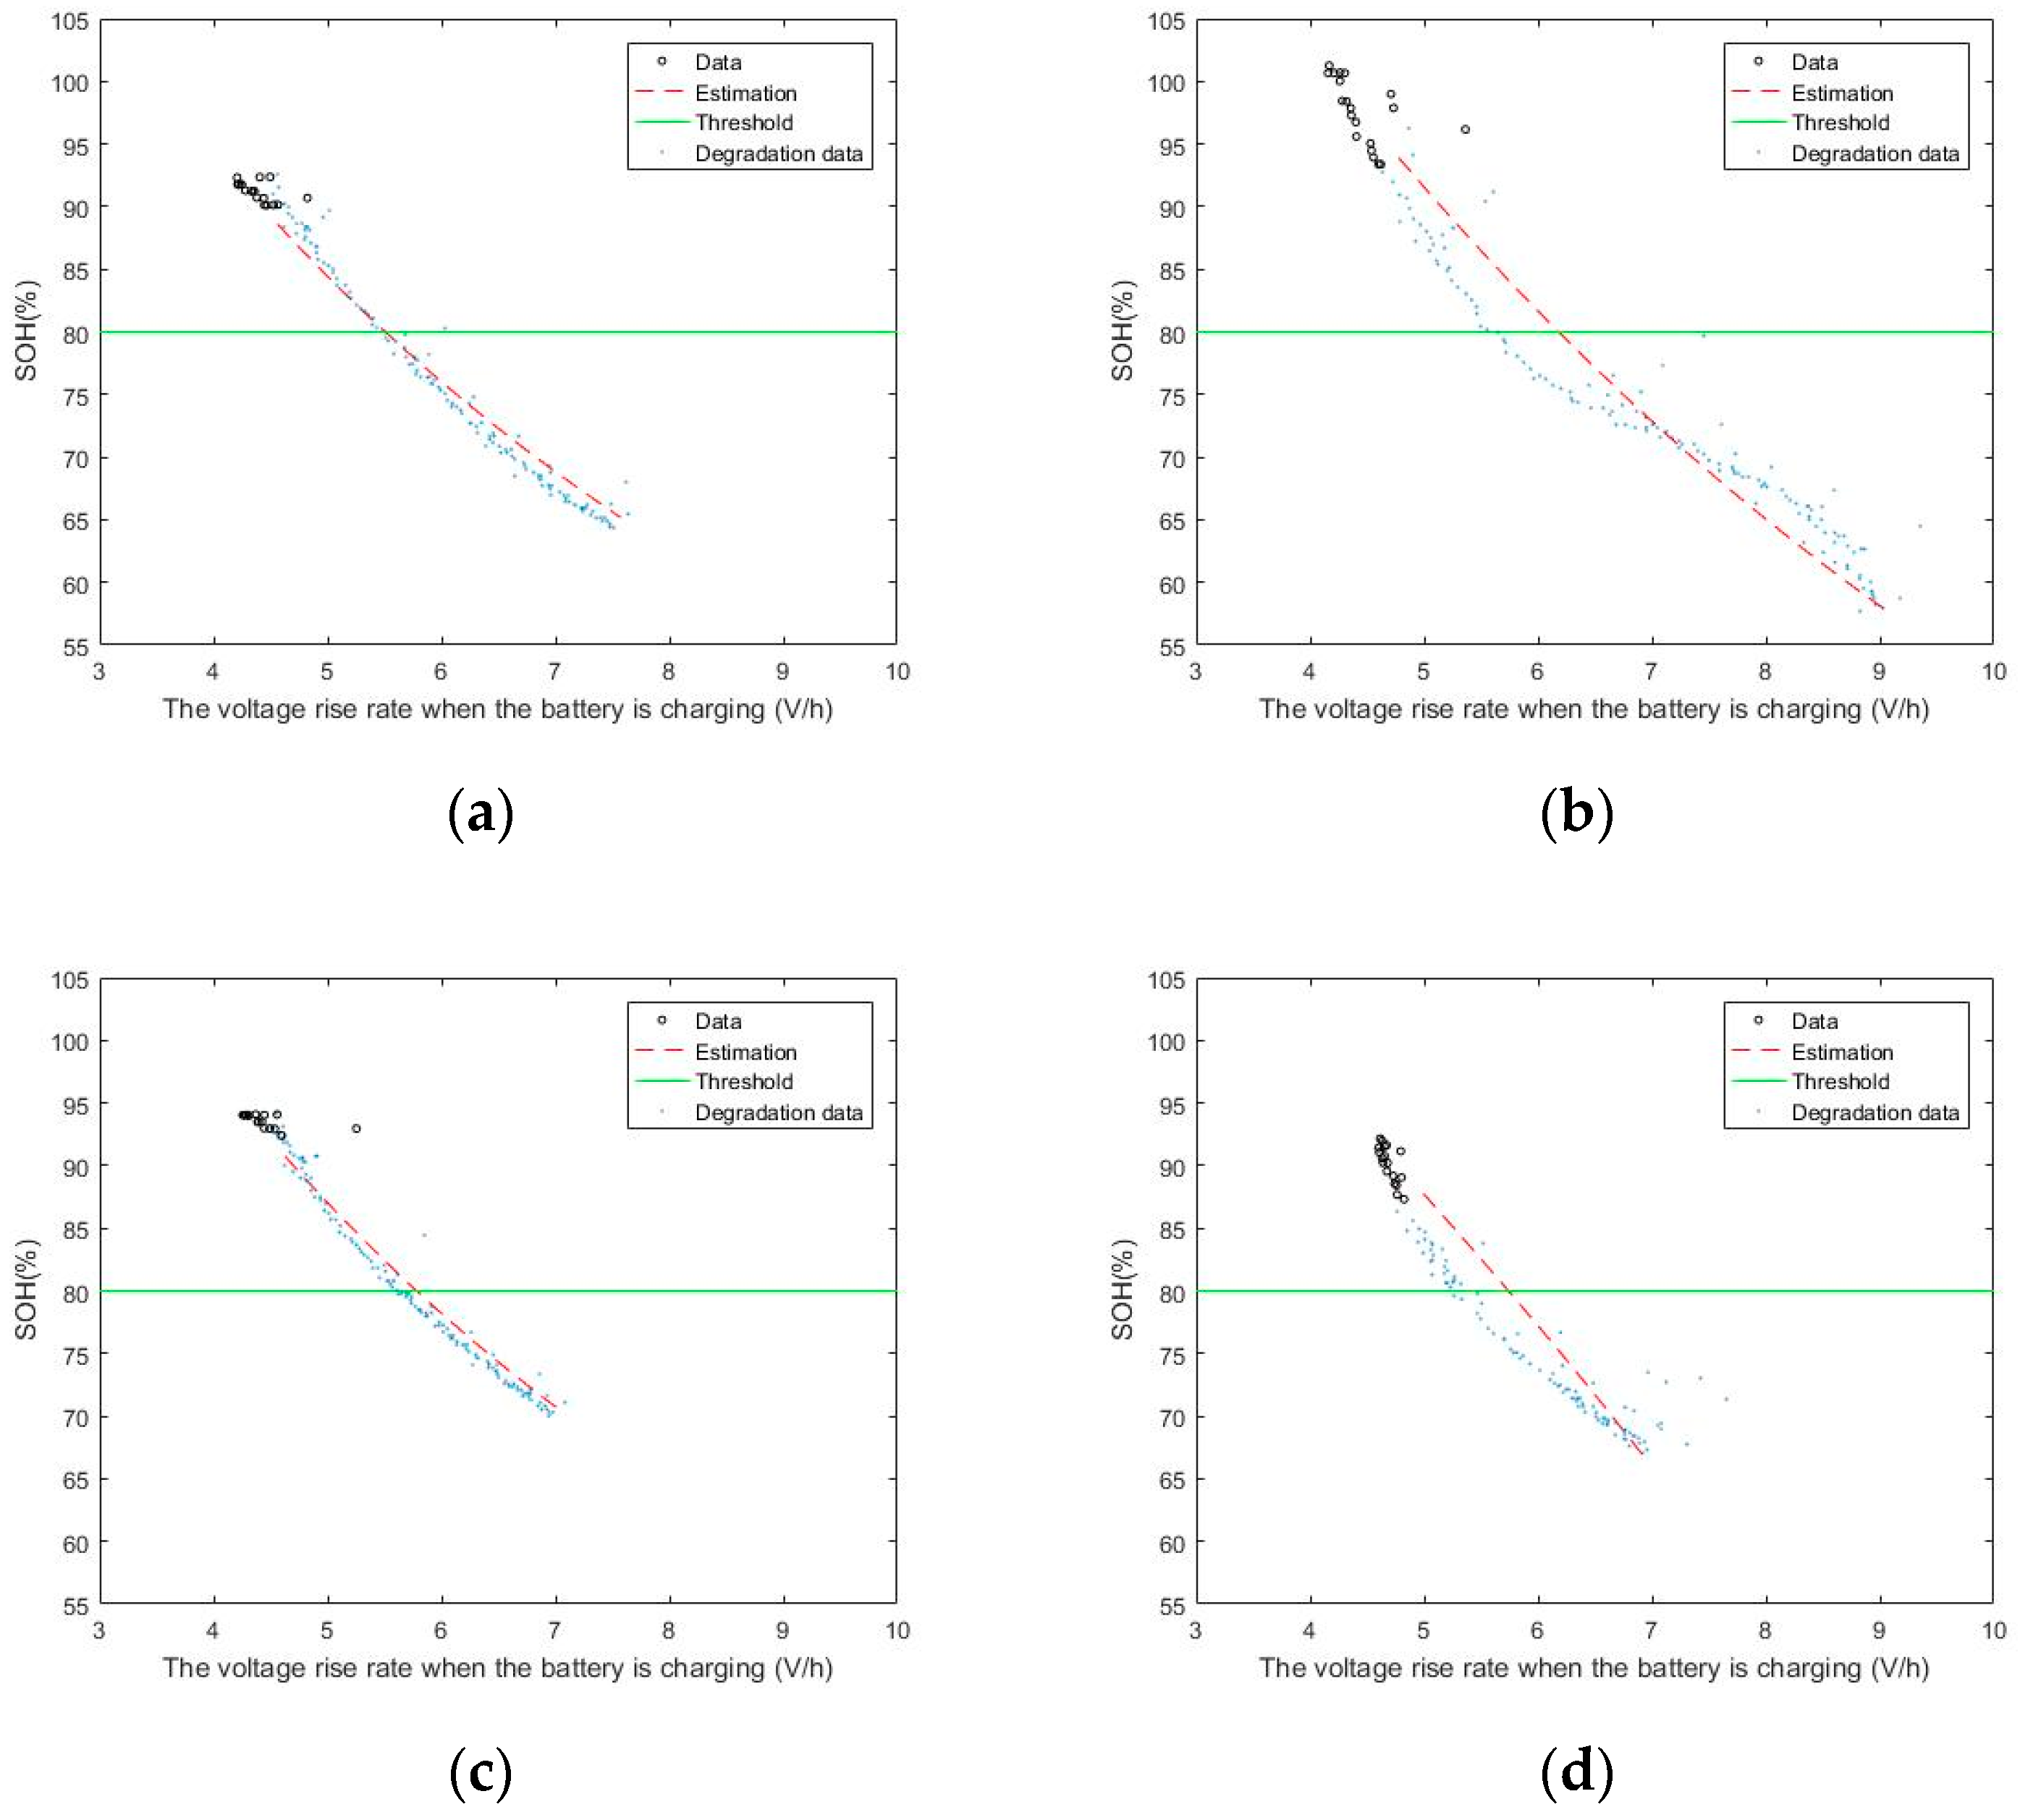
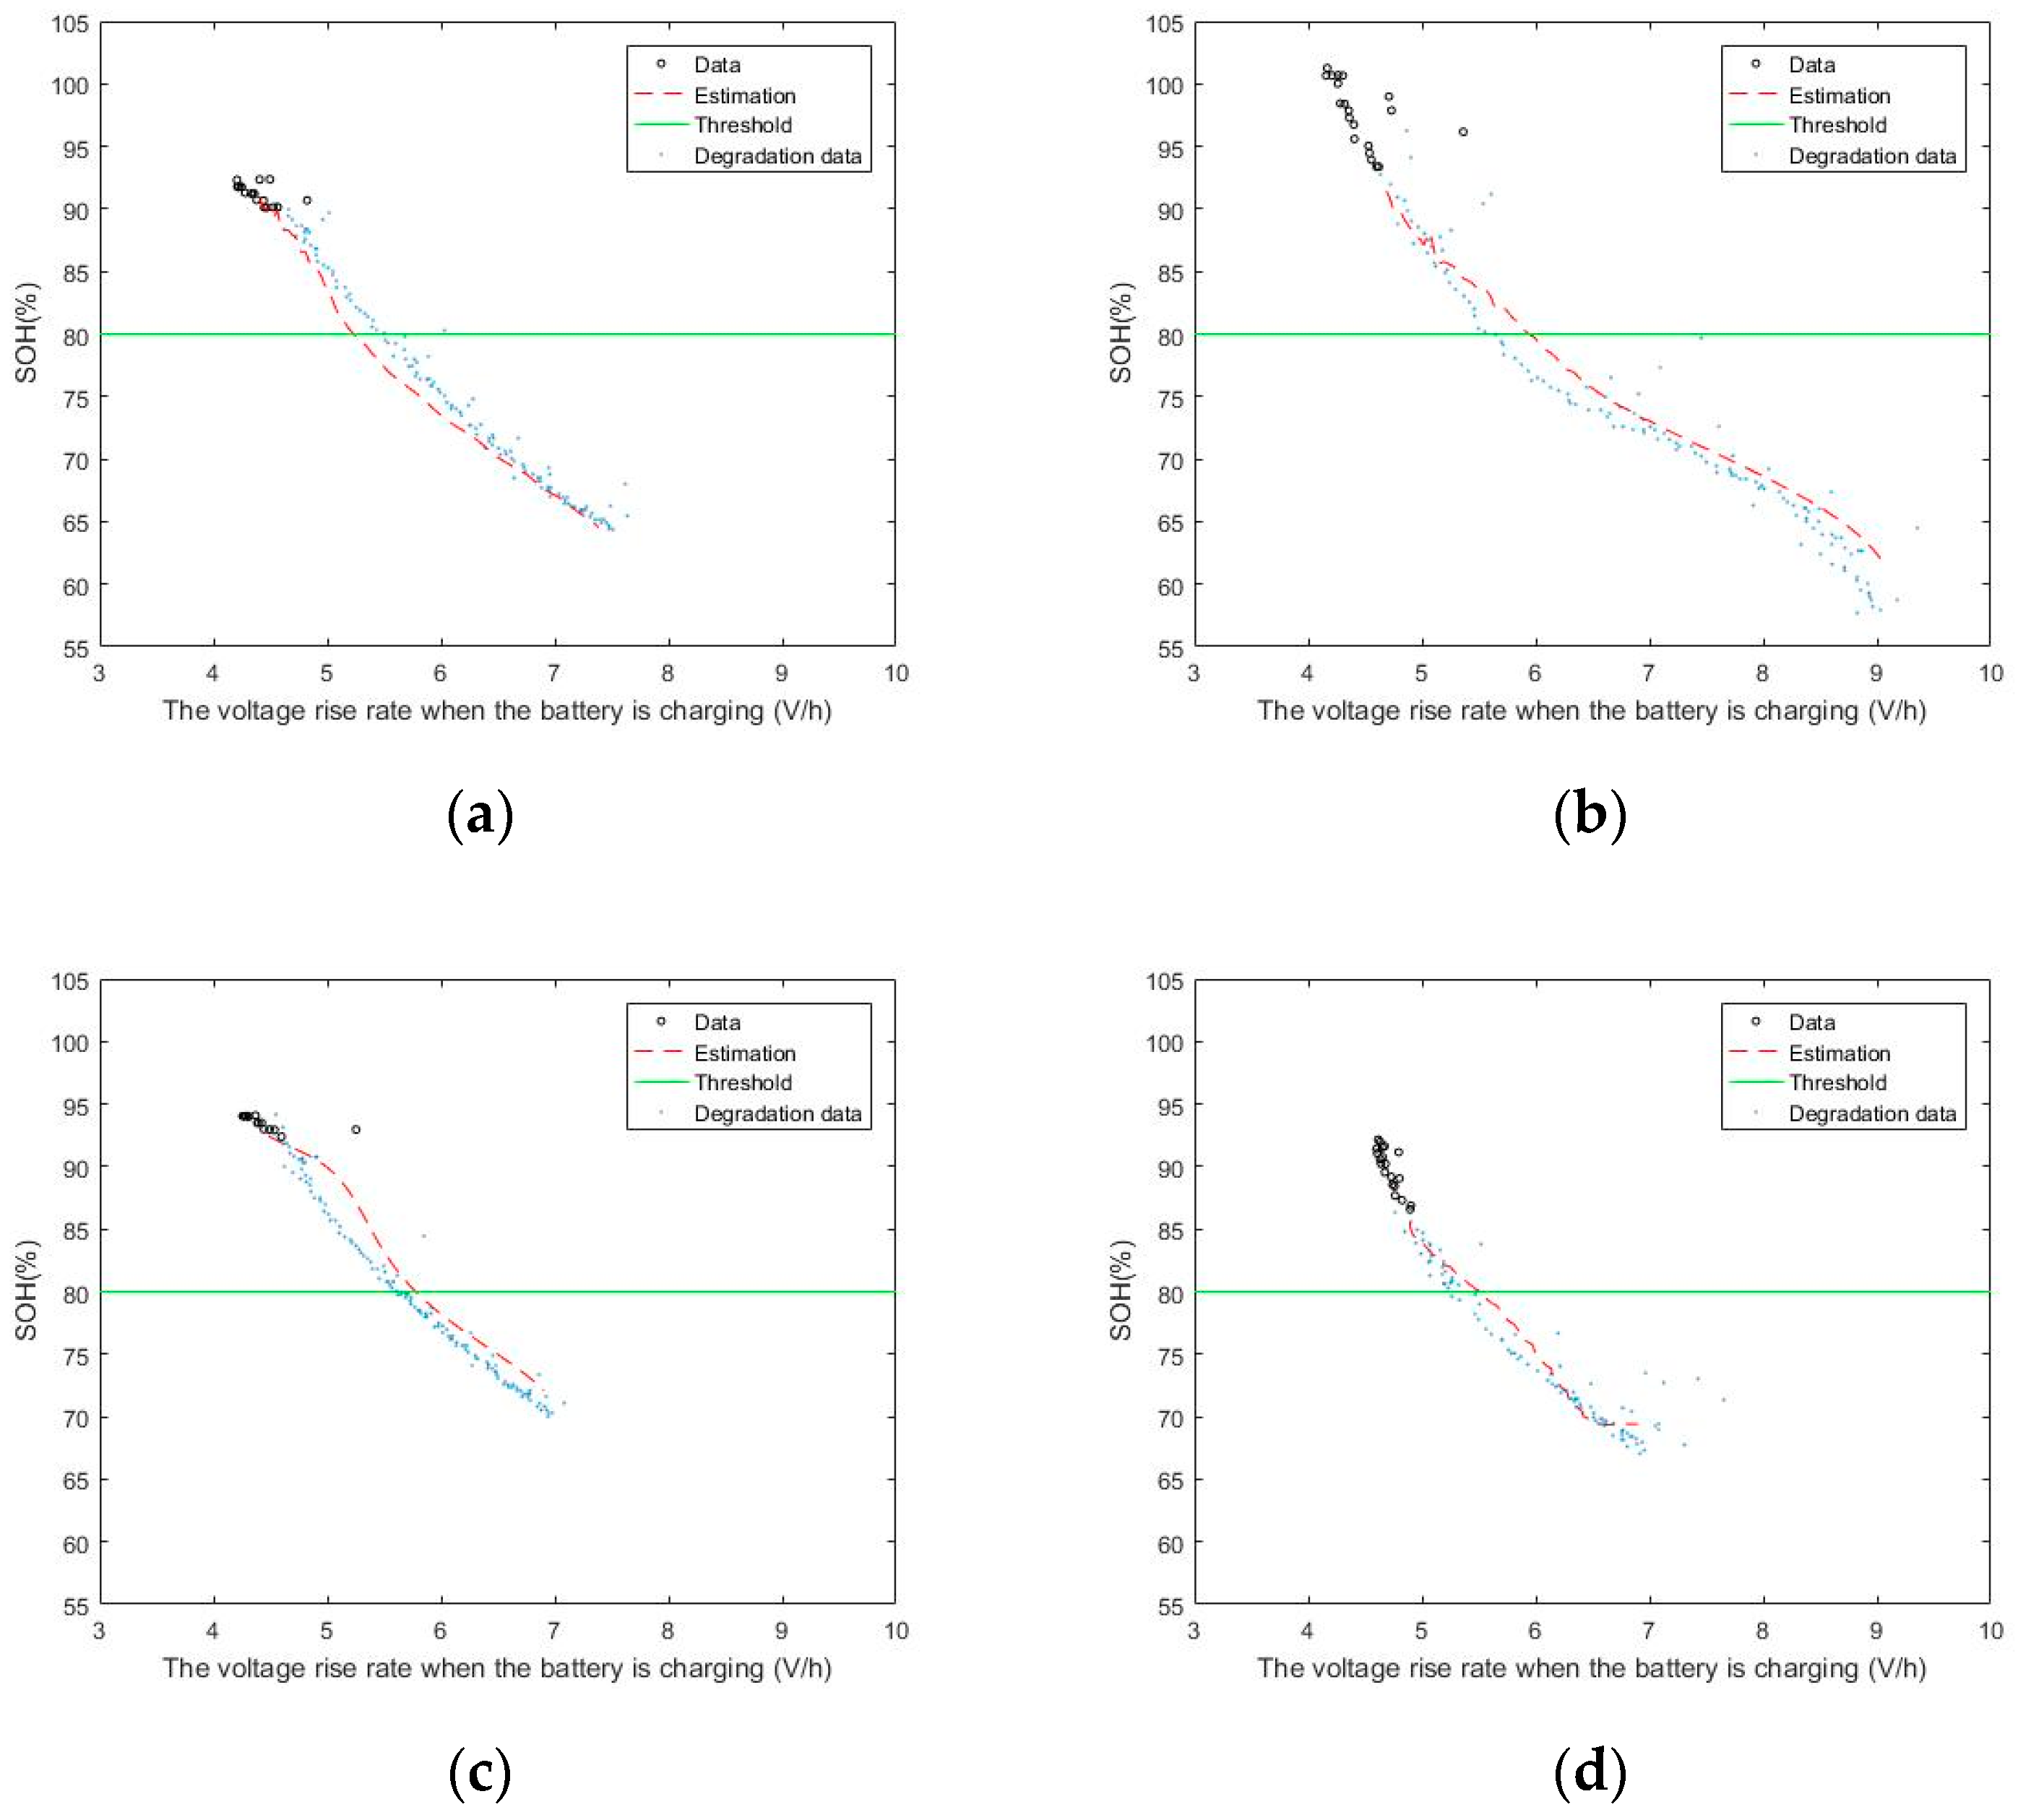
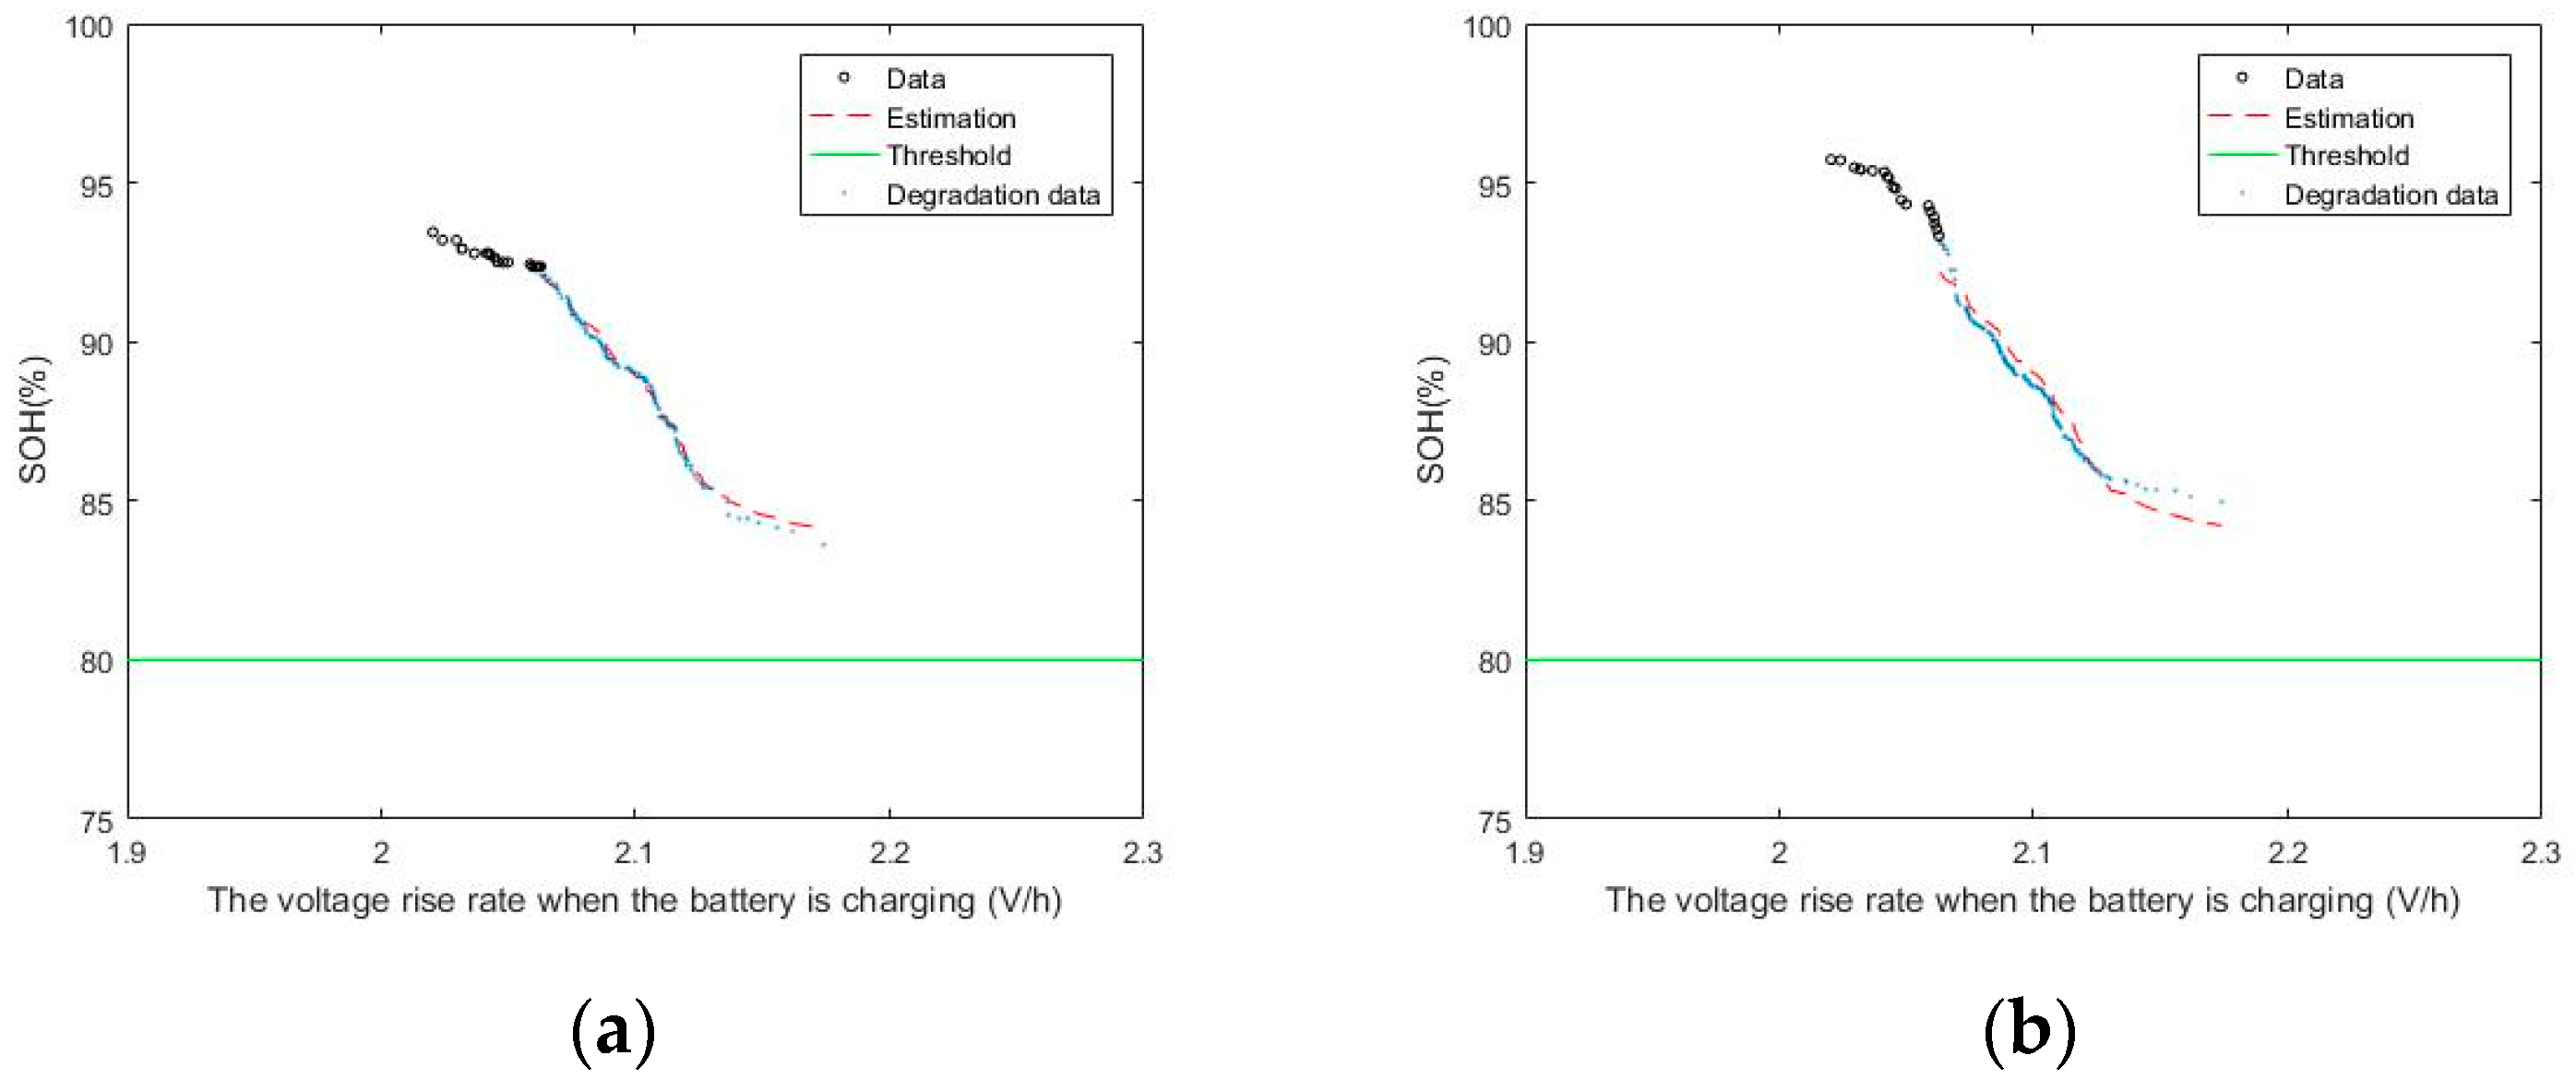
The prediction results for batteries 5, 6, 7, and 18 obtained by the LSTM using feature 3 are shown in 
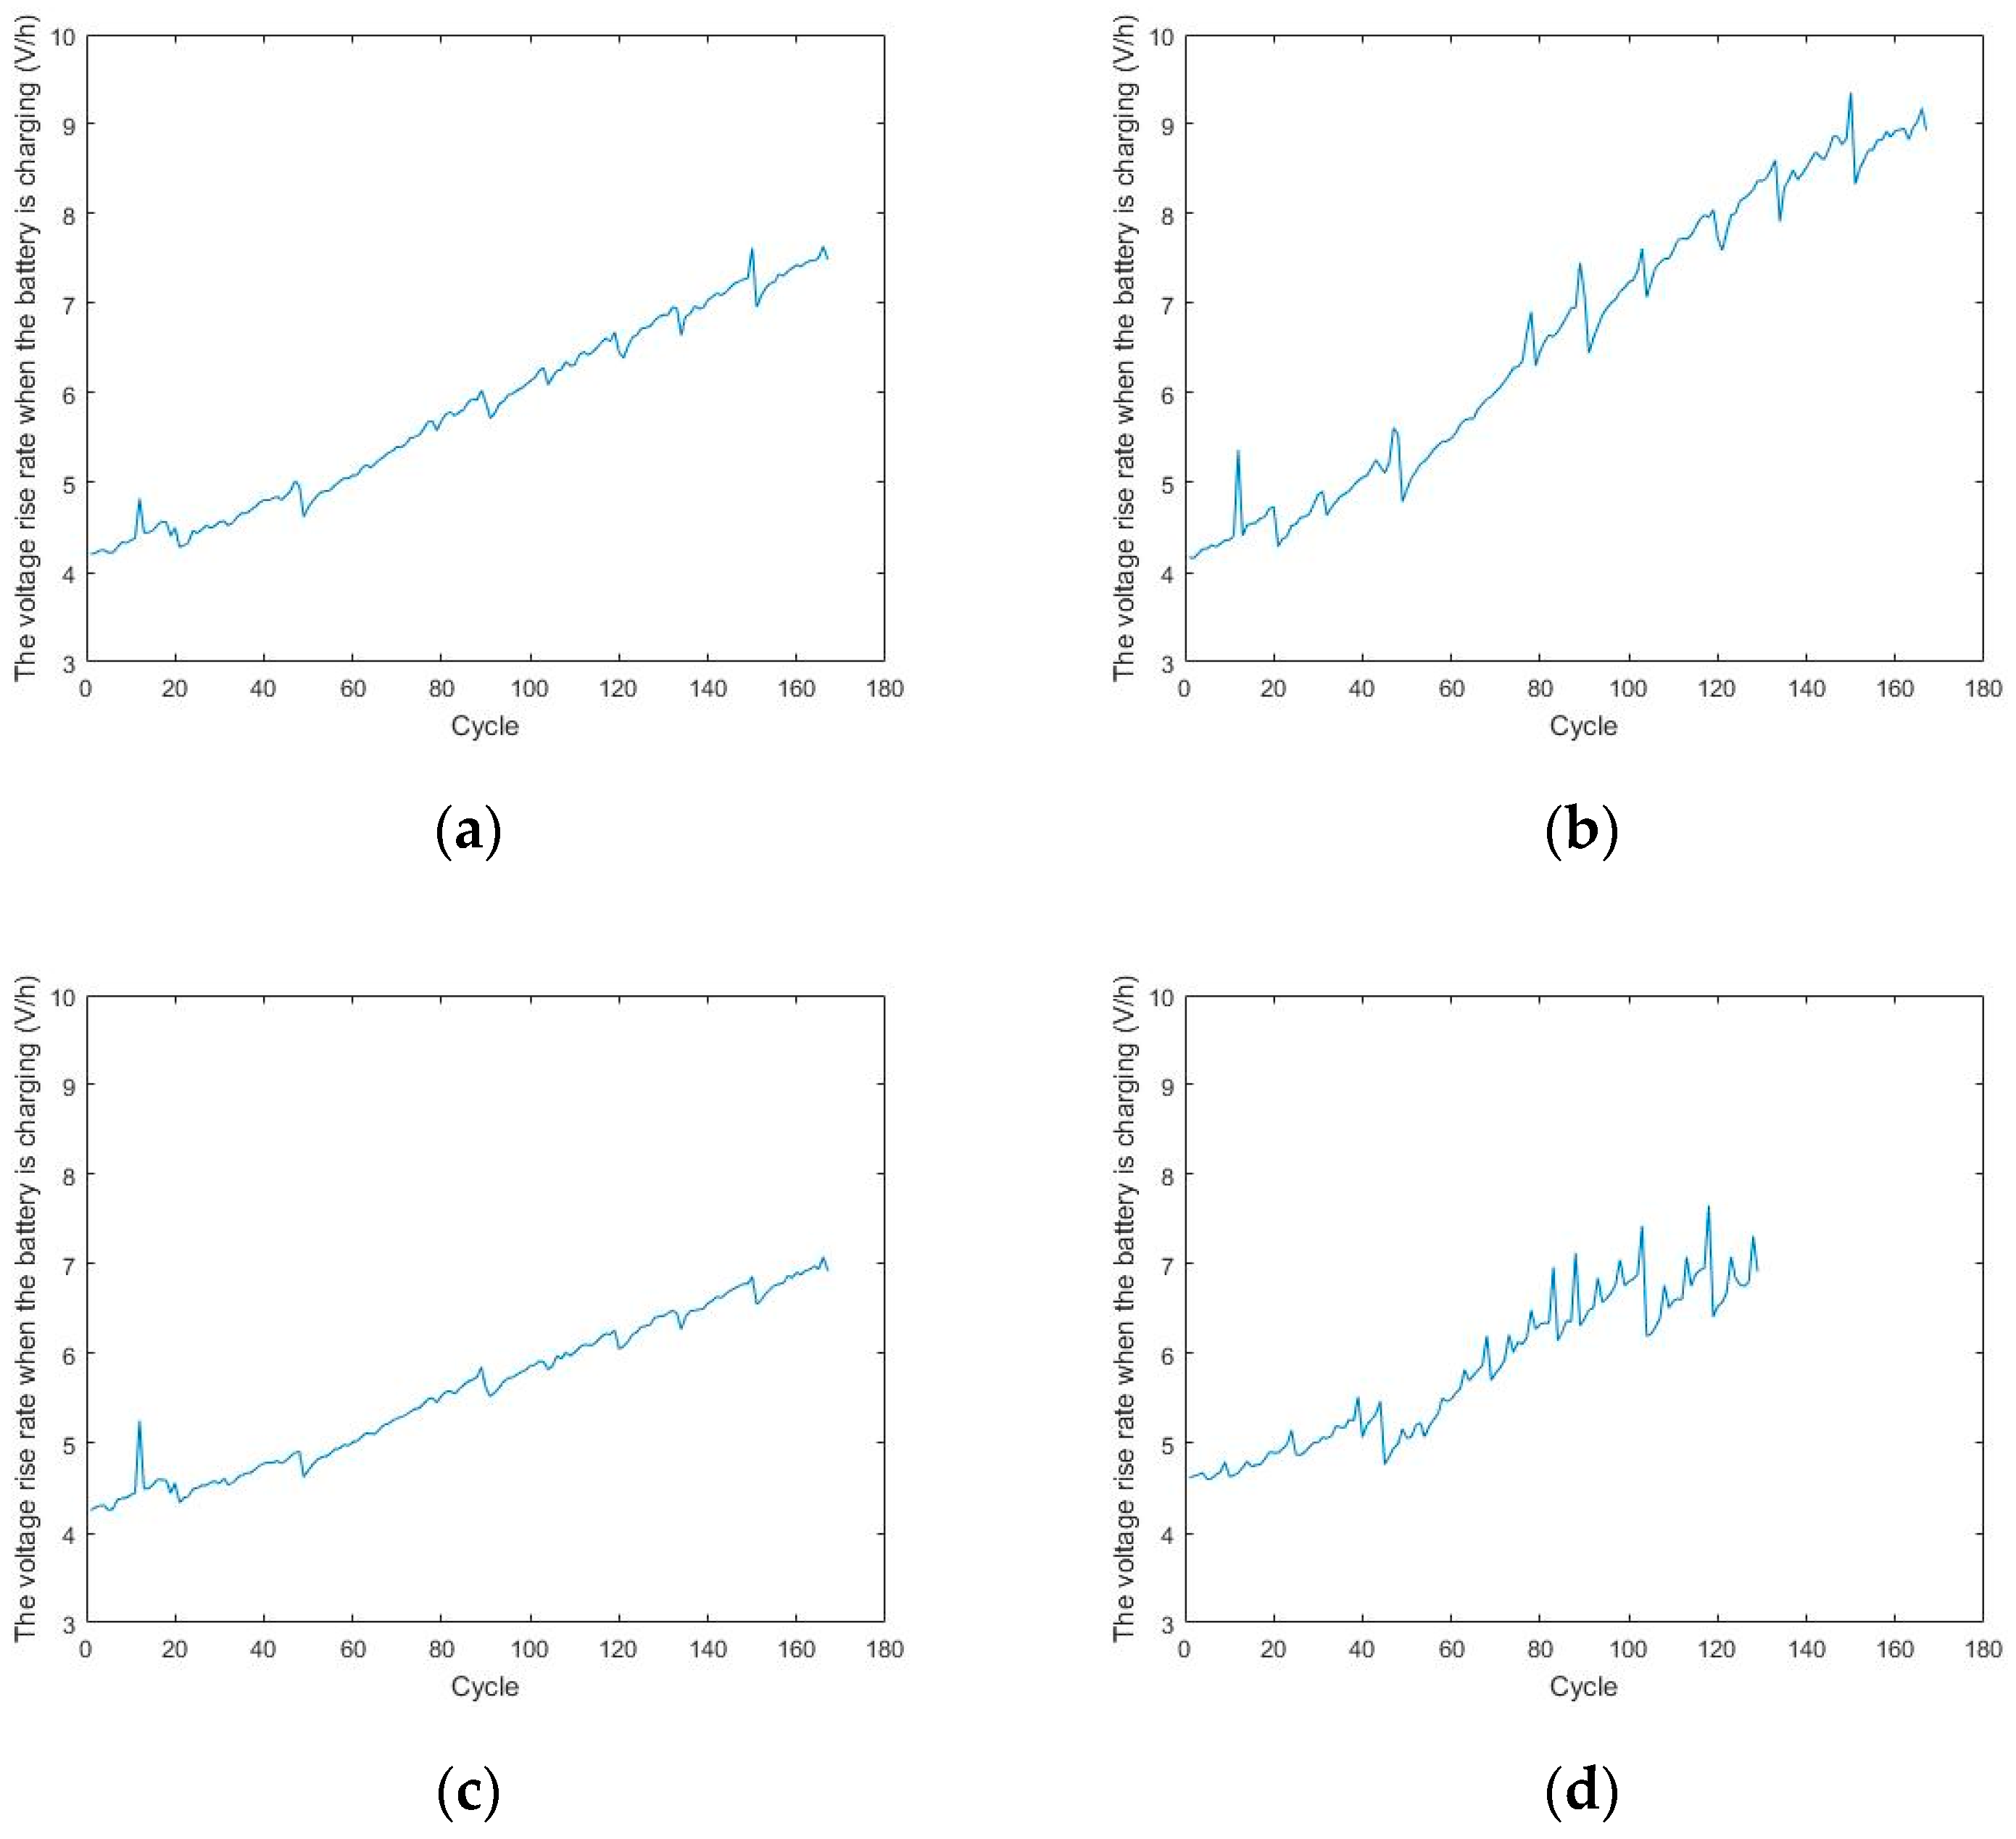
Figure 10. The extracted feature 3 is the voltage increase rate when the battery is charging.
The prediction results for batteries 5, 6, 7, and 18 obtained by the TCN using feature 1 are shown in Figure 11.
Figure 12 shows the predicted results of TCN for NASA 5, 6, 7, and 18 batteries using Feature 2.
The prediction results for batteries 5, 6, 7, and 18 obtained by the TCN using feature 3 are shown in Figure 13.
Table 2 lists the prediction results for different algorithms for each battery at 80% SOH using features 1, 2, and 3 by comparing LSTM, TCN, and real data to the threshold, respectively, to obtain the prediction performance. The closer the predicted result, the better the algorithm performance. It can be observed that the results predicted using the TCN algorithm are better than those using the LSTM algorithm.
To better demonstrate the accuracy of the prediction results, the relative error was used to calculate the SOH error values predicted by the LSTM and TCN with features 1, 2, and 3. The maximum relative errors of the features are shown in Table 3.
The relative errors of the TCN are smaller than that of the LSTM when using features 1 and 3. When feature 2 is used to estimate the SOH of the battery, the relative error using TCN is larger than that using LSTM by approximately 1.29%. Overall, the TCN is more accurate than the LSTM in predicting the battery SOH based on charge–discharge characteristics.

5. Experiment Based Verification

To verify whether the conclusions drawn from NASA’s experimental data were correct, we established a battery-accelerated aging test system in the laboratory. In the developed test system, the voltage, current, temperature, and internal resistance of the battery cell during the charging and discharging processes are obtained by setting the parameters of the accelerated aging test. This section verifies the feasibility of estimating the battery SOH with charging and discharging characteristics using the experimentally obtained dataset.

5.1. Experimental Design of the Structure and Control Logic

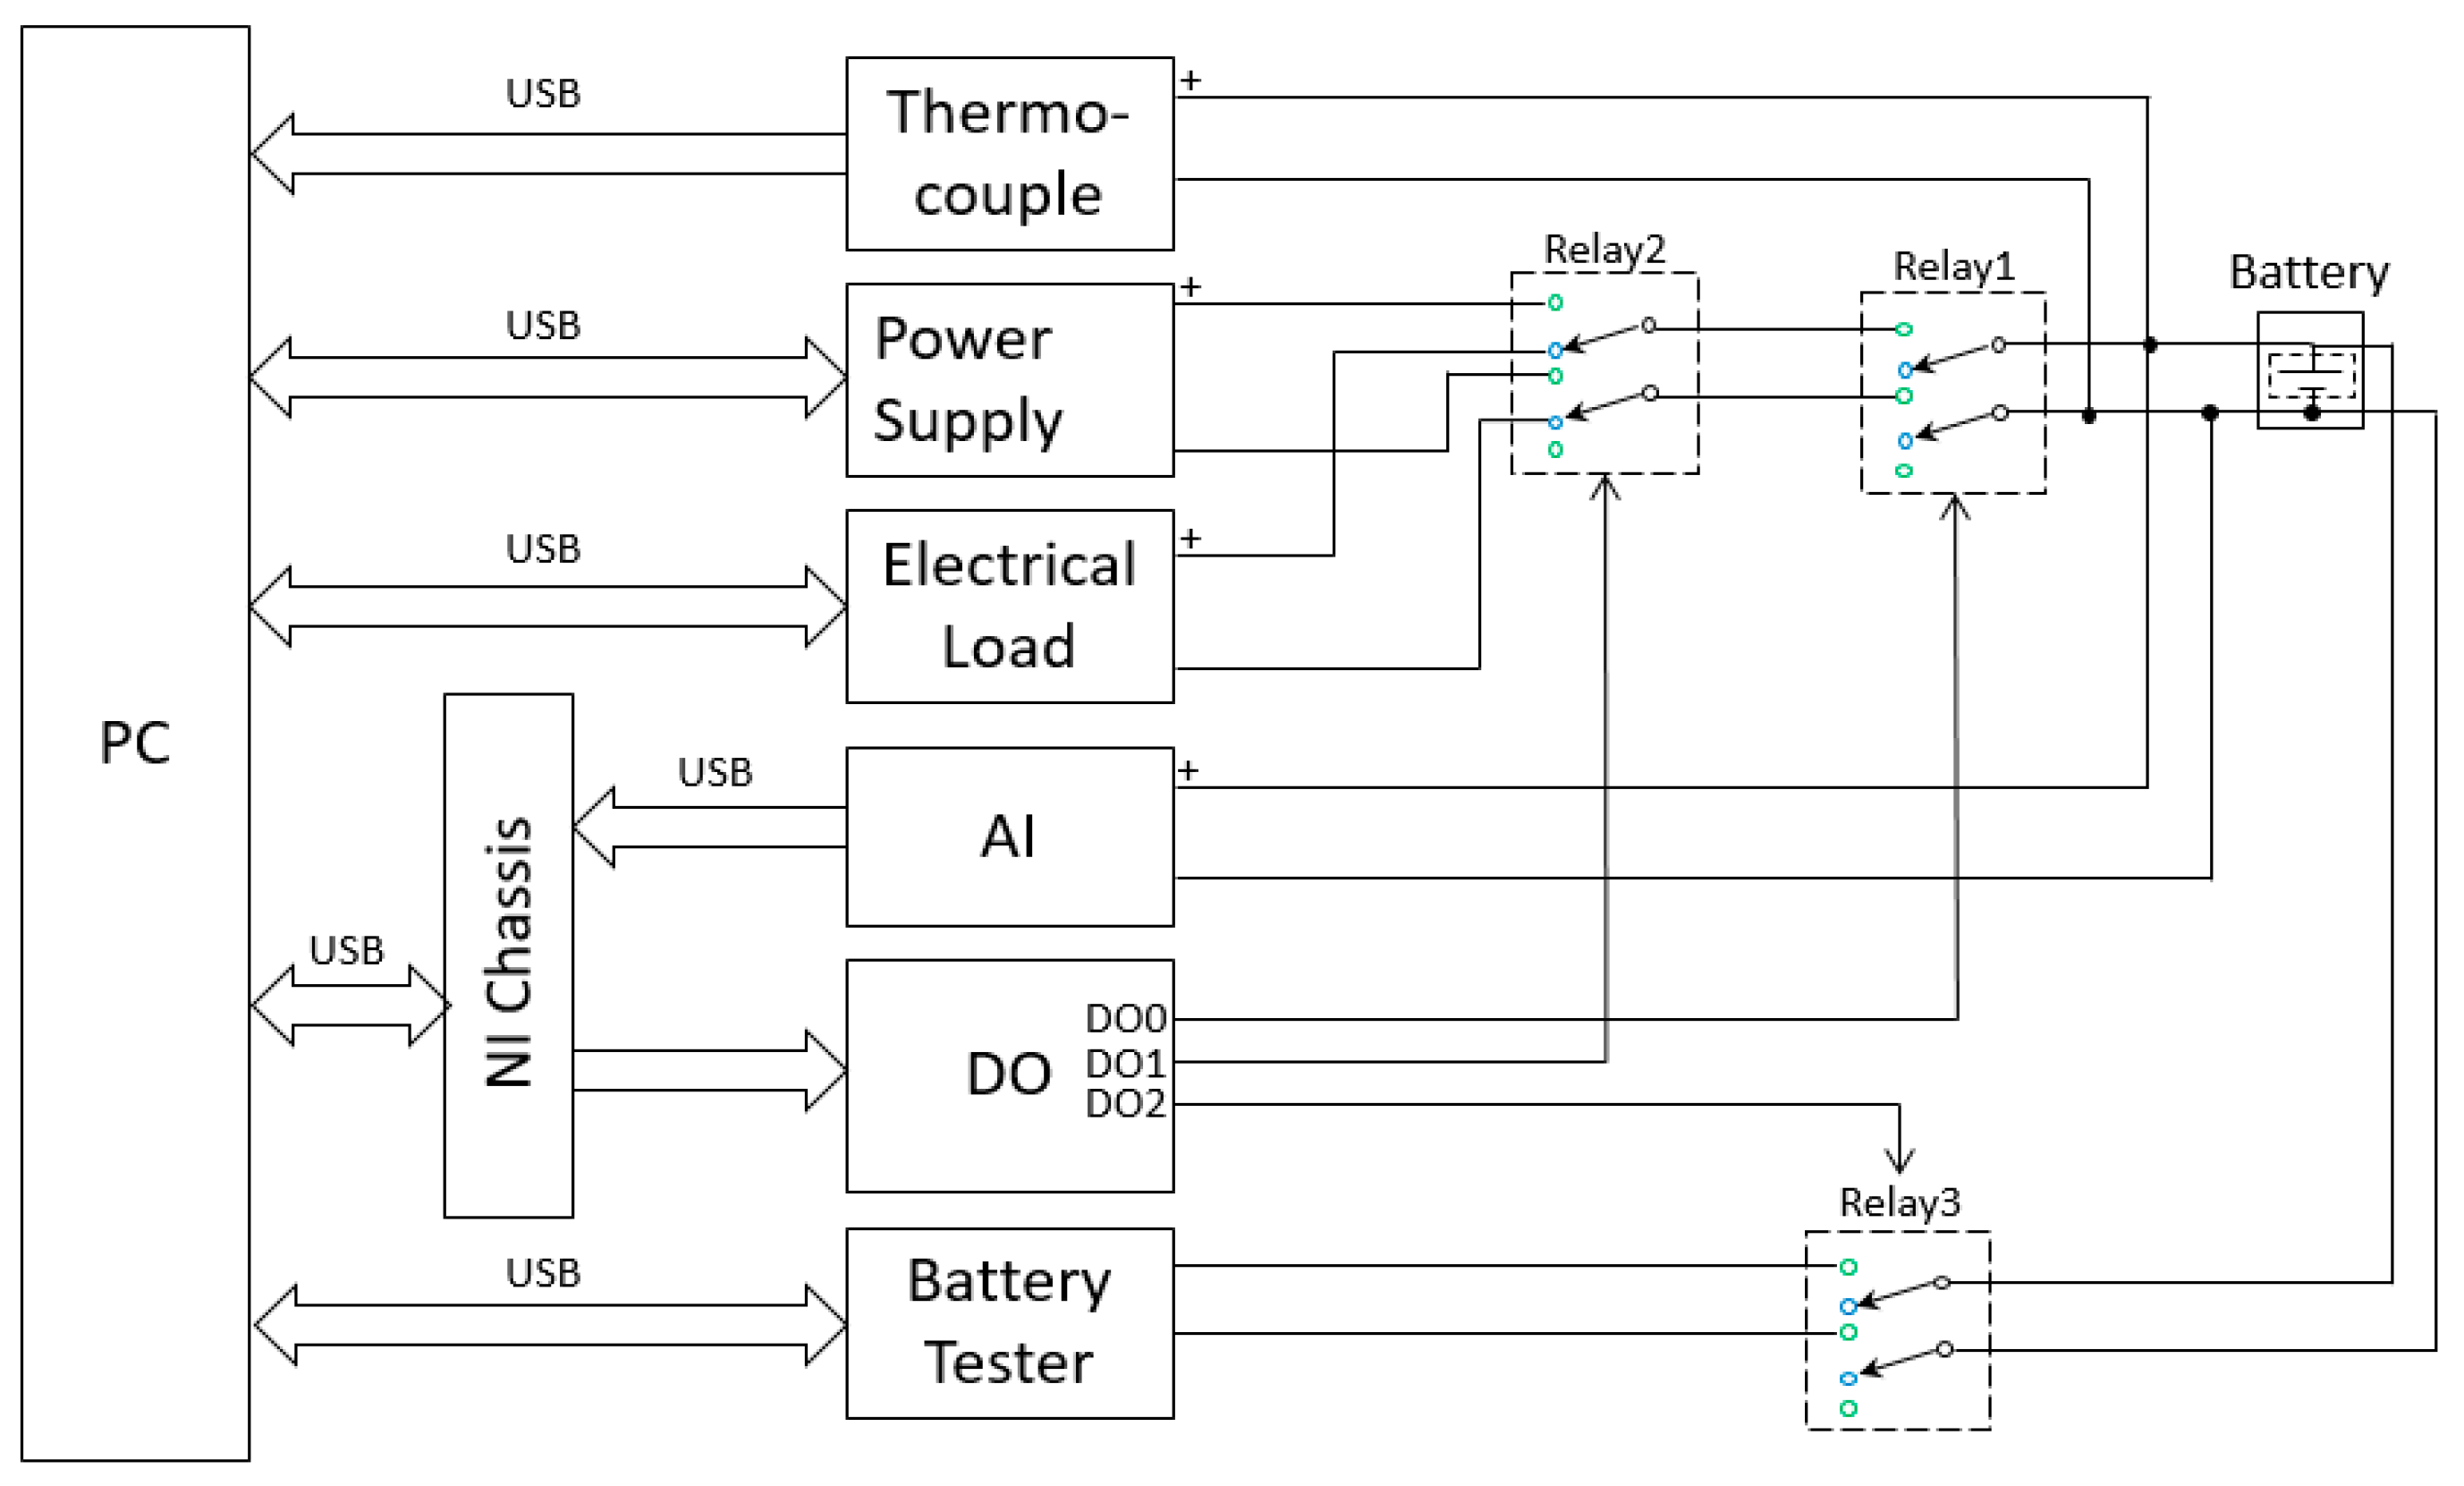
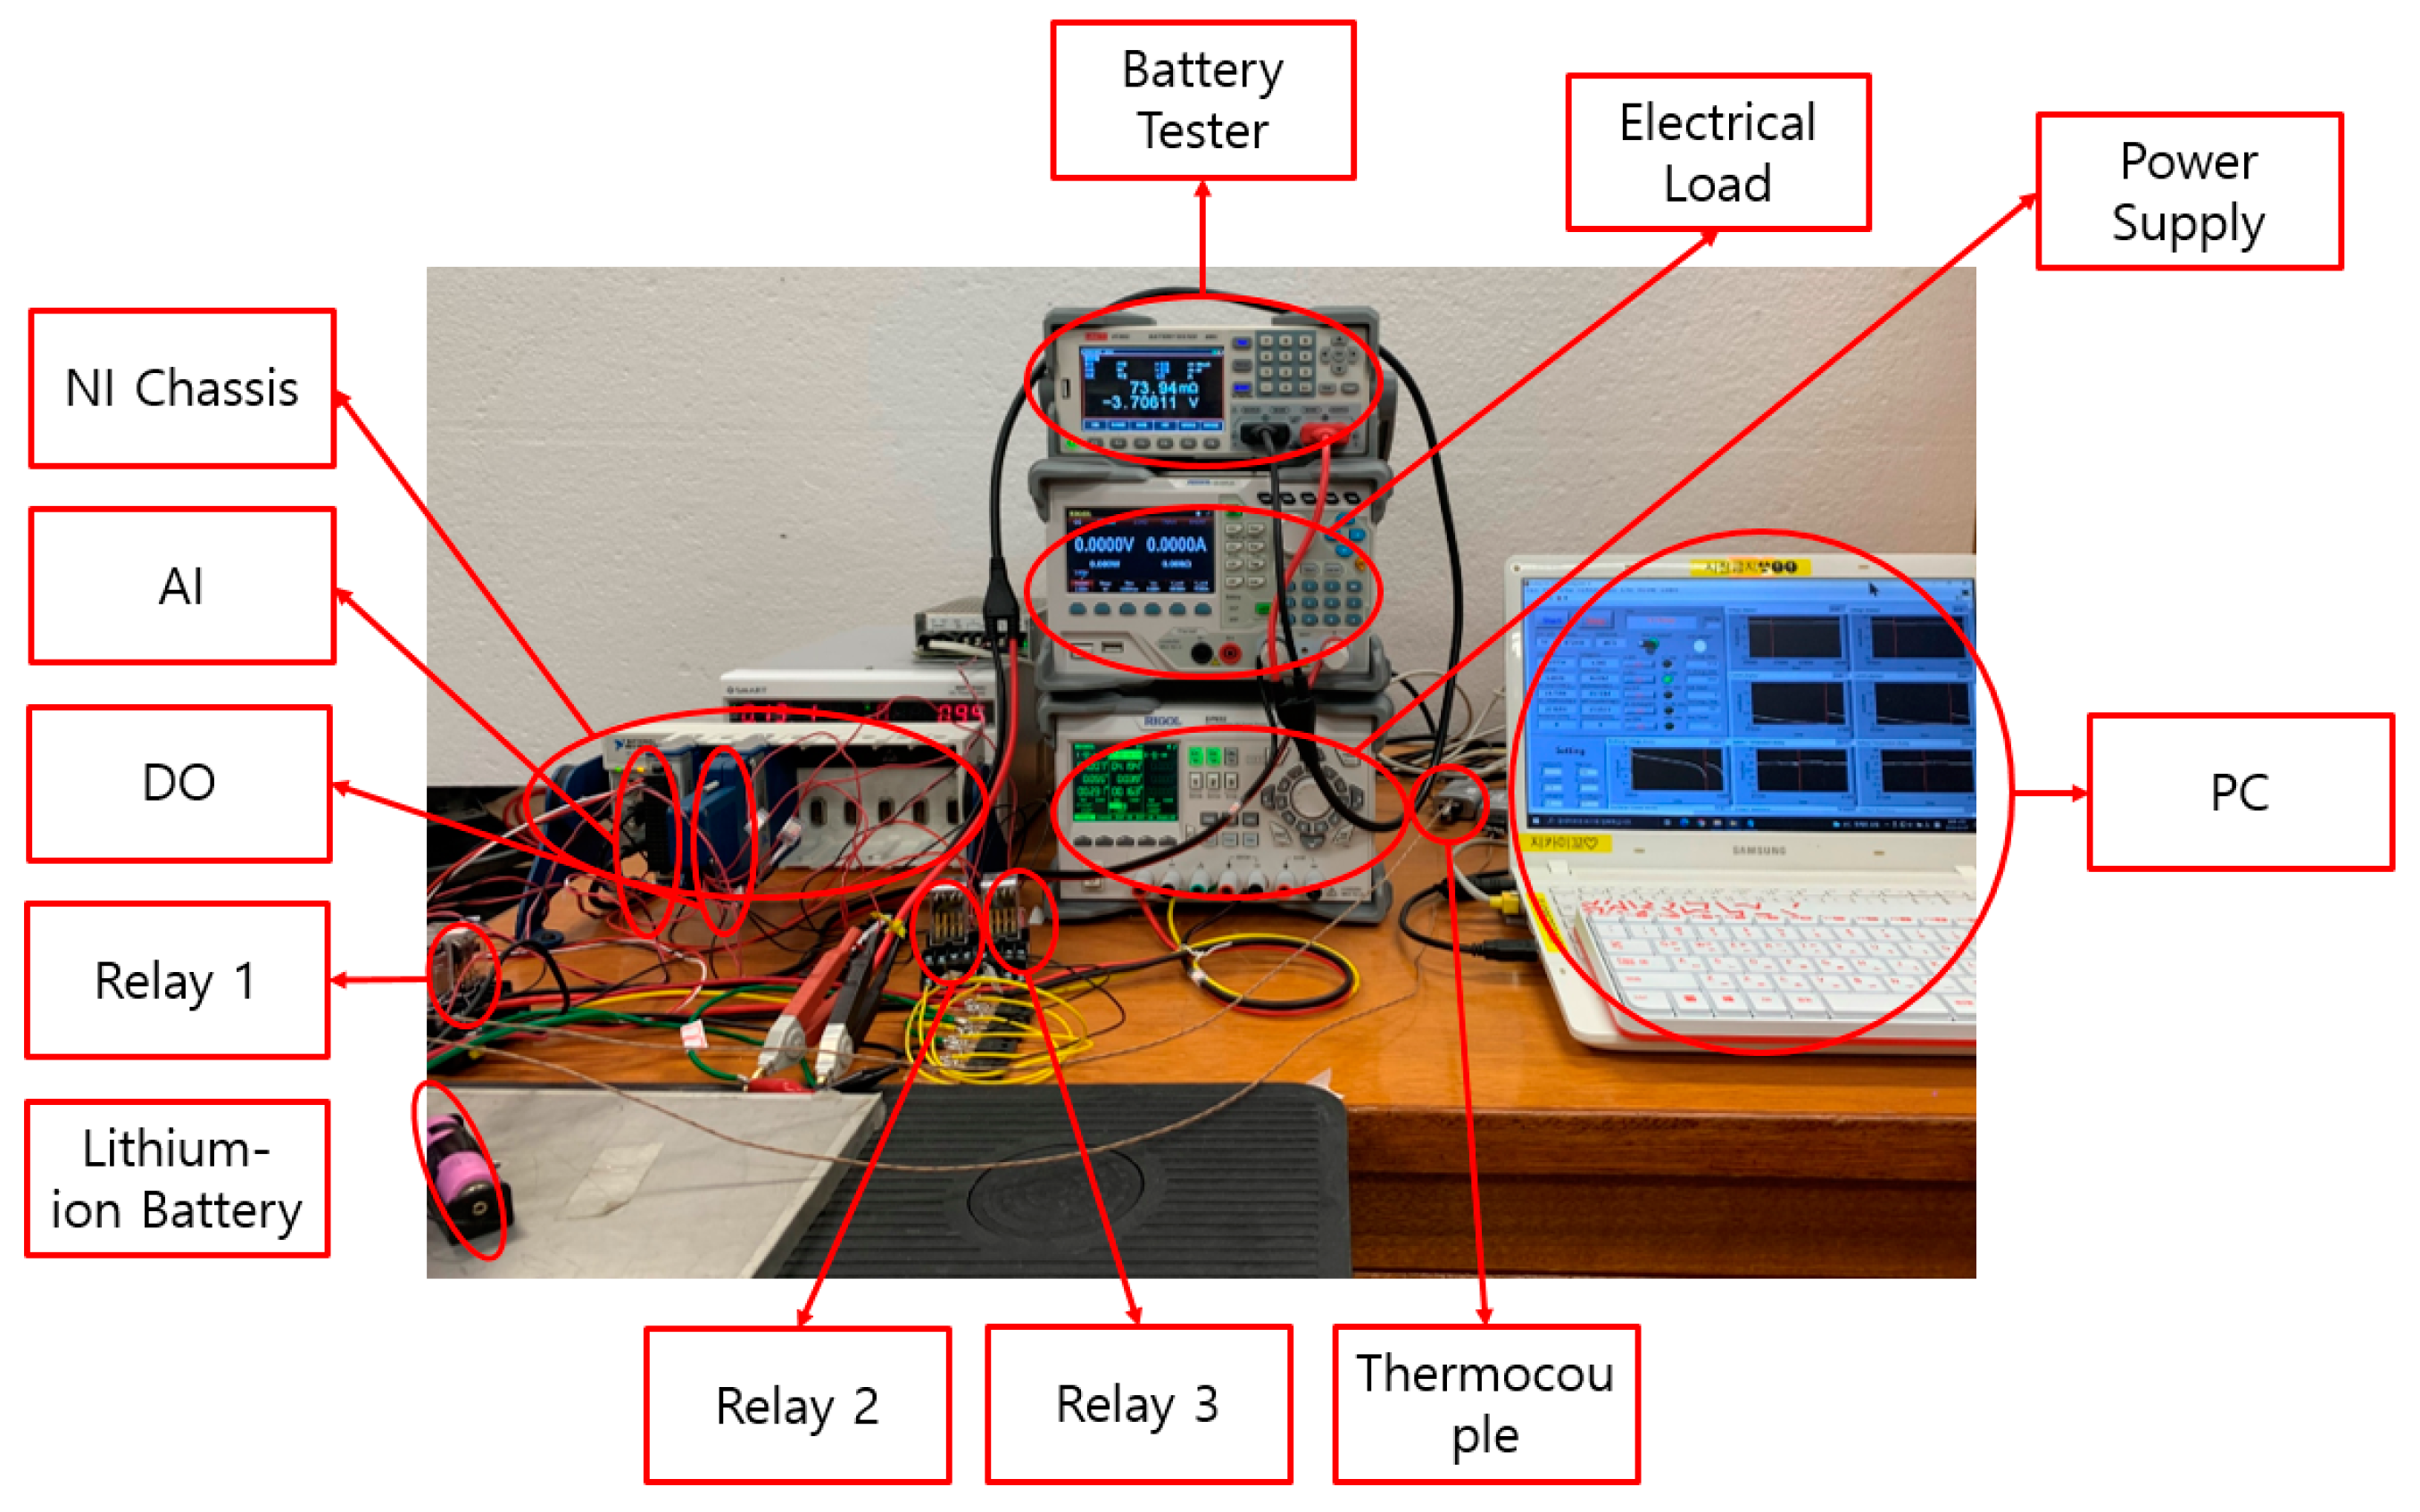
The experimental device use in the battery-accelerated aging test consists of a programmable DC power supply (PPS) that can charge the battery at constant current and voltage, a programmable electronic load (PEL) for constant current discharge, a battery tester (BT) that is used to measure the battery internal resistance, an NI chassis equipped with an analog input (AI) that measures the battery’s voltage and a digital output (DO) that can control the relay separately, a thermocouple that can measure the battery temperature, three relays, and a control PC [45]. The battery-accelerated aging test system is shown in Figure 14. Table 4 lists the functions and typical specifications of this battery-accelerated aging test system.
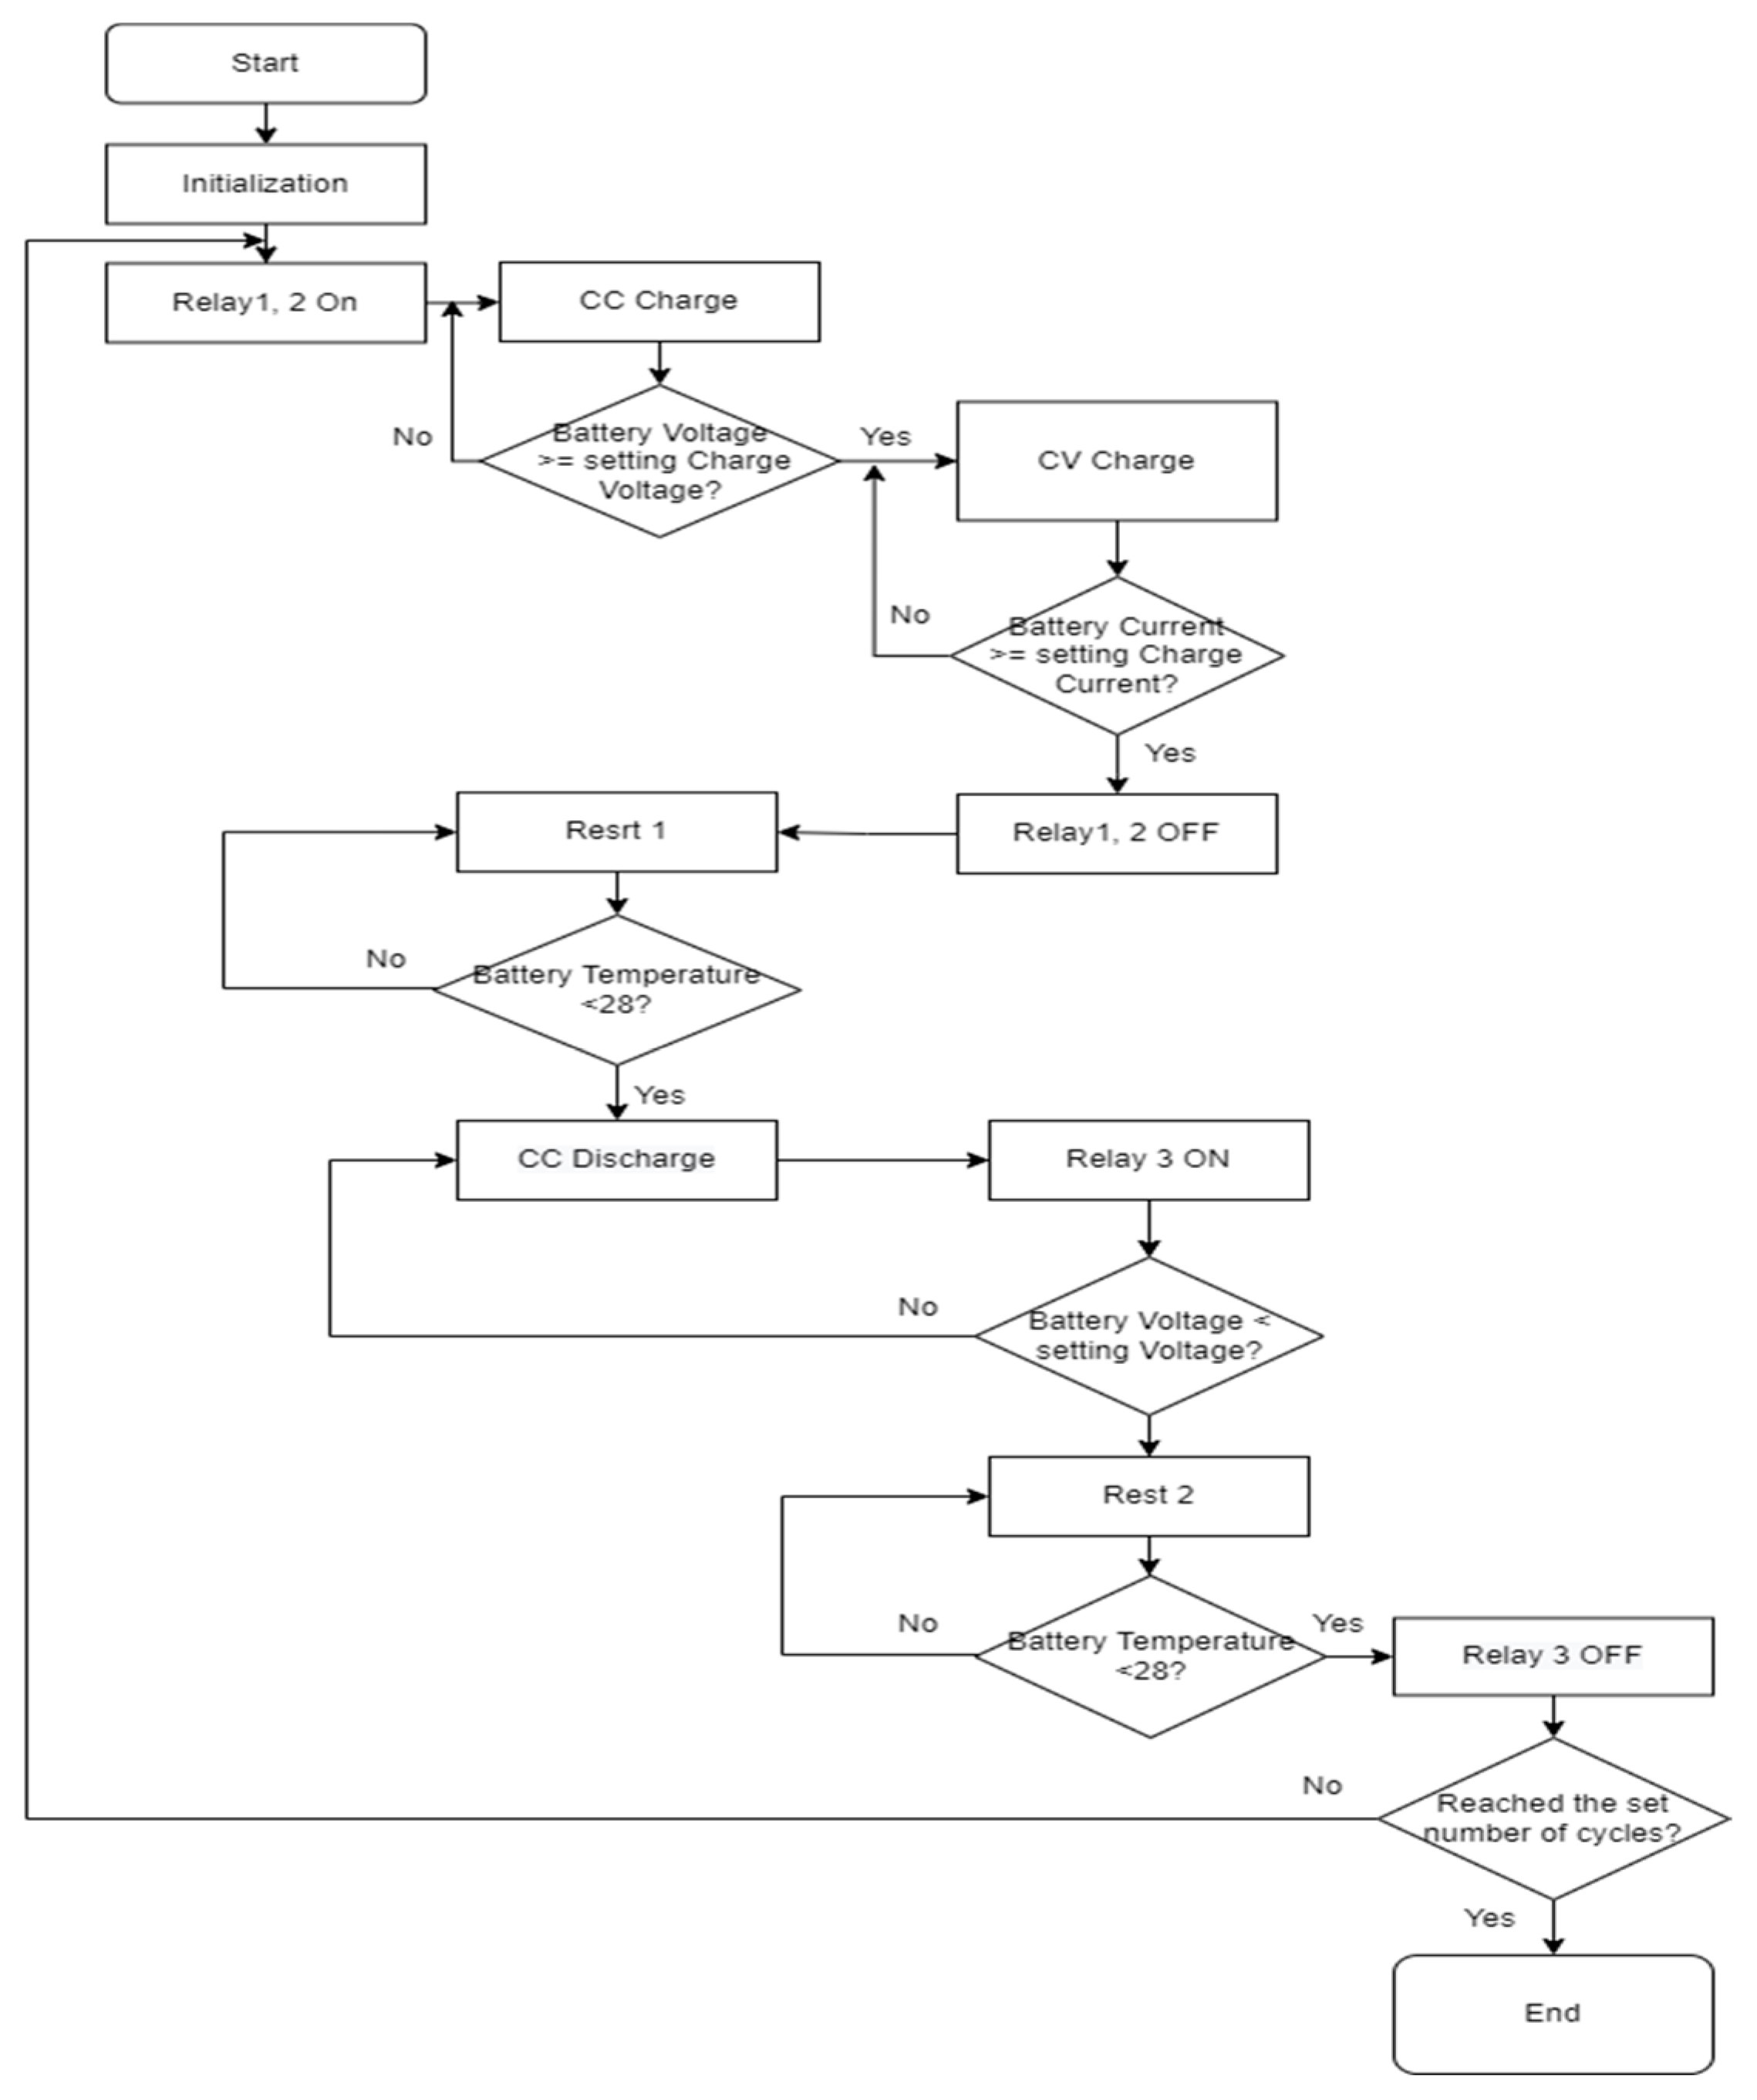
The experimental procedure is explained as follows. At the beginning of the experiment, relays 1 and 2 are turned on simultaneously and the battery is connected to the power supply to start charging. In the charging state, constant-current charging is first used; when the charging voltage reaches the set constant-current charging cut-off voltage, the constant-current charging state is converted into the constant-voltage charging state. When the charging current decreases to the set constant-voltage charging cut-off current, relays 1 and 2 are turned off and the battery experiment enters the set rest state. This ensures that the battery temperature drops to 28 °C in the resting state. The functional schematic of the experiment is shown in Figure 15.
After satisfying the conditions set by the rest state, only relay 1 is turned on and the state is transformed into the constant-current discharging state. The internal resistance of the battery is measured while discharging. In the discharging mode, when the voltage of the battery drops to the set discharging cut-off voltage, relay 1 is turned off again and the state is transformed to the rest state after discharge. The rest mode after discharging is the same as the rest mode after charging, which ensures that the temperature of the battery drops to 28 °C. Finally, after completing the set conditions for rest after the discharge, if the set number of cycles is not satisfied, the accelerated charge–discharge aging test of the battery is repeated. The flowchart of the experiment is shown in Figure 16.

5.2. Experimental Data

The experiment used the same 18,650 battery as that used by NASA, but its capacity was 2.6 A. The experimental conditions for charging and discharging were similar to those used by NASA. The detailed charging conditions are listed in Table 5. First, a constant current was used to charge the battery until the voltage reached 4.2 V. Subsequently, the charging mode was switched to constant voltage charging until the charging current decreased to 0.1 A. The discharging mode used a constant current to discharge the battery until the battery voltage dropped to 2.7 V.
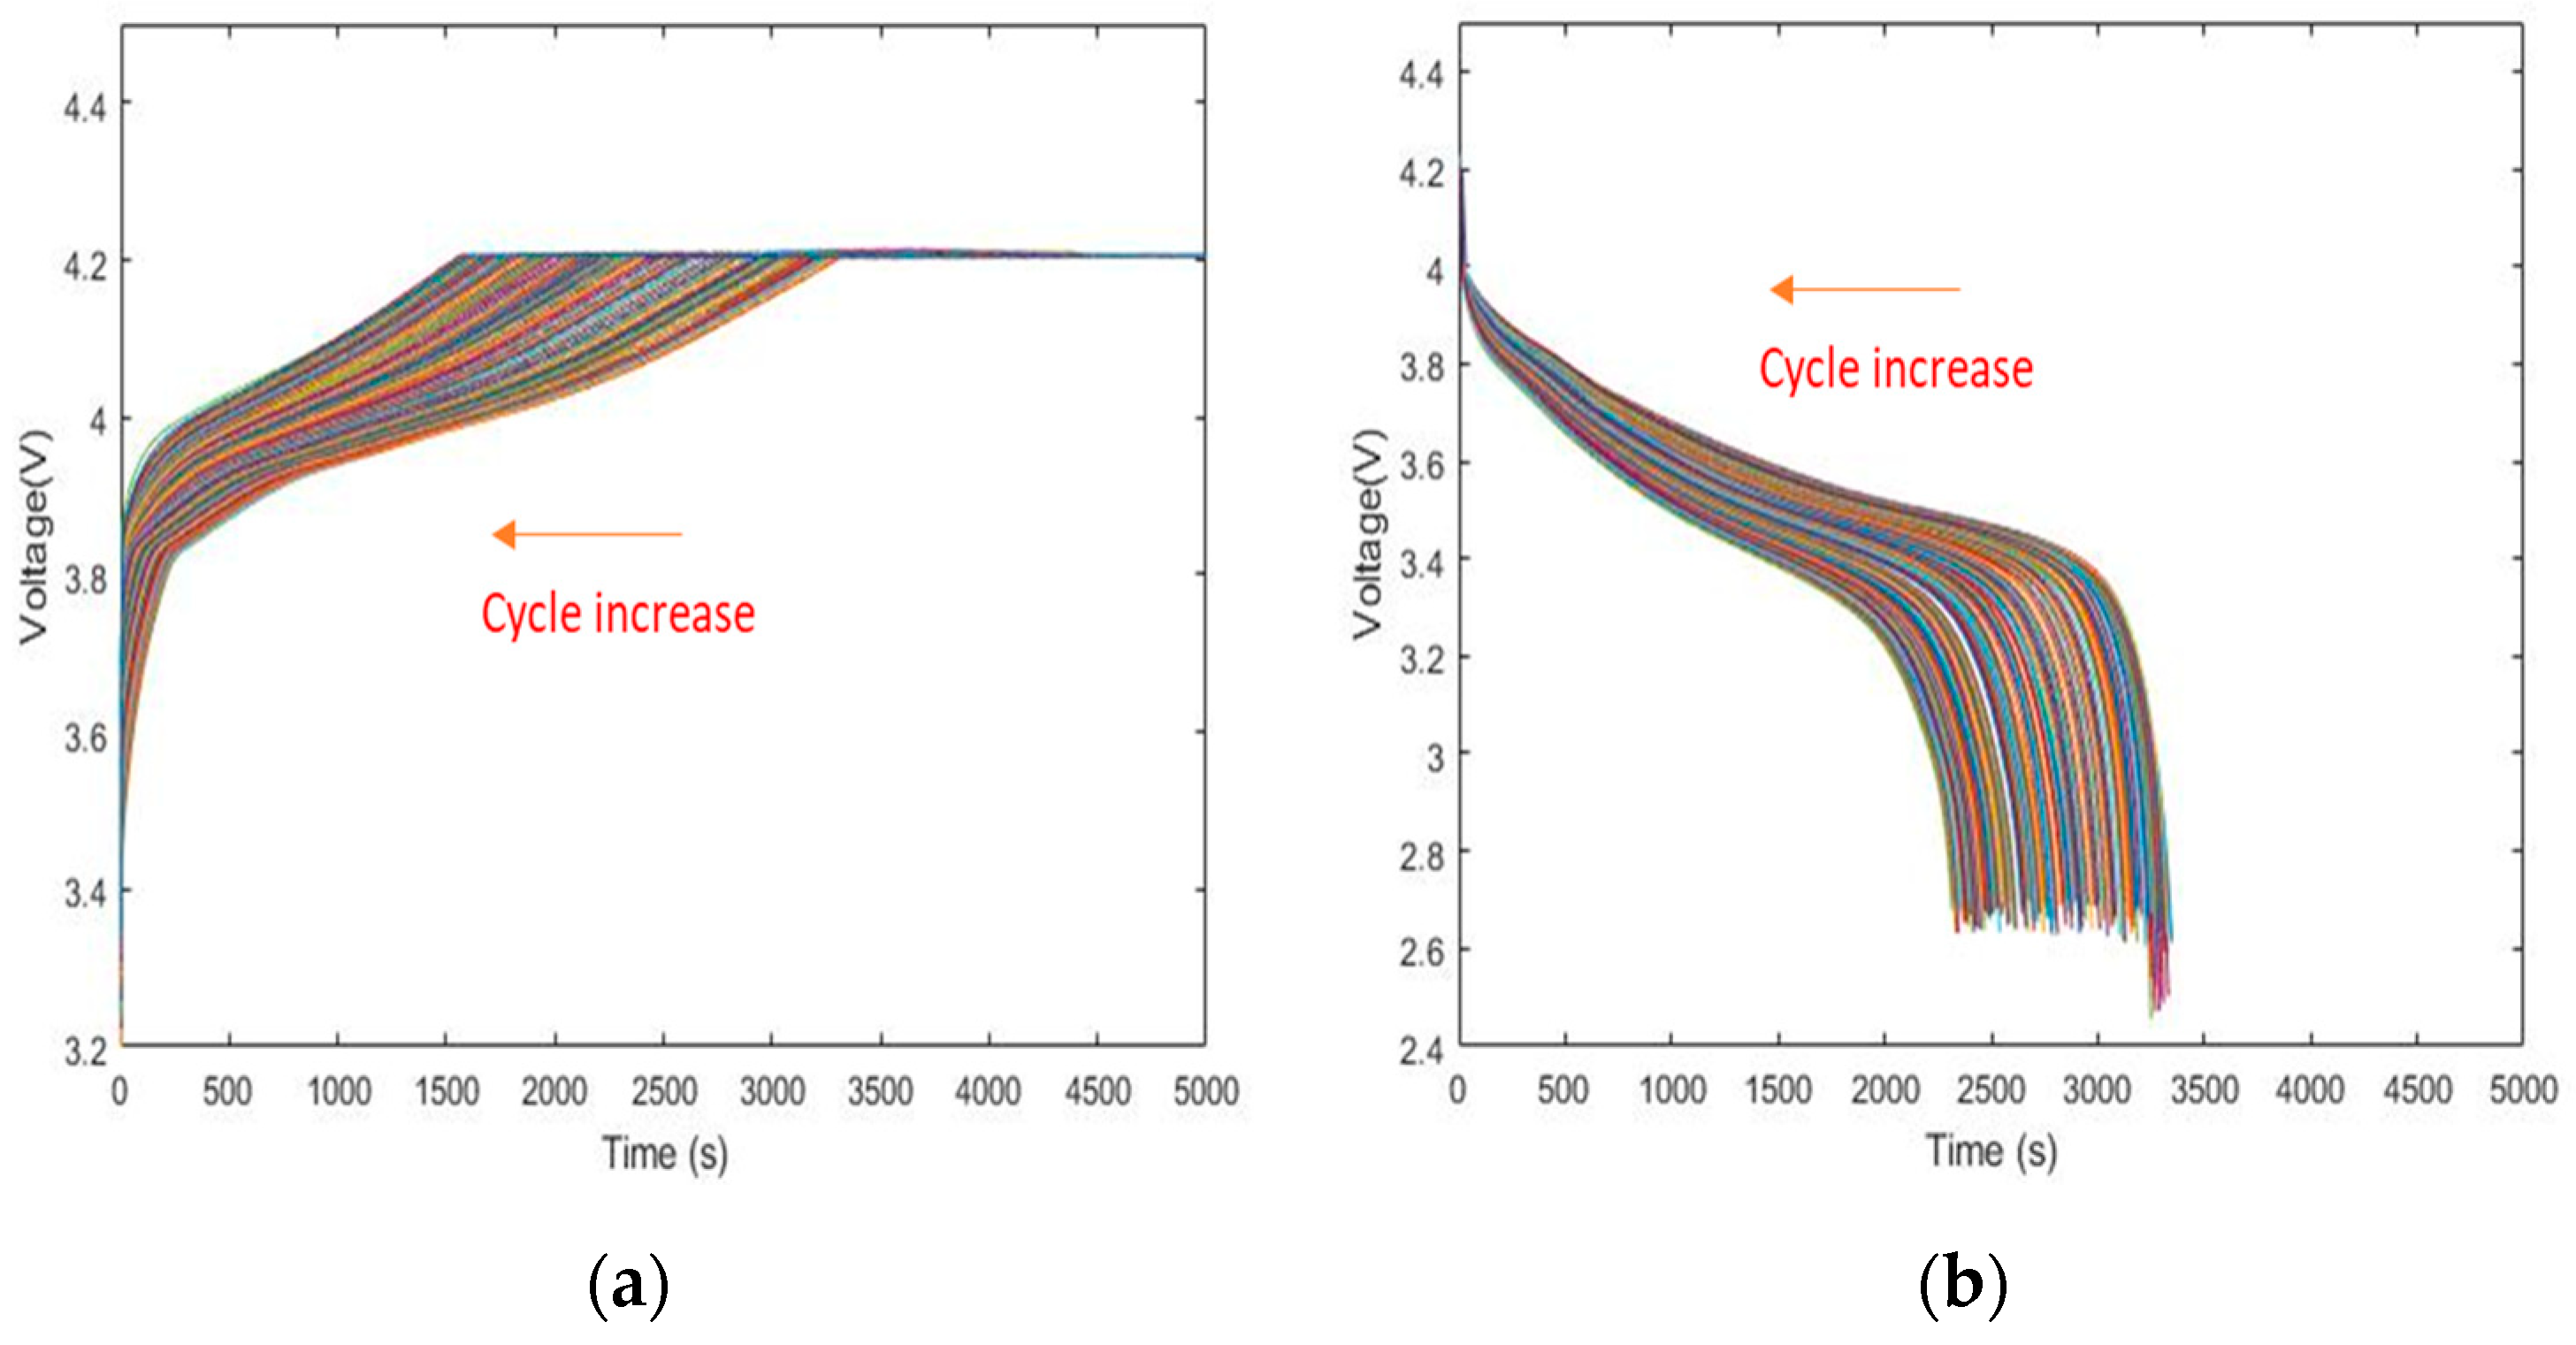
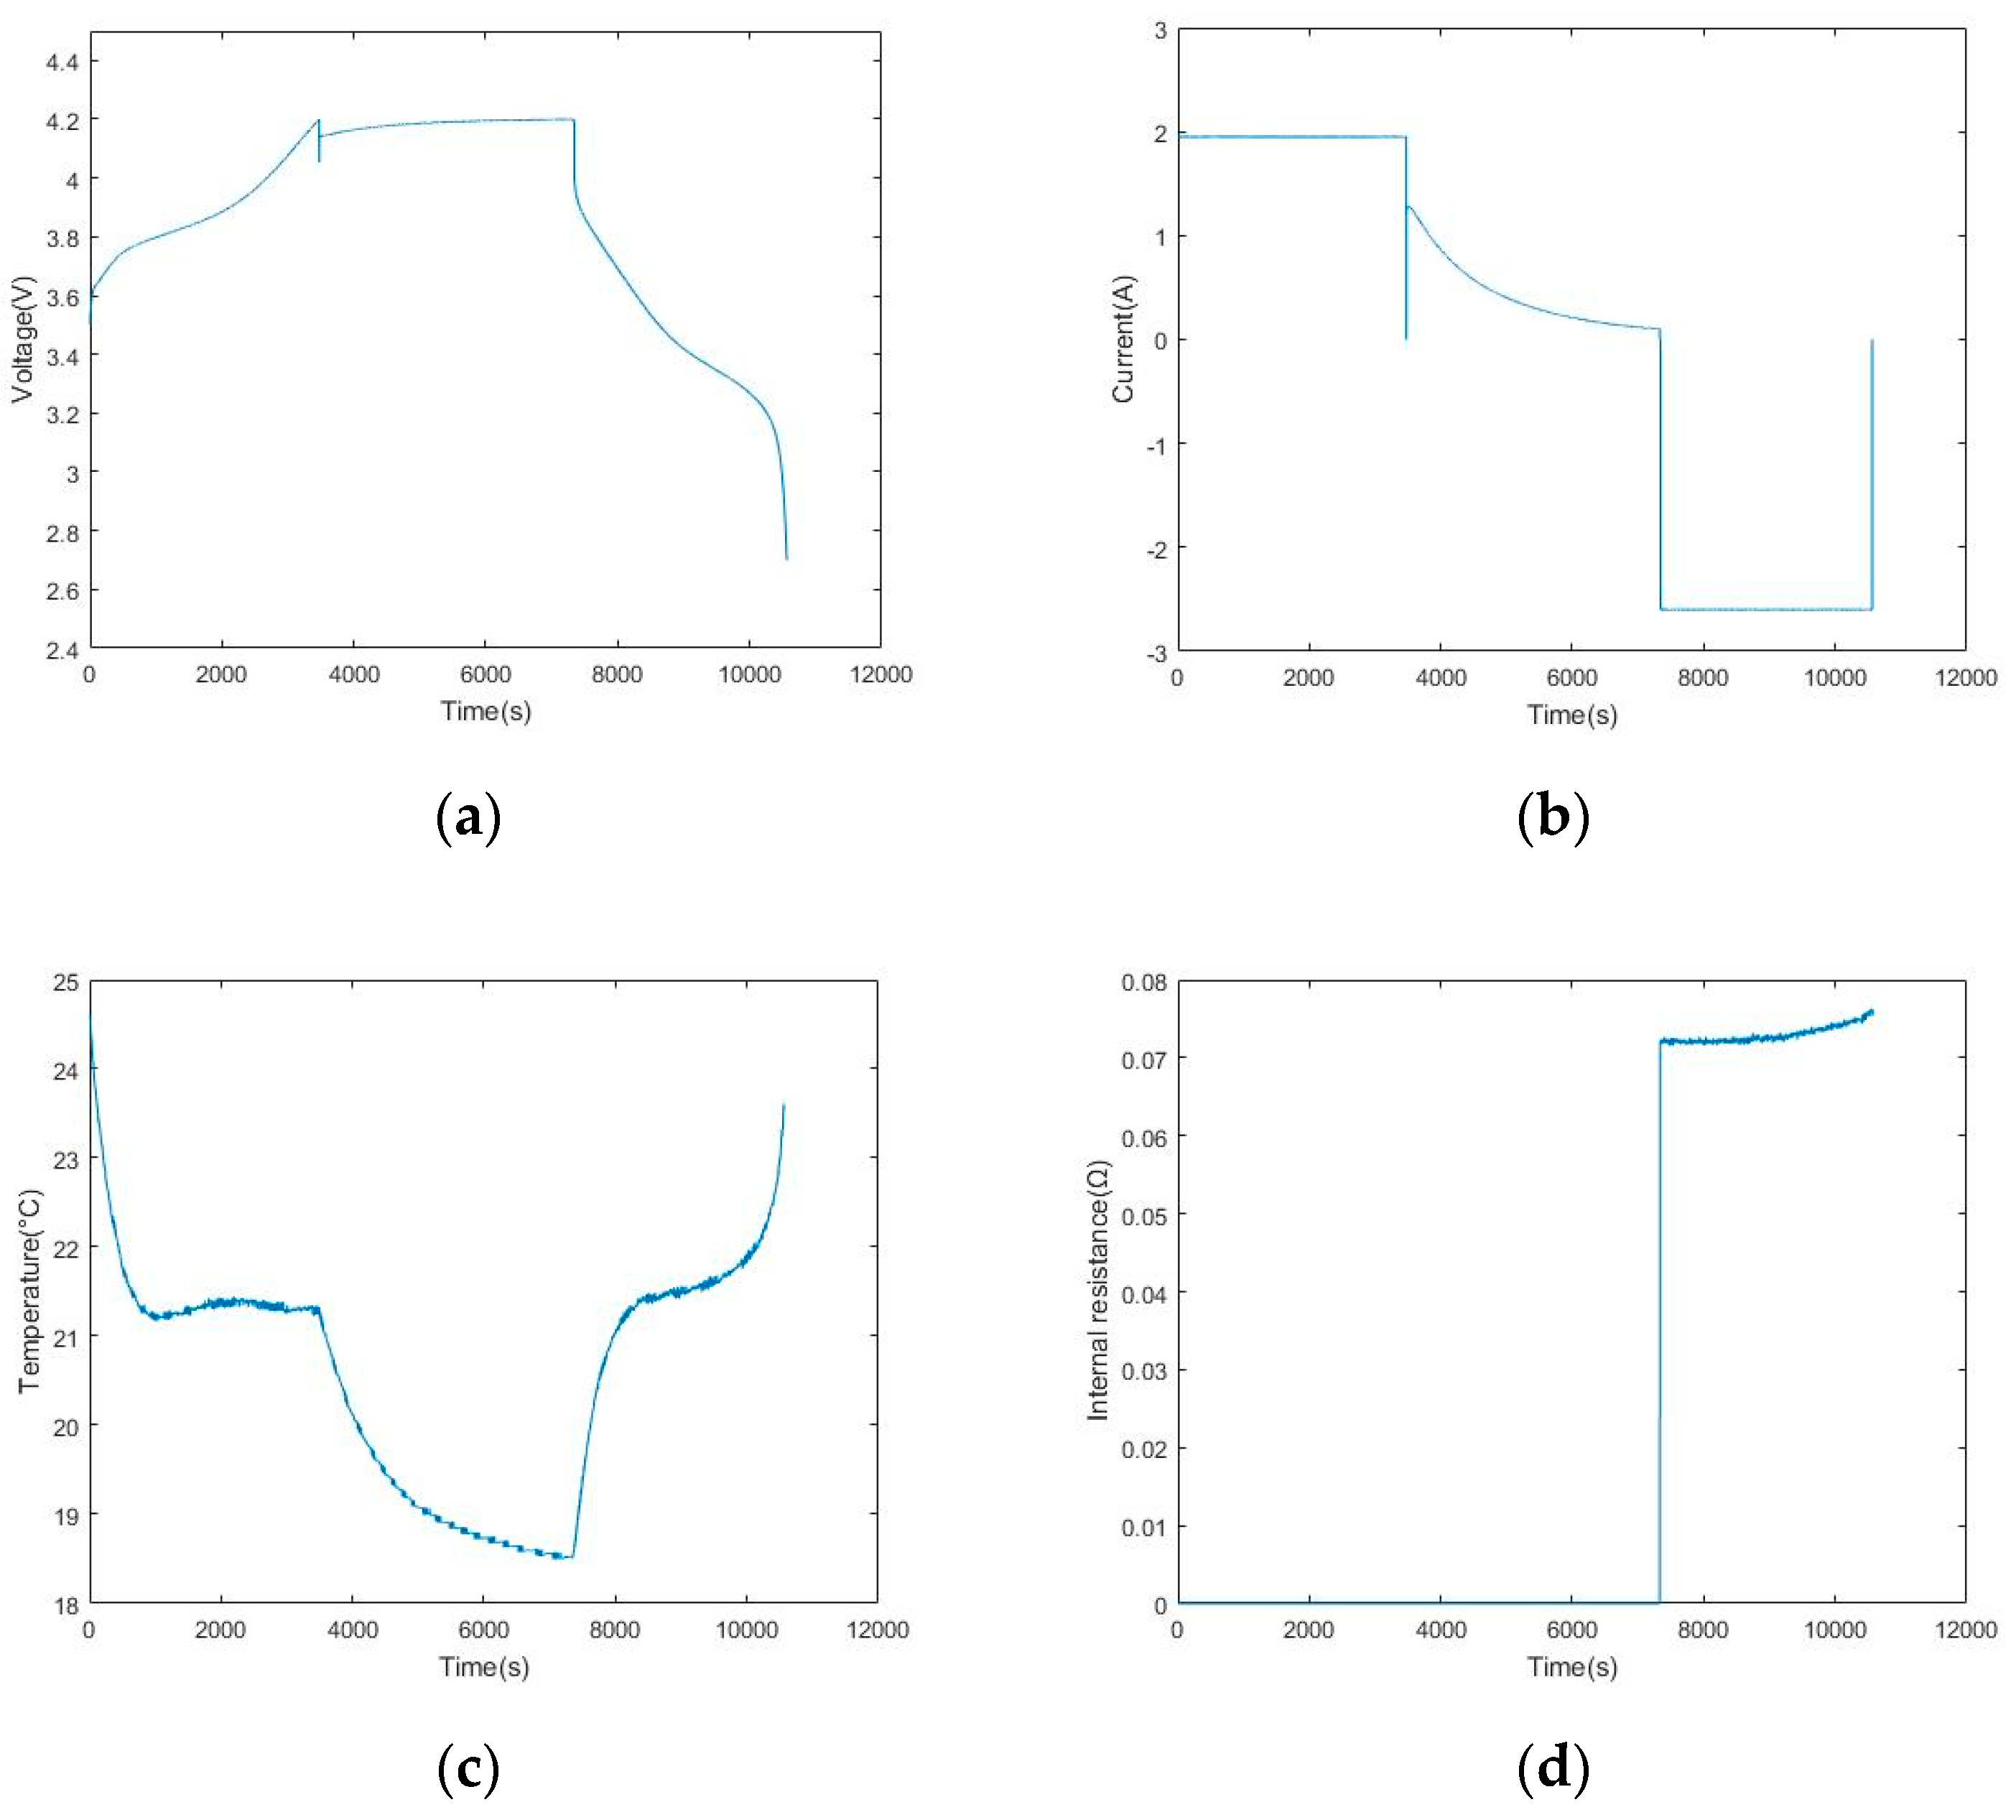
A rest time was introduced after charging and discharging to ensure experimental safety. However, because the battery temperature was not high, there was no rest mode after charging. One of the loop cycles was selected and the collected dataset was plotted, as shown in Figure 17.
As can be seen from these cycle data, the experimental battery took 7341 s to charge and 3229 s to discharge. Figure 17a shows the voltage changes of the battery during constant-current charging, constant-voltage charging, and constant-current discharging. In Figure 17b, the current is positive during charging and the discharging current is negative. During constant-current charging, the current is 1.95 A (0.75 C) and the battery temperature constant. In the current-voltage charging state, the battery temperature continues to decrease. However, it increases rapidly in the early stages of constant-current discharge. Toward the end of the discharge period, the temperature increases sharply again, then the battery voltage drops sharply when the voltage is below 3.2 V. It can be observed that the internal resistance increases with the increase in discharging depth.

5.3. Experiment-Based Verification Results

The lithium-ion battery was continuously charged and discharged through the built battery-accelerated aging experimental platform. The SOH predictions were performed for the experimental batteries based on the three charging features determined in this study regarding battery SOH. Although the input and output energies of the battery can be calculated by integrating the current against time using the ampere-hour integration method, the integration calculation and the degradation of the static flux caused by the degradation of the battery performance result in a large cumulative error and reduce the calculation accuracy [46,47,48,49]. Because it is difficult to directly measure the battery capacity, the internal resistance method was used to define the SOH of the battery in the experiment [50,51]. To distinguish it from the SOH based on the capacity of the NASA lithium-ion battery, the SOH defined based on the internal resistance is represented as shown in Equation (2) in the lowercase.
SOH = 1 R e o l R a R e o l R n  
where R e o l represents the internal resistance at the end of battery life, R a is the current internal resistance of the battery, and R n is the internal resistance of the new battery. The core idea of SOH prediction using this definition is to obtain the internal resistance value of the battery. In general engineering, the measurement value of the internal resistance of the battery is commonly used to measure the general health status of the current battery. In this paper, from the experimental data the current internal resistance of 2 R a is taken as the lithium-ion battery termination threshold.
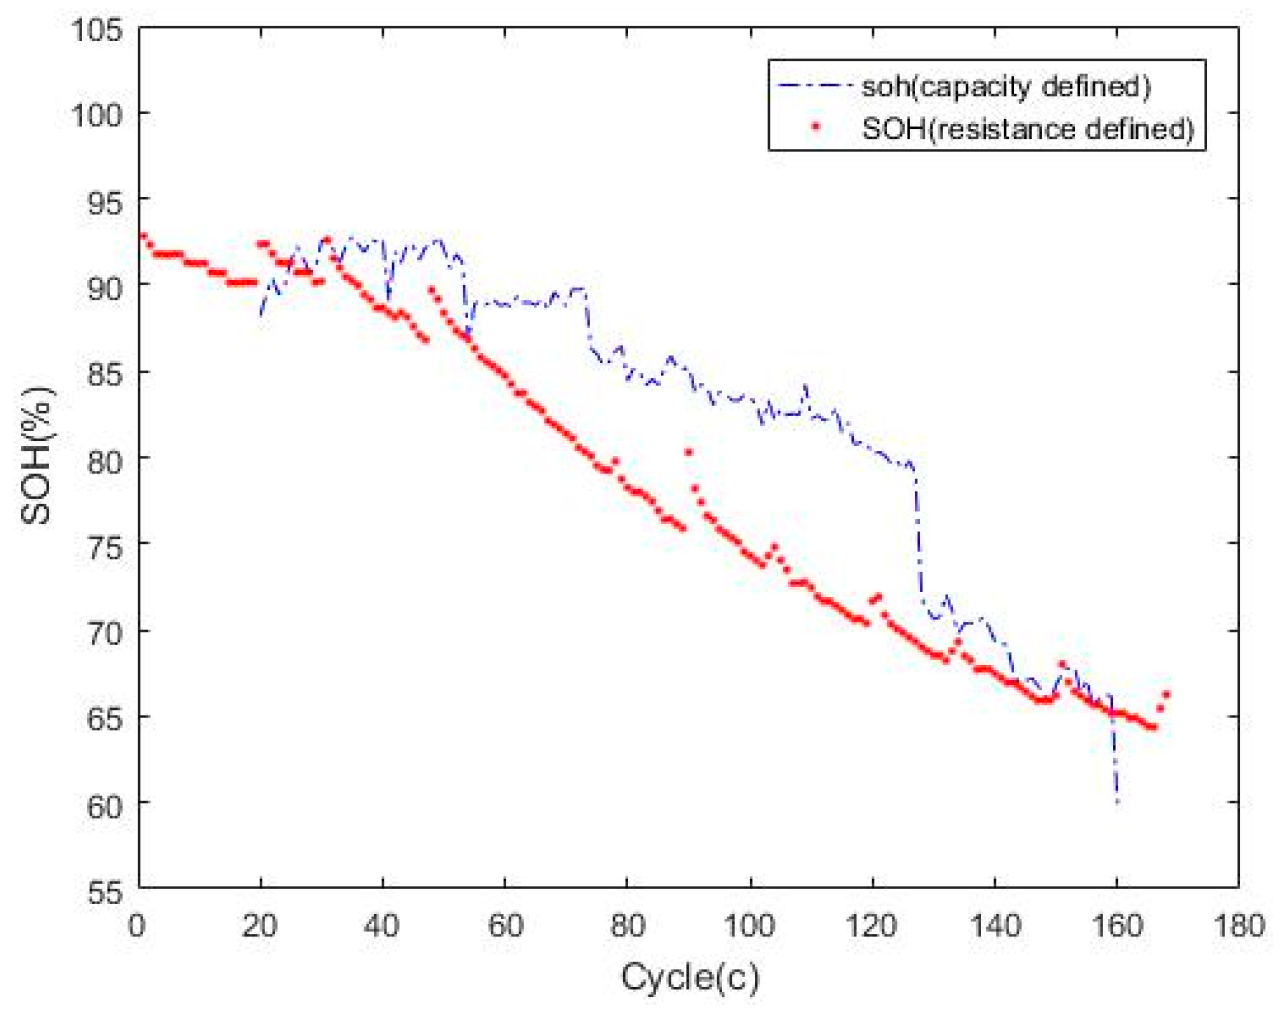
For comparison with the SOH defined by the capacity as described in Section 2, 
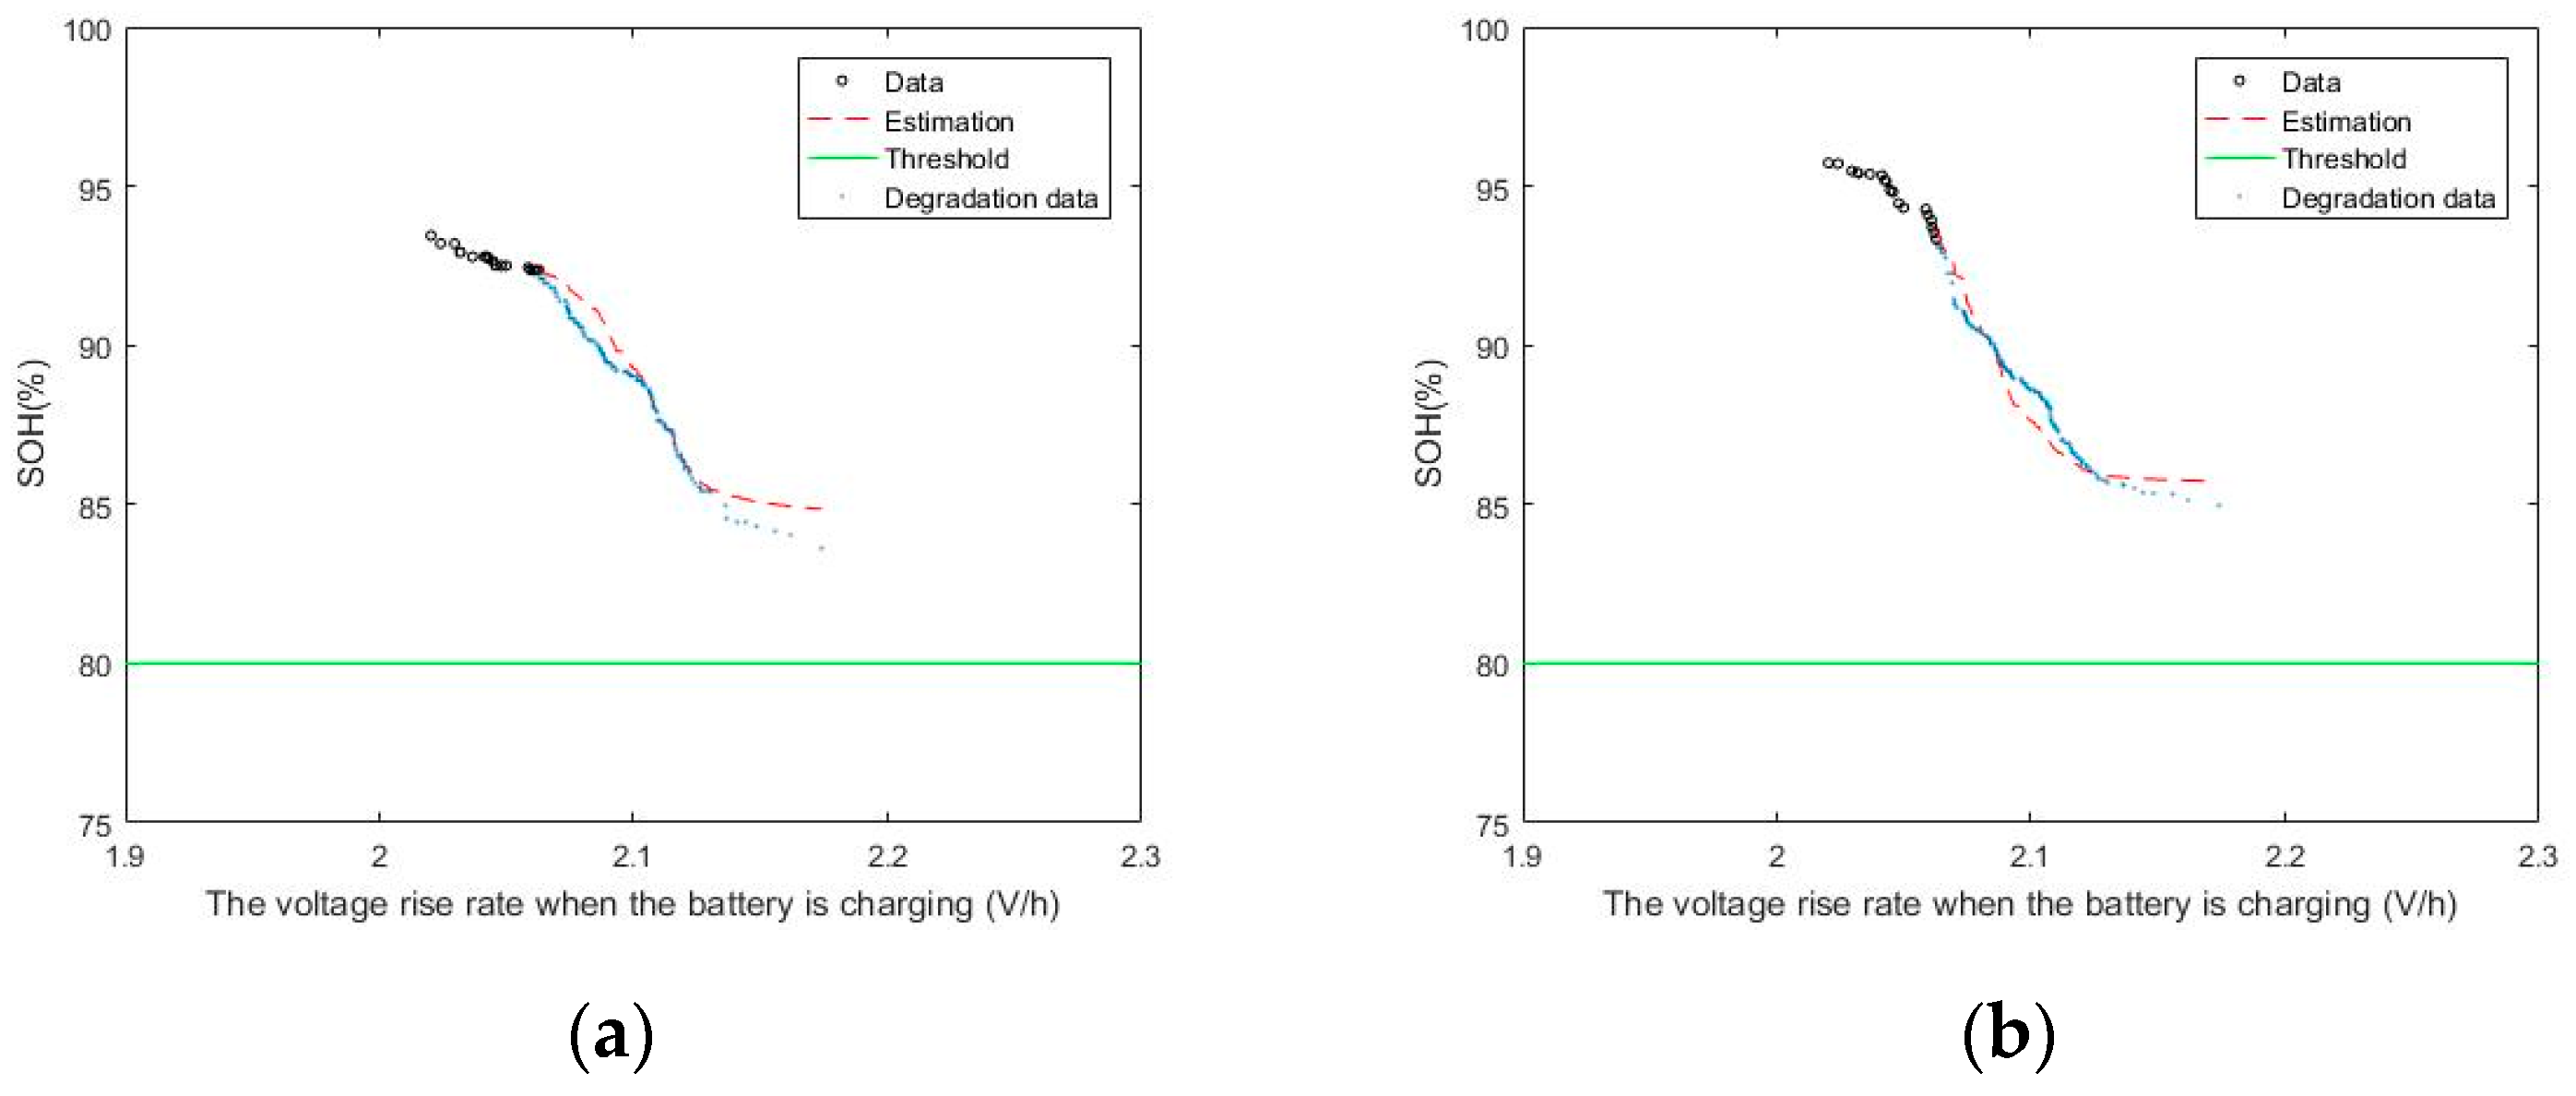
Figure 18 shows the relationship between the SOH based on the capacity in the NASA 5 dataset and the SOH based on the internal resistance of the battery.
As observed from the figure, there are slight differences in the SOH depending on the definition. However, a decreasing trend is noted for the SOH as the number of cycles increase. Thus, it can be proven that the SOH defined by the internal resistance is correct.
As presented in Table 6, the RMSE is used to compare two SOHs: the SOH calculated by the battery capacity measured using the ampere-hour integration method and that calculated by the internal resistance measured using the battery tester.
Notably, by comparing the experimental results of the two batteries, the RMSE values of the SOH calculated using the ampere-hour integration method and the internal resistance measured by the experiment were 0.0273 and 0.0547, respectively. The RMSE values were close to 0, indicating that the SOH values defined using the two methods were not very different. The internal resistance measured in the actual experiment can represent the SOH of the battery, similar to the battery capacity measured using the ampere-hour integration method.
The prediction results for the SOH values obtained by the LSTM using features 1, 2, and 3 are shown in Figure 19, Figure 20 and Figure 21, respectively.
The SOH results obtained by the TCN using features 1, 2, and 3 are shown in Figure 22, Figure 23 and Figure 24, respectively.
The performance of lithium-ion batteries is better than that of ordinary batteries, and their service life is longer. Although the accelerated aging experiments for the lithium-ion batteries designed in this study did not significantly reduce the battery SOH below the threshold of 80%, the limited battery life degradation experiments proved the argument proposed in this study to predict the SOH of lithium batteries based on charging characteristics. To better compare the performance of the two deep learning algorithms, we chose the results predicted when the SOH was 86% for comparison. Table 7 shows the predictions of the LSTM and TCN algorithms when the SOH was 86%.
Through the actual lithium-ion battery degradation experimental data, the LSTM and TCN algorithms can accurately predict the battery SOH according to the three charging characteristics proposed in this paper. For the same data, the prediction result for the TCN algorithm was more accurate than that of the LSTM.

6. Conclusions and Discussion

This study determined three characteristic relationships between battery charging and discharging using the battery experimental data published by NASA. These features include the ratio of the constant-current charging time to total charging time, the ratio of the charging time to discharging time, and the voltage increase rate when the battery is charging. We used two sequence prediction deep learning algorithms, LSTM and TCN, to verify the relationship between the three determined charging and discharging characteristics and to predict the SOH of the battery. The predicted results demonstrated that when the TCN algorithm is used with the three characteristic relationships of charging and discharging to predict the SOH of the battery, the predicted results are better than those of the LSTM algorithm. Furthermore, we also proved that the battery charging and discharging characteristics determined in this research can be used to predict battery SOH.
To verify the adaptability of the proposed method, one piece of equipment was prepared for the accelerated aging test of lithium-ion batteries. The test system was primarily composed of a programmable power supply, programmable electronic load, and battery internal resistance tester. The test system can perform charging and discharging degradation cycle tests and battery internal resistance measurements. Here, 200 cycles of charging and discharging data were obtained for a 2.6 Ah 18,650 battery, including current, voltage, internal resistance, and temperature data. The internal resistance was obtained using a battery internal resistance tester, and the SOH of the battery was calculated using the SOH calculation formula for the internal resistance. Owing to the individual differences in the batteries, the initial SOH was not the same. We demonstrated that the three charging characteristics proposed in this study can effectively predict the SOH of a battery. Two different deep learning algorithms were used to predict the battery life, and the prediction accuracy of the two algorithms was compared. From the perspective of predicting the SOH of the battery based on the three charging–discharging characteristics, the newly proposed TCN algorithm has advantages over LSTM.
The three features of the predicted battery SOH extracted in this paper are based on the data from full charge and discharge states as well as of continuous charge and discharge states under the same conditions. For charging and discharging data under random conditions of a battery in use, battery aging will be slower than under accelerated test conditions. With the aging of the battery in normal use, the battery capacity decreases and the charging and discharging times under the rated condition of the battery also shorten, increasing the feasibility of the SOH prediction of the battery under random conditions. Subsequent research could involve the design of random battery charging and discharging experiments to verify this method. In addition, this paper directly used the LSTM and TCN algorithms in deep learning through the proposed three charging features to predict the SOH of lithium-ion batteries, although we lacked a common benchmark work for comparison and the paper had certain limitations.

Author Contributions

J.B. and J.-C.L. are the co-first authors of this paper. Conceptualization, J.B., J.-C.L. and H.L.; methodology, J.B., J.-C.L. and H.L.; software, J.B.; validation, J.B., J.-C.L. and H.L.; formal analysis, J.-C.L.; investigation, J.B.; resources, J.B.; data curation, J.B.; writing—original draft preparation, J.B.; writing—review and editing, J.-C.L.; visualization, J.B.; supervision, J.B.; project administration, J.B.; funding acquisition, J.B. All authors have read and agreed to the published version of the manuscript.

Funding

This research was funded by the “Convergence and Open Sharing System” Project, supported by the Ministry of Education and National Research Foundation of Korea.

Institutional Review Board Statement

Not applicable.

Informed Consent Statement

Not applicable.

Data Availability Statement

Not applicable.

Conflicts of Interest

The authors declare no conflict of interest.

References

  1. Słupik, S.; Kos-Łabędowicz, J.; Trzęsiok, J. Are You a Typical Energy Consumer? Socioeconomic Characteristics of Behavioural Segmentation Representatives 8 European Countries. Energies 2021, 14, 6109. [Google Scholar] [CrossRef]
  2. Pakulska, T. Green Energy in Central and Eastern European (CEE) Countries: New Challenges on the Path to Sustainable Development. Energies 2021, 14, 884. [Google Scholar] [CrossRef]
  3. Jia, J.; Liang, J.; Shi, Y.; Wen, J.; Pang, X.; Pang, X.; Zeng, J. SOH and RUL Prediction of Lithium-Ion Batteries Based on Gaussian Process Regression with Indirect Health Indicators. Energies 2020, 13, 375. [Google Scholar] [CrossRef] [Green Version]
  4. Lu, L.; Han, X.; Li, J.; Hua, J.; Ouyang, M. A Review on the Key Issues for Lithium-Ion Battery Management in Electric Vehicles. J. Power Sources 2013, 226, 272–288. [Google Scholar] [CrossRef]
  5. Takami, N.; Inagaki, H.; Tatebayashi, Y.; Saruwatari, H.; Honda, K.; Egusa, S. High-Power and Long-Life Lithium-Ion Batteries using Lithium Titanium Oxide Anode for Automotive and Stationary Power Applications. J. Power Sources 2013, 244, 469–475. [Google Scholar] [CrossRef]
  6. Hu, X.; Zou, C.; Zhang, C.; Li, Y. Technological Developments in Batteries: A Survey of Principal Roles, Types, and Management Needs. IEEE Power Energy Mag. 2017, 15, 20–31. [Google Scholar] [CrossRef]
  7. Ezemobi, E.; Silvagni, M.; Mozaffari, A.; Tonoli, A.; Khajepour, A. State of Health Estimation of Lithium-Ion Batteries in Electric Vehicles under Dynamic Load Conditions. Energies 2022, 15, 1234. [Google Scholar] [CrossRef]
  8. Jia, B.; Guan, Y.; Wu, L. A State of Health Estimation Framework for Lithium-Ion Batteries Using Transfer Components Analysis. Energies 2019, 12, 2524. [Google Scholar] [CrossRef] [Green Version]
  9. Bian, X.; Wei, Z.; He, J.; Yan, F.; Liu, L. A Novel Model-Based Voltage Construction Method for Robust State-of-Health Estimation of Lithium-Ion Batteries. IEEE Trans. Ind. Electron. 2021, 68, 12173–12184. [Google Scholar] [CrossRef]
  10. Liu, R.; Zhang, C. An Active Balancing Method Based on SOC and Capacitance for Lithium-Ion Batteries in Electric Vehicles. Front. Energy Res. 2021, 9, 662. [Google Scholar] [CrossRef]
  11. Kim, N.H.; An, D.; Choi, J.H. Prognostics and Health Management of Engineering Systems, 1st ed.; Springer Nature: Cham, Switzerland, 2017; pp. 10–18. ISBN 978-3-319-44740-7. [Google Scholar]
  12. Ashwin, T.R.; Chung, Y.M.; Wang, J. Capacity Fade Modelling of Lithium-Ion Battery under Cyclic Loading Conditions. J. Power Sources 2016, 328, 586–598. [Google Scholar] [CrossRef] [Green Version]
  13. Peled, E. The Electrochemical Behavior of Alkali and Alkaline Earth Metals in Nonaqueous Battery Systems—The Solid Electrolyte Interphase Model. J. Electrochem. 1979, 126, 2047. Available online: https://iopscience.iop.org/article/10.1149/1.2128859 (accessed on 4 March 2022). [CrossRef]
  14. Kasnatscheew, J.; Evertz, M.; Streipert, B.; Wagner, R.; Nowak, S.; Laskovic, I.C.; Winter, M. Changing Established Belief on Capacity Fade Mechanisms: Thorough Investigation of LiNi1/3Co1/3Mn1/3O2(NCM111) under High Voltage Conditions. J. Phys. Chem. C 2017, 121, 1521–1529. [Google Scholar] [CrossRef]
  15. Klein, S.; Wickeren, S.V.; Röser, S.; Bärmann, P.; Borzutzki, K.; Heidrich, B.; Börner, M.; Winte, M. Understanding the Outstanding High-Voltage Performance of NCM523||Graphite Lithium Ion Cells after Elimination of Ethylene Carbonate Solvent from Conventional Electrolyte. Adv. Energy Mater. 2021, 11, 14. [Google Scholar] [CrossRef]
  16. Dahbi, M.; Komaba, S. Chapter 16—Fluorine Chemistry for Negative Electrode in Sodium and Lithium Ion Batteries. In Advanced Fluoride-Based Materials for Energy Conversion; Nakajima, T., Groult, H., Eds.; Elsevier: Amsterdam, The Netherlands, 2015; pp. 364–420. ISBN 978-0-12-800679-5. [Google Scholar]
  17. Zhou, Y.; Li, S.E.; Shao, B.; Wang, B. State-Space Model with Non-Integer Order Derivatives for Lithium-Ion Battery. J. Applied Energy 2016, 161, 330–336. [Google Scholar] [CrossRef]
  18. He, W.; Williard, N.; Osterman, M. Prognostics of Lithium-Ion Batteries Based on Dempster-Shafer Theory and the Bayesian Monte Carlo Method. J. Power Sources 2011, 13, 196. [Google Scholar] [CrossRef]
  19. Wang, D.; Miao, Q.; Pecht, M. Prognostics of Lithium-Ion Batteries Based on Relevance Vectors and a Conditional Three-Parameter Capacity Degradation Model. J. Power Sources 2013, 239, 253–264. [Google Scholar] [CrossRef]
  20. Tian, Y.; Lu, C.; Wang, Z.; Tao, L. Artificial Fish Swarm Algorithm-Based Particle Filter for Li-Ion Battery Life Prediction. J. Math. Probl. Eng. 2014, 2014, 564894. [Google Scholar] [CrossRef]
  21. Hu, C.; Jain, G.; Tamirisa, P.; Gorka, T. Method for Estimating Capacity and Predicting Remaining Useful Life of Lithium-Ion Battery. In Proceedings of the 2014 International Conference on Prognostics and Health Management, Washington, DC, USA, 22–25 June 2014; pp. 1–8. [Google Scholar] [CrossRef]
  22. Walker, E.; Rayman, S.; White, R.E. Comparison of a Particle Filter and Other State Estimation Methods for Prognostics of Lithium-Ion Batteries. J. Power Sources 2015, 287, 1–12. [Google Scholar] [CrossRef] [Green Version]
  23. Miao, Q.; Xie, L.; Cui, H.; Liang, W.; Pecht, M. Remaining Useful Life Prediction of Lithium-Ion Battery with Unscented Particle Filter Technique. J. Microelectron. Reliab. 2013, 6, 53–805. [Google Scholar] [CrossRef]
  24. Remmlinger, J.; Buchholz, M.; Soczka-Guth, T.; Dietmayer, K. On-Board State-of-Health Monitoring of Lithium-Ion Batteries using Linear Parameter-Varying Models. J. Power Sources 2013, 239, 689–695. [Google Scholar] [CrossRef]
  25. Liu, D.; Luo, Y.; Liu, J.; Peng, Y.; Guo, L.; Pecht, M. Lithium-Ion Battery Remaining Useful Life Estimation Based on Fusion Nolinear Degradation AR Model and RPF Algorithm. J. Neural Comput. Appl. 2013, 25, 557–572. [Google Scholar] [CrossRef]
  26. Zhang, S.; Zhai, B.; Guo, X.; Wang, K.; Peng, N.; Zhang, X. Synchronous Estimation of State of Health and Remaining Useful Lifetime for Lithium-Ion Battery Using the Incremental Capacity and Artificial Neural Networks. J. Energy Storage 2019, 26, 100951. [Google Scholar] [CrossRef]
  27. Meng, J.; Cai, L.; Luo, G.; Stroe, D.I.; Teodorescu, R. Lithium-Ion Battery State of Health Estimation with Short-Term Current Pulse Test and Support Vector Machine. J. Microelectron. Reliab. 2018, 88, 1216–1220. [Google Scholar] [CrossRef]
  28. Zhang, C.; He, Y.; Yuan, L.; Xiang, S.; Wang, J. Prognostics of Lithium-Ion Batteries Based on Wavelet Denoising and DE-RVM. J. Comput. Intell. Neurosci. 2015, 1, 14–23. [Google Scholar] [CrossRef] [PubMed] [Green Version]
  29. Li, X.; Wang, Z.; Yan, J. Prognostic Health Condition for Lithium Battery Using the Partial Incremental Capacity and Gaussian Process Regression. J. Power Sources 2019, 421, 56–67. [Google Scholar] [CrossRef]
  30. Remmlinger, J.; Buchholz, M.; Meiler, M.; Bernreuter, P.; Dietmayer, K. State-of-Health Monitoring of Lithium-Ion Batteries in Electric Vehicles by On-Board Internal Resistance Estimation. J. Power Sources 2011, 196, 5357–5363. [Google Scholar] [CrossRef]
  31. Wang, Y.; Yang, D.; Zhang, X.; Chen, Z. Probability Based Remaining Capacity Estimation Using Data-Driven and Neural Network Model. J. Power Sources 2016, 315, 199–208. [Google Scholar] [CrossRef]
  32. Li, Y.; Liu, K.; Foley, A.M.; Zülke, A.; Berecibar, M.; Nanini-Maury, E.; Mierlo, J.V.; Hoster, H.E. Data-Driven Health Estimation and Lifetime Prediction of Lithium-Ion Batteries: A Review. Model. J. Renew. Sustain. Energy Rev. 2019, 113, 109254. [Google Scholar] [CrossRef]
  33. Chemali, E.; Kollmeyer, P.; Preindl, M.; Fahmy, Y.; Emadi, A. A Convolutional Neural Network Approach for Estimation of Li-Ion Battery State of Health from Charge Profiles. Energies 2022, 15, 1185. [Google Scholar] [CrossRef]
  34. Kim, J.; Yu, J.; Kim, M.; Kim, K.; Han, S. Estimation of Li-Ion Battery State of Health Based on Multilayer Perceptron: As an EV Application. IFAC-PapersOnLine 2018, 51, 392–397. [Google Scholar] [CrossRef]
  35. Kaplan, H.; Tehrani, K.; Jamshidi, M. A Fault Diagnosis Design Based on Deep Learning Approach for Electric Vehicle Applications. Energies 2021, 14, 6599. [Google Scholar] [CrossRef]
  36. Zhang, Y.Z.; Xiong, R.; He, H.W.; Pecht, M.G. Long short-term memory recurrent neural network for remaining useful life prediction of lithium-ion batteries. IEEE Trans. Veh. Technol. 2018, 67, 5695–5705. [Google Scholar] [CrossRef]
  37. Yang, K.; Tang, Y.; Zhang, Z. Parameter Identification and State-of-Charge Estimation for Lithium-Ion Batteries Using Separated Time Scales and Extended Kalman Filter. Energies 2021, 14, 1054. [Google Scholar] [CrossRef]
  38. Chen, Y.; Huang, M. A Method of Battery State of Health Prediction Based on AR-Particle Filter. SAE Tech. Pap. 2016, 1, 1212. [Google Scholar] [CrossRef]
  39. Peng, Y.; Hou, Y.; Song, Y.; Pang, J.; Liu, D. Lithium-Ion Battery Prognostics with Hybrid Gaussian Process Function Regression. Energies 2018, 11, 1420. [Google Scholar] [CrossRef] [Green Version]
  40. Li, X.Y.; Zhang, L.; Wang, Z.P.; Dong, P. Remaining useful life prediction for lithium-ion batteries based on a hybrid model combining the long short-term memory and Elman neural networks. J. Energy Storage 2019, 21, 510–518. [Google Scholar] [CrossRef]
  41. Mao, L.; Xu, J.; Chen, J.; Zhao, J.; Wu, Y.; Yao, F. LSTM-STW and GS-LM Fusion Method for Lithium-Ion Battery RUL Prediction Based on EEMD. Energies 2020, 13, 2380. [Google Scholar] [CrossRef]
  42. Surya, S.; Rao, V.; Williamson, S.S. Comprehensive Review on Smart Techniques for Estimation of State of Health for Battery Management System Application. Energies 2021, 14, 4617. [Google Scholar] [CrossRef]
  43. NASA Ames Prognostics Data Repository. Available online: http://ti.arc.nasa.gov/project/prognostic-data-repository (accessed on 20 February 2022).
  44. Bai, S.; Kolter, J.Z.; Koltun, V. An Empirical Evaluation of Generic Convolutional and Recurrent Networks for Sequence Modeling. arXiv 2018, arXiv:1803.01271. Available online: https://arxiv.org/abs/1803.01271 (accessed on 20 February 2022).
  45. Liu, H.; Bi, J.; Lee, J.C. Construction of an Accelerated Aging Test System for Series Connection Battery Pack. IJOEST 2022, 6, 1. [Google Scholar] [CrossRef]
  46. Cheng, Y.; Zhang, X.; Wang, X.; Li, J. Battery State of Charge Estimation Based on Composite Multiscale Wavelet Transform. Energies 2022, 15, 2064. [Google Scholar] [CrossRef]
  47. Shin, D.; Yoon, B.; Yoo, S. Compensation Method for Estimating the State of Charge of Li-Polymer Batteries Using Multiple Long Short-Term Memory Networks Based on the Extended Kalman Filter. Energies 2021, 14, 349. [Google Scholar] [CrossRef]
  48. Lee, J.; Lee, I. Lithium Battery SOH Monitoring and an SOC Estimation Algorithm Based on the SOH Result. Energies 2021, 14, 4506. [Google Scholar] [CrossRef]
  49. Xin, X.; Wang, S.; Fernandez, C.; Yu, C.; Zou, C.; Jiang, C. A novel practical state of charge estimation method: An adaptive improved ampere-hour method based on composite correction factor. Energy Res. 2020, 44, 14. [Google Scholar] [CrossRef]
  50. Dai, H.; Wei, X.; Sun, Z. A New SOH Prediction Concept for the Power Lithium-Ion Battery Used on HEVs. In Proceedings of the 2009 IEEE Vehicle Power and Propulsion Conference, Dearborn, MI, USA, 7–10 September 2009; pp. 1649–1653. [Google Scholar] [CrossRef]
  51. Schweiger, H.; Obeidi, O.; Komesker, O.; Raschke, A.; Schiemann, M.; Zehner, C.; Gehnen, M.; Keller, M.; Birke, P. Comparison of Several Methods for Determining the Internal Resistance of Lithium Ion Cells. Sensors 2010, 10, 5604–5625. [Google Scholar] [CrossRef] [PubMed] [Green Version]
Figure 1. With the increase in the number of cycles, the relationships between the charge time, discharge time, and voltage become apparent: (a) charge time and voltage; (b) discharge time and voltage.
Energies 15 02448 g001
Figure 2. The ratio of the constant current charge time to total charge time: (a) NASA 5; (b) NASA 6; (c) NASA 7; (d) NASA 18.
Energies 15 02448 g002
Figure 3. The ratio of charge time to discharge time: (a) NASA 5; (b) NASA 6; (c) NASA 7; (d) NASA 18.
Energies 15 02448 g003
Figure 4. The voltage increase rate when the battery is charging: (a) NASA 5; (b) NASA 6; (c) NASA 7; (d) NASA 18.
Energies 15 02448 g004
Figure 5. Comparison of RNN and LSTM cells.
Energies 15 02448 g005
Figure 6. Causal convolution and dilated convolution in a TCN.
Energies 15 02448 g006
Figure 7. Residual block.
Energies 15 02448 g007
Figure 8. SOH results predicted by the LSTM using feature 1: (a) NASA 5; (b) NASA 6; (c) NASA 7; (d) NASA 18.
Energies 15 02448 g008
Figure 9. SOH results predicted by the LSTM using feature 2: (a) NASA 5; (b) NASA 6; (c) NASA 7; (d) NASA 18.
Energies 15 02448 g009
Figure 10. SOH results predicted by the LSTM using feature 3: (a) NASA 5; (b) NASA 6; (c) NASA 7; (d) NASA 18.
Energies 15 02448 g010
Figure 11. SOH results predicted by the TCN using feature 1: (a) NASA 5; (b) NASA 6; (c) NASA 7; (d) NASA 18.
Energies 15 02448 g011
Figure 12. SOH results predicted by the TCN using feature 2: (a) NASA 5; (b) NASA 6; (c) NASA 7; (d) NASA 18.
Energies 15 02448 g012
Figure 13. SOH results predicted by the TCN using feature 3: (a) NASA 5; (b) NASA 6; (c) NASA 7; (d) NASA 18.
Energies 15 02448 g013
Figure 14. Battery-accelerated aging test system.
Energies 15 02448 g014
Figure 15. The functional schematic of the experiment.
Energies 15 02448 g015
Figure 16. Flowchart of the experiment.
Energies 15 02448 g016
Figure 17. Single cycle experimental data display: (a) voltage; (b) current; (c) temperature; (d) internal resistance.
Energies 15 02448 g017
Figure 18. Comparison of two SOH definitions based on the NASA 5 dataset.
Energies 15 02448 g018
Figure 19. SOH results predicted by the LSTM using feature 1: (a) experiment 1; (b) experiment 2.
Energies 15 02448 g019
Figure 20. SOH results predicted by the LSTM using feature 2: (a) experiment 1; (b) experiment 2.
Energies 15 02448 g020
Figure 21. SOH results predicted by the LSTM using feature 3: (a) experiment 1; (b) experiment 2.
Energies 15 02448 g021
Figure 22. SOH results predicted by the TCN using feature 1: (a) experiment 1; (b) experiment 2.
Energies 15 02448 g022
Figure 23. SOH results predicted by the TCN using feature 2: (a) experiment 1; (b) experiment 2.
Energies 15 02448 g023
Figure 24. SOH results predicted by the TCN using feature 3: (a) experiment 1; (b) experiment 2.
Energies 15 02448 g024
Table 1. NASA battery charging conditions.
Battery Dataset NumberCharge CurrentCharge Cut-Off VoltageCharge up CurrentDischarge CurrentDischarge up Voltage
B00051.5 A4.2 V0.02 A2 A2.7 V
B00061.5 A4.2 V0.02 A2 A2.5 V
B00071.5 A4.2 V0.02 A2 A2.2 V
B00181.5 A4.2 V0.02 A2 A2.5 V
Table 2. Prediction performance for each battery using different features with different algorithms.
Battery Dataset NumberFeatureReal Data to ThresholdLSTM EstimationTCN Estimation
B000510.24440.25860.2451
23.823.7883.86
35.4995.5045.234
B000610.24550.23560.2381
23.6553.7793.887
35.6486.1835.943
B000710.24780.25320.2478
23.6533.683.656
35.6085.785.766
B0001810.26530.24240.2618
23.643.8243.71
35.475.7425.502
Table 3. Relative errors in SOH for LSTM and TCN.
FeatureMaximum Relative Error of LSTMMaximum Relative Error of TCN
10.08630.0301
20.05050.0634
30.09470.0522
Table 4. Functions and typical specifications of instruments used in the battery aging test system.
DeviceFunctionSpecifications
Programmable DC Power Supply (PPS)Charge the batteryMax: 30 V/3 A
Working mode: CC, CV
USB interface port with SCPI
Programmable Electronic Load (PEL)Discharge the batteryMax: 150 V/10 A
Working mode: CC, CV, CR, CP
USB interface port with SCPI
Battery Tester (BT)Measure internal resistance of batteryVoltage: 0.01 mV to 400.00 V
Resistance: 0.1 μΩ to 3.2 kΩ
Trigger: internal or external
USB interface port with SCPI
Analog Input (AI)Measure voltage of battery32 Ch Single-ended input
16 Ch differential input
Input voltage range: ±200 mV to ±10 V
Sampling rate: 250 kS/s
Resolution: 16 bit
Digital Output (DO)Control relays16 Ch
500 μs sourcing
External power supply voltage range: 6–30 VDC
ThermocoupleMeasure temperature about batteryJ-type
USB interface
RelayControl battery charge/discharge and battery tester3 Ch NC and NO
Excitation voltage: 24 VDC
Table 5. Experimental charging and discharging conditions.
Battery dataset NumberCharge CurrentCharge Cut-Off VoltageCharge up CurrentDischarge CurrentDischarge up Voltage
B11.95 A4.2 V0.1 A2.6 A2.7 V
B21.95 A4.2 V0.1 A2.6 A2.7 V
Table 6. RMSE between the capacity-defined SOH and the internal-resistance-defined SOH.
Battery Dataset NumberRSME
Experiment 10.0273
Experiment 20.0547
Table 7. Predictions of LSTM and TCN algorithms at 86% SOH.
Battery Dataset NumberFeatureReal Data to ThresholdLSTM EstimationTCN Estimation
Experiment 110.43990.43890.4394
22.3512.3542.353
32.1222.1232.123
Experiment 210.43720.43430.4376
22.3552.3642.359
32.1242.1232.124
Publisher’s Note: MDPI stays neutral with regard to jurisdictional claims in published maps and institutional affiliations.

