Article

How to Meet the Green Deal Objectives—Is It Possible to Obtain 100% RES at the Regional Level in the EU?

by
Bartłomiej Igliński
1,
Michał Bernard Pietrzak
2,*,
Urszula Kiełkowska
1,
Mateusz Skrzatek
1,
Artur Gajdos
3,
Anas Zyadin
4 and
Karthikeyan Natarajan
4
1
Faculty of Chemistry, Nicolaus Copernicus University in Toruń, Gagarina 11, 87-100 Toruń, Poland
2
Faculty of Management and Economics, Gdańsk University of Technology, Narutowicza 11/12, 80-233 Gdańsk, Poland
3
Faculty of Economics and Sociology, University of Lodz, POW 3/5, 90-255 Łódź, Poland
4
Faculty of Science and Forestry, School of Forest Sciences, University of Eastern Finland, P.O. Box 111, 801014 Joensuu, Finland
*
Author to whom correspondence should be addressed.
Energies 2022, 15(6), 2296; https://doi.org/10.3390/en15062296
Submission received: 25 October 2021 / Revised: 4 March 2022 / Accepted: 16 March 2022 / Published: 21 March 2022
(This article belongs to the Special Issue Renewable and Sustainable Energy: Current State and Prospects)

Abstract

:
The subject matter discussed in the article concerns the problem of the energy transformation of the European Union (EU) countries. In the case of the EU, the energy transformation has specific characteristics due to formal legal and institutional provisions. This means that the member states are obliged to implement the adopted Community Energy Strategy, which was defined under the European Green Deal. According to the EU policy, all member states are to have climate-neutral and zero-gas-emission economies by 2050. The energy transformation is to be largely based on the diversification of the energy sources used, with a dominance of renewable energy sources (RES). The article presents a research problem, where the question was asked whether achieving climate-neutral energy independence based solely on RES is possible at the regional level. It seems that the positive answer is an important argument in the discussion about the possibility of all member states achieving the goals set under the European Green Deal. Additionally, stating the possibility of energy independence from RES for a selected region is an important argument to promote just and bottom-up initiatives in order to carry out the energy transformation more effectively. The assessment of the energy potential from renewable sources at the regional level was carried out on the example of a selected NUTS 2 region, the Greater Poland Voivodeship in Poland. The main objective of the study is to analyze the possibility of obtaining independence from RES by the selected Greater Poland Voivodeship. The implementation of the objective consists of determining the energy potential from RES in the Voivodeship under study on the basis of the methods of a geographic information system (GIS). GIS methods were selected due to the fact that they allow for the spatial positioning of point, line, and surface structures in relation to the potential of RES, thus ensuring high accuracy of the obtained estimates. The analysis carried out in the study shows that the technical potential of RES in the Greater Poland Voivodeship is higher than the current electricity and heat usage. This means that by focusing solely on RES in the region, the Greater Poland Voivodeship can fully meet the energy demand thanks to its green resources. It should be emphasized that the Greater Poland Voivodeship is one of the coal-dependent regions in Poland that has already prepared a structured plan of just transformation. A locally and bottom-up prepared strategy assumes the conversion of the region from a “Coal Energy Region” into a “Green Energy Valley” in which economic development will be strictly connected to RES energy independence.

1. Introduction

For nearly thirty years, systematic growth of globalization and internationalization processes have been observed in the world [1,2,3]. These processes, through penetration into most markets, have resulted in intensive economic growth in most of the world’s economies and a related increase in the level of human development [4,5,6,7,8,9]. It should be emphasized that along with the increase in ties between economies, there was an unprecedented increase in investment, innovation, production, and significant institutional changes, both at the national and international level [10,11,12,13,14,15,16]. Significant changes in production have resulted in an increase in energy demand in all world economies [17,18]. The existing resources of energy from non-renewable sources are slowly becoming insufficient, and their use is becoming more and more expensive and has an increasingly negative impact on the natural environment. All this, combined with the change in consumer patterns and changes in the labor markets [19,20,21,22,23,24,25,26,27], has influenced the energy transformation currently being carried out in most countries [28,29,30,31,32]. The subject of the article is part of the problem of the energy transformation of the EU countries. It should be emphasized that the energy transformation in the community was strengthened institutionally, where all countries are obliged to follow the directions of the community climate policy. The short-term and long-term measures taken under the European Green Deal are to lead to a situation where all member states are to have climate-neutral economies with zero gas emissions [33,34].
One of the leading tools for an effective energy transformation is to diversify the energy sources used, with RES being the dominant ones [35]. This means that for most countries, the energy transition in EU member states refers to the shift from one dominant energy to energy based on RES [35,36,37,38]. The article poses a research problem in the form of whether achieving climate-neutral energy independence under the European Green Deal is possible at the regional level. The answer to this question seems to be very important. A positive answer will mean that all member states will be able to achieve all the objectives of the European Green Deal with a properly applied economic development strategy. The analysis of energy independence at the regional level was carried out on the example of a selected NUTS 2 region, the Greater Poland Voivodeship in Poland. The analysis was carried out in two aspects. The first aspect concerns the analysis of the current energy situation in the voivodeship in the context of the bottom-up initiative of energy transformation [39,40]. The second aspect concerns the assessment of the energy potential from RES.
Poland is a country where the majority of electric power and heat is generated with hard coal and brown coal (lignite) combustion. The limited amount of natural resources, increasing prices of fossil fuels, and environmental pollution are the major reasons for the use of RES. RES cannot be exhausted, are locally available for each country and, thus, do not lead to any economic or military conflict [41].
Currently, the greatest amount of renewable energy is generated by the following voivodeships: Kuyavian–Pomeranian [42], West Pomeranian [43] Pomeranian [44], Greater Poland [45], and Łódzkie [46]. The total RES capacity in Poland is about 9 GW (Figure 1). The Greater Poland Voivodeship, located in central Poland, has great potential to develop all types of RES [47].
Poland is obliged by the EC to add RES to the energy mix. In 2020, in Poland, the coal-based share in the energy mix went below 70% for the first time. The EC’s Renewable Energy Directives show the main goals and acts that emphasized the necessity to turn to a more sustainable and environmental economy. The directives have established the specific RES shares in the energy mix as targets. The EC’s Renewable Energy Directive from 2009 predefined three goals to be achieved by 2020—reduce greenhouse gas emissions by at least 20%; (2) increase the share of renewable energy to at least 20% of consumption; (3) achieve energy savings of 20% or more. Additionally, all EU countries should achieve a 10% share of renewable energy in their transport sector [48]. This EC Renewable Energy Directive was revised in 2018, establishing the new 32% renewable energy (share in energy mix) target by 2030 [49]. The proposed EC Renewable Energy Directive from 2021 established a 40% renewable energy target by 2030. The “Energy Roadmap” adopted by the EC in 2011 presents a strategic plan leading to the transition to a competitive low-carbon economy by 2050, with the goal of reducing CO2 emissions by 96–99% compared to 1990 [50].
The formal energy transformation in the EU was mainly a top-down initiative in the beginning. This means that the regions followed the formally established national and EC directions. The EC’s “Strategy on Adaptation to Climate Change”, introduced in 2013, includes the actions that must also be taken at the local, regional, and national levels in order to counteract the effects of climate change [51]. The most recent EU Strategy on Adaptation to Climate Change, established in 2021 empowered the local-level adaptation approach, focusing on individual citizens. The national response to the renewable energy directives were three documents established by the Polish government. Poland′s Energy Policy until 2030, constituted in 2009, underlines the commitment to develop the use of RES [52]. Poland’s National Energy and Climate Plan for years 2021–2030 [53], prepared as a fulfillment of the obligation set out in Regulation (EU) 2018/1999 of the European Parliament and of the Council of 11 December 2018 on the Governance of the Energy Union and Climate Action, established a 21–23% renewable energy target by 2030 (a 10-year plan). Prepared in 2021, Poland′s Energy Policy until 2040 [54] predefines a 32% renewable energy target to be obtained by 2040, claiming that “The local level is the bedrock of adaptation”.
In this paper, we underline the necessity of creating a well-organized and prepared bottom-up initiative of energy transformation, which starts within regions. Such an approach opens up more possibilities for energy transformation in the regions and automatically contributes to the Polish energy transformation. This does not mean that the RES regional policy is inconsistent with the Polish government policy and EU policy. It only underlines the necessity of performing RES transformation at the regional level more independently and equitably, taking into account the local context, such as the people’s awareness of climate change, the fairness of the decision-making process, and trust in the local government authorities, which includes the overall evaluation of costs, risks, and benefits of RES in the region. This approach should be integrated with the national and EU RES objectives and primarily enhance the quality of life in the region.
Attention should be paid to the role of business angels and sustainable start-ups, which can be translated into the effective implementation of the next stages of the energy transition and development of the RES sector [55,56,57]. Obtaining financing for successful sustainable start-ups, which have established their market position, is also possible in the capital market, where an important issue is the choice of an appropriate time for the company to enter the capital market [58,59,60,61].
At the local level, energy justice plays a key role in shaping the local community’s approach to energy transformation. Energy justice is defined in Poland as providing new development opportunities to regions and communities most affected by the negative effects of the transformation in connection to the low-carbon energy transition, providing new jobs and building new industries that participate in transforming the energy sector. The low-emission energy transformation envisaged in Poland′s Energy Policy until 2040 plans and initiates modernization changes for the entire economy, guaranteeing energy security and ensuring a fair distribution of costs and protection of the most vulnerable social groups [62]. According to this document, the energy transformation will be
  • Fair;
  • participatory, local, bottom-up;
  • focused on modernization and innovation;
  • stimulating economic development, efficiency, and competitiveness.
According to Carley and Konisky [39], “the comprehensive energy justice framework can be said to include energy availability and access, affordability, due process, accountability and transparency, and both inter- and intra-generational equity”. Such an approach points out that justice energy transformation comprises the fair distribution of benefits and burdens in the community, fair and transparent energy decision-making processes and procedures, understanding the historical context and related inequalities (and acts to reconcile them), and restorative justice treated as a tool to correct injustices [39]. The importance of consequentiality and trust in institutions on willingness-to-pay estimates towards the expansion of renewable energy is specifically important at the local level and has been analyzed and underlined in Germany by Oehlman and Meyerhoff [63]. Interpersonal and social trust in authorities has been proven to be related to community opinion on renewable energy in the United Kingdom. Energy justice and energy security are the base of an efficient and fair energy transformation in the region, as they shape the local community environment and opinions on renewable energies. This means that the community should have confirmation that the regional energy security and equity will be maintained. This includes maintaining a decent lifestyle and trust in the regional authorities and their decision-making processes.
A study performed by Rogers et. al. [64] examined the rural community perceptions of local renewable energy. The results stated that in the United Kingdom, “the community-based renewable energy projects, with high levels of public participation, are more likely to be accepted by the public than top-down development of large-scale schemes and may bring additional benefits such as increased engagement with sustainable energy issues.”
The studies performed by Zoellner et al. [65], Upham, and Shackley [66] demonstrated the roles of justice and trust in local authorities in the shaping of the public acceptance of renewable energy developments in Germany and the United Kingdom (accordingly).
The EC European Green Deal Plan includes the European Green Deal Investment Plan (EGDIP), which specifies the Just Transition Mechanism. The mechanism comprises the tools ensuring a fair and just transition to a green economy on the regional level and supports citizens of the regions (that are most impacted by the transition). The Greater Poland Voivodeship is one of six coal regions in Poland, and the first one that has an elaborated primary version of the Territorial Just Transition Plan with a specifically defined concept of the Just Transformation of the Eastern Greater Poland Voivodeship. This concept reinforced a strong bottom-up content-related emphasis in preparation for the energy transformation plan in the region, taking into account the local social and economic environment. The transition plan and the concept of just transformation have been prepared and will be followed with the collaboration with and the mutual support of public and private entities, the science sector, and the local community. Both documents were considered by public consultation. The plan and concept for the Greater Poland Voivodeship is to maintain the energy characteristic of the region, become the national leader of the green transformation in Poland, and achieve climate neutrality as early as 2040. What is more, the Greater Poland Voivodeship aims to create a well-known brand for the region, called the “Greater Poland Voivodeship Energy Valley” (based on RES) in the document. To do so, the region has to be RES independent.
Fuel cells are devices that convert the chemical energy of fuel and oxidants into electricity. All types of fuel cells, unlike traditional methods, generate electricity without burning fuel and oxidants. This allows for avoiding the emissions of harmful compounds, including nitrogen oxides, sulfur oxides, hydrocarbons (which cause the formation of holes in the ozone), and carbon oxides. In modern fuel cells, the most frequently used fuel is hydrogen (H2), while the oxidant is oxygen (O2), supplied to the device in its pure form or together with atmospheric air. However, this does not mean that no other fuels are used in fuel cells. Currently, intensive research is underway on cells powered directly by methanol CH3OH and carbon (in various forms). The fuel may also be CH4 methane, HCOOH formic acid, N2H4 hydrazine, and NH3 ammonia. Hydrogen is the fuel of choice for most cells due to its high reactivity in the presence of suitable catalysts, the possibility of producing it from hydrocarbons, and its high energy density when stored in a liquid form under high pressure at a low temperature. Unfortunately, although hydrogen is one of the most popular elements on Earth, it is mainly found in chemicals, primarily water. Hydrogen can be obtained from water by electrolysis, but unfortunately, a significant amount of energy must be invested in the process. Therefore, other sources of hydrogen have been sought and tested. In addition to obtaining hydrogen, an additional problem is its storage. The storage and transport of hydrogen require prior compression to a certain pressure or reduction to a liquid form [67,68,69].
The principle of the operation of fuel cells is the same as in galvanic cells, that is, batteries. However, unlike galvanic cells, fuel and oxidants are supplied externally in fuel cells. Thanks to this, they do not have such a limited time of use as traditional batteries. Fuel cells consist of two electrodes—an anode and cathode. The electrodes are separated by an electrolyte in liquid or solid form. Hydrogen (pure or as a component of air) is fed continuously to the anode, while oxygen (pure or as a component of air) is fed, also continuously, to the cathode. The ions must flow freely between the electrodes. In fuel cells, electrons reach the cathode, bypassing the electrolyte, through an external electrical circuit, making the cell a source of electromotive force. The said electrolyte is responsible for the transport of ions between the electrodes. For this reason, it must be a good ion conductor and at the same time, the weakest electron conductor. If the electrolyte did not meet even one of the requirements, the entire cell would not be able to function properly. The chemical reaction that takes place in the cell consists of breaking down the hydrogen into a proton and an electron at the anode, and then joining the reactants at the cathode. Electrochemical processes are accompanied by the flow of an electron from the anode to the cathode, bypassing the impermeable membrane. The electrochemical reaction of hydrogen and oxygen produces electricity, water, and heat [67,68,69].
In the future, fuel cells will be an integral part of the hydrogen fuel industry. Fuel cells are capable of supplying enough energy to meet the global energy needs. These technologies are very efficient and safe for the environment [67,68,69].
The main aim of the study was to analyze the possibilities of obtaining the RES independence by the Greater Poland Voivodeship. Achieving the goal consisted of determining the potential of energy for the selected NUTS 2 region, which was determined with the assumption of using only renewable sources. The claim of RES independence is an important factor to continue the process of introducing just and bottom-up coal region energy transformation opportunities.
In order to calculate the potential of renewable energy in the Greater Poland Voivodeship, the authors used GIS methods. Geographic information systems enable the spatial positioning of point, linear, and surface structures in relation to the potential of RES; these could respectively be geological boreholes, watercourses, or in the case of the surface, the total area of land excluded from a wind turbine location. As a result of including these structures into the coordinate system, it is possible to know the conditions of their positioning as well as of the surrounding area, such as the natural environment or technical infrastructure. In addition, the database and calculated parameters for each structure enable the measurement of the RES potential for the analyzed area.
The authors wanted to show that the selected region and, consequently, the entire country, in which energy is produced mainly from coal, has enough RES potential to cover 100% of its energy needs.
The authors used the geographical information system (GIS) method to calculate the technical potential of RES in the Greater Poland Voivodeship. For this purpose, meteorological data on wind speeds in the region were obtained. These data were extrapolated for a height of 100 m (this is the most common height of turbines in the voivodeship). We were the first to compare the technical potential of wind energy for the “10H” and “5H” distances (which will probably be introduced in Poland).
In the case of solar energy, both solar conditions and the availability of roofs were taken into account (roof installations do not take up space).
In the case of biomass, it was assumed that only waste biomass would be used for energy purposes. It was assumed that water power in the Voivodeship should develop in terms of the already existing dams, such as locks or weirs.
Geothermal energy in the Voivodeship should be based on the already existing boreholes (a map has been drawn up), primarily for heat production.
The conducted research is undoubtedly innovative in this sense. Implementation of the goal will allow for the assessment of the possibility of achieving the goals of the European Green Deal at the regional level, which can undoubtedly be translated into the possibility of achieving these goals both at the national level and at the EU level. The energy mix of renewable energy should be in the Greater Poland Voivodeship as well as in all of Poland; only in this way can 100% RES be achieved with the sustainable development of the economy.

2. Methodology—GIS in RES Research

GIS is increasingly used in RES sector research, including determining the potential of renewable energy. It allows you to calculate the potential of RES in a given region or country with great accuracy. Many papers have been published about using GIS for RES research over the last few years. The combination of a GIS and tools or multicriteria decision-making (MCDM) methods were used by Sánchez-Lozano et al. for performing an evaluation of the optimal placement of photovoltaic solar power plants in the area of Cartagena (Region of Murcia), Spain. An excellent analysis tool that allows for the creation of an extensive cartographic and alphanumeric database that will later be used by multi-criteria methodologies to solve problems simply and promote the use of multiple criteria is generated by the combination GIS-MCDM.
A suitable site selection for solar farms using GIS in the Karapinar region, Turkey was determined by Uyan [70]. The research showed that 15.38% (928.18 km2) of the study area had low suitability, 14.38% (867.83 km2) was moderately suitable, 15.98% (964.39 km2) as suitable, and 13.92% (840.07 km2) as the most suitable for solar farms.
Jahangiri et al. [71] showed that the eastern, central, and southwestern parts of Iran, the south of Oman, almost all parts of Iraq and Yemen, some northern and eastern parts of Egypt, the south of Jordan and Israel, as well as a small region in the southeast of Turkey are particularly ideal for setting up solar–wind power stations.
As far as Poland is concerned, there have not been many scientific studies so far in which the RES potential has been calculated using the GIS method. Sliz-Szkliniarz and Vogt [72] calculated the wind energy and biogas potential in the Kuyavian–Pomeranian Voivodeship. The application of a GIS-based approach showed that the Kuyavian–Pomeranian Voivodeship could be used for wind energy production to a great extent because the major technical potential remains untapped. By excluding the infrastructural and ecological-related barriers, the area of almost 7500 km2 remains suitable for wind collection. The potential for biogas production could meet the demand of 442 GWh of heat, 368 GWh of electricity, or 98 Mm3 of methane, based on the assumed biogas feedstock mix [73].
Rozakis et al. [74] determined the straw potential of Poland using the GIS method. In the article, the actual production of straw was modeled on a scale of local districts as well as the needs of its local use and the possibility of the redistribution of excessive quantities to regions with a deficit of straw based on statistical data from the Polish Central Statistical Office. The results showed that the straw surplus should be used in the energy sector along with its geographical distribution. The detailed results at the municipal level indicated an excess capacity for biomass co-firing by the plant and areas to be fulfilled by additional biomass sources, such as biomass from energy plantations and forests.
The current 100% RES solution in Portugal is in favor of wind and hydro energy [67]. Wind power should be introduced by the use of large reversible or pumped hydropower plants and could be achieved by installing bigger wind turbines and storage systems. It has become possible to combine these storage systems with a transport system. Hydrogen and batteries could become a storage solution for large future systems once the technology progresses [75].
In the paper by [76], a 100% RES system for Macedonia in the year 2050 was designed. The results of the analyses showed that a 100% renewable energy system in Macedonia is possible. However, to achieve this goal, a large share of biomass, solar power, and wind power, as well as different storage technologies are needed. The analysis showed that at the moment, half of the renewable energy system seems much more likely than a 100% renewable energy system. With the additional energy efficiency steps, which will lead to a decrease in consumption, and with the installation of new generation capacities, the achievement of this goal is possible.
For this article, the technical potential of wind energy, solar energy, biomass, hydropower, and geothermal energy in the Greater Poland Voivodeship was calculated. The authors wanted to know if the RES technical potential, counted with the use of the GIS method, will allow for 100% coverage of the energy needs of the Greater Poland Voivodship. More attention was devoted to wind energy, because the distance law, which inhibited the development of wind energy in Poland, was in force. In analyzing the aforementioned articles, one can draw the conclusion that in almost every country, there are good conditions for the development of one, and most often several, renewable energy sectors. In addition, in Poland, many regions can cover their energy needs only from RES.

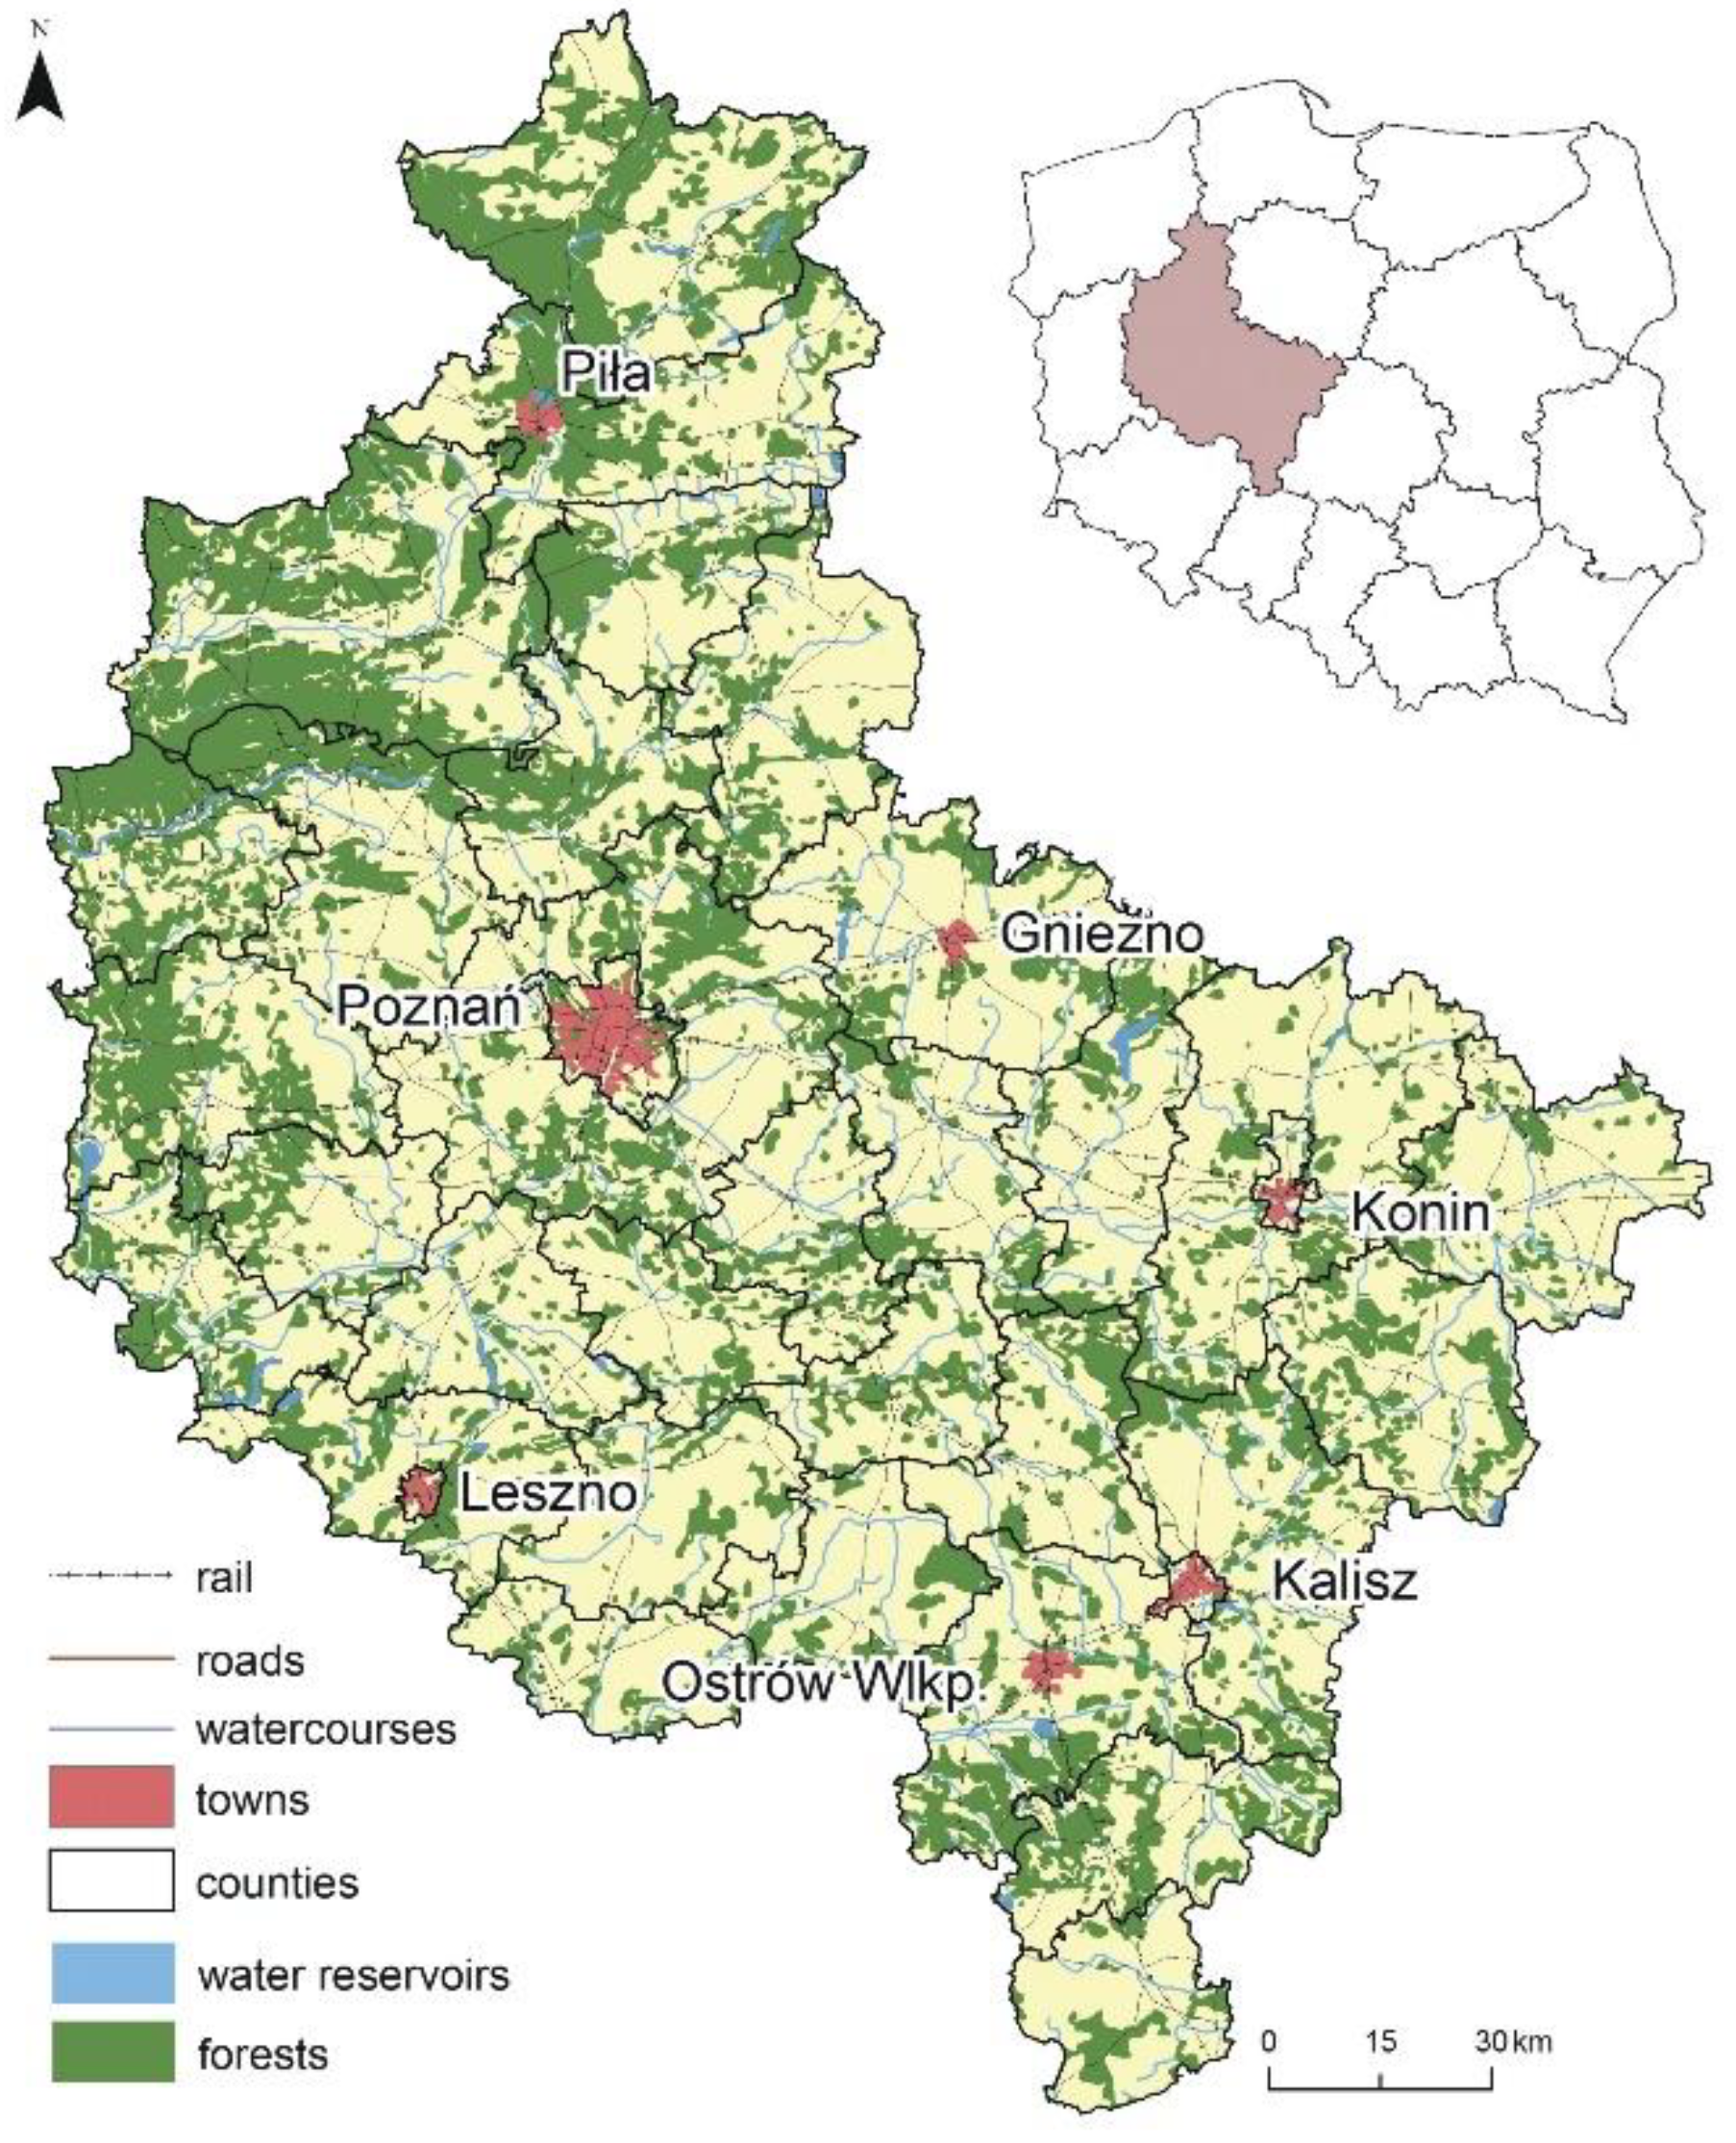
3. The Description of the Greater Poland Voivodeship

The Greater Poland Voivodeship is located in the central-western part of Poland, with Poznań being its capital city (Figure 2). The surface area of the voivodeship region is 29,826 km2 (second largest in the country after the Mazowieckie Voivodeship), which is equal to 9.53% of Poland’s area. The number of inhabitants of the Greater Poland Voivodeship is 3.47 million people. In terms of land management, the area of the Greater Poland Voivodeship is dominated by arable lands, which make up 65.4% of the area, whilst forests make up 25.7% [45].
The climate of the Greater Poland Voivodeship belongs to the temperate climate zone, where oceanic and continental influences converge. Despite a highly developed river network and an abundance of lakes, the voivodeship has limited water resources. This results from a low amount of atmospheric precipitation (the annual precipitation is from 480 mm to 600 mm), as well as insufficient investments into anthropogenic retention. The hydrological situation is worsened by open-cast brown coal mining. Water shortages in the Greater Poland Voivodeship are estimated at about 350 million m3 [45].
The dominant types of soil in the Greater Poland Voivodeship include podzolic and rusty soils, which make up 60% of the area, as well as lessive and brown soils at 20%. The remaining types are mainly wetland soil (pseudogley soils, gley-podzolic soils, half-bog peat soils, alluvial soils). The Greater Poland Voivodeship farmers boast the highest agricultural output, both market and global, in the country. The region comes second in terms of global and market plant production and first in terms of global and market animal production. The agriculture of the Greater Poland Voivodeship takes a dominant position when it comes to slaughter animal production, accounting for 22% of the whole country, of which pork production reaches nearly 26% whilst that of beef is 18.5%. The region also produces the highest amount of grain and sugar beet as well as a significant amount of rapeseed. In addition, the area covered by ground vegetable crops is higher than the domestic average (Figure 2) [45].

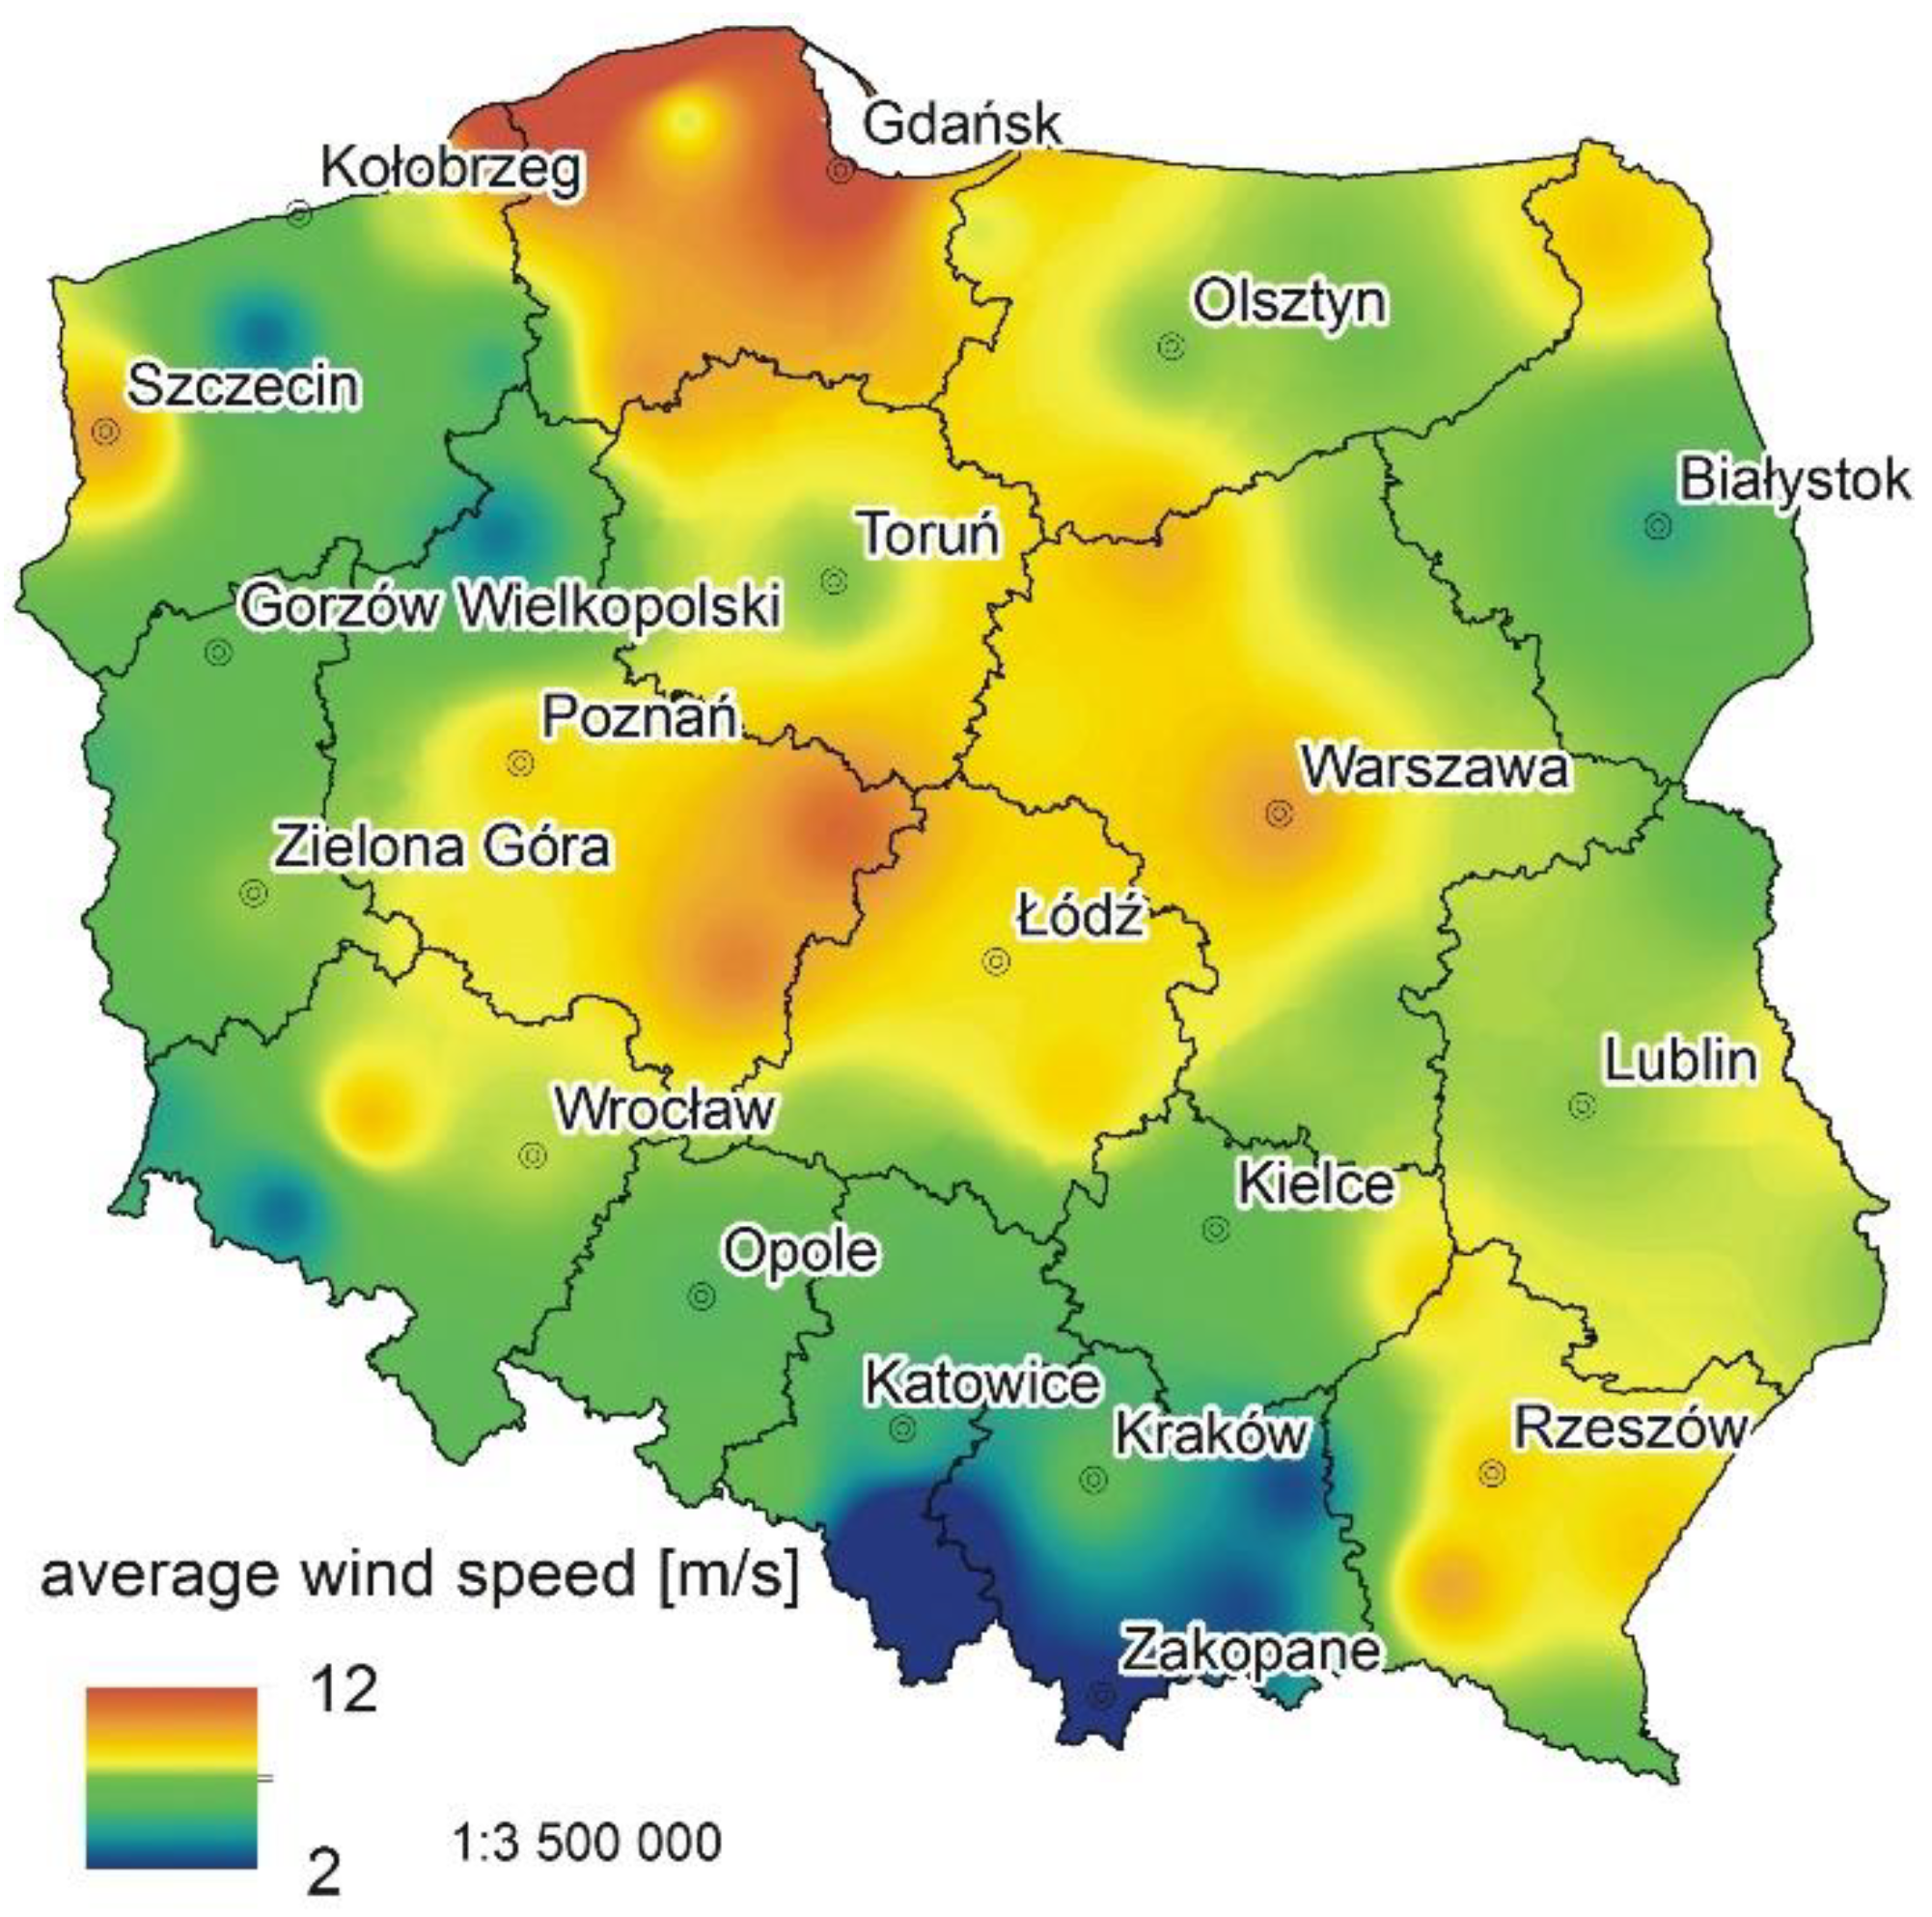
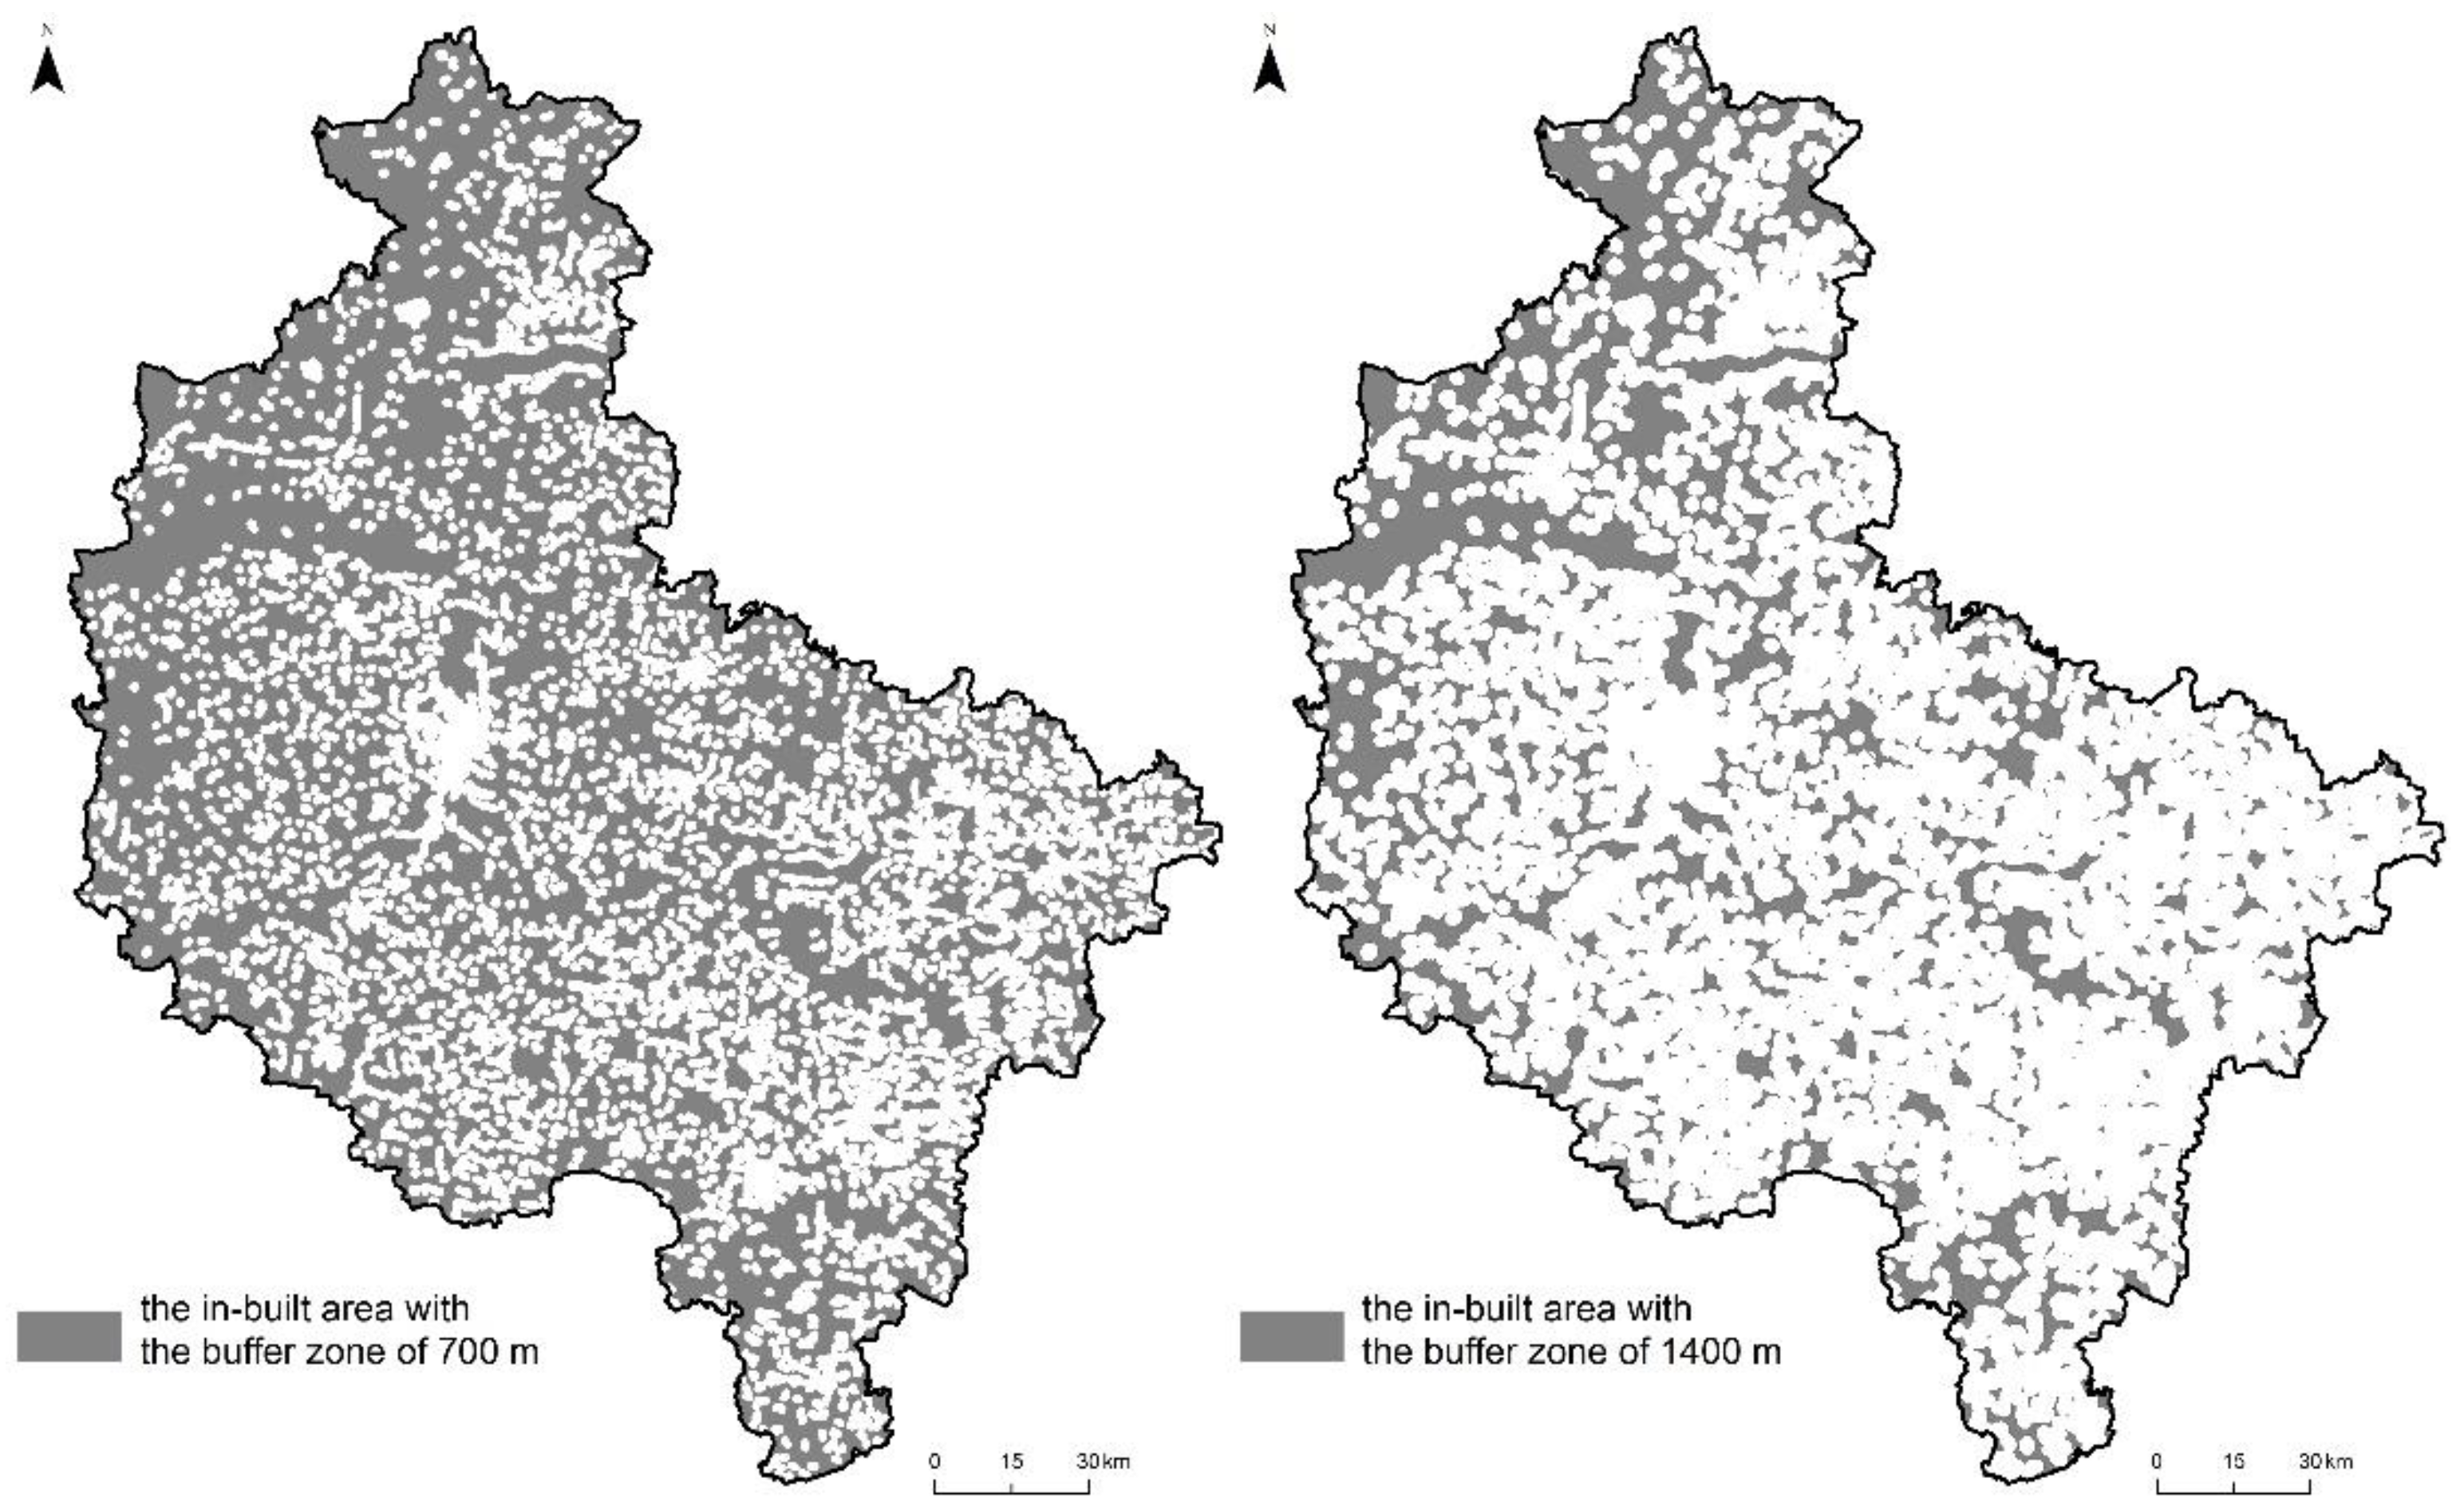
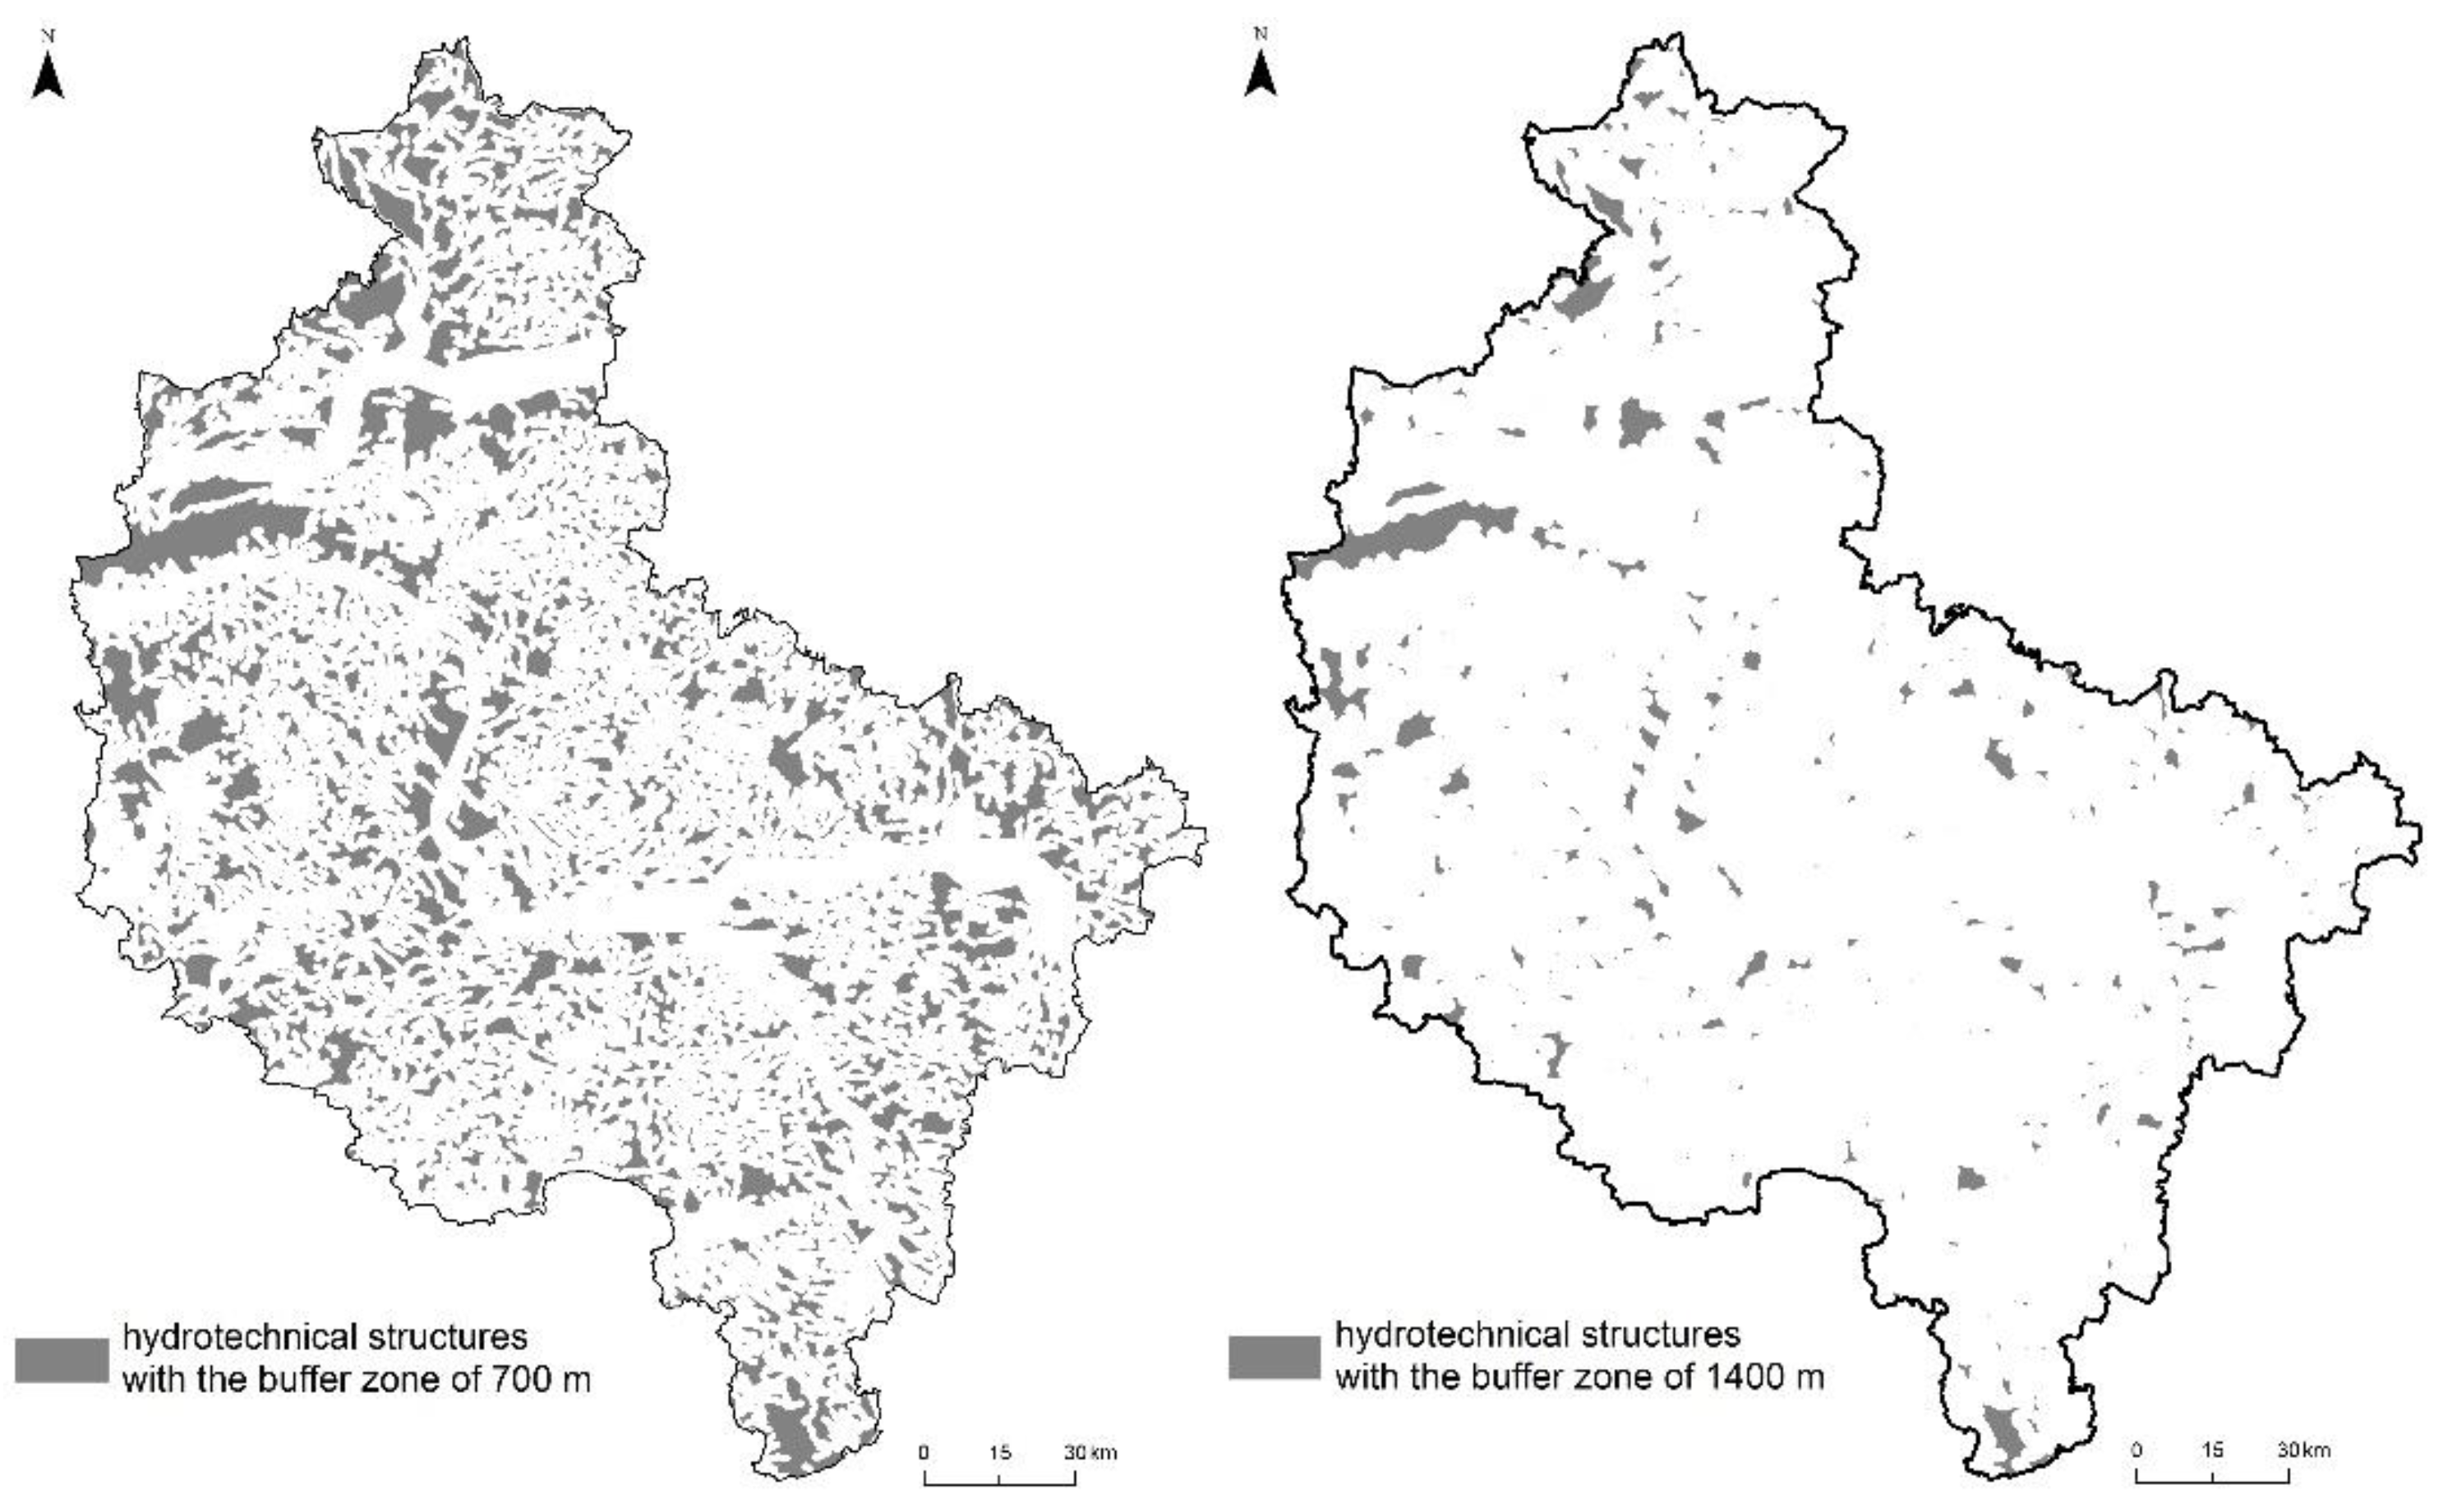
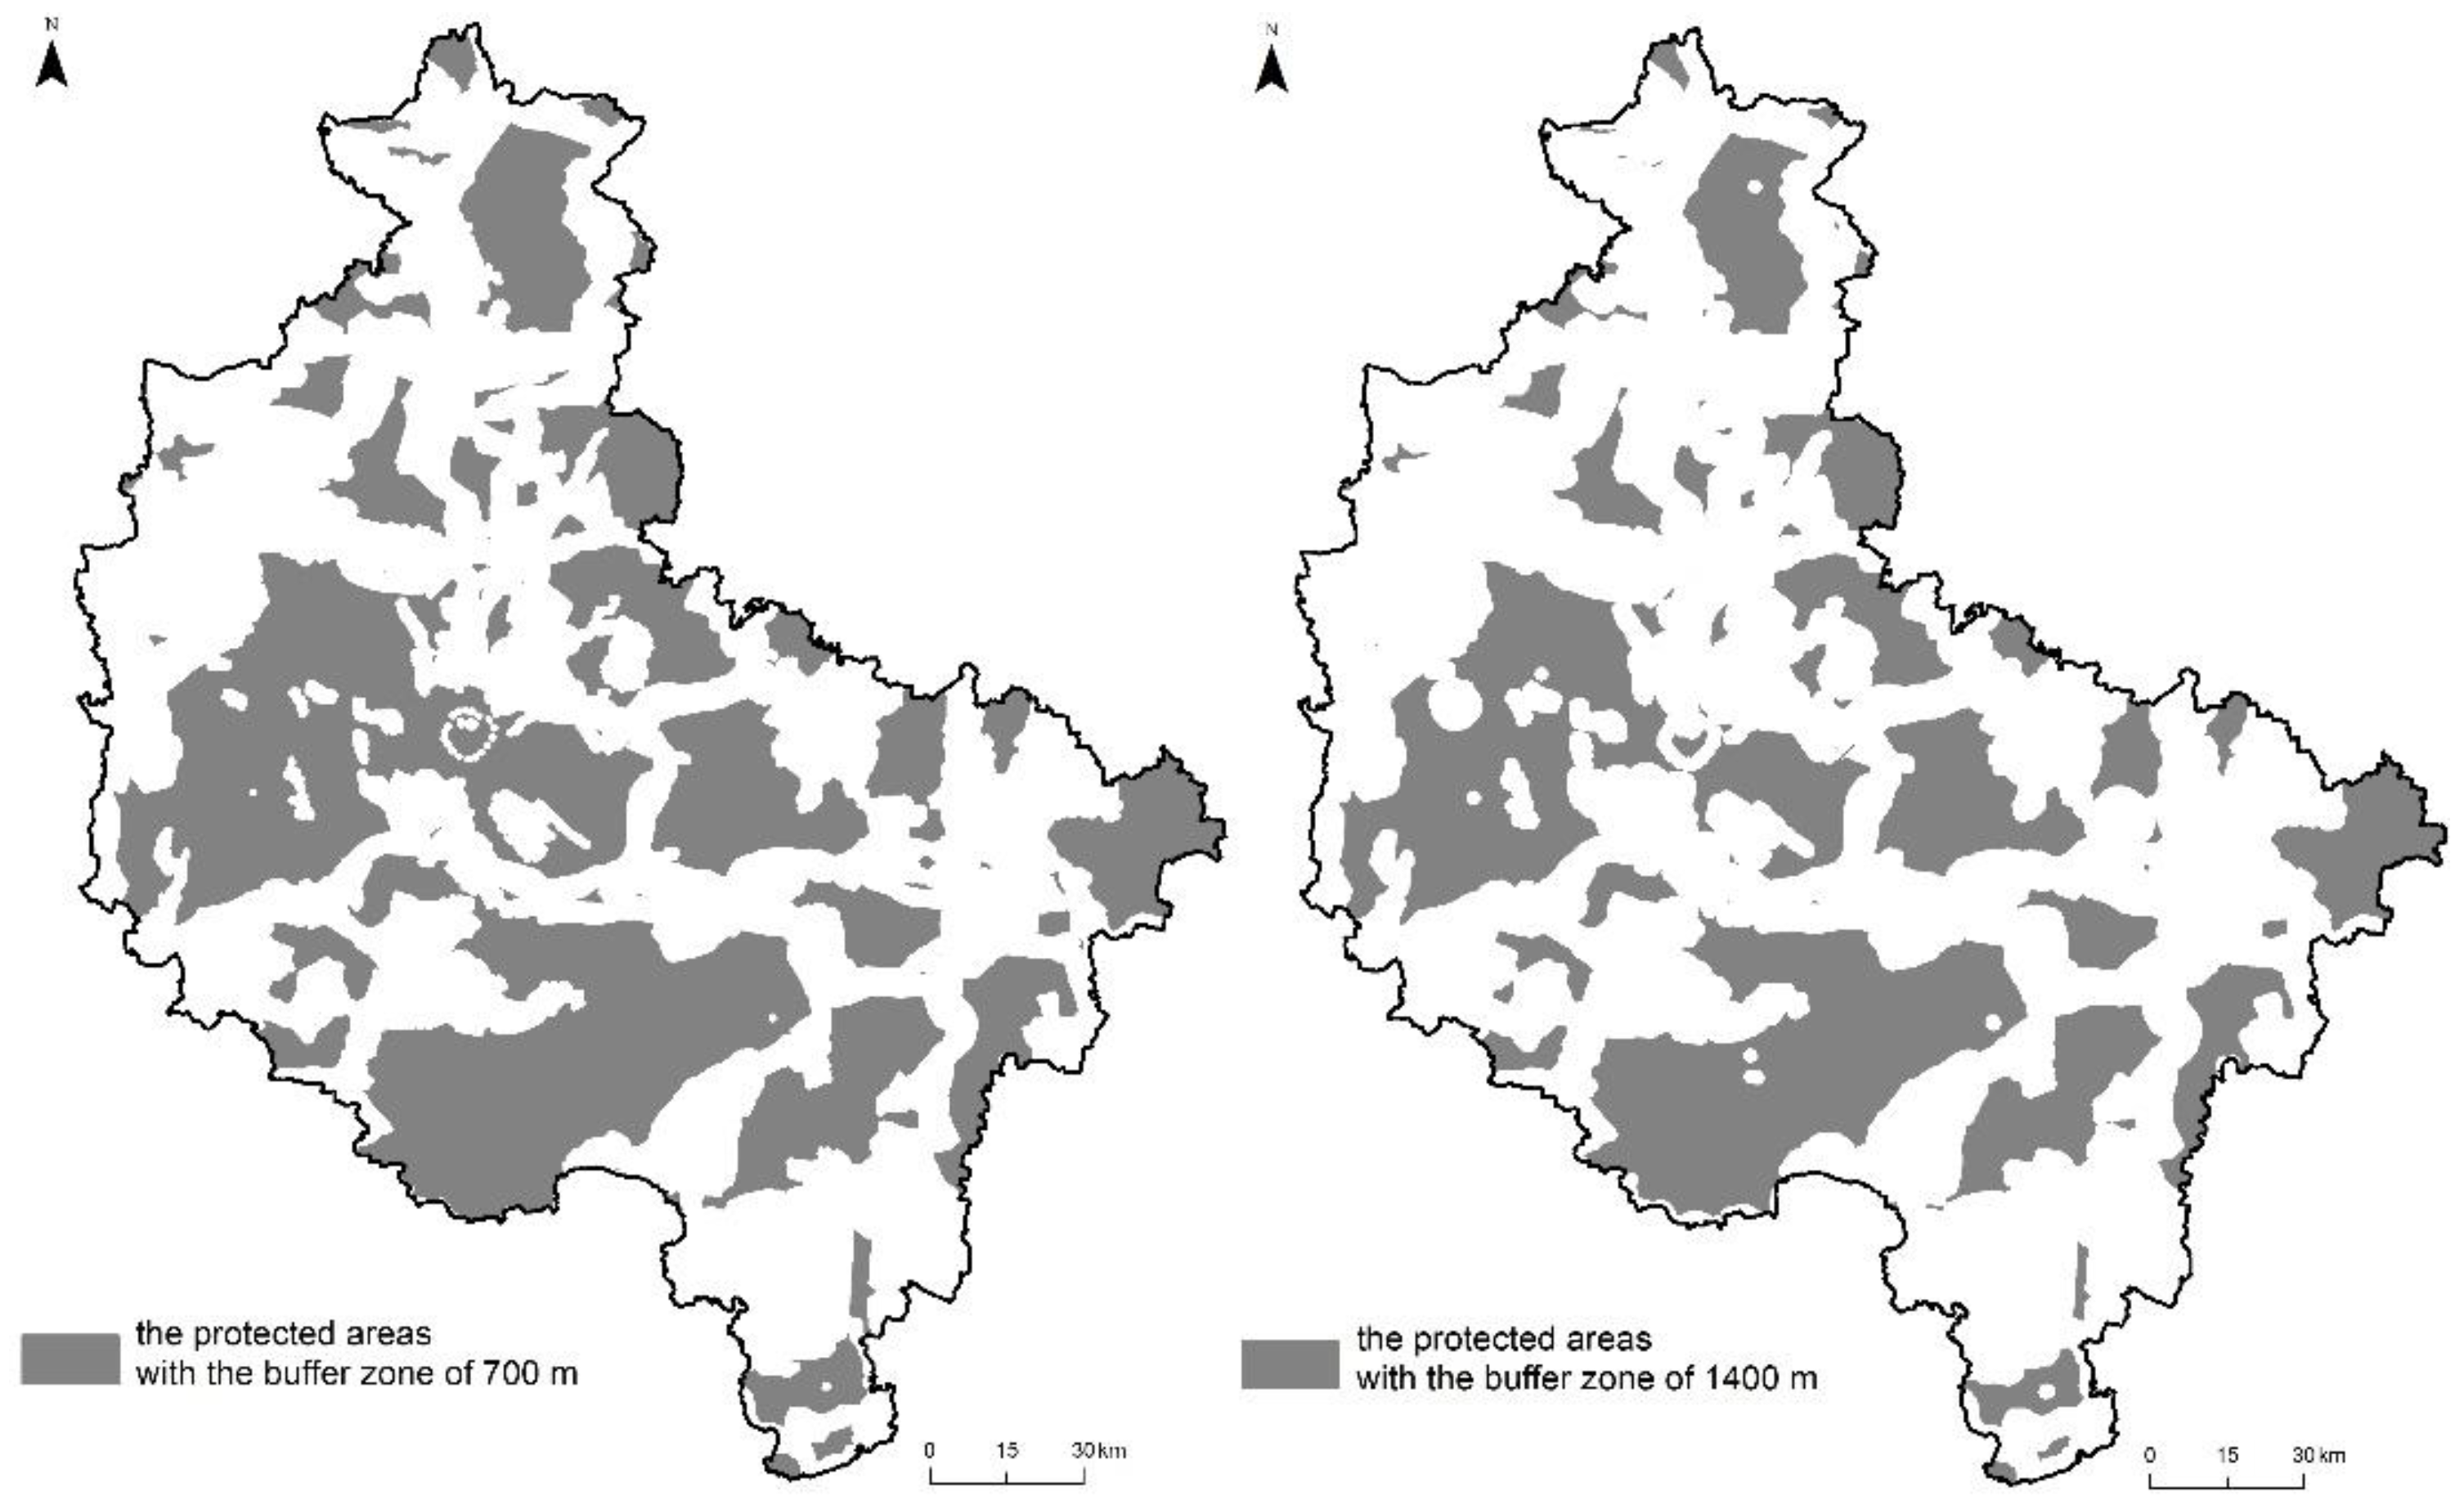
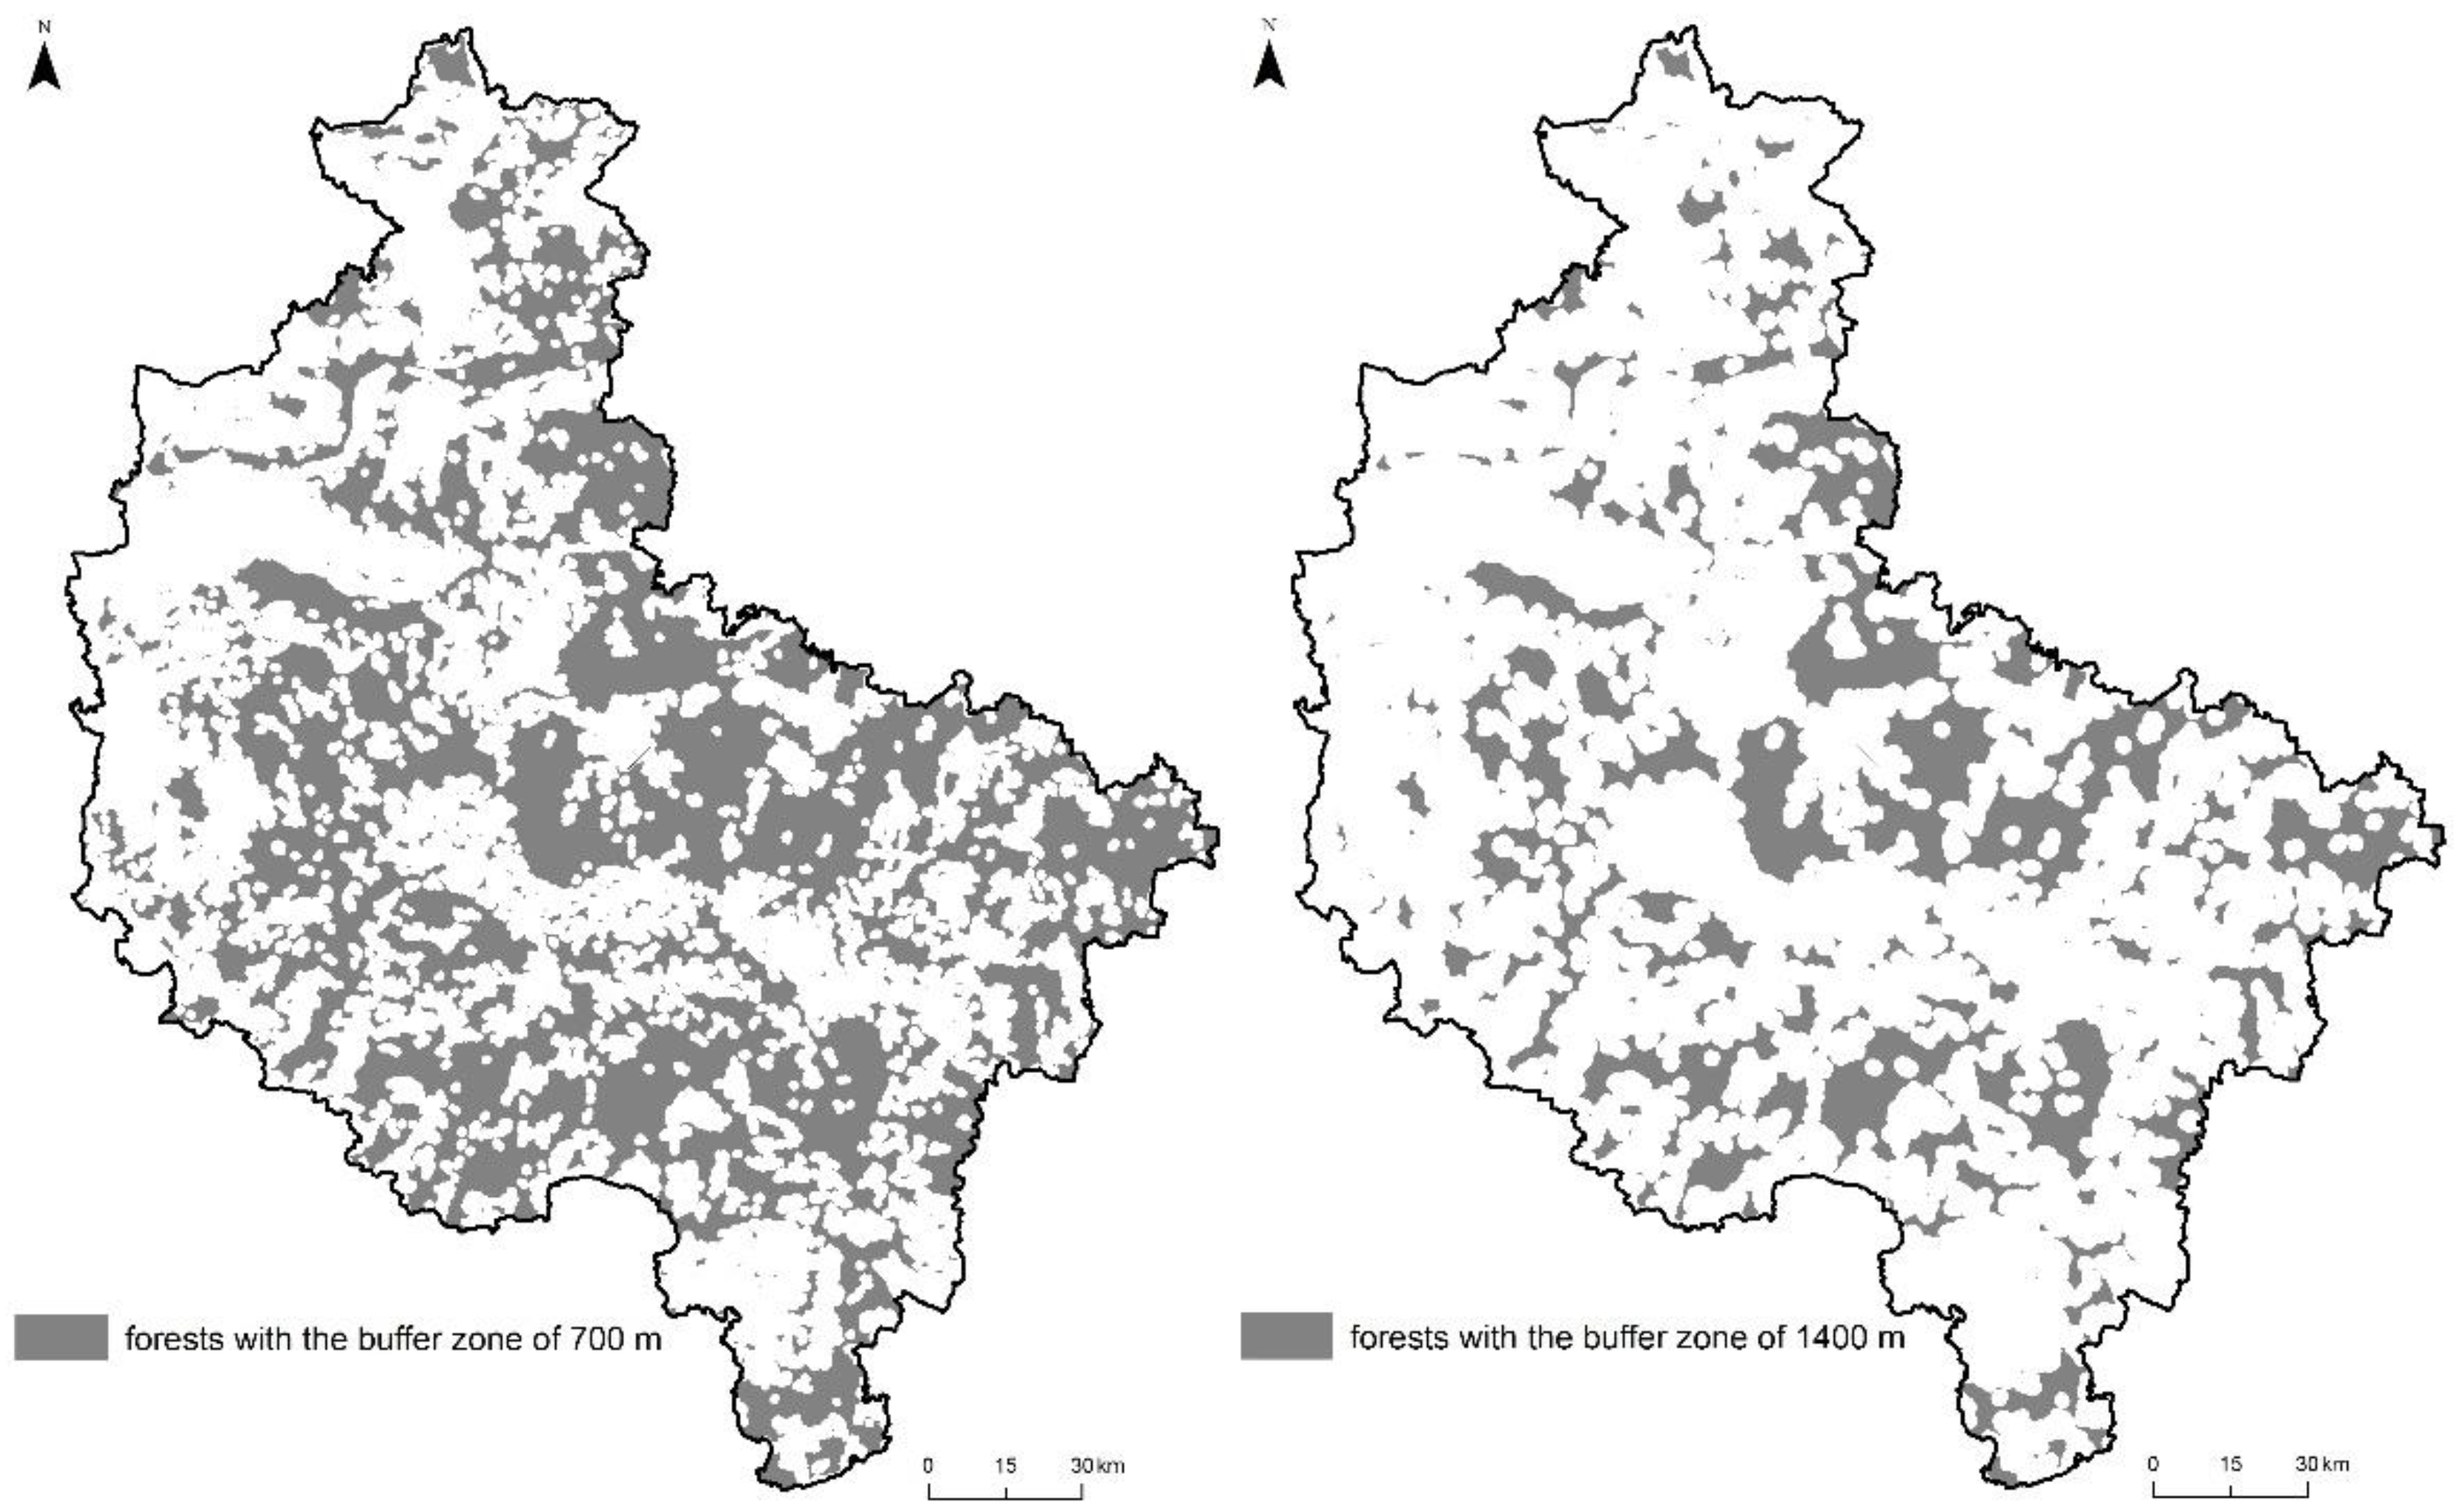
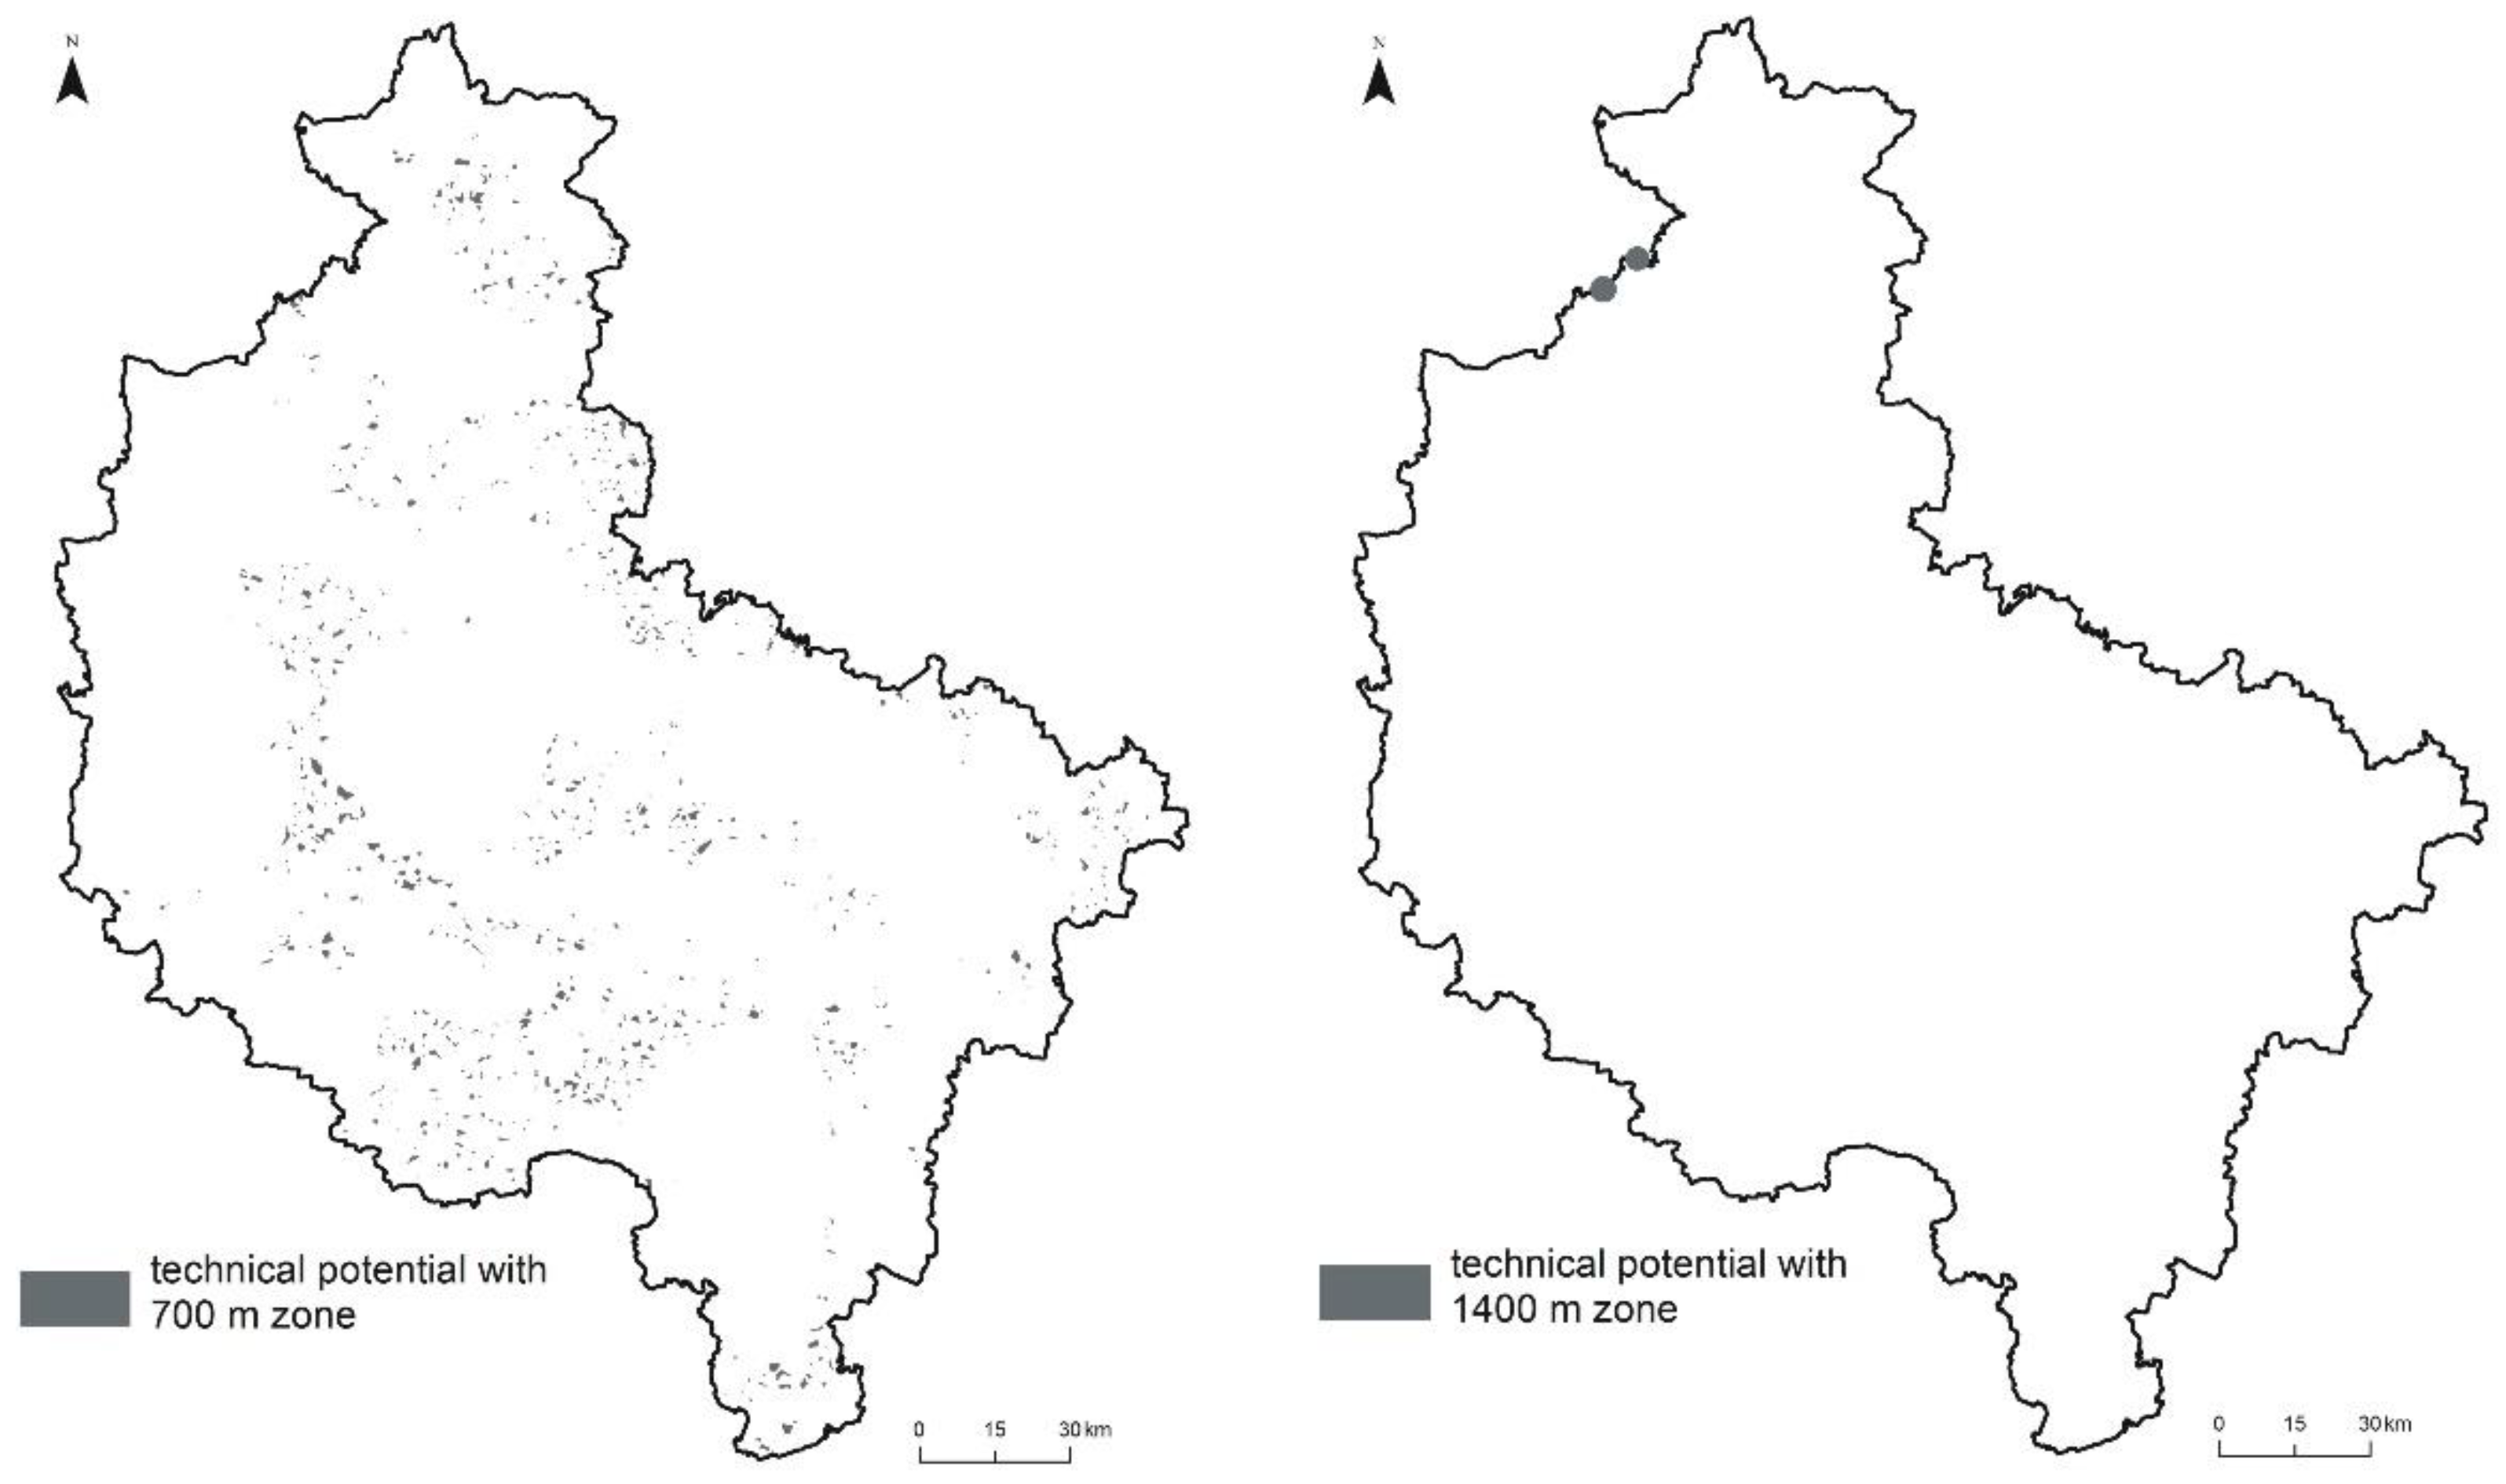
4. Wind Energy Potential in the Greater Poland Voivodeship

In order to calculate the wind speed in the Greater Poland Voivodeship, the so-called inverse distance interpolation of data provided by the Institute of Meteorology and Water Management in Warsaw was carried out using the mean monthly wind speed and the mean monthly wind directions (8 directions) from years 1990–2014. The obtained mean wind speed values at the basic height, that is, 10 m (vp), were used to calculate mean wind speed values at the height of a rotor, that is, 100 m (v1), according to the following formula:
v1 = vp(h/ho)k
where v1 is the mean wind speed at a height of 100 m (m/s), vp is the mean wind speed at a height of 10 m (m/s), h is the height of the rotor (in this case, 100 m), ho is the basic height (in this case, 10 m), k is the exponent, k = 0.14–0.30 [53], and was assumed to be 0.22.
Substituting
v1 = vp(100/10)0.22 = 1.66 vp
The obtained results are displayed graphically in Figure 3. When analyzing Figure 3, it can be concluded that the best conditions for locating wind turbines in the Greater Poland Voivodeship region are in the southeast whilst the worst are in the west.
According to the current regulations (the Wind Energy Investments Act, 2016), wind turbines in Poland must be placed away from other structures at a distance of 10 times (10h) their height (including the blades). Assuming the height is 140 m, the buffer will be 1400 m. Work is currently underway on the amendment of the RES Act; the “distance act” is to be amended, so a buffer of 700 m (5h) was also adopted in our calculations.
In the Greater Poland Voivodeship, the built-up area, along with the buffer zone of 700 m, reaches 16,655 km2 (Figure 4) and 6609 km2 for a buffer zone of 1400 m.
The area of the Greater Poland Voivodeship covered by flood plain areas is 6350 km2 for a buffer zone of 700 m and 1260 km2 for a buffer zone of 1400 m (Figure 5).
The area of the Greater Poland Voivodeship covered by protected areas together with a buffer zone of 700 m is 12,910 km2, and with a buffer zone of 1400 m, is 10,397 km2 (Figure 6).
The area of the Greater Poland Voivodeship covered by forest with a buffer zone of 700 m is 12,012 km2, and it is 6394 km2 for a buffer zone of 1400 m (Figure 7).
In total, the available terrain for wind energy for a buffer zone of 700 m is 210 km2 and for a buffer zone of 1400 m, only 2 km2 (Figure 8).
The area of the Greater Poland Voivodeship that could be technically designated for the construction of wind turbines is 210 km2 (buffer zone of 700 m). It was assumed that the operating wind turbines will have a diameter r = 50 m. In order to ensure that turbines do not interfere with one another, it was assumed that the distance between the turbines should be 5r, whilst in the direction towards the wind, it should be 8r. It was assumed that the wind turbines will be positioned in a network of rectangles, and each of the rectangles will have the dimensions 5r × 8r. The area taken up by one wind turbine is 100,000 m2 (0.1 km2). Therefore, in an area of 377 km2, it is technically possible to position 2100 wind turbines. This means that the technical potential of the wind power sector in the Greater Poland Voivodeship is 4.2 GW. It was assumed that the amount of energy generated by one 2 MW wind turbine is 4.2 GWh. Thus, the total amount of electricity is 8,5 TWh, which is 65% of the electricity currently used in the Greater Poland Voivodeship [77].

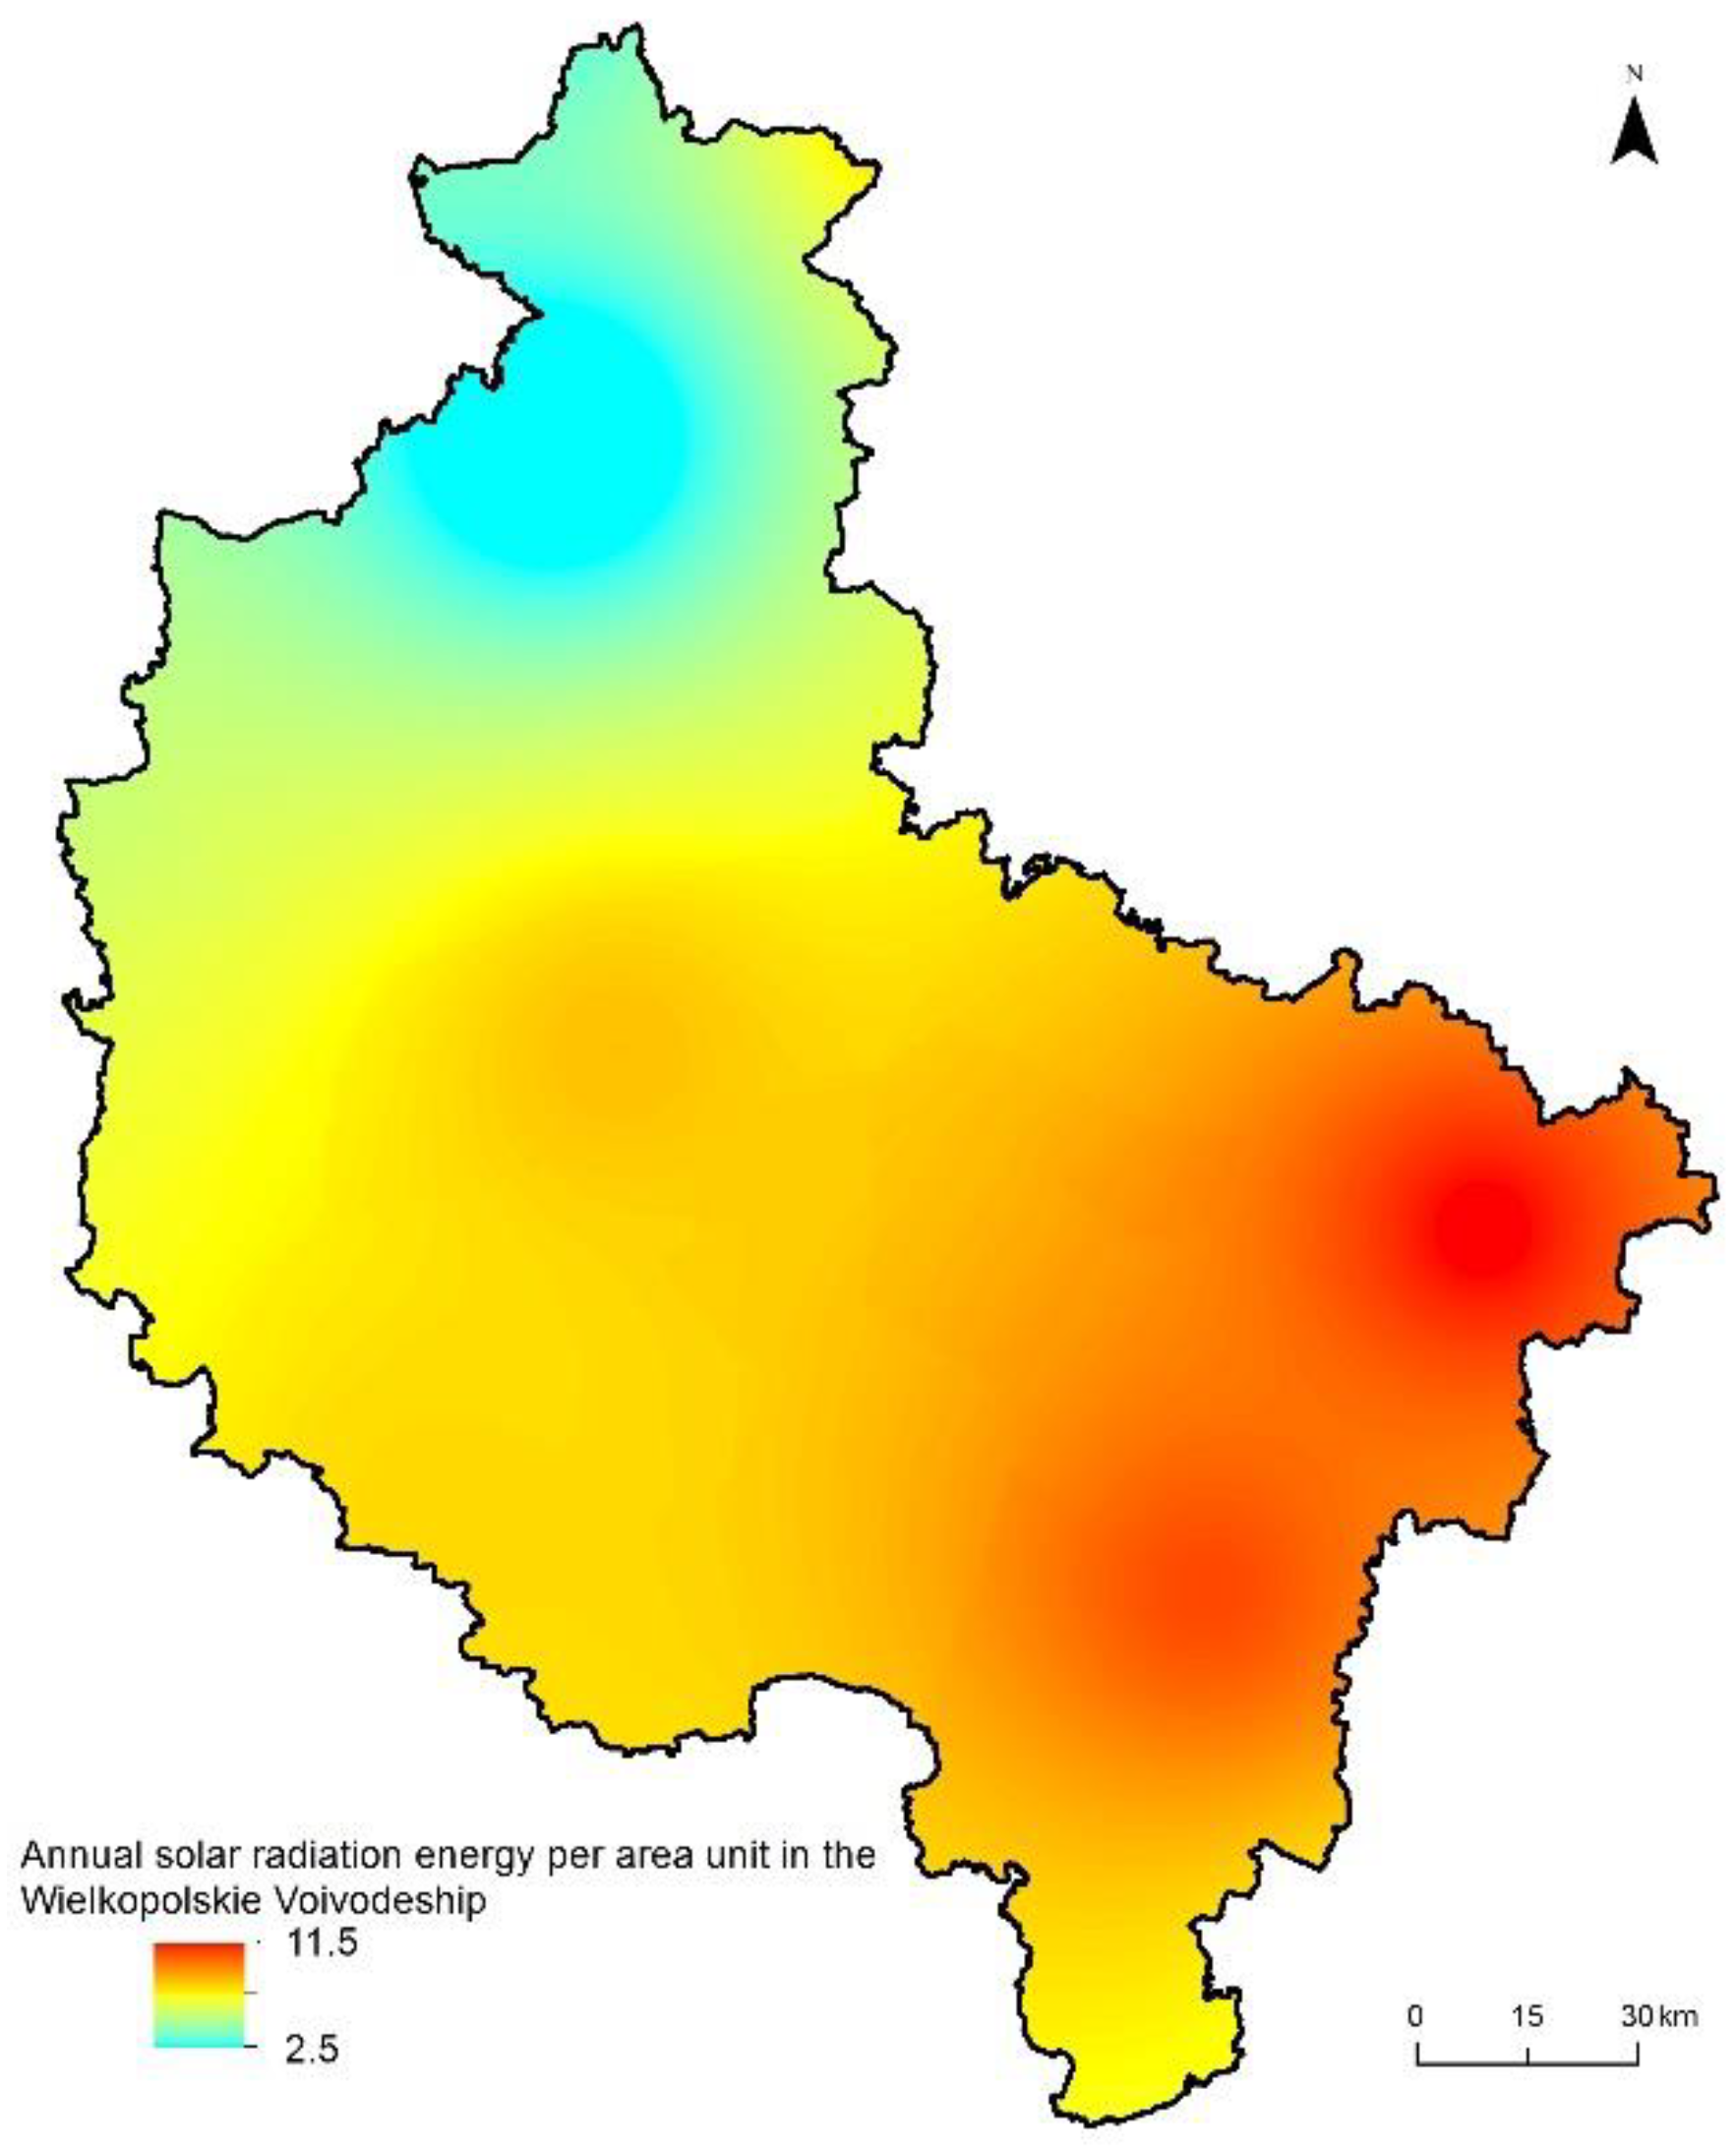
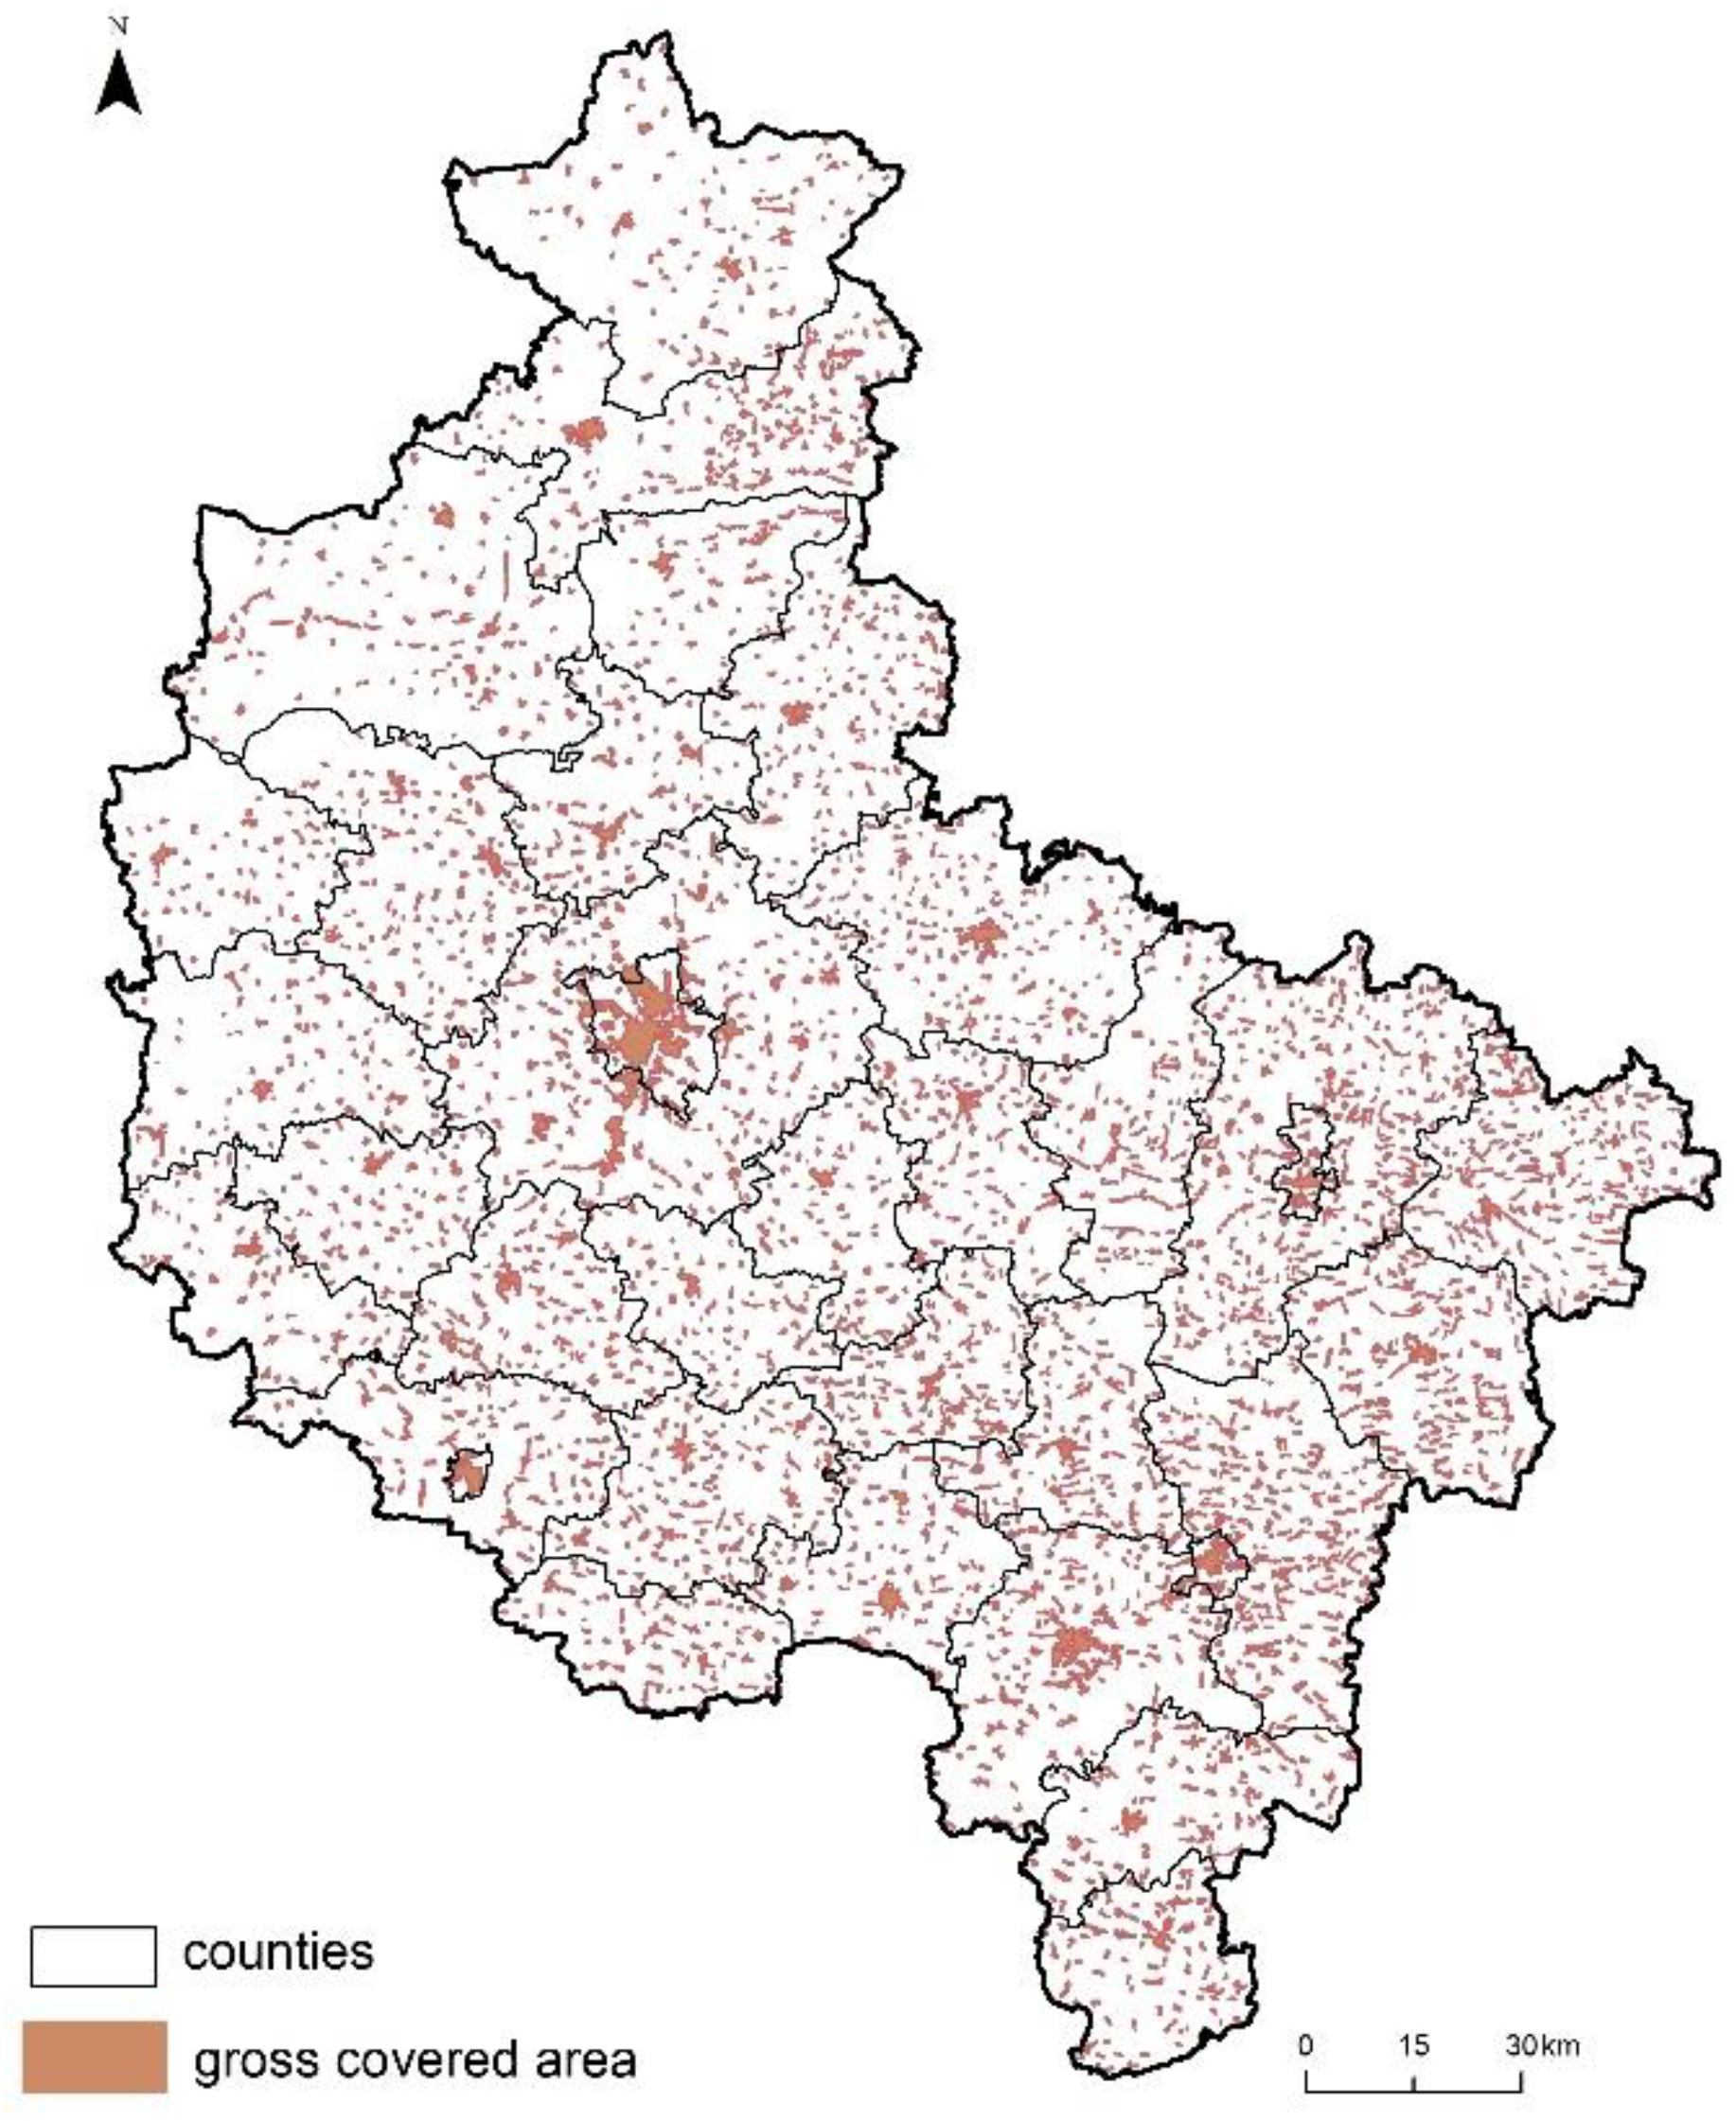
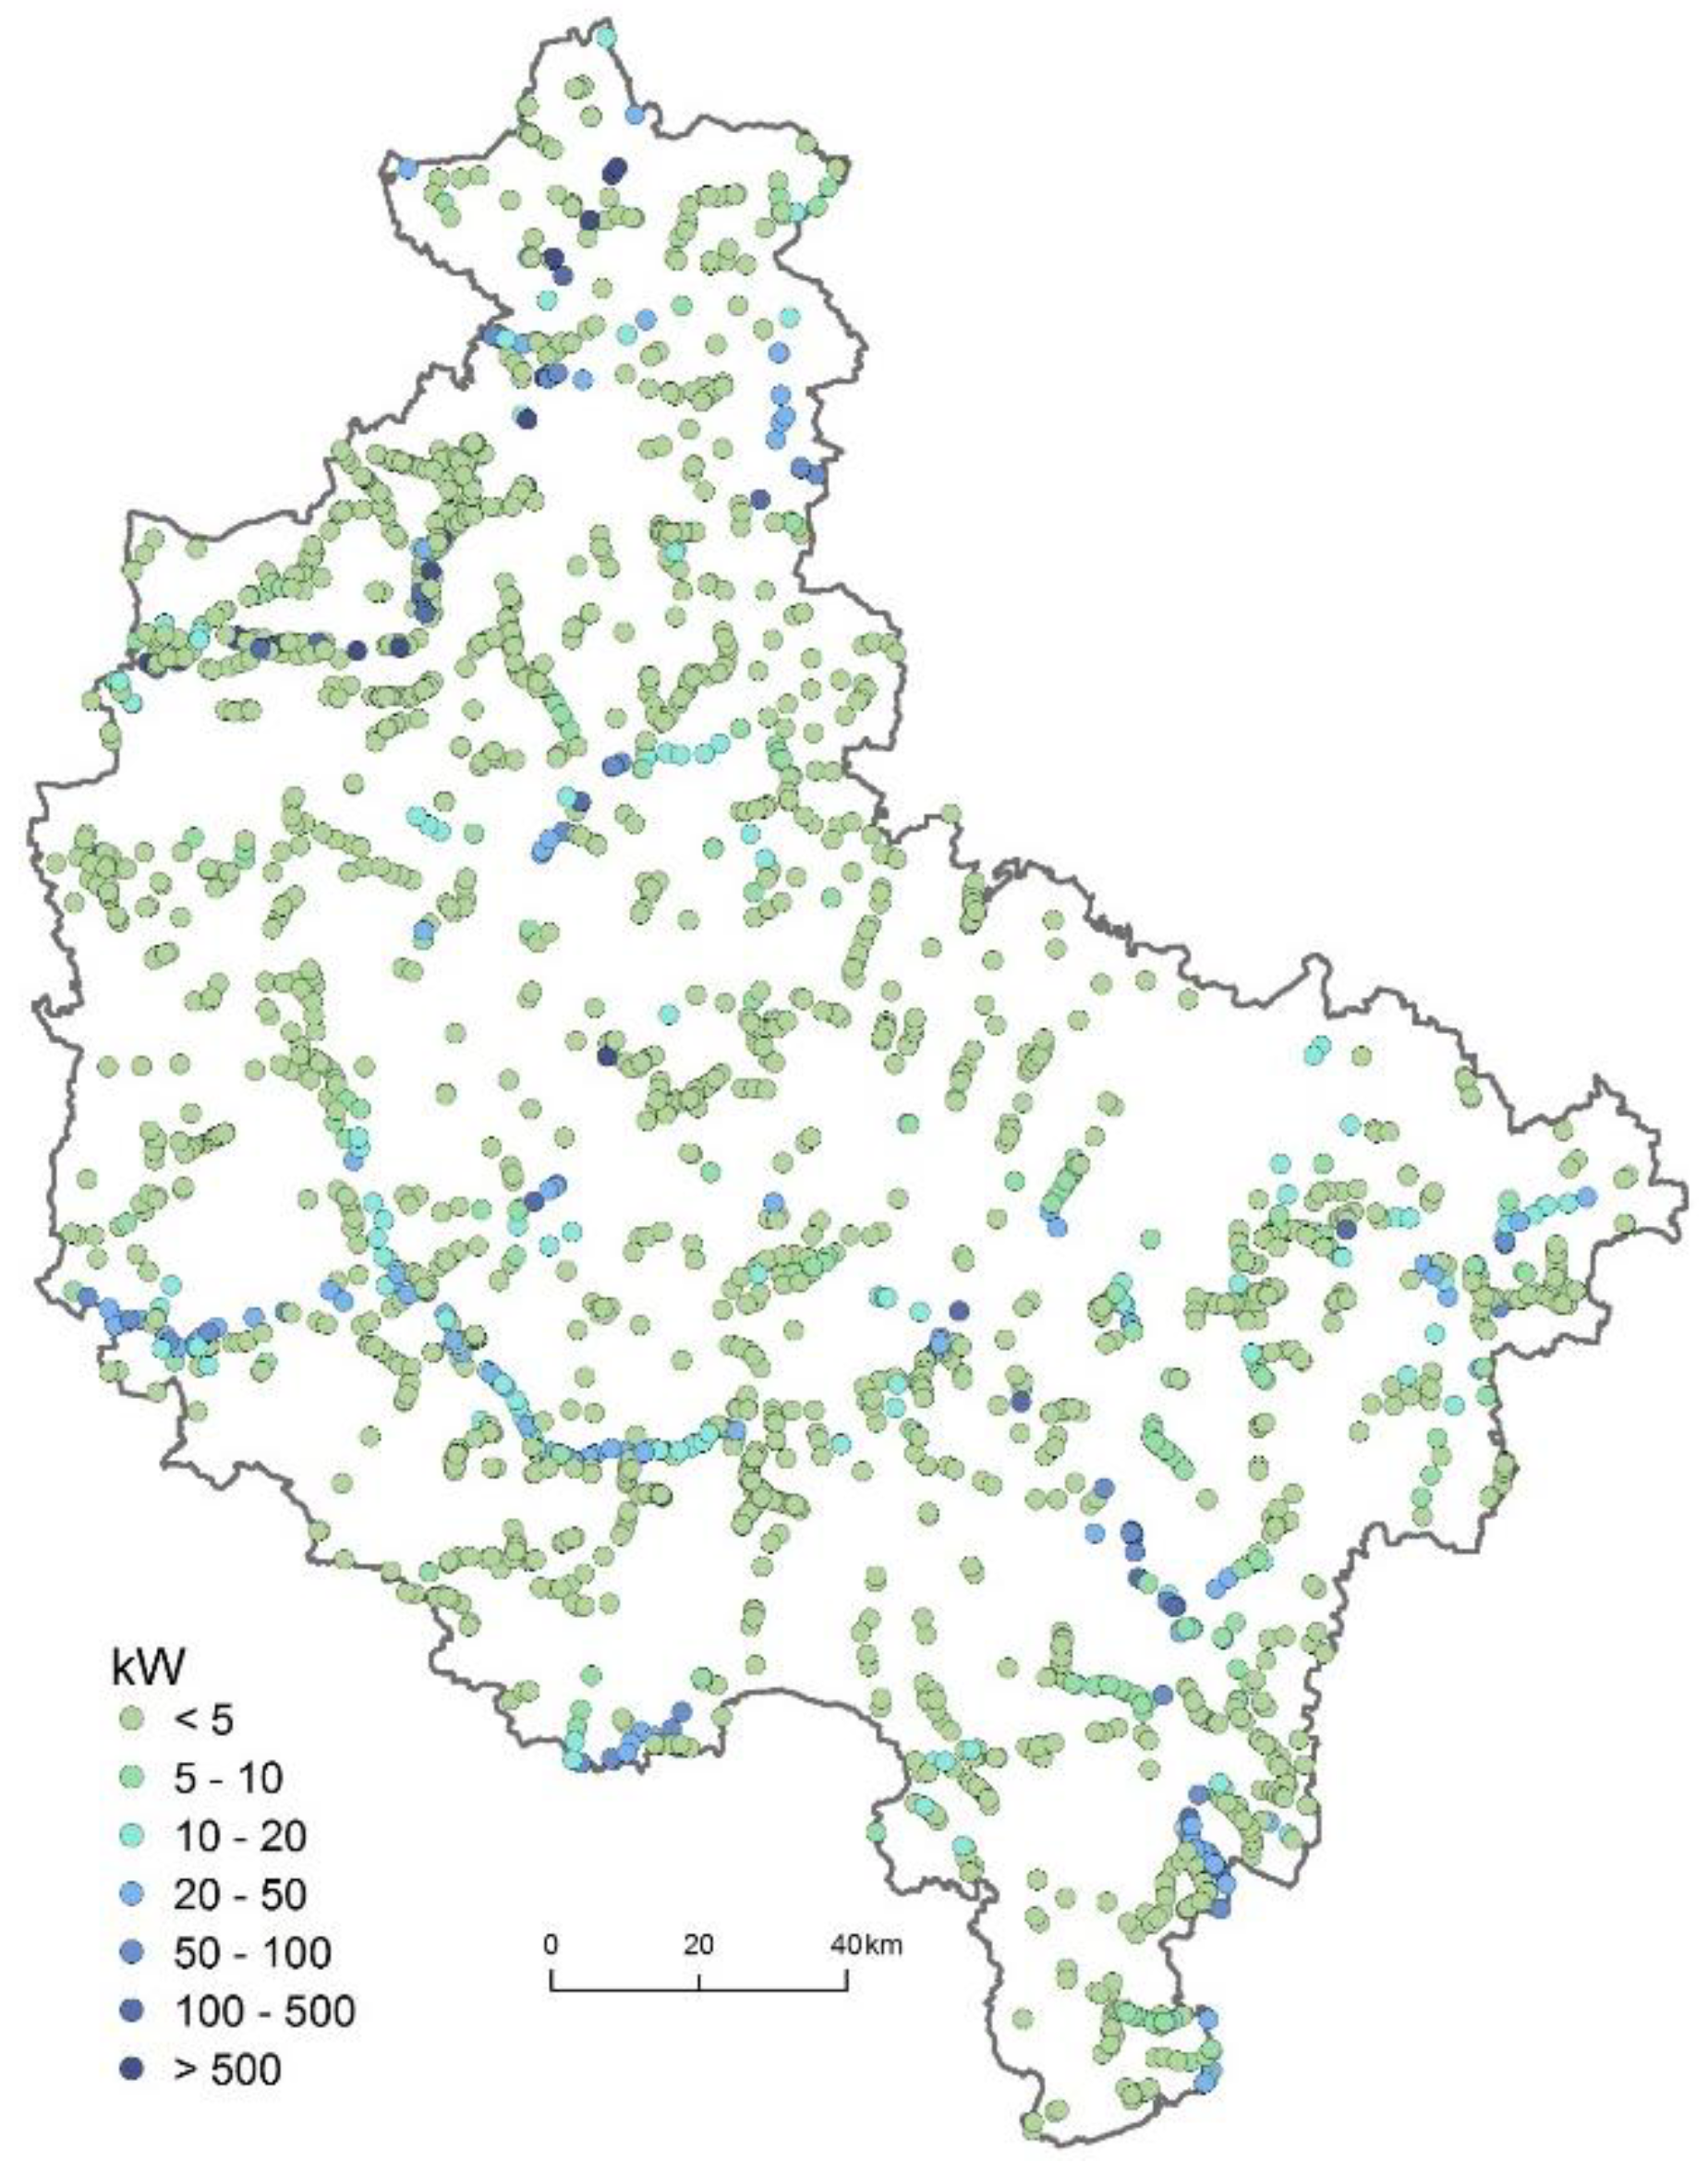
5. Solar Energy Potential in the Greater Poland Voivodeship

The annual solar radiation energy per area unit on a horizontal plane in Poland reaches between 950 and 1250 kWh/m2, whilst in the Greater Poland Voivodeship, it reaches about 1050–1150 kWh/m2 (Figure 9). About 80% of this value is generated during the six months of the spring and summer seasons (April–September) [78,79]. It needs to be mentioned that solar operation in the summer is prolonged up to 16 h per 24-h period, whilst in winter, it shortens down to 8 h per 24-h period [79,80,81].
The annual values of insolation in the Greater Poland Voivodeship vary from 1250 h in years with the highest cloud cover to 2000 h in the sunniest years. The long-term mean is 1600 h, which is similar to the long-term mean of insolation for all of Poland [77]. The analysis of variations in annual insolation carried out for Poznań over a 25-year period, 1990–2014, indicates that the insolation value has been regularly increasing by 11 h/year, on average.
Photovoltaic panels can be installed in many places where they take up a relatively small space or where typical economic activity cannot be undertaken (e.g., around airports) [77]. In the Greater Poland Voivodeship, such places could be the roofs of buildings, closed waste site grounds, and post-industrial wasteland. In our investigation, we assumed that 5% of the roofs of buildings could be designated for photovoltaic panels and 2% of the roofs could be used for solar collectors. The gross covered area in the Greater Poland Voivodeship is 1648 km2 (Figure 10) [77].
In addition, if we assume that the roof area of a typical building is approximately equal to the gross covered area—that is, according to the Polish Standard [77], the area of the vertical projection of the building in a completion state, determined by projecting onto the area surface all of its external walls (in reality, it could be slightly larger, as roofs are often sloping and not horizontal)—then the available areas for photovoltaic panels and collectors in the Greater Poland Voivodeship are 82.4 km2 and 33.0 km2, respectively. Based on the data [75], it can be assumed that from 1 m2, at least 120 kWh of electric power could be generated per year; thus, the total amount of electric power would be 9.84 TWh. The amount of heat obtained from 1 m2 of a collector was assumed to be at the level of 650 kWh annually, which, combined with the whole area of the Greater Poland Voivodeship, amounts to 21.45 PJ.

6. The Biomass Energy Potential in the Greater Poland Voivodeship

6.1. The Technical Potential of Waste Wood

The Greater Poland Voivodeship is known as “the breadbasket of Poland”. This Voivodeship region is where a significant part of food production takes place. Agricultural production generates considerable amounts of waste, which, together with forest waste, could be used to generate energy [82]. Forestation in the Greater Poland Voivodeship is 25.7% and lower than the average for Poland, which is 29.4% [73]. If we assume that 15% of wood obtained directly from forests could be used for energy purposes (parts of bark, slash, and more coarse waste wood generated during logging), then 450,000 m3 of waste wood per year could be obtained in the Greater Poland Voivodeship.
Significant amounts of waste [83] and used timber would be at least the same as the amount of waste wood obtained from forests, that is, 450,000 m3 (technical potential). In total, the amount of waste forest biomass for energy purposes can be estimated to be 900,000 m3 per year. If we assume that 1 m3 of wood weighs 600 kg, then the weight of waste wood would be 540,000 tons per year.
The area covered by orchards in the Greater Poland Voivodeship is 16,400 ha [82]. The timber from orchards is obtained from both felling and maintenance work. As a result of the felling of orchards, it is technically possible to obtain about 80 tons of biomass per 1 ha in the case of older plantations (about 30 years old) and about 60 tons/ha in the case of modern dwarf plantations (about 15 years old). The amount of biomass created during maintenance work varies depending on the variety and age of the trees, from 4 to 10 tons/ha [64]. Assuming that due to the felling of orchards, 3.5 tons of biomass can be obtained per 1 ha per year, and that as a result of maintenance work, 7 tons of biomass is created per 1 ha per year, then it is possible to obtain 125,000 tons of waste biomass from orchards in the Greater Poland Voivodeship. In total, the waste wood in the Greater Poland Voivodeship amounts to 600,000 tons per year (technical potential).

6.2. The Technical Potential of Straw and Hay from Unused Meadows, Pastures, and Energy Crops

In 2020, the Greater Poland Voivodeship produced about 770,000 tons of wheat straw, 310,000 tons of rye straw, 180,000 tons of barley straw, 330,000 tons of oats straw, and 50,000 tons of triticale straw [77]. The total amount of straw is 1,640,000 tons. Assuming that the technical potential of straw is 30%, then 492,000 tons of straw could be used for energy purposes. In the Greater Poland Voivodeship, there are 234,500 ha of meadows and 17,400 ha of pastures. The amount of hay harvested from meadows amounts to 4.9 tons per 1 ha/year, whilst from pastures, this amount is 3.6 tons per 1 ha/year [83]. Assuming that the technical potential of hay from meadows and pastures that could be used is 30%, then the amount of hay that could be used for energy purposes is 367,000 tons per year.
In the Greater Poland Voivodeship, there are 33,000 ha of fallow land and 36,000 ha of idle land [83]. These areas could be cultivated or reclaimed using energy crops. Our plant of choice is the common osier, which has been described in previous papers. This plant is used for both energy production and land reclamation. It could be assumed that it is viable to cultivate 50% of fallows and 25% of idle land; this means that there is an available area of 25,500 ha. The agriculture in the Greater Poland Voivodeship is at the highest level compared to other parts of the country. This is why, despite fallows and idle land being designated for cultivation, it can be assumed that the average biomass crop would be 20 tons of dry mass per 1 ha per year. This means that there would be a crop of about 510,000 tons of biomass per year.

6.3. The Technical Potential of Agricultural Biogas

The technical potential of agricultural biogas in the Greater Poland Voivodeship was calculated, taking into consideration the conversion factor of livestock heads into livestock units (LSU; 500 kg) [84]. For cattle, the conversion rate is 0.8, for pigs—0.2, and for poultry—0.004. The mean amount of slurry per 1 LSU is 44.9 kg for cattle, 43.5 kg for pigs, and 26.8 kg for poultry. The number of heads was taken from the data of the Central Statistical Office [77]. The construction of biogas plants using slurry and/or poultry manure is technically and economically viable on farms with a livestock number of at least 100 heads of cattle, 500 heads of pigs, and 5000 heads of poultry. Thus, the technical potential of agricultural biogas from animal droppings in the Greater Poland Voivodeship should be estimated at 25% of the theoretical potential [83]. It was assumed that the production of biogas from 1 ton of cattle slurry was 50 m3, from pig slurry—55 m3, and from poultry manure—140 m3. The amount of biogas that could be obtained in the Voivodeship is 40 million m3.
In the Greater Poland Voivodeship, maize is grown for consumption purposes and as farm livestock fodder. After the maize knobs have been harvested for consumption purposes, what is left in the field are stalks and leaves, which could be used to produce biogas. It was assumed that it is technically possible to obtain biogas from 30% of sown plants, whilst straw constitutes 62% of the dry mass of the whole plant. In 2015, the area where maize was cultivated for its grain in the Greater Poland Voivodeship reached 3,288,000 ha [83]. Assuming the grain crop yielded 9 tons, whilst 1 ton of biomass can produce 90 m3 of biogas, then the volume of biogas would be 1.3 billion m3. Due to the agricultural character of the Greater Poland Voivodeship, the opportunities to build agricultural biogas plants in the Greater Poland Voivodeship are great [85,86].

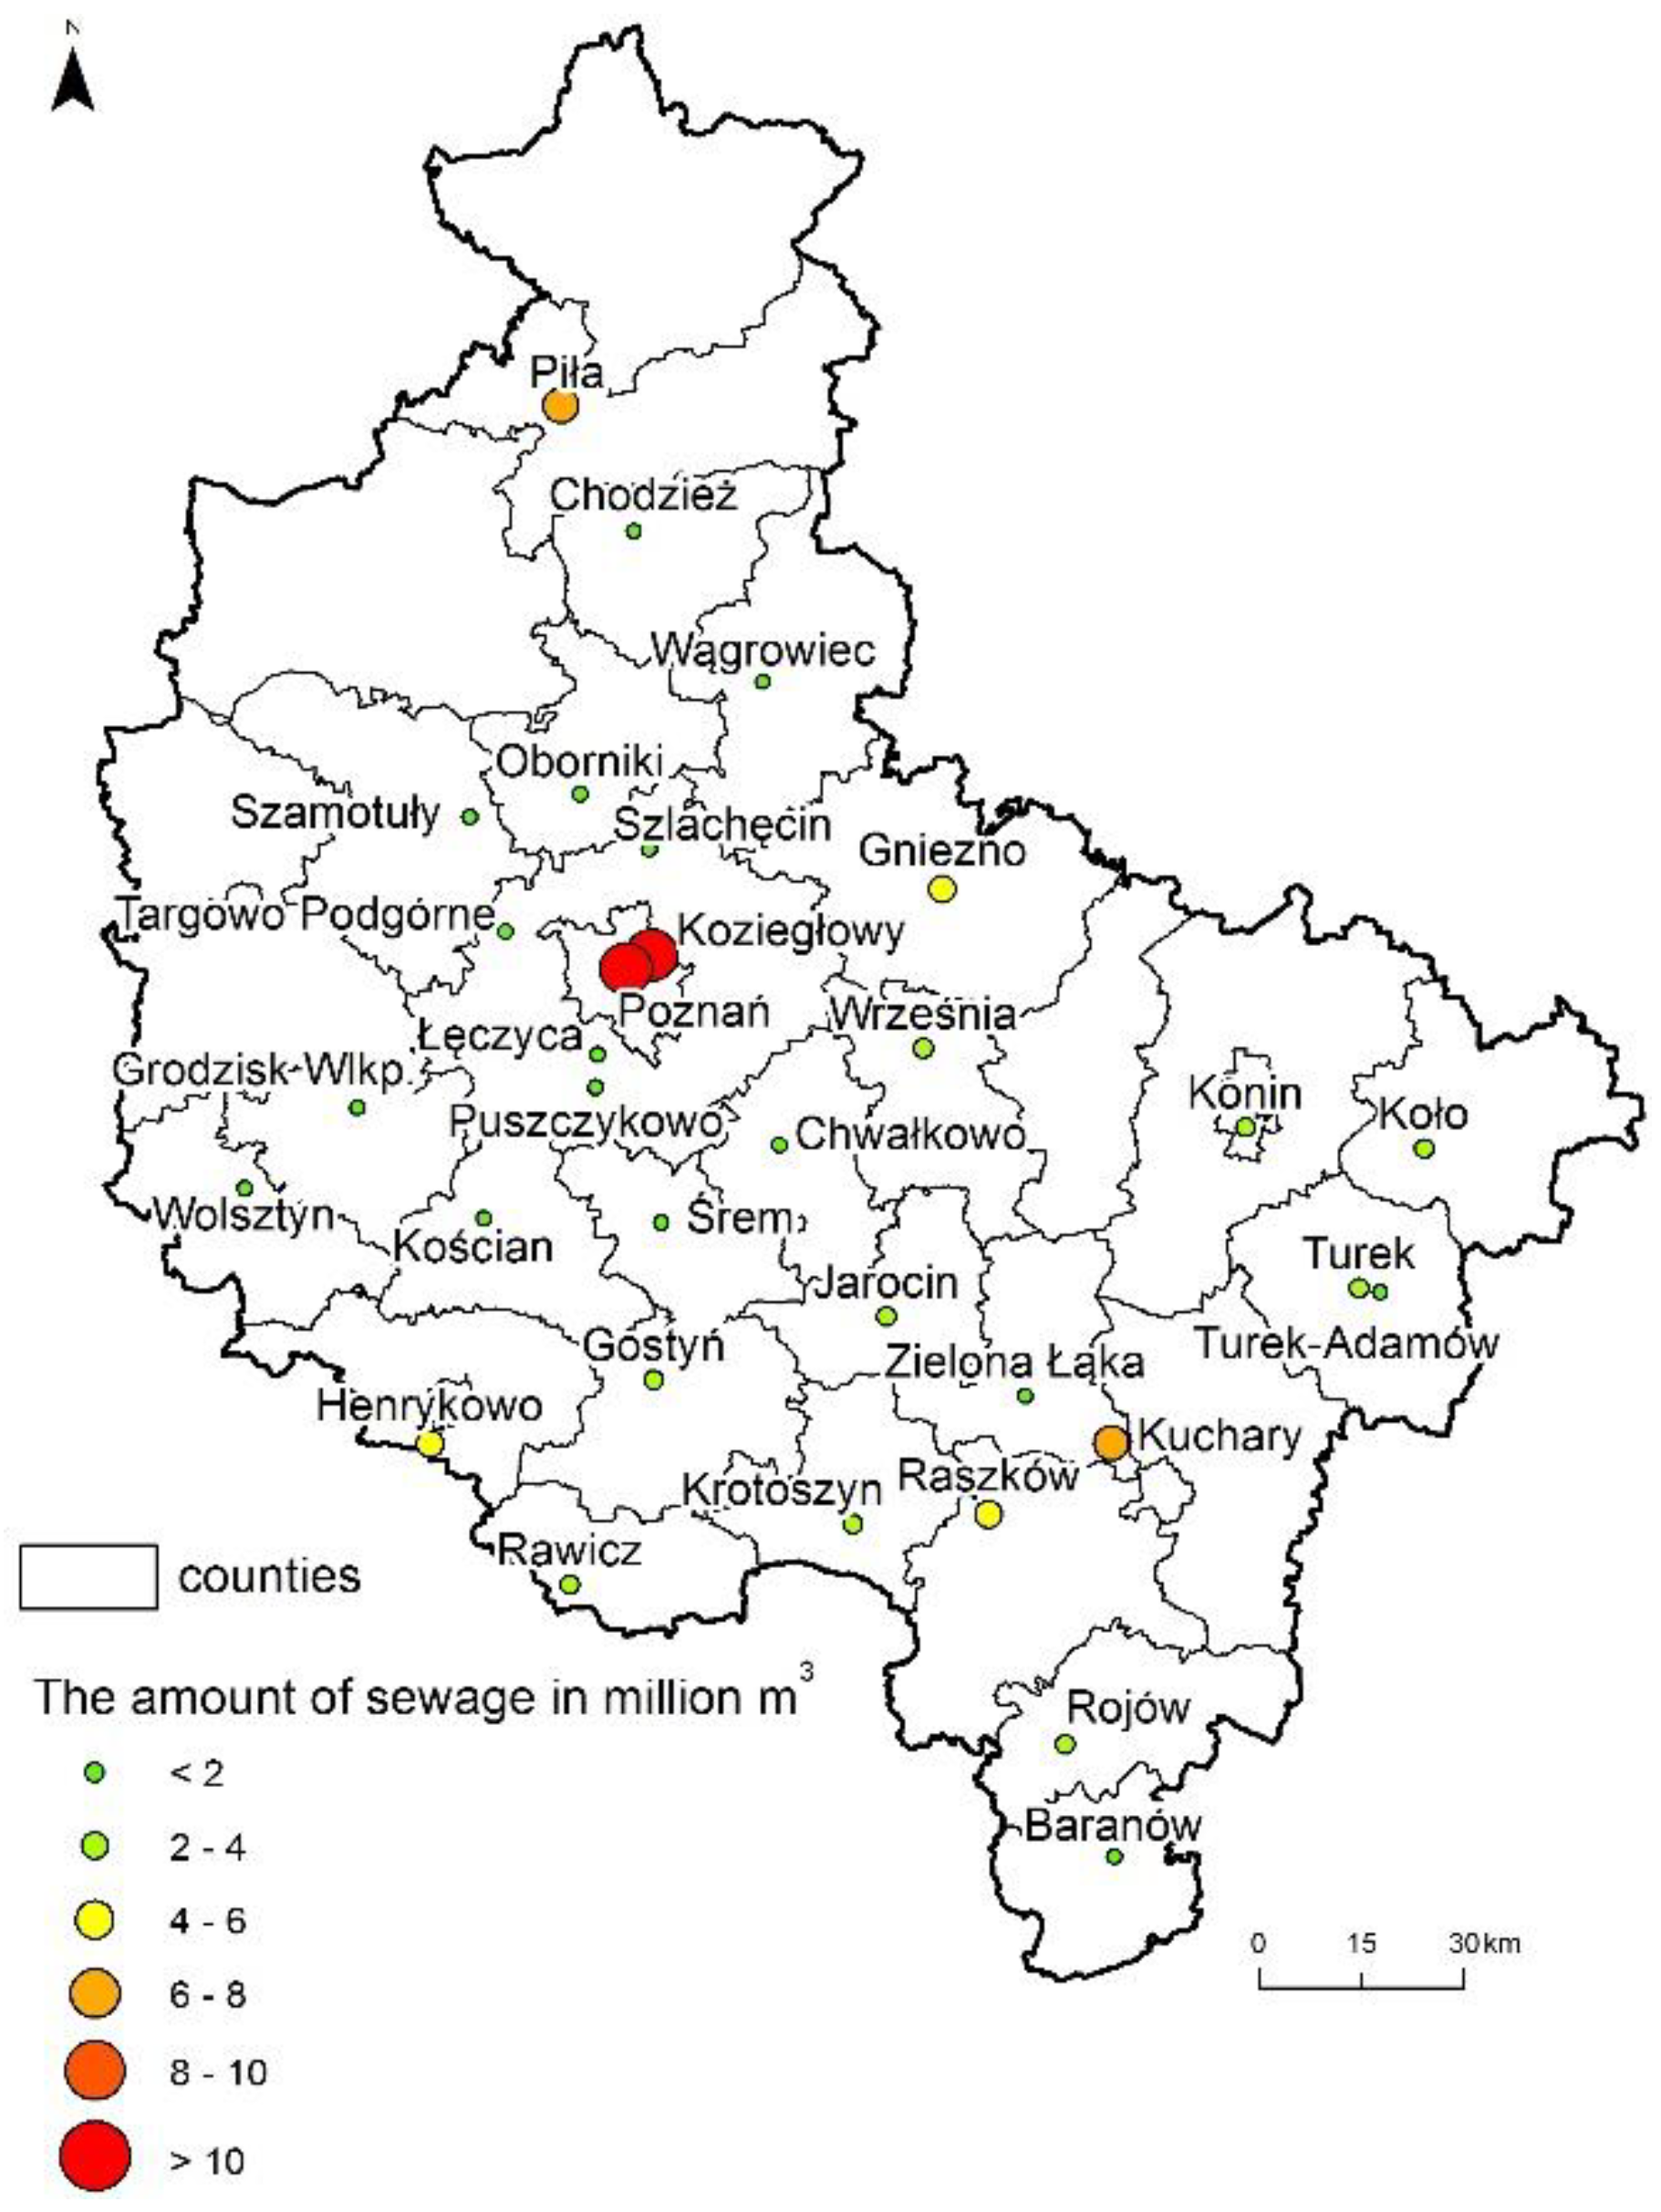
6.4. The Technical Potential of Biogas from Municipal Waste and Sewage Treatment Plants

The amount of municipal waste generated in households and public-use buildings in the Greater Poland Voivodeship reaches 1.1 million tons, of which more than a half consists of biodegradable waste [87]. The technical potential of biogas from municipal waste can be estimated at the level of 40% of the theoretical potential. Assuming that 90 m3 of biogas can be produced from 1 ton of waste, then it is possible to obtain nearly 20 million m3 of biogas from municipal waste per year in the Greater Poland Voivodeship.
In the Greater Poland Voivodeship, 21.4 million m3 of municipal sewage is treated [87]. Assuming that from 50% of effluents coming to the plant sludge can be obtained (sludge amounts to 1% of effluents) and that 1 m3 of sludge produces 15 m3 of biogas, then 1.6 million m3 of biogas could be generated in the Voivodeship.

6.5. The Total Technical Potential of Bioenergy in the Voivodeship

The Greater Poland Voivodeship has a very high potential to produce biomass for energy purposes. Table 1 shows the amounts of electric power and heat (in cogeneration) that could be produced from solid biomass. In total, it comes to about 25.6 PJ, which includes 2837 GWh of electric power and 12.8 PJ of heat (Table 1). The development of biomass-based energy generation would contribute a few hundred new work places in agriculture, the transport industry, companies dealing with biomass processing, such as briquette and pellet production, and eventually, in new boiler plants and heat and power stations.
Table 2 demonstrates the amounts of electric power and heat (in cogeneration) that could be obtained from biogas in the Greater Poland Voivodeship. In total, it reaches about 23.8 PJ, which includes 3.1 GWh of electric power and 12.6 TJ of heat (Table 2). In the Greater Poland Voivodeship, about 6 TWh of electric power could be obtained from solid waste biomass and biogas, which is nearly equivalent to 50% of the currently used energy [71]. On the other hand, the amount of heat that could be generated is 25.4 PJ, which amounts to 88% of the currently used heat.

7. The Water Energy Potential in the Greater Poland Voivodeship

Until recently, mills and small hydropower plants could be frequently sighted in the Greater Poland Voivodeship. Apart from energy generation, they had been responsible for water retention for a few hundred years [88]. The drainage system had been closely linked, in a unique symbiosis one could say, to barrages [89]. Unfortunately, after World War II, most of the small hydropower stations fell into decline. In recent years, however, there has been a growing interest among investors in the hydropower sector in the Greater Poland Voivodeship [89,90,91,92].
Calculations of the technical potential of hydropower in the Greater Poland Voivodship with the use of already existing damming facilities were carried out. In river water power plants, electricity is obtained from kinetic energy, and especially from potential energy. Assuming the water density ρ = 1000 kg/m3 and an efficiency of 85%, a formula [92,93] can be obtained, as follows:
P = 8.34Θ·H
where P is the hydroelectric power (MW), Θ is the flow (m3/s), and H is the spades (height).
Assuming that the full power plant will operate 6000 h a year, the amount of energy from the Ek hydroelectric power plant will be as follows:
Ek = 21.6·P
The data Θ and H were obtained from the National Water Management Board [66].
Figure 11 was created using the data provided by the Geodesic and Cartographic Documentation Centre [94]. Within the area of the Voivodeship, there are 1229 hydrotechnical structures—10 dams, 11 sluice locks, and 1208 weirs.
It can be assumed that at least half of all the hydrotechnical structures in the Greater Poland Voivodeship could be used to generate electric power. If the same supposition as above was followed, then the potential would be a total of 123 MW, whilst the power generation would reach 615 GWh. Clean water is becoming a rarity in the Greater Poland Voivodeship. Thus, more care has been given to its purification in recent years; some of the sewage treatment plants could be used to generate electricity, the way it is already happening in Minsk (Belarus) [92].
In the Greater Poland Voivodeship, there are 425 sewage treatment plants [87]. As already mentioned, some of them could be used to generate electric power—there must be an adequate difference between the water levels and the amount of treated water. It can be assumed that from a technical standpoint, hydropower plants need to be erected at the sewage treatment plants with a flow of at least 1 million m3 per year; 32 facilities meet this criterion (Figure 12). As an estimate, each of these could produce about 400–700 MWh of electric power. In total, this would provide about 8–12 GWh. It may not be a huge amount, but the main purpose of treating sewage is met anyway and electricity generation would just be a by-product.

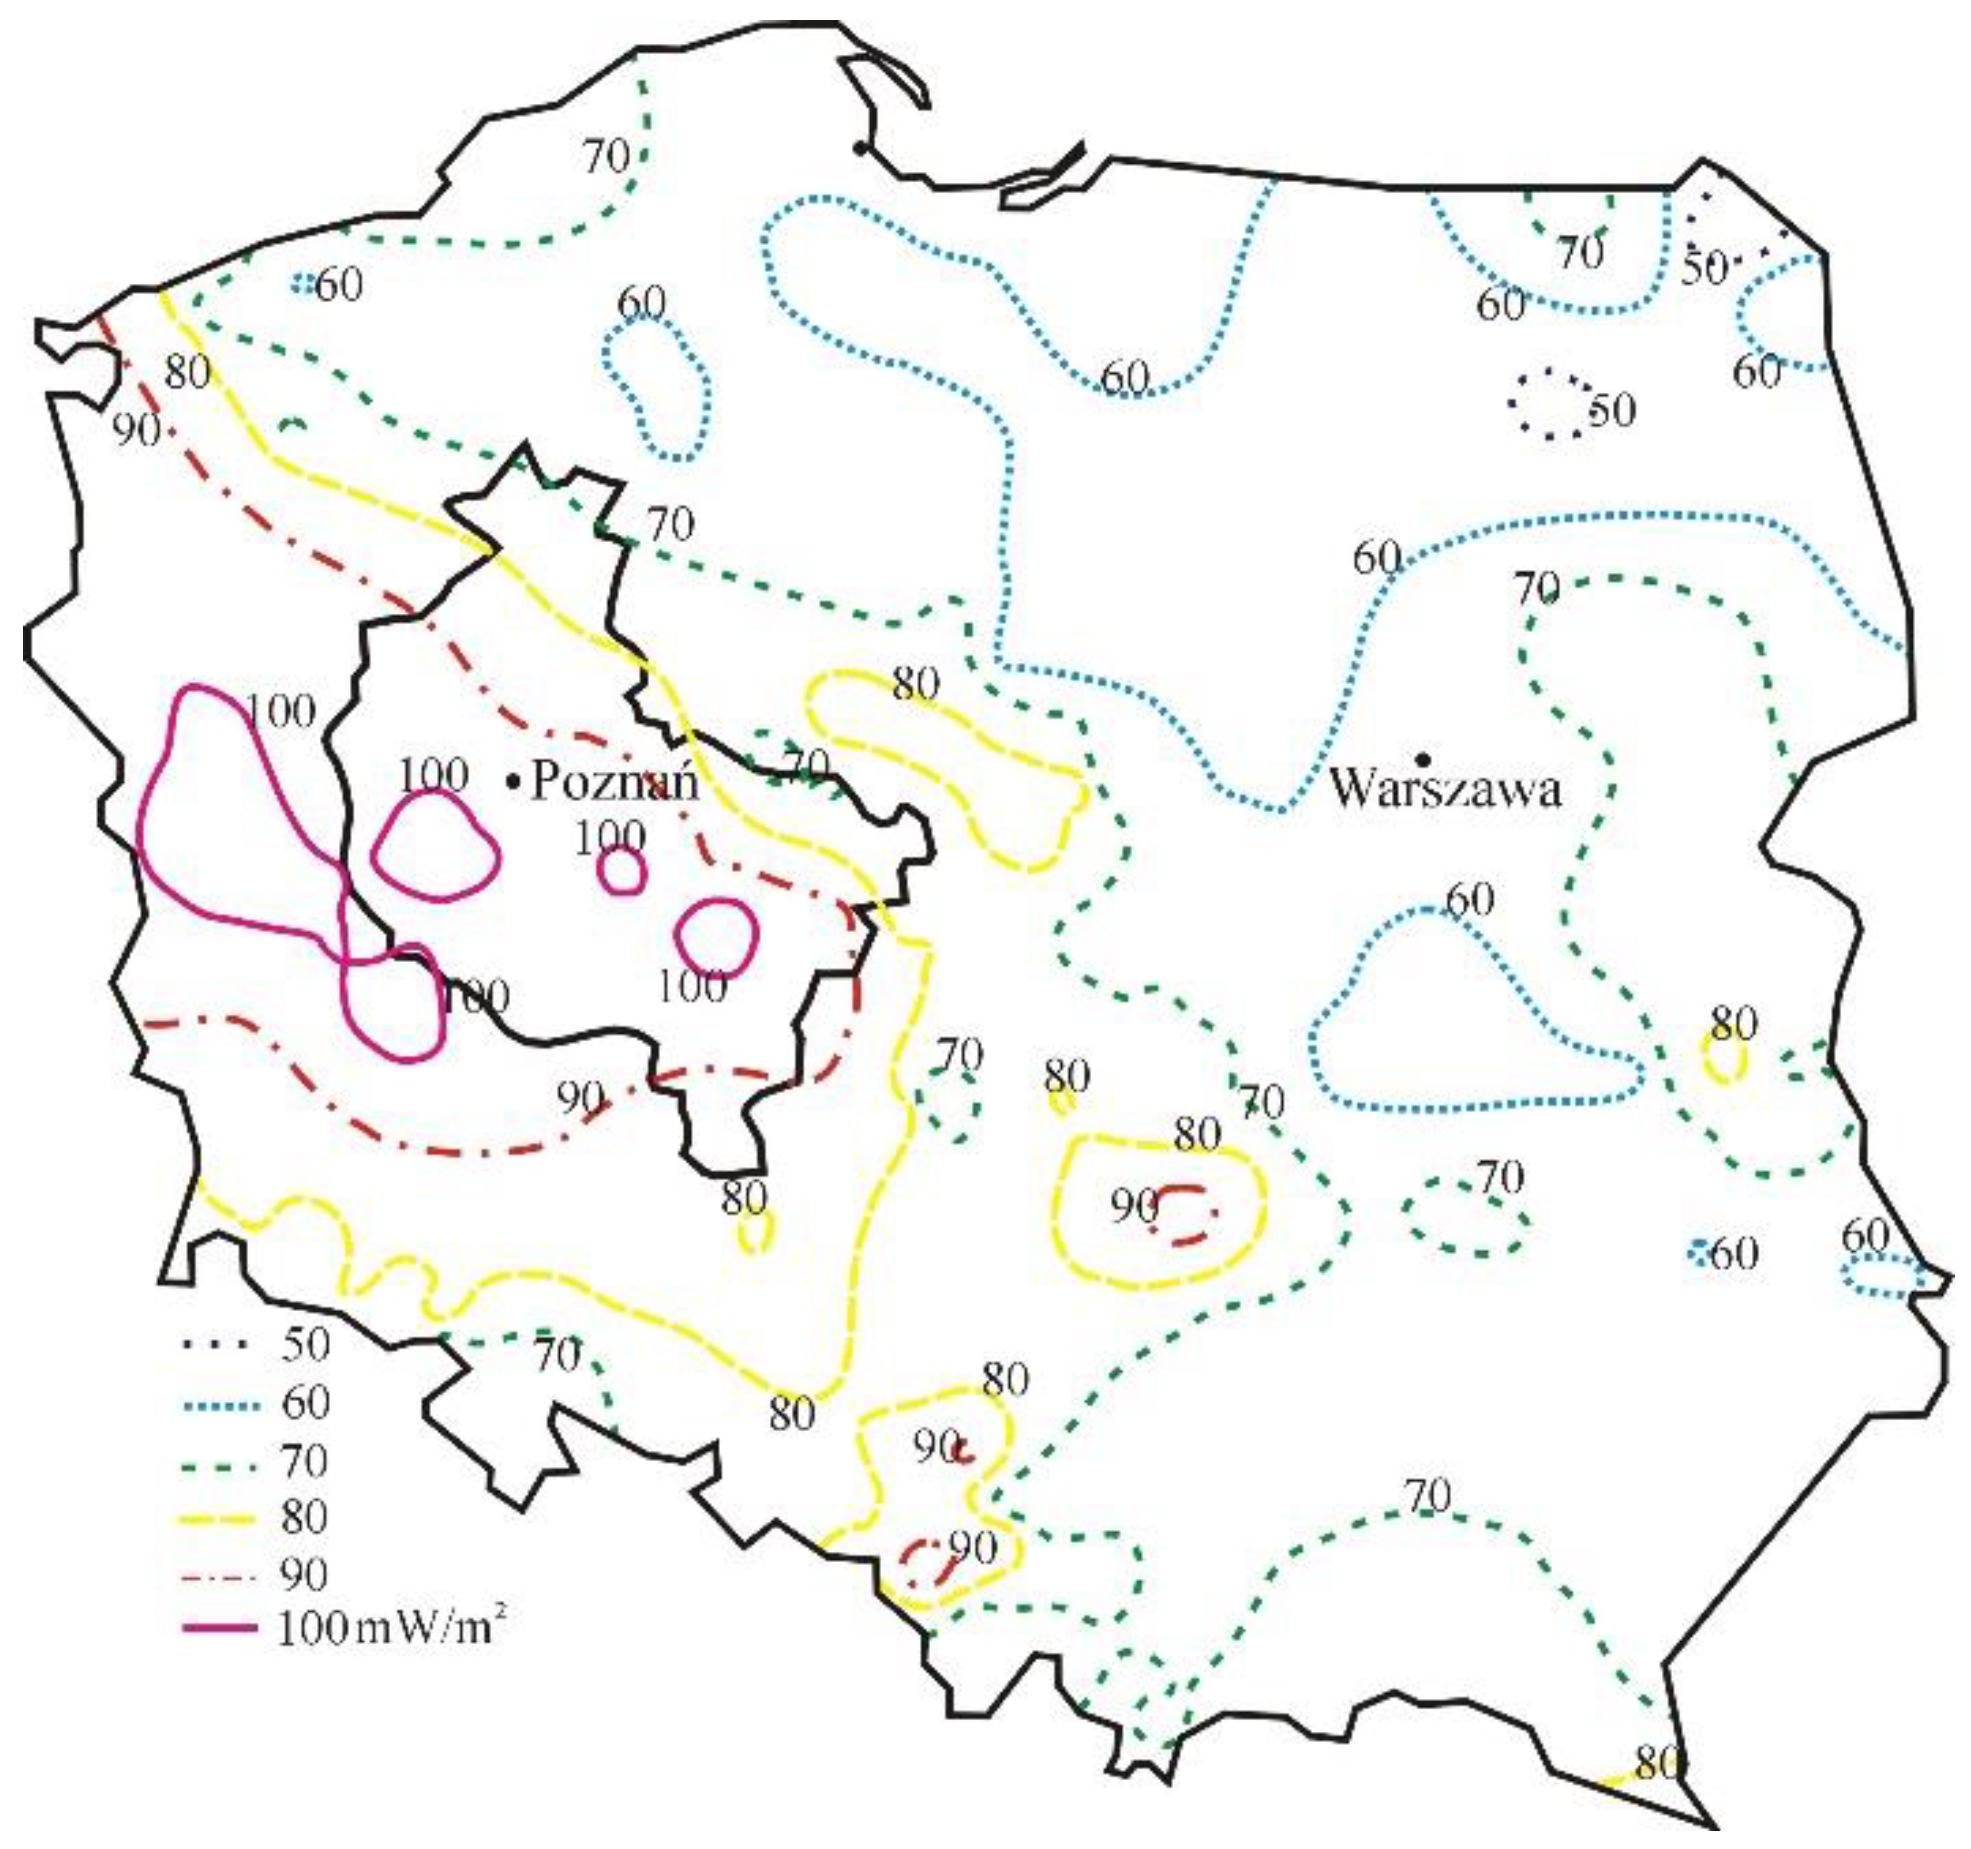
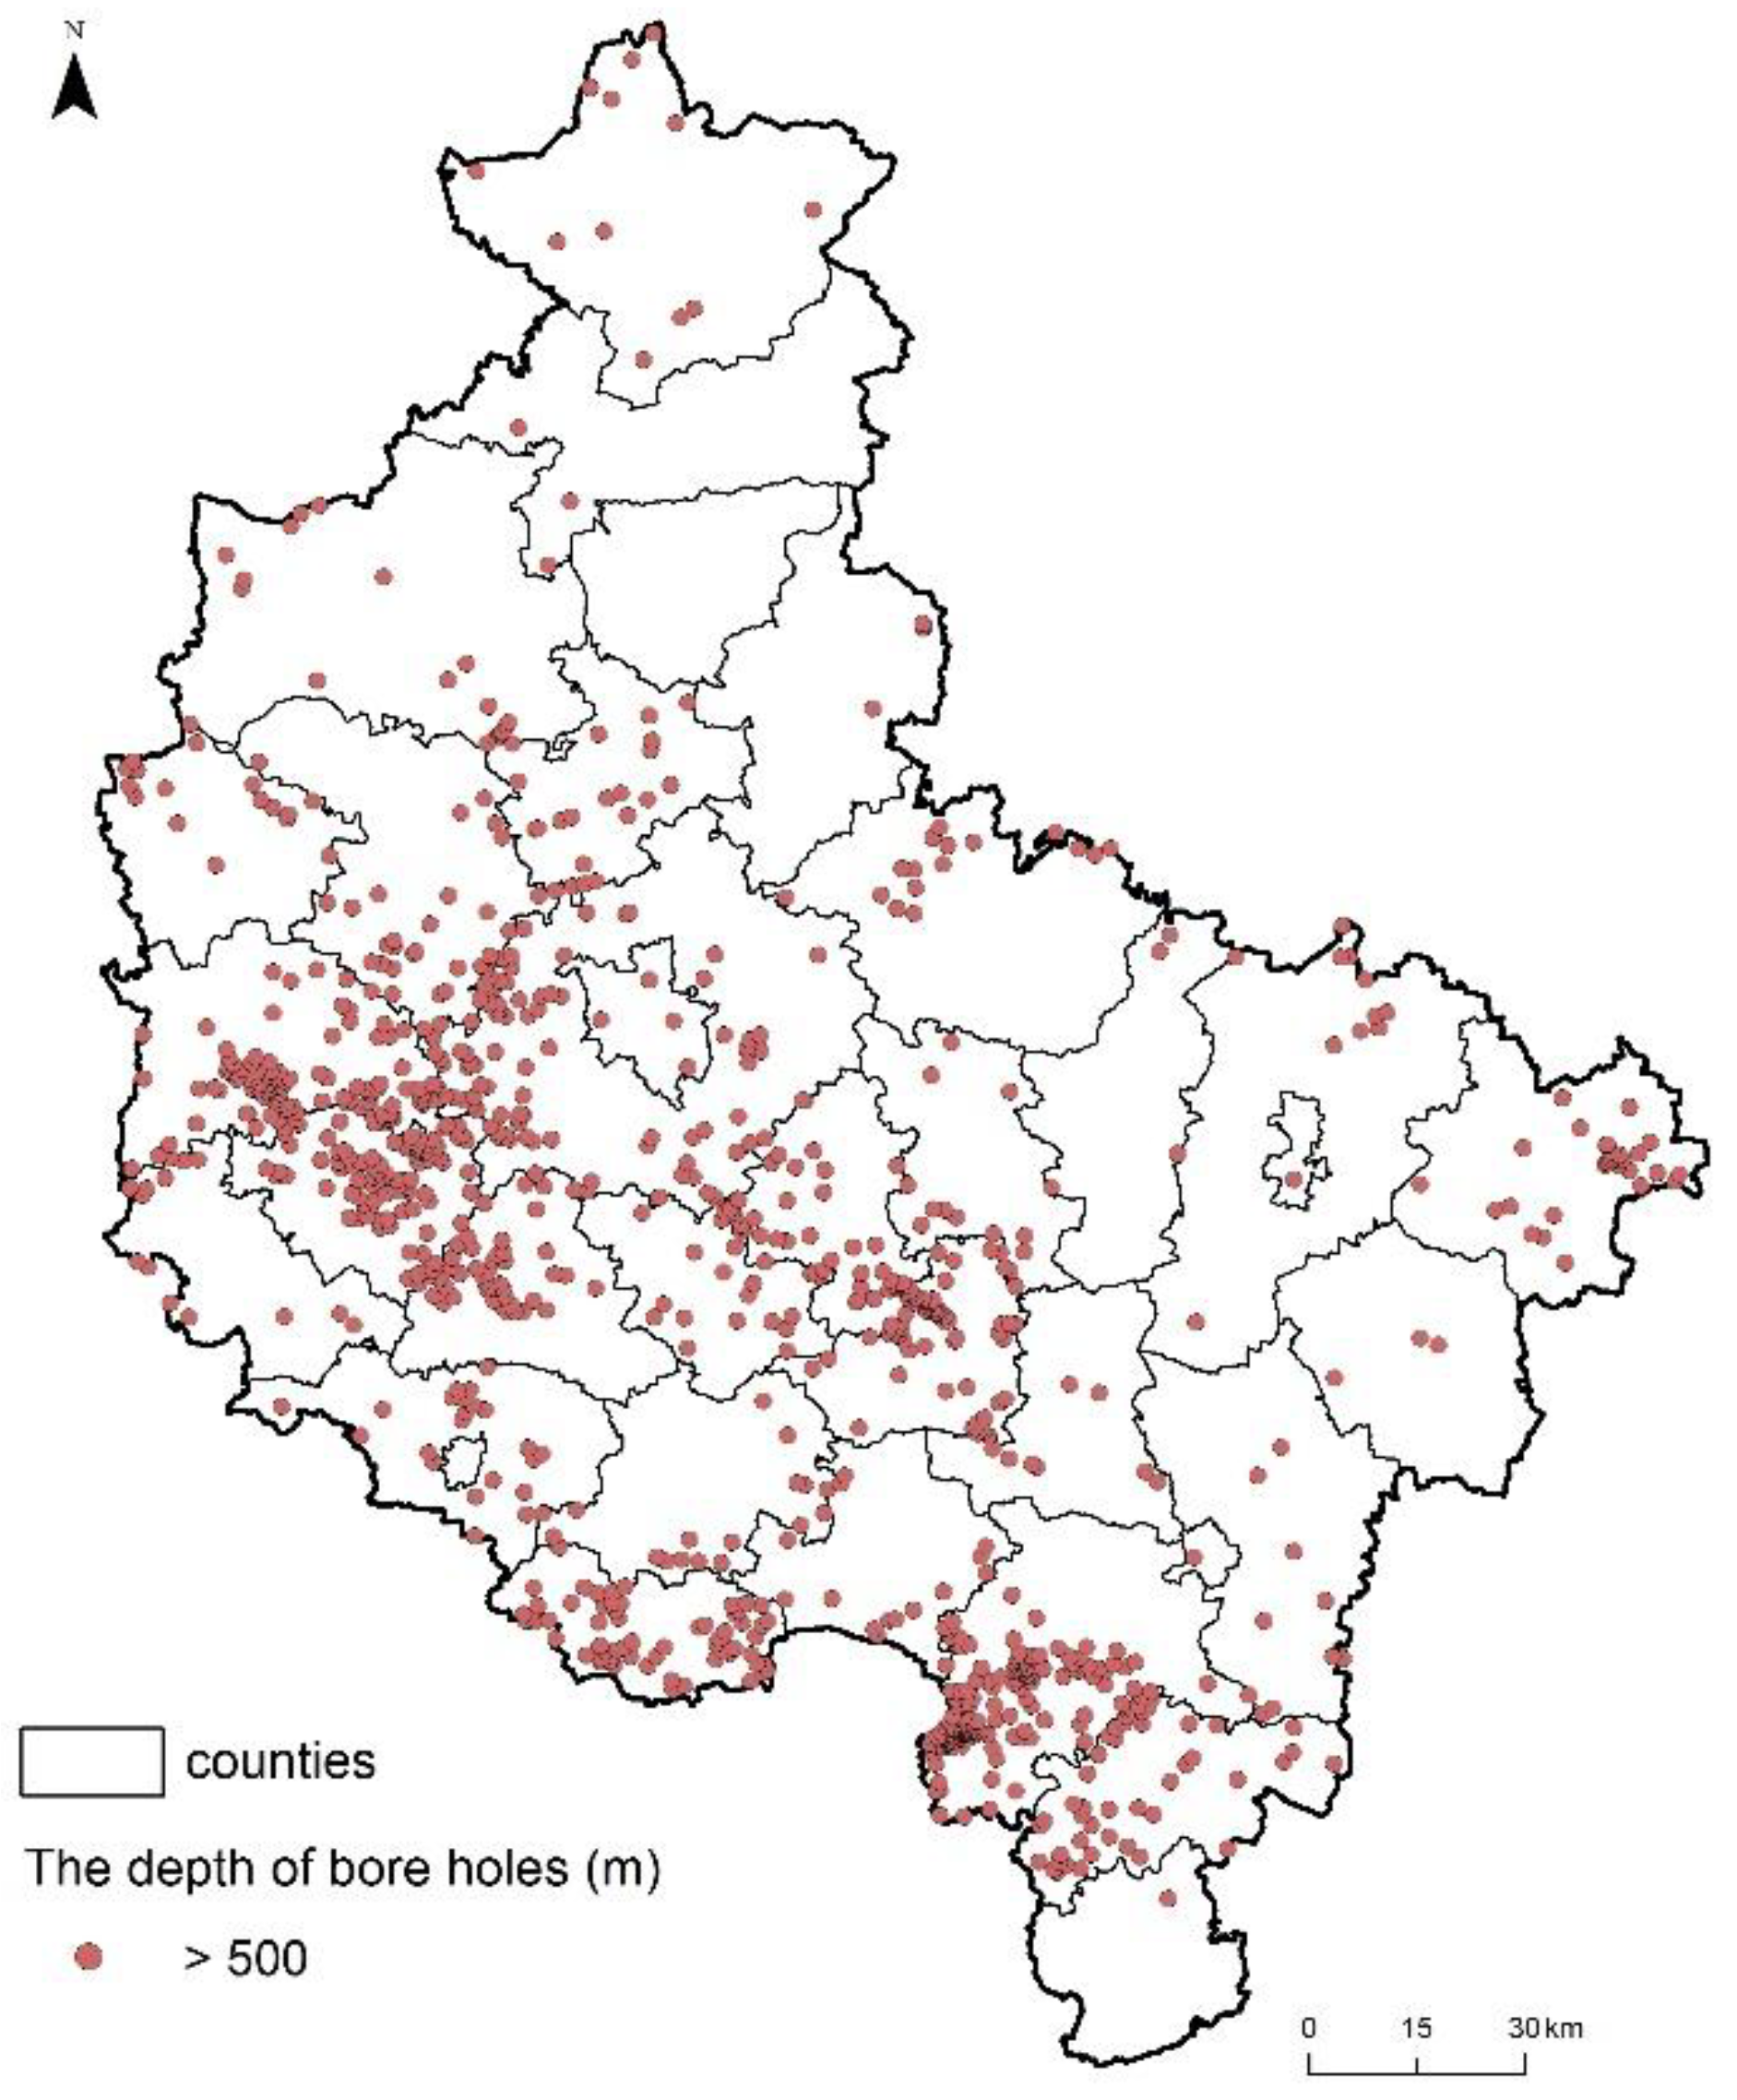
8. The Geothermal Energy Potential in the Greater Poland Voivodeship

In the Greater Poland Voivodeship, the density of the terrestrial heat flow varies from 70 to 100 mW/m2 (Figure 13) [95,96]. We know this is a result of a high number of exploratory bore holes, which were created after World War II, mainly during exploration for oil and natural gas resources. Using already existing bore holes results in significantly lower investment costs in the geothermal energy sector [95,96].
The data from the Central Geological Database [97] were used to create Figure 14, which shows bore holes of a minimum depth of 500 m in the Greater Poland Voivodeship.
The Greater Poland Voivodeship has good conditions not only for heat generation but also for electricity production [98]. In our study, it was assumed that binary geothermal heat and power plants could be implemented; their parameters are collated in Table 3. The construction of four binary heat and power plants will facilitate the production of 65.65 TJ of heat and 8.55 GWh of electric power per year. Medical and tourist centers are to be built next to the geothermal plants. For example, on the Island of Pociejewo in Konin, the geothermal water reaches a temperature of 97 °C and mineralization of 70 g/dm3 at a depth of 2600 m. According to the initial physico-chemical investigation, this is a highly mineralized sodium chloride type of water, which contains large amounts of chloride, sodium, magnesium, and calcium ions as well as many microelements. It meets all the parameters of medicinal water. The architectural development plan of the island in Konin contains the geothermal plant Pociejewo, “The Ecological Town Salon”, including a complex of 15, mainly indoor, swimming pools, 50 health and wellness salons, an exclusive hotel, and an indoor sports hall [99].

9. Total Technical Potential of the Renewable Energy in the Greater Poland Voivodeship

The implementation of the goal set in the article allowed for the designation of the technical potential of the renewable energy sector in the Greater Poland Voivodeship using GIS methods. The obtained results indicate that the amount of available electricity and heat is higher than the energy demand of the Voivodeship (Table 4). As for electric power, it is possible to generate 23.34 TWh, which is 1.8 times more than the demand. As for heat, it is about 47 PJ, which is 1.6 times more than the demand. A surplus of energy could be sent to other voivodeship regions. In addition, our accurate calculations show that it is possible to produce 100% RES in other regions in Poland. This means that the Greater Poland Voivodeship may be energy independent in the future, where both electricity and heat would come entirely from renewable energy sources.
This is an important argument in the further process of introducing just and bottom-up initiatives that would enable the region′s coal-based energy transformation. Additionally, the development of RES contributes to increasing the energy security of the society and economy, which are powered by a network of smaller and safer power plants, and leads to stronger local communities.

10. Discussion and Summary

The national coal regions have constituted the foundation of economic growth and prosperity at the local and national levels in the EU for decades. The XIXth and XXth centuries show a huge relation between coal mining in six coal regions in Poland (including the eastern part of the Greater Poland Voivodeship), the Ruhr region of Germany, Western Macedonia in Greece, and the southwest region of Bulgaria, and the economic and social development. A great value in performing energy transformation is establishing one region as an example for others. It is said that an example of just energy transformation is the Ruhr region of Germany. The transformation started there earlier and is much more ahead of the curve. The industrial sector of this German region has been restructured and is open for high-tech, tourism, and cultural services. The successful departure from coal mining has its foundation in focusing on the local strategy and authorities. The recommendations and transferable solutions reaccessioned on the Ruhr region transformation cover (1) the use of the bottom-up approach, (2) focusing on regional disparities, (2) establishing local value chains connected to the reindustrialization, and (3) empowering supra-regional competitiveness.
A transition to RES that is in line with the energy strategy of the EU is inevitable. As it has been mentioned, the comprehensive energy justice framework includes many issues, the first point of which is energy availability and access. RES may create a base of energy independence in coal regions, enabling full green energy availability and access for the local community. The analysis carried out in the study showed that by focusing only on RES resources in the region, the Greater Poland Voivodeship may fully meet the demand for energy with its green resources. The obtained results allow for concluding that in the area of the selected region (Greater Poland Voivodeship), it is possible to achieve climate-neutral energy independence under the European Green Deal. This means that despite the diversity of the energy potential of NUTS 2 regions in the EU, the energy transformation towards RES is justified at the regional level. This, in turn, is a good sign that all member states of the community will be able to achieve the objectives of the European Green Deal.
What is even more noticeable and economically important, the Greater Poland Voivodeship may remain energy competitive with other regions, as it may produce more energy than is needed. This means that this region may maintain its energy characteristic and economic power. The Greater Poland Voivodeship has high RES potential, and introducing a fair and just bottom-up strategy may convert the coal energy region to a green energy valley and further obtain the national and EU objectives. As the RES potential is far higher than the needs of the region, open-minded reindustrialization may bring large benefits. RES availability and energy transformation may lead to a diversified production centralization in the region, which, in conjunction with the west–east transition route, may even become a geopolitical hub, empowering the region and even national competitiveness and growth.
Moving towards RES is an enormous challenge, especially for local communities in coal regions. Local and family traditions, individual life choices, and a sense of security are based on coal mining in many situations. Juliette de Grandpré, Senior Policy Advisor, WWF Germany, said that “We need to make sure Europe’s transition towards a net-zero emissions economy does not happen at the expense of these regions” [100]. Above and beyond the RES benefits, the Ruhr region is still dealing with a high unemployment rate, double that in other German regions. This is what the Greater Poland Voivodeship wants to avoid. To do so, the local community has to be aware of the region’s RES potential, the large possibilities generated by RES, and be sure that the region maintains energy security and that it can be competitive and economically strong. The key roles played here are the local authorities, their financial and educative support, decision-making transparency, trust, equity, and of course, understanding and empathy. This may create a “green” and open-minded community that is able to meet challenges.
In this study, we showed that the Greater Poland Voivodeship has opportunities and resources to become an energy-independent region and become a Green Energy Valley in the near future. This energy independence is planned to be obtained under a fair, just, bottom-up, locally and community-oriented energy transformation. Performing such a region transformation is a milestone in achieving energy neutrality in Poland. There is only one way to move toward RES, and local support is indispensable. The possibility of the Greater Poland Voivodeship to achieve RES independence is an unmediated fact, but the details of how to, in practice, effectively support the local community while maintaining regional differences, still remain under discussion.

Author Contributions

Conceptualization, B.I. and M.B.P.; methodology, B.I. and M.B.P.; software, M.S. and M.B.P.; validation, B.I., M.B.P., U.K., M.S., A.G., A.Z. and K.N.; formal analysis, B.I., M.S. and M.B.P.; investigation, B.I., M.B.P., U.K., M.S., A.G., A.Z. and K.N.; resources, B.I., M.B.P., U.K., M.S., A.Z. and K.N.; data curation, M.B.P. and B.I.; writing—original draft preparation B.I. and M.B.P.; writing—review and editing, B.I., M.B.P., U.K., M.S., A.G., A.Z. and K.N.; visualization, B.I., M.B.P. and M.S.; supervision, B.I. and M.B.P.; project administration B.I. and M.B.P. All authors have read and agreed to the published version of the manuscript.

Funding

This research received no external funding.

Data Availability Statement

Data available on request due to restrictions. The data presented in this study are available on request from the corresponding author.

Conflicts of Interest

The authors declare no conflict of interest.

References

  1. Hussain, H.I.; Szczepańska-Woszczyna, K.; Kamarudin, F.; Anwar, N.A.M.; Saudi, M.H.M. Unboxing the black box on the dimensions of social globalisation and the efficiency of microfinance institutions in Asia. Oeconomia Copernic. 2021, 12, 557–592. [Google Scholar] [CrossRef]
  2. Rees, W.E. Globalization, trade and migration: Undermining sustainability. Ecol. Econom. 2006, 2, 220–225. [Google Scholar] [CrossRef]
  3. Barłożewski, K.; Trąpczyński, P. Is internationalisation beneficial for novice internationalisers? The performance effects of firm-specific advantages, internationalisation degree and firm size revisited. Oeconomia Copernic. 2021, 12, 53–75. [Google Scholar] [CrossRef]
  4. Szopik-Depczyńska, K.; Cheba, K.; Bąk, I.; Stajniak, M.; Simboli, A.; Ioppolo, G. The study of relationship in a hierarchical structure of EU sustainable development indicators. Ecol. Indic. 2018, 90, 120–131. [Google Scholar] [CrossRef]
  5. Skare, M.; Porada-Rochoń, M. Financial and economic development link in transitional economies: A spectral Granger causality analysis 1991–2017. Oeconomia Copernic. 2019, 1, 7–35. [Google Scholar] [CrossRef]
  6. Sánchez-López, C.; Aceytuno, M.T.; De Paz-Bañez, M.A. Inequality and globalisation: Analysis of European countries. Econ. Sociol. 2019, 4, 84–100. [Google Scholar] [CrossRef] [PubMed]
  7. Simionescu, M.; Lazányi, K.; Sopková, G.; Dobeš, K.; Balcerzak, A.P. Determinants of economic growth in V4 countries and Romania. J. Comp. 2017, 1, 103–113. [Google Scholar] [CrossRef] [Green Version]
  8. Zinecker, M.; Doubravský, K.; Balcerzak, A.P.; Pietrzak, M.B.; Dohnal, M. The COVID-19 disease and policy response to mitigate the economic impact in the EU: An exploratory study based on qualitative trend analysis. Technol. Econ. Dev. Econ. 2021, 27, 742–762. [Google Scholar] [CrossRef]
  9. Wosiek, M. Rural-urban divide in human capital in Poland after 1988. Oeconomia Copernic. 2020, 11, 183–201. [Google Scholar] [CrossRef] [Green Version]
  10. Szopik-Depczyńska, K.; Kędzierska-Szczepaniak, A.; Szczepaniak, K.; Cheba, K.; Gajda, W.; Ioppolo, G. Innovation in sustainable development: An investigation of the EU context using 2030 agenda indicators. Land Use Policy 2018, 79, 251–262. [Google Scholar] [CrossRef]
  11. Roszko-Wójtowicz, E.; Grzelak, M.M. Macroeconomic stability and the level of competitiveness in EU member states: A comparative dynamic approach. Oeconomia Copernic. 2020, 11, 657–688. [Google Scholar] [CrossRef]
  12. Prokop, V.; Kotkova Striteska, M.; Stejskal, J. Fostering Czech firms? innovation performance through efficient cooperation. Oeconomia Copernic. 2021, 12, 671–700. [Google Scholar] [CrossRef]
  13. Markauskas, M.; Baliute, A. Technological progress spillover effect in Lithuanian manufacturing industry. Equilib. Q. J. Econ. Econ. Policy 2021, 16, 783–806. [Google Scholar] [CrossRef]
  14. Nowak, P. Cooperation of enterprises in innovative activities on the example of Polish regions. Equilib. Q. J. Econ. Econ. Policy 2021, 16, 839–857. [Google Scholar] [CrossRef]
  15. Balcerzak, A.P. Quality of institutions in the European Union countries. Application of TOPSIS based on entropy measure for objective weighting. Acta Polytech. Hung. 2020, 1, 101–122. [Google Scholar] [CrossRef]
  16. Zielenkiewicz, M. Institutional environment in the context of development of sustainable society in the European Union countries. Equilibrium. Quart. J. Econ. Econ. Policy 2014, 9, 21–37. [Google Scholar] [CrossRef]
  17. Belke, A.; Dreger, C.; Dobnik, F. Energy consumption and economic growth–new insights into the cointegration relationship. Energy Econom. 2010, 33, 782–789. [Google Scholar] [CrossRef] [Green Version]
  18. Piekut, M. The consumption of renewable energy sources (RES) by the European Union households between 2004 and 2019. Energies 2021, 14, 5560. [Google Scholar] [CrossRef]
  19. Jankiewicz, M.; Pietrzak, M.B. Assessment of trends in the share of expenditure on services and food in the Visegrad group member states. Int. J. Bus. Soc. 2020, 2, 977–996. [Google Scholar] [CrossRef]
  20. Zadykowicz, A.; Chmielewski, K.J.; Siemieniako, D. Proactive customer orientation and joint learning capabilities in collaborative machine to machine innovation technology development: The case study of automotive equipment manufacturer. Oeconomia Copernic. 2020, 11, 531–547. [Google Scholar] [CrossRef]
  21. Wosiek, M. Unemployment and new firm formation: Evidence from Polish industries at the regional level. Equilib. Q. J. Econ. Econ. Policy 2021, 16, 765–782. [Google Scholar] [CrossRef]
  22. Fragkos, P.; Paroussos, L. Employment creation in EU related to renewables expansion. Appl. Energy 2018, 230, 935–945. [Google Scholar] [CrossRef]
  23. Gajdos, A.; Arendt, L.; Balcerzak, A.P.; Pietrzak, M.B. Future trends of labour market polarisation in Poland–The perspective of 2025. Transform. Bus. Econ. 2020, 3, 114–135. [Google Scholar]
  24. Dmytrów, K.; Bieszk-Stolorz, B. Comparison of changes in the labour markets of post-communist countries with other EU member states. Equilib. Q. J. Econ. Econ. Policy 2021, 16, 741–764. [Google Scholar] [CrossRef]
  25. Pietrzak, M.B.; Balcerzak, A.P.; Gajdos, A.; Arendt, Ł. Entrepreneurial environment at regional level: The case of Polish path towards sustainable socio-economic development. Entrep. Sustain. Issues 2017, 5, 190–203. [Google Scholar] [CrossRef] [Green Version]
  26. Svabova, L.; Tesarova, E.N.; Durica, M.; Strakova, L. Evaluation of the impacts of the COVID-19 pandemic on the development of the unemployment rate in Slovakia: Counterfactual before-after comparison. Equilib. Q. J. Econ. Econ. Policy 2021, 16, 261–284. [Google Scholar] [CrossRef]
  27. Markandya, A.; Arto, I.; Eguino, M.G.; Román, M.V. Towards a green energy economy? Tracking the employment effects of low-carbon technologies in the European Union. Appl. Energy 2016, 179, 1342–1350. [Google Scholar] [CrossRef] [Green Version]
  28. Pao, H.-T.; Fu, H.-C. Renewable energy, non-renewable energy and economic growth in Brazil. Renew. Sustain. Energy Rev. 2013, 25, 381–392. [Google Scholar] [CrossRef]
  29. Pietrzak, M.B.; Igliński, B.; Kujawski, W.; Iwański, P. Energy transition in Poland–assessment of the renewable energy sector. Energies 2021, 14, 2046. [Google Scholar] [CrossRef]
  30. Chovancová, J.; Tej, J. Decoupling economic growth from greenhouse gas emissions: The case of the energy sector in V4 countries. Equilib. Q. J. Econom. Econom. Policy. 2020, 15, 235–251. [Google Scholar] [CrossRef]
  31. Lin, M.-X.; Liou, H.M.; Chou, K.T. National energy transition framework toward SDG7 with legal reforms and policy bundles: The case of Taiwan and its comparison with Japan. Energies 2020, 13, 1387. [Google Scholar] [CrossRef] [Green Version]
  32. Grosse, T.G. Low carbon economy policy in Poland: An example of the impact of Europeanisation. Q. J. Econom. Econom. Policy. 2011, 1, 9–39. [Google Scholar] [CrossRef]
  33. 2019 Europe Sustainable Development Report. In Sustainable Development Solutions Network and Institute for European Environmental Policy; Institute for European Environmental Policy: Brussels, Belgium, 2019.
  34. Musiał, W.; Zioło, M.; Luty, L.; Musiał, K. Energy policy of European Union member states in the context of renewable energy sources development. Energies 2021, 14, 2864. [Google Scholar] [CrossRef]
  35. Igliński, B.; Skrzatek, M.; Kujawski, W.; Cichosz, M.; Buczkowski, R. SWOT analysis of renewable Energy sector in Mazowieckie Voivodeship: Current progress, prospects and policy implications. Env. Dev. Sustain. 2021, 24, 77–111. [Google Scholar] [CrossRef]
  36. Overland, I. Energy: The missing link in globalization. Energy Res. Soc. Sci. 2016, 14, 122–130. [Google Scholar] [CrossRef] [Green Version]
  37. Kochanek, E. Evaluation of energy transition scenarios in Poland. Energies 2021, 14, 6058. [Google Scholar] [CrossRef]
  38. Kałążny, A.; Morawski, W. Taxation of assets used to generate energy–in the context of the transformation of the Polish Energy sector from coal energy to low-emission Energy. Energies 2021, 14, 4587. [Google Scholar] [CrossRef]
  39. Carley, S.; Konisky, D.M. The justice and equity implications of the clean energy transition. Nat. Energy 2020, 5, 569–577. [Google Scholar] [CrossRef]
  40. David, M.; Schönborn, S. Bottom-up energy transition narratives: Linking the global with the local? A comparison of three German renewable Co-Ops. Sustainability 2018, 10, 924. [Google Scholar] [CrossRef] [Green Version]
  41. Budzianowski, W.M.; Gomes, J.F.P. Perspectives for low-carbon production until 2030: Lessons learned from the comparison of local context in Poland and Portugal. Energy Sources Part B Econ. Plan. Policy 2016, 6, 534–541. [Google Scholar] [CrossRef]
  42. Igliński, B.; Kujawski, W.; Buczkowski, R.; Cichosz, M. Renewable energy in the Kujawsko-Pomorskie Voivodeship (Poland). Renew. Sustain. Energ. Rev. 2010, 4, 1336–1341. [Google Scholar] [CrossRef]
  43. Igliński, B.; Buczkowski, R.; Cichosz, M.; Piechota, G.; Kujawski, W.; Plaskacz, M. Renewable energy production in the Zachodniopomorskie Voivodeship (Poland). Renew. Sustain. Energy Rev. 2013, 27, 768–777. [Google Scholar] [CrossRef]
  44. Igliński, B.; Piechota, G.; Iglińska, A.; Cichosz, M.; Buczkowski, R. The study on the SWOT analysis of renewable energy sector on the example of the Pomorskie Voivodeship (Poland). Clean Technol. Environ. Policy 2015, 1, 45–61. [Google Scholar] [CrossRef]
  45. Igliński, B.; Buczkowski, R.; Iglińska, A.; Cichosz, M.; Plaskacz-Dziuba, M. SWOT analysis of the renewable energy sector in Poland: Case study of Wielkopolskie region. J. Power Technol. 2015, 2, 143–157. [Google Scholar]
  46. Igliński, B.; Iglińska, A.; Cichosz, M.; Kujawski, W.; Buczkowski, R. Renewable energy production in the Łódzkie Voivodeship: The PEST analysis of the RES in the Voivodeship and in Poland. Renew. Sustain. Energy Rev. 2016, 58, 737–750. [Google Scholar] [CrossRef]
  47. Biuletyn Informacji Publicznej Urzędu Regulacji Energetyki. Available online: www.ure.gov.pl (accessed on 25 September 2021).
  48. European Union. Directive 2009/28/EC of the European Parliament and of the Council of 23 April 2009 on the promotion of the use of energy from renewable sources and amending and subsequently repealing Directives 2001/77/EC and 2003/30/EC. Off. J. Eur. Union 2009, 5, 2009. [Google Scholar]
  49. Directive (EU) 2018/2001 of the European Parliament and of the Council of 11 December 2018 on the Promotion of the Use of Energy from Renewable Sources PE/48/2018/REV/1. Available online: https://eur-lex.europa.eu/legal-content/EN/TXT/?uri=uriserv:OJ.L_.2018.328.01.0082.01.ENG (accessed on 30 September 2021).
  50. Energy Roadmap 2050. In European Commission Staff Working Paper; European Commission: Brussels, Belgium, 2011; Part 2/2; p. 36.
  51. Caravella, S.; Costantini, V.; Crespi, F. Mission-oriented policies and technological sovereignty: The case of climate mitigation technologies. Energies 2021, 14, 6854. [Google Scholar] [CrossRef]
  52. Poland’s Energy Policy until 2030. Available online: www.cire.pl/artykuly/materialy-problemowe/45029-polityka-energetyczna-polski-do-2030-roku (accessed on 28 September 2021).
  53. Poland’s National Energy and Climate Plan for Years 2021–2030. Available online: https://www.gov.pl/web/klimat/national-energy-and-climate-plan-for-the-years-2021-2030 (accessed on 29 September 2021).
  54. Poland’s Energy Policy until 2040. Available online: www.gov.pl/web/klimat/polityka-energetyczna-polski (accessed on 29 October 2021).
  55. Zinecker, M.; Skalická, M.; Balcerzak, A.P.; Pietrzak, M.B. Business angels in the Czech Republic: Characteristics and a classification with policy implications. Econ. Res.-Kenosha Istraživanja 2021, 1–26. [Google Scholar] [CrossRef]
  56. Gorączkowska, J. Enterprise innovation in technology incubators and university business incubators in the context of Polish industry. Oeconomia Copernic. 2020, 11, 799–817. [Google Scholar] [CrossRef]
  57. Zinecker, M.; Skalická, M.; Balcerzak, A.P.; Pietrzak, M.B. Identifying the impact of external environment on business angel activity. Econ. Res.-Ekonomska Istraživanja 2021, 1–23. [Google Scholar] [CrossRef]
  58. Meluzín, T.; Zinecker, M.; Balcerzak, A.P.; Pietrzak, M.B.; Doubravský, K. Institutional Settings and their Impact on the IPO Activity: An Exploratory Study Based on Qualitative Modelling. Acta Polytech. Hung. 2021, 18, 215–235. [Google Scholar] [CrossRef]
  59. Meluzín, T.; Balcerzak, A.P.; Pietrzak, M.B.; Zinecker, M.; Doubravský, K. The impact of rumours related to political and macroeconomic uncertainty on IPO success: Evidence from a qualitative model. Transform. Bus. Econ. 2018, 2017, 148–169. [Google Scholar]
  60. Meluzín, T.; Zinecker, M.; Balcerzak, A.P.; Doubravský, K.; Pietrzak, M.B.; Dohnal, M. The timing of initial public offerings: Non-numerical model based on qualitative trends. J. Bus. Econ. Manag. 2018, 19, 63–79. [Google Scholar] [CrossRef] [Green Version]
  61. Meluzín, T.; Zinecker, M.; Balcerzak, A.P.; Pietrzak, M.B. Why do companies stay private? Determinants for IPO candidates to consider in Poland and the Czech Republic. East. Eur. Econ. 2018, 56, 471–503. [Google Scholar] [CrossRef]
  62. Oehlmann, M.; Meyerhoff, J. Stated preferences towards renewable energy alternatives in Germany–do the consequentiality of the survey and trust in institutions matter? J. Environ. Econ. Policy 2017, 1, 1–16. [Google Scholar] [CrossRef]
  63. Rogers, J.; Simmons, E.; Convery, I.; Weatherall, A. Public perceptions of community-based renewable energy projects. Energy Policy 2008, 36, 4217–4226. [Google Scholar] [CrossRef] [Green Version]
  64. Zoellner, J.; Schweizer-Ries, P.; Wemheuer, C. Public acceptance of renewable energies: Results from case studies in Germany. Energy Policy 2008, 36, 4136–4141. [Google Scholar] [CrossRef]
  65. Upham, P.; Shackley, S. The case of a proposed 21.5MWe biomass gasifier in Winkleigh, Devon: Implications for governance of renewable energy planning. Energy Policy 2006, 34, 2161–2172. [Google Scholar] [CrossRef]
  66. Sánchez-Lozano, J.M.; Teruel-Solano, J.; Soto-Elvira, P.L.; García-Cascales, M.S. Geographical Information Systems (GIS) and Multi-Criteria Decision Making (MCDM) methods for the evaluation of solar farms locations: Case study in south-eastern Spain. Appl. Energy 2013, 24, 544–556. [Google Scholar] [CrossRef]
  67. Xu, Q.; Guo, Z.; Xia, L.; He, Q.; Li, Z.; Bello, I.T.; Zheng, K.; Ni, M. A comprehensive review of solid oxide fuel cells operating on various promising alternative fuels. Energy Conv. Manag. 2022, 253, 115174. [Google Scholar] [CrossRef]
  68. Huang, Y.; Xiao, X.; Kang, H.; Lv, J.; Zeng, R.; Shen, J. Thermal management of polymer electrolyte membrane fuel cells: A critical review of heat transfer mechanisms, cooling approaches, and advanced cooling analysis. Energy Conv. Manag. 2022, 254, 115221. [Google Scholar] [CrossRef]
  69. Ghanem, R.S.; Nousch, L.; Richter, M. Modelling of a grid-independent set-up of a PV/SOFC micro-CHP system combined with seasonal energy storage for residential applications. Energy 2022, 15, 1388. [Google Scholar] [CrossRef]
  70. Uyan, M. GIS-based solar farms site selection using analytic hierarchy process (AHP) in Karapinar region, Konya/Turkey. Renew. Sustain. Energy Rev. 2013, 28, 11–17. [Google Scholar] [CrossRef]
  71. Jahangiri, M.; Ghaderi, R.; Haghani, A.; Nematollahi, O. Finding the best location for establishment of solar-wind power stations in Middle-East using GIS: A review. Renew. Sustain. Energy Rev. 2016, 66, 38–52. [Google Scholar] [CrossRef]
  72. Sliz-Szkliniarz, B.; Vogt, J. GIS-based approach for evaluation of wind energy potential: A case study for the Kujawsko-Pomorskie Voivodeship. Renew. Sustain. Energy Rev. 2011, 15, 1696–1707. [Google Scholar] [CrossRef]
  73. Sliz-Szkliniarz, B.; Vogt, J. A GIS-based approach for evaluating the potential of biogas production from livestock manure and crops at a regional scale: A case study for Kujawsko-Pomorskie Voivodeship. Renew. Sustain. Energy Rev. 2012, 16, 752–763. [Google Scholar] [CrossRef]
  74. Rozakis, S.; Kremmydas, D.; Pudełko, R.; Borzecka, M. Straw potential for energy purposes in Poland and optimal allocation to major co-firing power plants. Biomass Bioenergy 2013, 58, 275–285. [Google Scholar] [CrossRef]
  75. Ozawa, A.; Kudoh, Y. Assessing uncertainties of life-cycle CO2 emissions using hydrogen energy for power generation. Energies 2021, 14, 6943. [Google Scholar] [CrossRef]
  76. Ćosić, B.; Krajačić, G.; Duić, N. A 100% renewable energy system in the year 2050: The case of Macedonia. Energy 2012, 48, 80–87. [Google Scholar] [CrossRef] [Green Version]
  77. Główny Urząd Statystyczny. Zużycie Paliw i Nośników Energii w 2019 Roku; GUS: Warsaw, Poland, 2019.
  78. Igliński, B.; Cichosz, M.; Kujawski, M.; Plaskacz-Dziuba, M.; Buczkowski, R. Helioeneregy in Poland–Current state, surveys and prospects. Renew. Sustain. Energy Rev. 2016, 58, 862–870. [Google Scholar] [CrossRef]
  79. Rataj, M.; Berniak-Woźny, J.; Plebańska, M. Poland as the leader in terms of photovoltaic market growth dynamics–behind the scenes. Energies 2021, 14, 6987. [Google Scholar] [CrossRef]
  80. Gnatowska, R.; Moryń-Lucharczyk, E. The place of photovoltaics in Poland’s energy mix. Energies 2021, 14, 1471. [Google Scholar] [CrossRef]
  81. Igliński, B.; Iglińska, A.; Kujawski, W.; Buczkowski, R.; Cichosz, M. Bioenergy in Poland. Renew. Sustain. Energy Rev. 2011, 6, 2999–3007. [Google Scholar] [CrossRef]
  82. Główny Urząd Statystyczny. Rocznik Statystyczny Leśnictwa 2020; GUS: Warsaw, Poland, 2020.
  83. Główny Urząd Statystyczny. Rocznik Statystyczny Rolnictwa 2020; GUS: Warsaw, Poland, 2020.
  84. Jasiulewicz, M. Potencjał Biomasy w Polsce; University of Technology in Koszalin Publishing: Koszalin, Poland, 2010. [Google Scholar]
  85. Igliński, B.; Buczkowski, R.; Iglińska, A.; Cichosz, M.; Piechota, G.; Kujawski, W. Agricultural biogas plants in Poland: Investment process, economical and environmental aspects, biogas potential. Renew. Sustain. Energy Rev. 2012, 7, 4890–4900. [Google Scholar] [CrossRef]
  86. Piechota, G.; Igliński, B. Biomethane in Poland–current status, potential, perspective and development. Energies 2021, 14, 1517. [Google Scholar] [CrossRef]
  87. Główny Urząd Statystyczny. Ochrona Środowiska 2020; GUS: Warsaw, Poland, 2020.
  88. Kasiulis, E.; Punys, P.; Kvaraciejus, A.; Dumbrauskas, A.; Jurevičius, L. Small hydropower in the Baltic States–current status and potential for future development. Energies 2020, 13, 6731. [Google Scholar] [CrossRef]
  89. Kishore, T.S.; Patro, E.R.; Harish, V.S.K.V.; Haghighi, A.T. A comprehensive study on the recent progress and trends in development of small hydropower projects. Energies 2021, 14, 2882. [Google Scholar] [CrossRef]
  90. Manzano-Agugliaro, F.; Taher, M.; Zapata-Sierra, A.; Juaidi, A.; Montoya, F.G. An overview of research and energy evolution for small hydropower in Europe. Energ Convers. Manag. 2017, 75, 476–489. [Google Scholar] [CrossRef]
  91. Restor Hydro. Available online: www.restor-hydro.eu/en/tools/mills-map (accessed on 21 November 2020).
  92. Igliński, B. Hydro energy in Poland: The history, current state, potential, SWOT analysis, environmental aspects. Intern. J. Energy Water Resour. 2019, 3, 61–72. [Google Scholar] [CrossRef] [Green Version]
  93. Date obtained from National Water Management Board. 2020.
  94. Data obtained from Geodesic and Cartographic Documentation Centre. 2020.
  95. Szewczyk, J.; Gientka, D. Terrestrial heat flow density in Poland–A new approach. Geol. Q. 2009, 1, 125–140. [Google Scholar]
  96. Igliński, B.; Buczkowski, R.; Kujawski, W.; Cichosz, M.; Piechota, G. Geoenergy in Poland. Renew. Sustain. Energy Rev. 2012, 5, 2545–2557. [Google Scholar] [CrossRef]
  97. Data obtained from Central Geological Database. 2020.
  98. Bujakowski, W.; Tomaszewska, B. Atlas Wykorzystania Wód Termalnych do Skojarzonej Produkcji Energii Elektrycznej i Cieplnej przy Zastosowaniu Układów Binarnych w Polsce; Jak: Kraków, Poland, 2014. [Google Scholar]
  99. Gospodarka Konin. Wyspa Pociejewo. Available online: http://gospodarka.konin.pl/wyspa-Pociejewo.htmlx (accessed on 1 October 2021).
  100. WWF. EU Coal Regions Share Just Transition Needs Despite Their Differences. Available online: https://wwf.panda.org/wwf_news/?359877/EU-coal-regions-share-just-transition-needs-despite-their-differences (accessed on 1 October 2021).
Figure 1. Capacity of RES in Poland (own study based on [47]).
Energies 15 02296 g001
Figure 2. The physico-geographical map of the Greater Poland Voivodeship—watercourses and reservoirs (own study).
Energies 15 02296 g002
Figure 3. Average wind speed at a height of 100 m (own calculations).
Energies 15 02296 g003
Figure 4. Area available for wind energy development—the built-up area with the buffer zones of 700 m and 1400 m in the Greater Poland Voivodeship (own calculations).
Energies 15 02296 g004
Figure 5. Area available for wind energy development—flood plains with the buffer zones of 700 m and 1400 m in the Greater Poland Voivodeship (own calculations).
Energies 15 02296 g005
Figure 6. Area available for wind energy development—protected areas with the buffer zones of 700 m and 1400 m in the Greater Poland Voivodeship (own calculations).
Energies 15 02296 g006
Figure 7. Area available for wind energy development—forest areas with the buffer zones of 700 m and 1400 m in the Greater Poland Voivodeship (own calculations).
Energies 15 02296 g007
Figure 8. Area available for wind energy development with the buffer zone of 700 m and 1400 m in the Greater Poland Voivodeship (own calculations).
Energies 15 02296 g008
Figure 9. Annual solar radiation energy per area unit in the Greater Poland Voivodeship (own calculations).
Energies 15 02296 g009
Figure 10. The gross covered area in the Greater Poland Voivodeship (own calculations).
Energies 15 02296 g010
Figure 11. Hydrotechnical structures in the Greater Poland Voivodeship (own calculations).
Energies 15 02296 g011
Figure 12. Location of sewage treatment plants with a minimum capacity of 1 million m3 per year (own calculations).
Energies 15 02296 g012
Figure 13. The map of terrestrial heat flow density for the Greater Poland Voivodeship in comparison to the whole of Poland (own study from [95,96]).
Energies 15 02296 g013
Figure 14. The bore holes of a minimum depth of 500 m in the Greater Poland Voivodeship (own study from [97]).
Energies 15 02296 g014
Table 1. Electricity and heat production from solid biomass in the Greater Poland Voivodeship (own calculations).
Biomass (Thousand tons)Calorific Value (MJ/kg)Amount of Energy (80%
Efficiency) (PJ)
Amount of Electric Power (30% Efficiency) (GWh)Amount of Heat (50%
Efficiency) (PJ)
Wooden waste540146.06673.0
Waste from
orchards
125161.61780.8
Straw492155.96563.0
Hay367154.54962.2
Energy crops51018.57.68403.8
Total 25.6283712.8
Table 2. Electric power and heat production from biogas in the Greater Poland Voivodeship (own calculations).
Source of
Biogas
Biogas (Million m3)CH4
Content (%)
CH4
Volume (Million m3)
Amount of Energy (85%
Efficiency) (TJ)
Amount of Electric Power (40% Efficiency) (GWh)Amount of Heat (45% Efficiency) (TJ)
Agriculture (manure, maize straw)1.36078023.73.112.5
Municipal waste10505.01522080
Sewage sludge1.6550.927414
Total 78623.83.112.6
Table 3. Parameters of binary geothermal heat and power plants in the Greater Poland Voivodeship (net power value, taking into account own energy usage and loss) [98].
LocalityDepth of the
Production Bore Hole (m)
Water
Temperature at the Outlet (°C)
Total
Thermal Power (MW)
Net Amount of Generated Heat (TJ/Year)Total
Electric Power (MW)
Net Amount of Generated Electric Power (GWh/Year)
Koło400011828.364.71.053.16
Turek3550982.450.250.451.70
Konin2897983.230.350.431.15
Ślesin3358980.300.350.452.54
Total - - - 65.65 - 8.55
Table 4. Technical potential of RES in the Greater Poland Voivodeship (own calculations).
RESAmount of Electric Power (TWh)Amount of Heat (PJ)
Wind Energy8.50
Solar Energy9.8421.45
Bioenergy5.9925.40
Hydropower0.63
Geothermal Energy0.010.01
Total23.3446.86
Demand in the Voivodeship12.4827.89
Oversupply of energy
(ratio)
1.871.68
Source: own calculations.
Publisher’s Note: MDPI stays neutral with regard to jurisdictional claims in published maps and institutional affiliations.

