Abstract
Power generation using wind has been extensively utilised, with substantial capacity add-on worldwide, during recent decades. The wind power energy sector is growing, and has turned into a great source of renewable power production. In the past decades of the 21st century, the capacity of installed wind energy has almost doubled every three years. This review paper presents the crucial facets and advancement strategies that were approved and adopted by the Government of India for intensifying the country’s own power safety, by the appropriate use of existing power sources. From India’s viewpoint, wind energy is not only utilized for power production but also to provide power in a more economical way. The particulars of India’s total energy production, contributions of numerous renewable sources and their demand are also encompassed in this paper. After an exhaustive review of the literature, detailed facts have been identified about the present position of wind energy, with an emphasis on government achievements, targets, initiatives, and various strategic advances in the wind power sector. Wind power potential is discussed, which can assist renewable power companies to select efficient and productive locations. All analyses carried out in this paper will be incredibly valuable to future renewable energy investors and researchers. The current scenario of wind power production in India is also paralleled with that of other globally prominent countries.
1. Introduction
Power is amongst the most crucial elements of infrastructure, essential for welfare and economic development of any country. Rapid exhaustion of the fossil fuels and tremendous growth in power demand has forced engineers worldwide to consider the utilisation of renewable energy sources (RES) [1,2,3]. The serious consequences of environmental deterioration have also focused universal attention towards RES. However, the cost of installation of such RES is higher, but their minimum operational costs and non-polluting nature is intensifying their use worldwide [4]. Wind power generation is a low-cost and profusely available resource. Therefore, various nations are beginning to recognise that wind energy offers a substantial opportunity for future electricity production. Consequently, installed wind capacity increases by more than 30% every year [5]. The stimulating and dominating characteristics of wind energy over other resources of energy are the reduction of greenhouse gases emissions, reduction of dependency on fossil fuels, no global warming, low operation and maintenance charges, no fuel cost, less set up time, low installation cost, and appropriate use of wind farm lands because wind turbine towers are tall and only inhibit a minor portion of land. Consequently, the land beneath the wind turbine towers can be used for agricultural purposes [6,7].
During the 1990s, the price of electrical power produced via wind was six times higher than current prices. Since then, wind power technology has been emerging at a fast rate among all RES with reference to enhanced installed capacity [8,9]. At the start of 2015, almost 85% of total global new wind power installation has been accomplished by the top ten wind energy leading countries, namely, China, US, Germany, India, Spain, UK, Canada, Italy, France and Denmark. Global new wind energy installations surpassed 90 GW in 2020, which was 53% growth since 2019, increasing total installed capacity to 742.9 GW. A growth of about 14% in comparison with the previous year was observed as shown in Figure 1. The top five marketplaces for new installations were mainly China, US, Brazil, Netherlands and Germany [10]. These marketplaces jointly comprised almost 81% of wind installations of the previous year, amounting to about 10% more than in 2019. At the end of 2020 the cumulative installations of the top five marketplaces was the same. These marketplaces were China, US, Germany, India and Spain, which collectively led to about 72.9% of the total wind energy installations as presented in Figure 2.
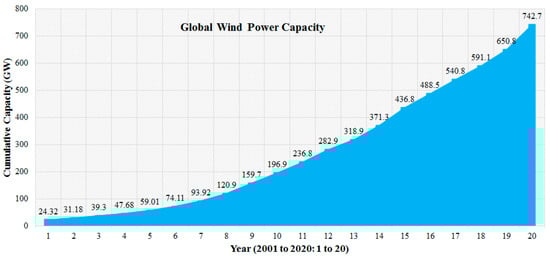
Figure 1.
Global wind power cumulative capacity (GW) (2006–2019) [7,8].
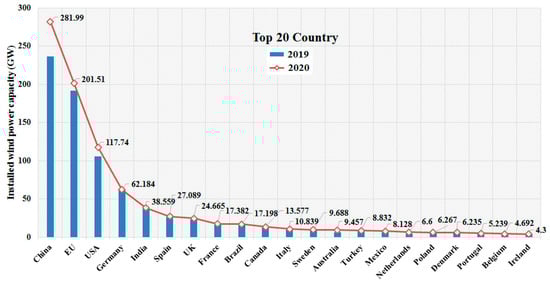
Figure 2.
Cumulative installed capacity (CIC) of wind power (MW) 2020 [7,11].
Wind power installation began in India in 1990 and has significantly increased over the past several years. The total installed wind power capacity as at December 2021 was 40.08 GW, being the fourth highest installed wind-power capacity globally [11]. Due to the reduced price of wind power from onshore wind energy, numerous wind power projects have been instigated. The Indian Government’s Ministry of New and Renewable Energy (MNRE) has set a renewable power target of 176 gigawatts by 2022 that involves 60 gigawatts of onshore wind power generation and 100 gigawatts of solar power generation [12,13]. To date, 40.1 gigawatts of wind power has been installed. In India, the main producers of wind energy have been Adani Green Energy, Alfanar, SembCorp Green Infra and Renew Power [13].
Figure 3 shows the CO2 emission (billion metric tons) produced by the foremost ten countries in the year 2020. It is worth noting that the above-mentioned amount of 742.9 GW of wind power production can reduce carbon dioxide emissions by 1.1 billion tons yearly.
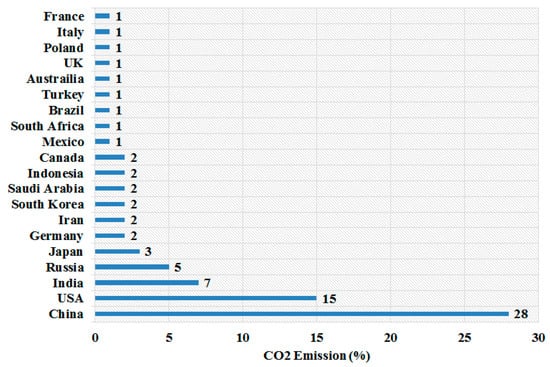
Figure 3.
CO2 emission in billion metric tons (as on 27 October 2020) by the foremost countries in world in the year 2020 [14].
As stated in the latest data of the Global Carbon Project, China, the United States, India, Russia, and Japan are the five top nations which generate the most carbon dioxide. Conventional power resources emit approximately half of the total carbon dioxide. Globally, China is the biggest emitter of CO2, as approximately 58% of the total power supplied in China is derived from coal alone. Worldwide, India is the third largest emitter of CO2, although it is still well behind China, the world’s largest emitter, and the United States. The global emission of CO2 totals approximately 33.1 billion metric tons each year [14,15,16]. However, due to COVID-19 induced lockdowns, the worldwide carbon dioxide emissions reduced by an estimated 2.4 billion metric tons in 2020. The Government of India is aware about its adverse impacts and has developed a National Action Plan (NAP) on changing climate. However, while growing the Indian economy improves the wellbeing level of individuals, it also upsurges the electricity demand. RES have emerged as the best solution for upholding the equilibrium between demand and generation of electricity.
In seeking to achieve this, the Government of India has taken numerous initiatives to augment wind energy utilisation, such as (i) no transportation concerns due to finished goods and raw material, (ii) no management and administrative problems for promoting wind energy, (iii) savings from various taxes, (iv) problems associated with sale of energy is no more because various distribution companies and state electricity boards are ready to buy the power, and, (v) easy availability of bank loans for installing wind power plants [17,18]. The growth of wind energy creates significant problems in areas such as grid integration, inter-connections, network stability, and frequency control, etc.
Therefore, for secure, stable and systematic operation of power systems, various nations have set up new grid codes. The majority of Indian states have gigantic wind power scope and other needed provisions for the steady and secure functioning of wind power plants. For upholding the energy development of any nation, forecasting the potential of future renewable energy is also necessary. Various techniques are being utilised to analyse and forecast the pattern of the future growth of wind power, and also the duration of time for attaining the technical wind power mission [19].
MNRE, Government of India, is outlining policy guidelines and looking towards the promotion of offshore wind projects. An analysis of the Indian shoreline has been conducted, which revealed that approximately 6–8% additional wind potential may occur along the eastern offshore [20]. To select the site, the main steps are to identify several potential sectors following data collection across a large area. Accurate forecasting of wind power density is also necessary for selection of the site. Various models such as Weibull distribution and extreme learning machine have already been implemented and are being utilised for determining the wind power density [21].
In the last 20 years, the worldwide generation of wind power has been advanced approximately 15 times. In addition, extensive research has been undertaken to estimate the future potential and current status of renewable power. Several technologies have been developed and implemented by many researchers for enhancing the renewable power potential and technology enhancement behind RESs for improving the system security and quality of power [22]. In this paper, precise data on the current state of wind energy in India is presented, with a focus on government activities, accomplishments, aims, policies, and wind energy development potential. From India’s perspective, efforts are being made to promote the wind’s potential capabilities.
2. Status of Global Wind Power
During the past few decades, several nations have become conscious of the harmful impacts of global warming. Hence, to reduce the environmental pollution and harmful impact of greenhouse gases all nations are eager to utilise RES. For the first time, 2015 witnessed an extraordinary growth of the wind industry as yearly installations traversed the historic mark of 60 gigawatts. Wind turbines with a capacity of more than 63 gigawatts have been installed. The earlier record was set in 2014, when more than 51.7 gigawatts of new capacity was added worldwide [23]. In 2016, 54 gigawatts of wind energy capacity was added around the world.
The rapid development of, and large capacity addition to, the renewable power-sector is mainly delivered by hydro, solar and wind power. However, in the majority of nations, among all the RES, wind farms contribute the most power due to being easily available and having a low maintenance cost. Figure 4 presents the renewable power contribution (in TWh) of the foremost six countries in 2020.
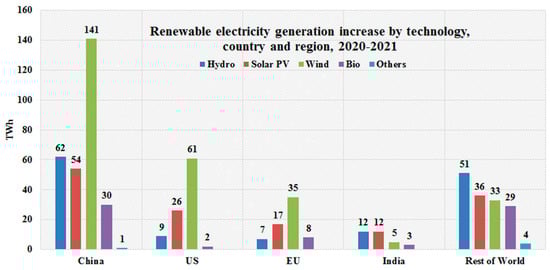
Figure 4.
Global top countries in the world with renewable power capacities in 2020 (in TWh). Source: REN21 (Renewable Energy Policy Network for the 21st Century) [25].
At present, the majority of nations have recognised the necessity of renewable energy and have engaged in innovating for large investment in the renewable power sector, and intend to grow further. In 2019, global investment was USD 282.2 billion in new RE capacity, and merely 1% higher than the total of the year before. The highest figure of USD 315.1 billion was set in the year 2017, while in the year 2020, global investment in RE capacity increased by 2% to USD 303.5 billion [24].
Figure 5 presents investment flow of RES among developing and developed countries from 2009 to 2019. The data clearly shows that since 2015, overall investment flows in RE among emerging nations have outpaced total investments in developed nations. In 2015, investment in wind power grew by 9% (i.e., USD 107 billion), while solar PV investment grew by 12% (i.e., USD 148.3 billion) in the same year as compared with 2014. Additionally, in 2019 investment was USD 152 billion, or 55% of the global total of USD 282.2 billion.

Figure 5.
Flow of investment in renewable energy in the world from 2009 to 2019 (in billion USD). Source: REN21 (Renewable Energy Policy Network for the 21st Century) [25].
This was the same percentage as in 2018, however it was down from 62% in 2017. Other developing nations, excluding India and China, invested most in renewable energy capacity in 2019. This increased by 17% to USD 59.5 billion, more than doubling the previous year’s figure [25].
For any energy sector, employment is the major factor; accordingly, the wind power field has the capability of creating employment that grows each year, in various nations. Therefore, the renewable energy field demands the majority of people for research and development, operation, maintenance and expansion. Throughout the world, employment in the renewable energy field is continuously growing.
In 2019, global employment in RE was calculated at 11.5 million jobs, while in 2018 it was estimated at 11 million jobs, as shown in Figure 6. Since 2012, global RE employment has been continuously growing. The biggest employers have been solar PV, wind power, hydro, and bio-energy industries.
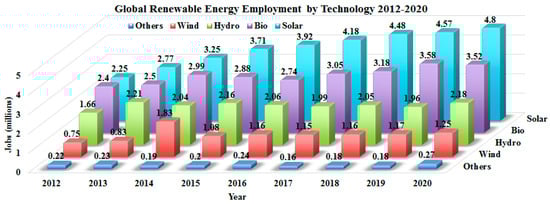
Figure 6.
Global employment in the field of renewable energy (2012–2019). Source: Renewable Energy and Jobs [28].
Table 1 displays global existing status of estimated jobs in 2019 in the field of renewable power. United States and China are consistently working in the RE sector and upheld their top places for annual investment, capacity add-on and power production from solar and wind energy [25,26,27].

Table 1.
Global status of jobs in the renewable energy industry in 2019. Source: Renewable Energy and Jobs [28]. Where, x = data is available.
In 2019, 11.5 million people were employed in the renewable energy sector. Asia was the market leader with 63% of all renewable energy jobs. Solar PV was the biggest employer in the sector with about 3.8 million jobs. Additionally, jobs related to biofuels followed closely behind, at nearly 2.5 million jobs. Most jobs were in the agricultural sector, primarily in Thailand, Philippines, Malaysia, Brazil and Colombia. Hydro and wind were large employees too, creating 1.2 million and 2 million jobs, respectively [25]. Jobs in the renewable sector are more inclusive and gender-balanced than the fossil-fuels sector, with women holding 32% of total RE jobs, in contrast to just 21% in fossil fuels. While COVID-19 has certainly hit the renewable job market, stimulus programmes safeguard existing jobs, create new ones, and keep the world on track towards creating 42 million renewable jobs by 2050 [28,29].
China is the global leader in the addition of capacities of solar PV, wind, bio-power and hydro power, while Spain and the United States lead with the highest net addition in focused geothermal power capacity and solar-thermal power capacity in 2019, as presented in Table 2. According to the GWEC report, the world’s capacity to produce wind power increased by 55% percent in 2020.
Table 2.
Worldwide ranking in annual investment/net capacity additions/production (at the end of 2019). Source: Renewable energy policy network for the 21st century (REN21) [25].
In 2020, a total of 93 gigawatts of capacity was installed. This record growth in 2020 was motivated by a swell of wind capacity installations in China and the U.S., the two largest wind energy marketplaces of the world [27]. The two countries accounted for 75% of new installations and over half the world’s energy capacity. Onshore generation capacity accounted for 86.9 GW while 6.1 GW was offshore. Presently, the world’s total wind power capacity is about 743 GW, while in 2019, the world’s cumulative wind power capacity was 655.9 GW. Germany (8754 MW) was the world’s largest wind power producer at the beginning of 20th century, followed by the United States (4258 MW), Spain (3337 MW) and India (1507 MW), etc., as shown in Table 3. At present, India and China are experiencing large demand for power because of their large populations. Thus, it is necessary to enhance electricity production from RE sources to meet their increasing demand. As a result, numerous countries have established renewable power plants and are deploying cutting-edge technology to increase production capacity. At the end of 2020, worldwide installed wind energy capacity reached a huge level of 742,689 MW, while in 2019, capacity was 650,758 MW [26,27,28,29]. The top 10 ranked countries generate 611,230 MW of wind power as shown in Table 3, while the remaining countries produce 15% of global wind power.
Table 3.
Wind power installation capacities of the world’s major countries on a year-by-year basis (MW, in the end of 2020). Source: The wind power; wind farms and wind turbines database [30].
Figure 7 shows the wind power plants instalment rate which is very large in China, USA, Germany and India, in contrast with the other nations. China has sustained top position by utilising a moderate working environment, large workforce and modern technologies in wind energy generation. Recently, the governments of 80 nations have globally concentrated on power generation activity via wind. As such, 26 nations have generated above 1 GW of wind power [30].
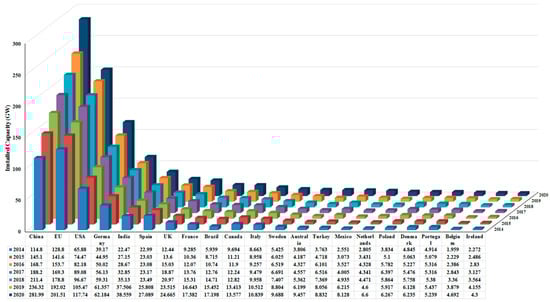
Figure 7.
Growth of wind power installation capacities of foremost countries in MW (as on 31 December 2020). Source: The wind power; wind farms and wind-turbines database [30].
Worldwide, the biggest wind power plant (as on 20 January 2021) is Jiuquan Wind Power Base (JWPB) located in Gansu Province, China, with a 20 GW generation capacity. During the past two to three years, China has maintained its top position in the installation of the highest number of wind power plants with the highest installed capacity [31,32,33,34,35,36].
The second biggest wind power plant in the world is situated in the Rajasthan state of India, which produces 1600 MW of wind energy. The top 10 largest wind power plants worldwide, their maximum production capabilities, and their corresponding country, is presented in Table 4 [37,38].
Table 4.
Top 10 largest wind farms in world (as on 20 January 2021). Source: Global Energy Observatory [37], Power Technology [38].
In 2017, the total renewable power capacity reached 2179 GW. However, hydro power contributed the biggest part of the world RE, with 1152 GW installed capacity. Solar and wind power contributed a major portion, with capacities amounting to 397 GW and 514 GW, respectively. Other renewable sources were 500 MW of marine power, 13 GW of geothermal power and 109 GW of bio-power [32].
In 2018, global renewable production capacity was 2351 GW, where hydropower contributed the biggest share, with an installed capacity of 1172 GW. Solar and wind power contributed the major portion, providing capacities of 486 GW and 564 GW respectively. Other renewable sources were 500 MW of marine power, 13 GW geothermal power, and 115 GW of bio-power [33].
During 2019, worldwide renewable power capacity was 2537 GW, where hydropower contributed the major portion with a capacity of 1190 GW. Solar and wind power contributions were 586 GW and 623 GW installed capacities, respectively, while other renewable sources such as marine power, geothermal, and bio-power contributed 500 MW, 14 GW and 124 GW, respectively [34].
During 2020, global renewable power capacity reached 2799 GW. Hydropower continued to be the major producer of the global total, with a capacity of 1211 GW. Solar and wind contributed equally to the remainder, with capacities of 714 GW and 733 GW, respectively. However, other renewable-sources, namely, marine power, geothermal power and bio-power capacities were 500 MW, 14 GW and 127 GW, respectively [35]. Renewable production capacity by various sources of energy from 2017 to 2020 is shown in Figure 8.
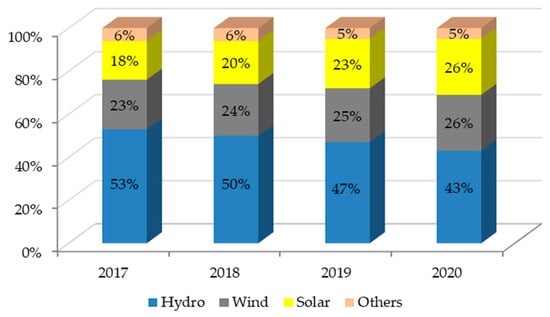
Figure 8.
Renewable production capacity by energy sources (2017–2020). Source: Global Wind Report [32,33,34,35].
Figure 9a,b shows the percentage of new installations of onshore and offshore wind farms, while Figure 8c,d shows the percentage of total installations of onshore and offshore wind farms [36].
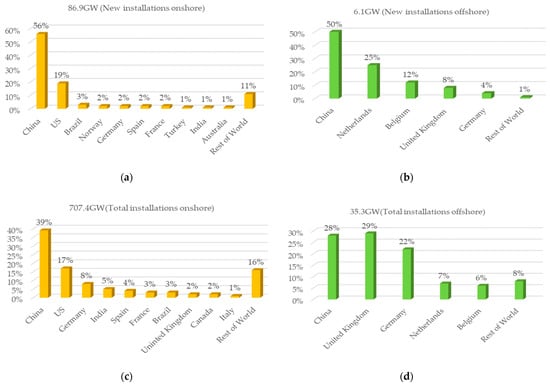
Figure 9.
(a) New installations onshore (%); (b) New installations offshore (%); (c) Total installations onshore (%); (d) Total installations offshore (%). Source: Global Wind Report 2021. Source: Global Wind Report [36].
3. Various Achievements and Significant Information Related to Worldwide Wind Energy
Successes of several nations towards wind-energy production are enumerated as follows:
- At the end 2014, 2.5% of worldwide power was delivered by wind;
- The most powerful offshore wind turbine in the world is Haliade-X, with 14 megawatts capacity, a 107 m blade, rotor diameter of 220 m, digital capabilities, and located in Saint-Nazaire, France;
- According to the Global Wind Energy Council (GWEC), at the beginning of 2017, more than 341,000 wind turbines were revolving and generating power;
- Since 2020, China and USA have been two outstanding growth markets of wind energy;
- In the beginning of 2021, worldwide renewable production capacity reached 2799 GW, with hydropower contributing the major portion (1211 GW) although wind and solar are increasing fast;
- China, already the biggest global marketplace for renewable energy production, added 136 GW in 2020, with the major portion sourced from 49 GW of solar and 72 GW of wind;
- The United States installed 29 GW of renewable capacity in 2020, about 80% more than in 2019, including 14 GW of wind, and around 15 GW of solar;
- The increased share of renewables as a portion of the total energy production is partially attributable to the net withdrawal of fossil fuel power in North America, Europe and Turkey, Russia, Georgia, Azerbaijan and Armenia. Total fossil fuel add-on dropped to 60 GW in 2020 from 64 GW the previous year, underlining a continued downward trend of fossil fuel increase;
- Wind power growth nearly doubled in 2020 (111 GW) as compared with 2019 (58 GW);
- Emissions of carbon and sulphur oxides in 2020 reduced by nearly 7%, the biggest drop ever, as nations around the globe enforced lockdowns to restrain the spread of COVID-19. Nearly 743 GW of wind energy capacity could reduce the emission of over 1.1 billion tons of CO2 in 2020, globally;
- India installed new wind capacity of 1119 megawatts in 2020. In addition, the renewable energy target of 175 gigawatts could be achieved by 2022, which includes 60 gigawatts of onshore wind. The Government of India has also shared its dream for a long-term renewable energy target of 450 GW by 2030, including a target of 140 gigawatts of wind capacity;
- India, is the fourth largest power consumer following China, the United States, and the European Union, and the third highest carbon emitter after China and USA;
- For onshore installations, 2020 was a record year. South America, North America and the Asia Pacific jointly installed 74 GW of new onshore wind capacity, 76% more than the previous year. In the offshore market, 6.1 GW was installed globally in 2020, making 2020 a great year;
- As stated in the GWEC report, wind power helped the world reduce emissions of CO2 by more than 637 MT. In addition, 2020 witnessed milestone commitments to carbon neutrality, with South Africa, Canada, South Korea, Japan and EU each pledging to achieve net zero by 2050;
- Incorporating China’s net zero intention by 2060 and the United States’ target to reach net zero by 2050, nations which have planned net zero target now represent two-thirds of the world economy and 64% of the global greenhouse gases emissions;
- According to IEA and IRENA, to control global warming worldwide it is necessary to install at least 180 gigawatts of new wind energy capacity annually to limit global warming to below 2 °C, and would need to install up to 280 GW annually to construct pathway yielding net zero by 2050;
- The Wind Vision Report of the Department of Energy states that wind could potentially create more than 600,000 jobs by 2050, and help reduce 12.3 gigatons of greenhouse gases [39,40].
4. Power Scenario in India
For every developing nation, economic projections are crucial, and power is required to sustain financial progress. Indian GDP in 2020 was about −7.97%, compared with 2019. It grew to 0.4% in the last three months of 2020, somewhat below market forecasts of 0.5%. The GDP of India increased to USD 2868.93 billion in 2019, from USD 2713.17 billion in 2018.
Since the beginning of the 21st century, from 2014 to 2018 the yearly average growth in GDP was 6 to 7%. It indicates that a huge increase in the supply of power would be desirable to meet the rising demand. India developed 117.9 GW of electricity generation capacity between April 2015 and February 2021, which included 53.4 GW with RES and 64.5 GW with fossil fuels.
India’s aggregate installed generation capacity, including from conventional and renewable sources, as at 28 February 2021, was 379.1 GW [41,42].
According to the MNRE, Government of India, at the end of 2021 the total renewable power generation was 104,879 MW, where solar contributed 49,347 MW, wind was 40,083 MW, small hydro contribution was 10,610 MW and biomass contribution was 4839 MW, as shown in Figure 10.
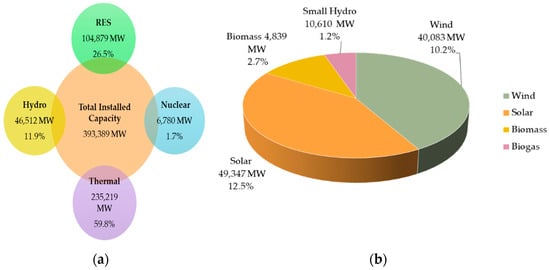
Figure 10.
(a) Total installed capacity as on 31 December 2021 (Ref: Ministry of Power); (b) RES status as at 31 December 2021 (Ref: MNRE); Source: Global Wind Report 2021. Source: Ministry of Power, Central Electricity Authority, Government of India [41].
If the difference between generation and load remains for an elongated time, the power system will become voltage unstable and may lead to system blackouts. India’s power grid is distributed into five regions, i.e., north-eastern, eastern, southern, northern, and western regions. Amid all five regions, the northern-region has the highest power consumption per capita. This region is one of the largest regions and constitutes approximately 30.8% of country’s total area and 31% of the country’s population, contributing over 26% to the national GDP.
As per the Ministry of Power data for all regions, the total load demand was 1,291,009 MU in 2019–2020, while 1,284,443 MU was available, at a deficit rate of 0.5%. During the period 2020–2021, total demand was 1,407,528 MU, while 1,445,085 MU was available, at a deficit rate of 0.5% [42]. Therefore, it becomes evident that the total power production of India is augmented at a larger rate due to the execution of several ventures in the renewable field. Therefore, the gap between generation and load demand is reduced.
India’s peak power supply was 182,533 MU, whereas the peak power demand was 183,804 MU with a 0.7% deficit rate in the fiscal year 2019–2020. The peak demand has now increased to 199,348 MU, but the peak supply has been 217,507 MU at a 9.1% deficit rate.
From this analysis, it is evident that as the peak power demand grows each year, the new technologies and increased installation rate of green power curtail the deficit power. Due to geography and huge population, the north-eastern region has low demand, while the northern region has high demand.
Table 5 displays the peak demand, peak availability, and electricity deficit in India by region for the fiscal years 2019–2020 and 2020–2021 [41,43]. The past trends indicate that with time, power demand is growing, therefore, to achieve consistent functioning of the power system, a balance in power must be retained.
Table 5.
Power scenarios in the financial years 2019–2020 and 2020–2021 as on 28 February 2021, Source: Ministry of Power, Central Electricity Authority, Government of India [41].
As stated in the report of ‘Ministry of Power, Government of India’, seven states announced 1.909 million un-electrified households (HH) that were identified before March 31, 2019, from which 1.565 million households were electrified up to 31 August 2020 as shown in Table 6 [44].
Table 6.
Households per state that were electrified under Saubhagya since launch of the scheme, i.e., 11 October 2017 to 31 March 2019. Source: Ministry of Power, Central Electricity Authority, Government of India [44].
As stated by the State Government, all inhabited villages across the country stood electrified on 28 April 2018. In October 2017, “Pradhan Mantri Sahaj Bijli Har Ghar Yojana–Saubhagya” was introduced by the Indian government with the objective of supplying widespread access to power by giving electricity links to every poor household in town areas, and to each un-electrified home in rural areas, throughout the nation, by March 2019. Additionally, a declaration of electrification of all households was announced by all states, apart from the left wing extremist (LWE) affected zones of Chhattisgarh. There are 18,734 households on the Saubhagya portal as at 31 March 2019.
Across the nation, about 26.3 million households were electrified by 31 March 2019, since the commencement of Saubhagya scheme. Table 7 shows the number of electrified households by state [44].
Table 7.
Households, by state, electrified under Saubhagya since launch of the scheme, i.e., 11 October 2017 to 31 March 2019. Source: Ministry of Power, Central Electricity Authority, Government of India [44].
The Indian government has the target of producing 175 gigawatts with RES, i.e., 60 gigawatts from wind energy, 100 gigawatts from solar energy and 15 gigawatts from small hydro and biomass, by the end of 2022.
Table 8 displays the position of electricity supply status in India, by state, with regard to requirements, availability and deficit/surplus in the fiscal year 2019–2020. Jammu and Kashmir have the largest energy deficit of 18.8%; however, it is mostly the states of the north-eastern region (Arunachal Pradesh, Manipur, Mizoram, Nagaland, Tripura, Assam, and Meghalaya) which are struggling with power deficit issues [45]. In order to attain the set target by 2022, Table 9 suggests the potential distribution of the installation of new renewable energy resources.
Table 8.
India’s electricity supply status by state in the fiscal year 2019–2020, in MU. Source: Ministry of Power, Central Electricity Authority, Government of India [45].
Table 9.
Potential distribution of renewable energy goals, by state, to be achieved by 2022, Source: Ministry of New and Renewable Energy (MNRE), Government of India [46].
Table 10 shows the Indian power production scenario by resource (thermal, nuclear, hydropower, renewable energy) and sector (central, private and state). In January 2021, India’s total available energy capacity was 377,260.67 MW, with 94,736.93 MW supplied by the central sector, 178,895.36 MW by the private sector, and 103,628.39 MW by the state sector. In India, the private sector leads in power production capacity by utilising their enormous economic structures, better technology and large workforce.
Table 10.
Power scenarios (MW) by resource and sector, as on 31 March 2021. Source: Central Electricity Authority, Government of India [45].
The total power produced by RES was 92,550.74 MW at the end of January 2021. Therefore, it clearly evident from Table 10 that coal is the dominating power resource with a contribution of 20,028 MW in India, however in recent times RES are quickly encouraging the addition of maximum green energy production [45].
Table 11 presents all RES contributions to India’s energy scenario at the end of January 2021. Among all RESs, solar energy sources have produced the most power (38,794.07 MW) [45]. At March 2021, India’s overall sum of grid-associated renewable energy production potential reached a milestone of largest energy output from RESs (92,970.48 MW). It comprised 38,789.15 MW of wind energy (approximately 41.7 percent of total renewable power), 39,083.71 MW of solar energy (42 percent of total renewable power) and 15,097.62 MW from the remaining RESs (16.3 percent of total renewable power), namely, small hydropower, waste to power and bio-power [47].
Table 11.
Break up of power produced from RES (MW) as on 31 March 2021, Source: Central Electricity Authority, Government of India [45].
The states of West Bengal, Telangana, Sikkim, Mizoram, Jammu and Kashmir, Bihar, Madhya Pradesh and Tripura have achieved their goal of 100% household electrification. The states which have almost attained the goal of 100% household electrification are Gujarat, Andhra Pradesh, Tamil Nadu, Punjab, Kerala and Goa. Many of the states, such as Arunachal Pradesh, Chhattisgarh, Himachal Pradesh, Maharashtra, Uttarakhand, have few remaining un-electrified households and are estimated to shortly accomplish the goal of 100% electrification under the great initiatives of the Government of India, ‘Saubhagya’ and ‘Pradhan Mantri Sahaj Bijli Har Ghar Yojana’, which were announced in September, 2017, with the goal of giving all households 24 hour, 7 days per week access to the electric supply [48,49,50,51].
5. Wind Resources of India
The wind power density at any place is defined as the average annual power available per square meter of turbine-swept area. Quantitatively, it is measured at different altitudes above the ground level (AGL) and is expressed in W/m2. At the site, it specifies the accessible power which can be transformed into electricity [52]. The wind energy potential of distinct sites at the various heights of 50 m, 80 m and 100 m above the ground of India, is presented.
5.1. Wind Power Potential at 50 m Height
In April 2010, the National Institute of Wind Energy (NIWE) assessed India’s wind power potential (WPP) and issued a wind atlas with a resolution of 5 kilometers for hub heights of 50, 80, and 100 m. All results and maps were created in collaboration with the RISO-DTU, Denmark’s National Laboratory for Sustainable Energy, on the basis of micro- and mesoscale data [53]. NIWE has acquired advanced modelling tactics and reconsidered this analysis in accordance with the directives and guidance of the Ministry of New and Renewable Energy (MNRE), Government of India, using practical and realistic assumptions to measure the wind power potential of 302 gigawatts at a height of 100 m [54]. Wind power potential is classified as 0–100 W/m2, 200 W/m2, 200–250 W/m2, 250–300 W/m2, 300–400 W/m2 and 400–500 W/m2. The states with projected maximum WPP are Gujrat and Karnataka, having 21.59 gigawatt and 17.5 gigawatt WPP with a range of 400–500 (W/m2) wind power density. Mostly states have low wind power density (i.e., 0–100 W/m2), such as Andaman and Nicobar with 0.004 gigawatt WPP. Few states have moderate wind power density (i.e., 200–250 W/m2), such as Rajasthan, Maharashtra, Madhya Pradesh, West Bengal, Tamil Nadu, Karnataka, Andhra Pradesh and Orissa [55,56,57].
From Table 12, it is evident that most states in India have low wind power density. Therefore, in such circumstances, wind power production is extremely difficult and necessitates the use of several current technologies for the production of wind power from low wind density.
Table 12.
India’s wind power potential at 50 m above ground level (gigawatts). Source: NIWE, India [58].
The state-by-state percentage distribution of wind power potential is shown in Figure 11. It is observed that Gujarat is clearly the leading producer, having 21% of the potential for wind power followed by Karnataka, Tamil Nadu, Andhra Pradesh, Jammu and Kashmir, Maharashtra, Rajasthan, Orissa, Madhya Pradesh and Kerala, whereas, a nominal wind power potential of less than 2% is served by rest of the Indian states, which is collected from the various states having limited units of wind turbines. As a result, India’s coastline states have the maximum wind energy potential, except Jammu and Kashmir state which has 11% of the distribution, primarily because of rising wind speed, high density wind and high altitude [58].
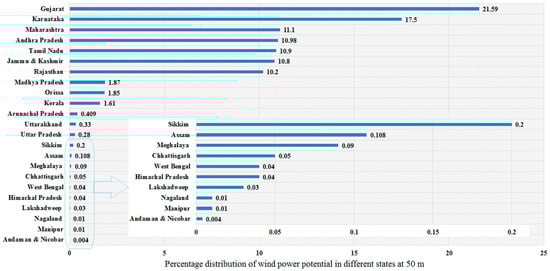
Figure 11.
Percentage distribution of wind power potential in different states at 50 m AGL [58].
5.2. Wind Power Potential at 80 m Height
For assessing the WPP, the Karlsruhe Atmospheric Mesoscale Model (KAMM) which utilizes a large-scale climatology, is applied. WPP is simulated with KAMM model and wind, and atlas-files are created. The final wind power density map is replotted after the wind power density map, developed using actual data, and is coupled with the obtained mesoscale wind power density map of 80 m. In addition, weightage is only given for the area’s topographical factors. Then, each wind power density range of the whole area is estimated.
On account of several reasons such as water bodies, forest and habitat, etc., the entire ground surface shielded by the isopleths cannot be expected to be accessible for wind farm development. Table 13 shows the potential of wind power at 80 m AGL in India. The states with the largest potential are Gujarat (35.071 GW), Andhra Pradesh (14.497 GW), Tamil Nadu (14.152 GW) and Karnataka (13.593 GW).
Table 13.
Wind power potential in India at 80 m AGL (gigawatts). Source: NIWE, India [58].
Figure 12 presents the percentage distribution of the potential wind power in distinct states at 80 m above ground level. When compared with the 50 m AGL data, it is found that Jammu and Kashmir at 80 m and 50 m AGL exhibits a potential share of around 6% and around 11%, respectively, which is an exception of the coastal areas as mentioned previously. Moreover, Gujarat at 80 m and 50 m AGL exhibits around 34% and around 21% potential, respectively, leading the coastal states [58].
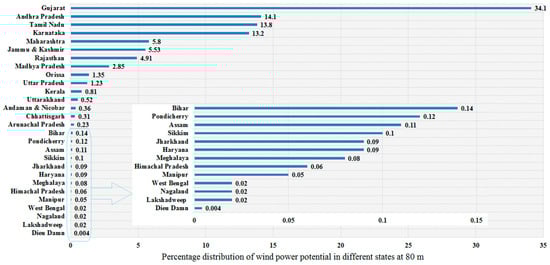
Figure 12.
Percentage distribution of wind power potential in different states at 80 m AGL [58].
5.3. Wind Power Potential at 100 m Height
The validated and improved meso–macro coupled wind flow model was used by NIWE to estimate potential at a high spatial resolution of 500 m. The outcomes revealed that Maharashtra, Tamil Nadu, Andhra Pradesh, Gujarat and Telangana are the maximum potential states. The current potential evaluation was carried out with the use of an advanced meso-micro coupled computational wind flow model and the corroboration of approximately 1300 real measurements sourced from every corner of India [58,59].
Additionally, the analysis included a land availability assessment utilizing National Remote Sensing Centre (NRSC) 56 m resolution ‘Land use land cover’ (LULC) data, and Advanced Wide Field Sensor (AWiFS) at 1:250 K scale and with a 6 MW/km2 consideration.
The incompetent features of a wind-farm site were omitted from the wind potential map by using a suitable buffer/set-off. Furthermore, airports, protected area, railways and roads, etc., were excluded. In the map, land with elevation beyond 1500 m and slope above 20 m were also omitted. The features of land were grouped as wasteland (Rank 1), cultivable land (Rank 2) and forest land (Rank 3). A substantial weight of 80% for Rank 1, 30% for Rank 2, and 5% for Rank 3, has been assumed for the assessment as shown in Table 14. The maps were formed in capacity utilization factor (%CUF) scale and a %CUF above 20% was determined for assessment of potential [57].
Table 14.
Wind power potential in India at 100 m AGL (GW). Source: NIWE [58].
Figure 13 depicts India’s wind power potential map at 100 m above ground level. It is clearly evident from the map that Gujarat state has the maximum predicted wind potential, followed by Tamil Nadu, Andhra Pradesh, Maharashtra and Karnataka [58].
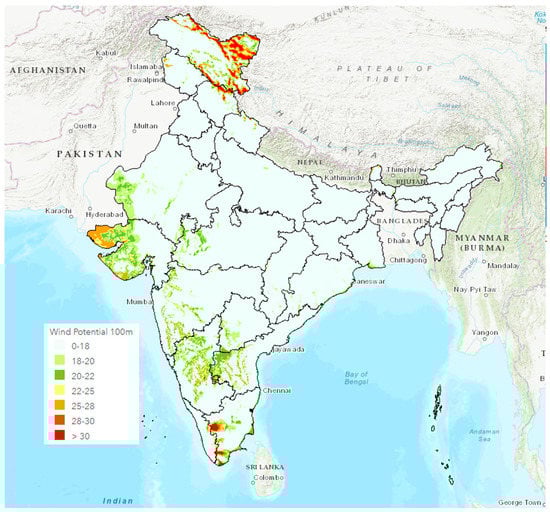
Figure 13.
Map showing wind power density at 100 m AGL [58].
6. Installed Wind Power Capacity in India
India’s wind power growth is phenomenal, which exhibits the achievement of the regulations and policies adopted by State and Union governments over time. The hard work of the wind power industry has led the nation to attain the milestone of more than 37 gigawatts. Seven states of India, located around the southern-western coast area, supplemented with significant wind power potential, constitute far above 99% of the total installed capacity [59].
It is seen that, as of 31 January 2021, the cumulative installed capacity of Karnataka is the largest with 15,387.98 MW, followed by Tamil Nadu, Gujarat and Maharashtra, with installed capacities of 14890 MW, 12442.85 MW and 10266.87 MW, respectively. With Rajasthan and Andhra Pradesh added to the list, the count improved to nine states. Table 15 presents installed capacity of wind power (in megawatts), by year and state, from fiscal year 2010–2011 to fiscal year 2019–2020. Figure 14 shows the percentage of the installed capacity of wind turbines by state in India from fiscal year 2019–2020. It is noted that the goal is to achieve 60 gigawatts by 2022.
Table 15.
Installed wind power capacity (in MW) by year and state, as at 31 March 2019. Source; Indian Wind Energy Association (IWEA) [60] (as at 31 March 2020).
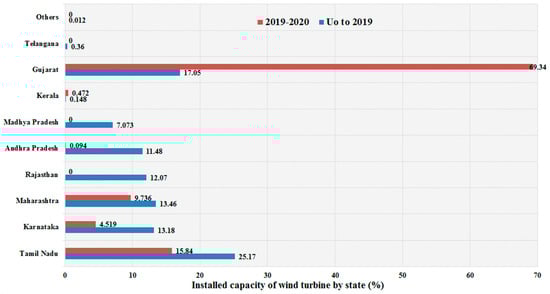
Figure 14.
Percentage of installed capacity of wind turbine by state, in India (2019–2020) [60].
Furthermore, Tamil Nadu leads the other states in wind energy installation capacity, accounting for 25% of the total. Maharashtra, Rajasthan, Karnataka, Gujarat, and Andhra Pradesh, on the other hand, have installed more than 93%of the total. Wind power accounts for 99.54% of total installed capacity in the primary seven states. Nearly 40% of installations are concentrated in Tamil Nadu and Gujarat, demonstrating that they have developed highly competent wind power policies, while other states that are lagging have started to develop their policies progressively in order to attract investors for wind power installations [60].
Figure 15 presents the cumulative installed capacities of wind turbines in megawatts during the fifteen years from fiscal year 2005–2006 to fiscal year 2019–2020. As presented in Figure 14, more than 50% of installations occurred in the past nine years. The improved installation of wind turbines over this duration in India shows the achievement of the government policies and efforts. In the fiscal year 2005–2006, installed wind capacity was only 5351.9 MW, and in the fiscal year 2019–2020 it reached 37,744.1 MW, and is anticipated to reach 60 gigawatts by 2022 [61].
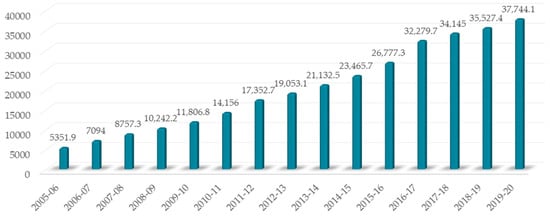
Figure 15.
Cumulative installed capacities (MW) of wind turbines from fiscal year 2005–2006 to fiscal year 2019–2020 [60].
A comparison by state of cumulative installed capacities and estimated potential in megawatts for the financial year 2019–2020 is given in Table 16. In the financial year 2017–2018, the installed capacity is only 37,744.1 GW, however, the estimated potential is 3,022,524 MW, which means the wind source has not been fully utilised.
Table 16.
Comparison of cumulative installed capacities and estimated potential in (MW), by state. Source: Indian Wind Energy Association [60] (as on 31 January.2021).
In the west coast area, annual wind speeds of 3–5 m/s are common. The southern coast and western coast regions have high wind speed, i.e., above 5 m/s in the monsoon season (June to September). As a result, with an average annual high-speed wind, the west coastal states are good places for harvesting wind. According to the Indian Energy Outlook 2016 report, International Renewable Energy Agency (IRENA), India’s wind power potential could be expanded up to 185 gigawatts, an eight-fold growth over fifteen years from the financial year 2014–2015 [62]. Therefore, this would need an investment of USD 42,000 million before 2030. GWEC estimated the nation would have between 111 gigawatts and 163 gigawatts of installed capacity by 2030.
The total installed capacity of grid-interactive renewable electricity, which was 78,316.44 MW in 2019, improved by 11.19% to 87,077.68 MW in 2020. In 2020, installed wind power capacity contributed around 43.3% of total renewable energy production capacity, followed by solar power, including rooftop solar (39.8%), and biomass power (11.2%) [63]. At 28 February 2021, the country had an installed renewable energy capacity of 92,970 MW, of which the contribution of wind was 41.7%, solar 42.03%, bio-mass 11.1% and small hydro 5.14% [61]. Figure 16 presents cumulative installed capacity of grid interactive renewable power by type in megawatts.
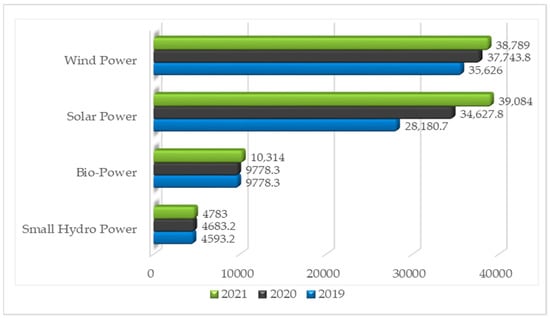
Figure 16.
Cumulative installed capacity of grid-interactive renewable power by type (in MW). Source: Ministry of New and Renewable Energy [64].
Table 17 indicates the wind power capacity addition targets and achievements. It is worth mentioning that in the financial years 2015–2016 and 2016–2017, it exceeded the target. On the other hand, the target was not accomplished in financial year 2017–2018 because of low wind. In financial year 2017–2018, the addition of only 1865.24 MW was a significant drop from the 5502.37 MW capacity.
Table 17.
Capacity additions; target and achievements (MW) from 2010–2020. Source: India Energy Outlook [65].
Capacity additions until 2017 (i.e., 32.27 GW) were via feed in tariff (FiT) method. Later, the tariff scheme was moved from feed in tariff (FiT) to bidding route, which has marginally decelerated the installation of projects. Currently, in India, wind power projects are installed on the basis of commercial viability via a tariff-based competitive bidding mechanism. For the purpose of delivering enough capacity to the developers, regular bids for wind energy projects are being allotted [65]. The implementation of projects and status of bids are being monitored regularly.
As of 31 January 2021, the capacity addition based on wind was extensively observed in Tamil Nadu which contributed 14,890.62 megawatts, Andhra Pradesh contributed 8762.09 megawatts, Gujarat contributed 12,442.85 megawatts, Rajasthan contributed 9869 megawatts and Maharashtra contributed 10,266.87 megawatts. Due to this, production capacity based on wind has improved to 92,550.74 megawatts. By comparison, as of 31 July 2020, Tamil Nadu had contributed 9317.34 megawatts, Andhra Pradesh 4092.45 megawatts, Gujarat 7721.92 megawatts, Rajasthan 4299.72 megawatts and Maharashtra added 5000 megawatts. Therefore, the wind-based production capacity improved to 38,789 megawatts in 2021, which was 37,743.8 MW in 2020. In addition, from 2006 to 2015, the contribution of wind industry was 1.5 gigawatts and 3 gigawatts per year [60].
7. Electricity Production from Wind in India
The Central Electricity Authority (CEA) of the nation has initiated the yearly collection of electricity production from wind energy (MU) data, from 2014 to 2020, as shown in Table 18.
Table 18.
Yearly electricity generation from wind energy (MU), from 2014 to 2020. Source: MNRE [66].
Table 19 presents the monthly quantum of electrical power generated via wind from financial year 2014–2015 to 2020–2021. It is worth noting that most electricity was generated in the months of June to September, which are also the months with maximum wind speed, as revealed in Figure 17. The wind energy contribution to the overall renewable energy generation throughout the financial years 2014–2015, 2015–2016, 2016–2017, 2017–2018, 2018–2019, 2019–2020 and 2020–2021 was 55%, 50%, 56%, and 53%, respectively [66].
Table 19.
The monthly quantum of energy produced from wind energy (MU) during financial years 2014–2015 to 2020–2021. Source: Central Electricity Authority [67].
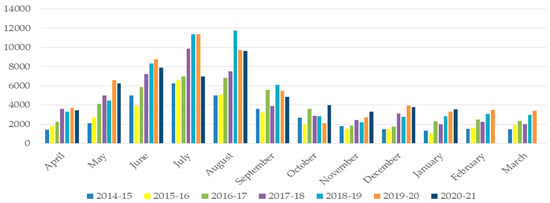
Figure 17.
The monthly wind power generation (MU) during financial years 2014–2015, 2015–2016, 2016–2017, 2017–2018, 2018–2019, 2019–2020 and 2020–2021. Source: Central Electricity Authority [67].
8. Wind Power-Based Companies in India
The top ten ranked companies in the world contributed 43 gigawatts, equivalent to approximately 25,400 turbines and serving 76% of the international market. Vestas is the global leader with 9.6 GW, followed by Siemens Gamesa Renewable Energy (SGRE) and General Electric (GE), as shown in Figure 18 [68]. In the global top 20 rank, Suzlon, an Indian manufacturer, is also mentioned as having contributed 1.1 gigawatts of wind generation capacity [69,70].
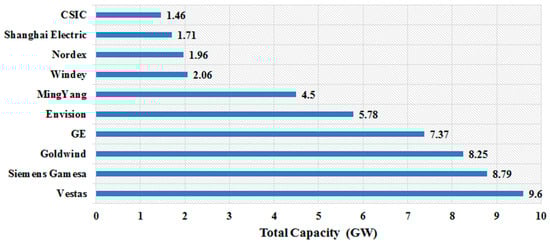
Figure 18.
Top 10 wind turbine manufacturers in the world in 2020, with cumulative installed capacity (GW) [70].
9. Onshore Wind Power Generation Facilities in India
In India, several wind power plants were installed by state government and central government, and the rest were developed under the private sector [71,72]. Most wind power plants have been developed in Maharashtra, Tamil Nadu, Karnataka, Rajasthan, Odisha and Madhya Pradesh, as shown in Table 20. India’s biggest onshore wind power plant ‘Muppandal wind power plant’ which is located in Tamil Nadu, has a capacity of 1500 MW [73].
Table 20.
Status of India’s largest onshore wind power plants (as on 28 February 2021). Source: Wind Power in India [73].
10. Offshore Wind Power Production Facilities in India
In 2015, the National Offshore Wind Power Policy was approved by MNRE, Government of India [74,75]. Under this policy, resource assessment was carried out in the coastal areas of Gujrat and Tamil Nadu [76,77,78]. For the development and promotion of offshore projects in Exclusive Economic Zones (EEZ), the National Institute of Wind Energy (NIWE) was announced [79,80] as the Nodal Agency.
NIWE is also an information partner in the promotion of offshore wind power in India, an initiative of GWEC for beginning and enhancing offshore wind power [81,82]. A pre-feasibility test was carried out by considering the wind power plant capacities of 504 MW and 150 MW for designing a wind plant in Tamil Nadu. A most important outcome of this analysis was identification of the south-western and southern coastal areas of Tamil Nadu which have better resources for offshore wind farm development than the coastal areas of Gujarat [83]. Additionally, on 7 August 2018, India’s foremost, 1 gigawatt offshore wind power project was developed in Gujarat, that can be ascribed to several causes involving state government participation and enthusiastic policy implementation [84].
11. Wind Power Institutions and Organizations in India
To promote wind power, the Government of India has signed memorandum of understandings with distinct educational institutes and organizations. The details of such institutes and organizations pertaining to wind energy are discussed as follows.
11.1. Ministry of New and Renewable Energy (MNRE)
‘MNRE’, Government of India, handles every issue related to renewable power. The main motive of ‘MNRE’ is to deploy and develop new and green power to supplement the power needs of the country. In recent times, the role of MNRE has been increasing with the rising concern for the nation’s security. The development of MNRE was as follows:
- In 1991, the Commission for Additional Sources of Energy (CASE) was developed;
- In 1982, ‘CASE’ was renamed as ‘Department of Non-Conventional Energy Sources (DNES)’;
- In 1992, ‘DNES’ was renamed as ‘Ministry of Non-Conventional Energy Sources (MNES)’;
- In 2006, ‘MNES’ was renamed as ‘Ministry of New and Renewable Energy (MNRE)’ [46].
11.2. National Institute of Wind Energy (NIWE)
In 1998, the ‘NIWE’, previously recognized as the Centre for Wind Energy Technology, was established in Chennai, as an autonomous research and development institution by MNRE, Government of India. The main role of NIWE is to deliver facilities, and strive to discover comprehensive solutions for problems and development in the wind power sector via research. Indian Renewable Energy Development Agency Limited (IREDAL) is a publicly limited government institution developed as a non-banking financial company in 1987 involved in developing, encouraging and extending financial assistance for setting up projects relating to MNRE. This institution was built as a “Mini Ratna” (Category 1) Government institution in 1956 under ‘4A section Companies Act’ [85].
The key objectives of the Indian Renewable Energy Development Agency Limited are:
- (1)
- To provide economic assistance to specified schemes and projects for producing electric power through new and renewable sources and conserving power via power efficiency;
- (2)
- To contribute effective and efficient finance in renewable energy and energy efficiency/ conservation projects;
- (3)
- IREDA increases its market shares by utilizing innovative financing in the sector of renewable power;
- (4)
- Through continual improvement of processes, systems and resources, better service efficiency is provided to customers [13].
11.3. India Wind Power Association (IWPA)
In 1998, the IWPA was developed as a nonprofit organization. Presently, this organization has 1570 members. The national workplace of this organization is situated in Chennai and has branches at Mumbai, Jaipur, Hyderabad, Delhi, Bengaluru and Ahmedabad.
This organization has worked constantly in the direction of removing the hurdles for growth of wind energy. This association runs jointly with several national industries such as Central Electricity Authority of India (CEA), Centre for Wind Energy Technology (CWET), World Wind Energy Association, State Nodal Agencies, State Electricity Regulatory Commissions, Confederation of India Industry, MNRE, Ministry of Environment, IREDA and Ministry of Power [86].
11.4. CLP India Private Limited
With the objective of delivering social, economic and environmentally valuable renewable power sources, CLP India was started in 2002. This is one of the largest wind power organizations in India, with over 1000 MW of wind generating installations. Wind is an integral sector of CLP India’s renewable portfolio, with projects in six states. Currently, 925 MW of the total projects are operational. In the year 2006, its initial project was accomplished in Khandke, India [87].
11.5. National Offshore Wind Energy Authority (NOWA)
MNRE, Government of India, established the National Offshore Wind Energy Authority (NOWA) in 2015. It is responsible for the nation’s offshore wind power projects. According to the study of Scottish development, the international coastline of Kanyakumari and Rameshwaram individually have 1 gigawatt wind power capacity in Tamil Nadu. The overall capacity of offshore wind power in India is around 349.8 gigawatts. Europe ranks at first place for the highest installation of offshore wind energy with 4995 megawatts, followed by China with 390 megawatts, and Japan with 25 megawatts [88].
11.6. Indian Wind Energy Association (INWEA)
INWEA was developed in 2020 to work as an independent body representing the interests of investors in the Indian wind energy sector, including manufacturers of wind turbine systems, components, and developers, etc. The organization was formed by individuals in the wind power sector in India and a group of experienced companies. The association has 400 members across India.
INWEA is also a member of various national and international industries such as ASSOCHAM, FICCI, CII, WWEA and EWEA. It also works in close collaboration with policy makers. developers and financial institutions. This organization also works to enable the industry to optimally utilize wind energy resources and to spread awareness about the benefits of wind energy. In view of the growing concern for ‘climate change’, the organization contributes effectively towards the nation’s mission for clean power, being affordable along with power security. The major aim is to establish a sustainable path for the nation’s social and economic development [89].
12. Govt. of India’s Actions, Policies and Programs for Encouraging Wind Power
In the history of the Indian wind market, the time period from 1994 to1996 is known as the period of the ‘wind rush’, because wind markets saw a remarkable improvement as private investment increased during this period. The Government of India started several incentives to tremendously drive the addition of wind capacity, through tax rebates, financial help and subsidies, etc. for supporting market players. In lowering the prices of wind power equipment via large scale manufacturing of equipment, the government has announced new policies through the Make in India scheme.
The Indian government made a number of initiatives in recent years, including National Electricity Policy 2005, National Rural Electrification Policy 2006, National Tarrif Policy, and Electricity Act 2003, etc. These initiatives in the wind power field show improved financial incentives, a steady market growth, opportunities in offshore wind power and lowering renewable energy prices [90].
The particulars of the regulatory acts enacted by the state and central governments to enhance clean power are listed as follows.
12.1. Electricity Act 2003
The Electricity Act, 2003 was enacted with effect from 10 June 2003. This act covers crucial matters involving transmission and distribution, sales and utility to promote electricity through renewable energies. The following are some of the points included in the 2003 Electricity Act:
- (1)
- To deliver improved methods to uplift power via generation and co-generation via RES by giving improved techniques for the integration of grid and trading power to customers, and to mention the terms of service for determining the tariff [91];
- (2)
- To encourage the utilization of RES through distinct sections of ‘Electricity Act 2003, the State Commission will have to produce power, grid integration and construct a competitive electricity market in which the sale and purchase of electric power can be accomplished by the RES and also encourage co-generation;
- (3)
- To encourage the generation and co-generation of electrical power from RES.
12.2. National Electricity Policy 2005
National Electricity Policy was set up in discussion with, and taking into consideration, the opinions of the CEA, CERC, state governments and other stakeholders. The main aim of this policy is to set regulations for faster growth of the power field, delivering power supply to all regions and protection of the interest of stakeholders and consumers by considering the availability of power resources, energy security issues, economics of generation using distinct resources, and the technology available to exploit these resources [92,93].
12.3. National Rural Electrification Polices (NREP), 2006
In 2006 ‘NREP’ Policy was announced by the Ministry of Power, Government of India, for allowing standalone power systems utilizing renewable power. The major objective of NREP is to deliver reliable and sustainable quality of electricity at an appropriate price to all local users. In addition, where grid supply is not possible, off-grid solutions such as a standalone power system can be used to bring electricity to isolated rural locations [94,95].
12.4. Nationl Tariff Policy 2006
The ‘National Tariff Policy was declared in 2006, to expand the utilization of RES under section ’86-1-e’ of the ‘Electricity Act 2003′. According to the policy, a suitable commission will set a definite percentage of tariffs having a minimal rate of power purchase from RES, taking into account the accessibility of the RES in the particular area and impacts on production prices. The tariffs, which will be determined by SERC, will reflect the amount of power purchased [96,97].
12.5. State Level Initiatives
There are several independent state level polices apart from the national policies, whereby wind energy can be promoted as RES. As per the regulations (as of 31 August 2016) of CERC and SERC, they have concluded the electric power cost for their individual states [98]. Therefore, based upon the tariff orders issued by SERC for the financial year 2020–2021, CERC has determined the APPC at the national level to be at Rs 3.85 per unit for the year 2021–2022 [99].
12.6. Mechanism of Renewable Energy Certificates (REC)
To encourage renewable power in the electricity market, the REC mechanism is very effective and profitable. In India, the REC mechanism was constituted in 2010 by CERC, under the Electricity ACT (2003). REC acts as a tracking or accounting mechanism for wind, solar and other green energies as they flow into the power grid. Since electric power produced from RES is indistinguishable from that generated by any other RES, some form of tracking is needed. This accounting and returning power to the grid is essential since electricity is tough and costly to store in batteries [100,101,102]. Thus, additionally produced renewable power, which is unused by producer, is fed back into the electric grid for utilization by other customers. Hence, the provider of renewable power will then obtain a REC. CERC registers and regulates to produce one renewable energy certificates for 1 MW hour of electricity produced [103,104,105]. Various traders, sellers and buyers joined in the Renewable Energy Certificates trading process, and data regarding this are presented in Table 21.
Table 21.
Numbers of buyers, sellers and number of Renewable Energy Certificates trading on Power Exchanges. Source: Central Electricity Regulatory Commission [106].
13. Barriers to the Direction of the Growth of Wind Power
To achieve the maximum share of the everyday power requirements of the Indian market, 302 GW of wind power potential is adequate. However, the exploration of resources of wind remains a tough assignment as social, financial and environmental issues set a boundary to the growth mission. Hence, growth of wind power imposes a few barriers and limitations, which can be described as follows.
13.1. Environmental Barriers
Wind power is perceived as a clean source of power, although it has a few harmful effects on the climate too. Therefore, it is forever essential to analyze the worst-case scenario in order to minimize this damage. Environmental issues related to wind farms comprise the following sub points.
13.1.1. Impacts on Wildlife
Generation of wind energy has been the cause of the death of birds hitting the wind turbines, other parts of the wind plant and transmission lines. Other difficulties encountered by wild species include breeding, nesting and habitat loss. Based on much research, it has been concluded that wind farm location does not contribute sizably to an increase in the death rate of birds. Thus, it is necessary to minimize the adverse impacts on birds or animals, to enhance the wind power penetration. With proper planning and design of wind turbines, it is possible to reduce the impact on the wild species. From much research, it has been found that turbines which have tighter turbine spacing, shorter rotor diameter and lower hub heights, leads to death of a larger number of birds. In recent times, turbines built with tubular-steel towers are secure and generate more power than the prop-style turbines [107]. In USA, avian radars are utilised to identify birds within the zone. The radar system will stop wind turbines instantly if there is any chance of birds flying past, and start the turbines again after the birds have safely passed through the wind farm without harm [108].
13.1.2. Noise Impact
In implementing wind power, noise pollution is the most serious environmental problem. If a large number of wind turbines are present, the greater the level of noise in the wind farm will occur. The noise produced by a turbine is classified as a mechanical type and aerodynamic type. Mechanical noise is created because of the movable parts, for example, bearing, generator and gearbox, etc. [109]. Lack of preventive maintenance, improper design, and wear and tear may increase the level of mechanical noise. Regular maintenance, proper designing, and selection of the wind turbine can all help to reduce noise. It may also be minimised by utilising acoustic insulation curtains and anti-vibration support footings [110,111]. Aerodynamic noise is created due to the interaction of turbine blades with the field of the airflow, and it rises with the speed of the rotor. When turbine interacts with atmospheric turbulence, a ‘whooshing’ sound is produced [112,113,114]. This noise can be reduced by careful design of the wind turbine.
13.1.3. Visual Problems
Shadow flickering caused by revolving blades and sunray reflection from the turbine can be inconvenient for people living nearby [115]. It was analysed that operational wind turbines create low visual impacts compared with stationary wind turbines. This problem can be reduced by coating the turbine with a less reflective material and optimising the smoothness of the rotor-blade surface [116].
13.2. Technical Issues
- Due to the lack of wind energy R&D institutions, technological challenges occur. Recent wind turbines are capable, however when it comes to a wind farm, the presence of other wind turbines has a negative impact on the performance of individual turbines. As a result, a wind plant’s overall wind-harvesting efficiency is lower than what could be attained if all the turbines were separately and individually functioning [117,118];
- Grid stability and connectivity of wind farms have been encouraged via many schemes or policies countrywide. However, sometimes it is impossible for the grid to store the power produced from the turbine, when the level of penetration is extremely large [119]. Because of this factor, some wind farms are kept idle when power production is large;
- Tamil Nadu state, in south India, has been the country’s main wind installer since 2016–2019, with 9.3 gigawatts of cumulative wind installations, and a 25% share of the total installed capacity in India as at 2020. This was accomplished via employing appropriate scheduling in addition to forecasting methods. Hence, regular metering of wind monitoring stations is required to be arranged in order to avoid problems occurring on account of the intermittent nature of wind [120].
13.3. Financial Issues
- The initial investment in wind generating projects is substantial, and a risk factor is always there, raising doubts about the project’s guaranteed success [121]. Because of non-uniform inflation and interest rates, debt and equity issues arise. Distribution companies can sometimes create a barrier by delaying payments that are already due;
- Despite wind power development being an economical choice, because of irregular funding during the initial phase, it may not be gainful to harness the wind power. The internal rate of return (IRR) and net present value (NPV) are two essential factors that are utilized for determining the feasibility of the project investment. A model has been designed by Petkovic [122,123] for the optimal and economical design of a wind farm by analyzing the relations between the turbines, wind regimes and varying prices.
13.4. Socio-Economic Issues
- Socio-economic barriers are the major obstacle to developing wind power. Sometimes a wind project may face public displeasure if a historically essential site is being employed for a wind farm. Sometimes the expenditure related to the transportation facility is also associated while developing a wind firm.
- Sometimes difficulties appear because of the lack of mutual understanding between the investors, and uneven profit distribution and policy uncertainty have negative impacts on wind power development programs [124].
14. Concerns Related to Wind Power Development in India
There are important concerns related to development of wind power in developing country such as India [125,126], as follows.
- For wind power plant installation, the availability of land is a major concern;
- Potential land is needed by developers/manufacturers;
- Buying of land and recognition is expensive and takes substantial time to process;
- Inadequate electricity tariff at low PLF locations;
- In several places in India, such as in western India, achieving the clearance of forest land is a difficult task;
- The price of electricity must be same throughout the state;
- For captive generation, wheeling and banking are not permitted;
- As per CERC guidelines, states must revise the cost of electricity;
- For producing power, building infrastructure and providing transmission facilities of that power to the grid;
- Industries are not yet fully prepared to implement forecasting and scheduling systems;
- For manufacturers or developers, the direct acquisition of private land is not allowed;
- The real potential of various states is still unidentified, and it must be determined by long term planning in the sector of wind power development;
- Various wind farms in India were unplugged from the grid during the peak windy season, resulting in massive electricity waste;
- The time it takes to obtain several approvals and clearances is considerable;
- The complete installation price of the wind plant must be carried by the designer.
All the briefly outlined stated challenges and issues above, are very essential for the development of wind farms in India. Several missions, policies, schemes and initiatives related to wind power are motivated and promoted continuously by the Indian Government.
15. Target and Achievements in Wind Power in India
Unceasing power demand due to rising population and an accelerated economy make India passionate for electrical energy. Despite substantial capacity addition over the past 21 years, the supply of power fights to keep up with the power requirement. Due to scarcity, electrical power is not accessible to a large portion of the population [127].
The modern power scenario, when the world is facing ecological, climate change and other environmental problems such as forest fires, floods, and record rainfall levels which are happening globally, is very alarming. We must act now to preserve the 1.5 °C warming limit in place and avoid more severe effects. The first part of the International Panel on Climate Change (IPCC) targets the limiting of global warming to below 1.50 °C above pre-industrial levels, based on 14,000 scientific articles studied by 234 experts. This may be achieved within next two decades, resulting in an increased frequency and severity of extreme weather, nearly entirely attributable to human activities. If the world wants to keep global warming below 2° degrees Celsius, swift action is required, including a shift away from fossil fuels. India has vowed, among other measures, to cut the emission intensity of Indian GDP by 30 to 35% below 2005 levels by 2030 and to increase the non-fossil share of energy production to 40% by 2030.
Recently, India and the U.S. launched a clean energy financial initiative popularly known as Climate Action and Financial Mobilization Dialogue (CAMFD), which motivates technologies and investment in renewable power projects. CAMFD is a section of the India–US Green Energy Agenda 2030, which was unveiled by US President Joe Biden and Prime Minister Narendra Modi during the April 2021 Leader’s Summit. The U.S. special envoy, John Kerry, praised India’s commitment to promote green energy and setting a goal of 450 GW of renewable power by 2030, while emphasizing the importance of all Paris Agreement signatories committing to a net zero emission objective by 2050. At the 26th Conference of Parties (COP 26) in Glasgow, held on 1 November 2021, the leaders of the world stepped up the heat and resorted to end-of-the-world rhetoric in an attempt to inject new urgency into the sputtering international climate negotiations. The United Nations Framework Convention on Climate change (UNFCC) and the leaders of the world, including the leaders of Germany, United Kingdom, United States, Canada, France, Leyen, Chaina, and Bangladesh, pledged to save humanity, committing to net zero carbon emission. The Indian Prime Minister made the following five pledges to be fulfilled by 2030:
- (a)
- India’s non-fossil energy capacity will be increased to 500 GW;
- (b)
- India will meet 50% of its energy needs with renewable energy;
- (c)
- India expects to eliminate total emission of carbon by 1 billion tons;
- (d)
- India’s economy will reduce its carbon intensity by up to 45%;
- (e)
- India will achieve its goal of net zero carbon emissions.
The Government of India has decided to invest EUR 10.4 billion into the wind energy sector every year until 2030, in order to partly meet the above-mentioned targets. A few significant successes are outlined below [128,129,130,131,132,133,134].
- In 2014, the National Wind Energy Mission (NWEM) was declared, that announced a long-term plan for the sector of wind power, and delivers added security to power policy;
- In India, there has been a plan in place for the past few years to consider harnessing the tremendous offshore wind potential. Although there is not much development expected in the near future, after 2022 this could add remarkably to the wind energy. To reach the target of 175 GW by the end of 2022, transmission line tenders of USD 5 billion were launched by the Indian Government in June 2019;
- Wind power installed capacity has increased up to 1.7 times during the last 5 years, as at 28 February 2021. India now has 38.78 GW of installed capacity, the fourth biggest national installation worldwide;
- In financial year 2019–2020, 64.639 billion units were produced from wind energy;
- The wind power sector in India is dominated by states such as Tamil Nadu, Madhya Pradesh, Maharashtra, Kerala, Gujarat, Karnataka, Rajasthan, Telangana and Andhra Pradesh. Gujarat has the most wind power capacity installed, with 5766.78 MW, followed by Tamil Nadu with 4397.61 MW.
- As at 28 April 2018, the electrification of 100 percent villages was attained under the Deen Dayal Upadhyaya Gram Jyoti Yojana.
- As per the Union Budget 2021–2022, the installed capacity of 139 GW was augmented. In the last six years, 14.1 million circuit kilometers of transmission lines were built, and 280 million households were electrified. In Tamil Nadu, the energy deficit was reduced to 0.7% in the financial year 2019–2020, from 4.2% in the financial year 2014–2015, and the lowest-ever wind price of 3.51106 million/unit was attained;
- As at December 2020, over 2.3 million energy-efficient fans, 1140 million LED tube lights, over 36,690 million LED bulbs have been mounted across the nation, saving about 47.65 billion units every year;
- India scored sixth in rank among nations making substantial investment on renewable power, assigning USD 90 billion between 2010 and 2020.
After an exhaustive review of the literature, detailed facts about the present position of wind energy have been identified in the wind power sector, with an emphasis on government achievements, targets, initiatives, and various strategic advances. In order to accentuate the potential capability of wind, numerous efforts have been made. The Indian Government has set a goal of potential power production utilizing RES by 2022, and to achieve this target, the government has introduced several polices and schemes related to the sources of renewable power. At this time, the nation is starved with regard to the socio-economic technologies associated with renewable power. In this paper, wind power potential is discussed that can assist renewable power companies in selecting efficient and productive locations. All of the analyses that were carried out in this paper will be incredibly valuable to future renewable energy investors. Additionally, this comprehensive study is presented to clarify possible doubts regarding the wind power systems of India.
16. Conclusions
Presently, India is finally defeating the tremendous challenge of the shortage of electricity, which may lead to lesser utilization of fossil fuels and greater utilization of RES. The Indian Government has taken a number of significant steps to encourage wind power, to build India a vast wind potential nation. The success of initiatives taken by the Indian Government to encourage wind power projects can be observed with the trend of exponentially growing annual capacity additions. India also plays a significant role in enhancing opportunities for employment, besides minimizing power shortages and carbon emissions. In recent years, several new policies have been introduced in India in the wind power sector that appear to be a sturdy agent in the remarkable development of the wind power markets. In various countries, wind power policies include several benefits such as subsidies, tax exemption, attractive financing options such as lower interest rates, and the involvement of research institutes, etc. Additionally, in several countries (including India), the idea of the Renewable Energy Certificate (REC) has been initiated. Additionally, renewable power is the best choice for Indian villages that are unable to receive power supply. It also assessed that up to 400,000 megawatts of power could be required by 2022. Therefore, India needs to utilize all existing RESs in order to reach the country’s electricity needs. Presently, India has been included among the top five nations worldwide for the creation of job opportunities in the field of renewable power, installations and capacity additions. Wind power development can be a major tool for reducing import dependence and production cost, and maximizing power security.
India has significant wind power potential, and it could be one of the leading sources of power in the near future. For effective execution of various policies, socio-economic, environmental, financial and technical hurdles, along with uncertainties in policy matters, are required to be overcome. In addition, offshore wind projects are the most efficient method of utilizing wind energy in India. However, in India, offshore wind generation remained undeveloped until 2015, and little progress has been made in this area. Therefore, resource assessment and strong policies to commercialize offshore projects must be taken into consideration. The Indian Government has a target of achieving a wind power capacity of up to 60 gigawatts by 2022. However, according to former trends, the annual capacity addition is not above 4 gigawatts; however it requires almost 6 gigawatts annual capacity addition to achieve the target of 60 gigawatts. This can only be achievable with the superior integration of infrastructure, technology and management in the power sector. Promoting research and development activities, and developing financially stable institutional centers of research in every windy state, could be beneficial. Additionally, regular inspections and monitoring of existing projects should be executed more frequently. To achieve desired targets, the re-powering of projects and an initiative that can assist in achieving the intended goal, an independent policy framework is required. Even while new initiatives implemented by Indian government have long-term consequences, they must be carefully analyzed, and policy execution must be ensured by the government in order to achieve the goal of 60 gigawatts by 2022. A well-connected grid network, devoted research centers, modifications in policies and energy prices with ongoing market trends, effective policy implementations and attractive incentives for projects can set wind power markets of India ahead of the other leading nations.
Author Contributions
Writing—editing and review, M.R. and U.S.; writing—novel draft, M.R. and U.S.; resources, M.R. and U.S.; formal analysis, M.R. and U.S.; Conceptualization, M.R. and U.S.; guidance, M.R.; funding acquisition, H.M. and F.P.G.M. All authors have read and agreed to the published version of the manuscript.
Funding
This research received no external funding.
Institutional Review Board Statement
Not applicable.
Informed Consent Statement
Not applicable.
Data Availability Statement
Not applicable.
Acknowledgments
The authors would like to acknowledge the support from Universidad Castilla-La Mancha, Spain. The authors would like to acknowledge the support from Intelligent Prognostic Private Limited Delhi, India Researcher’s Supporting Project. The authors would like to acknowledge the following agencies and organizations International Renewable Energy Agency (IRENA) (https://www.irena.org/), REN21 (www.ren21.net), The Wind Power (https://www.thewindpower.net/index.php), Global Energy Observatory (http://globalenergyobservatory.org/), Government of India, Central Electricity Authority (https://cea.nic.in/?lang=en), Government of India, Ministry of Power (https://powermin.gov.in/), Ministry of New and Renewable Energy (MNRE), Government of India (https://mnre.gov.in/), National Institute of Wind Energy (NIWE) (https://niwe.res.in/), Indian Wind Energy Association (http://www.inwea.org/), India Energy Outlook, International Energy Agency (IEA) (https://www.iea.org/), https://en.wikipedia.org/, Central Electricity Regulatory Commission, India (https://cercind.gov.in/), Investopedia (https://www.investopedia.com/), Global Wind Energy Council (https://gwec.net/) to provide the reports, articles, highlights, papers, data etc. as open access.
Conflicts of Interest
The authors declare no conflict of interest.
Abbreviations
| MoUs | Memorandum of Understandings |
| RES | Renewable Energy Sources |
| IREDA | Indian Renewable Energy Development Agency |
| WWEA | World Wind Energy Association |
| EWEA | European Wind Energy Association |
| SERC | State Electricity Regulatory Commission |
| GDP | Gross Domestic Product |
| CEA | Central Electricity Authority |
| CERC | Central Electricity Regulatory Commission |
| JEC | Joint Electricity Commissions |
| APPC | Average Power Purchase Cost |
| REC | Renewable energy certificate |
| NTPC | National Thermal Power Corporation |
| AGL | Above Ground Level |
| NIWE | National Institute of Wind Energy |
| GIS | Geographic Information System |
| IWEA | Indian Wind Energy Association |
| GWEC | Global Wind Energy Council |
| MNRE | Ministry of New and Renewable Energy |
| IEA | International Energy Agency |
| IREA | International Renewable Energy Agency |
| WPP | Wind Power Potential |
| EEZ | Exclusive Economic Zones |
| CWET | Centre for Wind Energy Technology |
| NOWA | National Offshore Wind Energy Authority |
| NREP | National Rural Electrification Polices |
| IRR | Internal Rate of Return |
| NPV | Net Present Value |
| IPCC | International Panel on Climate Change |
| CAMFD | Climate Action and Financial Mobilization Dialogue |
| NWEM | National Wind Energy Mission |
| NRSC | National Remote Sensing Centre |
| AWiFS | Advanced Wind Field Sensor |
| CUF | Capacity Utilization Factor |
| CIC | Cumulative Installed Capacity |
| MNRE | Ministry of new and Renewable Energy |
| IWPA | Indian Wind Power Association |
| IPCCC | International Panel for Climate change |
| CAMFD | Climate Action and Financial Mobilization Dialogue |
| MU | Mega Unit |
References
- Kisvari, A.; Lin, Z.; Liu, X. Wind power forecasting—A data-driven method along with gated recurrent neural network. Renew. Energy 2021, 163, 1895–1909. [Google Scholar] [CrossRef]
- Duan, J.; Wang, P.; Ma, W.; Tian, X.; Fang, S.; Cheng, Y.; Chang, Y.; Liu, H. Short-term wind power forecasting using the hybrid model of improved variational mode decomposition and Correntropy Long Short-term memory neural network. Energy 2021, 214, 118980. [Google Scholar] [CrossRef]
- Yang, M.; Shi, C.; Liu, H. Day-ahead wind power forecasting based on the clustering of equivalent power curves. Energy 2021, 218, 119515. [Google Scholar] [CrossRef]
- Yildiz, C.; Acikgoz, H.; Korkmaz, D.; Budak, U. An improved residual-based convolutional neural network for very short-term wind power forecasting. Energy Convers. Manag. 2012, 228, 113731. [Google Scholar] [CrossRef]
- Scarabaggio, P.; Grammatico, S.; Carli, R.; Dotoli, M. Distributed demand side management with stochastic wind power forecasting. IEEE Trans. Control Syst. Technol. 2021, 2, 1–16. [Google Scholar] [CrossRef]
- Qin, G.; Yan, Q.; Zhu, J.; Xu, C.; Kammen, D.M. Day-ahead wind power forecasting based on wind load data using hybrid optimization algorithm. Sustainability 2021, 13, 1164. [Google Scholar] [CrossRef]
- Maldonado-Correa, J.; Solano, J.C.; Rojas-Moncayo, M. Wind power forecasting: A systematic literature review. Wind Eng. 2021, 45, 413–426. [Google Scholar] [CrossRef]
- Sommer, B.; Pinson, P.; Messner, J.W.; Obst, D. Online distributed learning in wind power forecasting. Int. J. Forecast. 2021, 37, 205–223. [Google Scholar] [CrossRef]
- Wu, Q.; Guan, F.; Lv, C.; Huang, Y. Ultra-short-term multi-step wind power forecasting based on CNN-LSTM. IET Renew. Power Gener. 2021, 15, 1019–1029. [Google Scholar] [CrossRef]
- Bochenek, B.; Jurasz, J.; Jaczewski, A.; Stachura, G.; Sekuła, P.; Strzyżewski, T.; Wdowikowski, M.; Figurski, M. Day-Ahead Wind Power Forecasting in Poland Based on Numerical Weather Prediction. Energies 2021, 14, 2164. [Google Scholar] [CrossRef]
- Tripathi, L.; Mishra, A.K.; Dubey, A.K.; Tripathi, C.B.; Baredar, P. Renewable energy: An overview on its contribution in current energy scenario of India. Renew. Sustain. Energy Rev. 2016, 60, 226–233. [Google Scholar] [CrossRef]
- Mabel, M.C.; Fernandez, E. Growth and future trends of wind energy in India. Renew. Sustain. Energy Rev. 2008, 12, 1745–1757. [Google Scholar] [CrossRef]
- National Institute of Wind Energy. Available online: https://niwe.res.in/ (accessed on 25 July 2021).
- Zeng, C.; Stringer, L.C.; Lv, T. The spatial spillover effect of fossil fuel energy trade on CO2 emissions. Energy 2021, 223, 120038. [Google Scholar] [CrossRef]
- Union of Concerned Scientists. Available online: https://www.ucsusa.org/resources/each-countrys-share-co2-emissions (accessed on 25 July 2021).
- Magazzino, C.; Mele, M.; Schneider, N. A machine learning approach on the relationship among solar and wind energy production, coal consumption, GDP, and CO2 emissions. Renew. Energy 2021, 167, 99–115. [Google Scholar] [CrossRef]
- Pandve, H.T. India’s national action plan on climate change. Indian J. Occup. Environ. Med. 2009, 13, 17. [Google Scholar] [CrossRef]
- Rattani, V. Coping with Climate Change: An Analysis of India’s National Action Plan on Climate Change; Centre for Science and Environment: New Delhi, India, 2018. [Google Scholar]
- Sadorsky, P. Wind energy for sustainable development: Driving factors and future outlook. J. Clean. Prod. 2021, 289, 125779. [Google Scholar] [CrossRef]
- Mani, S.; Dhingra, T. Offshore wind energy policy for India—Key factors to be considered. Energy Policy 2013, 56, 672–683. [Google Scholar] [CrossRef]
- Pati, S. India’s sustainable energy future and the challenges for optimized integration of variable energy sources. International J. Energy Technol. Policy 2021, 17, 98–116. [Google Scholar] [CrossRef]
- Jiang, Z. Installation of offshore wind turbines: A technical review. Renew. Sustain. Energy Rev. 2021, 139, 110576. [Google Scholar] [CrossRef]
- Adib, R.; Murdock, H.E.; Appavou, F.; Brown, A.; Epp, B.; Leidreiter, A.; Lins, C.; Murdock, H.E.; Musolino, E.; Petrichenko, K.; et al. Renewables 2015 Global Status Report; REN21 Secretariat: Paris, France, 2015; Volume 162. [Google Scholar]
- Arshad, M.; O’Kelly, B. Global status of wind power generation: Theory, practice, and challenges. Int. J. Green Energy 2019, 16, 1073–1090. [Google Scholar] [CrossRef]
- Sawin, J.L.; Sverrisson, F.; Wilson, R.; Lins, C.; Williamson, L.E.; Rana, A.; Murdock, H.E.; Evan, M.; Martin, H.; Reith, A.; et al. Renewables, Global Status Report: Annual Reporting on Renewables: Ten Years of Excellence; RN:46105560; REN21, Renewable Energy Policy Network for the 21st Century: Paris, France, 2021. [Google Scholar]
- Global Wind Rnergy Statistics 2017, Global Wind Energy Council. 2017. Available online: http://gwec.net/global-figures/global-offshore/ (accessed on 25 July 2021).
- Zhang, S.; Wei, J.; Chen, X.; Zhao, Y. China in global wind power development: Role, status and impact. Renew. Sustain. Energy Rev. 2020, 127, 109881. [Google Scholar] [CrossRef]
- IRENA (2020), Renewable Energy and Jobs – Annual Review 2020, International Renewable Energy Agency, Abu Dhabi. Available online: https://www.irena.org/publications/2020/Sep/Renewable-Energy-and-Jobs-Annual-Review-2020 (accessed on 27 July 2021).
- Aldieri, L.; Grafström, J.; Sundström, K.; Vinci, C.P. Wind power and job creation. Sustainability 2020, 12, 45. [Google Scholar] [CrossRef]
- The Wind Power: Wind Turbines and Wind-Firms Database. Available online: http://www.thewindpower.net/statistics_en.php (accessed on 5 July 2021).
- Koivisto, M.; Plakas, K.; Ellmann, E.R.H.; Davis, N.; Sørensen, P. Application of microscale wind and detailed wind power plant data in large-scale wind generation simulations. Electr. Power Syst. Res. 2021, 190, 106638. [Google Scholar] [CrossRef]
- Renewable Capacity Highlights. Available online: https://bit.ly/3gEdf7X (accessed on 2 August 2021).
- Renewable Capacity Highlights. Available online: https://bit.ly/2U7ZJAL (accessed on 2 August 2021).
- Renewable Capacity Highlights. Available online: https://bit.ly/35zFRJv (accessed on 2 August 2021).
- Renewable Capacity Highlights. Available online: https://bit.ly/3vH4jmO (accessed on 2 August 2021).
- Global Wind Report. Available online: https://gwec.net/wp-content/uploads/2021/03/GWEC-Global-Wind-Report-2021.pdf (accessed on 5 August 2021).
- Global Energy Observatory. Available online: http://globalenergyobservatory.org/list.php?db=PowerPlants&type=Wind (accessed on 12 August 2021).
- Power Technology. Available online: https://www.power-technology.com/features/feature-biggest-wind-farms-in-the-world-texas/ (accessed on 22 July 2021).
- CleanTechnica. Available online: https://cleantechnica.com/2021/01/05/2020s-top-wind-energy-rd-achievements/ (accessed on 23 July 2021).
- Global Wind Energy Council. Available online: http://www.gwec.net/global-figures/ (accessed on 1 September 2021).
- Executive Summary Report, Power Sector, Central Electricity Authority, Ministry of Power. Government of India. Available online: https://cea.nic.in/executive-summary-report/?lang=en (accessed on 28 July 2021).
- Trading Economics. India GDP. Available online: https://tradingeconomics.com/india/gdp (accessed on 11 September 2021).
- Tentative State-Wise Break-Up of Renewable Power Target to be Achieved by the Year 2022. Ministry of New and Renewable Energy. Government of India. Available online: https://policy.asiapacificenergy.org/node/3652 (accessed on 11 September 2021).
- Government of India, Ministry of Power. Available online: https://bit.ly/35IdCIk (accessed on 13 September 2021).
- Government of India, Ministry of Power. Available online: https://cea.nic.in/wp-content/uploads/installed/2021/03/installed_capacity.pdf (accessed on 14 September 2021).
- Ministry of New and Renewable Energy, Government of India. Available online: https://bit.ly/3gGwCgQ (accessed on 14 September 2021).
- Ministry of New and Renewable Energy, Government of India. Available online: https://mnre.gov.in/the-ministry/physical-progress (accessed on 14 September 2021).
- Iqbal, H.; Sujni, P.; Khan, K. Sustainable governance in smart cities and use of supervised learning based opinion mining. Int. J. Electr. Comput. Eng. 2021, 11, 498. [Google Scholar]
- Kumar, A.; Sharma, A. Opinion Mining of Saubhagya Yojna for Digital India. In Proceedings of the International Conference on Innovative Computing and Communications, Ostrava, Czech Republic, 21–22 March 2019; Springer: Singapore; pp. 375–386. [Google Scholar]
- Jadhav, A. Rural Electrification in India: A Decentralized Approach. Int. Res. J. Eng. Technol. IRJET 2020, 7, 2911–2916. [Google Scholar]
- Ministry of Power. Saubhagya. Pradhan Mantri Sahaj Bijli Har Ghar Yojana. 2019. Available online: http://saubhagya.gov.in/dashboard/main (accessed on 15 September 2021).
- Katinas, V.; Gecevicius, G.; Marciukaitis, M. An investigation of wind power density distribution at location with low and high wind speeds using statistical model. Appl. Energy 2018, 218, 442–451. [Google Scholar] [CrossRef]
- Gubbala, C.S.; Dodla, V.B.R.; Desamsetti, S. Assessment of wind energy potential over India using high-resolution global reanalysis data. J. Earth Syst. Sci. 2021, 130, 1–19. [Google Scholar]
- Gao, M.; Ding, Y.; Song, S.; Lu, X.; Chen, X.; McElroy, M.B. Secular decrease of wind power potential in India associated with warming in the Indian Ocean. Sci. Adv. 2018, 4, 1–8. [Google Scholar] [CrossRef]
- Kumar, V.S.; Asok, A.B.; George, J.; Amrutha, M.M. Regional Study of Changes in Wind Power in the Indian Shelf Seas over the Last 40 Years. Energies 2020, 13, 2295. [Google Scholar] [CrossRef]
- Chandel, S.S.; Ramasamy, P.; Murthy, K.S.R. Wind power potential assessment of 12 locations in western Himalayan region of India. Renew. Sustain. Energy Rev. 2014, 39, 530–545. [Google Scholar] [CrossRef]
- Boopathi, K.; Kushwaha, R.; Balaraman, K.; Bastin, J.; Kanagavel, P.; Prasad, D.R. Assessment of wind power potential in the coastal region of Tamil Nadu, India. Ocean Eng. 2021, 219, 108356. [Google Scholar] [CrossRef]
- National Institute of Wind Energy India. Available online: https://niwe.res.in/department_wra_100m%20agl.php (accessed on 15 September 2021).
- Sitharthan, R.; Swaminathan, J.N.; Parthasarathy, T. Exploration of wind energy in India: A short review. In Proceedings of the 2018 National Power Engineering Conference (NPEC), IEEE, Madurai, Indina, 9–10 March 2018; pp. 1–5. [Google Scholar]
- Indian Wind Energy Association. Available online: http://www.inwea.org/wind-energy-in-india/wind-power-installation/ (accessed on 31 March 2020).
- National Institute of Wind Energy India. Available online: https://niwe.res.in/information_isw.php (accessed on 16 September 2021).
- Kar, S.K.; Sharma, A. Wind power developments in India. Renew. Sustain. Energy Rev. 2015, 48, 264–275. [Google Scholar] [CrossRef]
- Elavarasan, R.M.; Selvamanohar, L.; Raju, K.; Vijayaraghavan, R.R.; Subburaj, R.; Nurunnabi, M.; Khan, I.A.; Afridhis, S.; Hariharan, A.; Pugazhendhi, R.; et al. A holistic review of the present and future drivers of the renewable energy mix in Maharashtra, state of India. Sustainability 2002, 12, 6596. [Google Scholar] [CrossRef]
- Ministry of New and Renewable Energy. Installed Capacity and Capacity Utilization, Energy Statics India. 2021. Available online: https://bit.ly/3wKOHQh (accessed on 16 September 2021).
- India Energy Outlook. 2021. Available online: https://iea.blob.core.windows.net/assets/1de6d91e-e23f-4e02-b1fb-51fdd6283b22/India_Energy_Outlook_2021.pdf (accessed on 16 September 2021).
- Standing Committee of Energy, Seventeenth Lok Sabha. Ministry of New and Renewable Energy Sources. 2021. Available online: https://mnre.gov.in/img/documents/uploads/file_f-1608040317211.pdf (accessed on 21 August 2021).
- Central Electricity Authority. Renewable Energy Generation Report. 2021. Available online: https://cea.nic.in/renewable-generation-report/?lang=en (accessed on 20 September 2021).
- Vestas India. Available online: http://www.vestas.in/about (accessed on 23 August 2021).
- Suzlon Energy Limited. 2018. Available online: https://www.suzlon.com/in-en/suzlon-worldwide/asia/india (accessed on 23 August 2021).
- Global Wind Turbine Industry Factsheet 2020: Top 10 Largest Wind Turbine Manufacturers. Available online: https://blog.bizvibe.com/blog/energy-and-fuels/top-10-wind-turbine-manufacturers-world (accessed on 23 August 2021).
- Ministry of New and Renewable Energy Sources, Manufacturing. Available online: https://mnre.gov.in/wind/manufacturers-and-quality-control (accessed on 23 August 2021).
- National Institute of Wind Energy. Available online: https://niwe.res.in/assets/Docu/lwms/LIST_OF_WMS_AS_ON_31.05.2021.pdf (accessed on 23 September 2021).
- Wind Power in India. WIKIPEDIA the Free Encyclopaedia. Available online: https://en.wikipedia.org/wiki/Wind_power_in_India (accessed on 23 September 2021).
- Energy Alternative India (EAI). Available online: http://www.eai.in/ref/ae/win/technology_options.html (accessed on 22 September 2021).
- Eltayesh, A.; Castellani, F.; Burlando, M.; Hanna, M.B.; Huzayyin, A.S.; El-Batsh, H.M.; Becchetti, M. Experimental and numerical investigation of the effect of blade number on the aerodynamic performance of a small-scale horizontal axis wind turbine. Alex. Eng. J. 2021, 60, 3931–3944. [Google Scholar] [CrossRef]
- Zemamou, M.; Aggour, M.; Toumi, A. Review of savonius wind turbine design and performance. Energy Procedia 2017, 141, 383–388. [Google Scholar] [CrossRef]
- Hand, B.; Kelly, G.; Cashman, A. Aerodynamic design and performance parameters of a lift-type vertical axis wind turbine: A comprehensive review. Renew. Sustain. Energy Rev. 2021, 139, 110699. [Google Scholar] [CrossRef]
- Abdelsalam, A.M.; Kotb, M.A.; Yousef, K.; Sakr, I.M. Performance study on a modified hybrid wind turbine with twisted Savonius blades. Energy Convers. Manag. 2021, 241, 114317. [Google Scholar] [CrossRef]
- Liu, B.; Jin, W.; Zhao, J.; Zhang, Q.; An, W. Research on Risk Assessment Techniques of Offshore Wind Power Projects during Operation Period. IOP Conf. Ser. Earth Environ. Sci. 2021, 766, 012023. [Google Scholar] [CrossRef]
- Cevasco, D.; Koukoura, S.; Kolios, A.J. Reliability, availability, maintainability data review for the identification of trends in offshore wind energy applications. Renew. Sustain. Energy Rev. 2021, 136, 110414. [Google Scholar] [CrossRef]
- Kota, S.; Bayne, S.B.; Nimmagadda, S. Offshore wind energy: A comparative analysis of UK, USA and India. Renew. Sustain. Energy Rev. 2015, 41, 685–694. [Google Scholar] [CrossRef]
- Bento, N.; Fontes, M. Emergence of floating offshore wind energy: Technology and industry. Renew. Sustain. Energy Rev. 2019, 99, 66–82. [Google Scholar] [CrossRef]
- Díaz, H.; Soares, C.G. Review of the current status, technology and future trends of offshore wind farms. Ocean Eng. 2020, 209, 107381. [Google Scholar] [CrossRef]
- Kumar, R.; Stallard, T.; Stansby, P.K. Large-scale offshore wind energy installation in northwest India: Assessment of wind resource using Weather Research and Forecasting and levelized cost of energy. Wind Energy 2021, 24, 174–192. [Google Scholar] [CrossRef]
- Indian Renewable Energy Development Agency Ltd. Available online: https://mnre.gov.in/ireda (accessed on 25 September 2021).
- Indian Wind Power Association. Available online: http://www.windpro.org/about-iwpa.html (accessed on 25 September 2021).
- CLP India Private Limited. Available online: https://www.clpindia.in/renewables.html#Khandke (accessed on 24 September 2021).
- National Offshore Wind Energy Authority. Available online: https://bit.ly/3iZVilU (accessed on 25 September 2021).
- Indian Wind Energy Association. Available online: http://www.inwea.org/aboutinwea.htm (accessed on 25 September 2021).
- Singh, R.; Sood, Y.R. Current status and analysis of renewable promotional policies in Indian restructured power sector—A review. Renew. Sustain. Energy Rev. 2011, 15, 657–664. [Google Scholar] [CrossRef]
- Ministry of Law and Justice. The Electricity Act, 2003; Government of India, The Gazette of India, Extra Ordinary: New Delhi, India, 2003.
- National Electricity Policy 2005, Government of India. Available online: https://www.lse.ac.uk/GranthamInstitute/wp-content/uploads/laws/1324.pdf (accessed on 25 September 2021).
- National Electricity Policy and Plan. Government of India. Available online: http://www.powermin.nic.in (accessed on 25 September 2021).
- KhareSaxena, A.; Saxena, S.; Sudhakar, K. Solar energy policy of India: An overview. CSEE J. Power Energy Syst. 2020, 1–32. [Google Scholar] [CrossRef]
- Matakiviti, A. Energy Adviser GOI National Energy Policy and Rural Electrification Policy. In Proceedings of the Second Consultation Workshop, Port Moresby, Papua New Guinea, 5–7 April 2006; pp. 5–7. [Google Scholar]
- Tariff Policy: 6th January 2006. Government of India. Available online: https://orierc.org//OERCOLD/documents/National%20Electricity%20Tariff%20Policy.pdf (accessed on 16 September 2021).
- Ministry of Power, Government of India. Available online: https://powermin.gov.in/en/content/tariff-policy (accessed on 16 September 2021).
- State Govt. Tariff. Wind Power India. Available online: http://www.windpowerindia.com/index.php?option=com_content&view=article&id=64&Itemid=80 (accessed on 26 September 2021).
- Central Electricity Regulatory Commission (CERC). Terms and Conditions for Tariff Determination from Renewable Energy Sources Regulations. 2010. Available online: http://www.cercind.gov.in/2012/orders/RE_35_2012.pdf (accessed on 26 September 2021).
- Amrutha, A.A.; Balachandra, P.; Mathirajan, M. Model-based approach for planning renewable energy transition in a resource-constrained electricity system—A case study from India. Int. J. Energy Res. 2018, 42, 1023–1039. [Google Scholar] [CrossRef]
- Mishra, S.; Viral, R.K. January. Integration Phenomena of Renewable Energy with Contemplation of Issues from Electricity Distribution Utility and Consumer Perceptive. In Proceedings of the 2021 International Conference on Sustainable Energy and Future Electric Transportation (SEFET), IEEE, Hiderabad, India, 21–23 January 2021; pp. 1–6. [Google Scholar]
- Sawhney, A. Striving towards a circular economy: Climate policy and renewable energy in India. Clean Technol. Environ. Policy 2021, 23, 491–499. [Google Scholar] [CrossRef]
- Gupta, S.K.; Purohit, P. Renewable energy certificate mechanism in India: A preliminary assessment. Renew. Sustain. Energy Rev. 2013, 22, 380–392. [Google Scholar] [CrossRef]
- Girish, G.P.; Sashikala, P.; Supra, B.; Acharya, A. Renewable energy certificate trading through power exchanges in India. Int. J. Energy Econ. Policy 2015, 5, 805–808. [Google Scholar]
- Renewable Energy Certificate Registry of India. Available online: https://www.recregistryindia.nic.in/ (accessed on 16 September 2021).
- Central Electricity Regulatory Commission. Available online: https://cercind.gov.in/2019/market_monitoring/Annual%20Report%202018-19.pdf,file:///E:/DATA%20BACKUPPPP/Desktop/REC_REPORT_17082018_fPRINT%20Table%2021.pdf (accessed on 25 September 2021).
- Sánchez-Zapata, J.A.; Clavero, M.; Carrete, M.; DeVault, T.L.; Hermoso, V.; Losada, M.A.; Polo, M.J.; Sánchez-Navarro, S.; Pérez-García, J.M.; Botella, F.; et al. Effects of Renewable Energy Production and Infrastructure on Wildlife. In Current Trends in Wildlife Research; Springer: Cham, Switzerland, 2016; pp. 97–123. [Google Scholar]
- Agarwal, T.; Verma, S.; Gaurh, A. Issues and Challenges of Wind Energy. In Proceedings of the 2016 International Conference on Electrical, Electronics, and Optimization Techniques (ICEEOT), IEEE, Chennai, India, 3–5 March 2016; pp. 67–72. [Google Scholar]
- Kulkarni, S.H.; Anil, T.R. Renewable Energy in India—Barriers to Wind Energy. In International Solutions to Sustainable Energy, Policies and Applications; River Publishers: Aalborg, Denmark, 2020; Volume 38, pp. 359–386. [Google Scholar]
- Kumar, N.; Pal, N. The existence of barriers and proposed recommendations for the development of renewable energy in Indian perspective. Environ. Dev. Sustain. 2020, 22, 2187–2205. [Google Scholar] [CrossRef]
- Jaskelevičius, B.; Užpelkiene, N. Research and assessment of wind turbine’s noise in Vydmantai. J. Environ. Eng. Landsc. Manag. 2008, 16, 76–82. [Google Scholar] [CrossRef][Green Version]
- Katinas, V.; Marčiukaitis, M.; Tamašauskienė, M. Analysis of the wind turbine noise emissions and impact on the environment. Renew. Sustain. Energy Rev. 2016, 58, 825–831. [Google Scholar] [CrossRef]
- Merino-Martínez, R.; Pieren, R.; Schäffer, B. Holistic approach to wind turbine noise: From blade trailing-edge modifications to annoyance estimation. Renew. Sustain. Energy Rev. 2021, 148, 111285. [Google Scholar] [CrossRef]
- Velilla, E.; Collinson, E.; Bellato, L.; Berg, M.P.; Halfwerk, W. Vibrational noise from wind energy-turbines negatively impacts earthworm abundance. Oikos 2021, 130, 844–849. [Google Scholar] [CrossRef]
- Nazir, M.S.; Ali, N.; Bilal, M.; Iqbal, H.M. Potential environmental impacts of wind energy development: A global perspective. Curr. Opin. Environ. Sci. Health 2020, 13, 85–90. [Google Scholar] [CrossRef]
- Nopp-Mayr, U.; Kunz, F.; Suppan, F.; Schoell, E.; Coppes, J. Novel Application and Validation of a Method to Assess Visual Impacts of Rotating Wind Turbine Blades Within Woodland Areas. PFG J. Photogramm. Remote Sens. Geoinf. Sci. 2021, 89, 1–14. [Google Scholar] [CrossRef]
- Elavarasan, R.M.; Shafiullah, G.M.; Manoj Kumar, N.; Padmanaban, S. A state-of-the-art review on the drive of renewables in Gujarat, state of India: Present situation, barriers and future initiatives. Energies 2020, 13, 40. [Google Scholar] [CrossRef]
- Mishnaevsky, L., Jr.; Thomsen, K. Costs of repair of wind turbine blades: Influence of technology aspects. Wind Energy 2020, 23, 2247–2255. [Google Scholar] [CrossRef]
- Hochheimer, J. Wind Generation Integration & Operation-Technical Challenges/Issues. In Proceedings of the 2006 IEEE Power Engineering Society General Meeting, Montreal, QC, Canada, 18–22 June 2006; p. 6. [Google Scholar]
- Dalili, N.; Edrisy, A.; Carriveau, R. A review of surface engineering issues critical to wind turbine performance. Renew. Sustain. Energy Rev. 2009, 13, 428–438. [Google Scholar] [CrossRef]
- Petković, D. Adaptive neuro-fuzzy optimization of the net present value and internal rate of return of a wind farm project under wake effect. J. Cent. Cathedra Bus. Econ. Res. J. 2015, 8, 11–28. [Google Scholar]
- Luthra, S.; Kumar, S.; Garg, D.; Haleem, A. Barriers to renewable/sustainable energy technologies adoption: Indian perspective. Renew. Sustain. Energy Rev. 2015, 41, 762–776. [Google Scholar] [CrossRef]
- Jelti, F.; Allouhi, A.; Büker, M.S.; Saadani, R.; Jamil, A. Renewable power generation: A supply chain perspective. Sustainability 2021, 13, 1271. [Google Scholar] [CrossRef]
- Hansen, U.E.; Larsen, T.H.; Bhasin, S.; Burgers, R.; Larsen, H. Innovation capability building in subsidiaries of multinational companies in emerging economies: Insights from the wind turbine industry. J. Clean. Prod. 2020, 244, 118746. [Google Scholar] [CrossRef]
- Wind Power Programme in India, Ministry of New and Renewable Energy (MNRE), Government of India. Available online: https://mnre.gov.in/ (accessed on 16 September 2021).
- Premalatha, M.; Abbasi, T.; Abbasi, S.A. Wind energy: Increasing deployment, rising environmental concerns. Renew. Sustain. Energy Rev. 2014, 31, 270–288. [Google Scholar]
- Global Wind Energy Outlook 2017, Global Wind Energy Council (GWEC). Available online: https://www.iea.org/reports/world-energy-outlook-2017 (accessed on 16 September 2021).
- Ujwal Bharat. Achievements and Initiatives of Ministry of Power, Coal and New & Renewable Energy, Government of India. 2015. Available online: https://vikaspedia.in/energy/policy-support/ujwal-bharat (accessed on 16 September 2021).
- Satpute, A.V.; Kumar, E.V. Current scenario of wind power in India, government policies, initiatives, status and challenges. Int. J. Energy Sect. Manag. 2020, 15, 209–226. [Google Scholar] [CrossRef]
- Iqbal, A.; Malik, H.; Riyaz, A.; Abdellah, K.; Bayhan, S. Renewable Power for Sustainable Growth; Springer Nature: Singapore, 2021; Volume 723, p. 805. [Google Scholar]
- Malik, H.; Yadav, A.K. A novel hybrid approach based on relief algorithm and fuzzy reinforcement learning approach for predicting wind speed. Sustain. Energy Technol. Assess. 2020, 43, 100920. [Google Scholar] [CrossRef]
- Malik, H.; Khurshaid, T.; Almutairi, A.; Alotaibi, M.A. Multi-Step Ahead Time-Series Wind speed forecasting for Smart-Grid Application. J. Intell. Fuzzy Syst. 2022, 42, 633–646. [Google Scholar] [CrossRef]
- Azeem, A.; Fatema, N.; Malik, H. k-NN and ANN Based Deterministic and Probabilistic Wind Speed Forecasting Intelligent Approach. J. Intell. Fuzzy Syst. 2018, 35, 5021–5031. [Google Scholar] [CrossRef]
- Arora, P.; Malik, H.; Sharma, R. Wind Energy Forecasting Model for Northern-Western Region of India Using Decision Tree and MLP Neural Network Approach. Interdiscip. Environ. Rev. 2018, 19, 13–30. [Google Scholar] [CrossRef]
Publisher’s Note: MDPI stays neutral with regard to jurisdictional claims in published maps and institutional affiliations. |
© 2022 by the authors. Licensee MDPI, Basel, Switzerland. This article is an open access article distributed under the terms and conditions of the Creative Commons Attribution (CC BY) license (https://creativecommons.org/licenses/by/4.0/).