Article

Ammonia and Biogas from Anaerobic and Sewage Digestion for Novel Heat, Power and Transport Applications—A Techno-Economic and GHG Emissions Study for the United Kingdom

by
Oliver Grasham
1,*,
Valerie Dupont
1,*,
Timothy Cockerill
1,2 and
Miller Alonso Camargo-Valero
3,4
1
School of Chemical and Process Engineering, University of Leeds, Leeds LS2 9JT, UK
2
School of Mechanical Engineering, University of Leeds, Leeds LS2 9JT, UK
3
BioResource Systems Research Group, School of Civil Engineering, University of Leeds, Leeds LS2 9JT, UK
4
Departamento de Ingeniería Química, Campus La Nubia, Universidad Nacional de Colombia, Manizales 170002, Colombia
*
Authors to whom correspondence should be addressed.
Energies 2022, 15(6), 2174; https://doi.org/10.3390/en15062174
Submission received: 10 January 2022 / Revised: 4 March 2022 / Accepted: 6 March 2022 / Published: 16 March 2022
(This article belongs to the Special Issue Sustainable Energy from Biomass and Waste)

Abstract

:
Anaerobic digestion (AD) and sewage sludge digestion (SD) plants generate significant quantities of ammoniacal nitrogen in their digestate liquor. This article assesses the economic viability and CO2 abatement opportunity from the utilisation of this ammonia under three scenarios and proposes their potential for uptake in the United Kingdom. Each state-of-the-art process route recovers ammonia and uses it alongside AD-produced biomethane for three different end goals: (1) the production of H2 as a bus transport fuel, (2) production of H2 for injection to the gas grid and (3) generation of heat and power via solid oxide fuel cell technology. A rigorous assessment of UK anaerobic and sewage digestion facilities revealed the production of H2 as a bus fleet transport fuel scenario as the most attractive option, with 19 SD and 42 AD existing plants of suitable scale for process implementation. This is compared to 3 SD/1 AD and 13 SD/23 AD existing plants applicable with the aim of grid injection and SOFC processing, respectively. GHG emission analysis found that new plants using the NWaste2H2 technology could enable GHG reductions of up to 4.3 and 3.6 kg CO2e for each kg bio-CH4 supplied as feedstock for UK SD and AD plants, respectively.

1. Introduction

Anaerobic digestion (AD) from both commercial facilities and wastewater treatment plants (WWTPs) in the UK are significant contributors to national energy production, with a 10% share of the bioenergy and wastes sourced electricity generated in 2019 [1]. AD has been a bastion in UK efforts to tackle climate change since the passing of the Climate Change Act in 2008 and the industry continues to grow, with, for example, 5.7% and 4.0% increases in WWTP and commercial AD generation, respectively, between 2018 and 2019 [2]. With renewed ambitions from the 2021 United Nations Climate Change Conference (COP26) to adhere to the Paris Agreements 1.5 °C global warming limit, the role of improving energy from biomass and waste has never been more important with AD at its spearhead [3]. WWTP AD is also referred to as sewage sludge digestion (SD) and the resulting biogas as sewage gas and may be referred to as such throughout this report.
One notable advantage of AD is its inherent flexibility in terms of both acceptable feeds and product end-use. The vast majority of biogas generated in the UK is used for the production of heat and power [4]. However, biogas is also increasingly being scrubbed of its CO2 content and utilised as a transport fuel or injected into the natural gas grid. For example, biogas injected into the gas grid increased by 58 kilotons of oil equivalent or ‘ktoe’ (13%) to 497 ktoe in 2019.
Despite the impressive state of AD in the UK and globally, studies such as Grasham et al. [5,6], Babson et al. [7] and Xu et al. [8] suggest that these facilities are missing the chance to maximise yields and outputs by wasting a precious resource, in the form of ammonia. Ammoniacal nitrogen accumulates during anaerobic digestion due to the breakdown of nitrogenous compounds. Some nitrogen is found in the gas phase as free ammonia (NH3), yet the vast majority is emitted in the digestate’s liquid fraction as soluble ammonium (NH4+).
This circular economy approach to the wastewater industry is important, providing opportunity for current wastewater treatment operators to maximise their environmental and economic potential [9]. However, the future outlook is even more promising where recovery, regeneration and valorisation of materials, nutrients and energy will be at the forefront of infrastructure design with ever intensifying and condensing global populations [10]. The recovery and utilisation of ammonia for energy purposes is clearly attractive with operators such as Northumbrian Water piloting ammonia recovery for H2 production [11].
The state of the art process presented in Grasham et al. [5] demonstrated the effective recovery of ammonia from digestate liquor for use alongside biomethane in a solid oxide fuel cell (SOFC) stack. A case-study of an operational wastewater treatment plant showed the potential to increase electricity generation by 45%. This was facilitated by a combination of additional fuel, in the form of recovered ammonia (which contributes to 4.5% of the device output), and use of SOFC technology, which can operate at far superior electrical efficiencies compared to the conventional combustion-based alternatives.
Significantly, recovery of ammonia from digestate liquor has further merits when performed at SD plants due to the customary practice of reintroducing digestate liquor to the sewage treatment process for nitrogen treatment. Under these circumstances, the ammonium present is treated biologically in the plant’s activated sludge process (ASP), which has considerable power demand due to the aerobic conditions required and the emission of the potent greenhouse gas nitrous oxide (N2O) as an intermediary and side product of nitrification and denitrification [12]. This is not to say ammonia recovery is inappropriate for commercial AD facilities, but that there are added benefits of doing so at sewage sludge digestion plants.
Ammonia recovery from digestate liquor may not be limited to the generation of electricity because there is the alternative opportunity for green H2 production instead. In the work by Grasham et al. [6], ammonia recovery and its decomposition (cracking) to H2 and N2 during biomethane steam reforming were simultaneously performed in a process generating a pure H2 product to be used as a fuel for a fleet of fuel cell electric buses (FCEBs) at a case study WWTP. Not only was it found to be financially attractive, but it could also enable impressive lifecycle greenhouse gas (GHG) emission savings due to abatement of emissions from traditional diesel buses and diversion of ammonia from biological removal.
There are multiple other manners in which H2 can be utilised as an alternative to a transport fuel. In the IEA’s Net Zero by 2050 Roadmap for the Global Energy Sector, biogases, hydrogen and hydrogen-based fuels make up almost 20% of global final energy in 2050 [13]. In the UK, projects such as Northern Gas Network’s ‘H21 Citygate’ and Keele University’s ‘HyDeploy’ are researching the potential for green hydrogen injection in to the gas grid [14,15]. Similar strategies are being carried out in other EU countries, such as RWE’s ‘power-to-gas’ project in North Rhine-Westphalia, Germany and DNV GL’s ‘HYREADY’ project [16]. In the US, the Department of Energy’s (DOE) ‘H2@SCALE’ project [17] has initiated R&D into hydrogen production for grid injection. The aforementioned projects are at various stages of development, but the consensus is that hydrogen can be injected safely into much of the existing gas grid infrastructure, such as polyethylene pipes, whilst multiple storage options have also been identified [14]. This begs the question as to whether the H2 production process presented in Grasham et al. [6] could instead be used for grid injection.
Decarbonising domestic heat is a complicated task and hydrogen is gaining further attraction due to the vast infrastructural changes required for electrification and heat pump networks [18]. For low carbon H2 to make its mark in domestic heat, subsidies will be essential due to the gap in the cost of natural gas and H2. Quarton and Samsati suggested partial H2 injection is currently plausible but only with feed-in subsidies of GBP 20–50/MWh [19]. This highlights the need for effective economic support for the decarbonising of domestic heat.
An overview of the different process options discussed has been illustrated in Figure 1, colloquially termed NWaste2H2 processes. Until now, the analysis of these systems has focussed on their application at a single case study facility. The work detailed in the present article places the innovative use of ammonia and biomethane in the context of all potential UK sites, investigating the possibility of uptake via in-depth techno-economic analysis of viable process implementation. By understanding the implications of scale on profitability of these novel systems, a robust conclusion can be made for UK roll-out and how NWaste2H2 technologies can affect the UK energy landscape and its vital role in combatting climate change articulated through a GHG emission balance study.
Figure 1 displays an overview of the processes developed and discussed in this article, whereby biomethane and recovered ammonia are either used for H2 production to be used as a fuel for FCEB (Scenario 1), for gas grid injection (Scenario 2) or with SOFC technology for CHP purposes (Scenario 3).
Hydrogen fuel-cell electric vehicles (FCEVs) are becoming more commonplace with all major manufacturers releasing or developing their own range [20]. Millions of FCEVs are expected to be on the road in China by 2030 [21]. However, a clear economic barrier for FCEVs are the high costs in compressing H2 for on-board storage. A recent study by Perna et al. concluded reasonable lifecycle levellised costs of hydrogen (LCOH) from refuelling stations to lie between 6.28–7.92 EUR/kg. This is considerably greater than LCOH figures when compression for vehicle refuelling is not considered such as, the International Renewable Energy Agency figure for hydrogen generated via electrolysis from wind in 2018 at USD 4/kg H2 [22]. Transport is one sector falling behind on its decarbonising targets, as evident in the European transport sector (RES-T) [23], and the development of FCEV pathways is expected to aid the transition to zero-carbon transport.
Novel hydrogen and fuel cell technologies will inevitably incur high start-up and capital expenditure costs. When investigating the economic feasibility of process implementation, it is important to understand the returns expected, especially in a semi-regulated industry such as UK wastewater. The weighted average cost of capital (WACC) represents the average rate paid to secure assets, whether that be in debt or equity [24]. It is a valuable metric on which to base expected returns. This can then be used as an effective discount rate in net present value (NPV) levellised cost analysis. A detailed report by OFWAT on the cost of capital detailed that for the UK wastewater industry, its WACC currently lies between 4.69–5.45% [25].

2. Materials and Methods

2.1. Economic Analysis with Scale

To understand the feasibility of NWaste2H2 implementation across the UK, a detailed economic analysis has been carried out for each process at a case-study facility. The results from this investigation were appropriately adjusted to infer economic feasibility changes with plant scale. Firstly, the six-tenths rule [26] was applied to capital expenditure (CAPEX) figures calculated for the case-study facility to estimate the impact of economy of scale on initial investments. The associated calculation is described in Equation (1):
CAPEX   plant   b = CAPEX   plant   a   X 0.6
where the CAPEX of plant a is the original case study figure and X is the multiplication factor for the known capacity difference between unit a and unit b  b a . Each of the income streams and operational expenditure (OPEX) figures have been scaled directly with the multiplication factor. Where appropriate, an exchange rate of GBP 0.78/USD 1 and an interest rate based on the long-term UK RPI of 2.87% have been used throughout.
The net present value (NPV) over the projected 20-year lifetime of the plants, at scales ranging from 10% to 200% of the case study site at 10% increments, was calculated using Equation (2):
NPV i , N = t = 0 N R t 1 + i t
where i is the discount rate (as a fraction), N is the plant lifetime, t is the year of operation and Rt is the net cash flow for the year. NPV takes into account the time value of money, considering whether project funding is worthwhile compared to other investment options by discounting future cash flows. The discount rate utilised in this analysis is 6%, which has been rounded up from the wastewater industry’s weighted average cost of capital (WACC) of 5.45% [25], to be as conservative as possible due to the high-risk nature of implementing complex processes. When NPV is positive (i.e., at the point of discounted payback), the investment is deemed profitable, securing the returns expected by the company. Further analysis was performed in the form of return on invested capital (ROIC), which is the percentage return made on invested capital, the formula of which is shown below:
ROIC = o p e r a t i n g   i n c o m e   1 t a x   r a t e I n v e s t e d   C a p i t a l
The invested capital was calculated by assuming the CAPEX was financed using debt, weighted at 3%, in accordance with the industry’s average cost of debt [25]. The annual after-tax operating profit was used to reduce debt and the tax rate was fixed at 19%, in accordance with UK corporation tax. ROIC is often used as a metric for investors to calculate whether an investment in a company is worthwhile by incorporating their entire capital inventory and cost of equity/debt. However, it can also be used by accountants to check whether a new capital investment is adding value to the company. The required ROIC threshold is often determined as two percentage points higher than the company’s WACC [27,28]. For the wastewater industry, the minimum required ROIC would therefore be 8%, given the conservative 6% WACC [25]. This analysis was done on top of the NPV to provide a threshold facility size used to determine each of the UK SD and AD sites applicable for process implementation.
Levellised cost of energy (LCOE) and levellised cost of hydrogen (LCOH) are widely used as metrics to compare the cost of delivering alternative sources of energy and hydrogen, respectively [29]. In this article, LCOE and LCOH calculations have been performed to indicate the effect of facility size and type (commercial AD/SD) on the relative price of generating energy or hydrogen. It is important to recognise that the levellised cost analysis is a benchmarking tool and is to be used for comparison with alternative processes of a similar nature. The calculation for the levellised cost of energy is found in Equation (4):
LCOE = t = 0 T C t / 1 + r t t = 0 T E t / 1 + r t
where Ct is the net cost of the project at time t, r is the discount rate and Et is the annual energy production. The abated expenditure on electricity (discussed below) is deducted from the Ct to assess the difference between SD and standard AD facilities. For LCOH, Et is substituted with annual hydrogen production. The LCOE and LCOH data presented in this work are representative of the end of the plant’s proposed lifetime of 20 years.
In many cases, the removal of ammonia via nitrification and denitrification in the activated sludge process of WWTPs accounts for over ¼ of the facility’s total energy demand [30]. It is discussed by Garrido et al. [30] that the aerobic requirement of nitrification is 4.57 kg O2 per kg of oxidised N, and that aeration efficiency varies between 1–2 kWh per kg O2 [31]. To avoid overestimating the savings provided by ammonia diversion from the activated sludge process, the lower boundary of this range was chosen for energy balance calculations, providing an energy abatement factor of 4.57 kWh per kg of nitrogen diverted.

2.2. Interpretation for Anaerobic Digestion Sites

SD facilities are not the only sites suitable for this technology. In the presented analysis, standard AD plants are also considered. Under these scenarios, ammonia is also recovered from digestate liquor, but there is no diversion from conventional treatment and its associated benefits. Therefore, the financial outlook for standard AD sites will be worse compared to SD sites of identical size, as the abated electricity use from nitrification/denitrification diversion is omitted. Analysis of process implementation at standard AD facilities has been conducted under each of the three scenarios discussed.

2.3. CAPEX

2.3.1. Overall

An Aspen Process Economic Analyzer (APEA) [32] was used to estimate the capital expenditure for the majority of equipment in each NWaste2H2 process. CAPEX calculations from APEA include both the ‘equipment cost’ for simulated equipment unit costs and the ‘total installed cost’ for other plant requirements, such as above ground piping, poling, concrete, instrumentation underground/above ground electrics, grout and labour costs.
An RGibbs reactor (thermodynamic equilibrium reactor) was used in Aspen Plus (V.10) for the simulation of furnaces in both the SOFC and H2 production scenarios, but APEA was unable to appropriately cost CAPEX. As such, stainless-steel direct-fired heaters were costed as a factor of heat duty using Peters et al. [33]. Inflation accounting using the Bank of England’s inflation calculator [34] was performed from the date of publication to 2019, and a yearly price increase of 3% was found.
The cost of biogas clean-up (high pressure water scrubbing technology) prior to the processes simulated in Aspen Plus have been implied via a study from Barbera et al. [35], who evaluated installation costs for a biogas throughput of 500 Nm3 per hour at EUR 687,924. This figure was adjusted for scale using Equation (1) to meet the plant capacities analysed in this article.

2.3.2. H2 Transport Fuel: Scenario 1

The cost of the compression, storage and dispensing (CSD) units for the FCEB refuelling station was assessed under the transport fuel scenario. For costs unavailable for calculation in APEA associated with installation of the CSD, data from The National Renewable Energy Laboratory (NREL) techno-economic study [36] have been used. The 0.6 rule (Equation (2)), was again used to estimate costs adjustments with the NREL model distinguished by scale. The CSD system consists of the compression of generated H2 to 350 bar at 99.9% purity, ready for dispensing to H2-fuelled buses. Nickel-based reforming catalyst costs were calculated at USD 0.19 per kg of H2 [37].

2.3.3. H2 Grid Injection: Scenario 2

The capital expenditure in Scenario 2 is equivalent to Scenario 1 up to the pressure swing adsorption (PSA) unit. Downstream from this, it is proposed that H2 is pressurised to 7 bar and injected into the gas grid. Due to the limited number of current H2 to grid sites globally, much of the economic data have been based on information related to biomethane injection. Cost of connection to the gas grid is variable site-to-site. However, it is estimated that connection costs are in the region of GBP 750,000 for bio-methane grid injection [38]. This includes installation of units encompassing pressure control, gas quality monitoring, metering, odorising and telecommunications [39].

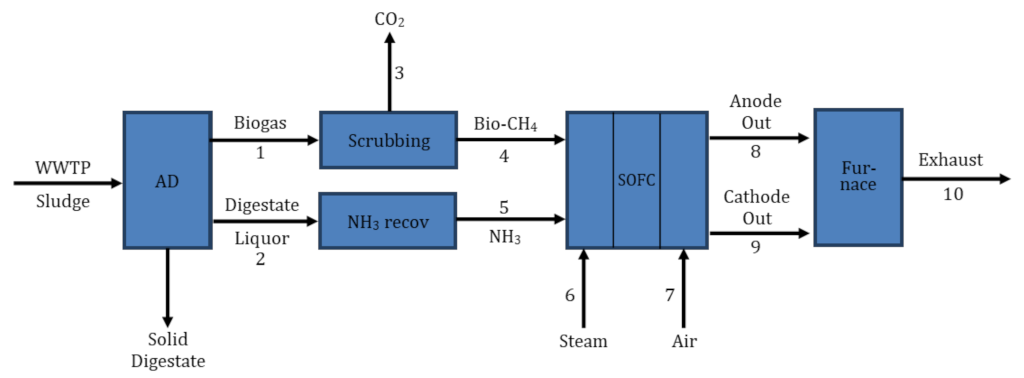
2.3.4. SOFC: Scenario 3

Data detailed in MosayebNezhad et al. [40] were used to infer various costs given manufacturing rate of at least 5000 units per year by the provider. This includes stack and clean-up system CAPEX and stack replacement costs, with the cost functions shown in Table 1. The Batelle Memorial Institute for the US Department of Energy [41] provided the DC/AC inverter costs given a manufacturing rate of 1000 units per year for 250 kW modules. The calculations for each unit also include installation costs.

2.4. OPEX

2.4.1. Overall

Calculations for total cost of labour was carried by first estimating the number of plant operators as described in Turton et al. [42] and Equation (5):
N O L = 6.29 + 31.7 P P 2 + 0.23 N n p 0.5
where NOL is the total operators per shift, PP is the number of particulate solids handling processing steps and Nnp is the number processing steps with non-particulates.
An operator would work a 5-day week of 8 h shifts, 49 weeks per annum, making 245 shifts per operator per year. Mean salary for a process engineer has been set at GBP 34,523 [43] for plant operators. An annual salary inflation rate of 2.99% has been applied, corresponding to data from the UK Office for National Statistics (ONS) for the years between 2005–2015 [44].
Maintenance costs of 3% of the total installed costs were accounted, as suggested in Turton et al. [42] and Rotunno et al. [45]. Electricity purchasing price has also been applied at 10.55 p kWh−1, as detailed by the UK Department for Business, Energy & Industrial Strategy BEIS [46]. Heat expenditure was calculated at 2.33 p/kWh in accordance with the BEIS [46].
Supervision, supplies, laboratory and research variable costs were added; fixed costs for taxes, insurance and plant overheads were also added and general costs for administration, distribution and selling and development were included and calculated as in Galli et al. [47].

2.4.2. H2 Transport Fuel: Scenario 1

Replacement costs have been inferred from the aforementioned NREL economic model [36], whereby replacement costs equate to 15, 50 and 15% after 5, 10 and 15 years, respectively. For this scenario, these replacement costs exist on top of the maintenance costs, calculated as previously discussed.

2.4.3. H2 Grid Injection: Scenario 2

Additional electricity costs in the grid injection scenario (2) were calculated using power requirements calculated in Aspen Plus for the compression of H2 to 7 bar from atmospheric conditions.

2.5. Income Streams

2.5.1. H2 Transport Fuel: Scenario 1

For renewable H2 to be competitive with diesel for bus transportation, a market value of GBP 4.50 (EUR 5)/kg is required [48]. Accordingly, the H2 will be sold at this price. The renewable transport fuel obligation (RTFO) grants certificates to producers of low carbon/renewable fuel in the UK. The certificates are sold to organisations that need to meet their certificate obligations, providing additional income. Under conservative valuation, this study assigned a market value of GBP 0.15 per certificate with 4.58 certificates awarded per kg produced [49].

2.5.2. H2 Grid Injection: Scenario 2

In the UK, there are currently financial incentives provided for biomethane injection under the renewable heat incentive (RHI). They are provided under a three-tier system, with separate tariffs for the injection of (1) the first 40 TWh, (2) the next 40 TWh and (3) anything after that. The associated rates currently stand at (1) 4.92, (2) 2.90 and (3) 2.24 pence (GBP 1/100) per kWh (p/kWh−1) [50]. The equivalent tariffs per kWh of injected H2 have been used to assess the economic viability of utilising the NWaste2H2 process for grid injection. However, at the launch of the scheme in 2015, these rates were considerably greater and have reduced with market maturation. Given this, some additional analysis has been performed with a fixed RHI tariff of 4.92 p kWh−1, equivalent to the current tier 1 to consider potential higher tariffs often used for the introduction of fledgling technology and labelled scenario S2b.
Under the H2 grid injection scenario, there are two other income streams from gas sale agreements (price based on wholesale market) and Renewable Gas Guarantee of Origin (RGGO) under the Green Gas Certification Scheme (GGCS). The sale price has been speculated at GBP 20 MWh−1 [51] and RGGOs at GBP 2 MWh−1 [52].

2.5.3. SOFC: Scenario 3

The use of the IR-SOFC (solid oxide fuel cell with internal reforming) in the scenario 3 process would provide eligibility for an ‘advanced conversion technology’ (ACT) rate under the UK’s “Contracts for Difference” scheme (CfD). The UK’s Department for Energy and Climate Change (DECC) [53] detailed an administrative strike price the first auction round for ACTs at GBP 140 MWh−1. This figure has been utilised as additional income for electrical power generation from the SOFC in the NPV analysis.
On top of the revenue from CfD, there are proxy income streams in the form of the heat and power generated from the system which offset the expenditure on grid-based electricity and heat. Accordingly, each kWhelec generated from the SOFC abates the expenditure of GBP 0.1055, equivalent to the price for non-domestic sector given the facility size [46]. It is conservatively estimated that half of the net heat generated from Scenario 3 would be used on-site for standard facility operation. As such, the associated offset expenditure is calculated via Equation (6):
E h e a t = 0.5   Q r × C N G η b o i l e r
where Eheat is the heat expenditure (GBP day−1), Qr is the thermal output (kWhth day−1), CNG is the natural gas purchasing price (GBP 0.23 kWhth−1) [46] and ηboiler is the boiler efficiency at 80%.

2.6. Greenhouse Gas Emission Analysis

It is hypothesised that implementation of the discussed processes will have a positive impact on lifecycle GHG emissions—firstly, because ammonia recovery and valorisation provide additional fuel compared to conventional systems, and secondly, because alternative end-use strategies can provide added benefits. The GHG assessment has been performed in terms of a balance of added emissions from process energy inputs and reductions in the form of abated emissions from fossil fuel replacement. The carbon factors applied throughout can be seen in Table 2 and are detailed subsequently. For S1, diesel buses are used as the reference transport option to be replaced with fuel cell electric buses (FCEBs). The abated emissions are calculated using an emission factor of 1281.65 g CO2 km−1 [54] with FCEB requiring 9 kg H2 per 100 km [55]. The abated emissions in S2 were calculated as replacement of domestic heat with an emission factor of 180 g kWh−1 [54]. For S3, reduced emissions come in the form of abated emissions from grid electricity (emission factor as above) via power generated by the SOFC.
A key benefit of implementation in SD compared to AD plants is the added benefit of reduced emissions possible from the diversion of ammonia from conventional WWTP treatment. Therefore, for the AD scenarios the impact of nitrogen diversion from the WWTP has been omitted. This includes both the direct emission reductions of N2O during activated sludge processing and the reduced power requirement for aeration. For N2O emission reductions applicable for SD plants, an emission factor of 0.002 kg of N (as N2O) for every kg of nitrogen diverted is applied [56]. Aeration abatement for diverted ammonia is calculated via a conversion factor of 4.57 kWh kg−1 of oxidised nitrogen [30].
For S1 and S2, where H2 is generated for transport and grid injection applications, there are heat requirements during ammonia recovery, which is not the case in S3, where the SOFC provides adequate heat for the process. As such, there are GHG emissions associated for the high quality heat requirement in S1 and S2 at 210 g CO2e per kWhth [57]. Each scenario has a system net power demand which were appointed a CO2 emission intensity of 257.92 g CO2e per kWh [54]. The GHG analysis results have been reported in two ways: firstly, in terms of their improvement on the conventional AD-CHP technology, where the current GHG benefits are taken into account (subtracted from scenario total). This is useful for current operators to understand the potential benefits of conversion of existing facilities. Secondly, in terms of the scenarios’ full GHG reduction potential, which is deemed practical during the planning of new AD and SD facilities. The emissions generated in the construction of the plants and embedded in the equipment were considered negligible over the 20-year lifetime of the plant and were not included.

3. Results

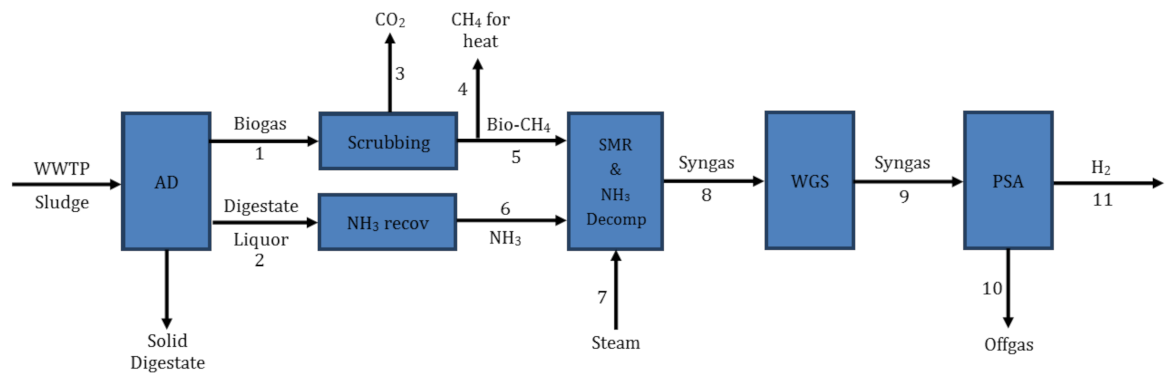
3.1. H2 Production Overview

Further details on the novel ammonia recovery and H2 production system can be found in Grasham et al. [6], including a material and energy balance analysis. The full process flow diagram developed using Aspen Plus V10.0 [58] and stream compositions can be found in this article’s Supplementary Material. A basic process flow of the system is illustrated in Figure 2 with associated composition data in Table 3. Ammonia is recovered from digestate liquor generated from the anaerobic digestion (AD) of sewage sludge. This is combined with biomethane from AD and steam in a high temperature catalytic reformer to produce an H2-rich syngas (stream 8) via a combination of steam methane reforming (reaction 6), water-gas shift (reaction 7) and ammonia decomposition (reaction 8). Water-gas shift (WGS) reactors maximise H2 production via reaction 7 before pressure swing adsorption separates the hydrogen gas into a high purity stream (stream 11):
CH 4 + H 2 O     3 H 2 + C O
C O + H 2 O     H 2 + C O 2
2 N H 3     3 H 2 + N 2

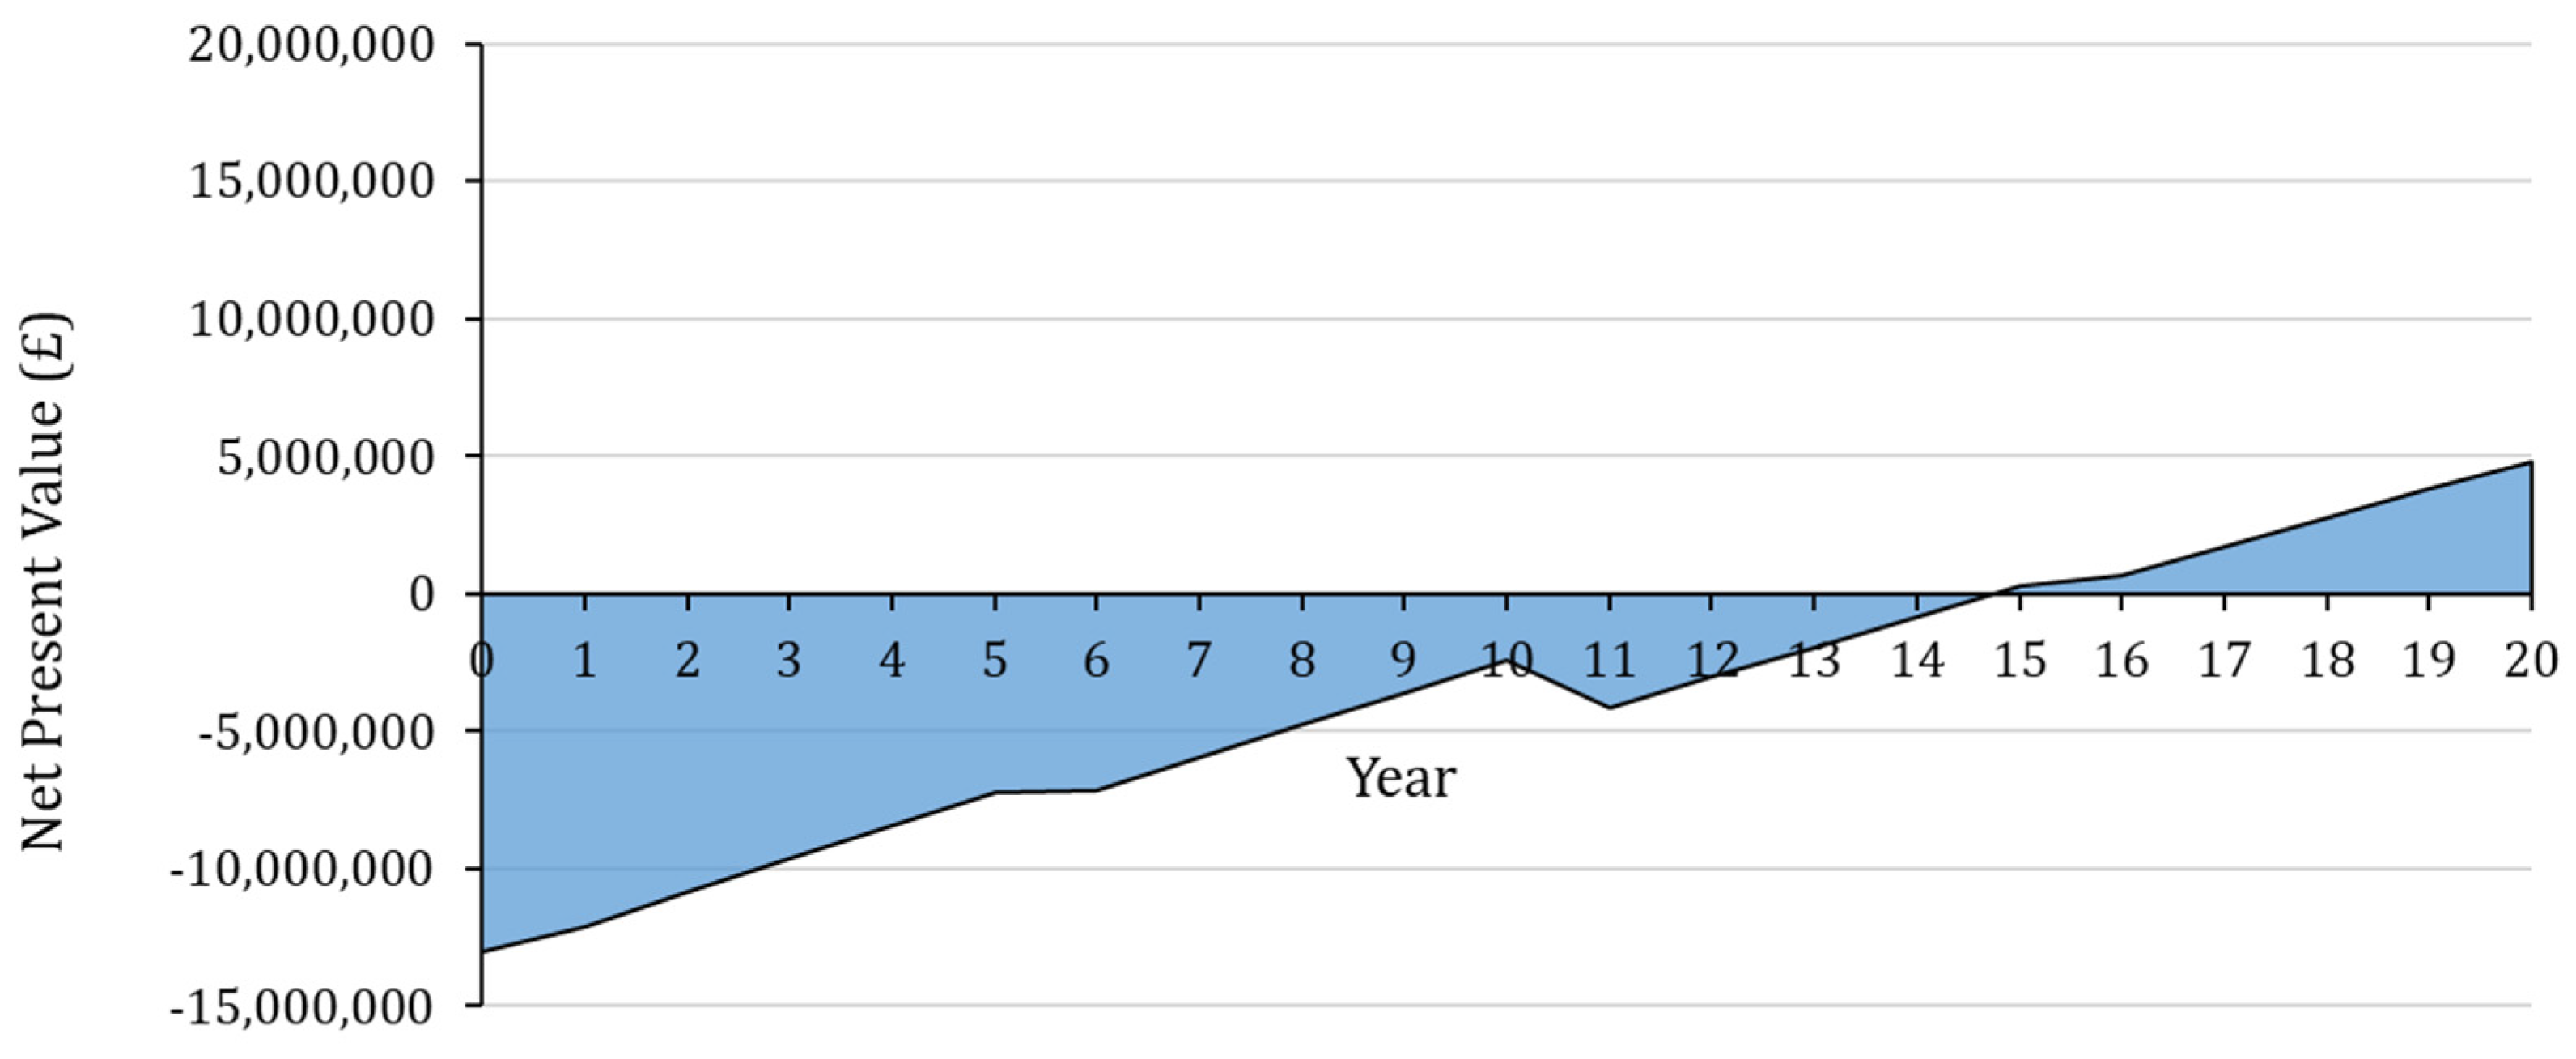
3.2. Scenario 1: H2 for Transport

The base system described in Table 3 and Figure 2 was developed for an operational UK WWTP serving a population of 750,000 people. It was stipulated that the 2.76 tonnes of H2 generated daily could be prepared and sold as a transport fuel. At a market value of GBP 4.50/kg, process implementation would be economically and environmentally attractive for the WWTP, with net present value analysis using a 6% discount factor showing a discounted return on investment after 14.6 years and a final NPV value of GBP 4.8 million, as illustrated in Figure 3.
The NPV analysis presented in Figure 3 was carried for various facility sizes and for both SD and standard AD sites along with the return on invested capital (ROIC). The final NPV value and the ROIC for varying scales for both SD and AD industries, under scenario 1, are presented in Figure 4. As expected, the smaller the facility, the lower the ROIC and NPV. This is due to the forcing of economy of scale, where CAPEX and some areas of OPEX are lower per unit of product when performed at larger scales. For example, SD plants with a biomethane production of 5 tonnes day−1 have a final NPV of GBP -8.3 million and an ROIC of 0.007, whereas the equivalent figures at 14 tonnes day−1 are GBP 36.9 million and 0.23, respectively.
Figure 4 also demonstrates the difference between profitability for AD and SD sites. For SD facilities, an ROIC of 0.08 is not reached until a daily bio-CH4 production capacity of 7.14 tonnes, whereas the same ROIC for AD plants is not achieved until a daily bio-CH4 production of 8.17 tonnes. The final NPV turns positive at almost exactly the same scale as an ROIC of 0.08 is reached, which may justify the selection of a 0.08 ROIC as a feasibility threshold. The difference in profitability is much more impactful at lower scales. For example, at 6.6 tonnes of bio-CH4 per day, the final ROIC is 60% greater at SD than AD facilities but is just 9% greater at 15 tonnes of daily bio-CH4 production. This is evident because the cost reduction facilitated by ammonia diversion at SD sites is more impactful on cash flows at lower scales.
Figure 5 illustrates the effect of plant capacity (in daily production of biomethane) on the levellised cost of H2 prepared as a bus fuel (S1) at SD sites. The exponential decay in levellised cost with increasing plant capacity means there is a sharp decline at lower capacities before levelling out with biomethane production scales greater than 7.5 tonnes of biomethane per day, providing a H2 levellised cost between GBP 5–6 kg−1. The levellised cost is only marginally greater (1.7–4.0%) for standard AD facilities, increasing with plant capacity. As such, at the scale of feasibility discussed previously the LCOH lie within the range found by Perna et al. (6.28–7.92 EUR/kg) for H2 prepared for transport fuelling and highlights the product’s potential market competitiveness.
Preparation of the H2 as a transport fuel requires compression and storage at 350 bar for fuel cell electric buses. This demands considerable capital (CAPEX) and operational (OPEX) expenditures. For example, 70% of the total electricity used during operation of the process and 32% of the system’s total CAPEX can be attributed to the preparation of the fuel. Historically, green H2 is most often discussed in reference to its use as a transport fuel, but there is increased attention for its use in other energy sectors, such as heat and energy storage. Alongside the high energy and cost demands for compression as a transport fuel, this report will now consider an alternative utilisation pathway for the generated H2 from this process as an option for grid injection.

3.3. Scenario 2: H2 for Grid Injection

The UK gas grid can be divided into three main bands: the national transmission system (NTS), the local transmission system (LTS) and the distribution system. The NTS, operated by National Grid, is a high pressure network (45–85 bar) that supplies gas around the country in 7660 km of pipes from import terminals to LTS networks (>7–70 bar) [59]. These higher pressure systems are thought to facilitate augmented hydrogen embrittlement of the high-strength steel that comprises the majority of pipes [60].
These concerns mean that currently, H2 is mainly being touted for injection into the distribution system [61]. The distribution system is made up of intermediate-pressure (>2–7 bar), medium-pressure (>75 mbar–2 bar) and low-pressure (>30 mbar–75 mbar) pipes [62]. The UK distribution system is currently undergoing a mass transition to polyethylene (PE) pipes under the Iron Mains Replacement Programme [63]. PE pipes are far less susceptible to hydrogen embrittlement, making them an attractive option for H2 injection.
There are eight local distribution networks in the UK, run by four companies. It is currently impossible to inject H2 into these networks, but this is likely to change in the future with government acceptance that it could be an effective way of decarbonising the gas grid [64]. As such, the H2 generated via the associated NWaste2H2 process is speculated for injection to the local distribution networks, hence our choice of the pressurisation of H2 to 7 bar for this scenario.
Figure 5 indicates the decreasing value of levellised cost of H2 for grid injection with plant size (S2). This is comparable to the trend seen for the transport fuel scenario (S1) (Figure 5), but this is where the comparisons end. Clearly, the levellised cost of H2 when prepared for injection is much lower than under scenario 1. This is attributed to the lower pressure requirements for injection into the national grid compared to those required for an FCEB tank.
Under S2, there is a considerable difference between the levellised cost at SD plants compared to that at standard AD facilities, which ranged between −17–22%. Comparatively, under Scenario 1, the maximum difference was 4%. The variance is due to the low-pressure requirements of grid injection and the low value of grid gas, which means ammonia diversion and the economic benefit of doing so plays a far more important role in the financial balance than under scenario 1.
The levellised cost range presented in Figure 5 for S2 is comparable to that found by the International Renewable Energy Agency for hydrogen generated via electrolysis from wind in 2018 (USD 4/kg H2) [22]. However, their projection is that wind powered electrolysis of water will generate hydrogen for grid injection at USD 1/kg by 2050 due to advancements in wind power. The levellised cost of generating hydrogen under the presented NWaste2H2 process is unlikely to see similar reductions due to the maturity of the technology involved.
The results displayed in Figure 6 were formulated using current RHI incentive for biomethane injection, which are tiered at GBP 0.0446 kWhth−1 for the first 40 TWh, GBP 0.0286 kWhth−1 for the following 40 TWh and GBP 0.0221 kWhth−1 for anything after. However, it could be argued strongly that H2 injection projects should be provided with greater incentivising tariffs given their fledgling nature.
Accordingly, in Figure 7, the impact of current RHI tariffs have been compared with a fixed RHI rate of GBP 0.0446 kWh−1, independent of cumulative output. In Figure 7, it is visible how much a fixed RHI impacts the final NPV. For example, with current RHI payment structures, a positive NPV is not achieved until a daily biomethane production of 17 tonnes. However, with a fixed RHI payment of GBP 0.0446 kWhth−1, the same ROIC is found at daily biomethane production of around 10 tonnes. It is clear that, even with improved RHI incentives, H2 production for grid injection is not as attractive as for use as a transport fuel, given the lower scales required to reach a positive NPV under S1.
Even where an adequate scale exists for grid injection, it must be reiterated that transferring a standard AD or SD facility to H2 injection would only be desirable under the scenario where the grid had already been converted to H2 or partial H2 to achieve total decarbonisation. These results show that if bio-H2 for grid injection under the NWaste2H2 process is to be realised, then the support mechanism must also respond. The clarity in which feasibility is only plausible with greater subsidies than are currently present aligns with the conclusions provided by Quarton and Samsatli [19], who highlighted the need for feed-in tariffs of GBP 20–50/MWh for H2 injection.hJHH.

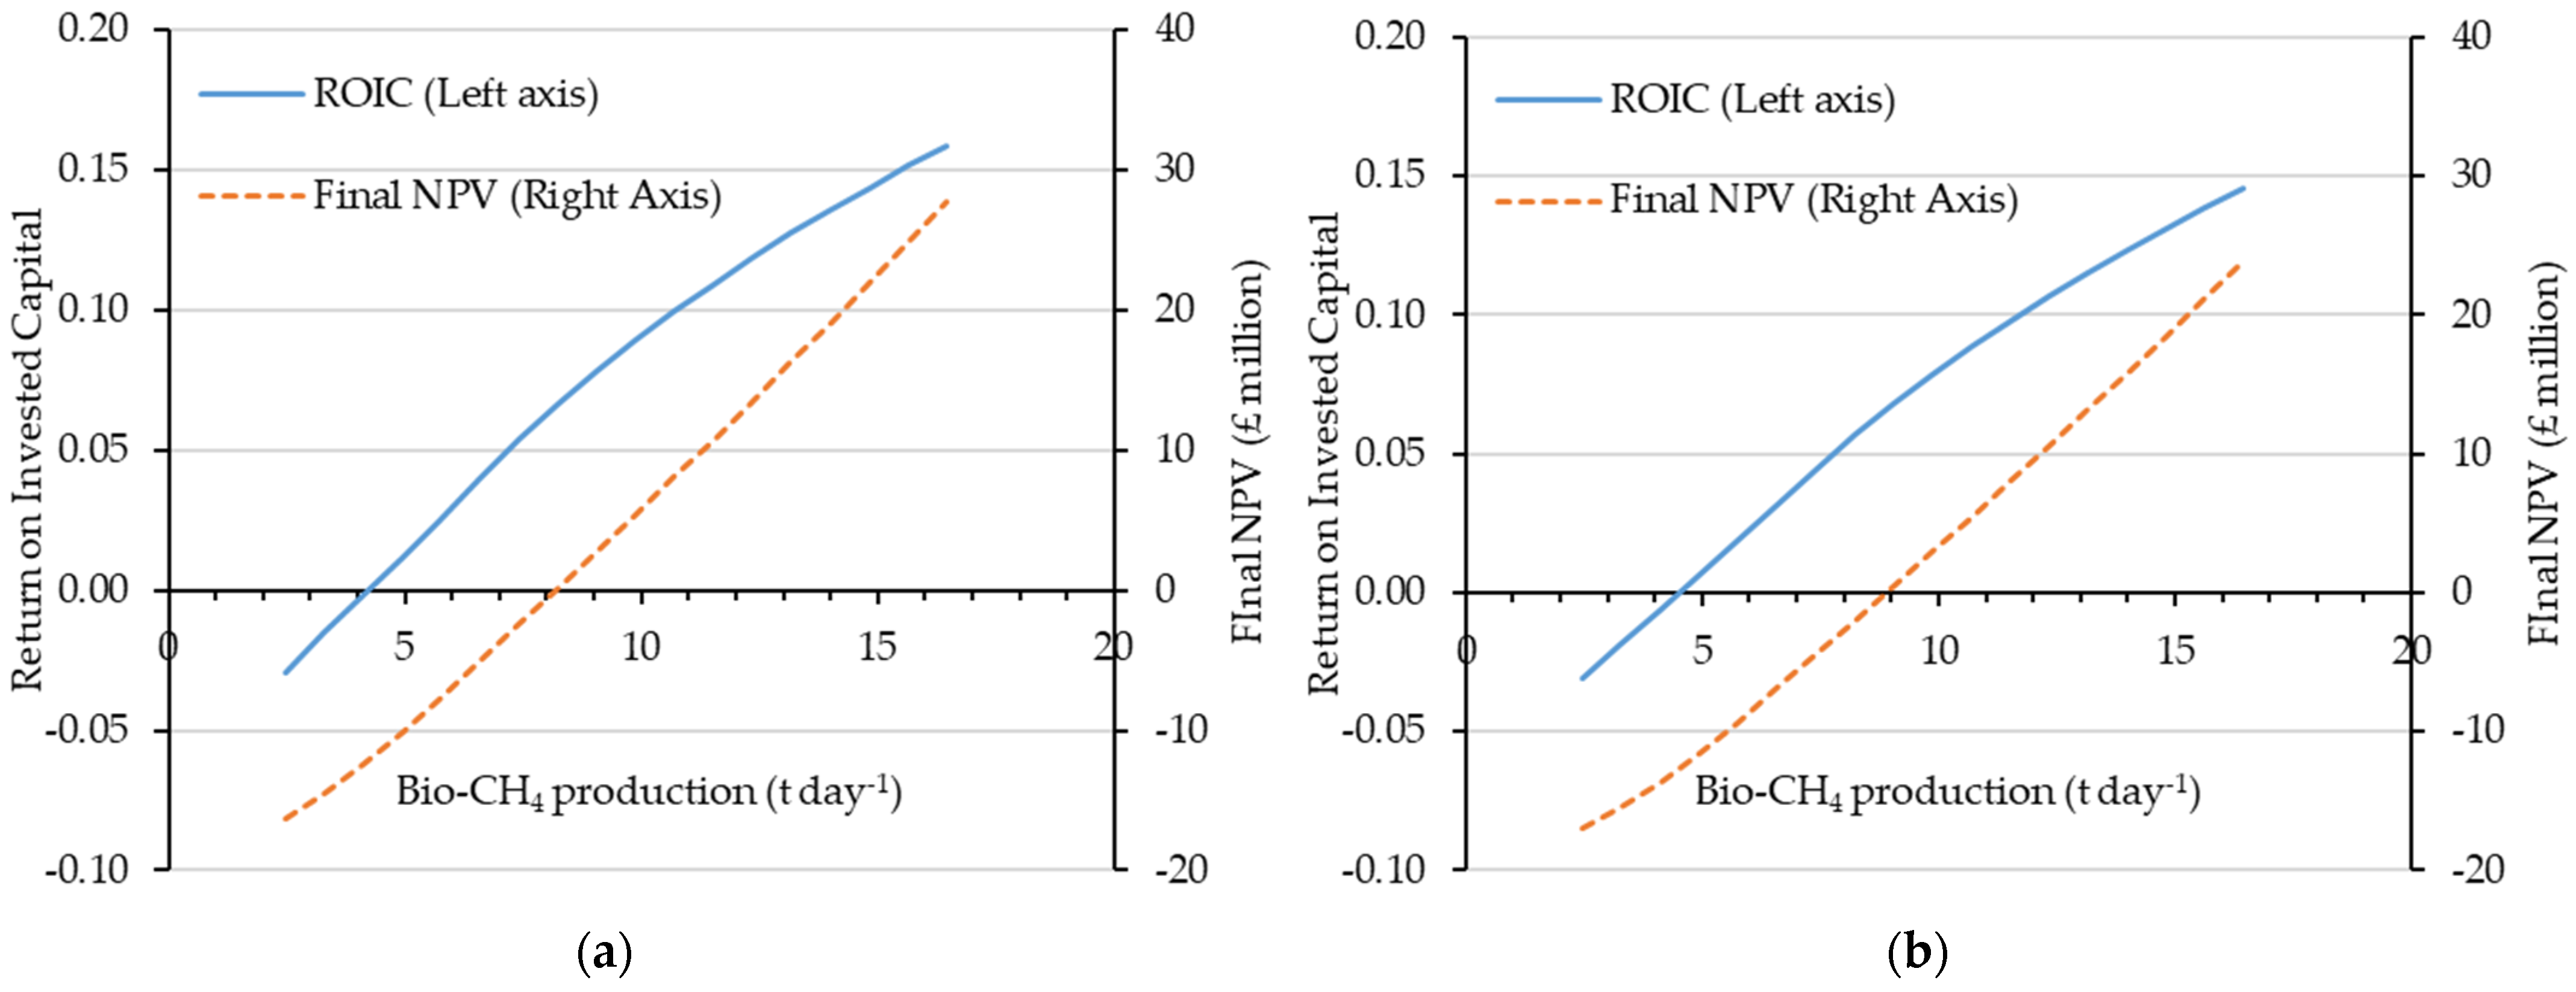
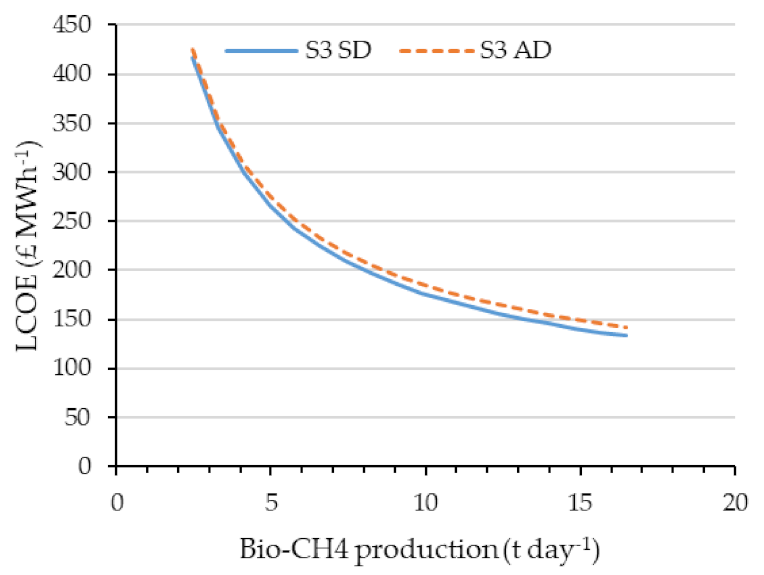
3.4. Scenario 3: SOFC Operation

In contrast to Route A (hydrogen production), Route B in the series of the NWaste2H2 system proposes the utilisation of recovered ammonia and biomethane for heat and power generation using SOFC technology. In a way, hydrogen production is still present, but as an intermediate in the internal reformer of the SOFC. Accordingly, SD and AD operators will not be generating a product for sale, but utilities for onsite use and export potential whenever possible. The system was demonstrated in Grasham et al. [5] with robust modelling for the operation of the SOFC. However, the ammonia recovery steps have since been updated and improved, and economic feasibility analysis has been performed. The ammonia recovery steps equate to that presented in Grasham et al. [6], except a portion of the exhaust stream of the SOFC furnace is used as the stripping gas instead of air. A basic flow diagram for Scenario 3 is illustrated in Figure 8, with stream compositions in Table 4. The full process flow diagram modelled in Aspen Plus can be found in the Supplementary Material.
The mass flow results presented in Table 4 correspond to that associated with the case-study facility presented in Grasham et al. [5]. The SOFC was calculated to run at an efficiency of 48%, giving a boost in the case study WWTP’s daily power production from 40 MWh to 58.1 MWh (plant treating population of 750,000 and generating 8.229 bio-CH4 tonnes day−1). The ammonia recovered from digestate liquor contributes to roughly 5% of this and its diversion from conventional treatment reduces consumption by 4.12 MWh. However, the proposed biogas scrubbing process demands 5.24 MWh. Accordingly, the daily net energy consumption would be just 3 MWh compared to the current 20 MWh. The impact of this reduced consumption of grid electricity is two-fold, with lowered financial outgoing and grid-associated GHG emissions.
Figure 9 demonstrates the ROIC and final NPV for integration of the SOFC process (Scenario 3) with a varying scale for both SD (a) and AD (b) environments. As with Figure 4 and Figure 6, it indicates at what scale implementation of this process might be attractive for plant operators. At lower capacities, the ability to divert ammonia from conventional processing in the WWTP has a greater impact that at larger scale. For example, the final NPV for a plant generating 10 tonnes of biomethane per day is 80% greater at SD than at AD plants, whereas at 15 tonnes of daily biomethane generation, the final NPV is 18% greater at SD than AD facilities. Figure 9 also shows that an ROIC of 0.08 is achieved at a biomethane production scale of 9.18 tonnes per day for SD sites and 9.98 per day for AD facilities.
Figure 10 details the levellised cost implications for each unit of electricity generated from Scenario 3 with a varying scale at SD and AD plants. Accordingly, these data cannot be compared to that in Figure 5 and Figure 6, but can be used for comparison to other renewable power generation projects. The high levellised cost of the power produced can be seen at lower scales. It is not until a daily biomethane production at SD plants of over 12.5 tonnes is reached that the levellised cost becomes comparable with other advanced conversion technology methods, which the UK’s Department for Business, Energy & Industrial Strategy (BEIS) estimates to be GBP 130 MWh−1 [65]. This is also significant compared to other mature renewable options, such as onshore wind at an estimated LCOE of GBP 46 MWh−1 [65]. However, as the relative cost of SOFC technology reduces with time, as will its LCOE. Much like under Scenario 1, the difference in the levellised cost for standard AD facilities where the benefits of ammonia diversion from standard treatment are not felt is more significant at greater scales.

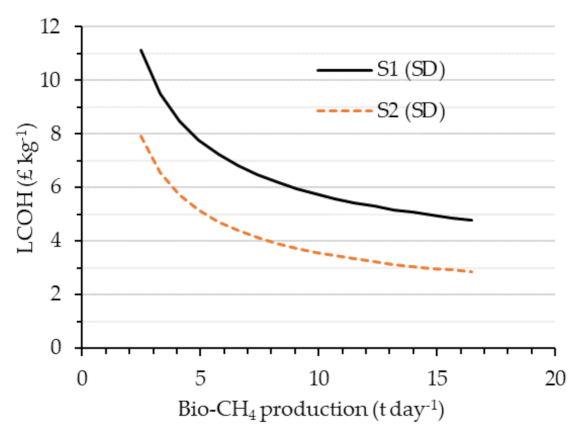
3.5. Direct Scenario Comparison

Figure 11 shows the results of the minimum scale required for process implementation under each scenario, based on an ROIC threshold of 0.08. It is clear Scenario 1 is the most financially attractive with the lowest required scale. However, it is expected that the cost of SOFC technology will lower as the market matures, which could have a considerable impact on its attractiveness. It is also the case that the SOFC system has the least processing steps of each scenario, and this may also be an attribute worth considering for plant operators.
It is an investor’s decision what ROIC is personally acceptable, but in this article, an ROIC of 0.08 was chosen, given it is two percentage points greater than the industry weighted average cost of capital (WACC). The associated minimum scale required in terms of daily biomethane production for each scenario at SD plants can be seen in Figure 11. These correspond to 7.14 tonnes, 17.02 tonnes and 9.18 tonnes for scenarios 1(H2 for transport), 2 (H2 for grid) and 3 (CHP by SOFC), respectively. For standard AD facilities, these figures are 8.17, 20.02 and 9.98 tonnes for scenarios 1, 2 and 3, respectively. It must be stated that the minimum scale requirements for S2 correspond to the provision of current equivalent variable RHI tariffs used for biomethane injection to the grid. When RHI payments are fixed at the equivalent of the upper tariff of the current variable incentives for biomethane injection (S2b), the minimum feasible scale for roll-out is 11.3 and 12.5 tonnes per day for SD and AD environments, respectively. Under this higher tariff, H2 injection would still be the least attractive option.
Due to uncertainty in the six-tenths rule, sensitivity analysis was performed, which altered the 0.6 factor to 0.7 for each SD scenario. This had the effect of increasing the minimum scale threshold for S1, S2, S2b and S3 by 1.44%, 4%, 1.34% and 1.8%, respectively.

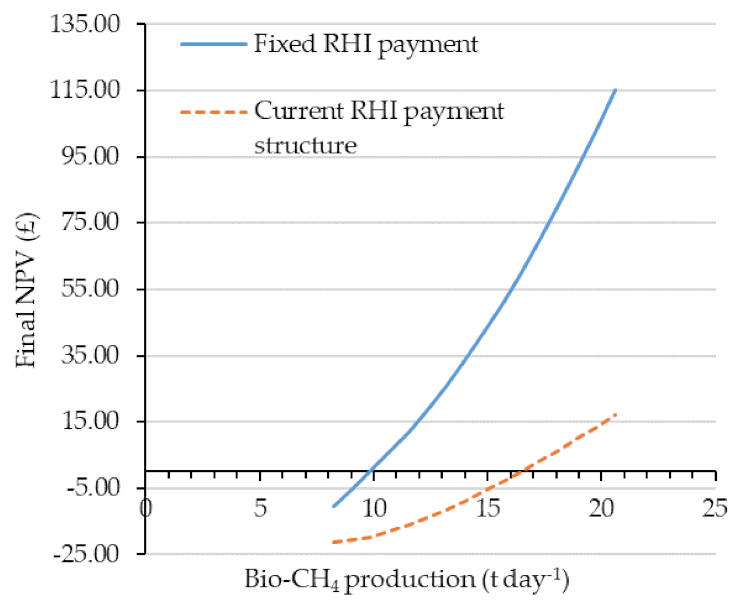
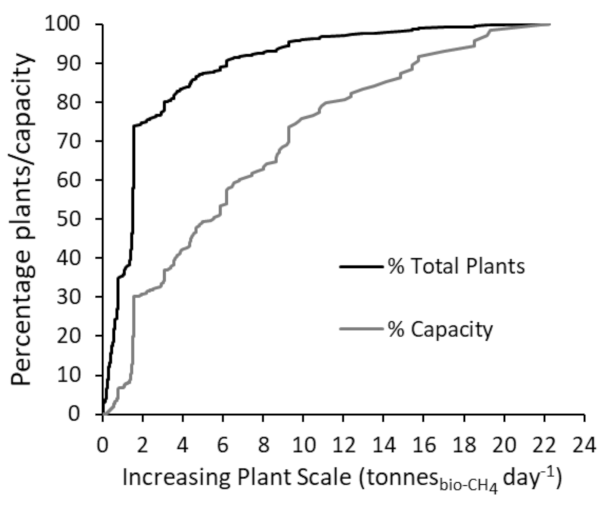
3.6. Applicability to the Current UK Landscape

According to the NNFCC [66], there are 579 operational AD plants in the UK as of April 2020, which far outnumber the 162 SD facilities [67]. However, the difference is not as stark in terms of total installed capacity, where standard AD is thought to have a total installed capacity of 453 MW [66] and SD plants have a total installed capacity of 205 MW [67]. This shows that on average, SD facilities tend to be larger than standard AD sites. Nevertheless, AD facilities operate at higher load factors, equivalent to the mean percentage of capacity reached by generation. For example, in 2019, AD facilities ran at a load factor of 62.6%, whereas this figure for SD plants was 48.6% [68]. Utilising these capacity factors, AD generates a calculated 2.5 GWh electricity annually and SD generates 0.87 GWh. It should be noted that these figures are not without discrepancy. Data from BEIS suggest that there are 658 AD facilities and 194 SD sites and 2.9 GWh production per year and 1.05 GWh for AD facilities and SD, respectively [68]. Either way, AD generates roughly three times the amount of biogas and/or power than SD.
As discussed so far in this paper, the NWaste2H2 processes are not viable for all facilities. There is a certain scale for each process and facility type where it is economically feasible for process implementation. Therefore, it is important to analyse the size distribution of UK AD and SD facilities. Figure 12 and Figure 13 illustrate the percentage of total plants compared to the percentage of capacity as scale increases for AD and SD plants respectively. In these datasets, most biomethane to grid plants are displayed with data for both biomethane production capacity and installed power capacity. As such, where both are presented, only the installed power capacity has been employed.
Figure 12 details both cumulative plant capacity and total plant fulfilment as a percentage of their respective totals for standard UK AD facilities as scale increases. It illustrates that 90% of UK AD plants each generate less than 6.2 tonnes of methane each day. Yet, these plants contain just 56% of the industry’s capacity. It is a very similar story for SD plants, as demonstrated in Figure 13.
Figure 13 demonstrates that UK SD facility numbers are significantly weighted to smaller scales. However, the industry’s capacity is undoubtedly dominated by the larger plants. For example, only 10% of UK sewage sludge facilities generate over 7.3 tonnes biomethane per day but these facilities contribute to over 46% of the industry’s capacity. The significance of this is that alterations to a small number of plants with larger capacities, in both standard AD and SD, could have a considerable impact on in the sustainability of the industries.
Using the scale distribution of each industry, it is possible to calculate the proportion and number of plants suitable for implementation of NWaste2H2 processes. As examined in the techno-economic analysis and highlighted in Figure 11, the viability limit that has been set for each process route and technology type is for a discounted payback period of 8 years. Using this benchmark, the number of plants and the methane that could be viably utilised is detailed alongside the equivalent H2 or power generation potentials.
Table 5 reaffirms that scenario 1, where H2 is generated, prepared and sold as a fuel for buses, is the most economically attractive option of the three scenarios discussed. The analysis shows that 19 SD and 42 AD facilities in the UK are of the minimum scale for implementation of scenario 1. Although the required minimum scale for AD plants is greater than that for the SD industry, 23 more AD than SD plants are viable due to the comparative size of the industries. This difference also corresponds to the industries potential H2 generation with AD’s potential of 171 tonnes per day compared to 83 tonnes per day from SD plants. If all these plants were converted with the scenario 1 process, a total of 254 tonnes of H2 per day could be generated from both industries.
Only three SD and one AD facilities are of a minimum scale applicable for conversion to Scenario 2 given equivalent RHI incentives for grid injection, which would enable the production of just 23 and 7 tonnes of H2, respectively. This is the only scenario where the capacity conversion from SD outweighs that of the AD industry. If the RHI was fixed at the highest tier, as presented previously (S2b in Table 5), then considerably more plants could be upgraded with NWaste2H2 technology with 11 potential SD and 15 standard AD facilities. This would act to increase the potential H2 production from the AD industry by a factor of 11 and almost triple that from SD plants.
There are 13 SD and 23 AD facilities identified as viable for upgrading using scenario 3, where SOFC technology is used for on-site heat and power generation. This would enable daily power generations of 1.4 and 2.3 GWhel for the WWT and AD industries, respectively. With the consideration that implementation of scenario 3 increases net power generation by 45% at SD plants and 42% at AD facilities from conventional CHP technology, equating to boosts in renewable electricity production of 0.44 and 0.71 GWh each day for the two industries, respectively. This would be a considerable growth for the industries, equating to an 18% and 10% increase for the SD and AD plant totals.

3.7. Greenhouse Gas Emission Analysis

The greenhouse gas emission savings that would arise from the implementation of the discussed processes have been assessed in terms of their totality or what would be the case for new systems. Secondly the improvement on the conventional process, where GHG emission reductions that would have been in place via conventional AD power production are taken into account. It should be noted that these figures could be considered ‘best-case’ because the greenhouse gas emissions generated in the construction and embedded in the process materials were note accounted. The breakdown of the results is displayed in Table 6.
Scenario 1 provides the greatest potential in lifecycle GHG emissions at 4.3 and 3.6 kg CO2e for each kg bio-CH4 supplied as feedstock for SD and AD environments, respectively. This can be reasoned by the intensity of the emissions from the diesel buses the generated H2 would replace. The equivalent figures for S1 are 1.4 and 0.7 and for S3 are 2.2 and 1.5 kg CO2e for each kg bio-CH4 for SD and AD environments, respectively. These results could be used for new plants to understand the overall impact of process implementation.
However, if the processes presented in S1–S3 were appended to existing plants, improvement figures detailed in Table 6 could be used instead for GHG implications. Again, S1 outperforms the other scenarios. It should also be highlighted that H2 produced for grid injection (S2) at AD sites would not see emission improvements compared to the current system. This is because the abated emissions from domestic heat is outweighed by the system’s net heat and power demand and the previous AD process power generation, which is assumed to be replaced with grid electricity.
Combining the GHG improvement figures with the analysis of the UK plants applicable for process introduction under each scenario, an estimation of industry-wide GHG emission reductions can be made. Under the assumption that all plants financially viable for process introduction were introduced with the NWaste2H2 technology, the SD industry could enable daily GHG reductions of 784, 22 and 220 tonnes CO2e, respectively, for S1, S2 and S3. For the AD industry, S1 and S3 scenarios could see GHG reductions of 1274 and 145 tonnes CO2e, whereas S2 would see a net gain of 8 tonnes each day.

4. Conclusions

This work has presented the three NWaste2H2 process options and considered the economic viability with scale to interpret their suitability for implementation in the UK energy landscape. The processes are best suited for application at wastewater treatment plants with sewage digestion (SD plants) due to the added benefits of ammonia diversion from conventional removal. However, viability assessments for implementation at standard AD plants have also been performed throughout.
Net present value, ised cost and return on invested capital were calculated as key viability metrics. Scenario 1 details the generation and preparation of H2 to be sold as a transport fuel for fuel cell electric buses (FCEBs). Scenario 2 specifies a H2 production process for injection into the UK’s gas grid. Scenario 3 presents a combined heat and power process option using solid oxide fuel cell technology.
As expected, process implementation was shown to be more attractive at SD facilities compared to standard AD plants of an equivalent scale. However, the difference was far less pronounced under scenario 1, where the offset in OPEX created by ammonia diversion was overshadowed by the cost of compressing H2 to 350 bar in preparation for fuelling fuel cell electric buses. For the same reason, the levellised cost of H2 under scenario 1 was significantly greater than under scenario 2, where H2 required compression to just 7 bar. This advantage did not carry to NPV, because the value of gas in the UK’s grid is considerably lower than the value of transport fuel, and thus, the profitability of scenario 2 was comparatively worse. It was shown that the potential viability of scenario 2 could be emphatically improved with greater financial incentives under the renewable heat incentive (RHI) scheme compared to its current level provided for standard biomethane injection.
An ROIC of 0.08 was chosen as acceptable limit, being two percentage points greater than the industry’s weighted average cost of capital; SD plants would need to be generating at least 7.1 tonnes, 17.0 tonnes and 9.2 tonnes of biomethane daily for each scenario, respectively, to achieve this. For AD plants, these figures correspond to 8.2, 20.0 and 10 tonnes, respectively. These scale thresholds were applied as the minimum required for implementation in the UK and the number of plants and capacity that could be applicable were found.
For scenario 1, 19 SD and 42 AD plants generated a total of 83 and 171 tonnes of H2, respectively, per day. For scenario 2, 3 SD and 1 AD facilities produced 23 and 7.4 tonnes of H2 per day for each industry, respectively. For Scenario 3, the 13 SD and 23 AD plants suitable for process implementation could see the generation of 1.4 and 2.3 MWh of power produced daily from SOFCs. This would see sector-wide power generation boosts of 18% and 10% for respective wastewater/sludge and AD industries.
The key reason scenario 1 exhibits the most promise is due to the high value of H2 as a transport fuel compared to the revenue potential of generating heat, power and gas for grid injection. Its high market value means it can easily offset the expenditure on compression during its preparation for bus fuelling. However, with the expected reduction in SOFC capital expenditure, there could be a significant potential for scenario 3 implementation in the future.
Analysis of the GHG emissions for each scenario showed that new plants using the NWaste2H2 technology could enable GHG reductions of 4.3, 1.4 and 2.2 kg CO2e for each kg bio-CH4 supplied as feedstock for SD plants and 3.6, 0.8 and 1.6 kg CO2e for each kg bio-CH4 at AD plants. If the technology was used at the existing facilities at viable scale for introduction in the UK, 784, 22 and 220 tonnes CO2e could be abated daily for S1, S2 and S3, respectively. For the AD industry, S1 and S3 scenarios could see GHG reductions of 1274 and 145 tonnes CO2e, respectively, whereas S2 would see a net gain of 8 tonnes each day.

Supplementary Materials

The supplementary material for full Aspen Plus process flow diagrams with mass flow data can be downloaded at: https://www.mdpi.com/article/10.3390/en15062174/s1.

Author Contributions

Conceptualisation, O.G., V.D., T.C. and M.A.C.-V.; methodology, O.G.; software, O.G., V.D., T.C. and M.A.C.-V.; formal analysis, O.G.; investigation, O.G.; resources, O.G. and V.D.; data curation, O.G.; writing—original draft preparation, O.G.; writing—review and editing, O.G., V.D. and T.C.; visualisation, O.G.; supervision, V.D., T.C. and M.A.C.-V.; project administration, O.G., V.D., T.C. and M.A.C.-V.; funding acquisition, O.G., V.D., T.C. and M.A.C.-V. All authors have read and agreed to the published version of the manuscript.

Funding

This research was funded by the UK’s Engineering and Physical Sciences Research Council (EPSRC), grant number EP/R00076X/1 and the EPSRC Centre for Doctoral Training in Bioenergy, grant number EP/L014912/1.

Institutional Review Board Statement

Not applicable.

Informed Consent Statement

Not applicable.

Data Availability Statement

Data associated with this publication are available under a CC-BY license at https://doi.org/10.5518/1124 (accessed on 24 May 2021).

Conflicts of Interest

The authors declare no conflict of interest.

References

  1. Department for Business Energy and Industrial Strategy (BEIS). Digest of United Kingdom Energy Statistics: Capacity of, and Electricity Generated from, Renewable Sources. Available online: https://www.gov.uk/government/statistics/digest-of-uk-energy-statistics-dukes-2020 (accessed on 24 May 2021).
  2. Department of Business Energy & Industrial Strategy. Renewable Sources Used to Generate Electricity and Heat; Electricity Generated from Renewable Sources 1990 to 2019. Available online: https://www.gov.uk/government/statistics/renewable-sources-of-energy-chapter-6-digest-of-united-kingdom-energy-statistics-dukes#full-publication-update-history (accessed on 24 May 2020).
  3. UN Climate Change Conference COP26: The Glasgow Climate Pact. Available online: https://ukcop26.org/wp-content/uploads/2021/11/COP26-Presidency-Outcomes-The-Climate-Pact.pdf (accessed on 9 January 2022).
  4. NNFCC. Anaerobic Digestion Deployment in the United Kingdom: Sixth Annual Report. Available online: https://www.nnfcc.co.uk/publications/report-anaerobic-digestion-deployment-in-the-uk (accessed on 24 May 2020).
  5. Grasham, O.; Dupont, V.; Camargo-Valero, M.A.; García-Gutiérrez, P.; Cockerill, T. Combined ammonia recovery and solid oxide fuel cell use at wastewater treatment plants for energy and greenhouse gas emission improvements. Appl. Energy 2019, 240, 698–708. [Google Scholar] [CrossRef]
  6. Grasham, O.; Dupont, V.; Cockerill, T.; Camargo-Valero, M.A.; Twigg, M.V. Hydrogen: Via reforming aqueous ammonia and biomethane co-products of wastewater treatment: Environmental and economic sustainability. Sustain. Energy Fuels 2020, 4, 5835–5850. [Google Scholar] [CrossRef]
  7. Babson, D.M.; Bellman, K.; Prakash, S.; Fennell, D.E. Anaerobic digestion for methane generation and ammonia reforming for hydrogen production: A thermodynamic energy balance of a model system to demonstrate net energy feasibility. Biomass Bioenergy 2013, 56, 493–505. [Google Scholar] [CrossRef]
  8. Xu, L.; Dong, F.; Zhuang, H.; He, W.; Ni, M.; Feng, S.P.; Lee, P.H. Energy upcycle in anaerobic treatment: Ammonium, methane, and carbon dioxide reformation through a hybrid electrodeionization–solid oxide fuel cell system. Energy Convers. Manag. 2017, 140, 157–166. [Google Scholar] [CrossRef]
  9. Gherghel, A.; Teodosiu, C.; De Gisi, S. A review on wastewater sludge valorisation and its challenges in the context of circular economy. J. Clean. Prod. 2019, 228, 244–263. [Google Scholar] [CrossRef]
  10. Koop, S.H.A.; van Leeuwen, C.J. The challenges of water, waste and climate change in cities. Environ. Dev. Sustain. 2017, 19, 385–418. [Google Scholar] [CrossRef] [Green Version]
  11. Northumbrian Water Northumbrian Water Secure Funding for Project to Turn Ammonia into Fuel. Available online: https://www.nwg.co.uk/news-and-media/news-releases/northumbrian-water-secure-funding-for-project-to-turn-ammonia-into-fuel/ (accessed on 9 January 2022).
  12. Massara, T.M.; Malamis, S.; Guisasola, A.; Baeza, J.A.; Noutsopoulos, C.; Katsou, E. A review on nitrous oxide (N2O) emissions during biological nutrient removal from municipal wastewater and sludge reject water. Sci. Total Environ. 2017, 596–597, 106–123. [Google Scholar] [CrossRef] [PubMed]
  13. International Energy Agency (IEA). Net Zero by 2050—A Roadmap for the Global Energy Sector. Available online: https://www.iea.org/reports/net-zero-by-2050 (accessed on 24 May 2020).
  14. Northern Gas Networks. H21 Leeds City Gate. Available online: https://h21.green/projects/h21-leeds-city-gate/ (accessed on 24 May 2018).
  15. HyDeploy. About HyDeploy. Available online: https://hydeploy.co.uk/about/ (accessed on 24 May 2018).
  16. International Energy Agency (IEA). The Future of Hydrogen. Available online: http://www.technologyreview.com/news/425492/the-future-of-hydrogen-cars/ (accessed on 24 May 2020).
  17. US Department of Energy; Office of Energy Efficiency and Renewable Energy; Fuel Cell Technologies Office. 2017 H2@ Scale Workshop Report. Available online: https://www.energy.gov/eere/fuelcells/downloads/2017-h2-scale-workshop (accessed on 24 May 2020).
  18. Watson, S.D.; Lomas, K.J.; Buswell, R.A. Decarbonising domestic heating: What is the peak GB demand? Energy Policy 2019, 126, 533–544. [Google Scholar] [CrossRef]
  19. Quarton, C.J.; Samsatli, S. Should we inject hydrogen into gas grids? Practicalities and whole-system value chain optimisation. Appl. Energy 2020, 275, 115172. [Google Scholar] [CrossRef]
  20. Muthukumar, M.; Rengarajan, N.; Velliyangiri, B.; Omprakas, M.A.; Rohit, C.B.; Raja, U.K. The development of fuel cell electric vehicles—A review. Mater. Today Proc. 2021, 45, 1181–1187. [Google Scholar] [CrossRef]
  21. Perna, A.; Minutillo, M.; Micco, S.D.; Jannelli, E. Design and Costs Analysis of Hydrogen Refuelling Stations Based on Different Hydrogen Sources and Plant Configurations. Energies 2022, 15, 541. [Google Scholar] [CrossRef]
  22. IRENA Hydrogen: A Renewable Energy Perspective. Available online: https://irena.org/publications/2019/Sep/Hydrogen-A-renewable-energy-perspective (accessed on 24 May 2020).
  23. D’Adamo, I.; Falcone, P.M.; Gastaldi, M.; Morone, P. RES-T trajectories and an integrated SWOT-AHP analysis for biomethane. Policy implications to support a green revolution in European transport. Energy Policy 2020, 138, 111220. [Google Scholar] [CrossRef]
  24. Harvey, L.D.D. Clarifications of and improvements to the equations used to calculate the levelized cost of electricity (LCOE), and comments on the weighted average cost of capital (WACC). Energy 2020, 207, 118340. [Google Scholar] [CrossRef]
  25. OFWAT. The Cost of Capital for the Water Sector at PR19. Available online: https://www.ofwat.gov.uk/publication/europe-economics-the-cost-of-capital-for-the-water-sector-at-pr19/ (accessed on 9 January 2022).
  26. Tribe, M.A. Scale Economies and the “0.6 Rule”. Eng. Costs Prod. Econ. 1986, 10, 271–278. [Google Scholar] [CrossRef]
  27. Investopedia. Return on Invested Capital (ROIC) Definition. Available online: https://www.investopedia.com/terms/r/returnoninvestmentcapital.asp (accessed on 9 January 2022).
  28. Mauboussin, M.J.; Callahan, D. Calculating Return on Invested Capital. Glob. Financ. Strateg. 2014, 23, 113. [Google Scholar]
  29. Rubert, T.; Road, G.; Ab, A.; Carlo, M. Levelised cost of energy—A theoretical justification and critical assessment. Energy Policy 2019, 124, 169–179. [Google Scholar] [CrossRef]
  30. Garrido, J.M.; Fdz-Polanco, M.; Fdz-Polanco, F. Working with energy and mass balances: A conceptual framework to understand the limits of municipal wastewater treatment. Water Sci. Technol. 2013, 67, 2294. [Google Scholar] [CrossRef]
  31. Mulder, A. The quest for sustainable nitrogen removal technologies. Water Sci. Technol. 2003, 48, 67–75. [Google Scholar] [CrossRef] [Green Version]
  32. Aspen Plus Economic Analyzer Aspen Technology; John Wiley & Sons: Hoboken, NJ, USA, 2017.
  33. Peters, M.S.; Timmerhaus, K.D.; West, R.E. Heat-Transfer Equipment—Design and Costs. In Plant Design and Economics for Chemical Engineers; McGraw-Hill: New York, NY, USA, 2004; pp. 642–754. ISBN 0071240446. [Google Scholar]
  34. Bank of England. Inflation Calculator. Available online: https://www.bankofengland.co.uk/monetary-policy/inflation/inflation-calculator?number.Sections%5B0%5D.Fields%5B0%5D.Value=150000&start-year=736.5&end-year=1075 (accessed on 11 January 2019).
  35. Barbera, E.; Menegon, S.; Banzato, D.; D’Alpaos, C.; Bertucco, A. From biogas to biomethane: A process simulation-based techno-economic comparison of different upgrading technologies in the Italian context. Renew. Energy 2018, 135, 663–673. [Google Scholar] [CrossRef]
  36. Penev, M.; Saur, G.; Hunter, C.; Zuboy, J. H2A Hydrogen Production Model: Version 3. 2018 User Guide. Available online: https://www.nrel.gov/hydrogen/h2a-production-archive.html (accessed on 24 May 2020).
  37. Kaiwen, L.; Bin, Y.; Tao, Z. Economic analysis of hydrogen production from steam reforming process: A literature review. Energy Sources Part B Econ. Plan. Policy 2018, 13, 109–115. [Google Scholar] [CrossRef]
  38. Bright, A.; Bulson, H.; Henderson, A.; Sharpe, N.; Dorstewitz, H.; Pickering, J. An Introduction to the Production of Biomethane Gas and Injection to the National Grid. Available online: https://silo.tips/download/an-introduction-to-the-production-of-biomethane-gas-and-injection-to-the-nationa (accessed on 9 January 2022).
  39. Department of Energy & Climate Change. Biomethane into the Gas Network: A Guide for Producers. Available online: https://webarchive.nationalarchives.gov.uk/ukgwa/20121217150421/http:/decc.gov.uk/assets/decc/whatwedo/ukenergysupply/energymarkets/gas_markets/nonconventional/1_20091229125543_e_@@_biomethaneguidance.pdf (accessed on 9 January 2022).
  40. MosayebNezhad, M.; Mehr, A.S.; Gandiglio, M.; Lanzini, A.; Santarelli, M. Techno-economic assessment of biogas-fed CHP hybrid systems in a real wastewater treatment plant. Appl. Therm. Eng. 2018, 129, 1263–1280. [Google Scholar] [CrossRef]
  41. Batelle Memorial Institute. Manufacturing Cost Analysis of 100 and 250 kW Fuel Cell Systems for Primary Power and Combined Heat and Power Applications; U.S. Department of Energy: Columbus, OH, USA, 2017.
  42. Turton, R.; Bailie, R.C.; Whiting, W.B.; Shaeiwitz, J.A. Estimation of Manufacturing Costs. In Analysis, Synthesis, and Design of Chemical Processes; Turton, R., Bailie, R.C., Whiting, W.B., Shaeiwitz, J.A., Eds.; Prentice Hall: Upper Saddle River, NJ, USA, 2008; ISBN 9780135129661. [Google Scholar]
  43. Glass Door Salary: Process Engineer. Available online: https://www.glassdoor.co.uk/Salaries/process-engineer-salary-SRCH_KO016.htm (accessed on 17 November 2018).
  44. Office for National Statistics (ONS). Wages and Salaries Annual Growth Rate%. Available online: https://www.ons.gov.uk/economy/grossdomesticproductgdp/timeseries/kgq2/qna (accessed on 27 November 2018).
  45. Rotunno, P.; Lanzini, A.; Leone, P. Energy and economic analysis of a water scrubbing based biogas upgrading process for biomethane injection into the gas grid or use as transportation fuel. Renew. Energy 2017, 102, 417–432. [Google Scholar] [CrossRef]
  46. Department of Business Energy & Industrial Strategy. Gas and Electricity Prices in the Non-Domestic Sector. Available online: https://www.gov.uk/government/statistical-data-sets/gas-and-electricity-prices-in-the-non-domestic-sector (accessed on 8 March 2019).
  47. Galli, F.; Lai, J.J.; De Tommaso, J.; Pauletto, G.; Patience, G.S. Gas to Liquids Techno-Economics of Associated Natural Gas, Bio Gas, and Landfill Gas. Processes 2021, 9, 1568. [Google Scholar] [CrossRef]
  48. Reuter, B.; Faltenbacher, M.; Schuller, O.; Whitehouse, N.; Whitehouse, S. New Bus ReFuelling for European Hydrogen Bus Depots: High-Level Techno-Economic Project Summary Report. Available online: http://newbusfuel.eu/wp-content/uploads/2017/03/NewBusFuel_D4.2_High-level-techno-economic-summary-report_final.pdf (accessed on 9 January 2022).
  49. The United Kingdom Department of Transport. Renewable Transport Fuel Obligation Guidance Part One Process Guidance Moving Britain Ahead. Available online: https://assets.publishing.service.gov.uk/government/uploads/system/uploads/attachment_data/file/694277/rtfo-guidance-part-1-process-guidance-year-11.pdf (accessed on 24 May 2020).
  50. Ofgem. Non-Domestic RHI Tariff Table (Q3 2020/21). Available online: https://www.ofgem.gov.uk/publications/non-domestic-rhi-tariff-table (accessed on 24 May 2021).
  51. Ofgem. State of the Energy Market 2019. Available online: https://www.ofgem.gov.uk/publications-and-updates/state-energy-market-2019 (accessed on 24 May 2021).
  52. Ofgem Green Gas Certification Scheme (GGCS) Response to Ofgem’s Default Tariff Cap: Statutory Consultation. Available online: https://www.ofgem.gov.uk/sites/default/files/docs/2018/10/green_gas_certification_scheme_-_response_0.pdf (accessed on 24 May 2020).
  53. Department for Business Energy and Industrial Strategy (BEIS). CFD Auction Allocation Round One. Available online: https://www.gov.uk/government/publications/contracts-for-difference-cfd-allocation-round-one-outcome (accessed on 24 May 2018).
  54. Department for Business, E.& I.S. 2020 Government Greenhouse Gas Conversion Factors for Company Reporting Methodology Paper for Conversion Factors; Stationary Office: London, UK, 2020.
  55. Willmann, V. Aberdeen Hydrogen Bus Project. Available online: http://www.zemo.org.uk/assets/presentations/7 (accessed on 24 May 2020).
  56. Andrews, J.; Chambers, B.; Davey, A.; Galetti, S.; Hobson, J.; Hunt, D.; Thorman, R.; Walkerm, I. Carbon Accounting in the Water Industry; Non-CO2 Emissions; UKWIR: London, UK, 2009. [Google Scholar]
  57. Post, U. Parliamentary Office of Science and Technology Carbon Footprint of Heat Generation. Carbon Footpr. Heat Gener. 2016, 523, 16. [Google Scholar]
  58. Aspen Plus Aspen Technology; John Wiley & Sons: Hoboken, NJ, USA, 2017.
  59. National Grid Annual Report and Accounts 2018/19. Available online: https://www.nationalgrid.com/document/124642/download (accessed on 24 May 2020).
  60. Dodds, P.E.; Demoullin, S. Conversion of the UK gas system to transport hydrogen. Int. J. Hydrogen Energy 2013, 38, 7189–7200. [Google Scholar] [CrossRef] [Green Version]
  61. Quarton, C.J.; Samsatli, S. Power-to-gas for injection into the gas grid: What can we learn from real-life projects, economic assessments and systems modelling? Renew. Sustain. Energy Rev. 2018, 98, 302–316. [Google Scholar] [CrossRef]
  62. National Grid Climate Change Adaptation: Second Round Response. Available online: https://www.gov.uk/government/publications/climate-adaptation-reporting-second-round-national-grid (accessed on 24 May 2020).
  63. Cambridge Economic Policy Associates Ltd. 10 Year Review of the Iron Mains Replacement Programme. Available online: https://www.hse.gov.uk/research/rrhtm/rr888.htm (accessed on 24 May 2020).
  64. UK Houses of Parliament. Decarbonising the Gas Network, Postnote. Available online: https://researchbriefings.files.parliament.uk/documents/POST-PN-0565/POST-PN-0565.pdf (accessed on 24 May 2020).
  65. Department for Business Energy and Industrial Strategy (BEIS). Electricity Generation Cost Report 2020. Available online: https://www.gov.uk/government/publications/beis-electricity-generation-costs-2020 (accessed on 9 March 2021).
  66. NNFCC Anaerobic Digestion Deployment in the UK: Seventh Annual Report. Available online: https://www.nnfcc.co.uk/publications/report-anaerobic-digestion-deployment-in-the-uk (accessed on 9 March 2021).
  67. Anaerobic Digestion and Bioresources Association AD MAP. Available online: https://adbioresources.org/about-ad/ad-map (accessed on 7 December 2020).
  68. Department for Business Energy and Industrial Strategy (BEIS). Renewable Electricity Capacity and Generation. Available online: https://www.gov.uk/government/statistics/energy-trends-section-6-renewables (accessed on 24 May 2021).
Figure 1. Overview of the NWaste2H2 process routes with scenarios labelled as discussed hereafter.
Energies 15 02174 g001
Figure 2. Basic process flow of NWaste2H2 hydrogen production system. Mass flows 1–11 listed in Table 3.
Energies 15 02174 g002
Figure 3. NPV over time for process introduction at a sewage digestion facility case study serving a population of 750,000 (Bio-CH4 production of 8.229 tonnes day−1).
Energies 15 02174 g003
Figure 4. Return on invested capital (ROIC) and final net present value NPV with scale of facility for (a) sewage digestion (SD) and (b) anaerobic digestion (AD) facilities.
Energies 15 02174 g004
Figure 5. Levellised cost of H2 generation ready for fuel cell electric buses (S1) and grid injection (S2) at SD facilities under varying plant size.
Energies 15 02174 g005
Figure 6. Return on invested capital and final NPV for grid injection scenarios at SD.
Energies 15 02174 g006
Figure 7. Final net present value for H2 grid injection scenario (3) with current RHI (variable) tariffs and fixed tariff for sewage sludge digestion plants.
Energies 15 02174 g007
Figure 8. Basic process flow diagram of the Scenario 3 system; mass flow data are shown in Table 4.
Energies 15 02174 g008
Figure 9. ROIC and final NPV for Scenario 3 at SD (a) and AD (b) facilities with a varying scale.
Energies 15 02174 g009
Figure 10. Levellised cost of electricity generated under scenario 3 with a varying scale for sewage sludge digestion (SD) and anaerobic digestion (AD) plants.
Energies 15 02174 g010
Figure 11. Comparison of minimum scales for each scenario provided by an ROIC of 0.08.
Energies 15 02174 g011
Figure 12. Representation of cumulative plant total percentage and cumulative capacity percentage with increasing scale for standard AD sites.
Energies 15 02174 g012
Figure 13. Representation of cumulative plant total percentage and cumulative capacity percentage with increasing scale for sewage sludge digestion sites.
Energies 15 02174 g013
Table 1. SOFC capital cost functions as a factor of the fuel cell stack power rating.
Function (GBP/kW−1)
Stack CAPEX2093
Stack replacement434
Clean-up system CAPEX450
DC/AC inverter220
Table 2. Carbon factors used in GHG analysis.
SourceFactorUnitRef.
Electricity grid257.9gCO2e/kWh[40]
High quality heat210gCO2e/kWh[39]
Bus emissions1282gCO2e/km[40]
H2 bus fuel requirement9kg H2/100 km[41]
Domestic heat180gCO2e/kWh[40]
N2O emissions0.002kg of N (as N2O)/kg N diverted[42]
Aeration abatement4.57kWh/kg of oxidised N[15]
Table 3. Flow data (kg/h) associated with process flow from initial case study (Figure 2), as discussed in Grasham et al. [6].
StreamH2ONH3CH4H2COCO2Temp (°C)Press (Bar)
1--343.1--506.123-
227,53850.3----231
3-----506.1231
4--95.2---231
5--247.9---99525
6-45.2----90025
7853.5-----90025
8523.20.35.2105.9317.0167.5100022.5
9328.50.35.2127.714.4643.124413.3
10-0.35.212.814.4643.1231
11---114.9--231
Table 4. Flow data (kg/h) associated with Figure 8 process flows.
StreamH2ONH3CH4O2N2COCO2H2Temp (°C)Press (Bar)
1--343.1---506.1-23-
227,53850.3------231
3------506.1-231
4--343.1-----7001.1
518.845.6----79.1-7001.1
69630.01------7001.1
7---540917,815---8671.1
81611---46.4287.5568.524.09101.08
9---433517,815---9101.08
101825--398217,861-1020-10751
Table 5. Scale requirement in methane production with ROIC of 0.08 for each scenario alongside the number of plants applicable for conversion, the equivalent total methane reformed, total H2 generated (scenarios S1 and S2) or the total power generated (S3). S2b represents S2 with fixed RHI payments at the highest tier.
SDMethane Limit (Tonnes day−1)Number of PlantsTotal Methane (Tonnes day−1)H2 Production (Tonnes day−1)SOFC Power Generation (MWh day−1)
S17.11924983
S217.036923
S39.21320201425
S2b11.31118161
AD
S18.242511171
S220.01227
S310.023338 2388
S2b12.51524783
Table 6. Greenhouse gas emissions inventory in g CO2 equivalent (e) per kg of biomethane (bio-CH4) available. Negative values showcase emissions savings.
S1
(g CO2e/kg bio-CH4)
S2
(g CO2e/kg bio-CH4)
S3
(g CO2e/kg bio-CH4)
Net process power729Net process power356Net process power−1821
High quality heat600High quality heat600Power Improvement−698
NH3 Diversion−391NH3 Diversion−391NH3 diversion−391
Abated bus emissions−4822Abated Domestic Heat−2009
AD power replacement1122AD power replacement1122
SD Total−4275 −1444 −2212
SD Improvement−3153 −321 −1090
AD Total−3616 −784 −1552
AD Improvement−2493 339 −430
Publisher’s Note: MDPI stays neutral with regard to jurisdictional claims in published maps and institutional affiliations.

