Article

Meranti (Shorea sp.) Biochar Application Method on the Growth of Sengon (Falcataria moluccana) as a Solution of Phosphorus Crisis

1
Faculty of Agriculture, University of Lampung, Jl. Sumantri Brojonegoro 1, Bandar Lampung 35145, Indonesia
2
National Research and Innovation Agency (BRIN), Gedung B.J. Habibie, Jakarta Pusat 10340, Indonesia
3
Climate Change Research Division, Korean Institute of Energy Research, Daejon 34129, Korea
*
Author to whom correspondence should be addressed.
Energies 2022, 15(6), 2110; https://doi.org/10.3390/en15062110
Submission received: 9 February 2022 / Revised: 7 March 2022 / Accepted: 11 March 2022 / Published: 14 March 2022

Abstract

:
Phosphorus (P) is a limiting nutrient mined from non-renewable sources. P is needed to stimulate trees growth in a forest plantation. P-fertilizer addition in the tropical forest field causes P-leaching flux to watershed and induces eutrophication. The high C contained in meranti (Shorea sp.) biochar can avoid the P-leaching process in the soil with a strategic application method. However, the biochar application method is poorly examined. This research aimed to develop a biochar application method to sequestrate P from the environment and examine its effect on the growth of sengon (Falcataria moluccana). Shorea sp. biochar pyrolyzed at 400 °C and 600 °C were added at a dosage of 0 t ha−1, 25 t ha−1, and 50 t ha−1 for six months in the field. The biochar was placed 20 cm under topsoil without soil mixing. This application method significantly increased total P in the soil without any P-fertilizer addition. The results showed that biochar pyrolyzed at 600 °C and a dosage of 25 t ha−1 increased the total P in the soil and CEC by 192.2 mg kg−1 and 25.98 me 100 g−1, respectively. Biochar with a higher pyrolysis temperature increased higher soil pH. In contrast, the higher dosage increased organic-C higher than the lower dosage application. The most significant P-uptake, height, and diameter increments on F. moluccana were achieved using Shorea sp. biochar pyrolyzed at 600 °C with a dosage of 25 t ha−1 by 0.42 mg kg−1, 222 cm, and 2.75 cm, respectively. The total P in the soil positively correlated with the P-uptake of F. moluccana. Furthermore, using the biochar application method P could be absorbed to the biochar layer and desorbed to the topsoil. Consequently, the biochar application method together with P-fertilizer addition could increase the availability of P in the soil and decrease P-leaching to the environment.

1. Introduction

Phosphorus (P) is a finite resource with no known alternative that becomes a significant growth-limiting factor in several sectors [1]. P fertilizer is produced through P-bedrock mining, which is non-renewable. It is predicted that P sources will be exhausted in the next 50–100 years [2]. In the forestry sector, P fertilizer is commonly used at an early stage of plantations. The forest plantation industry in Indonesia generally applies fertilizer to degraded lands and poor-nutrient soils [3]. Tropical soil is categorized as old soil [4]; hence, it has high Al and Fe contents [5,6]. On the other hand, P solubility is controlled by Fe- or Al-phosphates [7]. Thus, P-sequestration in low-solubility of Fe and Al-phosphate compounds and the effect of erosion and leaching mean that tropical soils lack soluble P [7]. P is a critical requirement for increasing root and shoot strength [8], cell elongation [9], and flower-seed formation [10]. P-deficient could inhibit plant growth [11] and increasing seedling mortality in a forest plantation. Conversely, P-addition to soil caused a problem called eutrophication [12] which is a water oxygen level degradation because of algae blooming caused by nutrient excess. Eutrophication is caused by the P-leaching process [13]. Forest P-leaching from topsoil with a 0–20 cm depth was 20 mg kg−1 [14]. P-leaching from forest yield unconsciously is more dangerous because forests control watershed flux into the ocean [1]. Hence, developing a method to conserve the nutrient cycle in forests is urgently needed.
Biochar is well known as an anti-leaching agent and one of the largest products resulting from the pyrolysis process [15]. Pyrolysis is the thermal modification of biomass whereby the combusting of the biomass is conducted in the absence of oxygen [16,17,18,19]. Biochar has been proven to conserve nutrients from leaching and evaporation [20,21]. Furthermore, biochar application is suitable for long-span forest cultivation due to its stable structure that can remain over a long span [8,22]. However, some factors that influence the ability of biochar to conserve P need to be examined.
Biochar contains high fixed carbon [17,23]. Biochar applied on soil sequestrates organic-C for the long term because of their predominantly aromatic nature [24]. The high C content of biochar increases soil organic matter (SOM) [25,26,27]. A previous study [28] revealed that the SOM from 10% biochar addition increased soil pH from 4.9 to 8.7 and dissolved organic matter (DOM)-water partitioning coefficients (Kd-values) from 0.2 to 590 L kg−1. DOM is important to in the conservation of soil nutrients and microorganisms [29,30]. Biochar could increase the cation exchange capacity (CEC) by microbial association [31,32]. In addition, high SOM could decrease the leaching of nitrate, ammonium, and phosphate up to 34.0%, 34.7%, and 20.6%, respectively [20]. Biochar with high fixed carbon is suggested to conserve the soil nutrients [33]. Meranti (Shorea sp.) biochar contains fixed carbon, at a proportion of up to 84.9% [34], which is higher than teak wood (Tectona grandis) biochar, with a fixed carbon content of 75.51% [35], rubberwood (Hevea brasiliensis) biochar, of 77.2% [36], and sengon (Falcataria moluccana) biochar, of 72.4% [35]. In the last three years, Shorea sp. wood cultivation in Indonesia has increased by 1.5%, with a timber production of 2. 63 million m3/year in 2020 [37]. However, the harvesting of Shorea sp. wood has not been optimal due to a lack of waste management [38]. The previous study revealed that 557.87 m3 volume of Shorea sp. waste in the form of the rest of the bucking (5.69%), twigs (11.13%), stumps (13.63%), and branches (26.12%) occurred from 1042.11 m3 Shorea sp. wood [39]. Pyrolysis could be a suitable process to increase the added value of the harvesting waste of Shorea sp. [40]. The biochar from the harvesting waste of Shorea sp. is potentially used to conserve P in the forest soil and support better waste management.
The biochar application method is another determining factor in the conservation of soil nutrients [41]. Biochar applied on the soil surface could increase water retention and decrease fertilizer evaporation [42]. Nonetheless, this application method is unsuitable for areas with high precipitation such as Indonesia because biochar will leach by surface runoff. The application of biochar to improve growth and nutrients is generally achieved by mixing with the soil. Biochar could optimally decrease the nitrate leaching by 8.3–17.0% and improve the soil’s hydraulic conductivity (Ksat) by 20.9% by mixing with soil at a 10–20 cm depth [43]. Nevertheless, mixing biochar with soil is inefficient in large forest areas. On the other hand, research that evaluates the effect of biochar without blending with the soil under topsoil has never been conducted. Previous studies reported that biochar could sequestrate P from the environment due to its strong ionic bond [18,44]. Hence, biochar can desorb P to the topsoil to reach equilibrium [45].
Falcataria moluccana was planted to examine the biochar effect on plant growth by soil P increment. F. moluccana was chosen because legume plants can sensitively uptake P by producing organic acids, such as citrate and malate, to release inorganic-P from soil inorganic complexes by the ligand exchange mechanism [11]. Furthermore, F. moluccana is also an invasive tree that is not easily affected by climate, shade, or temperature [23,46]. Therefore, the increase in P can influence the growth effectively without bias effect. Moreover, F. moluccana is a mainstream commercial wood and easy to find in Indonesia because of its comprehensive cultivation, especially in the Sumatra and Java islands [47]. Therefore, the aim of this study was to investigate the biochar application method with a pyrolysis temperature of 400 °C and 600 °C to increase P in the soil that stimulates F. moluccana growth in the field for six months.

2. Materials and Methods

2.1. Site Study

This research was conducted at a field plot of 1 ha, near the Pesawaran Forest Management Unit Area, Lampung province, Indonesia (104° 59′ 22′′ E 5° 28′ 20.5′′ S). The field was covered by weed and grass without canopy trees or shade, and mimics the first stage of forest succession. This field plot has a warm-temperate monsoon humid climate with an average monthly precipitation of 161.8 mm month1 [48]. The land slope was 5–15° and categorized as a gentle slope. The soil was classified as podsolic soil and formed due to high precipitation and low temperature [49]. The study site is an old mineral soil type with a reddish to yellowish color, indicating relatively low soil fertility.

2.2. Biochar Production

Biochar was produced using a dome kiln developed by Kendi Ltd., South Lampung Regency, Lampung Province, Indonesia. Bricks and clays were used to construct the dome kiln structure with a capacity of 12 m3. The kiln was equipped with a door channel and holes to control the oxygen supply during the pyrolysis process (Figure 1).
Air-dried Shorea sp. woods with an average moisture content of 11.6% and 40 cm length were used as raw materials for biochar production. The raw material was positioned horizontally until the kiln’s maximum capacity to minimize oxygen entering the kiln was reached (Figure 1b). The kiln door was then covered with bricks and clays. The Shorea sp. biochars were produced using the slow pyrolysis method [45,50,51], consisting of the following three stages: heating, maintaining peak temperature, and cooling. During the heating stage, materials were burned at the upper part of the stack for ±3 days to reach the targeted peak temperature. The targeted peak temperatures of 400 °C and 600 °C were maintained for ±4 days. The kiln temperature was measured hourly to maintain the targeted peak temperature by opening the control holes when the peak temperature decreased and by closing the control holes when the peak temperature increased. The cooling stage was carried out by closing all control holes for ±7 days. One production batch was conducted for each of the experimental temperatures. The biochar properties can be seen in Table 1.

2.3. Experiment Design

This study used a randomized experimental design factorial with two factors, namely pyrolysis temperature and dosage. The treatments were as follows: dosage 0 t ha−1 (control), dosage 25 t ha−1 at 400 °C (D25T400), dosage 25 t ha−1 at 600 °C (D25T600), a dosage of 50 t ha−1 at a temperature of 400 °C (D50T400), and a dosage of 50 t ha−1 at a temperature of 600 °C (D50T600). Each treatment was replicated ten times in the field plots. The total sample unit was fifty F. moluccana seedlings. The growth of Shorea sp. seedlings was monitored once a month. The growth measurement was height and diameter increment, soil chemical properties after six months, P on the leaf, and dry weight leaf.

2.4. Biochar Application

The biochars produced were pulverized by crushing them into smaller particles and then separated using a 2 mm fine-size sieve before being applied to the plantation site. Eighty-four planting holes were prepared for the plantation. The holes had a 60 cm depth with a diameter of 20 cm. The distance between the holes was 5 m x 5 m. Border plants, F. moluccana, were planted between treatment plots to minimalize the bias effect of biochar treatments (Figure 2a). The planting hole was filled with biochar to a depth of 40 cm and then covered with a topsoil layer of 20 cm depth (Figure 2b). The sixth-month F. moluccana seedlings with an identical stem height were selected as experimental samples. F. moluccana seedlings from polybags were transferred to the planting holes and planted in the topsoil to avoid direct contact with the biochar (Figure 2b).

2.5. P-Uptake on Leaves

F. moluccana leaves samples for measuring P-uptake were picked from the bottom, middle, and upper parts collected from six plants to avoid the edge effect. The leaf samples were kept at 23–25 °C for 24 h. Prior to P analysis, leaves were dried in the oven until reaching a constant weight. The leaves were weighed with a precision scale of 0.0001 g. The samples were ground into a powder and then sieved using a 0.5 mm mesh screen and combusted at 500 °C. A 5 mg sample was placed in a 50 mL Erlenmeyer with 25 mL of deionized water, and 1 mL of HCl was added. The solution was heated to evaporate the water. Then, a cooling bulb was placed on top of the flasks. After the color turned yellow and transparent, the sample was rotated to remove ash particles from the wall and adjusted the volume to 100 mL with deionized water. The sample was filtered through a GF/C filter connected to a 20 mL syringe. A 10 mL sample was placed in a glass tube. The P-uptake concentration was analyzed by atomic absorption spectrophotometry (AAS) [53].

2.6. Total-P, Organic-C, pH, and CEC Analysis

After six months, soil samples were collected by mixing three spots around the sample unit. Two spots were collected 30 cm from the sample unit, and one spot was directly below the sample unit. The soil was collected at a depth of 10–20 cm. The soil sample was stored at 23–25 °C for seven days. Total P was analyzed with AAS [54]. The calibration graph of absorbance was correlated to standard concentration in ppm to determine P concentration on the soil sample. Organic-C was analyzed using the Walkley–Black method [55]. A blank titration was compared to the FeSO4 added. Organic-C was determined by this equation:
W B C = M + ( v 1 v 2 ) W × 0.30 × C F
where WBC is Walkley–Black organic carbon (%), M is the molarity of the FeSO4 solution from blank titration (mol/L), V1 is the volume (L) of FeSO4 required in blank titration, V2 is the volume (L) of FeSO4 required in actual titration, W is the weight (g) of the oven-dried soil sample, and CF is the correction factor. CEC was analyzed with the atomic absorption spectrophotometry method developed by [56]. The pH was analyzed with Potentiometric [57].

2.7. Statical Analysis

Two-way ANOVAs were used to test for the statistical significance of the treatments with a confidence level of 95%. The Least Significant Difference (LSD) was used for multiple comparisons at a probability level of 0.05. Correlations were analyzed using Pearson tests (two-tailed, p < 0.05). All statistical analyses were performed using SPSS 20.0 software (SPSS Inc., Chicago, IL, USA).

3. Results

3.1. Biochar Effect on Total P, Organic-C, CEC, and pH

The interaction treatment of total P, organic-C, CEC, and pH were significant by p-value < 0.001. Treatment with T600D45 provides the most effective total P in the soil and CEC by 192.2 mg kg−1 and 25.98 me 100 g−1, sequentially (Figure 3a–d). Meanwhile, the treatment with the most significant effect on the organic-C content is T400D50 by 2.83%. Nonetheless, T600D50 was in the same class as T400D50, which means that the treatment affected the organic-C matter in the soil. It showed that treatment with a higher dosage resulted in higher organic-C to the soil. Furthermore, all Shorea sp. biochar treatments significantly affected soil pH compared to control, showing the highest value in T600D25 (Figure 3d). It could be concluded that a higher pyrolysis temperature might lead to a high soil pH increase.

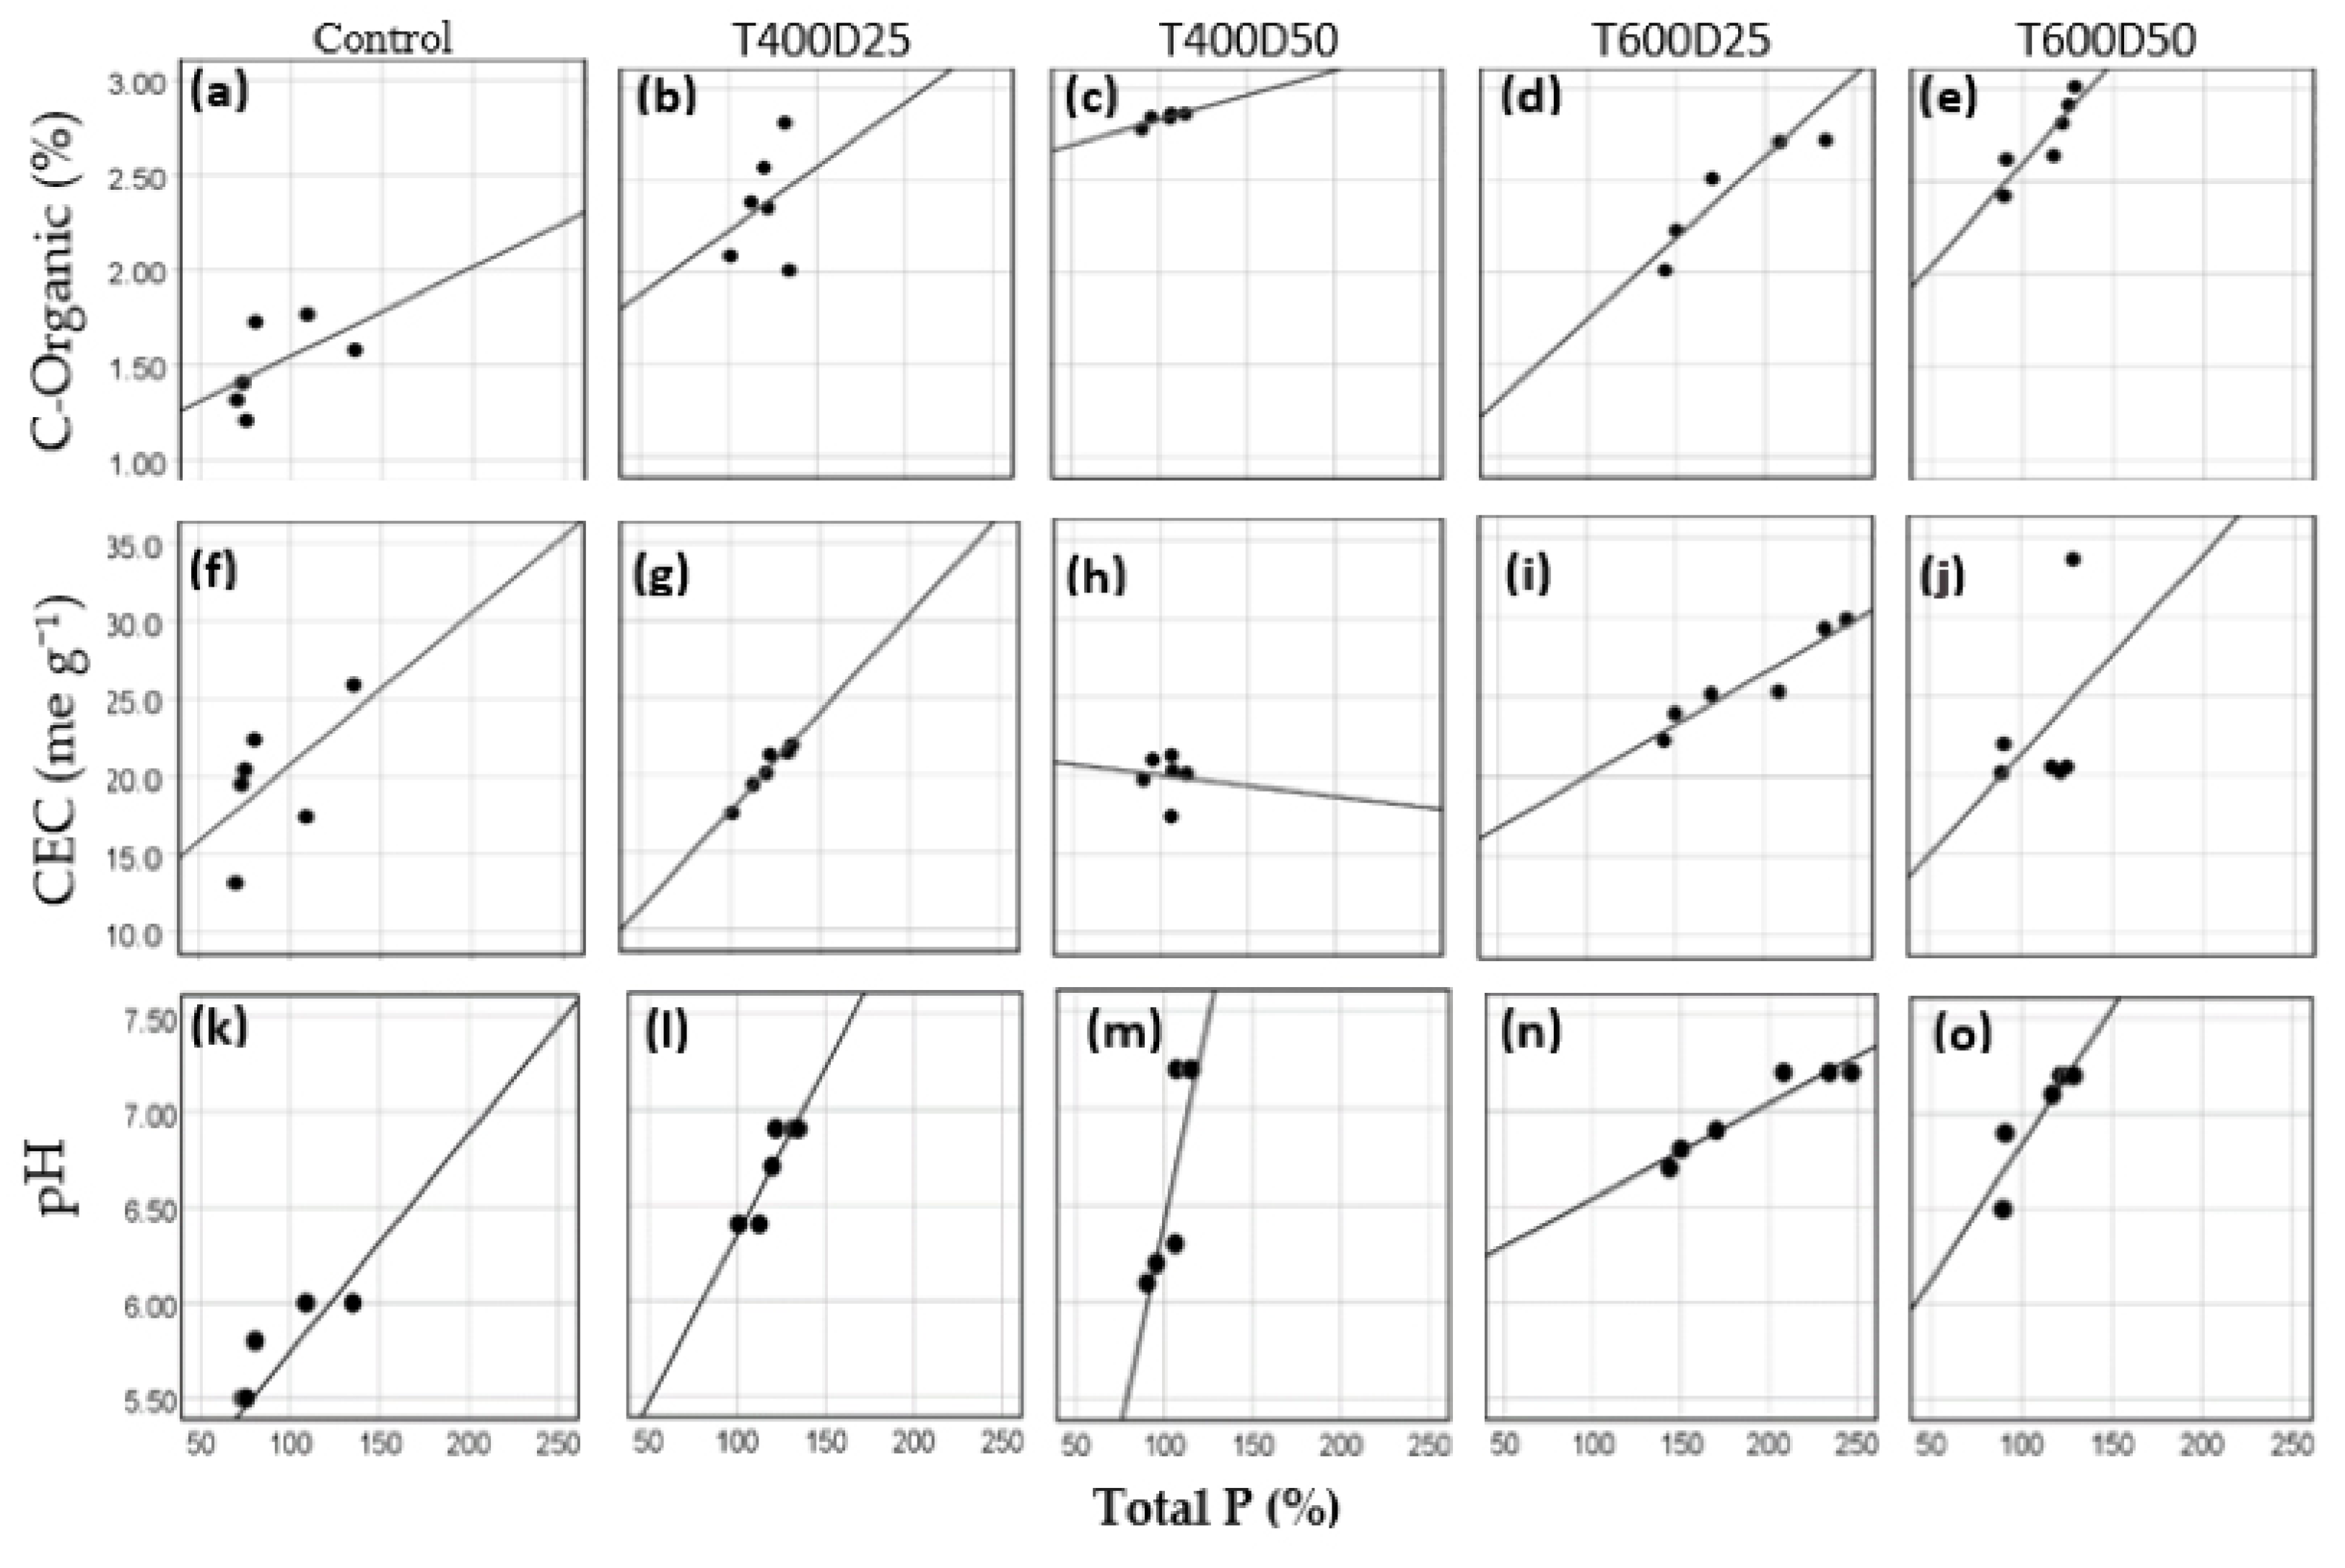
3.2. Correlation of Total P with Organic-C, pH, and CEC

All treatments show a positive correlation between soil total P with organic-C and pH. Meanwhile, the correlation between soil total P to CEC, T400D25, negatively correlates by −0.088 (Table 2). Organic-C correlation to soil total P, T400D50, T600D25, and T600D50 had the highest number of Pearson coefficients, categorized as a very strong correlation [58]. It indicates that higher temperatures will improve organic-C matter in the ground. Still, a lower dosage with a lower pyrolysis temperature makes a minor increment in the organic-C value in the soil (Figure 4a–e). On CEC correlation with total P, T400D25 and T600D25 provide the most robust relation of 0.969 and 0.948, respectively. Based on [47], this was classified as a strong correlation. It is suspected that the smaller dosage has a more substantial correlation between P total and CEC (Figure 4f–j). On pH correlation, all treatments have a strong correlation. It shows that total P is strongly influenced by the increase in pH (Figure 4k–o).

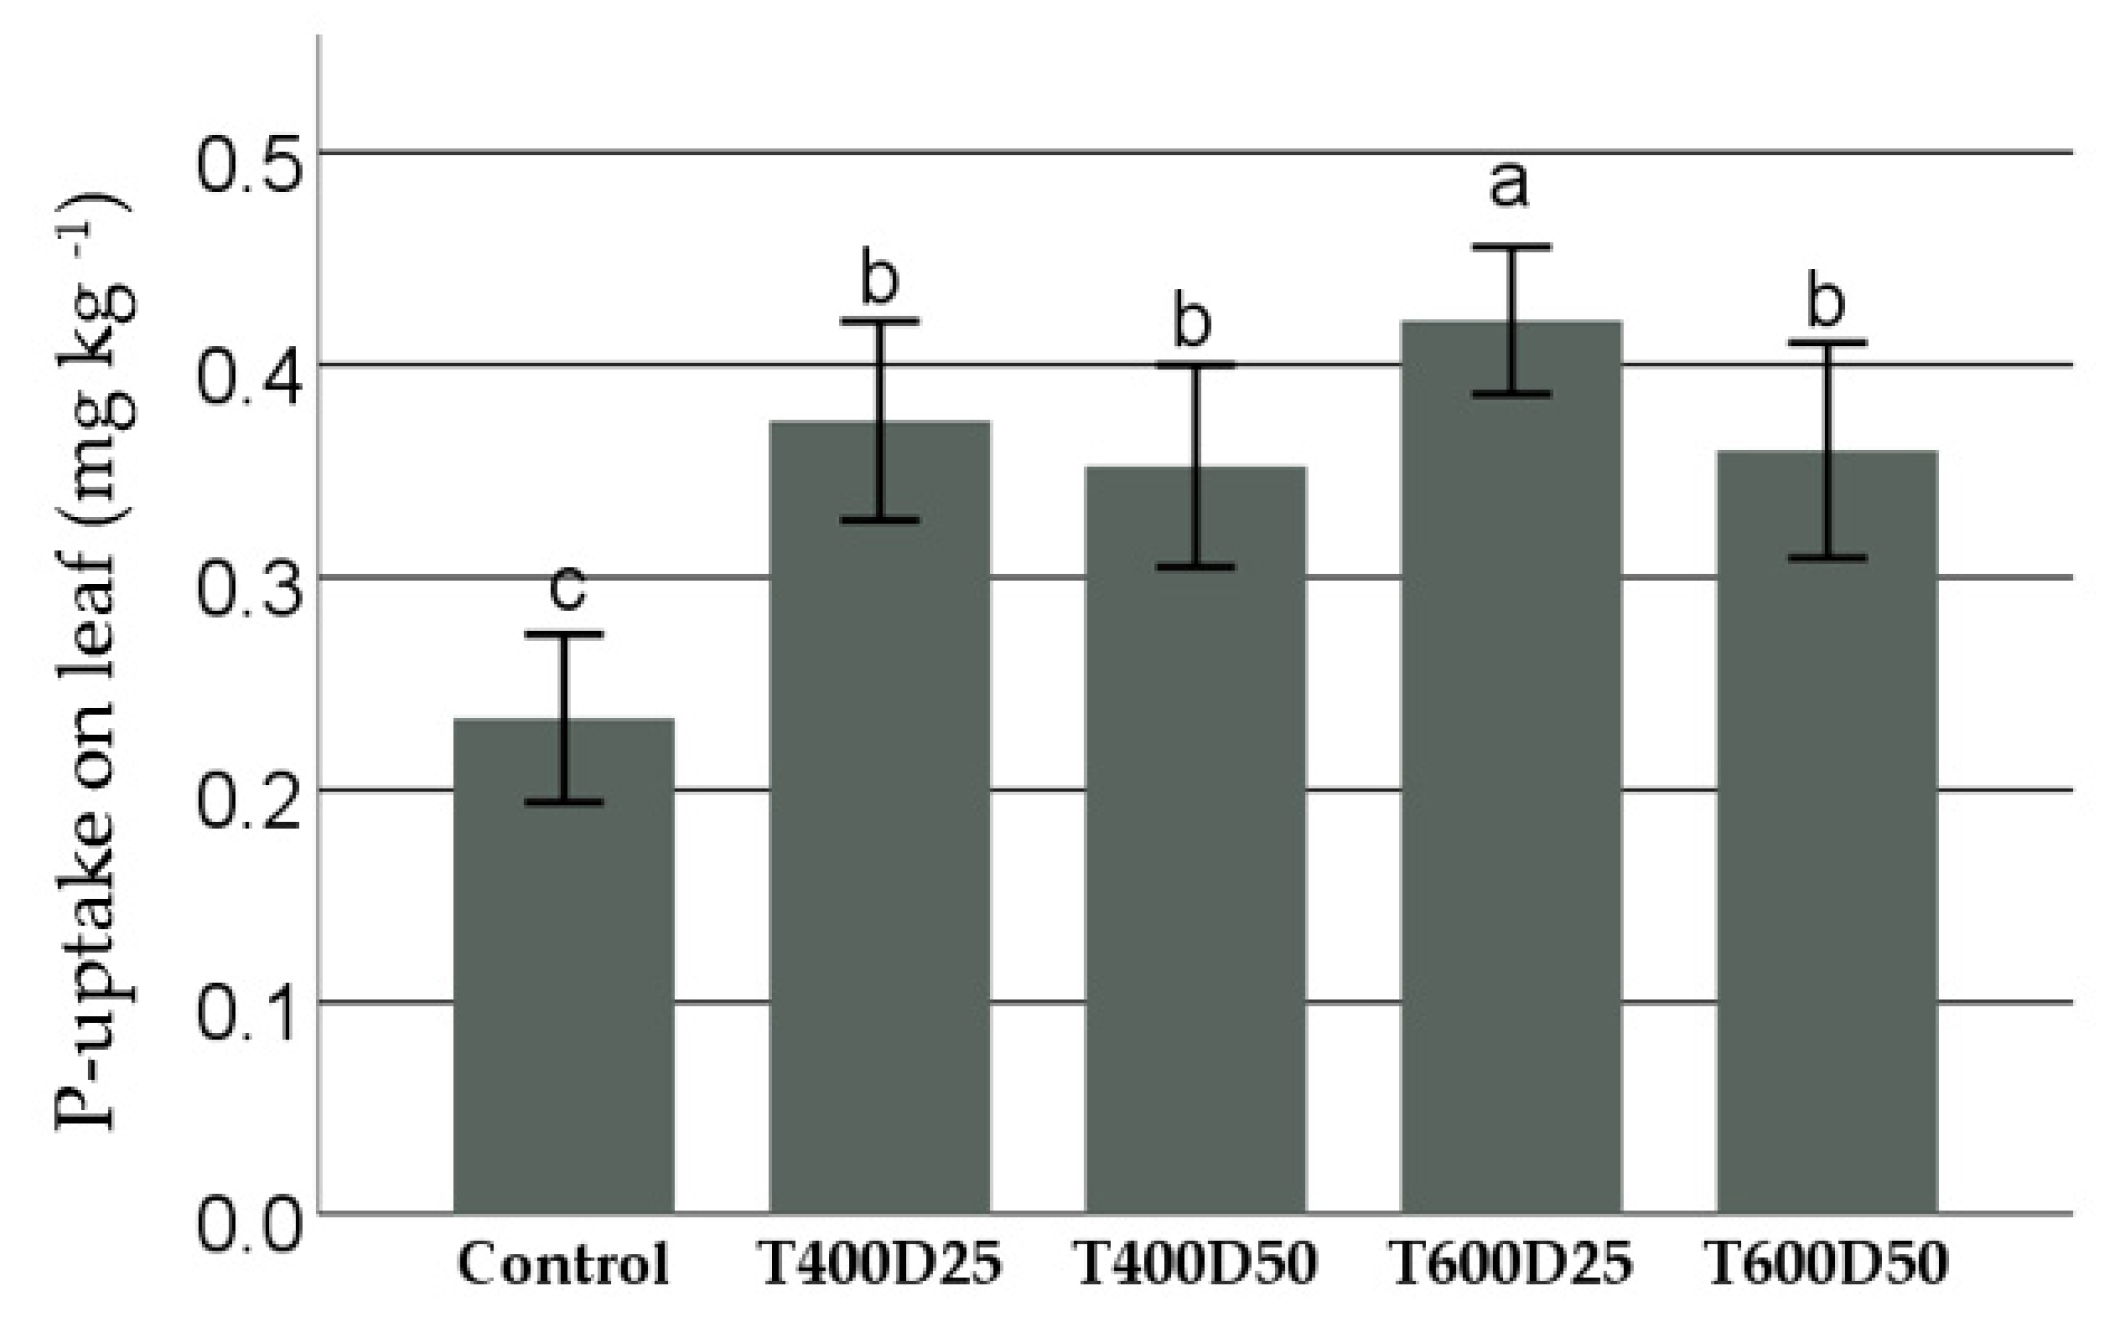
3.3. P-Uptake on Leaf
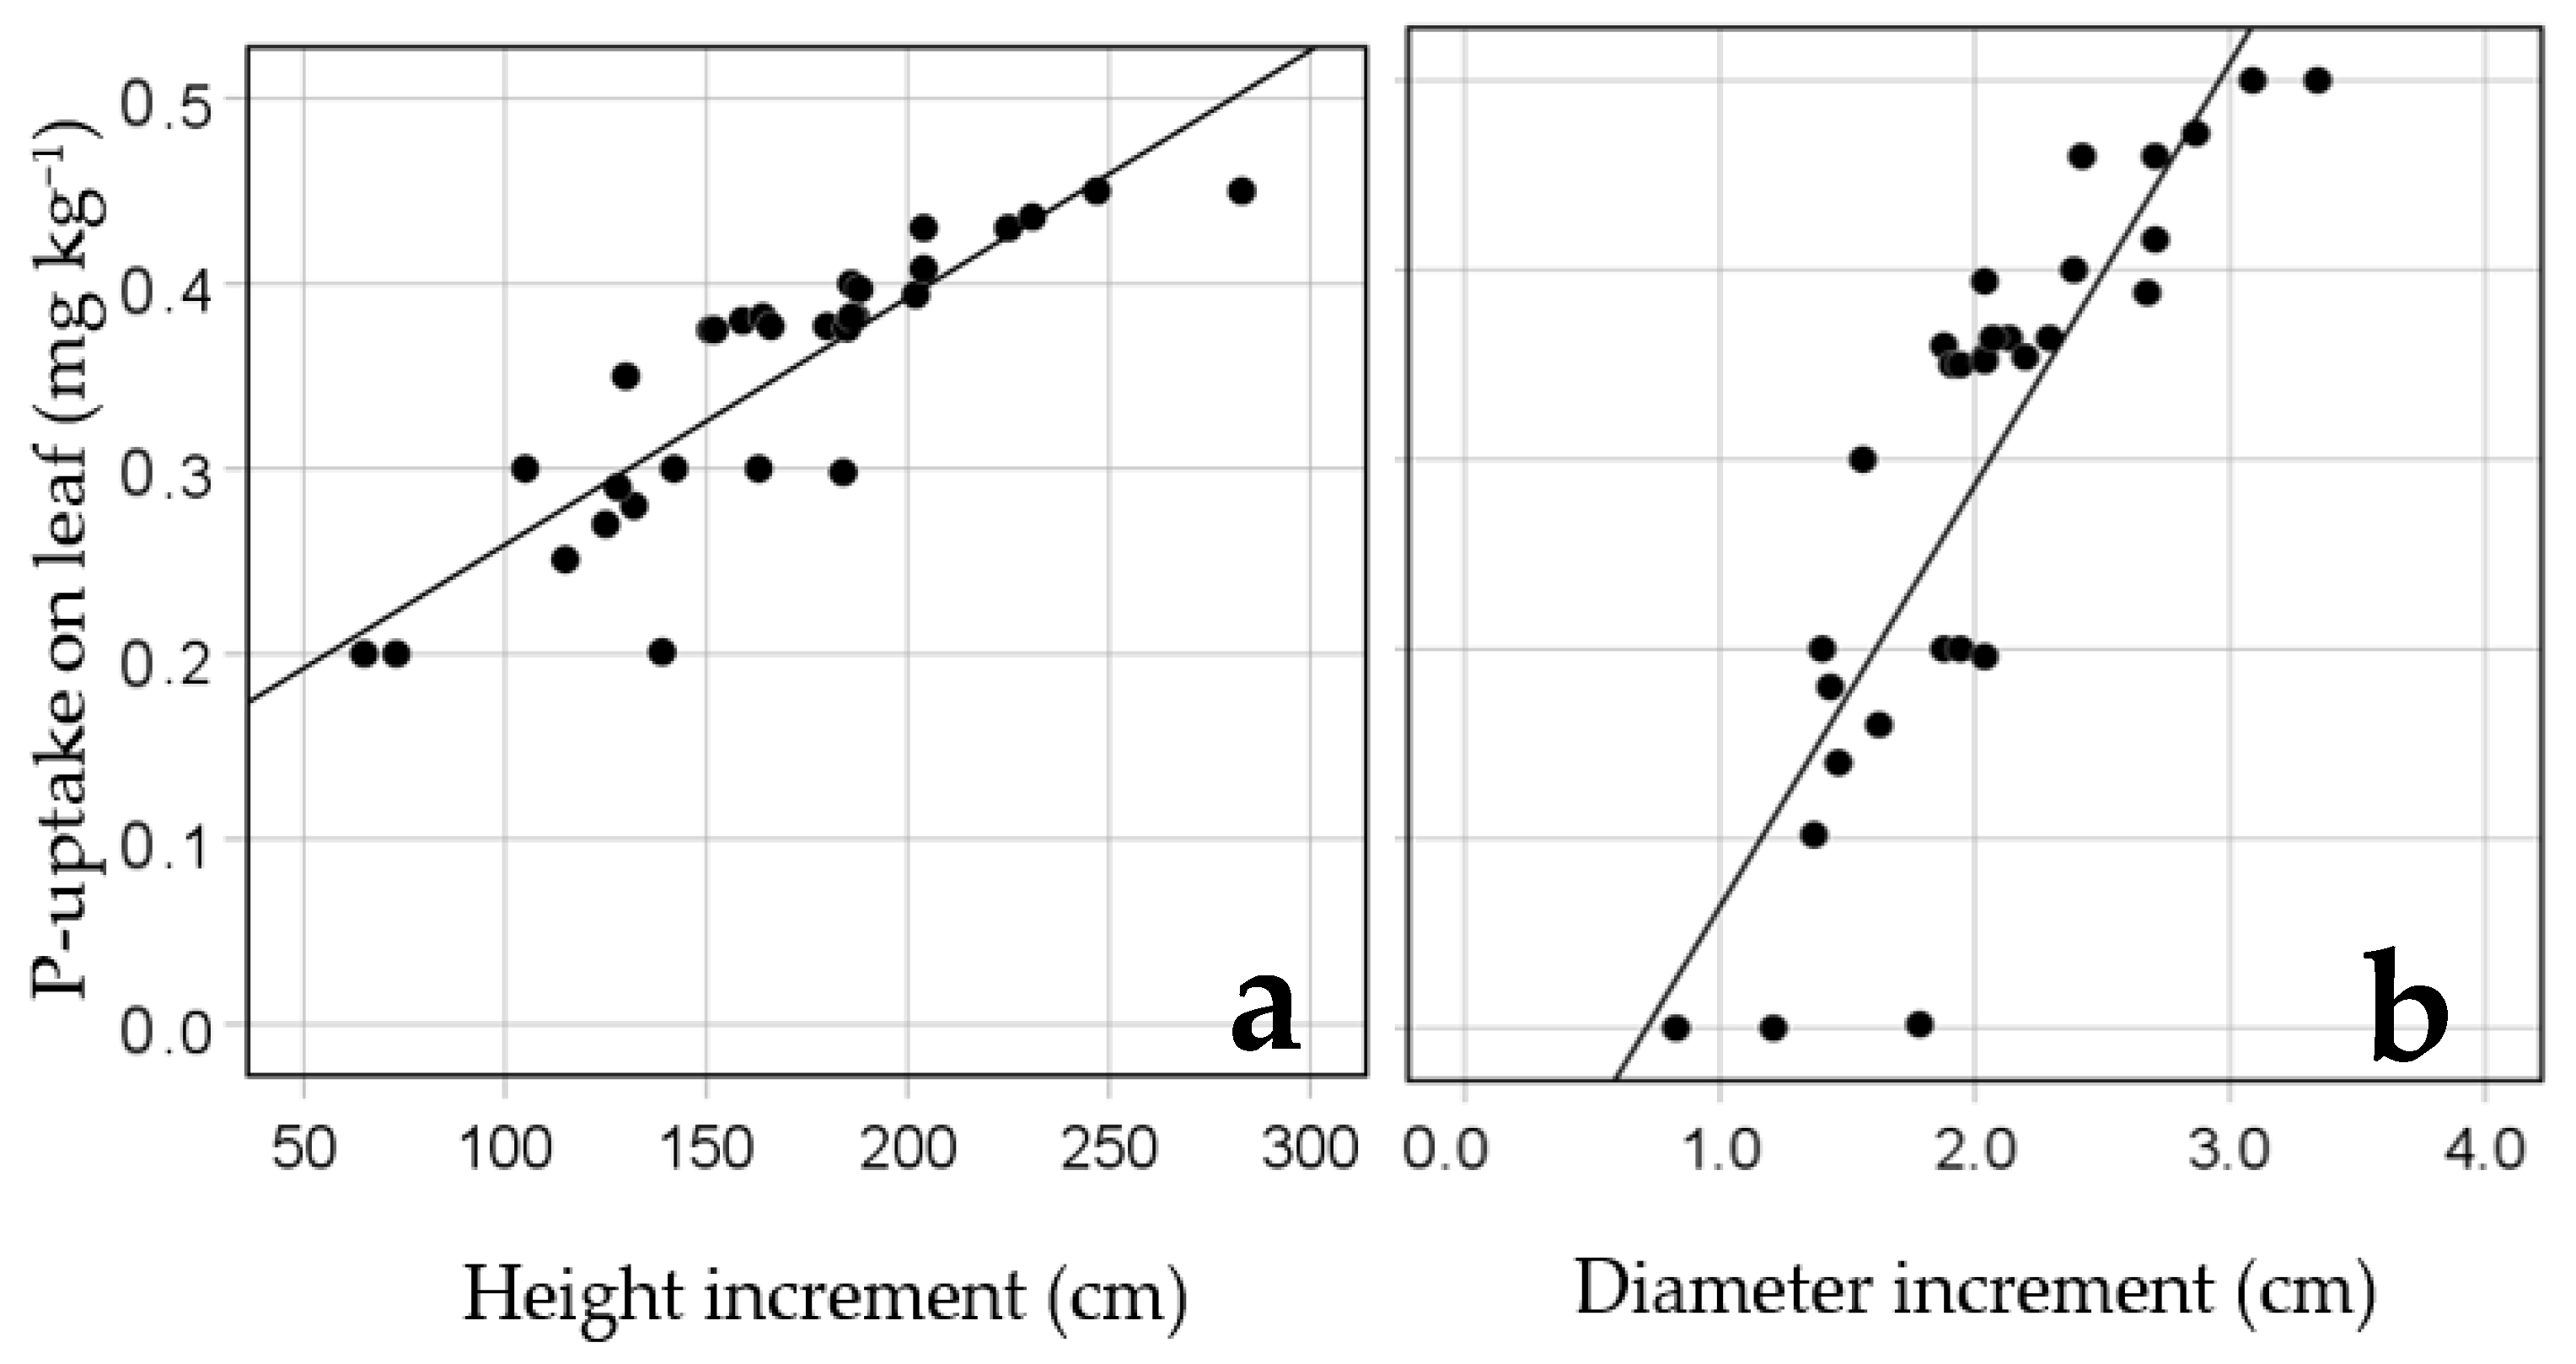
The interaction treatment at P-uptake on the leaf analysis was significant with a p-value < 0.001. Similar to the height and diameter increment, biochar with a pyrolysis temperature of 600 °C and a dosage of 25 t h−1 provided the most sign P absorption by 0.42 mg kg−1 (Figure 5). Sequentially, the correlation between the height and diameter increment to P absorption on leaf had coefficients 0.92 and 0.91 (Figure 6). It indicated that the form of its correlation is a positive correlation. The height and diameter increment will increase by enhancing P on the leaf and vice versa (Figure 6a,b). Based on Pearson strength correlation classification, the Pearson correlation coefficients of height and diameter increment indicates a strong relation. A slight change in one of the variables will change others sensitively.

3.4. Plant Growth

All Shorea sp. biochar application interaction treatments significantly affected the growth of the F. moluccana seedling in terms of height and diameter increment after six months, with a p-value for height and diameter increment <0.001. Shorea sp. biochar with a pyrolysis temperature of 600 °C and a dosage of 25 t h−1 (T600D25) provided the greatest height and diameter increment by 222 cm and 2.75 cm, respectively (Figure 7a,b). Furthermore, T600D25 was 42.26% and 42.22% higher than the control, respectively. Based on the increment in the height and diameter, a similar effect pattern was observed. However, all biochar treatments to the height increment are in the same class, which means that these four treatments have the same effect on the height increment except the control.

4. Discussion

In this application method, P fertilizer was not added. However, it increased the total P higher than control. This might be because biochar absorbs P from mineral leaching during the P cycle [59]. In the terrestrial area, the common pool resource of P is from bedrock and organisms [60]. P is weathered from bedrock and leached by runoff to the soil, mainly in the form of apatite (Ca10(PO4)6(OH, F, Cl)2) [61]. The study in [1] demonstrated that the solubility of P in the soil changes during soil development. At the early stage, it is dominated by insoluble apatite. At mid-stage, organic-P increases as a less-soluble mineral. At the late stage, P is partitioned between organic-P and refractory minerals. Decomposed leaf litter also uplifts the P from the earth and assimilates P reservoirs on the topsoil [62].
The biochar application method also might increase P in soil. Biochar was positioned before the topsoil without mixing with the soil. Biochar plays a role in P storage, as it absorbs P from the environment and releases it to the soil above. This is supported by [63], stating that biochar could increase P on the soil by P-sorption and -desorption mechanisms. Biochar P-sorption mechanism sequestrates P via its strength ionic exchange. Biochar acquisition supplies some metal ions such as Al3+ and Fe2+ to the soil [64], and these ions form a solid ionic bond with P in the soil. The ionic bond then sequestrates P inside the biochar solution. The P-desorption mechanism releases P to the soil solution. When soil depletes P, biochar desorbs to equilibrium and makes P soluble [45]. Thus, the total P increases in the soil. In addition, Biochar undergoes intra-biochar diffusion before releasing P to the soil solution [65]. The intra-biochar diffusion is relatively slow [45]. Therefore, it is possible to slow-release P-desorption from biochar to a soil solution. This biochar application design could maximize P retention in the soil for a long time span and can help to avoid leaching because the P is saved inside the biochar layer. Furthermore, this application method can preserve several fertilizers added into the site and promotes slow-release from the addition of the fertilizer.
Additionally, T600D25 increased total-P in the soil and P-uptake to F. moluccana, was found to produce a higher increase than T600D50. The high dosage might be the reason. As explained previously, the nutrient undergoes an intra-biochar diffusion to release soluble P to the soil. The biochar-application design of a dosage of 50 t ha−1 has a longer dimension than the smaller dosages. In [45], it was estimated that the rate of intra-biochar diffusion is 1.5 × 10⁻¹² cm2 s−1. To reach the topsoil, the intra-biochar diffusion of P requires more time to release P into the soil due to this longer dimension. It might cause P-uptake in the topsoil by F. moluccana’s root to become inefficient. However, this assumption needs to be proven by calculating the exact time of intra-biochar diffusion in further research.
Biochar pyrolyzed at 600 °C has a higher increase in total-P than the treatment at 400 °C because biochar pyrolyzed at 600 °C has a better thermal decomposition of its structure than 400 °C. A previous study [34] evaluated the thermal decomposition of Shorea sp. wood during pyrolysis and reported that hemicellulose, cellulose, and lignin were decomposed at 210–310 °C, 300–400 °C, and 150–900 °C, respectively. The Shorea sp. biochar used in this study pyrolyzed at 600 °C and almost optimally decomposed, resulting in a broader surface area than the biochar pyrolyzed at 400 °C. In [45], it was revealed that biochar at a pyrolysis temperature of 600 °C has a surface area 28.3 times wider than biochar with a pyrolysis temperature of 350 °C. Furthermore, the author elucidated that a higher pyrolysis temperature could absorb the ionic P by a rate of 58% higher than a lower pyrolysis temperature. The wider surface also increases ionic exchange [66]. Thus, it increases the P-sorption in biochar.
A wider surface area also increased CEC. Several studies have proven that biochar with a wide surface area will increase CEC [25,27,67,68,69,70]. Biochar has a high surface area charge density and a large surface area per unit mass [25]. It increases the soil colloid and maximizes nutrient absorption in the soil [27]. Moreover, biochar production with a high pyrolysis temperature produces a higher ash content. Biochar with an ash-rich content will enhance CEC in the soil [71,72]. Shorea sp. biochar with a pyrolysis temperature of 600 °C has an ash content 3.34 times higher than the lower temperature pyrolysis [52]. Therefore, T600D25 has the highest CEC increment when compared with the other treatments.
CEC determines the amount of total P in the soil [73]. However, the availability of P is determined by pH [60]. Both T600D25 and T600D50 have a higher soil pH than T400D25 and T400D50. The Shorea sp. biochar pH increases during production with increasing temperatures [52]. Biochar application on soil depends on the biochar pH [74]. Furthermore, pH is essential in supplying soluble P because it causes the release of ionic nutrients that bond with the soil colloid. P is soluble at a pH of 6.5–7 [75]. P reacts with Al+3, Mg+2, and Fe+2 at a lower pH; at higher pH, P reacts with Ca+2 [1]. It can be assumed that Shorea sp. biochar produced with a lower pyrolysis temperature in 6 months application was not capable of increasing soil pH to the extent that Shorea sp. biochar produced with a high pyrolysis temperature was able to. Further research needs to be conducted to examine the change of Shorea sp. biochar pH for longer time spans in the soil.
Organic-C matter in the soil affects the increment in CEC and pH [76]. All Shorea sp. biochar treatments led to an increase in the organic-C content. The Shorea sp. biochar feedstock already contains a high C content compared to other wood species [40]. C content on raw Shorea sp. feedstock is 41.7 wt.%; after pyrolysis, the C content increases two-fold [34]. This abundance in C content in the biochar will increase the organic-C matter in the soil. The dosage is in line with the increase in organic-C. Nonetheless, the overapplication of biochar presents some problems, such as filling soil pore spaces [77] and the excessive accumulatio of heavy metal elements in the soil [78].
The soil’s increment in organic-C affects the microorganism colonization [30]. Microorganism colonization is essential for P for plant growth. Nonetheless, soluble P is not always available for plants [1]. P-uptake to the plant by its root is in the form of HPO4 and H2PO4 [79]. In general, there are three mechanisms by which soil microorganism transforms and enhance the capacity of P as an essential nutrient for plant growth. First, by stimulating root–phosphorous mycorrhiza association to increase soluble P [80] or producing stimulation-like hormones to enhance the development of root, branch or reproductive organs [81], for example producing GAs, indole-3-acetic acid, or alternative plant ethylene precursors enzyme, such as carboxylate deaminase, or 1-aminocyclopropane-1 [82]. Second, by customizing the P equilibrium in the soil. This either increases the net transfer of orthophosphate ions to the soil solution or promotes organic P directly or indirectly via microbial turnover [83]. The third mechanism is by directly solubilizing P from available soil and inducing metabolic processes that are effective in mineralizing inorganic and organic P [84,85].
There is a positive relationship between the increase in the CEC, pH, and organic-C to total P in the soil from the explanation above. The increment in CEC leads to organic-C retention. Thus the abundance of organic-C increases soil microorganisms. Expanded soil-microorganism colonization transforms and mobilizes P to the soil and increases its concentration. This mechanism will increase P-uptake to F. moluccana. The highest P-uptake into F. moluccana is achieved with T600D25. That is because T600D25 has the highest P assimilation in the soil. The availability of P in soil solution determines the P-uptake to the plant. It causes the concentration difference between root and soil. High P concentration differences boost the P transporter present in the root plasma membrane against the concentration gradient [86]. The P transporter is an integral membrane protein consisting of 12 membrane members of the Major Facilitator Super family (MFS) [87]. It uses an H+ gradient to drive the transport process [11].
Additionally, T600D25 resulted in the highest height and diameter increment. This is a result of the highest P-uptake for T600D25. In the plant, phosphorus constructs the component of high energy bonds, including phosphoanhydride, enol phosphate, and acyl phosphate. It plays a role in controlling cellular metabolism by transferring energy required by the acceptor molecules [88]. P is also well recognized as the main component in ATP. ATP supports some cellular processes, including membrane phospholipids [89], synthesis of macromolecules [90], and nutrient transport due to its high concentration gradient [91]. The relative P growth decreases during P deficiency because ATP is reduced in several vital organs such as roots and leaves [11,88]. Hence, the height and diameter increment in F. moluccana is determined by P concentration in the plant.

5. Conclusions

The Shorea sp. Biochar-application method in this study could increase the soil total-P and the growth of F. moluccana. Additionally, T600D25 increased the height and diameter of F moluccana seedlings by 51.04% and 49.82% higher than control, respectively. The biochar layer can sequestrate P from the environment and release it to the topsoil. Biochar treatments with high dosages, T400D50 and T600D50, increased higher organic-C in the soil than lower dosage treatments and control. Biochar pyrolyzed at a higher temperature (600 °C) increased CEC and pH higher than biochar pyrolyzed at a lower temperature (400 °C), even with the high dosage. The increment in the CEC and soil pH induced soluble P on topsoil. Furthermore, T600D25 led to the highest P in topsoil among other treatments, of 192.2 mg kg−1. Soluble P on the topsoil was absorbed by F. moluccana seedlings. The P-uptake increment on F. moluccana seedlings improved its height and diameter. This biochar application method can maximize fertilizer addition in the future. It can store nutrients from the fertilizer in the biochar layer and slow-release it to the topsoil.

Author Contributions

Conceptualization, W.H., S.K., S.L. and J.Y.; data curation, B.A.W., M.R. and H.P.; writing—original draft preparation, B.A.W. and W.H.; writing—review, A.N., U.H. and I.S.B. All authors have read and agreed to the published version of the manuscript.

Funding

The authors acknowledge the funding from the project titled “Establishment of Low-carbon ISWM center in Indonesia”.

Institutional Review Board Statement

Not applicable.

Informed Consent Statement

Not applicable.

Data Availability Statement

Not applicable.

Conflicts of Interest

The authors declare no conflict of interest.

References

  1. Werner, E.; Ami, N. The phosphorus cycle. Aquat. Ecol. 2014, 6, 347–363. [Google Scholar] [CrossRef]
  2. Cordell, D.; Drangert, J.O.; White, S. The story of phosphorus: Global food security and food for thought. Glob. Environ. Chang. 2009, 19, 292–305. [Google Scholar] [CrossRef]
  3. Mirmanto, J.; Proctor, J.; Green, J.; Nagy, J. Suriantata Effects of nitrogen and phosphorus fertilization in lowland evergreen rainforest. R. Soc. 2018, 388, 539–547. [Google Scholar]
  4. Riniarti, M.; Setiawan, A. Soil fertility on two type of land cover in kesatuan pengelolaan hutan lindung (KPHL) batutegi lampung. J. Sylva Lestari 2014, 2, 99. [Google Scholar] [CrossRef]
  5. Giesler, R.; Ilvesniemi, H.; Nyberg, L.; Van Hees, P.; Starr, M.; Bishop, K.; Kareinen, T.; Lundström, U.S. Distribution and mobilization of Al, Fe and Si in three podzolic soil profiles in relation to the humus layer. Geoderma 2000, 94, 249–263. [Google Scholar] [CrossRef]
  6. Lambers, H.; Raven, J.A.; Shaver, G.R.; Smith, S.E. Plant nutrient-acquisition strategies change with soil age. Trends Ecol. Evol. 2008, 23, 95–103. [Google Scholar] [CrossRef]
  7. Tiessen, H. Phosphorus in the global environment. In The Ecophysiology of Plant-Phosphorus Interactions; Business Media: Berlin, Germany, 2008; pp. 1–7. [Google Scholar]
  8. Grant, C.A.; Flaten, D.N.; Tomasiewicz, D.J.; Sheppard, S.C. The importance of early season phosphorus nutrition. Can. J. Plant Sci. 2001, 81, 211–224. [Google Scholar] [CrossRef]
  9. Kavanová, M.; Lattanzi, F.A.; Grimoldi, A.A.; Schnyder, H. Phosphorus deficiency decreases cell division and elongation in grass leaves. Plant Physiol. 2006, 141, 766–775. [Google Scholar] [CrossRef] [Green Version]
  10. Li, J.; Xie, Y.; Dai, A.; Liu, L.; Li, Z. Root and shoot traits responses to phosphorus deficiency and QTL analysis at seedling stage using introgression lines of rice. J. Genet. Genom. 2009, 36, 173–183. [Google Scholar] [CrossRef]
  11. Raghothama, K.G. Phosphorus and plant nutrition: An overview. In Phosphorus: Agriculture and the Environment; Cabrera, M., Ed.; Purdue University: West Lafayette, IN, USA, 2015; pp. 355–378. ISBN 9780891182696. [Google Scholar]
  12. Harper, D. Eutrophication of Freshwaters, 1st ed.; Springer Netherlands: Dordrecht, The Netherlands, 1992; Volume 1, ISBN 978-94-010-5366-2. [Google Scholar]
  13. Rast, W.; Thornton, J.A. Trends in eutrophication research and control. Hydrol. Process. 1996, 10, 295–313. [Google Scholar] [CrossRef]
  14. Xie, Z.; Li, S.; Tang, S.; Huang, L.; Wang, G.; Sun, X.; Hu, Z. Phosphorus Leaching from Soil Profiles in Agricultural and Forest Lands Measured by a Cascade Extraction Method. J. Environ. Qual. 2019, 48, 568–578. [Google Scholar] [CrossRef] [PubMed]
  15. Yuan, T.; He, W.; Yin, G.; Xu, S. Comparison of bio-chars formation derived from fast and slow pyrolysis of walnut shell. Fuel 2020, 261, 116450. [Google Scholar] [CrossRef]
  16. Koufopanos, C.A.; Lucchesi, A.; Maschio, G. Kinetic modelling of the pyrolysis of biomass and biomass components. Can. J. Chem. Eng. 1989, 67, 75–84. [Google Scholar] [CrossRef]
  17. Hidayat, W.; Qi, Y.; Jang, J.H.; Febrianto, F.; Lee, S.H.; Chae, H.M.; Kondo, T.; Kim, N.H. Carbonization characteristics of juvenile woods from some tropical trees planted in Indonesia. J. Fac. Agric. Kyushu Univ. 2017, 62, 145–152. [Google Scholar] [CrossRef]
  18. Lee, J.; Kim, K.H.; Kwon, E.E. Biochar as a catalyst. Renew. Sustain. Energy Rev. 2017, 77, 70–79. [Google Scholar] [CrossRef]
  19. Yaman, S. Pyrolysis of biomass to produce fuels and chemical feedstocks. Energy Convers. Manag. 2004, 45, 651–671. [Google Scholar] [CrossRef]
  20. Yao, Y.; Gao, B.; Zhang, M.; Inyang, M.; Zimmerman, A.R. Effect of biochar amendment on sorption and leaching of nitrate, ammonium, and phosphate in a sandy soil. Chemosphere 2012, 89, 1467–1471. [Google Scholar] [CrossRef]
  21. Yu, P.; Huang, L.; Li, Q.; Lima, I.M.; White, P.M.; Gu, M. Effects of mixed hardwood and sugarcane biochar as bark-based substrate substitutes on container plants production and nutrient leaching. Agronomy 2020, 10, 156. [Google Scholar] [CrossRef] [Green Version]
  22. Mašek, O.; Brownsort, P.; Cross, A.; Sohi, S. Influence of production conditions on the yield and environmental stability of biochar. Fuel 2013, 103, 151–155. [Google Scholar] [CrossRef] [Green Version]
  23. Hidayat, W.; Kim, Y.K.; Jeon, W.S.; Lee, J.A.; Kim, A.R.; Park, S.H.; Maail, R.S.; Kim, N.H. Qualitative and quantitative anatomical characteristics of four tropical wood species from moluccas, indonesia. J. Korean Wood Sci. Technol. 2017, 42, 369–381. [Google Scholar]
  24. McBeath, A.V.; Smernik, R.J. Variation in the degree of aromatic condensation of chars. Org. Geochem. 2009, 40, 1161–1168. [Google Scholar] [CrossRef]
  25. Mahmoud, E.; El-Beshbeshy, T.; El-Kader, N.A.; El Shal, R.; Khalafallah, N. Impacts of biochar application on soil fertility, plant nutrients uptake and maize (Zea mays L.) yield in saline sodic soil. Arab. J. Geosci. 2019, 12, 719. [Google Scholar] [CrossRef]
  26. Criscuoli, I.; Ventura, M.; Wiedner, K.; Glaser, B.; Panzacchi, P.; Ceccon, C.; Loesch, M.; Raifer, B.; Tonon, G. Stability of woodchips biochar and impact on soil carbon stocks: Results from a two-year field experiment. Forests 2021, 12, 1350. [Google Scholar] [CrossRef]
  27. Atkinson, C.J.; Fitzgerald, J.D.; Hipps, N.A. Potential mechanisms for achieving agricultural benefits from biochar application to temperate soils: A review. Plant Soil 2010, 337, 1–18. [Google Scholar] [CrossRef]
  28. Smebye, A.; Alling, V.; Vogt, R.D.; Gadmar, T.C.; Mulder, J.; Cornelissen, G.; Hale, S.E. Biochar amendment to soil changes dissolved organic matter content and composition. Chemosphere 2016, 142, 100–105. [Google Scholar] [CrossRef]
  29. Alexander, M. Biochemical Ecology of Soil Microorganisms. Annu. Rev. Microbiol. 1964, 18, 217–250. [Google Scholar] [CrossRef]
  30. Gorovtsov, A.V.; Minkina, T.M.; Mandzhieva, S.S.; Perelomov, L.V.; Soja, G.; Zamulina, I.V.; Rajput, V.D.; Sushkova, S.N.; Mohan, D.; Yao, J. The mechanisms of biochar interactions with microorganisms in soil. Environ. Geochem. Health 2020, 42, 2495–2518. [Google Scholar] [CrossRef]
  31. Wu, H.; Lai, C.; Zeng, G.; Liang, J.; Chen, J.; Xu, J.; Dai, J.; Li, X.; Liu, J.; Chen, M.; et al. The interactions of composting and biochar and their implications for soil amendment and pollution remediation: A review. Crit. Rev. Biotechnol. 2017, 37, 754–764. [Google Scholar] [CrossRef]
  32. Stotzky, G. Influence of Clay Minerals on Microorganisms. Can. J. Microbiol. 1966, 12, 1235–1246. [Google Scholar] [CrossRef]
  33. Wijaya, B.A.; Riniarti, M.; Prasetia, H.; Hidayat, W.; Niswati, A.; Hasanudin, U.; Banuwa, I.S. The interaction of dose treatment and pyrolysis temperature of meranti wood biochar (Shorea spp.) affects the growth rate of sengon (Paraserianthes moluccana). ULIN J. Hutan Trop. 2021, 5, 78. [Google Scholar] [CrossRef]
  34. Mazlan, M.A.F.; Uemura, Y.; Osman, N.B.; Yusup, S. Characterizations of bio-char from fast pyrolysis of Meranti wood sawdust. J. Phys. Conf. Ser. 2015, 622, 012054. [Google Scholar] [CrossRef] [Green Version]
  35. Gupta, G.K.; Gupta, P.K.; Mondal, M.K. Experimental process parameters optimization and in-depth product characterizations for teak sawdust pyrolysis. Waste Manag. 2019, 87, 499–511. [Google Scholar] [CrossRef] [PubMed]
  36. Mazlan, M.A.F.; Uemura, Y.; Yusup, S. Fast pyrolysis of rubber wood sawdust via a fluidized bed pyrolyzer: The effect of fluidization gas velocity. Sindh Univ. Res. J. 2016, 48, 9–15. [Google Scholar]
  37. Central Bureau of Statistics of the Republic of Indonesia. Available online: https://www.bps.go.id/indicator/60/502/1/produksi-kayu-bulat-perusahaan-hak-pengusahaan-hutan-hph-menurut-jenis-kayu.html (accessed on 28 December 2021).
  38. Susanto, D.; Widyarko, W. Sustainable Material: Used Wood As Building Material. Insist 2017, 2, 14. [Google Scholar] [CrossRef] [Green Version]
  39. Sari, D.R. Ariyanto The potential of woody waste biomass from the logging activity at the natural forest of Berau District, East Kalimantan. IOP Conf. Ser. Earth Environ. Sci. 2018, 144, 012061. [Google Scholar] [CrossRef]
  40. Haryanto, A.; Hidayat, W.; Hasanudin, U.; Iryani, D.A.; Kim, S.; Lee, S.; Yoo, J. Valorization of indonesian wood wastes through pyrolysis: A review. Energies 2021, 14, 1407. [Google Scholar] [CrossRef]
  41. Igalavithana, A.D.; Mandal, S.; Niazi, N.K.; Vithanage, M.; Parikh, S.J.; Mukome, F.N.D.; Rizwan, M.; Oleszczuk, P.; Al-Wabel, M.; Bolan, N.; et al. Advances and future directions of biochar characterization methods and applications. Crit. Rev. Environ. Sci. Technol. 2017, 47, 2275–2330. [Google Scholar] [CrossRef]
  42. Lehmann, J.; Joseph, S. Biochar for Environmental Management, 1st ed.; Routledge: London, UK, 2009; ISBN 9781849770552. [Google Scholar]
  43. Li, S.; Zhang, Y.; Yan, W.; Shangguan, Z. Effect of biochar application method on nitrogen leaching and hydraulic conductivity in a silty clay soil. Soil Tillage Res. 2018, 183, 100–108. [Google Scholar] [CrossRef]
  44. Li, H.; Dong, X.; da Silva, E.B.; de Oliveira, L.M.; Chen, Y.; Ma, L.Q. Mechanisms of metal sorption by biochars: Biochar characteristics and modifications. Chemosphere 2017, 178, 466–478. [Google Scholar] [CrossRef]
  45. Li, H.; Li, Y.; Xu, Y.; Lu, X. Biochar phosphorus fertilizer effects on soil phosphorus availability. Chemosphere 2020, 244, 125471. [Google Scholar] [CrossRef]
  46. Hughes, R.; Johnson, M.; Uowolo, A. The Invasive Alien Tree Falcataria moluccana: Its Impacts and Management. In Proceedings of the XIII International Symposium on Biological Control of Weeds, Waikoloa, HI, USA, 11–16 September 2011; pp. 218–223. [Google Scholar]
  47. Ridjayanti, S.M.; Bazenet, R.A.; Hidayat, W.; Banuwa, I.S.; Riniarti, M. The influence of adhesive content variation on the characteristics of sengon (Falcatataria moluccana) wood charcoal briquettes. Perennial 2021, 17, 5–11. [Google Scholar]
  48. Meteorology Climatology and Geophysics Council (BMKG), Data Online Pusat Database. Available online: https://dataonline.bmkg.go.id/home (accessed on 31 December 2021).
  49. Muir, A. The Podzol and Podzolic Soils. Adv. Agron. 1961, 13, 1–56. [Google Scholar] [CrossRef]
  50. Lee, Y.; Eum, P.R.B.; Ryu, C.; Park, Y.K.; Jung, J.H.; Hyun, S. Characteristics of biochar produced from slow pyrolysis of Geodae-Uksae 1. Bioresour. Technol. 2013, 130, 345–350. [Google Scholar] [CrossRef]
  51. Ronsse, F.; van Hecke, S.; Dickinson, D.; Prins, W. Production and characterization of slow pyrolysis biochar: Influence of feedstock type and pyrolysis conditions. GCB Bioenergy 2013, 5, 104–115. [Google Scholar] [CrossRef]
  52. Hidayat, W.; Riniarti, M.; Prasetia, H.; Niswati, A. Characteristics of biochar produced from the harvesting wastes of meranti (Shorea sp.) and oil palm (Elaeis guineensis) empty fruit bunches. Characteristics of biochar produced from the harvesting wastes of meranti (Shorea sp.) and oil palm (Elaeis. In IOP Conference Series: Earth and Environmental Science; IOP Publishing: Bristol, UK, 2021. [Google Scholar]
  53. Flindt, M.; Lillebø, A. Determination of Total Nitrogen and Phosphorus in Leaf Litter\rMethods to Study Litter Decomposition. In Methods to Study Litter Decomposition: A Practical Guide; Springer: Copenhagen, Denmark, 2005; pp. 53–59. ISBN 978-1-4020-3466-4. [Google Scholar]
  54. Martin, M.; Celi, L.; Barberis, E. Determination of low concentrations of organic phosphorus in soil solution. Commun. Soil Sci. Plant Anal. 1999, 30, 1909–1917. [Google Scholar] [CrossRef]
  55. Walkley, A.; Black, I.A. An examination of the Degtjareff method for determining soil organic matter, and a proposed modification of the chromic acid titration method. Soil Sci. 1934, 37, 29–38. [Google Scholar] [CrossRef]
  56. Aran, D.; Maul, A.; Masfaraud, J.F. A spectrophotometric measurement of soil cation exchange capacity based on cobaltihexamine chloride absorbance. Comptes Rendus-Geosci. 2008, 340, 865–871. [Google Scholar] [CrossRef]
  57. Oman, S.F.; Camões, M.F.; Powell, K.J.; Rajagopalan, R.; Spitzer, P. Guidelines for potentiometric measurements in suspensions part A. The suspension effect: IUPAC technical report. Pure Appl. Chem. 2007, 79, 67–79. [Google Scholar] [CrossRef]
  58. De Vaus, D. Analyzing Social Science Data: 50 Key Problems in Data Analysis, 1st ed.; Sage Publication: New Delhi, India, 2002; Volume 1. [Google Scholar]
  59. Shigaki, F.; Sharpley, A.; Prochnow, L.I. Rainfall intensity and phosphorus source effects on phosphorus transport in surface runoff from soil trays. Sci. Total Environ. 2007, 373, 334–343. [Google Scholar] [CrossRef]
  60. Föllmi, K.B. The phosphorus cycle, phosphogenesis and marine phosphate-rich deposits. Earth-Sci. Rev. 1996, 40, 55–124. [Google Scholar] [CrossRef]
  61. Li, R.; Zhang, Z.; Li, Y.; Teng, W.; Wang, W.; Yang, T. Transformation of apatite phosphorus and non-apatite inorganic phosphorus during incineration of sewage sludge. Chemosphere 2015, 141, 57–61. [Google Scholar] [CrossRef] [PubMed]
  62. Nishigaki, T.; Tsujimoto, Y.; Rinasoa, S.; Rakotoson, T.; Andriamananjara, A.; Razafimbelo, T. Phosphorus uptake of rice plants is affected by phosphorus forms and physicochemical properties of tropical weathered soils. Plant Soil 2019, 435, 27–38. [Google Scholar] [CrossRef] [Green Version]
  63. Xu, G.; Sun, J.N.; Shao, H.B.; Chang, S.X. Biochar had effects on phosphorus sorption and desorption in three soils with differing acidity. Ecol. Eng. 2014, 62, 54–60. [Google Scholar] [CrossRef]
  64. Baigorri, R.; Francisco, S.S.; Urrutia, Ó.; García-Mina, J.M. Biochar-Ca and biochar-Al/-Fe-mediated phosphate exchange capacity are main drivers of the different biochar effects on plants in acidic and alkaline soils. Agronomy 2020, 10, 968. [Google Scholar] [CrossRef]
  65. Koopmans, G.F.; Chardon, W.J.; de Willigen, P.; van Riemsdijk, W.H. Phosphorus Desorption Dynamics in Soil and the Link to a Dynamic Concept of Bioavailability. J. Environ. Qual. 2004, 33, 1393. [Google Scholar] [CrossRef] [PubMed] [Green Version]
  66. Cheng, C.H.; Lehmann, J.; Engelhard, M.H. Natural oxidation of black carbon in soils: Changes in molecular form and surface charge along a climosequence. Geochim. Cosmochim. Acta 2008, 72, 1598–1610. [Google Scholar] [CrossRef]
  67. Hailegnaw, N.S.; Mercl, F.; Pračke, K.; Száková, J.; Tlustoš, P. Mutual relationships of biochar and soil pH, CEC, and exchangeable base cations in a model laboratory experiment. J. Soils Sediments 2019, 19, 2405–2416. [Google Scholar] [CrossRef]
  68. Lago, B.C.; Silva, C.A.; Melo, L.C.A.; de Morais, E.G. Predicting biochar cation exchange capacity using Fourier transform infrared spectroscopy combined with partial least square regression. Sci. Total Environ. 2021, 794, 148762. [Google Scholar] [CrossRef]
  69. Munera-Echeverri, J.L.; Martinsen, V.; Strand, L.T.; Zivanovic, V.; Cornelissen, G.; Mulder, J. Cation exchange capacity of biochar: An urgent method modification. Sci. Total Environ. 2018, 642, 190–197. [Google Scholar] [CrossRef] [Green Version]
  70. Herviyanti, H.; Maulana, A.; Prima, S.; Aprisal, A.; Crisna, S.D.; Lita, A.L.; Herviyanti, H. Effect of biochar from young coconut waste to improve chemical properties of ultisols and growth coffee [Coffea arabica L.] plant seeds. In IOP Conference Series: Earth and Environmental Science; Institute of Physics Publishing: Bristol, UK, 2020; Volume 497, p. 012038. [Google Scholar]
  71. Lee, J.W.; Kidder, M.; Evans, B.R.; Paik, S.; Buchanan, A.C.; Garten, C.T.; Brown, R.C. Characterization of biochars produced from cornstovers for soil amendment. Environ. Sci. Technol. 2010, 44, 7970–7974. [Google Scholar] [CrossRef] [Green Version]
  72. Veiga, T.R.L.A.; Lima, J.T.; de Abreu Dessimoni, A.L.; Pego, M.F.F.; Soares, J.R.; Trugilho, P.F. Different plant biomass characterization for biochar production. Cerne 2017, 23, 529–536. [Google Scholar] [CrossRef] [Green Version]
  73. Amery, F.; Smolders, E. Unlocking fixed soil phosphorus upon waterlogging can be promoted by increasing soil cation exchange capacity. Eur. J. Soil Sci. 2012, 63, 831–838. [Google Scholar] [CrossRef]
  74. Li, Y.; Hu, S.; Chen, J.; Müller, K.; Li, Y.; Fu, W.; Lin, Z.; Wang, H. Effects of biochar application in forest ecosystems on soil properties and greenhouse gas emissions: A review. J. Soils Sediments 2018, 18, 546–563. [Google Scholar] [CrossRef]
  75. Penn, C.J.; Camberato, J.J. A critical review on soil chemical processes that control how soil ph affects phosphorus availability to plants. Agriculture 2019, 9, 120. [Google Scholar] [CrossRef] [Green Version]
  76. Li, Y.; Wang, F.; Miao, Y.; Mai, Y.; Li, H.; Chen, X.; Chen, J. A lignin-biochar with high oxygen-containing groups for adsorbing lead ion prepared by simultaneous oxidization and carbonization. Bioresour. Technol. 2020, 307, 123165. [Google Scholar] [CrossRef]
  77. Dewi, W.S.; Prijono, S. Effect of high doses of rice husk biochar on soil physical properties and growth of maize on a typic kanhapludult. J. Tanah Sumberd. Lahan 2019, 6, 1157–1163. [Google Scholar] [CrossRef] [Green Version]
  78. Xiang, L.; Liu, S.; Ye, S.; Yang, H.; Song, B.; Qin, F.; Shen, M.; Tan, C.; Zeng, G.; Tan, X. Potential hazards of biochar: The negative environmental impacts of biochar applications. J. Hazard. Mater. 2021, 420, 126611. [Google Scholar] [CrossRef]
  79. Chen, J.-H. Barber Division s-4-soil fertility & plant nutrition. Soil Sci. Am. 1990, 54, 1032–1036. [Google Scholar] [CrossRef]
  80. Bolan, N.S. A critical review on the role of mycorrhizal fungi in the uptake of phosphorus by plants. Plant Soil 1991, 134, 189–207. [Google Scholar] [CrossRef]
  81. Riniarti, M.; Wahyuni, A.E. Surnayanti Soil inoculum heating impact on the ectomycorrhizal colonization ability of Shorea javanica roots. EnviroScienteae 2017, 13, 54–61. [Google Scholar] [CrossRef]
  82. Richardson, A.E.; Simpson, R.J. Soil microorganisms mediating phosphorus availability. Plant Physiol. 2011, 156, 989–996. [Google Scholar] [CrossRef] [PubMed] [Green Version]
  83. Seeling, B.; Zasoski, R.J. Microbial effects in maintaining organic and inorganic solution phosphorus concentrations in a grassland topsoil. Plant Soil 1993, 148, 277–284. [Google Scholar] [CrossRef]
  84. Leys, N.M.; Bastiaens, L.; Verstraete, W.; Springael, D. Influence of the carbon/nitrogen/phosphorus ratio on polycyclic aromatic hydrocarbon degradation by Mycobacterium and Sphingomonas in soil. Appl. Microbiol. Biotechnol. 2005, 66, 726–736. [Google Scholar] [CrossRef] [PubMed]
  85. Dalai, R.C. Soil Organic Phosphorus. Adv. Agron. 1977, 29, 83–117. [Google Scholar] [CrossRef]
  86. Hinsinger, P. Bioavailability of soil inorganic P in the rhizosphere as affected by root-induced chemical changes: A review. Plant Soil 2001, 237, 173–195. [Google Scholar] [CrossRef]
  87. Henderson, P.J.F. The 12-transmembrane helix transporters. Curr. Opin. Cell Biol. 1993, 5, 708–721. [Google Scholar] [CrossRef]
  88. Hasanuzzaman, M.; Fujita, M.; Oku, H.; Nahar, K.; Hawrylak-Nowak, B. Plant nutrients and abiotic stress tolerance. In Plant Nutrients and Abiotic Stress Tolerance; Springer Nature Singapore Pte: Singapore, 2018; pp. 171–190. ISBN 9789811090448. [Google Scholar]
  89. Seigneuret, M.; Devaux, P.F. ATP-dependent asymmetric distribution of spin-labeled phospholipids in the erythrocyte membrane: Relation to shape changes. Proc. Natl. Acad. Sci. USA 1984, 81, 3751–3755. [Google Scholar] [CrossRef] [PubMed] [Green Version]
  90. Stouthamer, A.H. A theoretical study on the amount of ATP required for synthesis of microbial cell material. Antonie Van Leeuwenhoek 1973, 39, 545–565. [Google Scholar] [CrossRef]
  91. Klingenberg, M. The ADP and ATP transport in mitochondria and its carrier. Biochim. Biophys. Acta-Biomembr. 2008, 1778, 1978–2021. [Google Scholar] [CrossRef] [PubMed] [Green Version]
Figure 1. (a) The design of the dome kiln, and (b) the preparation activities before the pyrolysis process.
Energies 15 02110 g001
Figure 2. (a) The plantation site design, and (b) application of biochar and soil in planting holes.
Energies 15 02110 g002
Figure 3. (a) P-total P, (b) organic-C, (c) CEC, and (d) pH in the five experimental treatments: dosage 0 t ha−1 (control), dosage 25 t ha−1 at 400 °C (D25T400), a dosage of 50 t ha−1 at a temperature of 400 °C (D50T400), dosage 25 t ha−1 at 600 °C (D25T600), and a dosage of 50 t ha−1 at a temperature of 600 °C (D50T600) after six months planted in the field. Different letters above the bars indicate statistically significant differences between the sampling times within the same treatment (p ≤ 0.05). Vertical bars represent the standard error of the mean.
Energies 15 02110 g003
Figure 4. (ae) correlation between Total P to organic-C, (fj) CEC, and (ko) pH in the five experimental treatments: dosage 0 t ha−1 (control), dosage 25 t ha−1 at 400 °C (D25T400), a dosage of 50 t ha−1 at a temperature of 400 °C (D50T400), dosage 25 t ha−1 at 600 °C (D25T600), and an amount of 50 t ha−1 at a temperature of 600 °C (D50T600) after six months planted in the field. The line indicated the slope and form of correlation between the two parameters.
Energies 15 02110 g004
Figure 5. P absorption on the leaf in the five experimental treatments: dosage 0 t ha−1 (control), dosage 25 t ha−1 at 600 °C (D25T400), a dosage of 50 t ha−1 at a temperature of 400 °C (D50T400), dosage 25 t ha−1 at 600 °C (D25T600), and a dosage of 50 t ha−1 at a temperature of 600 °C (D50T600) after six months planted in the field. Different letters above the bars indicate statistically significant differences between the sampling times within the same treatment (p ≤ 0.05). Vertical bars represent the standard error of the mean.
Energies 15 02110 g005
Figure 6. (a) correlation between P absorption on the leaf to height, and (b) diameter increment after six months planted in the field. The line indicated the slope and form of correlation between the two parameters.
Energies 15 02110 g006
Figure 7. (a) Height increment, and (b) Diameter increment in the five experimental treatments: dosage 0 t ha−1 (control), dosage 25 t ha−1 at 400 °C (D25T400), a dosage of 50 t ha−1 at a temperature of 400 °C (D50T400), dosage 25 t ha−1 at 600 °C (D25T600), and a dosage of 50 t ha−1 at a temperature of 600 °C (D50T600) after six months planted in the field. Different letters above the bars indicate statistically significant differences between the sampling times within the same treatment (p ≤ 0.05). Vertical bars represent the standard error of the mean.
Energies 15 02110 g007
Table 1. Shorea sp. biochar properties according to previous research [52].
PropertiesPyrolysis Temperature
400 °C600 °C
Ash content0.7602.52
Volatile matter42.6231.11
Fixed carbon56.6266.35
pH8.58.7
Table 2. Pearson correlation analysis of total P with organic-C, pH, and CEC.
ParameterTotal P
ControlT400D25T400D50T600D25T600D50
Organic-C0.5400.2920.8320.9370.885
pH0.7770.8960.7750.9540.894
CEC0.5890.969−0.0880.9480.412
Notes: dosage 0 t ha−1 (control), dosage 25 t ha−1 at 400 °C (D25T400), a dosage of 50 t ha−1 at a temperature of 400 °C (D50T400), dosage 25 t ha−1 at 600 °C (D25T600), and an amount of 50 t ha−1 at a temperature of 600 °C (D50T600).
Publisher’s Note: MDPI stays neutral with regard to jurisdictional claims in published maps and institutional affiliations.

