1. Introduction
Developing nations seek to increase capital inflows to boost economic growth because domestic savings are insufficient to fund their investment objectives. Foreign direct investment (FDI) is typically channeled through overseas businesses, and science and technology can be exchanged as mechanical contraptions. It is not easy to exchange technology in ideas and processes from one country to another. Whenever a multinational corporation (MNC) makes a financial investment in a host nation, innovative technologies and fresh ideas from the source country can be immediately transmitted and subsequently dispersed to the host country via MNCs. This transfer may also improve the host country’s production techniques (Degong et al., 2019) [
1]. Additionally, technology from other countries can assist in the upgrade of existing technology in a host country and lead to innovative research that produces new ideas and develops technological advances in the home nation (UNCTAD, 1999) [
2].
Currently, Pakistan’s economy is best equipped for growth and take-off. In the last 70 years, Pakistan has been a victim of three eras of inadequate financial development. In each of these periods, Pakistan has been unable to accomplish maintainable economic growth for a consistent period. The probability of success is higher this time than in the previous three instances because of the inauguration of the China Pakistan Economic Corridor (CPEC—Tehsin et al., 2017) [
3]. CPEC is a Chinese investment in Pakistan made under the Belt and Road Initiative (BRI), which further consists in the construction of roads, a dam, special economic zone, and ports. Moreover,
$36 billion dollars out of
$46 billion allocated is to consist of energy sector investment.
As per history, three periods of economic growth are observable. Neither of these periods, however, flourished into an age of justifiable monetary growth in Pakistan. Several factors impact the monetary growth and performance of a country. FDI has shown a considerable impact, generally in economies and especially in developing economies. There are two differing opinions, however, in this regard. First, the current security situation in our country poses a problem for economic growth regardless of socio-political steadiness. On the contrary, Pakistan’s GDP for the previous five years was approximately 4% and it is forecasted to be 5% for the upcoming 10 years. This base serves as a potential for progress in the long run. Moreover, China and Pakistan enjoy an enduring friendship. In spite of the financial advantages, enduring friendship, and a geostrategic advantage between Pakistan and China, the main reason behind extensive projects like the CPEC is self-interest. This research aims to determine the advantages of CPEC in terms of sustainable economic development in the context of Chinese FDI in Pakistan’s renewable energy sector. We propose that a procedure identical to Rostow’s economic take-off could lead to a path of sustainable economic growth. Thomas et al. (2009) [
4] found that investment by multinational organizations in a host country inflicts a burden of innovation and technological development on the resident firms. This phenomenon also describes the motivation of developing countries for the adoption of steps that invite FDI, which is required to fill the variance between savings and investment, a problem extensively faced by developing nations. As per Kobrin (2005) [
5] and Le and Ataullah (2002) [
6], the resulting influence includes creating employment prospects, increasing competition, transfer of technology, and greater efficiency. These advantages motivate developing countries like Pakistan to invite FDI. Many efforts have been made to evaluate the effects of FDI on growth to demonstrate the existence of such advantages. Nonetheless, the theories and empirical research on the influence of FDI on economic growth in developing nations reveal a complex pattern.
From 1966 to 2014, Jawaid (2016) examined the link between FDI and Pakistan’s economic development [
7]. He found that FDI has a strong impact on Pakistan’s short- and long-term economic growth using the autoregressive distributed lag error correction model (ARDL ECM) method. Khan (2015) [
8] looked at the relationship between FDI, the domestic banking sector, and economic growth in Pakistan from 1972 to 2005. He used the bound testing approach of co-integration proposed by Pesaran et al. (2001) [
9]. For both the long and short term, FDI positively affected economic growth, because the economic system had matured to a certain level (2001). The results also show that optimal conditions in the host country are not only advantageous in terms of attracting FDI, but also to reap its maximum benefits. Malik (2015) investigated the effects of FDI and trade openness for Pakistan’s economic growth [
10].
The objective of this paper is to ascertain the impact of Chinese FDI on Pakistan’s economic growth, using Chinese FDI in the form of CPEC and investment in the renewable energy sector. This study evaluates the impact of Chinese FDI on economic growth in the concurrence of seven variables: inflation, remittance, exchange rate, interest rate, renewable energy consumption, and trade openness. The remaining study is arranged as follows:
Section 2 presents the discussion on theoretical and empirical literature regarding the association between economic growth and Chinese FDI.
Section 3 provides the assessment of data, a description of the model, and of the variables.
Section 4 presents the empirical findings, while
Section 5 contains the inference of outcomes and the discussion of findings.
2. Literature Review
Endogenous growth theory (EGT) is an economic growth theory which states that economic growth can be created from inner sources of the economy. However, in the case of Pakistan, it has been a region with lucrative investment opportunities, controlled by British companies around 200 years ago. During the rule of Zulfiqar Ali Bhutto (in the 1970s), Pakistan saw extensive nationalization. With time, the emphasis shifted towards the need for privatization to catch up with the pace of globalization. However, Pakistan’s economy is facing problems, as it is not sufficiently mature to reap the benefits of globalization.
Lin and Ahmad (2017) looked at Pakistan as a case study, analyzing the potential for reducing energy-related CO
2 emissions across the country. They concluded that rapid economic growth and massive population change harmed the country’s sustainability agenda by increasing the country’s high mass level of CO
2 emissions [
11].
Khan et al. (2018) used annual time-series data from 1981 to 2015 to analyse the impact of renewable energy certificates (REC) on GHG emissions in Pakistan and found a negative association between the two variables [
12]. The findings suggest that RECs reduce GHG emissions significantly, with a one-to-one link between the two. Other factors, such as agricultural value-added and land reforms, further reduce GHG emissions, demonstrating the effectiveness of land use and renewable energy sources in reducing climate changes in a country.
2.1. Hypothesis Development
2.1.1. Chinese Foreign Direct Investment in Pakistan and Pakistan Economic Growth
China and Pakistan have had a long-lasting relationship over the last few decades. Initially, the flow of FDI to Pakistan was minor. However, the groundbreaking Belt and Road Initiative (BRI) led to the creation of the China-Pakistan Economic Corridor (CPEC) and an increase in the presence of Chinese MNCs. According to the Board of Investment Pakistan, Chinese investments in Pakistan increased from
$695.9 MM in 2014 to
$1002.9 MM in 2020. These figures show that Chinese investment constituted 69.8% of total FDI in 2014. Furthermore, 78% of investment were made in 2015–2016 and 89% were in 2016–2017. This FDI encouraged the attention of many researchers, such as Degong et al. (2019) [
1] and Ma et al. (2021) [
13], to assess the influence of the international source of funds on different sectors of Pakistan’s economy.
Mishal and Abulaila (2007) evaluated the influence of FDI and imports on economic growth in Jordan from 1976 to 2003 [
14]. The results show the existence of a dual directional association of output with FDI as well as with imports. The results prove the assumption of the growth of output caused by FDI and imports in the context of Jordan. Trevino et al. (2008) claimed that FDI applies pressure on local firms to innovate and bring about technological development, which might explain the motivation of developing countries to invite FDI [
15]. Developing countries are also prone to minimize the gap between savings and investment with FDI help. This FDI leads to the transmission of technology, new employment opportunities, higher productivity, and competition. Advantages like these motivate developing economies like Pakistan to take measures favoring FDI. Extensive research demonstrates FDI’s influence on economic growth. Yet empirical literature and theories present diverse results on such effects. Lee and Tcha (2004) claimed FDI to be the most effective path leading to economic growth [
16]. The majority of researchers found FDI to be a significant contributor to the host country’s economic growth. In 2002, the Organization of Economic Cooperation and Development (OECD) claimed that nations with weak economies consider that FDI is a country’s primary source of growth and advancement. Carkovic and Levine (2002) found that FDI is given considerable attention, especially by the governments of developing countries [
17]. This attention might be because developing countries depend on FDI as an important capital source, since they lack savings. Ford et al. (2008) found that countries employ the services of their respective public agencies that use public funds to attract foreign investments [
18]. Therefore, to attract FDI, governments are even ready to incur expenses. According to Hill (2000), FDI has a substantial effect on host nation economic growth through the transmission of technology and capital and management resources [
19]. He also found that these resources have the potential to expedite host country economic development. Most extraordinary is that such resources are only transferable to the host country with FDI help. Har Wai Mun et al. (2008) researched the link between FDI and economic growth in the context of Malaysia and found FDI to be a lucrative cause of economic development [
20]. Thus, FDI leads to a number of advantages for the host nation in terms of the creation of new employment opportunities, technological advancement, management resources, and competitive merchandise.
Prior to Colen et al. (2009), Iqbal et al. (2014) also conducted a study to find the relationship between FDI and GDP. Their findings proposed a significant impact on Pakistan’s economic growth [
21,
22]. Moreover, recent studies (Faisal et al., 2021; Ciobanu, 2021; Abdouli and Omri, 2021) have found a significant impact [
23,
24,
25]. Based on these arguments, we can hypothesize:
Hypothesis 1 (H1).
Chinese foreign direct investment, remittances, and trade openness have a significant impact on Pakistan’s economic growth.
2.1.2. The Relationship among Inflation, Interest Rates and GDP
According to Semuel and Stephanie (2014), economic growth can be defined as “an increase in the ability of a country or region in providing for the economic needs of the population” [
26], measured by GDP.
Abu Bakaar (2010) studied the relationship between the economic growth of Sierra Leone and the exchange rate [
27], analyzing data for the period 1990–2006. He carried out Granger causality tests to determine the effect of real effective exchange rates on the economic growth of Sierra Leone, finding a positive association. Yin and Wong (2000) discovered the impact of exchange rates on growth regarding five countries in Asia [
28]. Chen (2012) studied the contribution of exchange rates to economic growth for the period 1992–2008 for 28 provinces in China [
29]. The results prove that the economic growth of China is positively affected by real exchange rates. On the contrary, Danson Musyoki (2012) found that volatility in real exchange rates adversely affects economic growth [
30]. Semuel and Stephanie (2014) conducted a study of GDP, inflation, and exchange rates [
27]. Their study supports a direct relationship between GDP and exchange rates, with a negative relationship between inflation and GDP. Esther and Folorunso (2011) investigated the impact of FDI inflow on economic growth in Nigeria [
31].
Hypothesis 2 (H2).
Interest rates and inflation have a positive impact on Pakistan’s economic growth.
2.1.3. Renewable Energy, Trade Openness and Economic Growth
Inglesi-Lotz (2016) investigated the influence of renewable energy consumption on economic growth in four OECD nations, finding that renewable energy consumption had a considerable impact on economic development [
32]. Lin and Moubarak (2014) used the ARDL approach to find a link between renewable energy consumption in China and economic development, considering asymmetrical factors such as workforce and carbon dioxide emissions [
33]. Their research demonstrates that green energy use and economic growth have a long-term, multi-directional, causal relationship. According to their findings, China’s economic growth is advantageous to renewable energy generation, which is accountable for its economic progress. Eren et al. (2019) recently investigated the link between economic development, renewable energy usage, and economic progress [
34]. Their findings show that long-term financial development drives renewable energy usage, and that there is bidirectional causality between renewable energy usage and economic growth in India.
Over the last few decades, there has been a steady transition away from conventional to non-conventional energy sources. Because of the negative environmental impacts of traditional energy production and use, as well as the finite yields of conventional energy sources, the use of renewable energy sources (RESs) is becoming increasingly important. Renewable energy and economic growth have a positive relationship, as shown in a study conducted by Ntanos et al. (2018) “Renewable energy and economic growth [
35]: Evidence from European countries”. Apergis and Danuletiu (2014) carried out a study on renewable energy and economic growth: “Evidence from the sign of panel long-run causality” [
36]. Their research demonstrated that renewable energy is important for economic growth, and similarly, economic growth encourages the use of more renewable energy sources.
According to the findings of Koçak and Şarkgüneşi, A, (2017), there is an outstanding impact of renewable energy consumption on economic growth in Balkan and Black Sea countries [
37]. Fu et al. (2021), in a study entitled “Impact of Renewable Energy on Economic Growth and CO
2 Emissions—Evidence from BRICS Countries”, reached the conclusion that renewable energy has a positive impact on economic growth [
38].
Iqbal and Zahid (1998) discovered a positive relationship between trade openness and economic growth and a negative relationship between foreign debt and the budget deficit and productivity growth [
39]. Iqbal and Satar (2005) argue that remittances from foreign employees significantly positively impact economic growth [
40]. In a study of the factors of economic growth, Abou-Ali and Kheir-El-Din (2009) discovered that inflation harmed economic growth [
41]. In the context of factors impacting Africa’s economic growth, Anyanwu (2014) found that inflation has an adverse influence on economic growth [
42]. These findings are also consistent with those of Shamim and Mortaza (2010) but in the context of Bangladesh [
43]. On the other hand, Aslam and Awan (2018) claimed that inflation has a positive impact on economic growth [
44]. Kuttner and Mosser (2002) evaluated the US economy for the period 1950–2000, finding that a positive association exists between GDP growth and interest rates [
45]. As per De-Gregorio and Guidotti (1995), interest rates and economic growth are considered to have a non-monotonic association [
46]. Furthermore, the investment volume does not prove to be significant, but it is the efficiency of the financial sector that has a positive impact on economic growth. Prior empirical research on the influence of worker remittances on economic growth and poverty reduction is equivocal (Juthathip, 2007, 2019) [
47,
48]. Inglesi-Lotz (2016) investigated the influence of renewable energy consumption on economic growth in four OECD nations, finding that renewable energy consumption had a considerable impact on economic development [
33].
On the contrary, Fry (1998) found a nonlinear association between interest rates and economic growth in a few developing countries [
49]. He showed that the initial increase in interest rates encourages growth, but this growth slows at higher interest rates. Most studies found no significant relationship between the openness of the economy and its growth.
Based on this research, we can hypothesize:
Hypothesis 3 (H3).
There is a positive relationship between renewable energy and economic growth.
3. Research Methodology
3.1. Data
This research attempts to identify the nexus among remittances, trade openness, renewable energy, inflation, exchange rates, interest rates, Chinese FDI, and the economic growth of Pakistan by utilizing an ARDL model using data from 1990 to 2019. We analyzed data on remittances, trade openness, renewable energy, GDP, Chinese FDI, inflation, remittances, exchange rate, and interest rates from world direct investment (WDI). Economic growth is taken as a dependent variable, calculated from GDP. We selected as explanatory variables for the empirical research trade openness (measured as exports + imports/GDP) and inflation (measured by the consumer price index). Chinese FDI is computed as net inflows as a percentage of GDP, interest rates mean the discount rate, exchange rates are as published, renewable energy is measured as domestic credits to the private sector as a percentage of GDP, and remittances are measured as a percentage of GDP.
Table 1 is the details list of variables.
3.2. Methodology
This study explores the nexus between Pakistan’s economic growth and Chinese FDI, along with its determinants in Pakistan, using the ARDL methodology for the analysis. The main points are clearly outlined, and some details follow. We analyzed the data in a descriptive way to explain its characteristics, and then we pre-processed and analyzed information to make informed decisions regarding pre-processing and estimation. It is necessary to check for stationarity in a time series before proceeding to perform a cointegration test, since results would be inaccurate if a time series were not stationary. For the order of integration and stationarity of the variables, we used unit root tests. We found the ARDL model suitable for this investigation, since all variables were integrated at the highest order of I(0) and I(1). Before using the ARDL model, we employed the augmented Dickey–Fuller (Dickey and Fuller 1979) test to ensure stationarity. We used the following equation to check the variables’ relationships.
The association can be expressed in the following manner:
In regression form,
where β _1, β _2, and β _3 all indicate coefficients, and ε is the residual, while FDI means foreign direct investment; RE represents renewable energy; REM means remittances, TO is trade openness; GDP is gross domestic product; Exch rate indicates exchange rate; and Infl means inflation.
It is essential to check every time series for stationarity before carrying out cointegration tests, as the regression analysis produces spurious outcomes if a time series is non-stationary. In addition, one condition of the bounds testing method is that no single variable is integrated of order two, and they should have a mixed order of integration. We employ the ADF test for this reason. The general equations of ADF tests are written as follows:
where Δ denotes the difference operator;
α is the intercept;
t is a time index;
φ symbolizes the coefficient donating process root, i.e., concentrate on testing;
γ is the coefficient on a time trend; m represents the number of lags of the autoregressive model; and
ε_t is random error.
Autoregressive distributed lag bounds test:
We use the bounds test with the dynamic simulated ARDL technique to assess the long-run relationship between variables. We tested the long-run relationship between the variables in this study using the ARDL bound test for cointegration. The following is the model equation that we used:
where the symbol Δ indicates the first difference term: RE means renewable energy consumption,
Exch rate represents Exchange rate,
TO means trade openness,
REM means Remittance, GDP is gross domestic product,
Infl indicates inflation,
Exch rate indicates exchange rate, and
IR means interest rate.
t−1 connotes the best lag choices based on Akaike’s information criteria. We investigate the long-run relationships of variables in the preceding equation. The following are the ARDL bound test null hypotheses and alternative hypotheses:
4. Results
The estimated findings of F statistics determine whether the null hypothesis is accepted or rejected. Long-run connections occur within the research variables when the values of F statistics are higher than the values of upper limits. Meanwhile, there are no prolonged connections when the F-statistic values are smaller than the bottom limit (Pesaran et al., 2001). However, if the values are in-between the top and lower boundaries, the result will be faltering. We assume the lower limit critical values are integrated of order zero, or I(0), whereas the upper bound critical values are considered to be integrated of order one, or I(1), according to Pesaran et al. (2001). As a result, if the estimated F-statistic is more than the upper critical boundaries, the null hypothesis should be rejected. We can determine that the selected variables have a long-run relationship.
4.1. Descriptive Statistics
Before going to the statistical analysis of the time series data, we carry out a detailed statistical analysis of the selected variables in Pakistan. We observe from the following
Table 2 that GDP in Pakistan between 1990 and 2019 ranges from the maximum and minimum of 7.705898 and 0.988829, respectively, with an average of 4.163441 and a standard deviation of 1.766379. Further, Chinese FDI has a range from 6.186882 to 0.966308 with values of mean and standard deviation being 3.319297 and 1.383434, respectively. The mean value for the exchange rate is 68.33615 with a standard deviation of 32.93966. The mean value for the interest rate (IR) is 0.428710 with a standard deviation of 3.051067. Moreover, the exchange rate variable has the highest standard deviation of 32.93966 with a range value from a minimum of 21.70738 to a maximum of 150.0363.
4.2. Unit Root Testing
It is critical to determine the order in which selected variables are integrated. For this purpose, we performed an augmented Dicky–Fuller test. The augmented Dicky–Fuller test (ADF), which reveals that GDP, Chinese FDI, RE, IR, GDP, REM, Infl, and TO are not stationary at a 5% level of significance, is essential to maintain that the study’s variables are stationary and integrated at the highest level of I(0) or I (1). As two of the series are stationary at this level and the remaining variables become stationary in the first difference, there is now room to employ the ARDL bounds test for cointegration (
Table 3). The ARDL model may be used since all of the variables in this research are stationary and integrated at least I(0) and I(1).
The results of the ARDL bound tests and F statistics are shown in
Table 4.
4.3. ARDL Bounds Test
We used the ARDL bound tests to look at the long-term relationships between variables. The value of F statistics is greater than the upper bound value at the 10%, 5%, 2.5%, and 1% levels of significance, indicating that all variables in this study are cointegrated.
4.4. Lag Selection
Table 5 demonstrates the lag order selection criteria acquired from the unrestricted VAR. Most criteria have selected one lag for the empirical analysis.
4.5. ARDL Long-Run Results
Table 6 shows the output of the long-term relationship between the dependent and explanatory variables. The findings indicate that Chinese FDI has a considerable and robust impact on Pakistan’s economic growth (Khathlan, 2012; Antwi et al., 2013), and others back up our findings. Almsafir (2014) examined a wide range of research and concluded that FDI has a favorable and considerable impact on economic growth [
50,
51,
52]. Foreign direct investment from China is one of the most important elements influencing the Chinese rate of economic growth.
Furthermore, the study finds strong evidence of a positive and significant nexus between exchange rates and economic growth in Pakistan. The results are inconsistent with the study performed by Janus and Riera-Crichton (2015), which indicated that exchange rates are negatively correlated with economic growth [
53]. In this way, the states that implement flexible exchange rate regimes have a satisfactory economic performance, and variability of the exchange rate encourages their growth. In both theoretical and empirical studies, the impacts of exchange rates on economic growth did not indicate any clear-cut nexus between them. Moreover, inflation (INFL) also has a statistically insignificant association in the long run with Pakistan’s economic growth. The results are inconsistent with Muzindutsi (2017) [
54]. Our findings also indicate that, in the long run, the influx of remittances has a negative and statistically significant relationship with economic growth.
The negative outcome implies that an appropriate scale of remittances is spent on non-productive activities such as consumption. This spending pattern suggests that remittances are driven by philanthropy rather than gain. Remittances can help Pakistan by increasing local consumption and decreasing poverty. The inflow of remittances can increase the poor’s income levels and hence assist them in escaping poverty. As a result, remittances are more valuable to poverty reduction than economic growth. Our findings are consistent with Ratha (2013) [
55]. The findings support the prevailing wisdom that foreign exchange rates and economic growth are linked, so much so that a rise in foreign exchange rates boosts net export volume and, as a result, fosters economic development by raising overall demand. Therefore, renewable energy usage has a long-term favorable and significant association with Pakistan’s economic growth. This empirical result is in line with the findings of Kutan et al. (2018) [
56].
Secondly, the data show that trade openness is statistically significant with long-term economic growth. The statistical significance of trade openness we discovered is consistent with other studies (Feruni and Hysa 2020) [
57]. This demonstrates that increasing exports and importing necessary inputs for increased manufacturing contributes to the economic growth process. Moreover, interest rates (IR) have a long-term impact on economic growth in Pakistan. Our findings are similar to the results of Hayat et al. (2021) [
58].
The findings of the error correction term are given in
Table 7.
4.6. Error Correction Term
The ECT coefficient being negative and highly significant at a 1 percent level is further evidence of the stable long-term association between dependent and independent variables. The estimated ECT magnitude of −1.33 suggests that short-term dis-equilibrium be rectified at a rate of 1.33%. The lags of GDP and FDI inflow are positive and significant in the short run, which clearly demonstrates that both lags significantly contribute to augmenting economic growth. Further, the findings postulated no significant relationship between renewable energy (RE) and economic growth in the short run. In addition, the lag of trade openness (TO) has a positive and significant nexus with Pakistan’s short-term economic growth.
4.7. Sensitivity Analysis
Table 8 displays the results of various diagnostic statistical tests, including the Breush–Godfrey LM, Breusch–Pagan–Godfrey, and Jarque–Bera tests. We used all these tests to evaluate the model’s reliability. The Breusch–Godfrey LM test demonstrates that the model is free of serial correlations. The Breusch–Pagan–Godfrey test shows that there is no issue of heteroscedasticity, whereas the Jarque–Bera test shows that the estimated model residuals are normal. Furthermore, we cannot reject the null hypothesis of the heterogeneity test because the
P-value is greater than 5%, indicating that the data are homogenous.
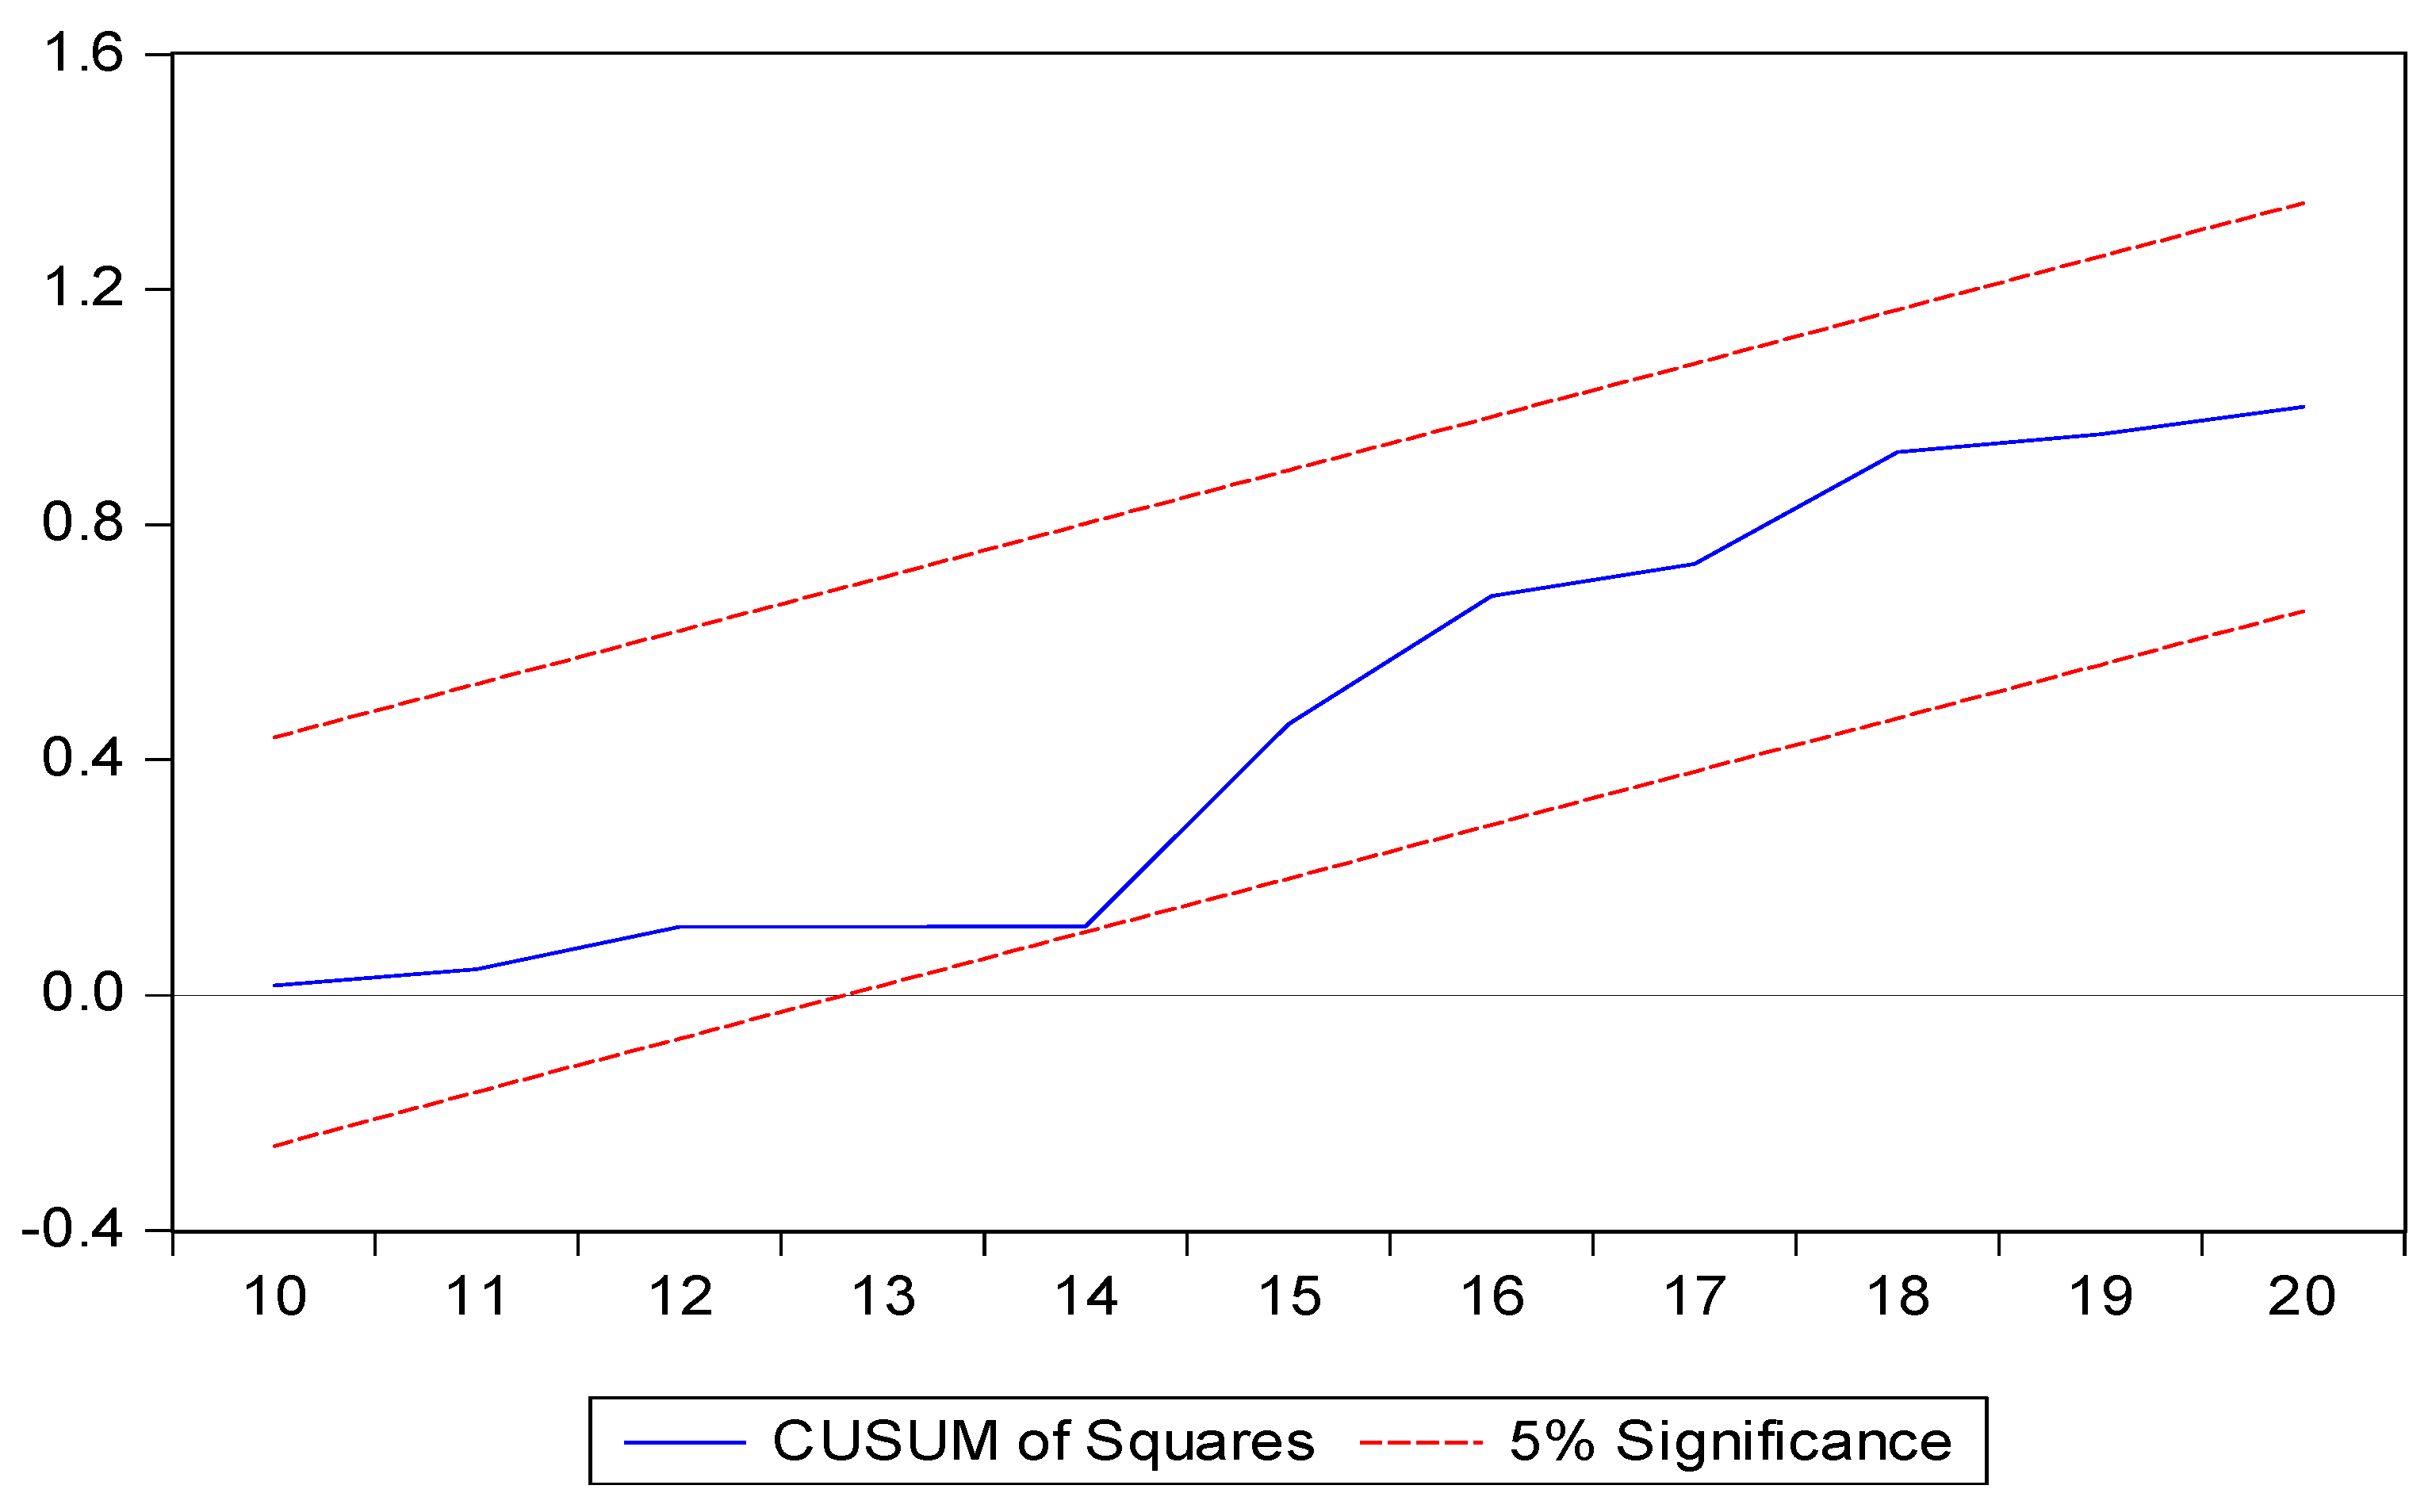
We used the CUSUM (please see
Figure 1) and CUSUM of squares graphs (please see
Figure 2) to determine whether the coefficients are stable. The blue lines are in the middle of the red lines in the graphs above, indicating that coefficients are stable at the 5% level of significance, and the models utilized in this study are correct.
5. Conclusions and Policy Recommendations
This research paper seeks to establish a new theoretical framework that describes how the inflow of Chinese FDI triggers an increase in Pakistan’s economic growth. The hypothesis is based on the premise that inflows of Chinese FDI positively impact Pakistan’s economic growth. This article attempts to identify the nexus between remittances, trade openness, interest rates, exchange rates, renewable energy consumption, and Pakistan’s economic growth by utilizing the ARDL bounds test model using time series data from 1990 to 2019. We summarize our findings below. In the present research article, we checked the stationarity of the variables through augmented Dicky–Fuller tests and concluded that some of the variables are stationary at level and some variables become stationary on the first difference. The stationarity tests reported mixed results of the variables, and this provided room to employ cointegration tests for the long-run nexus. The ARDL bounds cointegration test indicated that there is a long-run equilibrium among remittances, trade openness, IR, exchange rates, renewable energy consumption, and GDP. For the short-run results, we also performed the error correction model (ECM) model after ARDL. The ECM was also negative and significant and confirmed a long-run relationship between remittances, trade openness, IR, Chinese FDI, exchange rates, renewable energy consumption, and GDP, and thus long-run associations.
Furthermore, the ARDL findings show that the influence of Chinese FDI is positive and significant on economic growth in Pakistan. Moreover, the study finds strong evidence that there is a positive and significant nexus between exchange rates and economic growth in Pakistan, whereas inflation (INFL) also has a statistically insignificant association in the long run with Pakistan’s economic growth. The results further revealed that the inflow of remittances contributes positively and statistically to economic growth. Thus, the findings provide evidence of an association between exchange rates and economic growth in the long run. Moreover, the findings indicate that trade openness has been found to be statistically significant with economic growth in the long run. Meanwhile, interest rates (IR) also have a significant effect in the long run on Pakistani economic growth. The ARDL findings indicate that the coefficient of Chinese FDI is positive and has a noteworthy impact on Pakistani economic growth.
Policy Implications
Consequently, 1% growth in Chinese FDI leads to a 0.2907% rise in Pakistan’s economic growth. Foreign direct investment is one of the most crucial aspects impacting the amount of economic growth. Thus, policymakers should support it to promote growth. As a result, it is fundamental to safeguard the country’s long-term development through the many initiatives launched under the CPEC umbrella. Pakistan should be conscious of the importance of creating jobs amongst the country’s population. Such Chinese FDI will result in more job prospects for Pakistanis and an uplift in the country’s ailing economy. More exporting and importing, useful for more production, has been determined to be statistically significant, indicating that trade openness is indeed helping with the process of economic growth. Moreover, this research recommends that the Government of Pakistan should boost the process of trade openness if they want to develop more quickly in the long term. Trade openness should be promoted by reducing tariff rates and non-tariff taxes on trade. The Pakistani central authorities should employ sound foreign and educative policies to attract FDI, as well as to produce more job opportunities. According to conventional wisdom, foreign exchange rates and Pakistan’s economic growth are strongly intertwined. As a result, an increase in foreign exchange rates boosts net export volume and, as a result, stimulates economic growth by raising overall demand. Pakistani policymakers should emphasize migration policies, which need modification for appropriate implementation, and the prolific use of remittances to protect economic growth. Moreover, policymakers should control interest rates since they help to lessen the negative effects of instability on growth. Hence, the contribution to economic growth is closely associated to global trade and investments.
We have identified a few policy implications based on the results of our research. We suggest that policymakers of the Government of Pakistan should continue the policies of providing incentives in the form of tax deductions, subsidies, etc. so that renewable sources of energy become more attractive for business. Their economic influence in the long run, both on the economy and government policies concerning the advancement of alternate energy sources, could not be unnoticed. Furthermore, our findings strongly suggest the importance of renewable energy sources, as such sources not only reduce the pressure on policymakers regarding the improvement of the environment, but would also improve the economic growth of the country.
For the long-term economic benefits of FDI in Pakistan, we make the following suggestions. To encourage more FDI, policymakers should create a favorable and welcoming climate for foreign investors. Policymakers should provide more incentives to foreign investors for technology transfer to the host country. These policies would help to lubricate local businesses. Import-substitution policy-related FDI could be beneficial to Pakistan.
6. Limitation of This Research
Time is a major constraint for all types of research. In this study, we used yearly data for all variables. However, some results may change with those of other scholars’, e.g., if we get monthly data for some variables like exchange rates, inflation, etc. In the future, we are planning to use the same variables for many emerging economies. Panel data will help all the emerging economies to understand the effect of macro-economic variables in cross border activities.
Author Contributions
Conceptualization, E.I.S., D.Y., F.U. and W.E.L.; methodology, E.I.S., I.U. and F.U.; software, E.I.S.; validation, M.S.A., E.I.S., I.U. and F.U.; formal analysis., D.Y. and F.U.; investigation, F.U and I.U.; resources M.S.A., E.I.S. and I.U.; writing—original draft preparation, E.I.S.; writing—review and editing, M.S.A. and W.E.L.; visualization, I.U; supervision, E.I.S. and D.Y.; project administration, E.I.S.; funding acquisition, D.Y. All authors have read and agreed to the published version of the manuscript.
Funding
This paper is supported by a major project of National Social Science Foundation of China (17ZDA045), “A Study on the Influence of the Security Pattern of the Countries around the Bay of Bengal on the Implementation of “Belt and Road Initiative” in China and The major project of the Key Research Base of Humanities and Social Sciences of the Ministry of Education, “Research on Political and Legal Environment and ‘Belt and Road’ Initiative Construction in South Asian Countries” (16JJDGJW014).Funding: There is no financial sponsorship or assistance for these writers to publish.
Institutional Review Board Statement
Not applicable.
Informed Consent Statement
Not applicable.
Data Availability Statement
Data is available on request.
Conflicts of Interest
The authors declare no conflict of interest.
References
- Degong, M.; Ullah, F.; Khattak, M.S.; Anwar, M. Do International Capabilities and Resources Configure Firm’s Sustainable Competitive Performance? Research within Pakistani SMEs. Sustainability 2018, 10, 4298. [Google Scholar] [CrossRef] [Green Version]
- Available online: https://unctad.org/webflyer/world-investment-report-1991 (accessed on 10 February 2020).
- Tehsin, M.; Khan, A.A.; Sargana, T.U.H. CPEC and sustainable economic growth for Pakistan. Pak. Vis. 2017, 18, 102–118. [Google Scholar]
- Thomas, H.; Li, X.; Liu, X. Ownership structure and new product development in transnational corporations in China. Transnatl. Corp. Rev. 2009, 17, 17–44. [Google Scholar]
- Kobrin, S.J. The determinants of liberalization of FDI policy in developing countries: A cross-sectional analysis, 1992–2001. Transnatl. Corp. 2005, 14, 67–104. [Google Scholar]
- Le, M.H.; Ataullah, A. Foreign capital and economic performance of Pakistan. Lahore J. Econ. 2002, 7, 1–32. [Google Scholar] [CrossRef]
- Jawaid, S.T.; Raza, S.A.; Mustafa, K.; Karim, M.Z.A. Does inward foreign direct investment lead export performance in Pakistan? Glob. Bus. Rev. 2016, 17, 1296–1313. [Google Scholar] [CrossRef]
- Khan, M.A. Foreign direct investment and economic growth: The role of domestic financial sector. Econ. Bull. 2015, 37, 361–376. [Google Scholar]
- Pesaran, M.H.; Shin, Y.; Smith, R.J. Bounds testing approaches to the analysis of level relationships. J. Appl. Econom. 2001, 16, 289–326. [Google Scholar] [CrossRef]
- Malik, K. Impact of foreign direct investment on economic growth of Pakistan. Am. J. Bus. Manag. 2015, 4, 190–202. [Google Scholar] [CrossRef] [Green Version]
- Lin, B.; Ahmad, I. Analysis of energy related carbon dioxide emission and reduction potential in Pakistan. J. Clean. Prod. 2017, 143, 278–287. [Google Scholar] [CrossRef]
- Khan, M.T.I.; Ali, Q.; Ashfaq, M. The nexus between greenhouse gas emission, electricity production, renewable energy and agriculture in Pakistan. Renew. Energy 2018, 118, 437–445. [Google Scholar] [CrossRef]
- Degong, M.; Ullah, F.; Ullah, R.; Arif, M. An empirical nexus between exchange rate and China’s outward foreign direct investment: Implications for Pakistan under the China Pakistan economic corridor project. Q. Rev. Econ. Financ. 2020; in press. [Google Scholar] [CrossRef]
- Mishal, Z.; Abulaila, Z. The impact of foreign direct investment and imports on economic growth: The case of Jordan. J. Econ. Adm. Sci. 2007, 23, 1–31. [Google Scholar] [CrossRef]
- Trevino, L.J.; Thomas, D.E.; Cullen, J. The three pillars of institutional theory and FDI in Latin America: An institutionalization process. Int. Bus. Rev. 2008, 17, 118–133. [Google Scholar] [CrossRef]
- Lee, M.; Tcha, M. The color of money: The effects of foreign direct investment on economic growth in transition economies. Rev. World Econ. 2004, 140, 211–229. [Google Scholar] [CrossRef] [Green Version]
- Levine, R.; Carkovic, M. Finance and growth: New evidence and policy analyses for Chile. Cent. Bank Chile 2002, 157, 343–376. [Google Scholar]
- Ford, T.C.; Rork, J.C.; Elmslie, B.T. Foreign direct investment, economic growth, and the human capital threshold: Evidence from US states. Rev. Int. Econ. 2008, 16, 96–113. [Google Scholar] [CrossRef]
- Hill, C.W. Global Business Plan & Resource CD-Rom for Use with International Business Competing in the Global Marketplace; McGraw-Hill: New York, NY, USA, 2000. [Google Scholar]
- Har, W.M.; Teo, K.L.; Yee, K.M. FDI and economic growth relationship: An empirical study on Malaysia. Int. Bus. Res. 2008, 1, 11–18. [Google Scholar]
- Iqbal, N.; Ahmad, N.; Haider, Z.; Anwar, S. Impact of foreign direct investment (FDI) on GDP: A Case study from Pakistan. Int. Lett. Soc. Humanist. Sci. 2014, 16, 73–80. [Google Scholar] [CrossRef] [Green Version]
- Hansen, H.; Rand, J. On the causal links between FDI and growth in developing countries. World Econ. 2006, 29, 21–41. [Google Scholar] [CrossRef] [Green Version]
- Faisal, F.; Rahman, S.U.; Chander, R.; Ali, A.; Ramakrishnan, S.; Ozatac, N.; Ullah, M.N.; Tursoy, T. Investigating the nexus between GDP, oil prices, FDI, and tourism for emerging economy: Empirical evidence from the novel fourier ARDL and hidden cointegration. Resour. Policy 2021, 74, 102368. [Google Scholar] [CrossRef]
- Ciobanu, A.M. The Impact of FDI on Economic Growth in Case of Romania. Int. J. Econ. Financ. 2021, 12, 1–81. [Google Scholar] [CrossRef]
- Abdouli, M.; Omri, A. Exploring the nexus among FDI inflows, environmental quality, human capital, and economic growth in the Mediterranean region. J. Knowl. Econ. 2021, 12, 788–810. [Google Scholar] [CrossRef]
- Semuel, H.; Nurina, S. Analysis of the Effect of Inflation, Interest Rates, and Exchange Rates on Gross Domestic Product (GDP) in Indonesia. Ph.D. Thesis, Petra Christian University, Surabaya, Indonesia, 2014. [Google Scholar]
- Saddiq, S.A.; Bakar, A.S.A. Impact of economic and financial crimes on economic growth in emerging and developing countries. J. Financ. Crime 2019, 26, 910–920. [Google Scholar] [CrossRef]
- Cheung, Y.W.; Wong, C.Y.P. A survey of market practitioners’ views on exchange rate dynamics. J. Int. Econ. 2000, 51, 401–419. [Google Scholar] [CrossRef] [Green Version]
- Chen, J. Real exchange rate and economic growth: Evidence from Chinese provincial data (1992–2008). Hum. Soc. Sci. 2012, 56, 494–513. [Google Scholar]
- Musyoki, D.; Kadubo, A.S. The impact of credit risk management on the financial performance of banks in Kenya for the period. Int. J. Bus. Public Manag. 2012, 2, 72–80. [Google Scholar]
- Adegbite, E.O.; Ayadi, F.S. The role of foreign direct investment in economic development: A study of Nigeria. World J. Entrep. Manag. Sustain. Dev. 2011, 6, 133–147. [Google Scholar] [CrossRef]
- Inglesi-Lotz, R. The impact of renewable energy consumption to economic growth: A panel data application. Energy Econ. 2016, 53, 58–63. [Google Scholar] [CrossRef] [Green Version]
- Lin, B.; Moubarak, M. Renewable energy consumption–economic growth nexus for China. Renew. Sustain. Energy Rev. 2014, 40, 111–117. [Google Scholar] [CrossRef]
- Eren, B.M.; Taspinar, N.; Gokmenoglu, K.K. The impact of financial development and economic growth on renewable energy consumption: Empirical analysis of India. Sci. Total Environ. 2019, 663, 189–197. [Google Scholar] [CrossRef] [PubMed]
- Ntanos, S.; Skordoulis, M.; Kyriakopoulos, G.; Arabatzis, G.; Chalikias, M.; Galatsidas, S.; Batzios, A.; Katsarou, A. Renewable Energy and Economic Growth: Evidence from European Countries. Sustainability 2018, 10, 2626. [Google Scholar] [CrossRef] [Green Version]
- Apergis, N.; Danuletiu, D.C. Renewable energy and economic growth: Evidence from the sign of panel long-run causality. Int. J. Energy Econ. Policy 2014, 4, 578. [Google Scholar]
- Koçak, E.; Şarkgüneşi, A. The renewable energy and economic growth nexus in Black Sea and Balkan countries. Energy Policy 2017, 100, 51–57. [Google Scholar] [CrossRef]
- Fu, Q.; Álvarez-Otero, S.; Sial, M.S.; Comite, U.; Zheng, P.; Samad, S.; Oláh, J. Impact of Renewable Energy on Economic Growth and CO2 Emissions—Evidence from BRICS Countries. Processes 2021, 9, 1281. [Google Scholar] [CrossRef]
- Iqbal, Z.; Zahid, G.M. Macroeconomic determinants of economic growth in Pakistan. Pak. Dev. Rev. 1998, 37, 125–148. [Google Scholar] [CrossRef] [Green Version]
- Iqbal, Z.; Sattar, A. The contribution of workers’ remittances to economic growth in Pakistan. In Working Papers & Research Reports; Pakistan Institute of Development: Islamabad, Pakistan, 2010; Volume 187. [Google Scholar]
- Abou-Ali, H.; Kheir-El-Din, H. Inflation and Growth in Egypt: Is there a Threshold Effect? Middle East Dev. J. 2009, 1, 59–78. [Google Scholar] [CrossRef]
- Anyanwu, J.C. Factors Affecting Economic Growth in Africa: Are There Any Lessons from CHINA? Afr. Dev. Rev. 2014, 26, 468–493. [Google Scholar] [CrossRef]
- Ahmed, S.; Mortaza, M.G. Inflation and economic growth in Bangladesh: 1981–2005. eSocialSciences 2010, 34, 33–41. [Google Scholar]
- Aslam, M.; Awan, A.G. Impact of monetary policy on economic growth: Evidence from Pakistan. Glob. J. Manag. Soc. Sci. Humanit. 2002, 4, 89–109. [Google Scholar]
- Kuttner, K.N.; Mosser, P.C. The monetary transmission mechanism: Some answers and further questions. In Economic Policy Review; Federal Reserve Bank of New York: New York, NY, USA, 2002; Volume 8. [Google Scholar]
- De Gregorio, J.; Guidotti, P.E. Financial development and economic growth. World Dev. 1995, 23, 433–448. [Google Scholar] [CrossRef]
- Jongwanich, J.; Kohpaiboon, A. Workers’ Remittances, Capital Inflows, and Economic Growth in Developing Asia and the Pacific. Asian Econ. J. 2019, 33, 39–65. [Google Scholar] [CrossRef] [Green Version]
- UN ESCAP. Workers’ remittances, economic growth and poverty in developing Asia and the Pacific countries. In ESCAP Work. Paper; United Nations Economic and Social Commission for Asia and the Pacific: Bangkok, Thailand, 2007. [Google Scholar]
- Fry, M.J. Savings, investment, growth and financial distortions in Pacific Asia and other developing areas. Int. Econ. J. 1998, 12, 1–24. [Google Scholar]
- Al Khathlan, K. The link between remittances and economic growth in Pakistan: A boon to economic stability. J. Econ. Manag. Trade 2012, 2, 167–185. [Google Scholar] [CrossRef] [PubMed]
- Antwi, S.; Mills, E.F.E.A.; Mills, G.A.; Zhao, X. Impact of foreign direct investment on economic growth: Empirical evidence from Ghana. Int. J. Acad. Res. Account. Financ. Manag. Sci. 2013, 3, 18–25. [Google Scholar]
- Almfraji, M.A.; Almsafir, M.K. Foreign direct investment and economic growth literature review from 1994 to 2012. Procedia-Soc. Behav. Sci. 2014, 129, 206–213. [Google Scholar] [CrossRef] [Green Version]
- Janus, T.; Riera-Crichton, D. Real exchange rate volatility, economic growth and the Euro. J. Econ. Integr. 2015, 30, 148–171. [Google Scholar] [CrossRef] [Green Version]
- Bonsu, C.O.; Muzindutsi, P.F. Macroeconomic determinants of household consumption expenditure in Ghana: A multivariate cointegration approach. Int. J. Econ. Financ. Issues 2017, 7, 737–745. [Google Scholar]
- Ratha, D. The impact of remittances on economic growth and poverty reduction. Policy Brief 2013, 8, 1–13. [Google Scholar]
- Kutan, A.M.; Paramati, S.R.; Ummalla, M.; Zakari, A. Financing renewable energy projects in major emerging market economies: Evidence in the perspective of sustainable economic development. Emerg. Mark. Financ. Trade 2018, 54, 1761–1777. [Google Scholar] [CrossRef] [Green Version]
- Feruni, N.; Hysa, E.; Panait, M.; Rădulescu, I.G.; Brezoi, A. The Impact of Corruption, Economic Freedom and Urbanization on Economic Development: Western Balkans versus EU-27. Sustainability 2020, 12, 9743. [Google Scholar] [CrossRef]
- Hayat, M.A.; Ghulam, H.; Batool, M.; Naeem, M.Z.; Ejaz, A.; Spulbar, C.; Birau, R. Investigating the Causal Linkages among Inflation, Interest Rate, and Economic Growth in Pakistan under the Influence of COVID-19 Pandemic: A Wavelet Transformation Approach. J. Risk Financ. Manag. 2021, 14, 277. [Google Scholar] [CrossRef]
| Publisher’s Note: MDPI stays neutral with regard to jurisdictional claims in published maps and institutional affiliations. |
© 2022 by the authors. Licensee MDPI, Basel, Switzerland. This article is an open access article distributed under the terms and conditions of the Creative Commons Attribution (CC BY) license (https://creativecommons.org/licenses/by/4.0/).


 ,
, 

