Article

A Collaborative Optimization Model for Integrated Energy System Considering Multi-Load Demand Response

1
State Grid Economic and Technological Research Ifigurenstitute Co., Ltd., Beijing 102209, China
2
Department of Economics and Management, North China Electric Power University, Beijing 102206, China
*
Author to whom correspondence should be addressed.
Energies 2022, 15(6), 2033; https://doi.org/10.3390/en15062033
Submission received: 8 January 2022 / Revised: 16 February 2022 / Accepted: 8 March 2022 / Published: 10 March 2022

Abstract

:
The integrated demand response strategy participates in the coordinated operation of the integrated energy system, which can effectively improve the flexibility and stability of the system operation. This paper adopts a multiple load demand response strategy to guide users’ energy consumption habits. Firstly, the cooperative operation structure of integrated energy system considering comprehensive demand response is designed by analyzing the characteristics of multiple loads. Secondly, according to the interactive relationship between the output exchange power and the demand response adjustment of units, a two-stage collaborative optimization model is established. Finally, results show that considering the demand response of electricity-heat-gas load requires higher output power flexibility of the generators and enhances the ability of the system to participate in the demand response. The overall economic benefit of the system can be improved, but the comprehensive satisfaction of users will be reduced.

1. Introduction

In 2021, China put forward the “30 and 60” double carbon development goals, accelerating the energy revolution focusing on carbon reduction [1,
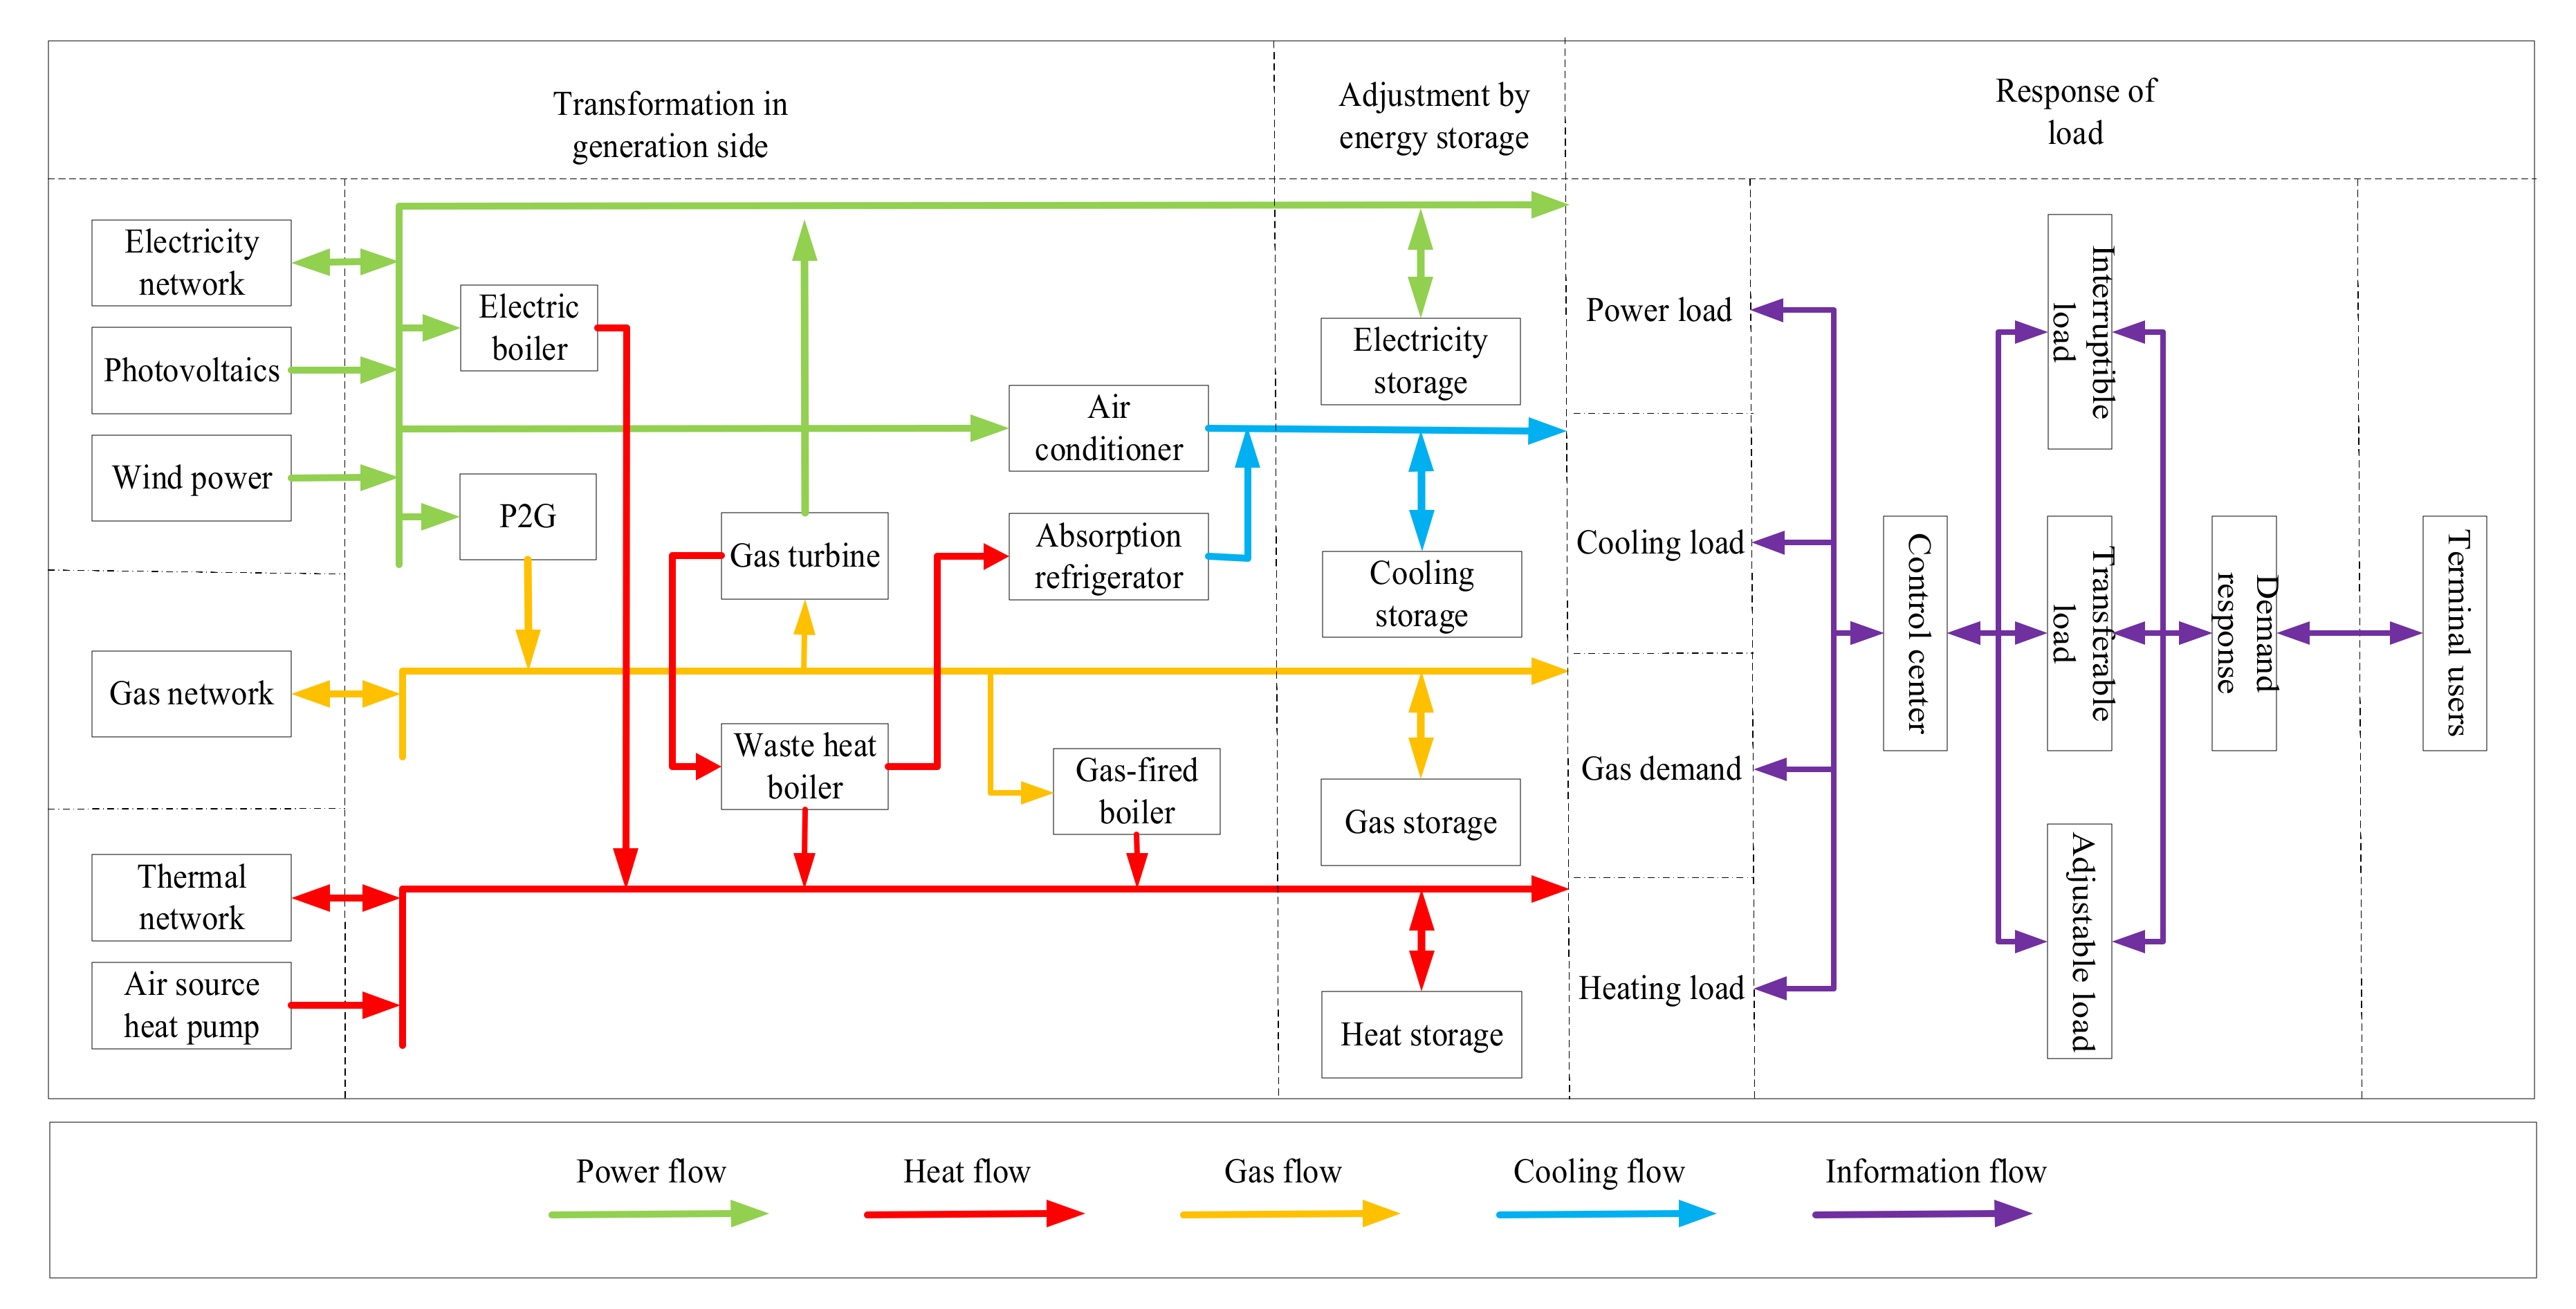
2]. As an important technology for integrating multiple types of energy resources such as electricity, heat, cooling and gas, and breaking the traditional single energy development, the integrated energy system realizes the complementarity, mutual assistance, coordination and optimization of multiple energy sources, and can also meet various load requirements [3]. However, due to the complex multi-energy structure and the response rate of different energy sources, the coordinated operation and scheduling of integrated energy system (IES) is more difficult.
Since 2015, China has comprehensively promoted the pilot project of demand-side management and achieved remarkable results by adopting demand response technology and considering the load characteristics and energy storage technology of end-users [4]. However, with the deep coupling development of electricity, heat, cooling and gas, demand response technology is not limited to the reduction or stabilization of electric load, but gradually transformed into the demand of electricity, heat, cooling and gas, which puts forward the concept of integrated demand response technology [5]. Compared with the traditional demand response technology, the integrated demand response technology improves the interactive content, ability and benefit of the demand response of multiple loads by reducing or increasing the demand of electricity, heat, cooling and gas. When participating in the integrated demand response technology, various users adopt the incentive mechanism or energy price mechanism to guide various end users to change the energy consumption mode, improve the overall utilization rate of multi energy and reduce the operation cost [6].
In this context, considering the multi-load demand response technology to participate in the coordinated optimal operation scheduling of the IES, and refining the energy demand of various users into interruptible load, transferable load and adjustable load, it is a direction to study the operation change of the system.
At present, many scholars have studied the collaborative optimal scheduling of the IES, mainly aiming at the lowest total cost of the system [7,8,9,10,11,12,13,14], the maximum energy efficiency [7,11], the maximum user satisfaction [9,14], the minimum risk [12], and the minimum carbon emission [10,13]. Amirmohammad Behzadi et al. [7] considered photovoltaic equipment, double effect conversion equipment, absorption refrigerator, geothermal device and cooling equipment, and constructed a multi-objective optimization model of IES with the lowest total operating cost and the highest energy efficiency, which was solved by genetic algorithm. Li Y. et al. [8] analyzed the operation problem of community IES in uncertain environments and established a hierarchical stochastic optimal scheduling model with the goal of minimizing the operation cost. Zhang N. et al. [9] proposed a two-stage multi-objective optimization model for the 
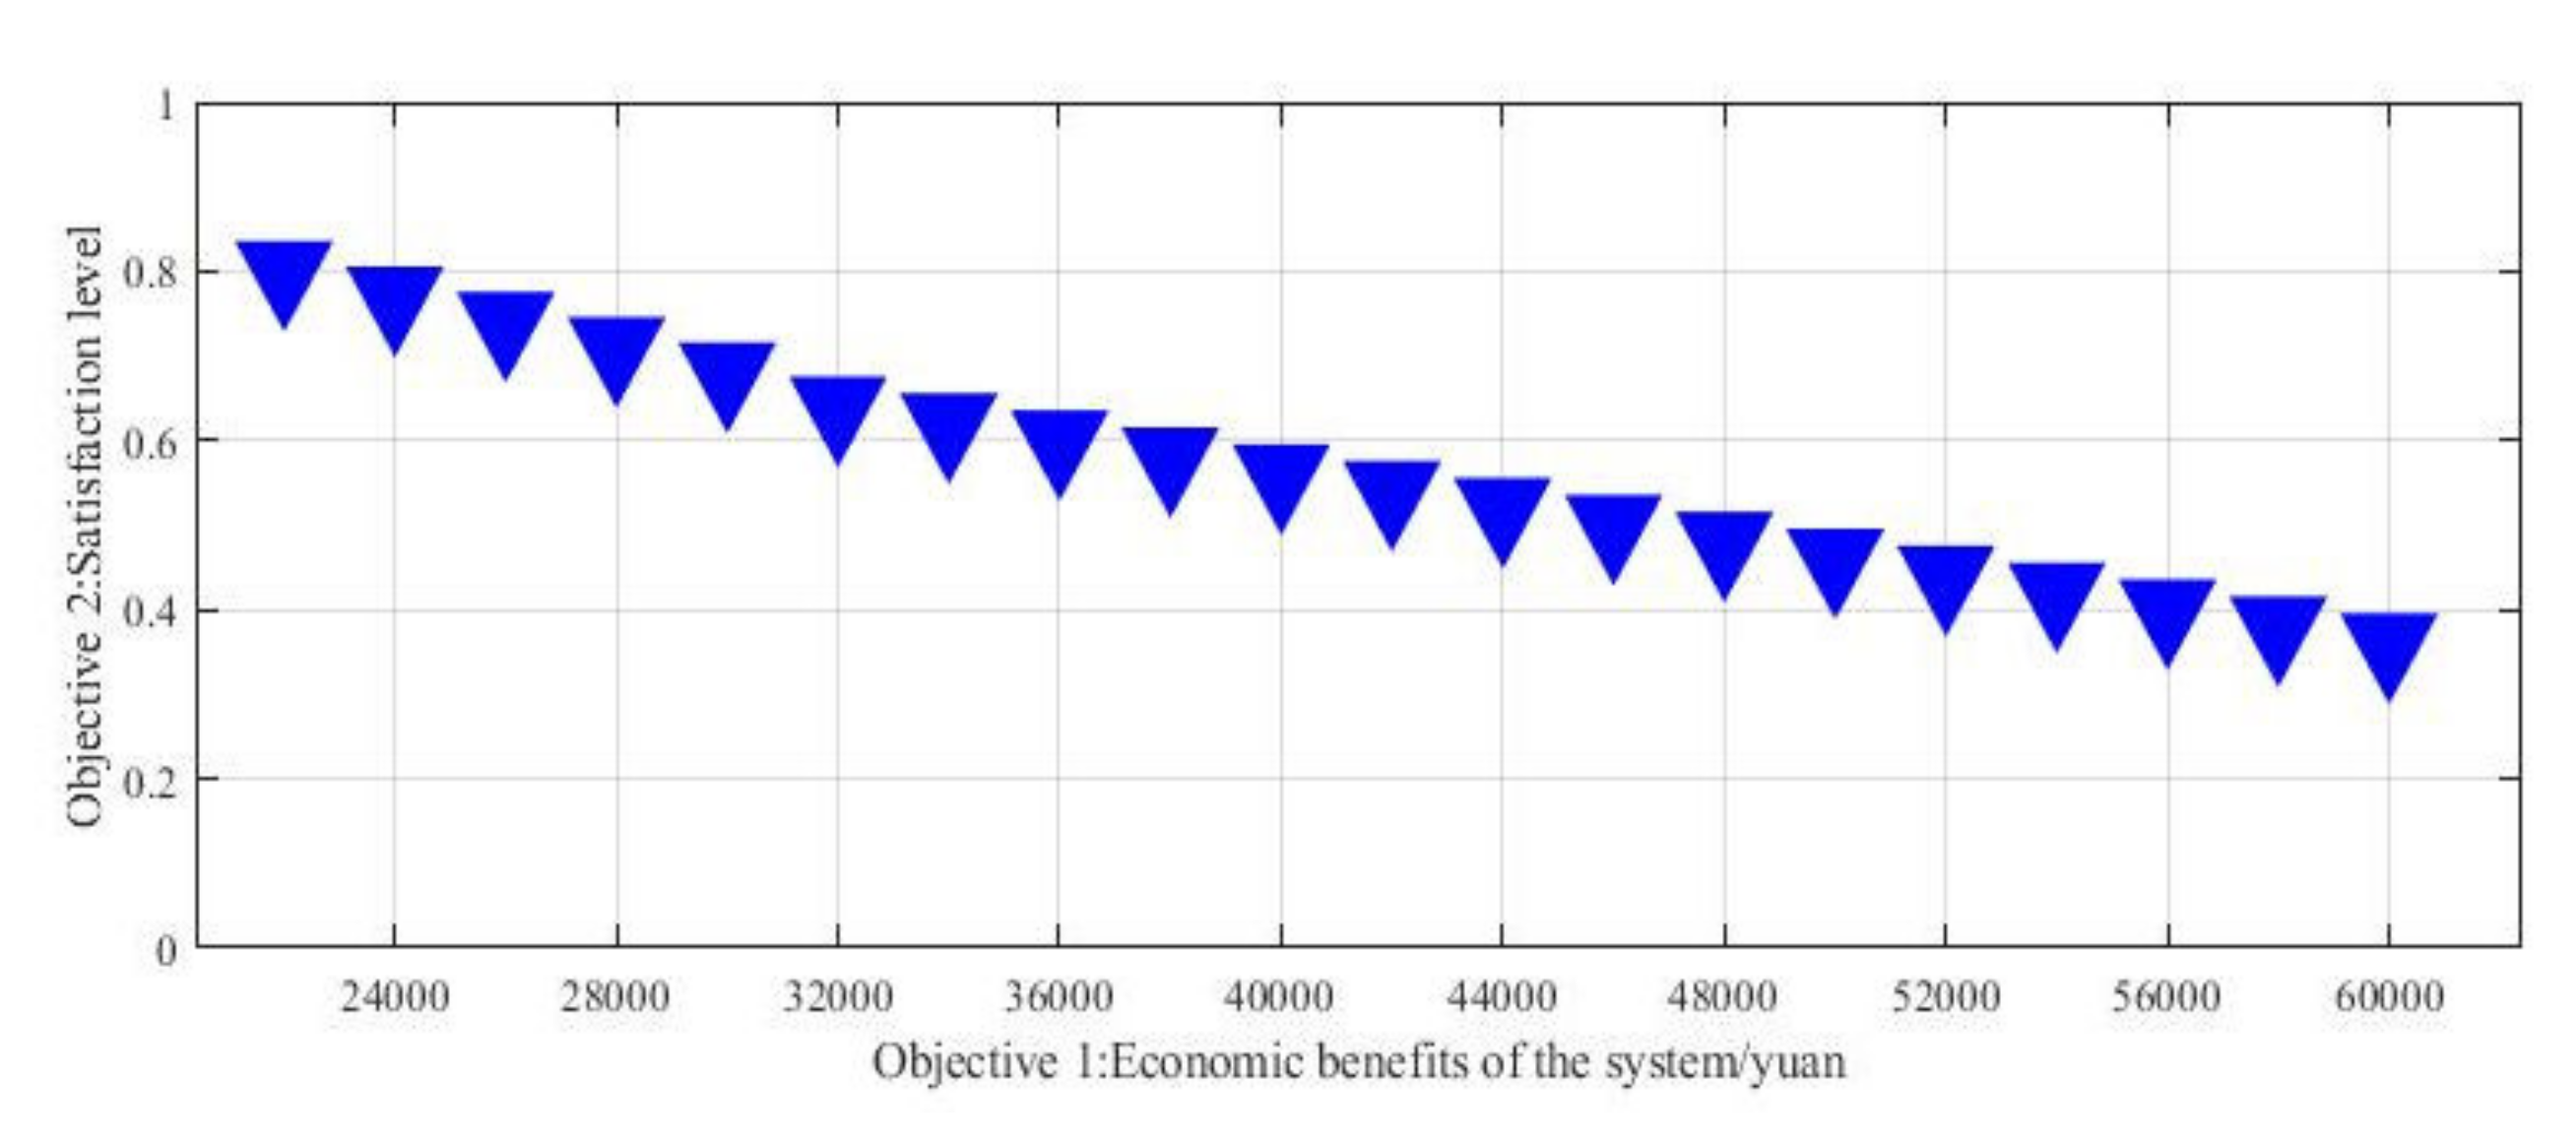
IES, in which the first stage focuses on the economic benefits of system operation and scheduling and user satisfaction, and the second stage focuses on reducing the impact of renewable energy prediction error, so as to ensure the real-time power balance of the system. Zhou, X.R. et al. [10] aimed at the lowest carbon dioxide emission and economic cost, proposed an IES optimal scheduling model considering the combination of low-carbon and economic operation, and used particle swarm optimization algorithm to solve the multi-objective optimization model. Wang, L.X. et al. [11] established a two-level optimization model of IES and optimized the operation scheduling strategy, based on the operation structure composed of energy conversion equipment, energy supply network and consumers. Wei. F. et al. [12] introduced the interval variable method to deal with the uncertain problems caused by the grid connection of wind power and photovoltaic, established the regional IES optimization model with the lowest investment cost and risk as the goal, and solved the multi-objective problem of the system under uncertainty by using the search optimization algorithm with adaptive covariance matrix and chaotic search. Shan, J.N. et al. [13] aimed at the lowest daily power generation dispatching cost and daily environmental pollutant treatment cost and proposed a multi-objective optimization model of cogeneration microgrid, which balanced the economic benefits and environmental friendliness of the system. Chen, H.P. et al. [14] proposed a multi-objective optimization model of microgrid system under opportunity constraint rules, aiming at minimizing system operation cost and maximizing user improvement. Although in the above works, multi-energy collaborative optimal scheduling models are constructed by analyzing the coupling relationship between various energy subsystems of comprehensive energy, few studies have discussed the refinement of various loads of users and the change of energy consumption habits.
Integrated demand response (IDR) is an extension of power demand response strategy [14]. Sun et al. [15] analyzed the problems of IDR technology participating in multi-energy system, based on the complementary relationship between energy subsystems and considering the comfort of end users. Yuan et al. [16] considered the real-time electricity price, proposed a two-level optimization model of IES with IDR technology, reduced the system operation cost and improved the user welfare, and obtained the optimal energy allocation strategy. Yang et al. [17] introduced the IDR strategy into the optimal scheduling of IES, which improved the economy and flexibility of the system. Chen, et al. [18] considered the price-based demand response technology, analyzed the timing transmission and energy substitution of energy, established a general model of micro energy system, and verified that the energy substitution characteristics can reflect the consumption behavior of users. Liu, N. et al. [19] integrated thermoelectric energy system based on cogeneration unit and demand response mechanism and proposed a hybrid energy sharing framework of multi-microgrid. However, the IES involves multiple energy systems, which leads to different coordination strategies under different demand response mechanisms. Li et al. [20] aimed at tapping the potential of source load interaction, considered the power consumption comfort of users and the actual schedulable margin in the dispatching interval of building system, and established the optimal dispatching model of energy storage and interruptible load. Zhao et al. [21] established a demand response model considering transferable load to optimize the day-ahead, hour-ahead and real-time dispatches of power system, based on the uncertainty of flexible load response and consumer psychology. Wang et al. [22] took the heating load as an adjustable load and applied it to the operation scheduling optimization of heating power plants under the environment of power market and established a two-stage optimal method for day-ahead and real-time scheduling with the participation of heat load in regulation. Xie et al. [23] considered the characteristics of heat storage and release of pipe network, interruptible electric load and adjustable load of charged side boiler and constructed the source-network-load coordination optimization model of electric-heating system. The above research not only shows that the introduction of demand response strategy can reduce the operation cost of the system, but also change the energy consumption habits of users, but lacks the analysis and discussion under the condition of considering multiple types of loads.
To sum up, most of the existing research achievements focus on the coordinated operation and scheduling optimization of IES, and do not deeply consider the impact of various load demand response technologies of electricity, heat, cooling and gas. However, in the actual working conditions, the IES collaborative optimization scheduling under the IDR technology has more flexibility and space. Therefore, this paper refines the load type and studies the IDR technology in the collaborative optimal scheduling of IES. The specific innovations are represented as follows:
(1)
Based on the demands of multiple loads on the user side, this paper uses the IDR technology to participate in the coordinated and optimal dispatching operation of the IES, and uses interruptible, transferable and adjustable loads to change the energy load curve to maximize the satisfaction of energy consumption.
(2)
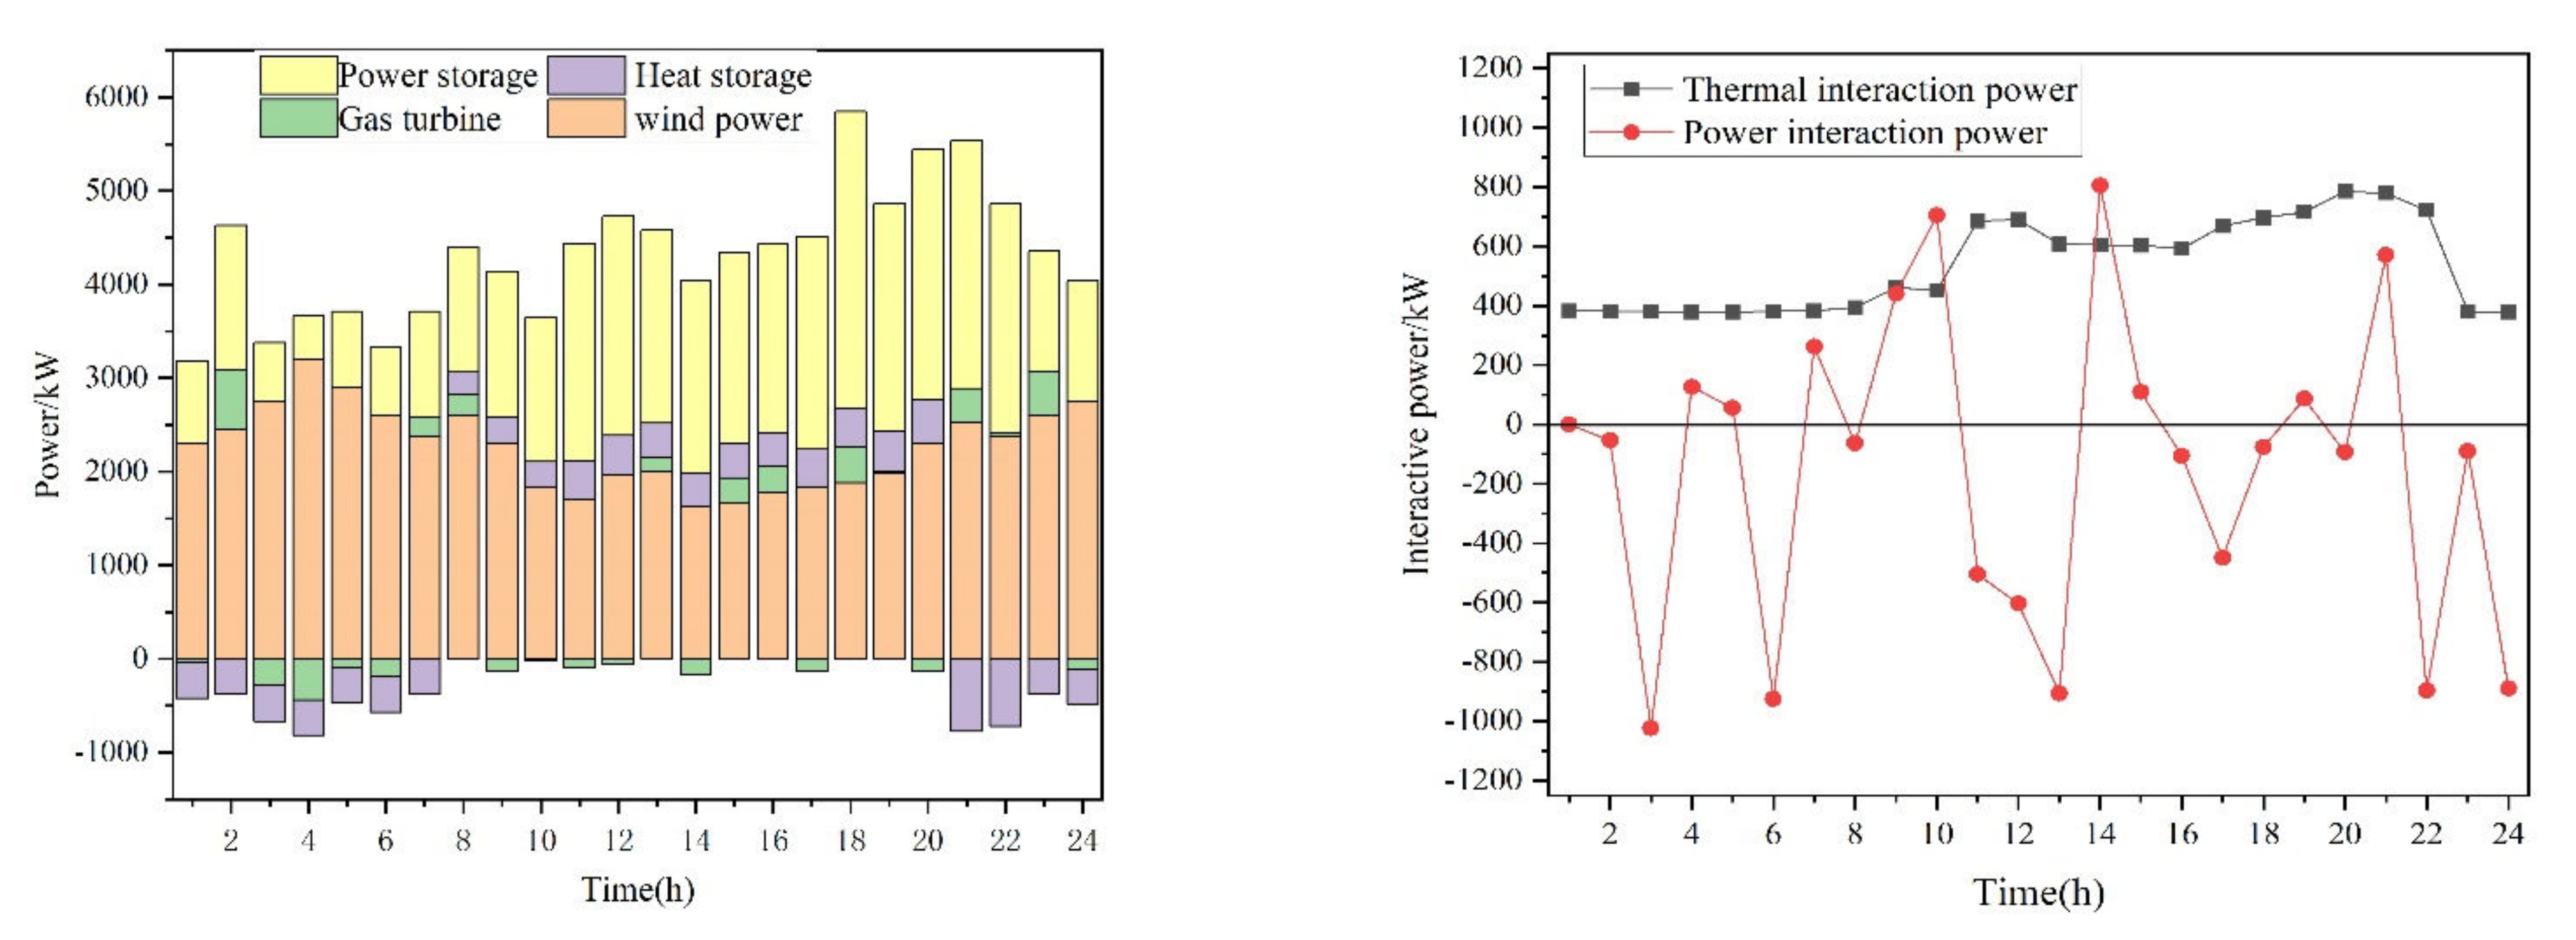
In this paper, a two-stage collaborative optimization model is established under the condition that the IDR technology participates in the collaborative optimization scheduling of IES. In the first stage of the daily dispatching model, according to the forecasted prices of daily electricity, heat, gas, user load and renewable energy power generation, the daily economic operation of the system is conducted, and the best output strategy for the system to respond to the power grid and heat supply network is established. In the second stage of the hour-ahead unit output scheduling model, based on the planned output curve of the day-ahead strategy, the real-time electricity price and the output of renewable energy units are predicted, and the day-ahead economic cooperative operation plan is adjusted in real time, so as to realize the system collaborative optimization and formulate the electric-heating demand response strategy, reduce the hour-ahead output deviation of the system and increase intermittent energy consumption.
(3)
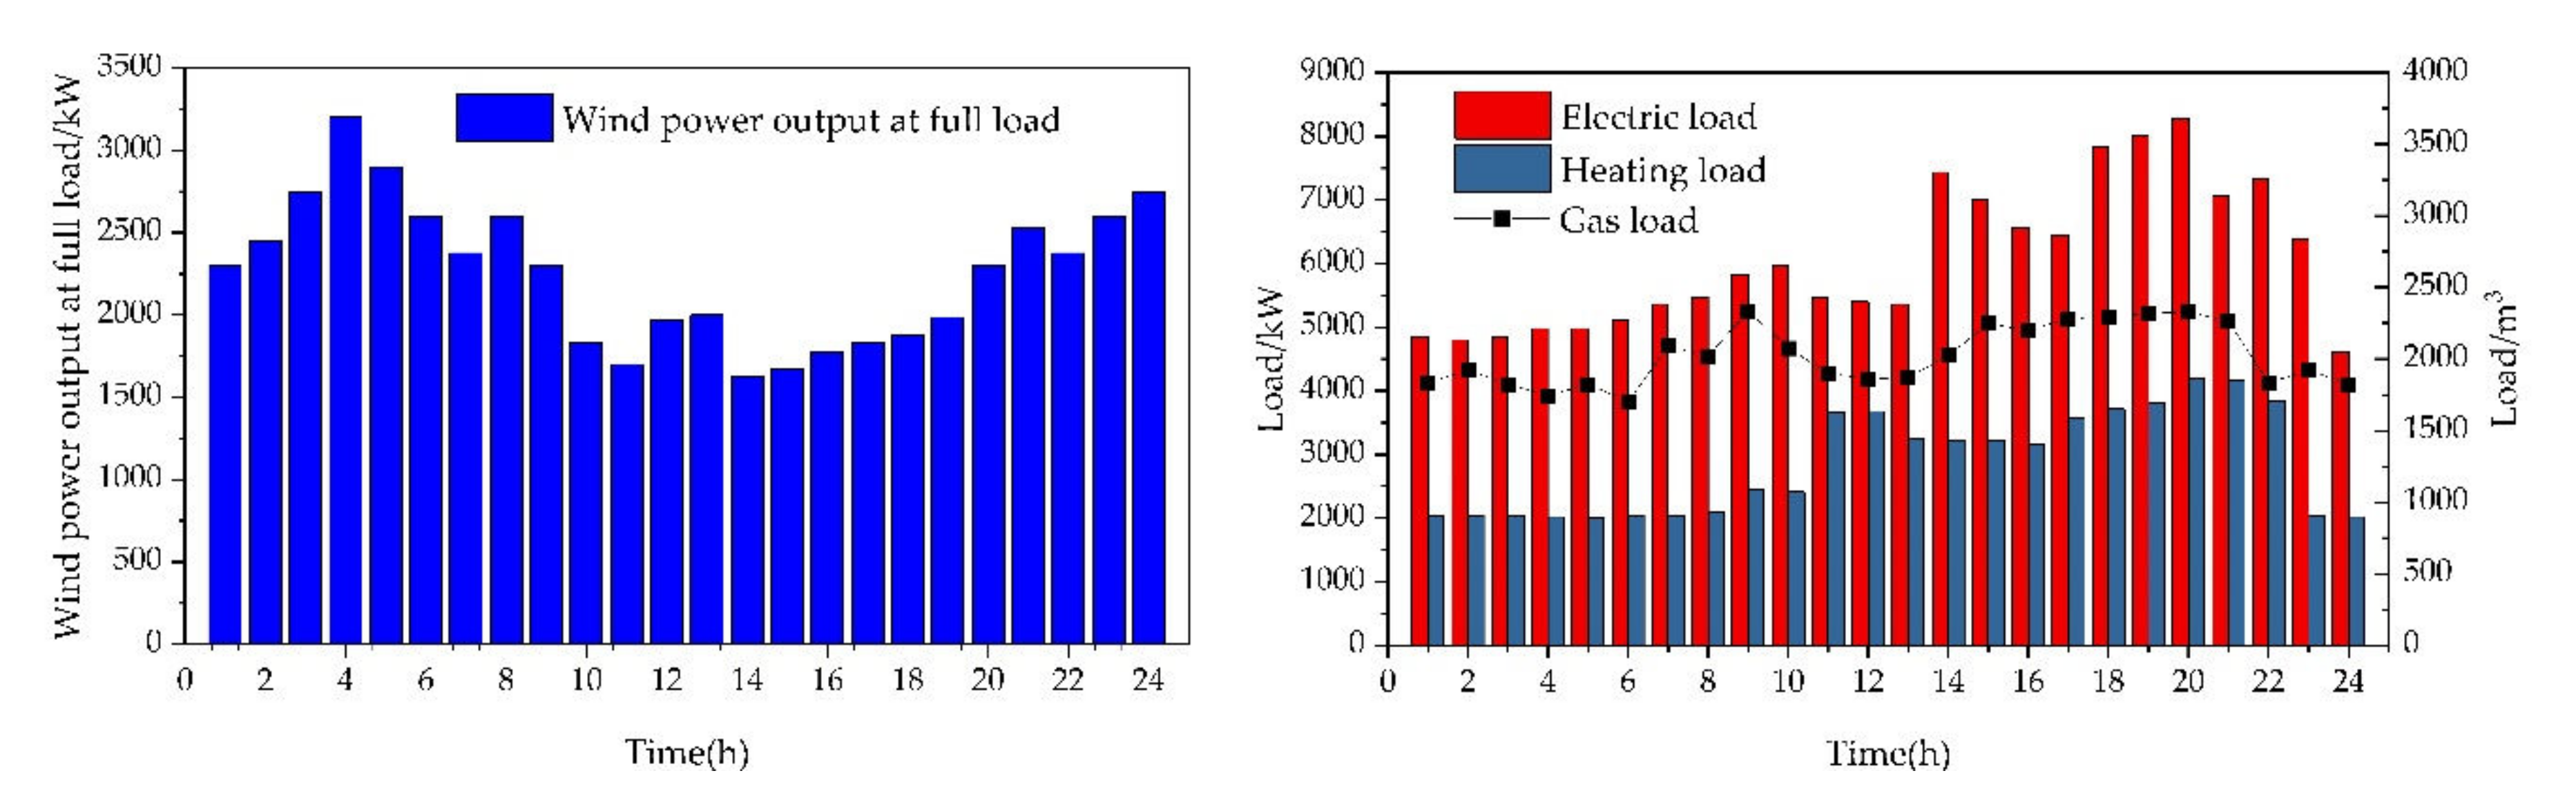
In this paper, a typical comprehensive energy demonstration base is selected for example analysis. The results show that under the multi-load of electricity, heat, cooling and gas, the IDR technology, which is involved in the collaborative optimization operation of the IES, can effectively improve the energy utilization efficiency and renewable energy utilization level of the system.
The rest of this paper is organized as follows. Analyzing the operation of IES under multi-load response strategy in Section 2; Considering the interactive relationship of IES operation under multi-load demand response strategy and establishing a two-stage optimization model of IES in 
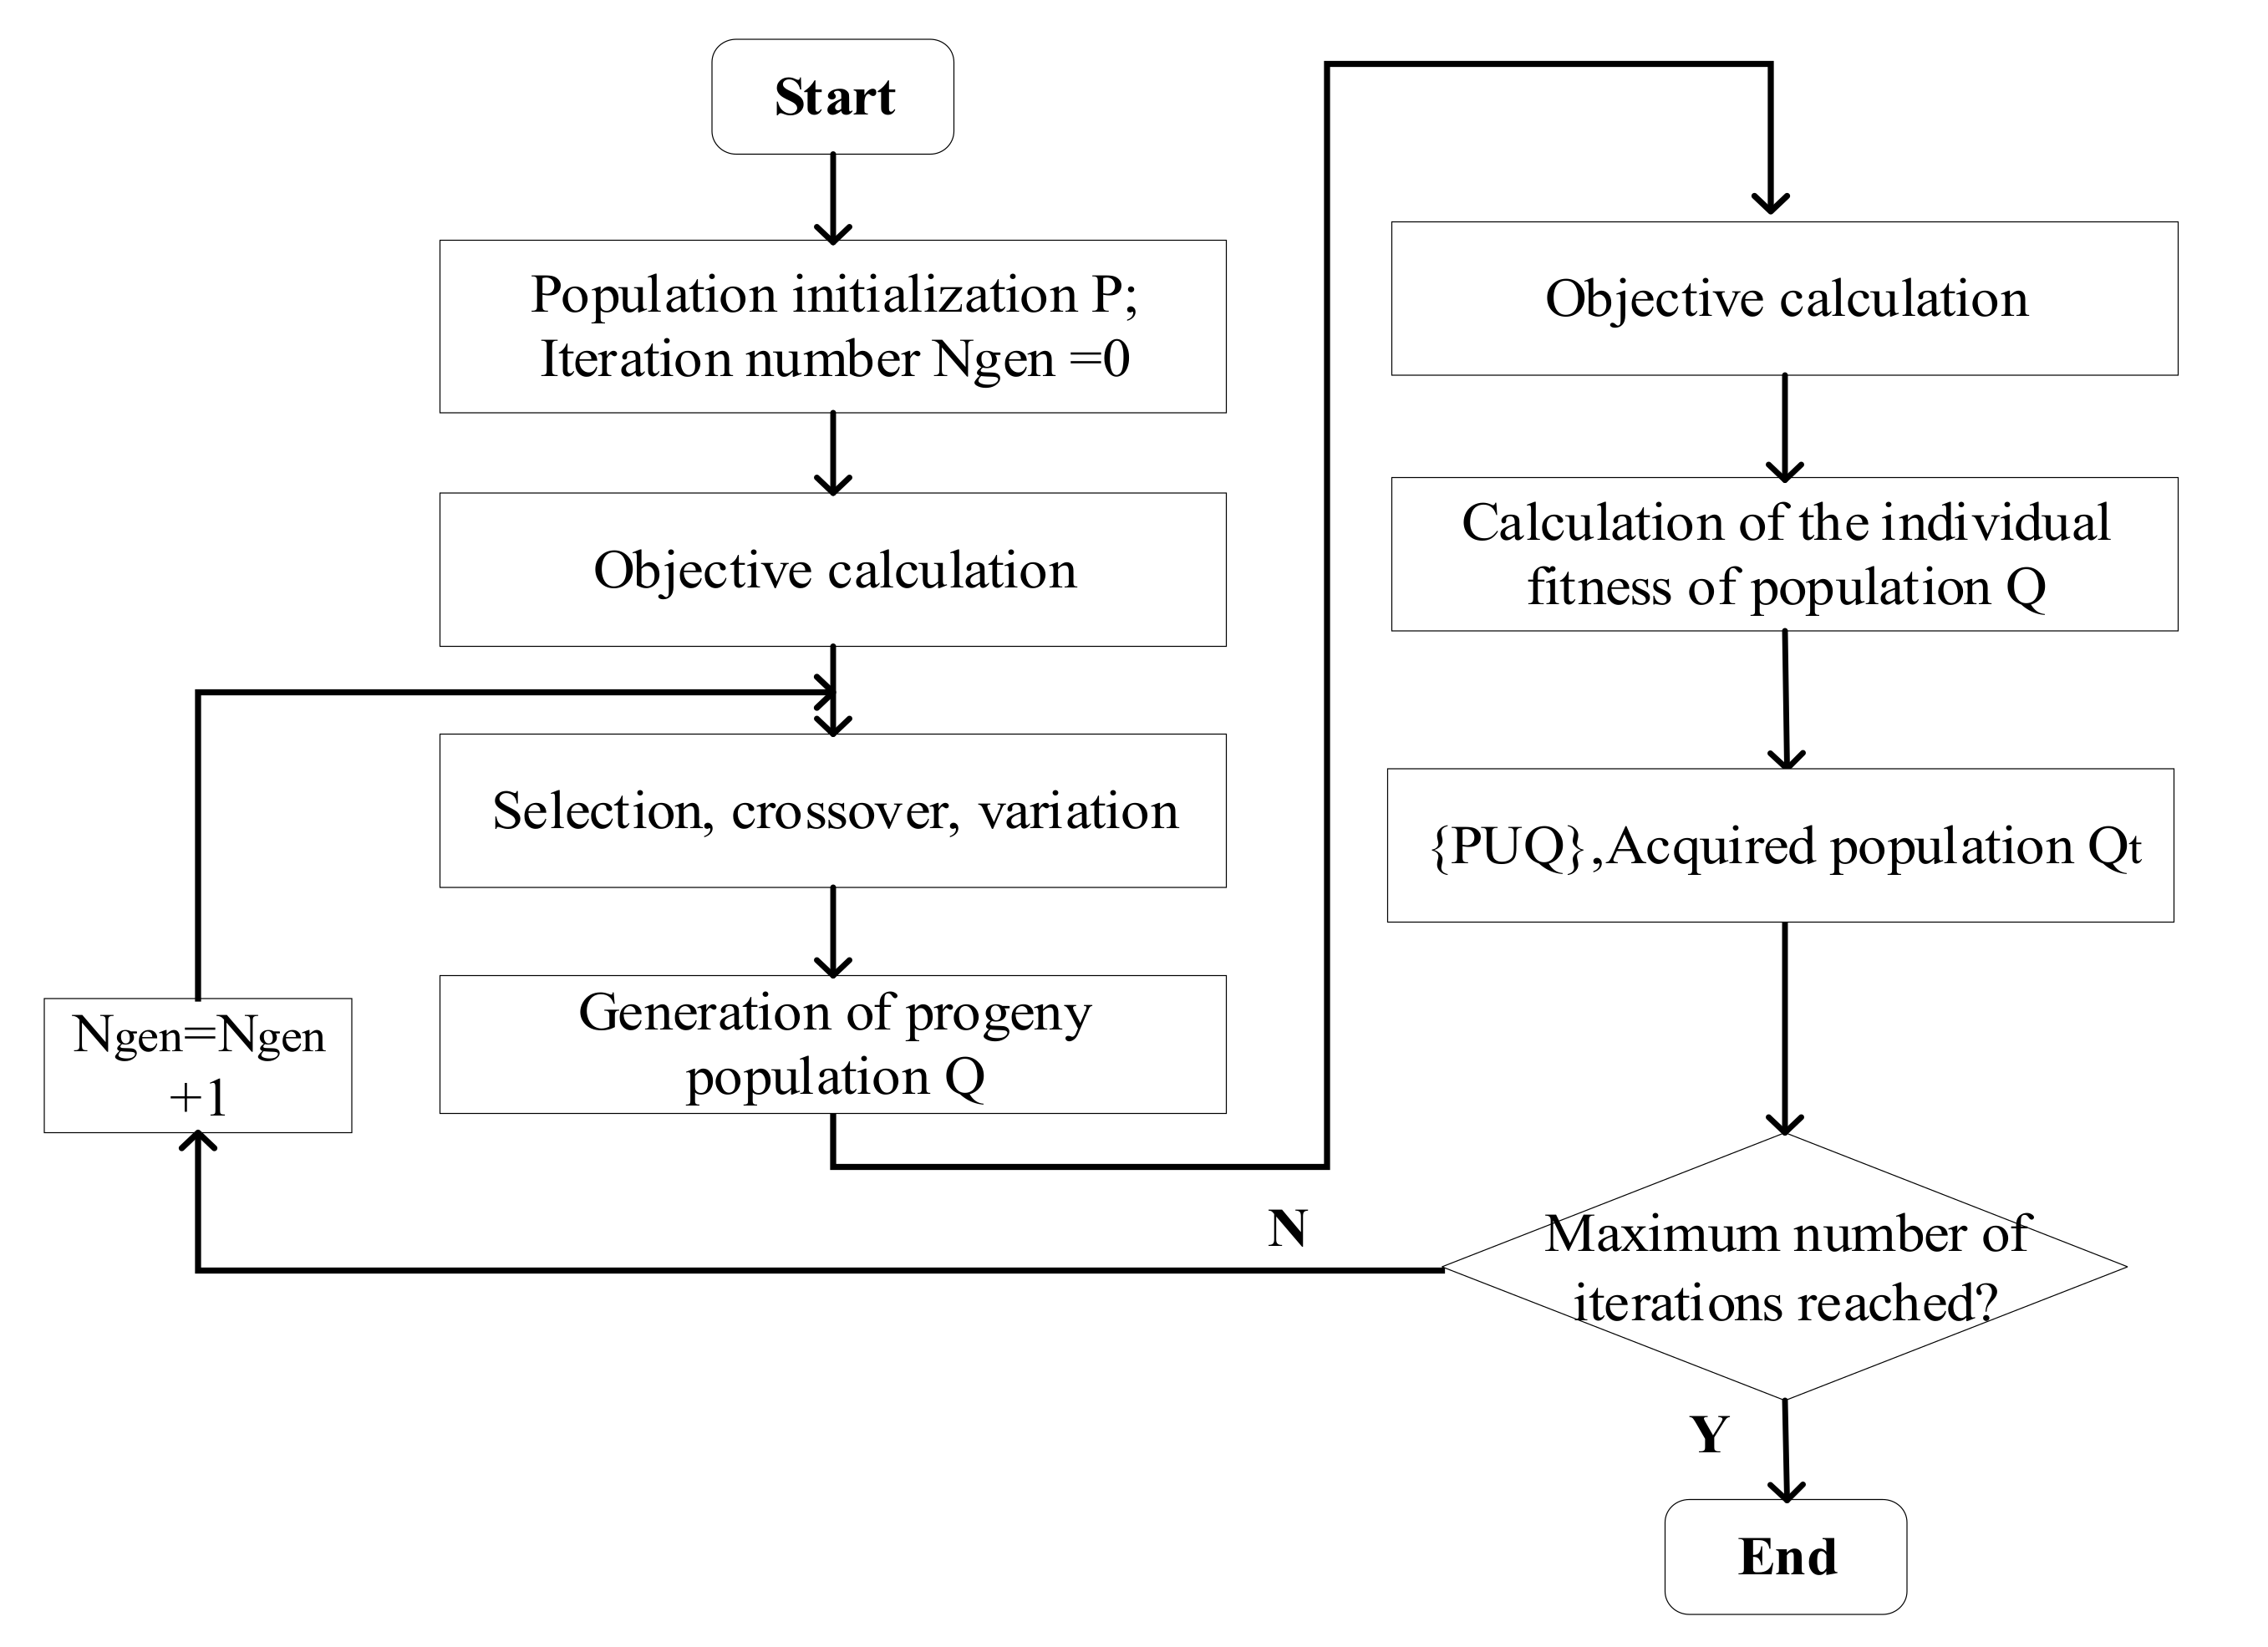
Section 3; According to the characteristics of the model, a two-stage collaborative optimization model solving method is proposed in Section 4; Finally, example analysis and result discussion in Section 5.

2. Comprehensive Demand Response Characteristic Analysis and Operation Structure

2.1. Demand Response Load Characteristics

Collaborative optimization of IES is carried out based on a comprehensive demand response strategy [24,25]. Complementary behaviors among energy supply, conversion and energy storage devices are realized vertically, and multi-load transfer is realized horizontally, which improves the flexibility of integrated energy network, reduces the cost of energy supply and consumption, and stimulates the flexible characteristics of various energy loads. The schematic diagram of collaborative operation is shown in Figure 1.
It can be seen from Figure 1 that the demand side load response includes four load demand responses: electricity, heat, cold and gas. Among them, the response characteristics of electrical load demand are transferable and interruptible [26]. The response characteristics of heat demand show that the heat has thermal inertia, and the system temperature is adjusted within a certain range. The cooling load is provided by the transformation of electric load or heat load, that is, by changing the curves of electric and heat load. The response characteristics of gas demand are similar to those of electric load, which are transferable and interruptible. Therefore, when multiple load demand responses participate in system collaborative optimization, price-based demand response strategy or incentive-based demand response strategy is adopted to guide users to change their energy consumption habits and changing the load curves of various energy sources.

2.2. System Operation Structure

As an operation optimization entity, the IES under the multiple load demand response strategy integrates new energy power generation, integrated energy service providers, users’ loads and other subjects to participate in the comprehensive demand response of multi-energy transactions in external power grid, heating network and gas network [27]. The optimization framework of system cooperative operation is shown in Figure 2.
It can be seen from Figure 2 that in the collaborative optimization of IES, the system dispatching center formulates the output strategy of each unit of the system and the strategy of interaction with external power grid, heating network and gas network according to the load demand, characteristics of wind and light resources, unit characteristics and external power grid price, heating network price and gas network price. According to the actual operating conditions, the pre-operation unit output is optimized and adjusted, which not only maximizes the system economic benefit and comprehensive user satisfaction, but also reduces the system penalty cost. At the same time, when there is a surplus in electric heating, the energy will be sold to gain profits, and when there is a shortage, the electric energy and heat energy will be purchased to meet the load demand. Scheduling multiple load resources in user interaction mode can reduce operating costs by signing demand response contracts with some users.

3. Two-Stage Optimization Model of IES

On the basis of considering the response characteristics and operation structure of multi-load comprehensive demand, this paper establishes a collaborative two-stage optimization model, and the interaction relationship is shown in Figure 3:
It can be seen from Figure 3 that the first stage of the day-ahead collaborative optimization model carries out the day-ahead economic collaborative operation of the system according to the predicted values of the day-ahead electricity price, heat price, gas price, user load and renewable energy generation power, and formulates the best output strategy of the system in response to the dispatching of power grid and heating network. In the second stage, the pre-unit output optimization stage is based on the planned output curve of the pre-unit. The model forecasts the real-time electricity price and the output of renewable energy units, and then it adjusts and optimizes the coordinated operation of the system in real time according to the current economic coordinated operation plan. Finally, it formulates a reasonable electric heating demand response strategy, so as to reduce the output deviation of the system before the time and promote intermittent energy consumption.

3.1. Collaborative Optimization Model before the First Stage

In this stage, considering the constraints of power balance, energy storage, various energy networks, demand response, etc., and aiming at the economic benefits of system operation and the comprehensive satisfaction of users, a collaborative optimization model before the first stage is established.

3.1.1. Objective Function

(1) Target of maximum economic benefit of IES.
The economic benefit of comprehensive energy system is the difference between the operating income and the operating cost of the system. Among them, the operating income of the system mainly comes from the remuneration obtained from participating in energy transactions such as power grid, heat network and gas network, as well as the income from the system’s power supply and heating to residents, and the system participates in demand response to obtain economic compensation. The system operation cost mainly comes from fuel cost, operation and maintenance cost and environmental emission cost, namely:
M a x F I E S E B = R I E S C I E S
In the formula, F I E S E B is the economic benefit of comprehensive energy system operation (yuan); R I E S is the operating income of a comprehensive energy system (yuan); C I E S is the operation cost of IES (yuan).
R I E S = R I E S d i s p a t c h E + R I E S d i s p a t c h T + R L o a d Re s i d e n t + R I L o a d c o m p e n s a t e R I E S d i s p a t c h E = t = 1 T p s E P E g r i d ( t ) R I E S d i s p a t c h T = t = 1 T p s T P T g r i d ( t ) R L o a d Re s i d e n t = t = 1 T p s T P T L o a d D R ( t ) + p s E P E L o a d D R ( t ) R I L o a d c o m p e n s a t e = t = 1 T C I L o a d t P I L o a d ( t )
In the formula, R I E S d i s p a t c h E is the sales revenue for IES (yuan); R I E S d i s p a t c h T is revenue from selling heat for IES (yuan); R L o a d Re s i d e n t is income from power supply and heating for IES (yuan); R I L o a d c o m p e n s a t e is the gains (yuan) for the IES to participate in power grid demand response dispatching; P E g r i d ( t ) is the interactive power (kW) between the IES and the power grid; P T g r i d ( t ) is the interactive power (kW) between the IES and the heating network; p s E is the price of electricity transaction between the IES and the power grid (yuan/kWh); p s E is the price of heat energy transaction between the IES and the heating network (yuan/kWh); P T L o a d D R ( t ) is the user’s heat load (kW) in the IES after the demand response; P E L o a d D R ( t ) is the electricity load (kW) of users in the IES after the demand response; P I L o a d ( t ) is the interruptible load capacity in the system (kW); C I L o a d t is compensation price (yuan/kW) for response of interruptible load capacity demand in the system.
C I E S = C f u e l + C o p e r a t i o n + C e n v i r o n m e n t a l C f u e l = N G t = 1 T P C H P ( t ) + P G B ( t ) δ G T × L H V N G C o p e r a t i o n = t = 1 T i = 1 M C i o p P i ( t ) C e n v i r o n m e n t a l = t = 1 T P e n ( t ) j = 1 N β j g ( C j H + C j T )
In the formula, C f u e l is operation cost of natural gas for IES (yuan); C o p e r a t i o n is operation and maintenance cost for IES (yuan); C e n v i r o n m e n t a l is the environmental cost of comprehensive energy system operation (yuan); N G is the price of natural gas (yuan/m3); P C H P ( t ) is the output power of CHP system (kW); P G B ( t ) is the output power of gas boiler (kW); L H V N G is the low calorific value power of natural gas (kW/m3); P i ( t ) is the rated power (kW) of the energy supply equipment in the IES; C i o p is unit power operation and maintenance cost of energy supply equipment in the IES (yuan/kW); P e n ( t ) is the output power of pollutant emission source in the system (kW); β j g is the unit power emission of j pollutants (kg/kW) in the IES; C j H is basic discharge cost of j pollutants (yuan/kg); C j T is the expenses of j pollutants exceeding the basic discharge quota (yuan/kg).
(2) Maximum comprehensive satisfaction target of users of IES.
IES will guide users in the system to adjust user load in real time when participating in the comprehensive demand response process of power grid and heating network. The load changes directly affect the user’s electricity experience. The user’s comprehensive satisfaction is expressed by interruptible load and transferable load [28], namely:
M a x F I E S S B = 1 k = 1 V 1 t = 1 T Ω 1 , k ( t ) π max , 1 , k + 2 t = 1 T Ω 2 , k ( t ) π max , 2 , k
In the formula, F I E S S B is comprehensive satisfaction of users; 1 , 2 are the ratio of interruptible load and transferable load to total load; Ω 1 , k ( t ) , Ω 2 , k ( t ) are the calling state variable (kW) of interruptible load and transferable load; π max , 1 , k , π max , 2 , k are the maximum adjustment amount (kW) of interruptible load and transferable load.

3.1.2. Constraints

In the first stage, when the IES operates cooperatively, it needs to meet the power balance and constraints of each energy network, and also meet the maximum/minimum power constraints of each component and the operation constraints of the energy storage system.
(1) Energy and power balance constraints
Electric power balance means that the electric power supply of the system always meets the demand for electricity and heat, namely:
P E l o a d ( t ) + P E E S c h a r ( t ) = P E g r i d ( t ) + P W T ( t ) + P C H P ( t ) η C H P E + P E E S d i s ( t ) P T l o a d ( t ) + P T E S _ c h a r ( t ) = P T g r i d ( t ) + P C H P ( t ) η C H P T + P G B ( t ) η G B + P T E S _ d i s ( t ) P N G l o a d ( t ) + P N G _ C H P ( t ) + P N G _ G B ( t ) = P N G g r i d ( t )
In the formula, P E l o a d ( t ) is the system electrical load power (kW); P T l o a d ( t ) is the system heat load power (kW); P E E S c h a r ( t ) is charging power for electric energy storage (kW); P T E S _ c h a r ( t ) is the heat storage power of heat storage (kW); P W T ( t ) is the generating power of wind turbine (kW); η C H P T is CHP thermal efficiency in the system; η C H P E is the electrical efficiency of the system CHP; η G B is the operating efficiency of system GB; P E E S d i s ( t ) is the discharge power of electric energy storage (kW); P T E S _ d i s ( t ) is the exothermic power of thermal energy storage (kW); P N G l o a d ( t ) is the natural gas load of residents (m3/s); P N G _ C H P ( t ) is the natural gas load consumed by CHP system (m3/s); P N G _ G B ( t ) is the natural gas load consumed by the gas boiler (m3/s); P N G g r i d ( t ) is the natural gas (m3/s) imported into the system from the external natural gas network.
(2) Energy storage operation constraints
Electric heating energy storage system of IES realizes load peak shaving and valley filling, and reduces operation cost. Specific capacity constraints and power constraints of electric energy storage and thermal energy storage, namely:
1. Energy storage operation constraints, namely:
0 P E E S c h a r ( t ) P c h a r _ max ϖ B A _ s 0 P E E S d i s ( t ) P d i s _ max ϖ B A _ r ϖ B A _ s + ϖ B A _ r 1
In the formula, P c h a r _ max is the maximum charging power of electric energy storage (kW); ϖ B A _ s Charging efficiency for electric energy storage; P d i s _ max is the maximum discharge power of electric energy storage (kW); ϖ B A _ r is the discharge efficiency of electric energy storage; I c h a r max , I d i s max is the maximum charging and discharging current (a) of electric energy storage; S O C max is the maximum state of charge of electric energy storage; S O C ( t ) is the state of charge of electric energy storage.
P c h a r _ max = min I c h a r max V b a t , S O C max S O C ( t ) Q max γ c h a r Δ t , P i n v P d i s _ max = min I d i s max V b a t , S O C max S O C ( t ) Q max γ d i s Δ t , P i n v
2. Thermal energy storage operation constraints, namely:
0 P T E S _ char ( t ) P T _ s t _ max ϖ T _ s t 0 P T E S _ d i s ( t ) P T _ r e _ max ϖ T _ r e ϖ T _ s t + ϖ T _ r e 1
In the formula, P T _ s t _ max is the maximum charging power of thermal energy storage (kW); ϖ T _ s t is charging efficiency for thermal energy storage; P T _ r e _ max is the maximum heat release power of thermal energy storage (kW); ϖ T _ r e is the heat storage and release efficiency.
(3) Operation constraints of cogeneration system
During the operation of the cogeneration system, the equipment power is kept within a certain output power range, namely:
0 P C H P ( t ) P C H P _ n ( t )
Δ P C H P min ( t ) P C H P ( t + 1 ) P C H P ( t ) Δ P C H P max ( t )
In the formula, P C H P _ n ( t ) is the rated power of CHP unit (kW); Δ P C H P min ( t ) is the minimum climbing power of CHP unit (kW); Δ P C H P max ( t ) is the maximum climbing power (kW) of CHP unit.
(4) Transmission constraints of energy network
The IES exchanges power with power grid, heating network and natural gas network through tie lines, and the energy transmission must meet the following constraints, namely:
P E _ min P E g r i d ( t ) P E _ max
P T _ min P T g r i d ( t ) P T _ max
P N G _ min P N G g r i d ( t ) P N G _ max
In the formula, P E _ max is the maximum transmission power of the power grid (kW); P E _ min is the minimum transmission power of the power grid (kW); P T _ max is the maximum transmission power of the heating network (kW); P T _ min is the minimum transmission power of the heating network (kW); P N G _ max is the maximum transmission power of the natural gas network (m3/s); P T _ min is the minimum transmission power of natural gas network (m3/s).
(5) Load demand response constraints
Comprehensive demand response means that when the energy price fluctuates or the reliability of the system is threatened, the user responds to the energy price signal according to the information released by the comprehensive energy service provider, changes the inherent energy consumption mode, and then reduces and translates the load. Therefore, when guiding users to participate in demand response, the interruptible load and transferable load in the system must meet the following constraints, namely:
l = t t + T max Ω k ( t ) T max , t 1 , T T max Ω k s Ω k ( t ) Ω k ( t 1 ) + 1 t 1 , T T max + 1 , s t , T + T min 1 Ω k ( t ) = 0 , t Ω I L , k
In the formula, Ω k ( t ) is the call state variable of interruptible load (kW); T max , T min are the maximum number of consecutive calls and the minimum number of consecutive non-calls for interruptible loads.
t = 1 T P T L , k ( t ) = 0 P T L , k i n P T L , k ( t ) P T L , k o u t 0.5 t = 1 T P T L , k ( t ) P T L , k max P T L , k ( t ) = 0 , t Ω T L , k
In the formula, P T L , k i n , P T L , k o u t are the maximum turn-in amount and maximum turn-out amount of transferable load (kW); P T L , k max is the maximum transfer amount of transferable load (kW); Ω T L , k is the set of adjustable time periods for transferable loads.

3.2. Collaborative Optimization Model before the Second Stage

In this stage, due to the influence of prediction error, the IES constantly updates the predicted values of electric heating load and wind/solar power, and makes real-time power adjustments to the previous dispatching plan. The unit output real-time adjustment strategy, as a beneficial supplement to the prior economic dispatch, uses the pre-time optimization method to balance the energy supply and demand deviation in the operation of power grid and heat network. It is an effective means to improve the power balance of the system. Therefore, on the basis of the results of the first stage prior collaborative optimization, a prior unit output optimization model aiming at the minimum penalty cost is constructed, and real-time power adjustment is carried out for the prior collaborative plan.

3.2.1. Objective Function

At this stage, the objective function of the unit output optimization model mainly considers the cost minimization of interactive power deviation penalty and wind abandonment penalty, namely:
M i n F I E S F i n e = C f i n e B P + C f i n e A W
C f i n e D R = λ t B P , f i n e + Δ Q B P ( t ) i f , Δ Q B P ( t ) 0 λ t B P , f i n e 1 Q I E S 0 B P + λ t B P , f i n e 2 ( Δ Q B P ( t ) Q I E S 0 B P ) i f , Δ Q B P ( t ) 0
C f i n e A W = λ t A W , f i n e Q t A W
In the formula, F I E S F i n e is penalty cost (yuan) for IES to participate in electric heating dispatching; C f i n e A W is penalty cost for system abandonment (yuan); C f i n e B P is the penalty cost caused by output deviation when the IES participates in power grid dispatching (yuan); λ t A W , f i n e is the basic penalty coefficient of system wind abandonment (yuan/kW); Q t A W is the abandoned air volume of the system (kW); Δ Q B P ( t ) is the output deviation (kW) generated by the system’s prior scheduling plan; λ t B P , f i n e + is the penalty coefficient when the output deviation is greater than zero (yuan/kW); λ t B P , f i n e 1 , λ t B P , f i n e 2 are the step penalty coefficient when the output deviation is less than zero (yuan/kW); Q I E S B P is the planned output (kW) of the system participating in the dispatching optimization before the power grid dispatching.

3.2.2. Constraints

The IES participates in the optimization process of coordinated operation of power grid, heating network and gas network. The adjustable active output unit is to leave standby controllable units and energy storage system in real-time optimization, and the adjusted power should meet the constraint conditions, i.e., Equations (5)–(14). In addition, the system exchanges power with power grid, heat grid and gas grid through tie lines. Therefore, the tie-line power of the actual system is also adjustable, but in the actual operation process, it will face the assessment and punishment of output deviation of power grid, heating network and gas network. Through the optimization in the first stage, the planned interactive power of the system participating in the power grid and heating network dispatching is obtained.
There is a deviation between the actual interactive power of the system and the planned interactive power of the previous day during the output adjustment of the previous unit, and the cooperative operation of the system must also meet the following constraints, namely:
0 Δ Q B P + ( t ) μ Δ B P [ P E l o a d ( t ) + P W T ( t ) + P C H P ( t ) η C H P E ) ] 0 Δ Q D R ( t ) ( 1 μ Δ B P ) [ P E l o a d ( t ) + P W T ( t ) + P C H P ( t ) η C H P E ) P I E S B P ( t ) ]
Q I E S B P = t = 1 T P W T ( t ) + P C H P ( t ) η C H P E + Δ Q B P ( t ) Δ Q B P + ( t ) P E l o a d ( t ) + Ω k ( t ) Δ t
In the formula, μ Δ B P is the positive value of the ratio of system output deviation to actual output; Δ Q B P + ( t ) is the positive value of the actual output deviation of the system (kW); Δ Q B P ( t ) is the negative value of the actual output deviation of the system (kW).

4. Method for Solving Two-Stage Collaborative Optimization Model

In the collaborative optimization model, the first stage prior collaborative optimization model is a typical multi-objective mathematical model, which is solved by genetic algorithm improved by NSGA-II algorithm, and the second stage prior unit output optimization model is a typical mixed integer problem, which is solved by YALMIP toolbox.

4.1. Description of Solution Algorithm

Genetic Algorithm(GA) is a search based on Darwin’s theory of biological evolution. The optimal solution is based on an intelligent algorithm. However, the search speed of this algorithm is slow, and it takes a long training time to obtain the exact solution, and the potential capability of parallel mechanism cannot be fully utilized. On this basis, the genetic algorithm is improved by using NSGA-II, and a fast non-dominated sorting method is proposed, which reduces the computational complexity of the algorithm, and the elite strategy is introduced to expand the sampling space [29]. The specific algorithm flow is shown in Figure 4.
Because the cooperative optimization of IES established in this paper is a multi-objective optimization problem involving economic benefits and comprehensive satisfaction of users, which is nonlinear, contradictory or unmeasurable, the global optimal solution is obtained by Pareto optimal solution set. However, Pareto is a compromise solution with different objectives. According to the Pareto frontier and the needs of different targets, the decision is made, and the Pareto optimal solution set is obtained by NSGA-II algorithm, and Nash negotiation method is introduced to further process the Pareto solution set, so as to obtain the best day-ahead scheduling.
Nash pointed out in the literature [30] that the objectives in the multi-objective optimization problem can be regarded as competing negotiating units, and these units all want to strive for the best for their own objectives, avoid unfavorable strategies as much as possible, and finally reach a compromise, thus obtaining a scheme acceptable to all negotiating units. The multi-objective problem established in this paper is transformed into the following problem to calculate the optimal solution of Nash negotiation.
M a x λ F I E S E B x , 1 - λ F I E S S B x s . t . G x = g H x = h
Set the optimal solution of the optimization problem with parameter λ is x λ , the Pareto frontier of the optimization problem S is:
S = λ 0 , 1 x λ
To obtain the Pareto front S , according to the mathematical expression, the KKT conditions for the game solution of the optimization problem are as follows:
K K T ( λ ) = ( x , η , ξ ) / λ F I E S E B x + 1 - λ F I E S S B x + G T η + H T ξ = 0 0 ( g G x ) η 0 , H x = h
In the formula, η , ξ is a dual variable, expression. ( g G x ) η express η T ( g G x ) = 0 . The above complementary relaxation conditions can be further linearized as follows:
0 η M ( 1 z ) 0 g G x M z z 0 , 1 N d
In the formula, z is 0-1 variable in N d Dimension; N d is the corresponding number of digits.
To sum up, the multi-objective optimization problem constructed in this paper can be described as a mixed integer nonlinear programming problem, namely:
M a x λ F λ = F I E S E B x λ d 1 F I E S S B x λ d 2 d 1 = x 1 * , d 2 = x 2 *
In the formula, x 1 * , x 2 * are the λ optimal solutions when 0 and 1 are taken; d 1 , d 2 are the maximum payments possible for both sides of the game, that is, the negotiation breakdown point.

4.2. Calculation Flow of Solution Algorithm

According to the description of the two-stage collaborative optimization model and solving algorithm of IES, NSGA-II improved genetic algorithm and YALMIP toolbox are used to solve the problem. The specific calculation flow is shown in Figure 5.

5. Analysis of Examples

In order to verify the feasibility and accuracy of the proposed model, this paper selects a demonstration base of IES to carry out optimization simulation analysis before and after the day, and the operation structure follows Figure 2.

5.1. Description of Basic Data

5.1.1. Basic Parameters

The IES includes wind turbine, gas turbine, electric energy storage, thermal energy storage and gas energy storage. The voltage level of the power grid is 10 kV, and the maximum transmission power of the heat network is 1000 kW. In an example, the basic parameters of simulation include electric load, heat load, gas load, equipment parameters and energy network parameters, as shown in Figure 6.
Organize the relevant literature [28,29] and energy prices, as shown in Table 1:
Technical parameters of electric energy storage and thermal energy storage, and related technical parameters of CHP system, as shown in Table 2, Table 3 and Table 4:
According to the load characteristics of the demonstration base, interruptible load and transferable load account for 15% and 45% of the total load, respectively. Integrated energy service providers adjust interruptible load and transferable load, and actively mobilize users to participate in demand response. The response parameters are shown in Table 5.
In view of the reliability and environmental protection of the cooperative operation of the system, the policy encourages the demonstration base to consume renewable energy and electricity as much as possible to reduce pollutant emissions. In the process of operation, pollutant emissions must meet the prescribed emission standards, and those exceeding the emission standards participate in carbon market transactions to meet the requirements of low-carbon operation of the system. The specific emission factors are shown in Table 6:
When the system participates in the coordinated operation of power grid, heating network and gas network, due to the randomness of load forecast and wind power output, the actual output of the system deviates from the planned output of the previous coordinated operation, so it is necessary to punish the integrated energy service providers to ensure the reliability of system coordinated operation response. According to the penalty strategy implemented by the demonstration base, the penalty for output deviation of power grid cooperative operation is 2.5 yuan/kW, the penalty for output deviation of coordinated operation of heating network is 1.5 yuan/kW, and the penalty cost for wind is 1 yuan/kW.
In addition, when NSGA-II algorithm is used to improve genetic algorithm to solve the optimization model, the initial population size is set to 1000, the number of iterations is set to 200, the cross coefficient is set to 0.85, and the variation coefficient is set to 0.2.

5.1.2. Scene Setting

According to the positive role played by CHP system, electrothermal energy storage device and terminal-user electricity-heat-gas comprehensive demand response in the collaborative optimization model, three different scenarios are set, as shown in Table 7:
It can be seen from Table 7 that the wind turbine generator set (WT) is the optimized target of the construction model, and its output is always adjustable. Cogeneration unit (CHP), as an ideal electrothermal coupling device, plays a dual role in regulating the electrothermal output in the system. Electrical energy storage (EES) and thermal energy storage (TES) are important means of system power balance, and their operating conditions are always adjustable. Electricity, heat and gas loads in the system. According to the characteristics of users, there are two adjustment situations: participating in demand response strategy and not participating in demand response strategy. Among them, the residential gas load in natural gas load does not participate in the response, and the gas used for power supply and heating is directly related to the running state of CHP system, which belongs to passive response strategy. Electrical load and thermal load directly participate in demand response, which belongs to active response strategy.

5.2. Analysis of Optimization Results

5.2.1. Collaborative Optimization Results before the First Stage

Under the constraint of cooperative operation of the prior system, aiming at maximizing the economic benefits of the system and the comprehensive satisfaction of users, the prior output plan of the unit and the interaction strategy of electricity and heat energy of the IES participating in the cooperative operation of the power grid and the heat network are formulated. Under the joint constraint and guidance of the economic benefits and the comprehensive satisfaction of users, obtain multiple groups of prior system cooperative operation strategies to meet the requirements of economic and efficient operation of the system, that is, Pareto optimal solution set of prior system cooperative operation, as shown in Figure 7:
It can be seen from Figure 7 that the maximum economic benefit of the IES reached 60,000 yuan and the maximum satisfaction of users reached 0.82 in the cooperative operation a few days ago. However, there is a restrictive relationship between system economic benefit and user satisfaction. The maximum economic benefit and user satisfaction cannot be met at the same time, and there is obvious competition between the two optimization objectives. Therefore, according to Nash negotiation law. Further calculate the target value in Pareto solution set, and select the solution with the largest Nash negotiation function value as the relative optimal solution for system operation optimization before the day. The specific calculation results are shown in Table 8:
It can be seen from Table 7 that when Nash negotiation parameter is 0.5, the maximum value of the function is 0.950, the economic benefit of the system is 43,577.605 yuan, and the maximum satisfaction of users can reach 0.580. While meeting the goal of maximizing the economic benefits of the system and the comprehensive satisfaction of users, the system formulates the coordinated operation of electric power and thermal power grid and heating network before the day. Obtain the planned output curve and planned interactive power curve of the unit with IES participating in the coordinated operation of external power and heat network, as shown in Figure 8:
It can be seen from Figure 8 that the output levels of wind turbines and gas turbines in the system are kept at a high operation level all day long, so as to meet the needs of the system participating in the comprehensive demand response of the coordinated operation of the system. Among them, when participating in the cooperative operation of the system, electrothermal energy storage plays a certain buffering role, ensuring the internal electrothermal balance of the system and improving the safety of the system. At the same time, system power resources actively participate in power grid interaction. During the peak period of electricity price, the system reduces the amount of electricity purchased and increases the amount of electricity delivered to the power grid. When the load demand of the power grid is low, the system purchases electricity from the power grid and actively participates in peak shaving to ensure the safety of the power grid. Compared with power grid operation, the way in which thermal power in the system participates in power grid operation is more passive. When the system actively participates in the power grid demand response operation, the thermal power output of the cogeneration system in the system also changes at any time. In this case, in order to strictly meet the demand of system heat load and thermal energy storage system, the system conducts certain heat transaction with the heating network.

5.2.2. Collaborative Optimization Results before the Second Stage

In the first stage of collaborative optimization before the day, the IES formulated the collaborative operation strategy before the day in combination with its own energy demand and operation benefit. However, in the second stage, due to the uncertainty of wind power output, there is a certain deviation between the actual output and the interactive power of each unit in the system. Therefore, in order to reduce the deviation of abandoned wind level and output, combined with the above three different scenarios, adjust the output of each unit before the second stage of collaborative optimization strategy adjustment before the first stage to further reduce the penalty cost, and specify the collaborative optimization results before the second stage as follows:
(1) Collaborative optimization results before time in Scenario 1.
Under the collaborative optimization strategy before Scenario 1, the output curve of each unit is optimized before Scenario 1, as shown in Figure 9 and Figure 10:
It can be seen from Figure 9 and Figure 10 that in Scenario 1, the adjustability of the system cogeneration system is poor, and neither the electric load nor the heat load participates in the system load adjustment. The system output is exchanged with the electric energy storage device, the power grid and the heating network, thus realizing the optimal system power.
(2) Collaborative optimization results before time in Scenario 2.
On the basis of Scenario 1, the response of electricity and gas demand is considered, and the time front output curve of each unit is obtained, as shown in Figure 11 and Figure 12.
It can be seen from Figure 11 and Figure 12 that, in Scenario 2, the wind turbine and gas turbine are the main power and heat sources in the system, and the actual output curves of wind turbine, gas turbine and electrothermal energy storage system are obtained by real-time adjustment of the day-ahead scheduling strategy. In this scenario, the thermoelectric ratio of the traditional cogeneration unit is constant. The ability to dynamically match the actual heat load and electric load of the unit is poor. This thermoelectric coupling relationship limits the peak shaving ability of the cogeneration unit, resulting in serious wind abandonment in the system. There is a large deviation between the actual output of electrothermal interaction and the output of previous coordinated operation. The actual average output of the wind turbine is about 1100 kW. The abandoned air volume accounts for more than 50% of the predicted wind power level and the average wind power consumption rate of the system is about 46%.
(3) Collaborative optimization results before time in Scenario 3.
On the basis of Scenario 2, considering the uncertainty of wind power output, the robustness of system optimization decision is improved, and the output curves of each unit are obtained, as shown in Figure 13 and Figure 14.
It can be seen from Figure 13 and Figure 14 that in Scenario 3, the coordinated operation plan has certain anti-risk ability by adjusting the gas turbine. In this scenario, the system cogeneration unit breaks the strong coupling relationship of the unit, and the unit has strong ability to dynamically match the actual heat load and electric load. The thermal electrolytic coupling relationship releases the peak shaving ability of the cogeneration unit. The actual output of the system participating in the coordinated operation of power grid and heating network is close to the planned output of the previous coordinated operation. Compared with Scenario 2, the deviation of system output is greatly reduced, and the wind abandonment phenomenon of the system is effectively solved. The uncertainty of wind power output and the wind abandonment phenomenon are solved during the operation optimization process. The output level of wind turbines is relatively high, and the actual average output is about 2200 kW. Compared with Scenario 2, the abandoned air volume of wind turbines is reduced by about 60%, and the average consumption rate of wind power exceeds 80%.

5.3. Comparative Discussion of Results

5.3.1. Comparative Analysis of Optimization Results

According to the calculation results of the three scenarios, the actual operation economic benefits, user satisfaction, environmental emissions and load demand responses of the system are shown in Table 9:
It can be seen from Table 9 that, among the three scenarios, the peak shaving capability and system adjustment capability of the cogeneration unit with adjustable electric-heat ratio in Scenario 3 are stronger, the system output deviation and abandoned air volume are smaller, and the overall economic benefit of the system is better. At this time, the daily operation benefit of the system can reach 14,821.04 yuan, but at the same time, due to the frequent response of electricity, heat and gas demand, the load of users is greatly affected, resulting in the comprehensive satisfaction of users being 0.56 is lower than Scenario 1 and Scenario 2. In Scenario 1 and Scenario 2, due to the poor coordination and adjustment ability of the system, the deviation of the actual output of the system is larger than the planned output, resulting in serious wind abandonment and high operation cost, which reduces the economic benefits of the system operation. For details, see Table 10, Table 11 and Table 12 for the benefit and cost composition under each scenario.
It can be seen from Table 10 that there are obvious differences in demand response benefits among the three scenarios. Scenario 3: Because the output flexibility of the system unit is higher, the system’s ability to participate in demand response is also stronger. It can be seen from Table 11 that in different pre-optimization scenarios, according to the results of electric load demand response, the total load response of the three scenarios is 0 kW, 36,710.96 kW and 287,052.92 kW, respectively. Scenario 3: Compared with Scenario 2, the system load response capability in the scenario with adjustable heat-electricity ratio of cogeneration is increased by about 6.8 times, and the system demand response income is increased by about 76.92%, and the deviation under different optimization scenarios is given, as shown in Figure 15.
It can be seen from Figure 15 that in Scenario 1, the system’s coordinated adjustment ability is poor, and the modes of power supply and heat supply are relatively fixed, resulting in a large deviation of system output in Scenario 1, and the system penalty cost is as high as 36,956.28 yuan, which is about 25.73% higher than that in Scenario 2. In Scenario 2, the electric-heat ratio of the traditional cogeneration unit is constant, which limits the peak-shaving capacity and wind power consumption capacity of the cogeneration unit. As a result, the output of the system in the actual operation process seriously deviates from the previous collaborative planned output. In this case, compared with the planned amount, the gap in power supply from the system to the grid will be as high as 6832.78 kW, while the heat supply is 936.77 kW higher than planned. In addition, due to the inflexible system scheduling, the abandoned air volume in Scenario 2 reaches 10,905.56 kW, resulting in a penalty cost of about 29,392.650 yuan for the actual operation of the system in Scenario 2. It seriously affects the economy of system operation and the security of power grid. Compared with Scenarios 1 and 2, Scenario 3 is superior to Scenarios 1 and 2 in terms of system output regulation capability and wind power consumption capability. After optimization and adjustment, the deviation of power output of the system is 1429.68 kW, the abandoned air volume is only 2015.25 kW, and the total penalty cost of the system is 8843.71 Yuan, which is 69.91% lower than that of Scenario 2. At the same time, under the above three scenarios, environmental cost before the system, as shown in Table 13:
In Scenario 2, the output of cogeneration unit is limited by a fixed electric-heat ratio, and the flexibility of the system is poor, and the unit is in a low load rate operation state in some periods, resulting in lower operation efficiency and larger natural gas consumption. At the same time, due to the low load rate operation of the unit, the natural gas combustion is insufficient, and the pollutant discharge is also large. According to Table 12, the environmental cost of Scenario 2 system is as high as 2671.810 yuan, which is 27.26% higher than that of Scenario 3. In Scenario 1, although the adjustability of the cogeneration system is poor, the system does not participate in the demand response due to the load of electricity, heat and gas, so the system calls the gas turbine infrequently, and its environmental cost is relatively low.

5.3.2. Comparative Analysis of Demand Response

For the load situation of the electric load demand response result of the cooperative operation system, see Figure 16 and Figure 17:
It can be seen from Figure 16 and Figure 17 that the response results of electric load demand in different optimization scenarios are different, as shown in Table 14:
It can be seen from Table 14 that among the three pre-optimization scenarios, the load curve of scenario 1 does not change because the load of electricity, heat and gas does not participate in the response of power grid and heating network. The electric loads in both Scenarios 2 and 3 participate in the demand response, and the demand responses in Scenarios 2 and 3 are 41,299.83 kW and 23,026.86 kW, respectively. Scenario 3 because the heat load also participates in the demand response and the function of electrothermal coupling equipment, there is a cross response between electrothermal loads, and the load response is lower than Scenario 2.
For the heat load demand response result of the collaborative operation system, see Figure 18.
Combined with Figure 18, heat load demand response results of different optimization scenarios before and after different optimization scenarios and heat load curves before and after different optimization scenarios, the heat load demand response results are obtained, as shown in Table 15:
According to the adjustable characteristics of the units in the three pre-optimization scenarios, the electric heating ratio of the cogeneration units in Scenarios 1 and 2 are not adjustable, which leads to poor flexibility of heat load and ability to participate in demand response. In Scenario 3, because the thermal-electrical ratio of gas turbine can be flexibly adjusted, the system has a strong ability to participate in the demand response of urban heating network. The daily thermal demand response income of the system can reach 4359.450 yuan. It can be seen from Figure 18 that the heat loads in Scenario 1 and Scenario 2 do not participate in the demand response, and the system heat load curve has not changed. In Scenario 3, the system heat load is reduced during the peak heat consumption period (18:00~22:00), thus reducing the system heat cost.
According to the air load demand response result of the collaborative operation system, the load situation is shown in Figure 19:
Combined with Figure 19, it can be seen that according to the load characteristics of optimized scenarios three times ago, the natural gas load in the system includes two parts, namely, residential gas load and gas load of gas turbine. Among them, residential gas load does not participate in system regulation, while natural gas load of gas turbine passively participates in system operation optimization regulation due to the adjustment of cogeneration unit.
To sum up, according to the electricity, heat and gas load responses of the three time-ago optimization strategies, it can be seen that in Scenario 1, the electricity and heat loads of the system are not involved in the demand response, and the electricity-heat ratio of the gas turbine is not adjustable, and the natural gas load curve of the system has not changed. In Scenario 3, both the electrical and thermal loads of the system participate in the demand response, and the electrical and thermal ratio of the gas turbine is adjustable. Compared with Scenario 1 and Scenario 2, the operating conditions of the medium gas turbine in the system are more flexible, the operating efficiency of the gas turbine is high, and the change of natural gas consumption is relatively small. Scenario 2 Although the thermal-electrical ratio of the gas turbine is not adjustable, and the electrical load in the system participates in the demand response of the urban power grid, resulting in the change of the operation state of the cogeneration unit, the thermal load does not participate in the demand response. The operation flexibility of cogeneration system is poor, the operation efficiency of gas turbine is low, and the natural gas consumption of the system changes greatly. Under the comprehensive action of electricity, heat, gas load and gas operation characteristics, the gas load response in Scenario 2 is lower than that in Scenario 3.

6. Conclusions

It is of great significance to accelerate the construction of IES projects in combination with the proposal of China’s “peak carbon dioxide emissions and carbon neutrality” goal. In this paper, the cooperative optimization model of IES is constructed considering the response strategy of multiple load demands. The specific research conclusions are as follows:
(1)
In the process of collaborative optimization of source, load and storage of IES, the four load demand response characteristics of electricity, heat, cold and gas effectively guide users to change their energy consumption habits and change the load curve of each energy source.
(2)
Based on the interaction between source, load and storage of IES, a two-stage collaborative optimization model is established. Among them, in the first stage, taking the economic benefits of the system operation and the comprehensive satisfaction of users as the goal-driven, the optimal output strategy of the system in response to the dispatching of power grid and heating network was formulated. In the second stage, on the basis of the planned output curve of the unit obtained in the first stage, the real-time operation plan was adjusted, and the coordinated operation of the system was optimized, and then a reasonable response strategy for electric heating demand was formulated.
(3)
According to the analysis results of an example, the economic benefits of the system can be effectively improved by comprehensively considering various load demand response strategies of electricity, heat, cold and gas, and its electricity and heat loads participate in the demand response, which makes the thermal-electrical ratio of the gas turbine adjustable and makes the operating conditions of the gas turbine in the system more flexible.

Author Contributions

In this research activity, all authors were involved in the data collection and preprocessing phase, model constructing, empirical research, results analysis and discussion, and manuscript preparation. All authors have read and agreed to the published version of the manuscript.

Funding

Project Supported by National Natural Science Foundation, grant number (72174062).

Institutional Review Board Statement

Not applicable.

Informed Consent Statement

Not applicable.

Data Availability Statement

The data presented in this study are available upon request from the corresponding author.

Acknowledgments

The completion of this paper has been helped by many teachers and classmates. We would like to express our gratitude to them for their help and guidance.

Conflicts of Interest

The authors declare no conflict of interest.

References

  1. Zhang, Y.Z.; Zhang, X.P.; Lan, L.H. Robust optimization-based dynamic power generation mix evolution under the carbon-neutral target. Resour. Conserv. Recycl. 2022, 178, 106103. [Google Scholar] [CrossRef]
  2. Peng, W.; Poovendran, P.; Manokaran, K.B. Fault detection and control in integrated energy system using machine learning. Sustain. Energy Technol. Assess. 2021, 10, 101366. [Google Scholar]
  3. Chen, Z.; Avraamidou, S.; Liu, P.; Pistikopoulos, E. Optimal Design of Integrated Urban Energy System Under Uncertainty and Sustainability Requirements—Science Direct. Comput. Aided Chem. Eng. 2020, 48, 1423–1428. [Google Scholar]
  4. Mu, Y.; Chen, W.; Yu, X.; Jia, H.; Hou, K.; Wang, K.; Meng, X. A double-layer planning method for integrated community energy systems with varying energy conversion efficiencies. Appl. Energy 2020, 12, 115700. [Google Scholar] [CrossRef]
  5. David, B.; Agnelli, J.; Gagliardi, A.; Dini, P.; Saponara, S. Design of an Off-Grid Photovoltaic Carport for a Full Electric Vehicle Recharging. In Proceedings of the 2020 IEEE International Conference on Environment and Electrical Engineering and 2020 IEEE Industrial and Commercial Power Systems Europe (EEEIC/I&CPS Europe), Madrid, Spain, 9–12 June 2020; IEEE: Piscataway, NJ, USA, 2020. [Google Scholar]
  6. Xu, Z.; Wang, H.; Cheng, P.; Chang, T.; Chen, P.; Zhou, C.; Ruan, R. Development of integrated culture systems and harvesting methods for improved algal biomass productivity and wastewater resource recovery—A review. Sci. Total Environ. 2020, 746, 141039. [Google Scholar] [CrossRef]
  7. Behzadi, A.; Gholamian, E.; Ahmadi, P.; Habibollahzade, A.; Ashjaee, M. Energy, Exergy and Exergoeconomic (3E) Analyses and Multi-Objective Optimization of a Solar and Geothermal Based Integrated Energy System. Appl. Therm. Eng. 2018, 10, 1011–1022. [Google Scholar] [CrossRef]
  8. Li, Y.; Wang, B.; Yang, Z.; Li, J.; Chen, C. Hierarchical stochastic scheduling of multi-community integrated energy systems in uncertain environments via stackelberg game. Appl. Energy 2022, 308, 118392. [Google Scholar] [CrossRef]
  9. Zhang, N.; Sun, Q.Y.; Yang, L.X. A two-stage multi-objective optimal scheduling in the integrated energy system with We-Energy modeling. Energy 2021, 215, 119121. [Google Scholar] [CrossRef]
  10. Zhou, X.R.; Ma, Y.M.; Wang, H.X.; Li, Y.L.; Yu, J.S.; Yang, J.Y. Optimal scheduling of integrated energy system for low carbon considering combined weights. Energy Rep. 2022, 8, 527–535. [Google Scholar] [CrossRef]
  11. Wang, L.X.; Jing, Z.X.; Wu, Q.H.; Wei, F. Decentralized optimization of coordinated electrical and thermal generations in hierarchical integrated energy systems considering competitive individuals. Energy 2018, 9, 607–622. [Google Scholar] [CrossRef]
  12. Wei, F.; Wu, Q.H.; Ying, Z.X.; Chen, J.J.; Zhou, X.X. Optimal Unit Sizing for Small-Scale Integrated Energy Systems Using Multi-Objective Interval Optimization and Evidential Reasoning Approach. Energy 2016, 9, 933–946. [Google Scholar] [CrossRef]
  13. Shan, J.N.; Lu, R.X. Multi-objective economic optimization scheduling of CCHP micro-grid based on improved bee colony algorithm considering the selection of hybrid energy storage system. Energy Rep. 2021, 11, 326–341. [Google Scholar] [CrossRef]
  14. Chen, H.P.; Gao, L.; Zhang, Z. Multi-objective optimal scheduling of a microgrid with uncertainties of renewable power generation considering user satisfaction. Int. J. Electr. Power Energy Syst. 2021, 10, 107142. [Google Scholar] [CrossRef]
  15. Tan, Z.; Wei, F.A.; Li, H.; De, G.; Ma, J.; Yang, S.; Ju, L.; Tan, Q. Dispatching optimization model of gas-electricity virtual power plant considering uncertainty based on robust stochastic optimization theory. J. Clean. Prod. 2020, 247, 119106. [Google Scholar] [CrossRef]
  16. Sun, P.; Guan, Q.; Fan, S.L. Research on Multi energy System Scheduling with Integrated Demand Respons. Energy Conserv. Technol. 2019, 9, 476–481. [Google Scholar]
  17. Yuan, G.X.; Gao, Y.; Ye, B. Optimal dispatching strategy and real-time pricing for multi-regional IESs based on demand response. Renew. Energy 2021, 12, 1424–1446. [Google Scholar] [CrossRef]
  18. Yang, D.C.; Wang, M.; Yang, R.; Zheng, Y.; Pandzic, H. Optimal dispatching of an energy system with integrated compressed air energy storage and demand response. Energy 2021, 11, 121232. [Google Scholar] [CrossRef]
  19. Chen, Z.X.; Zhang, Y.J.; Tang, W.; Lin, X.; Li, Q. Generic modelling and optimal day-ahead dispatch of micro-energy system considering the price-based integrated demand response. Energy 2019, 6, 171–183. [Google Scholar] [CrossRef]
  20. Liu, N.; Wang, J.; Wang, L. Hybrid Energy Sharing for Multiple Microgrids in an Integrated Heat–Electricity Energy System. IEEE Trans. Sustain. Energy 2019, 7, 1139–1151. [Google Scholar] [CrossRef]
  21. Li, S.H.; He, Y.; Peng, H.H.; Li, H. Short-term Optimal Scheduling of Intelligent Building System Considering Energy Storage and Controllable Load. Proc. CSU EPSA 2020, 7, 9–17. [Google Scholar]
  22. Zhao, D.M.; Song, Y.; Wang, Y.L.; Yin, J.; Xu, C. Coordinated Scheduling Model with Multiple Time Scales Considering Response Uncertainty of Flexible Load. Autom. Electr. Syst. 2019, 43, 21–30. [Google Scholar]
  23. Wang, Y.Z.; Zhou, R.J.; Li, J.; Wang, Y.; Chen, Y.; Ren, Q.Q. Two-stage Optimal Dispatching for Wind Power-Electric Boiler-Thermal Power Plant with the Regulation of Thermal Load. Proc. CSU EPSA 2019, 31, 13–20. [Google Scholar]
  24. Xie, B.H.; Xu, D.; Hu, L.X.; Ding, Q.; Song, B.Y. Study on effect of electric boiler configuration method on wind power curtailment. Power Syst. Prot. Control. 2019, 47, 126–133. [Google Scholar]
  25. Tan, Z.; De, G.; Li, M.; Lin, H.; Yang, S.; Huang, L.; Tan, Q. Combined electricity-heat-cooling-gas load forecasting model for integrated energy system based on multi-task learning and least square support vector machine. J. Clean. Prod. 2019, 248, 119252. [Google Scholar] [CrossRef]
  26. Li, Y.; Han, M.; Yang, Z.; Li, G. Coordinating flexible demand response and renewable uncertainties for scheduling of community integrated energy systems with an electric vehicle charging station: A bi-level approach. IEEE Trans. Sustain. Energy 2021, 12, 2321–2331. [Google Scholar] [CrossRef]
  27. Li, Y.; Li, K.; Yang, Z.; Yu, Y.; Xu, R.; Yang, M. Stochastic optimal scheduling of demand response-enabled microgrids with renewable generations: An analytical-heuristic approach. J. Clean. Prod. 2022, 330, 129840. [Google Scholar] [CrossRef]
  28. Saponara, S. Electro-Thermal Model-Based Design of Bidirectional On-Board Chargers in Hybrid and Full Electric Vehicles. Electronics 2021, 11, 112. [Google Scholar]
  29. Liu, Y.L.; Zhou, C.Y. Application of catastrophe theory to comprehensive evaluation of safety of levee construction. Hydro Sci. Eng. 2011, 56, 60–65. [Google Scholar]
  30. De, G.; Tan, Z.; Li, M.; Huang, L.; Song, X. Two-Stage Stochastic Optimization for the Strategic Bidding of a Generation Company Considering Wind Power Uncertainty. Energies 2018, 11, 3527. [Google Scholar] [CrossRef] [Green Version]
Figure 1. Schematic diagram of coordinated operation of IES considering comprehensive demand response strategy.
Energies 15 02033 g001
Figure 2. Multi-objective cooperative operation optimization framework of IES.
Energies 15 02033 g002
Figure 3. Interaction of two-stage optimization model.
Energies 15 02033 g003
Figure 4. Flow chart of improved non-inferior classification genetic algorithm.
Energies 15 02033 g004
Figure 5. Flow chart of solving collaborative optimization model.
Energies 15 02033 g005
Figure 6. Wind generation prediction curve and power, heat, and gas load prediction curves.
Energies 15 02033 g006
Figure 7. Day-ahead scheduling Pareto optimal solution set.
Energies 15 02033 g007
Figure 8. Planned output curve of day-ahead coordinated operation unit and planned interactive power curve with power grid and heating network.
Energies 15 02033 g008
Figure 9. Day-ahead optimized output of wind power units in Scenario 1.
Energies 15 02033 g009
Figure 10. Day-ahead optimized power and heat output curves of each unit in Scenario 1.
Energies 15 02033 g010
Figure 11. Day-ahead optimized output of wind power units in Scenario 2.
Energies 15 02033 g011
Figure 12. Day-ahead optimized power and heat output curves of each unit in Scenario 2.
Energies 15 02033 g012
Figure 13. Day-ahead optimized output of wind power units in Scenario 3.
Energies 15 02033 g013
Figure 14. Day-ahead optimized power and heat output curves of each unit in Scenario 3.
Energies 15 02033 g014
Figure 15. Power and heat output deviations in different day-ahead optimization scenarios.
Energies 15 02033 g015
Figure 16. Demand response results of interruptible power load in different day-ahead optimization scenarios.
Energies 15 02033 g016
Figure 17. Transferable power demand response results and power load curves before and after demand response in different day-ahead optimization scenarios.
Energies 15 02033 g017
Figure 18. Heat demand response results and heat load curves before and after demand response in different day-ahead optimization scenarios.
Energies 15 02033 g018
Figure 19. Gas demand response results in different day-ahead optimization scenarios and gas load curves after demand response in different day-ahead scheduling scenarios.
Energies 15 02033 g019
Table 1. Time-of-use prices of each energy.
CategoryTime DivisionPeriod of TimeEnergy Price
Electricity rateValley period(12:00–18:00)1.440 yuan/kw h.
Peacetime section(1:00–6:00)0.381 yuan/kw h.
Peak period(6:00–12:00), (18:00–24:00)0.839 yuan/kw h.
Hot priceValley period(1:00–8:00)0.085 yuan/kw h.
Peacetime section(8:00–11:00), (15:00–18:00) (21:00–24:00)0.153 yuan/kw h.
Peak period(11:00–15:00), (18:00–21:00)0.057 yuan/kw h.
Gas priceFull time period(0:00–23:00)3.250 yuan/m3.
Table 2. Technical parameters of power, heat, and gas storage systems.
Energy Storage TypeCapacity/kW S O C max S O C min Discharge (Thermal) EfficiencyCharging (Thermal) Efficiency
Electric energy storage2500100%10%96%95%
Thermal energy storage2000100%10%95%95%
Table 3. Technical and economic parameters of power and heat generation units.
Unit TypeCapacity/kWUpper Power Limit/kWLower Power Limit/kWOperating Cost Yuan/kW
Wind turbines5000500000.450
Micro gas turbine5000500000.180
power grids-1500−1500-
Table 4. Technical parameters of CHP system.
ParameterElectrical EfficiencyHeat EfficiencyFlue Gas Recovery EfficiencyHeat-Electricity Ratio
CHP unit0.3250.3950.7801.550
Table 5. Demand response parameters of each load.
Load TypeResponse TimeSubsidized Price
Medium power-off load10:00~12:00; 19:00~24:001250 yuan/MWh
Transferable electrical load1:00~24:00650 yuan/MWh
Adjustable heat load1:00~24:001000 yuan/MWh
Table 6. Pollutant emission parameters and environmental emission factors.
Pollutant S O 2 N O x C O 2
Natural   gas   emission   factor   ( kg / 10 6 m 3 )11.6000.0062.010
Environmental value (yuan/kg)6.13026.0000.086
Carbon trading(yuan/kg)Trading standard 0.5   kg / h 2.45   kg / h 1.25   kg / h
Cost parameter 1.0002.0000.010
Table 7. Day-ahead unit output adjustment scenario.
SightElectricity and Heat SourceEnergy-Storage SystemsMultivariate LoadComprehensive Demand Response
WTCHPEESTESElectricityHeatingGasGas Load Demand ResponseElectrical Load Demand ResponseHeating Load Demand Response
Scenario 1
Scenario 2
Scenario 3
Note: The symbol ⅹ indicates that the unit is not adjustable, and the symbol √ indicates that the unit is adjustable.
Table 8. Calculation results of day-ahead scheduling based on Nash negotiation method.
Parameter SettingSymbolCalculation Result
Nash negotiation parameters λ 0.500
Maximum value of Nash negotiation function max F ( λ ) 0.950
System economic benefit F I E S E B 43,577.650
Comprehensive satisfaction of users F I E S S B 0.580
Table 9. System economic benefits and comprehensive satisfaction of users in different day-ahead optimization scenarios.
Optimize Scenarios at Different TimesScenario 1Scenario 2Scenario 3
Pre-scheduling income/yuan86,614.43079,730.61096,032.900
Pre-scheduling cost/yuan92,203.98090,513.24081,211.860
Economic benefit/yuan−5589.550−10,782.63014,821.040
Comprehensive satisfaction of users10.7500.560
Table 10. Coordinated operation revenue in different day-ahead optimization scenarios.
Pre-Optimization ScenarioScenario 1Scenario 2Scenario 3
Sales revenue/yuan4842.7104594.8706889.660
Sales revenue/yuan000
Energy supply income/yuan81,771.72070,546.87064,897.250
DR income/yuan04588.87024,245.990
Total income/yuan86,614.43079,730.61096,032.900
Table 11. Coordinated operation cost in different day-ahead optimization scenarios.
Pre-Optimization ScenarioScenario 1Scenario 2Scenario 3
Natural gas cost/yuan19,696.65022,695.98024,580.620
Electricity purchase cost/yuan2816.7402917.7603367.860
Heat purchase cost/yuan1479.8101500.6501898.430
Operation and maintenance cost/yuan29,757.15031,554.42040,431.280
Environmental cost/yuan1497.3502451.7802089.960
Penalty cost/yuan36,956.28029,392.6508843.710
Total cost/yuan92,203.98090,513.24081,211.860
Table 12. Coordinated operation penalty in different day-ahead optimization scenarios.
Pre-Optimization ScenarioScenario 1Scenario 2Scenario 3
Penalty for thermal output deviationDeviation/kW1515.200936.7702169.500
Penalty cost/yuan2272.8001405.1503254.250
Penalty of electric output deviationDeviation/kW−10,276.770−6832.780−1429.680
Penalty cost/yuan25,691.92017,081.9403574.210
Punishment for abandoning windAbandoned air volume/kW8991.56010,905.5602015.250
Penalty cost/yuan8991.56010,905.5602015.250
Total penalty cost/yuan36,956.28029,392.6508843.710
Table 13. Environmental cost composition in different day-ahead optimization scenarios.
Pre-Optimization ScenarioScenario 1Scenario 2Scenario 3
Basic emission cost/yuan1069.7501921.3001555.370
Carbon transaction cost/yuan427.600750.510543.990
Total environmental cost/yuan1497.3502671.8102099.360
Table 14. Power demand response results in different day-ahead optimization scenarios.
Pre-Optimization ScenarioScenario 1Scenario 2Scenario 3
Response capacity/kWInterruptible load036,710.96020,468.320
Transferable load00266,584.600
Income/yuanInterruptible load04588.8702558.540
Transferable load0017,328
Table 15. Heat demand response results in different day-ahead optimization scenarios.
Pre-Optimization ScenarioScenario 1Scenario 2Scenario 3
Response capacity/kW004359.450
Income/yuan004359.450
Publisher’s Note: MDPI stays neutral with regard to jurisdictional claims in published maps and institutional affiliations.

