1. Introduction
Access to energy is a fundamental right, but many people and communities worldwide do not have access to this essential service. Typically, urban areas of cities have a continuous supply of electricity 365 days of the year, contrary to many rural communities. According to statistics from World Bank in 2019, 10% of the world’s population and 17.47% of the world’s rural population do not have access to electricity [
1,
2]. Affordable, reliable, and clean energy access (SDG7) for the entire population is a universal goal, reflected in the United Nations’ Sustainable Development Goals (SDGs) [
3].
The lack of electricity access, especially for rural communities far from each country’s main electric grid, reduces the inhabitants’ quality of life, their health, and their safety, affecting their commercial activities [
4,
5]. In Ecuador, this limitation is not due to the governments’ lack of interest. However, the economic and technological challenges associated with building infrastructure to bring power lines from the main electric grid to these remote areas is the issue [
6,
7]. Electric generators based on fossil fuels are the most common option for electricity generation in these communities where these machines can generate from a few watts to several kilowatts. Furthermore, these generators use fossil fuels, such as diesel and gasoline, whose fuel combustion has considerable impacts on the environment due to releasing hazardous substances and polluting gas emissions [
8]. In communities of the Gulf of Guayaquil, in Ecuador, the price for fuel is not limited to the national sale price, but rather is adjusted to increased values that benefit resellers. Island communities such as “Cerrito de los Morreños” and “Bellavista”, located in the Gulf of Guayaquil, have diesel generators of considerable size and capacity (>45 kW). Typically, these generators operate six hours every day (from 18:00 until 24:00) [
9,
10,
11]. For the remaining time, the communities do not have electricity unless they have small personal gasoline generators in their homes. In addition, this fuel arrives to these communities via motorboats. The transportation of fuel increases the risk of accidents and spills of this fuel into the rivers and bodies of water that surround these communities. This practice represents a threat to the ecosystem [
12], which includes a large variety of flora and fauna around these places.
To expand the electricity coverage to remote rural communities, electricity generation from renewable energy sources is a feasible option. Some solutions based on renewable sources are solar home systems and remote microgrid systems [
13,
14,
15]. Both systems differ in the amount of electricity they can deliver. The first system can deliver enough energy for one house but the microgrid could generate enough electricity for an entire community. In addition, off-grid hybrid power systems (or off-grid hybrid microgrid systems) can use renewable sources in combination with non-renewable sources (fossil fuel-based generators) to supply electricity to remote communities [
16]. In Ecuador, solar home systems have been implemented in rural electrification projects, some of which are carried out in remote communities in the Gulf of Guayaquil [
10] and in the Amazon jungle [
17]. Solar home systems solve particular basic needs for electricity use in each of the homes in these communities. Due to the low power generated by these systems, users must considerably restrict the number of hours that they use household appliances, lighting, computers, etc. However, microgrids are a solution that are being widely studied, and in many cases, implemented in several locations around the world [
14,
18,
19].
Energy-efficiency (EE) measures reduce the energy consumption in many sectors of society, such as buildings, the transportation, industry, energy industry, and commerce. In residential buildings, these measures are focused on replacing high-consumption and low-efficiency devices for household appliances, lighting, and computing devices [
20,
21]. In many countries, household appliances are identified with energy labeling [
22]. This label shows the electricity consumption of an electrical/electronic device or machine quickly and easily. This labeling consists of a series of letters designated to a particular appliance, where the devices with the letter A are the most efficient and thus have a lower energy consumption. In addition, the application of energy efficiency in the design of off-grid hybrid power systems with renewable and/or non-renewable sources could show how the costs of these types of projects are affected by considering the replacement of low-efficiency equipment with high-efficiency devices in remote locations.
2. Literature Review
Off-grid Renewable Hybrid Power Systems or Hybrid Renewable Energy Systems (HRES’s) can provide reliable, affordable, and clean energy solutions to meet the electrical demand for remote and isolated communities worldwide. In selecting the most appropriate source for electricity generation, researchers and practitioners often weigh in the specific features and constraints of the different available technologies to produce a system with a high probability of success according to a predetermined metric. A wide variety of studies have been proposed to analyze different HRES’s for rural or island electrification using metrics such as economic analysis, technical feasibility, environmental, political, and social considerations and benefits [
9,
23,
24]. A widely-used software tool for analyzing the merits of different combinations of HRES is the Hybrid Optimization of Multiple Energy Resources (HOMER) software developed by NREL [
25,
26]. The use of this tool for simulating HRES’s is presented in the rest of this section.
In [
27], the authors studied the cost and technical benefits for multiple hybrid system alternatives for rural electrification for a remote community in southern India. The authors used HOMER software to simulate seven different combinations of a solar photovoltaic system (SPVS), wind turbine, diesel generator, battery energy storage system (BESS), and hydropower. The authors also found at least four scenarios to be more cost-effective than extending the grid more than 75 km to reach the village. Ultimately, the results show that the HRES system with Wind/SPVS/Hydro/BESS required the least total Net Present Cost (NPC) and a Levelized Cost of Energy (LCOE) of 0.111 USD/kWh. The results also confirm the emission reductions for a system with a higher penetration of renewable energy. A similar approach was used in [
28], where the authors used HOMER to study seven different scenarios for integrated renewable energy systems for a village in Thumkunta, India. The authors included realistic scenarios including wind turbines, diesel generators, batteries, biogas, and SPVS with at least two futuristic scenarios including an electrolyzer, a hydrogen tank, and fuel cells. The results show the minimum LCOE for the future scenarios to be 0.88 USD/kWh while the minimum LCOE for the realistic scenarios was 0.207 USD/kWh. The results also show the need to consider policy incentives and subsidies for these scenarios to compete with conventional LCOE. After tax subsidies, the LCOE can be reduced to 0.18 USD/kWh.
In [
29], the authors performed a feasibility study for integrating renewables to power a community in Popova Island in Russia. Their approach uses multiple Monte Carlo simulations (MCs)-based techniques to define scenarios considering different parameters and uncertainties and feeding them into a HOMER model. The study’s objective was to optimize the design and operation of the system for one year to satisfy the power demand while minimizing LCOE. Eight scenarios were presented of 40,000 combinations of different technologies such as SPVS, wind turbines, BESS, and diesel generators. The results showed that for scenarios where the renewable energy penetration was increased, the LCOE increased. Ultimately, the most feasible and cost-effective scenarios featured an energy mix with a significant contribution of diesel generators and a relatively smaller contribution from renewables (<45%).
In [
30], the authors performed a techno-economic analysis to find the most cost-effective alternative to power an off-grid community on the island of Gilutongan in the Philippines. The community was initially powered through a 194 kVA diesel generator from 18:00 to 22:30. Community members had to pay a fixed rate per light-bulb and per outlet installed in their home, resulting in a total of USD 0.10 to USD 1.20 per day. This study aimed to provide uninterrupted power to the community by considering a combination of Diesel and SPVSs. HOMER was used to analyze two scenarios: a diesel generator/SPVS hybrid system and a stand-alone SPVS. The results showed that both scenarios achieve lower values for NPC and LCOE indicators than the baseline case of the diesel generator providing power throughout the day. However, the diesel generator/SPVS has the lowest NPC and LCOE values while achieving a more significant return on the investment, and thus, was selected as the optimal system design. It is worth noting that the authors did not include the capital costs for the diesel generator as it was already a part of the electric system installed in the community.
A different approach was considered in [
31], where the authors analyzed the economic and environmental aspects of the hybrid renewable energy system in Colombia by using a multi-objective optimization algorithm. This study aimed to limit environmental impacts while selecting the combination of renewable energy technologies with lower costs than electricity production from conventional thermoelectric plants. This paper did not focus on a particular community but instead looked at six locations in Colombia to find suitable sites for HRES’s, including wind turbines and SPVSs. HOMER was used to analyze the energy production from SPVS and wind turbine for each location, prioritizing the site with the lowest NPC and a sizeable renewable energy fraction. Using the results from HOMER, a matrix for NPC and CO
2 production was assembled based on the SPVS’s sizes and wind turbine generators. Then, using MATLAB, two mathematical optimization functions were determined. Using Pareto’s efficiency criteria, both objective optimization functions were minimized to find the optimal system, which resulted in a minimal NPC and CO
2 production.
The review of the literature shows the different dimensions to be considered when studying HRES’s. In addition to technical and economic constraints, political, environmental, and social aspects must be considered. HOMER is highlighted in these papers as a powerful tool to analyze the performance of multiple HRES’s. However, the selection of the different scenarios must be grounded in each community’s political, social, and economic realities and what can be achievable for the sustainable development of each community. This paper shows the technical–economic, operational and environmental feasibility of four off-grid power systems to supply energy to the island community of Cerrito de los Morreños in Ecuador. This community was chosen as a case study due to the interest of some non-governmental entities interested in investing in electricity generation projects in this site. The design of these systems (or configurations) took into consideration an existing diesel generator (165 kW), the site’s renewable energy potential, and an energy-efficiency initiative focused on replacing some specific household appliances and lighting in the community. In addition, the tool used for the evaluation of each configuration was the Homer Pro software, which was used to determine the optimal configuration based on the lowest NPC.
The rest of this paper is organized as follows.
Section 2 illustrates previous works related to renewable and non-renewable power systems.
Section 3 indicates all details that are included as inputs in the analysis, optimizations and simulations of the proposed power systems.
Section 4 presents the outcomes of the modeling, optimization and simulation of each off-grid power system with or without EE initiative, followed by comparisons between these systems. In
Section 5, the results of the simulation studies are discussed. Finally,
Section 6 presents the conclusions of this work.
3. Methodology
This section presents the details of all the input variables used in optimizations and simulations to evaluate each of the four off-grid power systems proposed for this community. The analyses considered in the present section are:
Description of the study area;
Climate conditions;
Configurations for off-grid hybrid power systems;
Estimating the electrical load in the community and energy-efficiency initiative;
Modeling approach;
Components used in the proposed off-grid hybrid power systems.
The methodology for evaluating off-grid hybrid power systems is summarized in
Figure 1. There are three components to consider: inputs, modeling in Homer Pro, and outputs for each configuration. Inputs are included on the left of the diagram and outputs which are used for results and analysis are included in the bottom. The optimization process in Homer Pro finds the least-cost option for distributed renewable and/or non-renewable generation configurations. This tool is among the most advanced software for microgrid design [
32,
33]. The planning horizon for the simulation was set at 15 years based on our experience with Ecuadorian investors who typically want to invest and see results within a 10- or 15-year time frame. That is why we chose this time horizon for our analysis.
3.1. Description of Study Area
The island community of Cerrito de los Morreños is located in the Gulf of Guayaquil, which is settled in an approximate area of 100,000 m
2. The coordinates of this place are 2°28′21.64″ S, 79°54′25.25.25″ W with a maximum elevation of 32 m. This location is surrounded by the Guayas River, which flows before reaching the Gulf of Guayaquil and the Pacific Ocean. The community has a population of 570 people with 106 households [
10,
34]. There are also other buildings such as a police station, a community center, a health center, a church, and a cyber-café.
3.2. Climate Conditions
Due to Ecuador’s location on the Equator, winter and summer are the only seasons in each of the natural regions of this country. Winter is the wet season which runs from January to April, and summer is the dry season, which runs from May to December.
Table 1 shows the annual summary of meteorological data for the area under study. Since there are no weather stations in this area, the data were obtained from [
35]. In Cerrito de los Morreños, the predominant climate is hot and semi-arid [
36] with monthly average temperatures between 23.5 °C and 26.6 °C and annual average air humidity of 70%. In addition, the annual average solar radiation is 4.75 kWh/m
2/day but the average wind speed of 1.9 m/s is low. The months with a higher average wind speed are from July until November, but these do not exceed 3 m/s.
3.3. Configurations for Off-Grid Hybrid Power Systems
Four off-grid configurations to supply electricity to the Cerrito de los Morreños community can be seen in
Figure 2. The main components used in these configurations are PV panels, a diesel generator, and BESSs. Several PV panels make up a PV array. SPVS is equivalent to a PV array in
Figure 2b. Each SPVS is formed by a number “n” of PV arrays, as shown in
Figure 2c,d. There is a solar charge controller between the PV array and the BESS. The design of the system considers charge controllers with Maximum Power Point Tracking (MPPT) as suggested in [
37]. These controllers protect against overloads, and deep discharges to the BESS [
38], one of the most expensive components in off-grid systems. The number of PV panels per controller depends on the maximum input power and maximum input voltage supported by this device.
In the opinion of the authors of this work, these components can be easily used in the proposed configurations since there is a considerable solar resource [
39] and a 165 kW diesel generator on this site. The wind resource is low (
Table 1), so for all the configurations, wind turbines were not considered. During visits to the community, it was determined that there is not a considerable biomass resource. Additionally, the rivers surrounding this community do not have adequate depth and contain much sediment [
40], which would not allow the exploitation of the tidal resource from the site.
In order to better serve the needs of the community, the design of all the configurations consider supplying uninterrupted power 24 h a day throughout the year.
Figure 2a shows the baseline where the generator is the only source of electricity to the community. This scenario would establish a baseline for the amount of carbon savings for the system while delivering uninterrupted power to the community. Currently, the community has a 165 kW diesel generator to run power from 18:00 to 24:00 (midnight) every day, as explored previously. This generator, with its 165 kW output, is being considered in three of the four configurations.
Figure 2b,d are hybrid configurations including both renewable and non-renewable sources. The scenario described in
Figure 2b considers an SPVS/diesel generator configuration. This configuration is considered as an alternative in which the BESS was not considered to reduce capital costs.
Figure 2c is a 100% renewable configuration. Additionally, configurations from
Figure 2c,d have considered DC/DC solar charge controllers to protect the BESS. The scenario in
Figure 2d considers a typical SPVS/diesel generator/BESS configuration to somewhat mitigate CO
2 emissions in the community while providing a stable and reliable energy supply.
3.4. Estimating the Electrical Load in the Community and an Energy-Efficiency Initiative
Table 2 shows the community’s estimated electrical load which will be used to build the daily and annual load profiles. These load data are vital to determine the main appliances that are currently being used in the community. This information was collected in July 2021 using surveys which were consulted to the members of the community in order to know what electrical appliances they have in their respective homes.
Given the significant power requirements for the community, particularly the unusual number of appliances in some homes in the community, we propose an alternative to reduce the number of devices and replace them with more energy-efficient options. It is worth noting that this proposed scenario called “energy efficiency initiative” has not been discussed with the local community, but instead are suggestions that would reduce the total load requirements. Before implementing these proposed changes in the community, they need to be discussed and approved by the community leaders and the community members themselves. The adoption of the energy-efficient guidelines might be challenging as funding options are not being considered at the moment, and the replacement of appliances would have to come “out of pocket” for community members. The proposed changes include replacing:
20 of the 66 existing refrigerators with high-efficiency ones. Each new refrigerator has an estimated consumption of 1.5 kWh/day.
All compact fluorescent, tube fluorescent, and incandescent bulbs with LED lighting.
All washing machines. Here, we propose that washing machines should be grouped into a single facility, such as a laundromat. Some families in the community are used to washing their clothes during the night when the generator is operating. The proposed change will require them to use the laundry machines during the day in periods of higher solar radiation. Additional social guidelines must be included to accommodate a time slot to use the laundromat for each of the 106 families in the community. In this case, the number of washing machines was reduced to 12 machines, and each of the 106 families must be able to carry out laundry activities to a maximum of 3 times per week. These activities must be carried out between 10:00 and 14:00. The electricity consumption of each new washing machine was assumed to be 0.7 kWh per wash. Each machine has a maximum weight capacity of 22 kg.
All street lighting with LED street lamps. The unit power for each new light is 150 W.
The replacement of the household appliances and lighting costs of approximately USD 25,000.
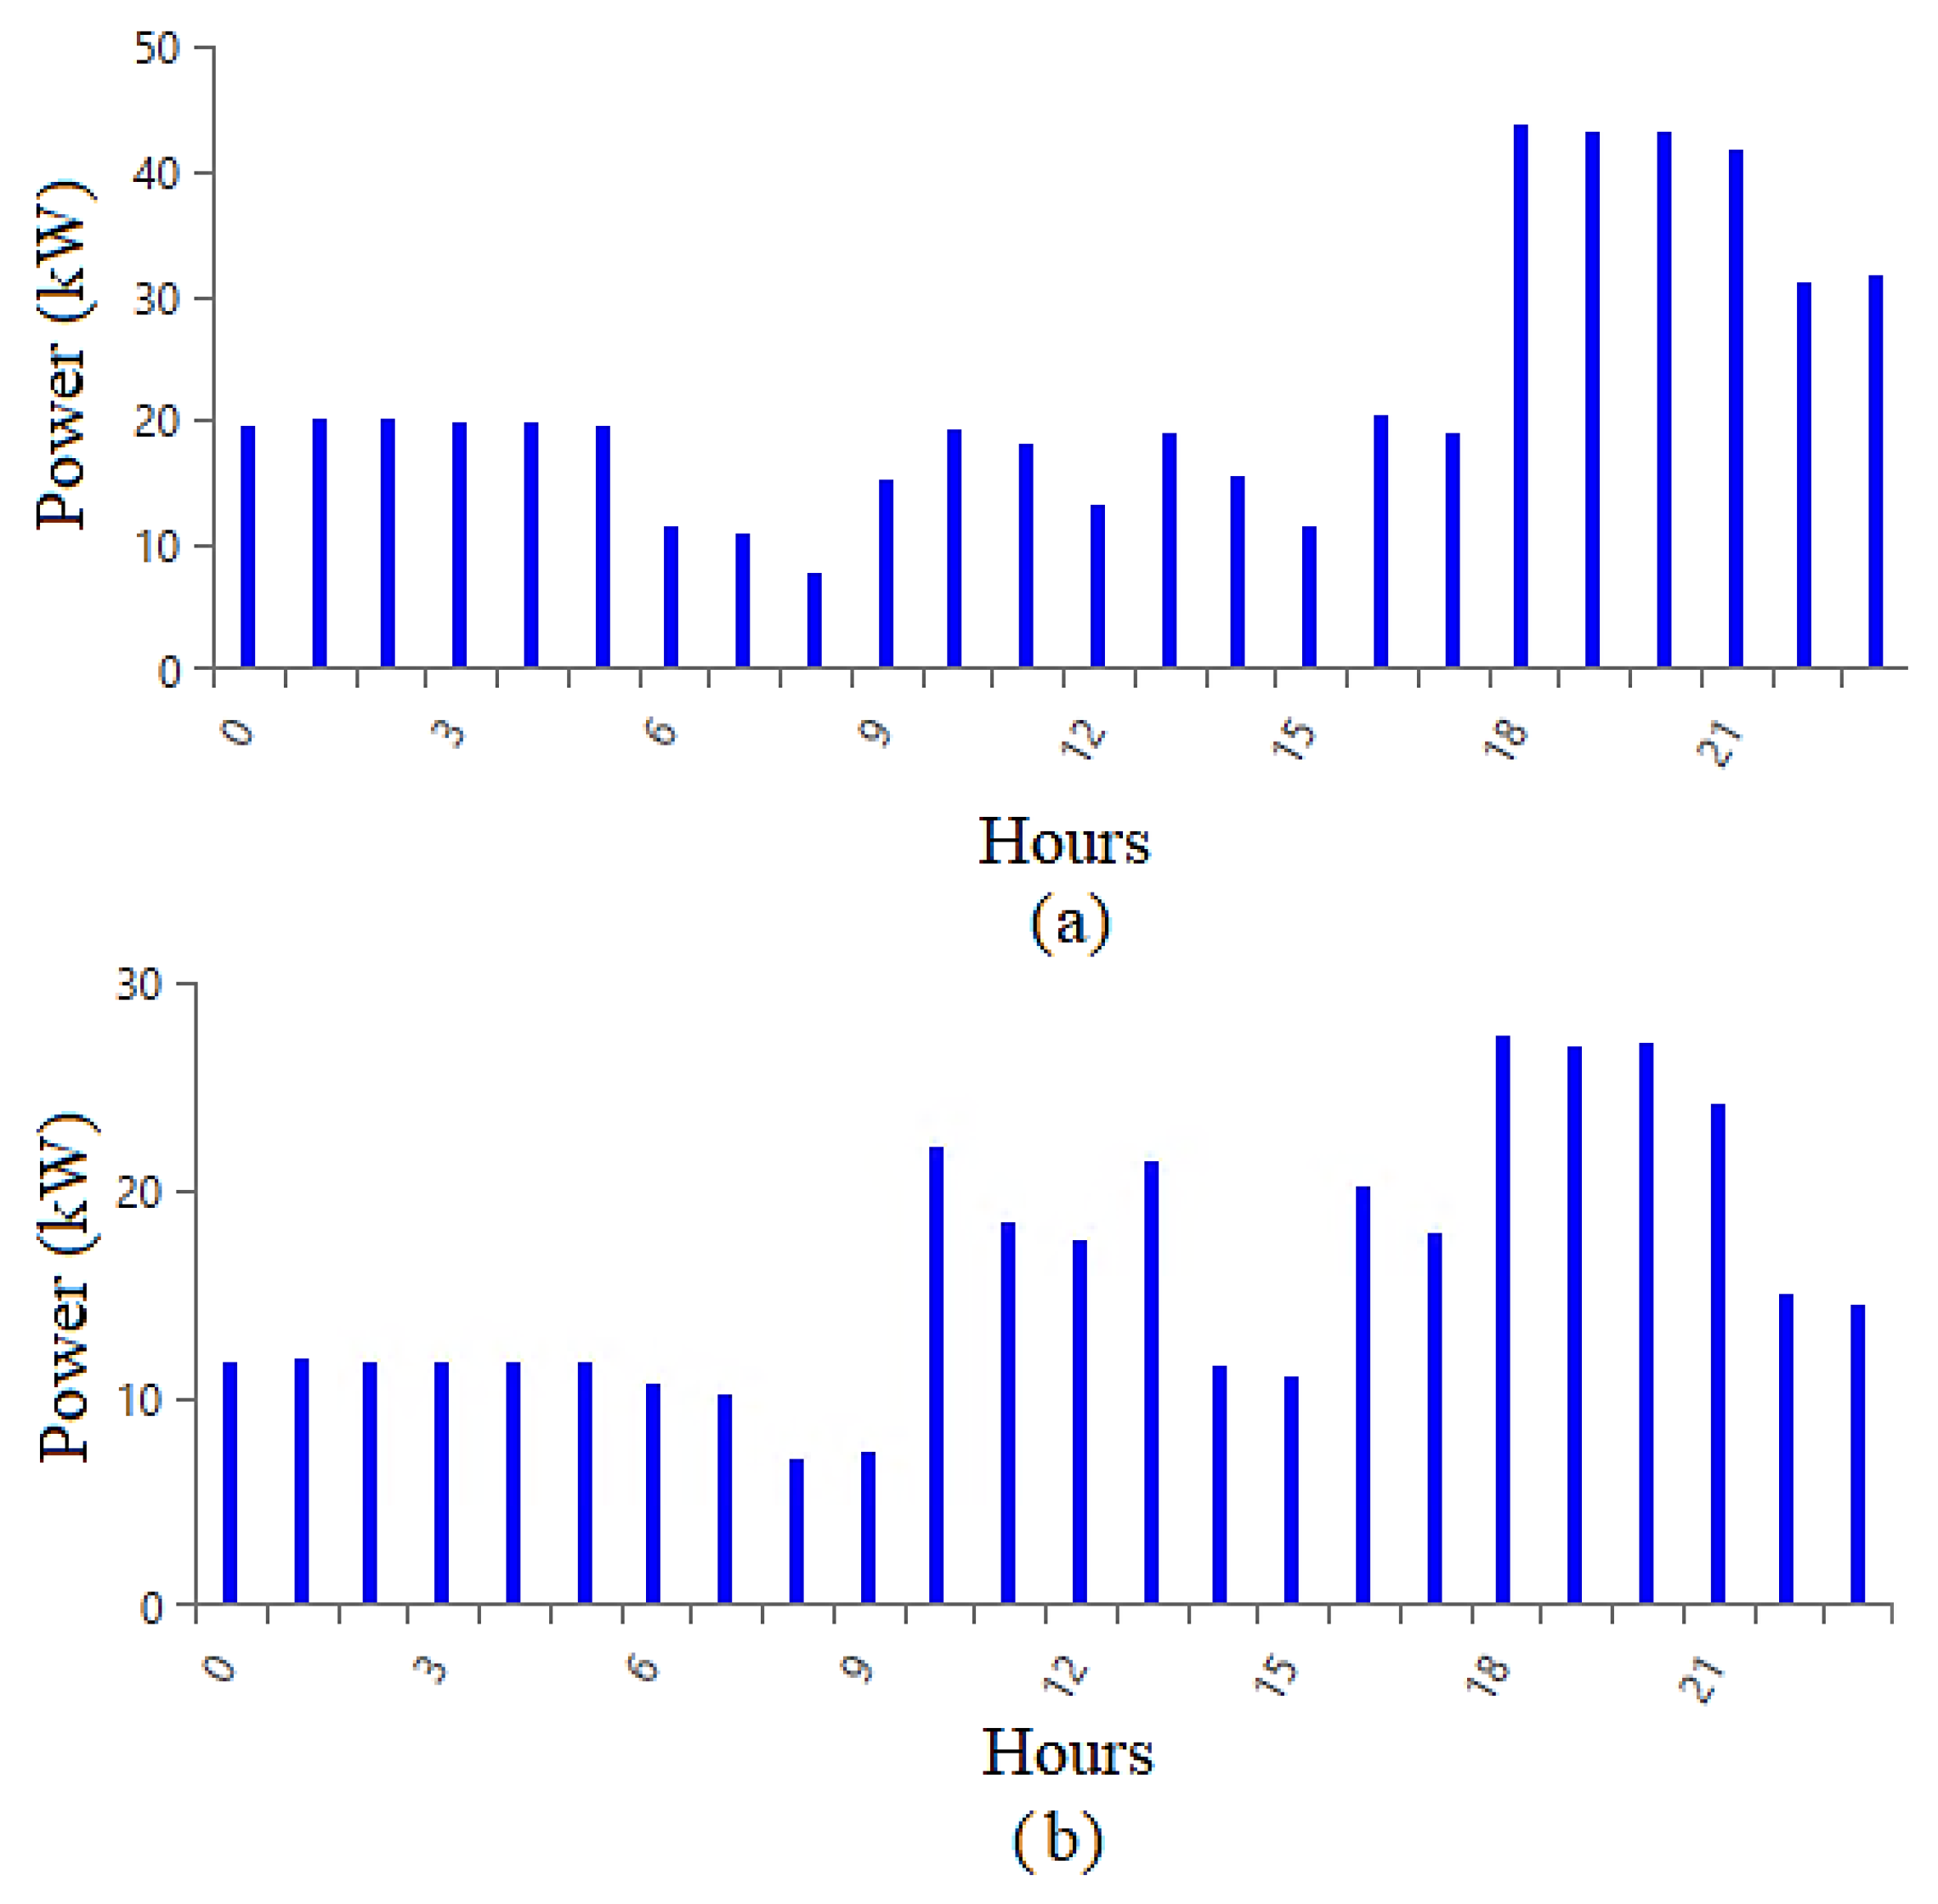
The daily load profiles without and with the EE initiative can be seen in
Figure 3. The daily electricity consumption from
Figure 3a is 545.79 kWh/day and from
Figure 3b it is 391.86 kWh/day. To build the annual load profiles, we considered a daily random variation of ±10% for each proposed daily load profile.
3.5. Modeling Approach
The simulations of the configurations presented in
Figure 2 were performed using Homer Pro software [
25]. This software evaluates the Life Cycle Cost (LCC) of renewable and/or non-renewable power systems, including their respective sizing. LCC is also known as Net Present Cost. The LCC is an assessment of all costs associated with the life cycle of a product or engineering project that are directly covered by one or more decision makers in the product or project life cycle, including the anticipation of eventual costs within a defined planning horizon; LCC is the result of all final costs minus the present value of all revenues during this same period [
41,
42]. Some of the equations used by Homer Pro are presented below:
3.5.1. Output Power of the SPVS
The output power of the
(
) is given by Equation (
1). This equation takes into account the effect of the temperature on the
. The solar radiation data for the site under study were obtained from the Meteonorm meteorological database [
35].
where
is the temperature coefficient of power (%/°C);
is the cell temperature of the PV panels (°C);
is the temperature of the PV panels under standard test conditions—
(25 °C);
is the nominal capacity of the
(power output under
);
is the derating factor of the
;
is the incident radiation in the current time step (kW/m
2), and
is the irradiation under
(1 kW/m
2).
3.5.2. Battery Energy Storage System
Some of the proposed configurations in
Figure 2 used battery-based storage systems to supply stable electricity to the inhabitants of this community. The use of the BESS ensures continuous electrical power supply to the load even at night and during daylight hours with low solar radiation [
9,
43]. The State of Charge (
) of the BESS at a specific time interval as well as the constraints for the available BESS capacity are given by the following expressions [
44,
45]:
where
is the state of charge of the battery at
;
is the charging efficiency; ∑
is the electrical power supplied to the BESS at time
t; ∑
is the discharge power from BESS at time
t;
is the discharge efficiency;
and
are the minimum and the maximum allowable battery bank capacities (kWh) of the BESS, respectively;
is the depth of discharge of the BESS, and
is the maximum hourly discharging power.
3.5.3. Diesel Generator
The diesel generator is a backup power source that can be used to meet the electricity demand that cannot be satisfied by the renewable energy sources or the BESS. The generator’s operating restriction is given by the following equation [
45]:
where the power supply from
can at no time exceed its maximum power
during its operation in the power system. The electricity production of the generator is proportional to its fuel consumption which is given by the following equation [
45,
46]:
where
is the fuel consumption of the diesel generator (L/h);
is the nominal power of the diesel generator (kW);
is the output power of the diesel generator (kW);
is the the generator fuel intercept coefficient (L/h/kW
nominal), and
AG is the generator fuel slope (L/h/kW
out). Both coefficients for the fuel consumption curve are defined according to the operation parameters of the diesel generator.
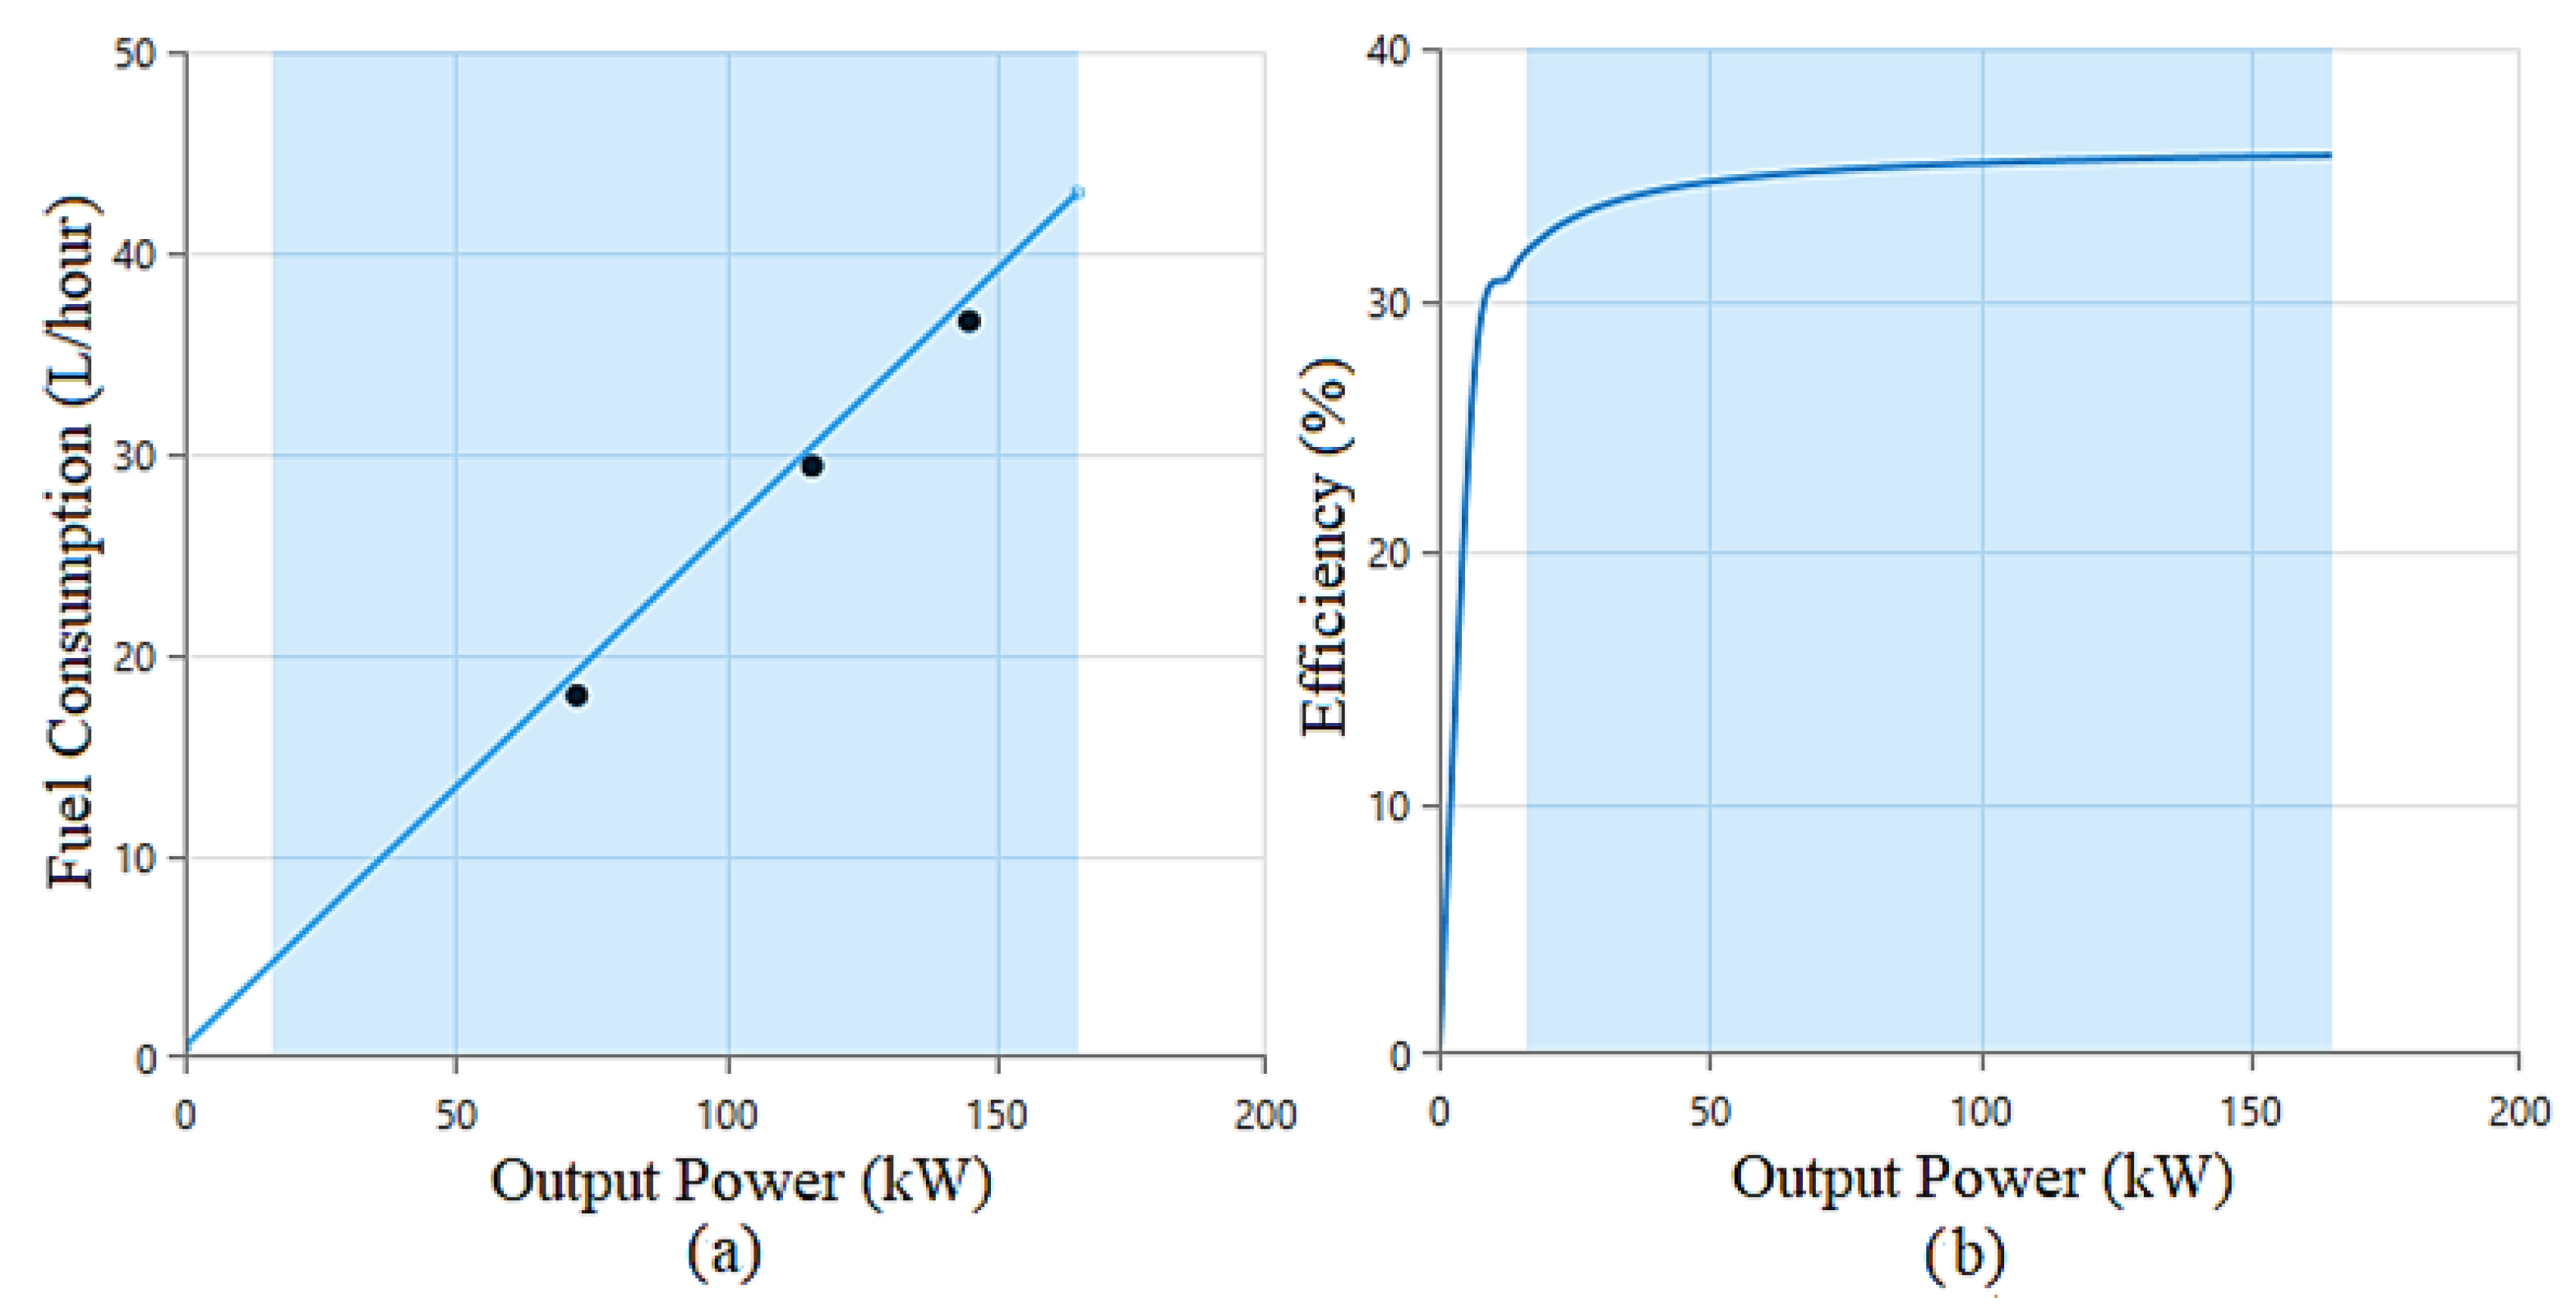
Initially, we created a new diesel generator component from the Homer Pro library. This component must have the operational characteristics of the existing diesel generator in the community. For this purpose, we introduced to the component the data related to power vs. fuel consumption of this generator obtained from its datasheet [
47]. Then, we proceeded to initially model the diesel generator as a preliminary step to use this component in each of configurations under study. The modeling of the 165 kW generator in Homer Pro allowed us to obtain the relationship between power and fuel consumption of the diesel generator, which can be seen in
Figure 4a. The values of
and
were 0.0034 L/h/kW and 0.257 L/h/kW, respectively.
Figure 4b shows the efficiency curve of the 165 kW diesel generator. This component was used in the configurations that are analyzed in the following sections.
3.5.4. Control System
A Load Following (LF) control method was selected for all of the proposed configurations for the system. This dispatch strategy in Homer Pro is based on the fact that whenever the generator is needed in its power system, it produces only enough power to cover the electrical load without charging the BESS [
26]. Additionally, this strategy is optimal in power systems with a high renewable energy penetration, particularly when the demand exceeds the generation capacity. The LF strategy is widely used to reduce the fuel consumption in electric generators, which is beneficial for the environment [
48]. Thus, the LF strategy was selected for the proposed simulations in this paper to maximize the renewable energy production and reduce emissions from the generator and its fuel.
3.5.5. Economic Model
Homer Pro software minimizes the NPC of the target power system. This is represented by the following expression [
42,
49]:
where
is the total NPC,
is the initial investment for the
component in the power system,
is the cash flow for
component,
x is the discount rate (%),
T is the planning horizon (years), and
t is time of the cash flow (year). The minimization of this objective function is subject to the following constraints:
where
is the generator disconnection power (kW),
is the load power (kW),
is the PV fraction (%),
is the electricity generation (kWh/year),
is the input operating reserve as a percentage of load in the time step
t (%),
is the load in time step
t (kWh),
is the input operating reserve as a percentage of annual peak load (%).
The total annualized cost of the entire system (
) is given by Equation (
12) [
48]:
where
is in units of USD/year,
i is the annual real discount rate (%) and
N is the planning horizon (years). Additionally, the levelized cost of energy (
) is obtained by dividing the total annual cost of the target power system in one year over the total energy generated in the same period. It is given by the following expression:
where
is given in USD/kWh, and
is the primary served load (kWh/year).
The costs (
) and salvages (
) of each component
i of the target power system over the planning horizon can be calculated by Equations (
14) and (
15) [
42].
where
is the capital cost of component
i (USD),
is the fixed
cost of element
i (USD/year),
is the replacement cost of component
i (USD),
is the fuel cost of component
i (electrical generator based on fossil fuel) (USD/year),
is the remaining life of the component (years), and
is the component lifetime (years).
3.5.6. Renewable Fraction
The renewable fraction (
) is the fraction of the energy delivered to the load produced from the proposed renewable components in the power system. It is given by the following equation [
9,
45]:
where
(kWh/year) is the electricity generation from non-renewable sources, and
(kWh/year) is the total electricity consumed by the electrical load (Cerrito de los Morreños community). The renewable fraction is inevitably related to the NPC and CO
2 emissions in the system because a system with higher renewable energy penetration will require higher capital costs and will save on CO
2 emissions. Conversely, a system with higher fossil fuel usage will have lower capital costs and will output more CO
2 emissions. The design of hybrid power systems requires the optimization of indicators such as the renewable fraction.
3.6. Components Used in the Proposed Off-Grid Hybrid Power Systems
Table 3 shows the parameters of the different components of the proposed power systems. Homer Pro uses these values for the optimization of the components. The interest rate considered for the calculations was 6% and the planning horizon was 15 years. Additionally, two fuel prices were considered for the simulations: 0.93 USD/L and 1.25 USD/L. The current price of fuel in this community at the time of this work was 0.93 USD/L. Currently, Ecuador is in the process of eliminating fuel subsidies [
9]. In view of this, fuel prices are gradually increasing month-by-month and the value of 1.25 USD/L is expected to be reached in the next year.
4. Results
This section shows the analysis, optimization, and simulation of the four renewable and non-renewable power configurations considered. Since the community has a 165 kW diesel generator, this equipment was modeled with its operating characteristics in three of the four proposed configurations. Two scenarios were analyzed for each configuration: (1) Configuration with Energy Efficiency Initiative (CEEI) applied to the load, and (2) Configuration without Energy Efficiency Initiative (CWEEI) applied to the load, i.e., the configuration with the current electrical load of the community. In both the CEEIs and CWEEIs scenarios, we assumed a 1% yearly increase in the electricity consumption for the community. In the first year, the total electricity usage for CEEI and CWEEI was 143,028 kWh and 199,213 kWh, respectively. Homer Pro also selects the best configuration based on the scenario with the lowest NPC. As described before, the planning horizon for the project is 15 years. The authors chose the results for year 15 to analyze the simulation scenarios because it is the scenario where the community’s electricity consumption is at the highest level for the planning horizon of the project.
4.1. Configuration 1: Stand-Alone Diesel Generator
This configuration has the diesel generator as the main power source to supply electricity to the community (
Figure 2a). Because this equipment already exists in the community, its initial capital cost was not considered. Thus, only fuel costs, as well as Operations and Maintenance costs, were considered. Therefore, the NPC is the sum of the last two mentioned costs. The fuel price was considered as a sensitivity variable, taking values of 0.93 USD/L and 1.25 USD/L.
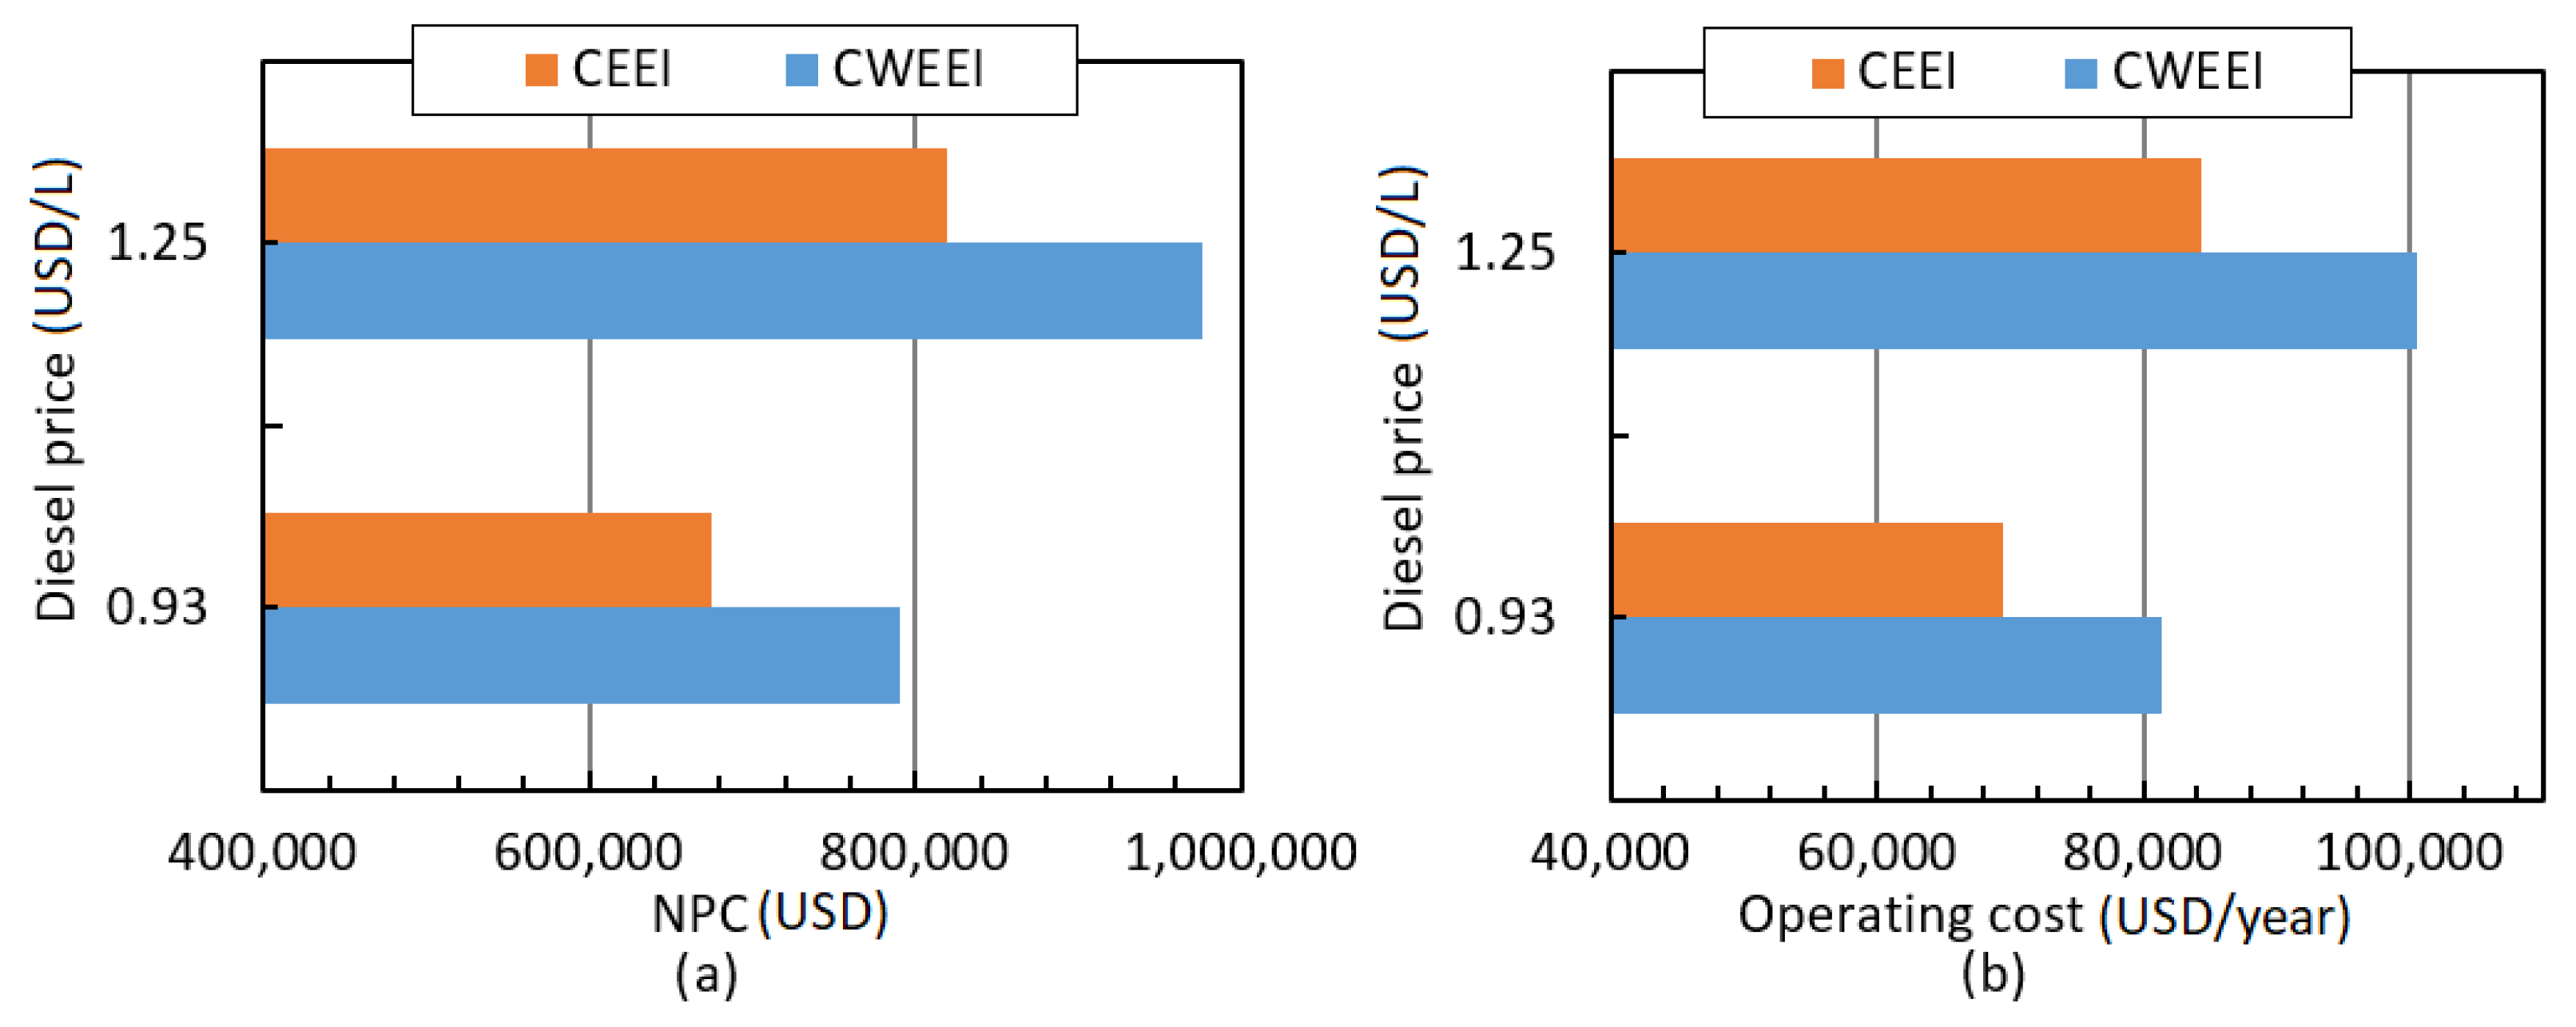
Figure 5 shows the results of NPCs and Operating Costs for the CEEI and the CWEEI.
The results show that the CEEI had a 15% lower NPC with respect to the CWEEI, independent of the fuel price. A similar difference was found for the annual operating costs for CEEI and CWEEI with both fuel prices.
As shown in
Figure 5, the optimal configuration considered the fuel price of 0.93 USD/L for both CEEI and CWEEI.
Table 4 shows the operational and economic values obtained in the simulations of the CEEI and the CWEEI.
The CEEI reduced fuel consumption by about 22% compared to the CWEEI. This reduction can also be reflected in both the generator’s energy production and its fuel cost. Although the LCOE was higher in the CEEI, the NPC and the primary load served were lower in this scenario compared to the CWEEI. In addition, the Operations and Maintenance cost was USD 253,751.93 for both configurations during the planning horizon.
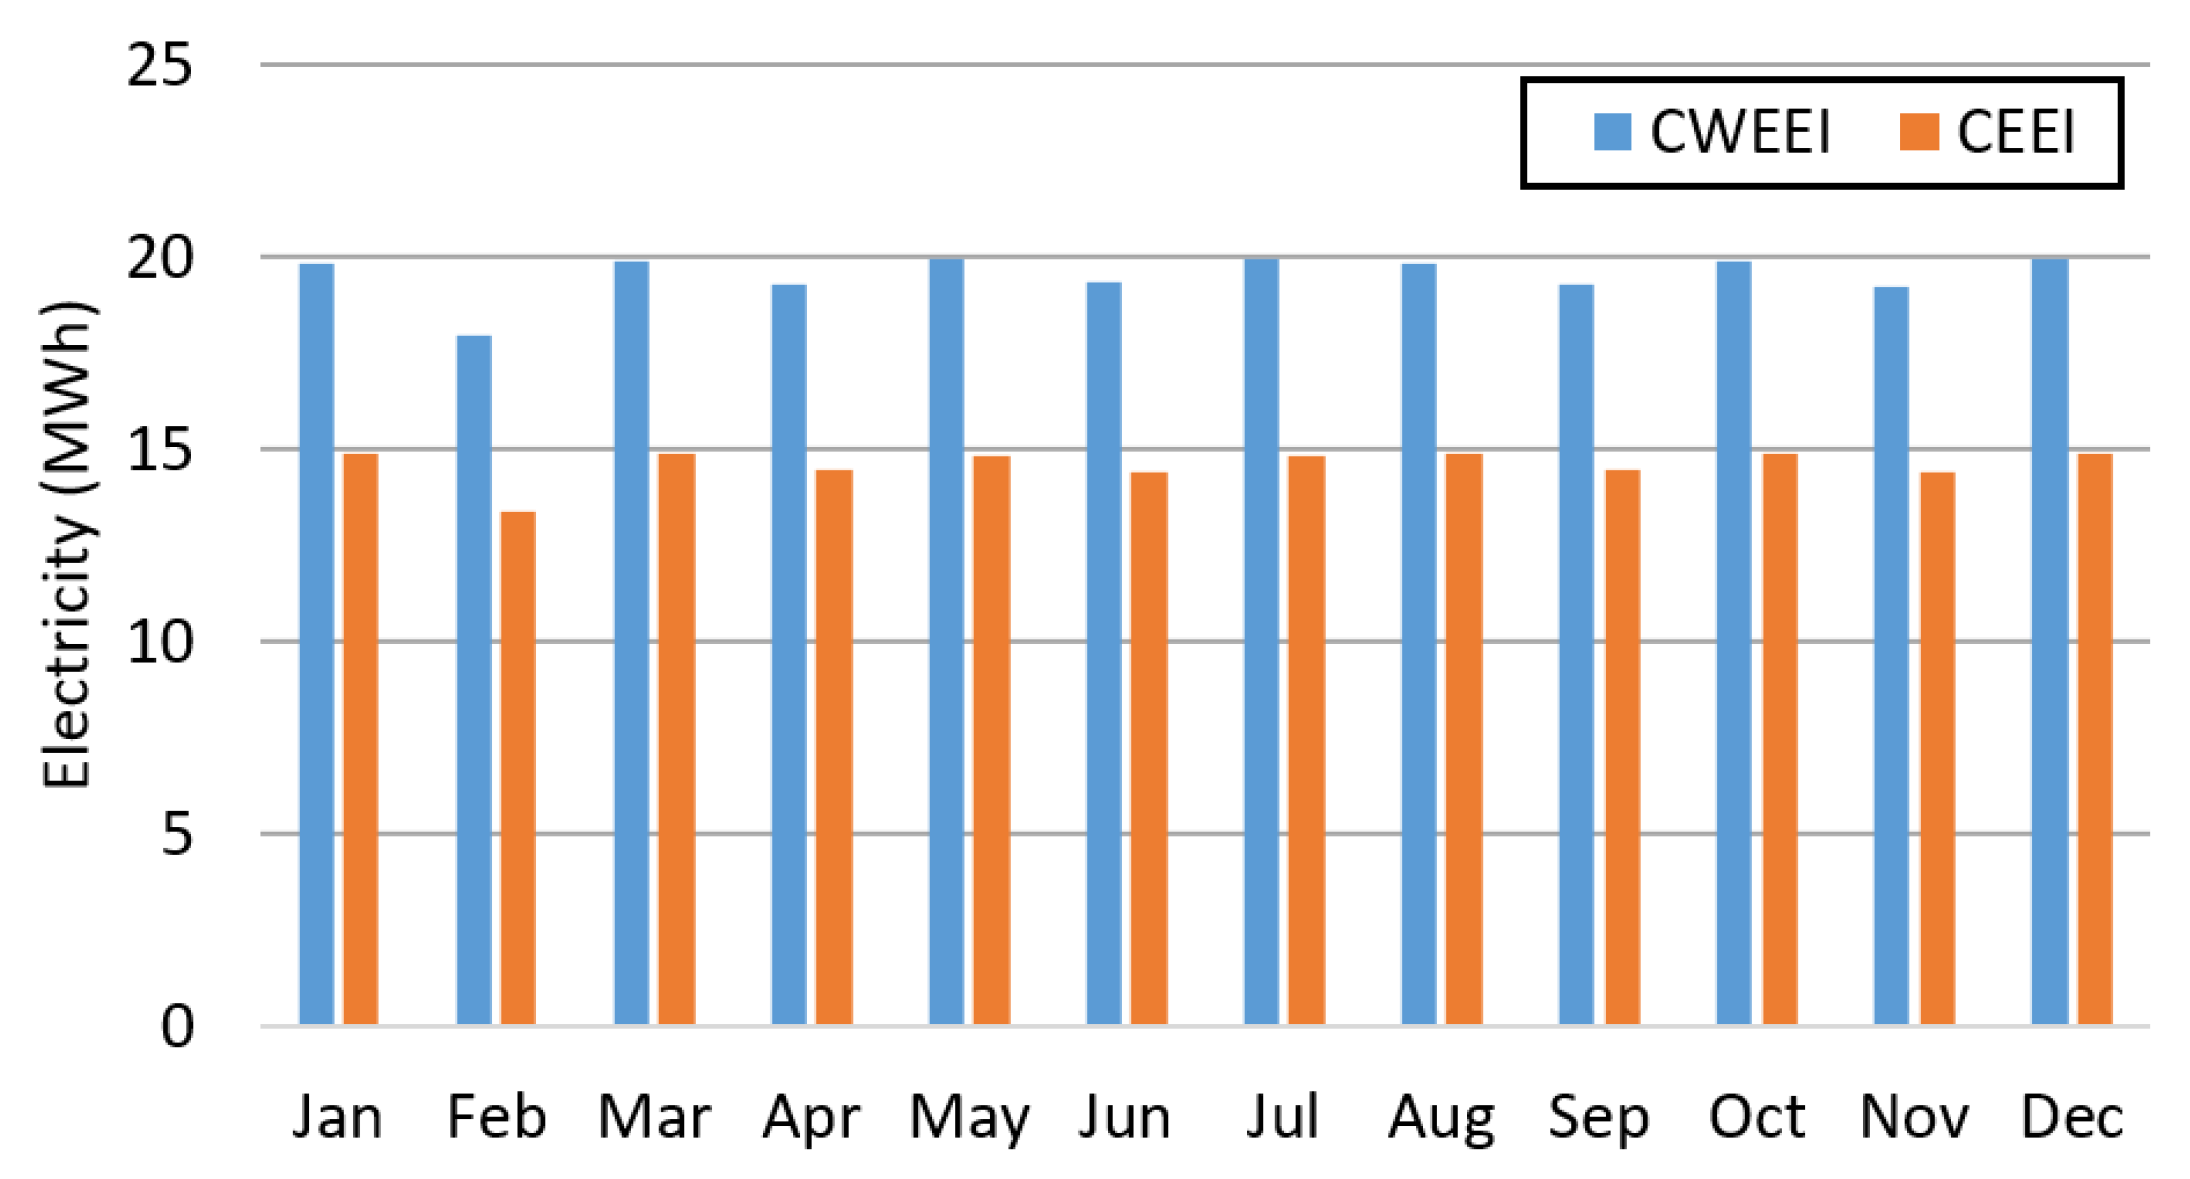
The diesel generator output in year 15 for the CEEI and the CWEEI cases can be seen in
Figure 6. The generator output for the CEEI during this year was 175.04 MWh, with an excess of 10,630 kWh/year (6.07%). Similarly, in the CWEEI, the generator produced 234.07 MWh with an excess of 5082 kWh/year (2.17%).
4.2. Configuration 2: SPVS/Diesel Generator
This configuration has as power sources the diesel generator and an SPVS (
Figure 2b). The SPVSs sizes considered were 1 kWp, 3 kWp and 4 kWp. As in the previous section, the fuel prices considered were 0.93 USD/L and 1.25 USD/L.
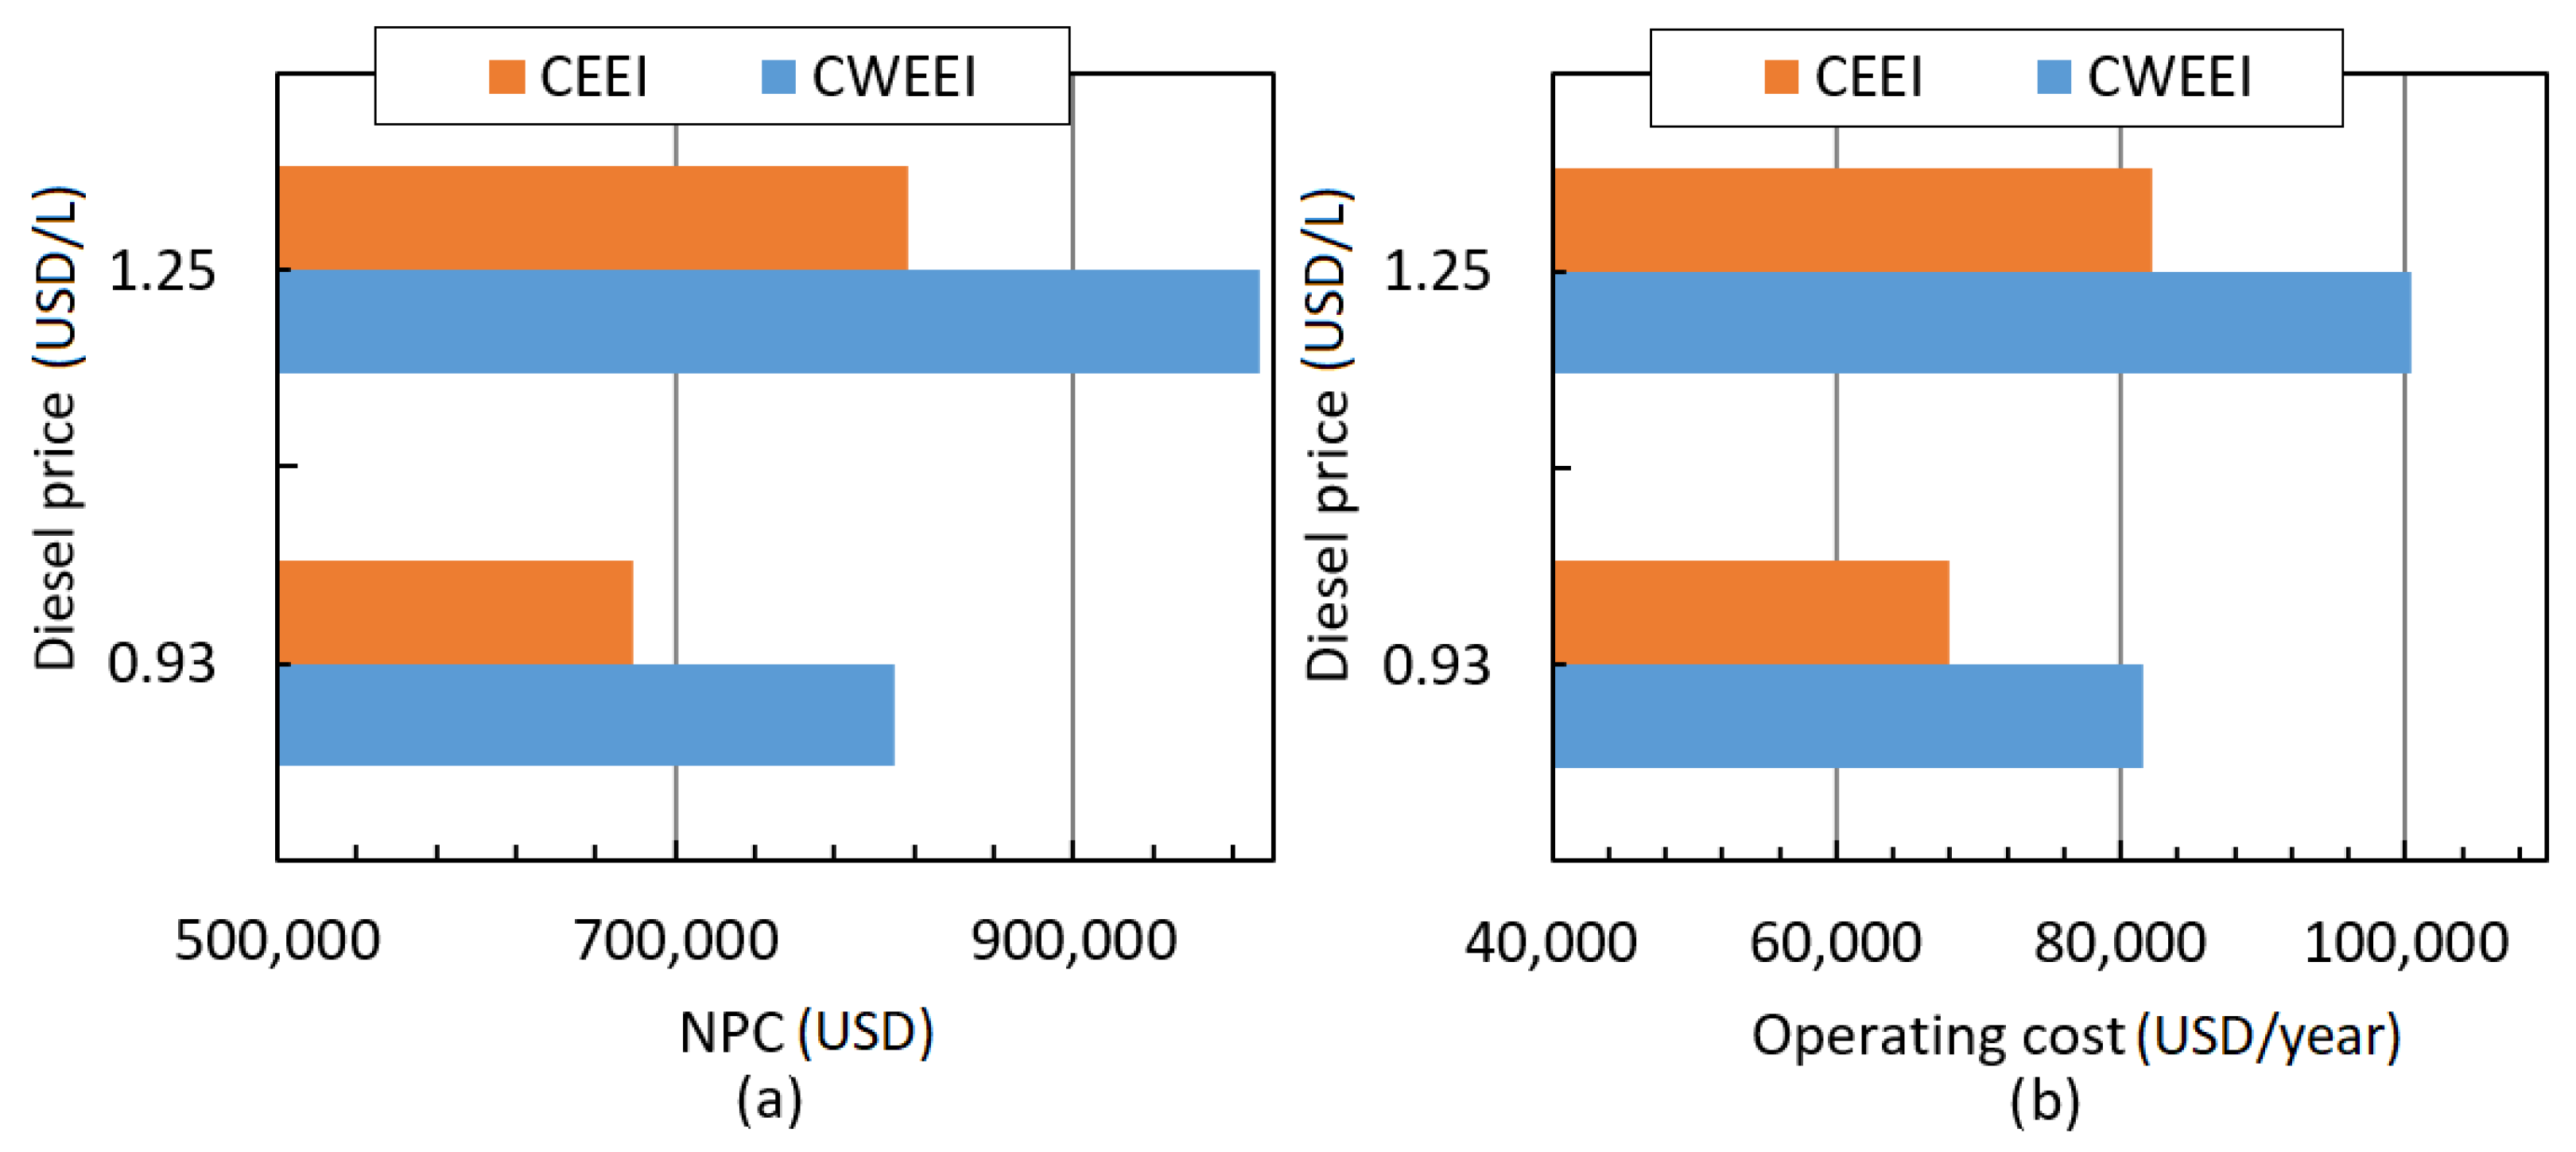
Figure 7 shows the results of NPCs and Operating Costs for the CEEI and the CWEEI in their optimal scenarios.
The optimal size of the SPVS at the CEEI resulted in 4 kWp with a fuel price of 0.93 USD/L. Similarly, for the CWEEI, the optimal size was 3 kWp with a fuel price of 0.93 USD/L. In both cases, larger SPVSs sizes produced an instability warning in each configuration. The instability issue is associated with a lack of energy storage in the system. Thus, when there is a drop in solar radiation, the load is not being met, which leads to the instability warning. It should be noted that an in-depth configuration instability problem analysis was not within the scope of this study. In the case of the optimal configurations (0.93 USD/L), the CEEI resulted in a reduction in the NPC of USD 131,499 (16.23%) with respect to the CWEEI (
Figure 7a). A similar percentage reduction occurred in annualized operating costs (
Figure 7b).
Table 5 shows a summary of the operational and economic details of the CEEI and the CWEEI. The slight difference in initial capital costs is due to the increase in the SPVSs size in the CEEI in 4 kW compared to the 3 kW in the CWEEI. Similarly, the fuel reduction was about 25% in the CEEI compared with the CWEEI. The electrical efficiency of the generator in the CWEEI was 33.9% compared to 33.1% in the CEEI. This higher efficiency in the CWEEI indicates that the generator consumes less fuel per kWh produced, i.e., 0.274 L/kWh against 0.281 L/kWh in the CEEI.
The electricity production of the CEEI and the CWEEI in year 15 can be seen in
Table 6. Due to the small size of the SPVSs in both scenarios, the electricity production from these panels was negligible in each of the years of the planning horizon. In addition, the excesses of electricity were 7.05 MWh and 20.86 MWh for the CWEEI and the CEEI, respectively.
4.3. Configuration 3: SPVS/ BESS
This configuration is 100% renewable, as can be seen in
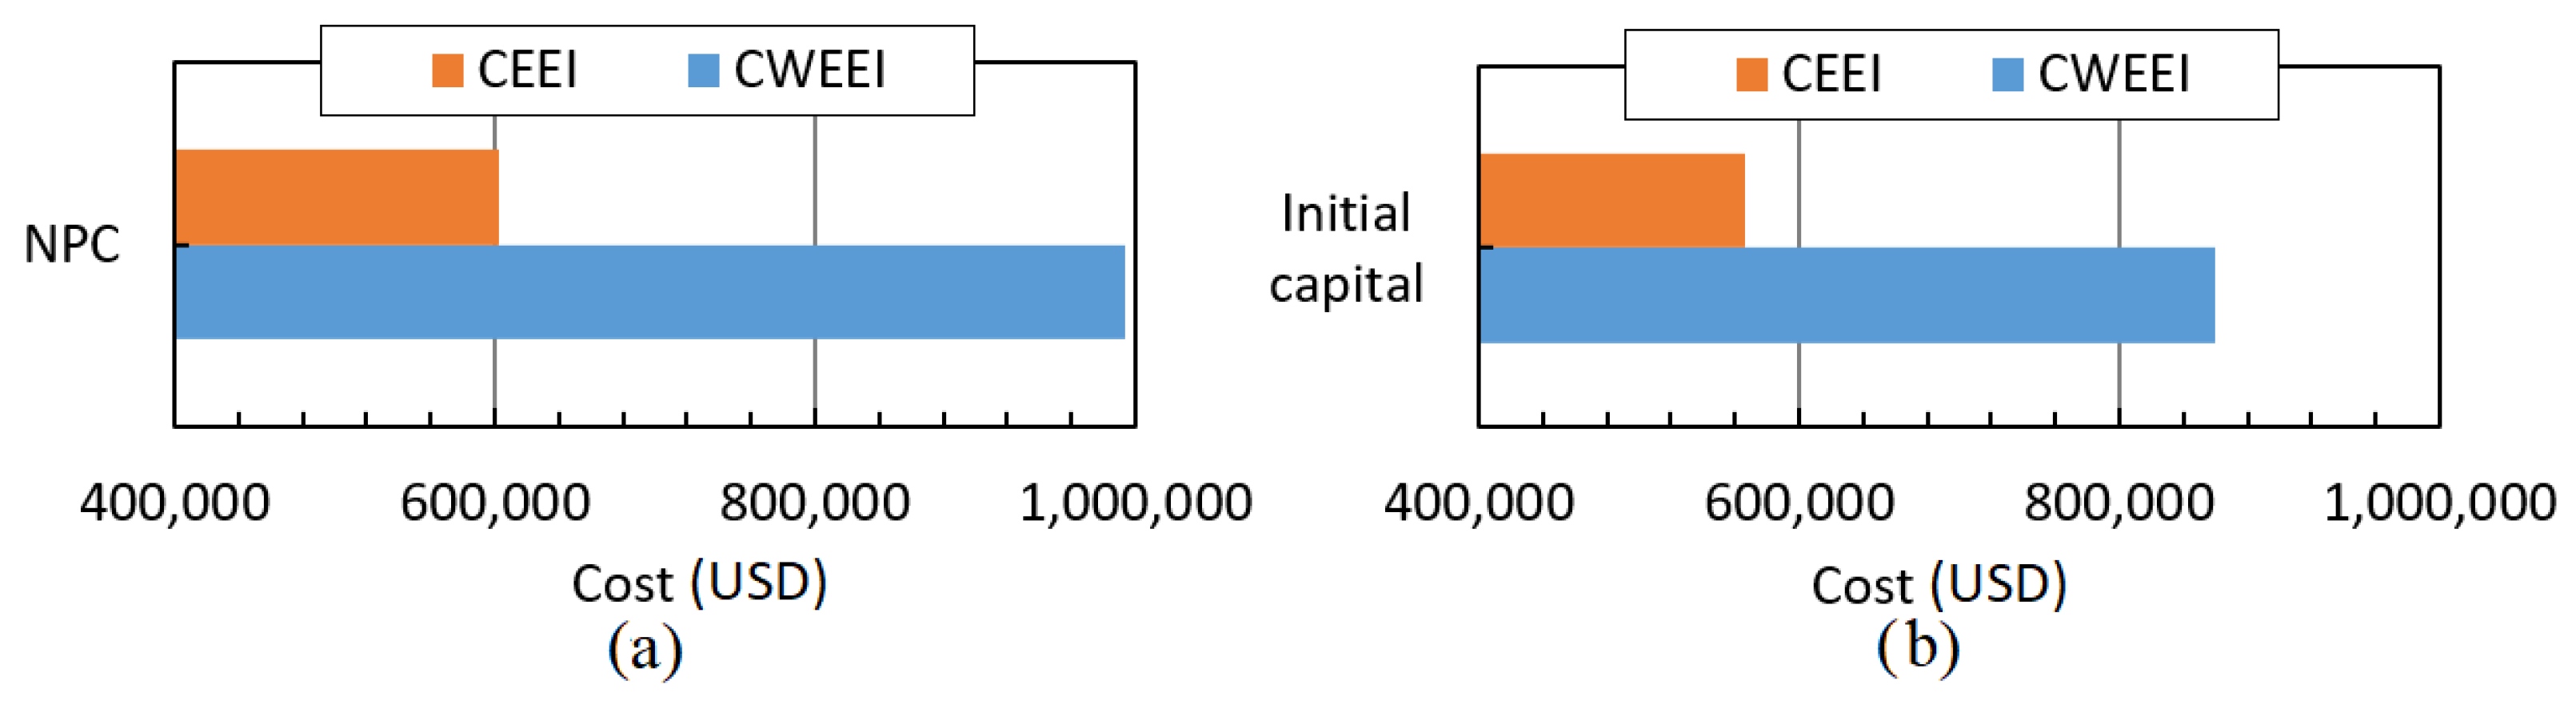
Figure 2c. Both CEEI and CWEEI were optimized with various sizes of SPVSs. The SPVSs sizes considered in CEEI were 150 kWp, 200 kWp, 240 kWp, 300 kWp and 340 kWp. Similarly, the SPVSs sizes considered in CWEEI were 200 kWp, 340 kWp, 540 kWp and 600 kWp. The results of the optimal configurations are presented in this section. NPCs and initial capitals for optimal solutions for both CEEI and CWEEI can be seen in
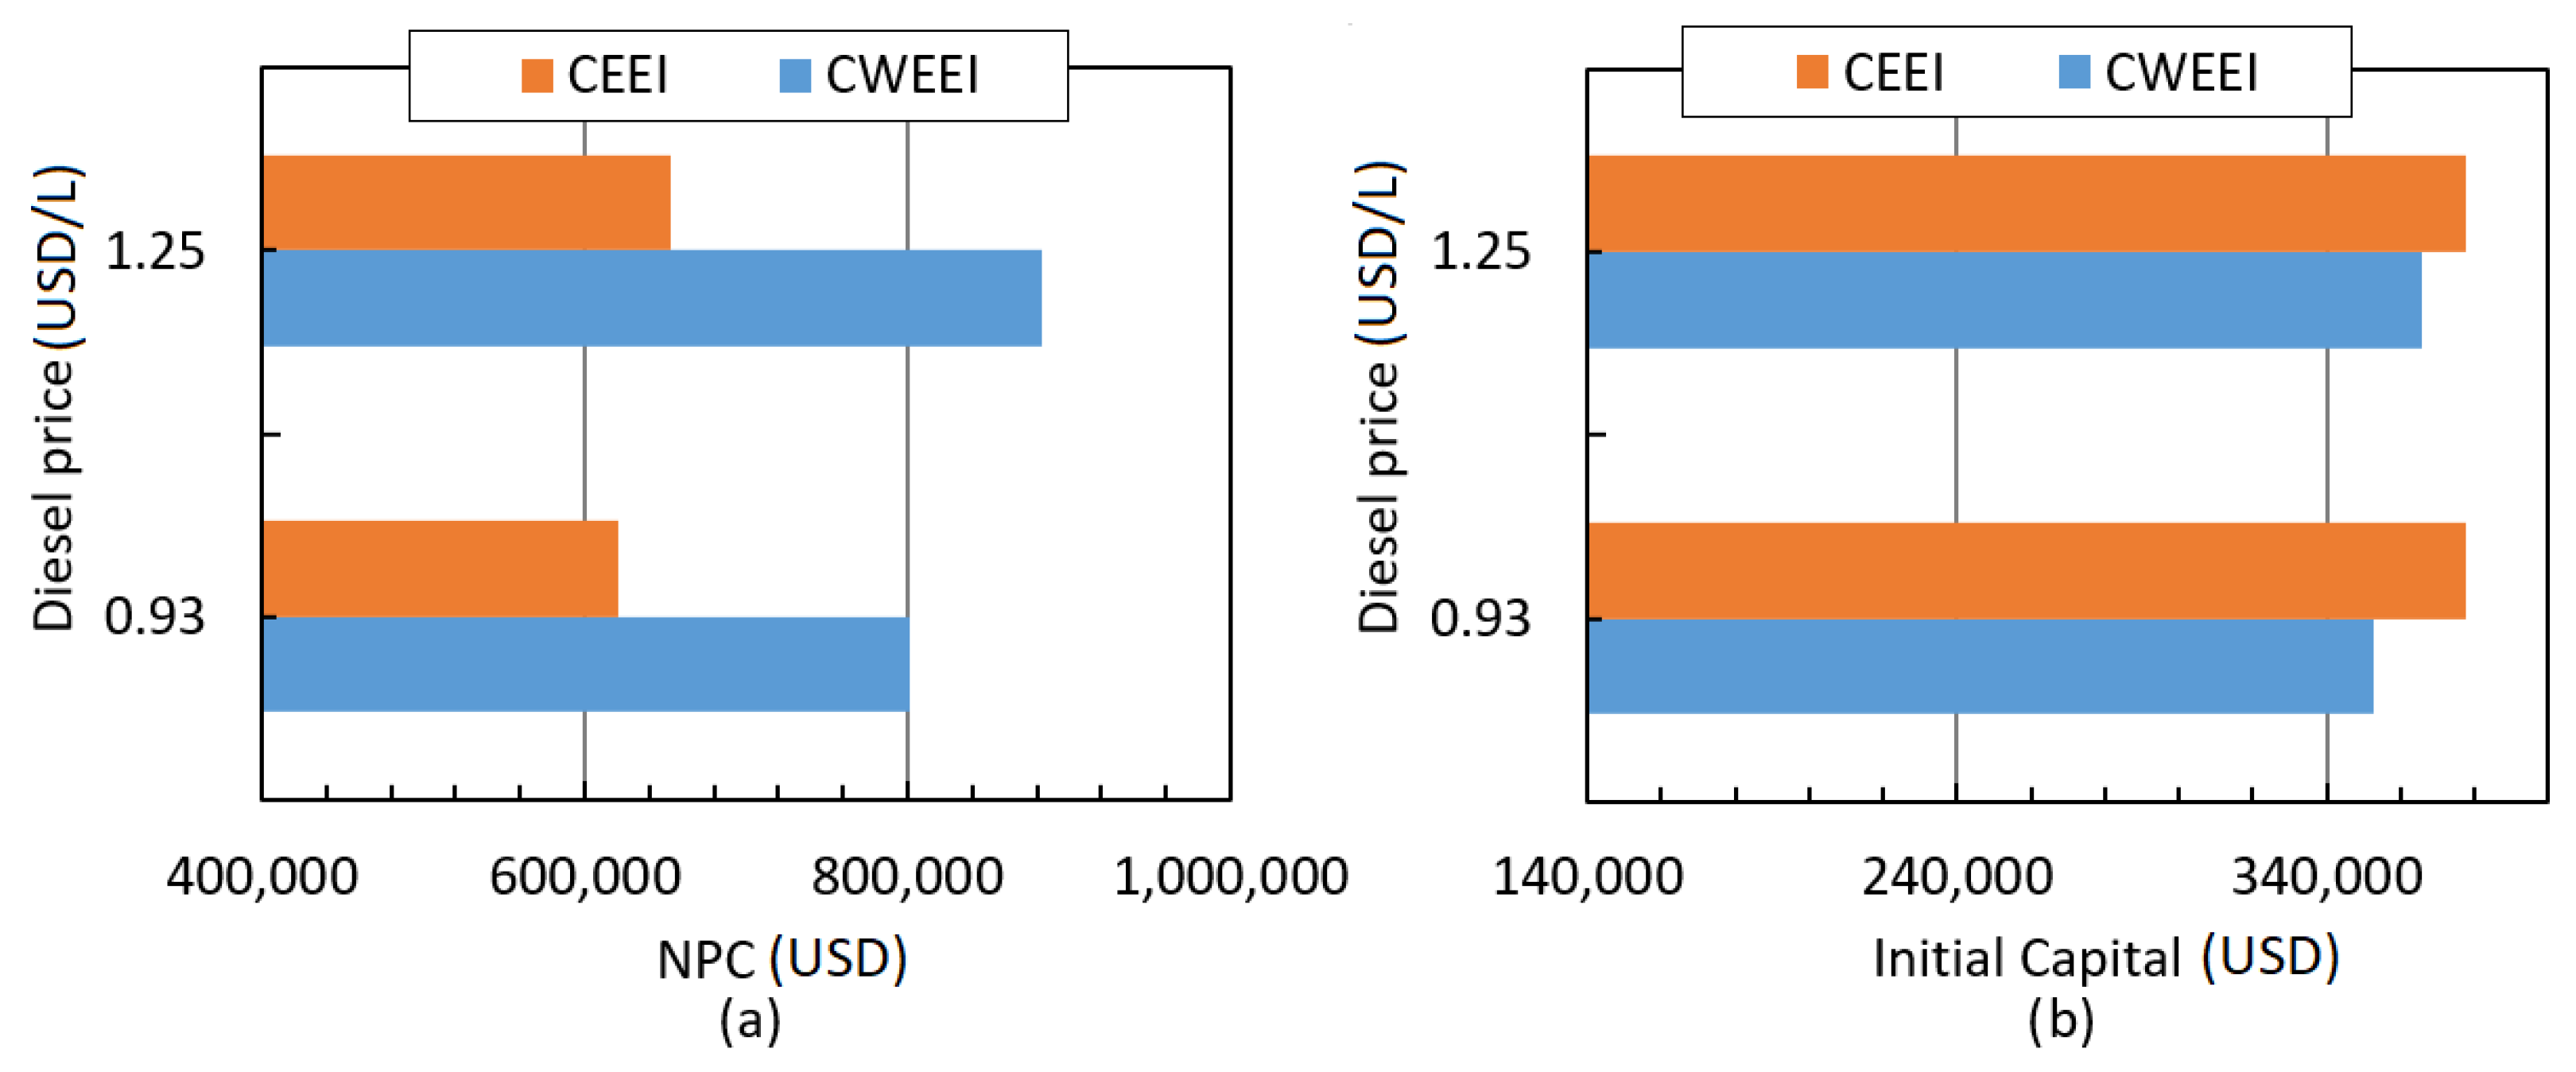
Figure 8a,b. As can be seen in
Figure 8a, the NPC of the CEEI was reduced by about 40% with respect to the value of the CWEEI. The energy efficiency initiative applied to the community allowed for the reduction mainly in the capacity of the BESS, which is one of the most expensive components in this type of power system. This was also reflected in the reduction of about 34% of the initial capital between these configurations (
Figure 8b). Additionally, the LCOEs were 0.421 USD/kWh and 0.498 USD/kWh for the CEEI and the CWEEI, respectively.
The operating results of the CEEI and the CWEEI are given below.
The optimal SPVSs size in CEEI was 240 kWp with average annual production of 344,387 kWh. The maximum power output of the SPVS was 223 kW with an average output of 40.2 kW. The number of PV panels required was 534, so two solar charge controllers were required [
55]. Likewise, the number of batteries used for the BESS was 120 in a single series string for a DC bus voltage of 240 V. The nominal capacity of the BESS was 707 kWh with an average annual loss of 15,709 kWh and an autonomy of about 40 h. In the case of the power converter, its maximum output was 36.3 kW with an average output of 16.3 kW. The input energy of this equipment was 148,960 kWh/year, and the output was 143,002 kWh/year, which indicates that the losses were 5958 kWh/year.
The optimal SPVS’s size in CWEEI was 540 kWp with an average annual production of 774,870 kWh. The maximum power output of the SPVSs was 502 kW with an average output of 90.5 kW. The number of PV panels required was 1200, so five solar charge controllers were required [
55]. Likewise, the number of batteries used for the BESS was 120 in a single series string for a DC bus voltage of 240 V. The nominal capacity of the BESS was 964 kWh with an average annual loss of 24,748 kWh and an autonomy of about 33.9 h. In the power converter, its maximum output was 51.9 kW with an average output of 22.7 kW. The input energy of this equipment was 207,469 kWh/year and output was 199,171 kWh/year, which indicates that the losses were 8299 kWh/year.
The configuration without the energy efficiency initiative nearly doubled the number of PV panels. Additionally, there was an increase of 26.6% in the nominal capacity of the BESS.
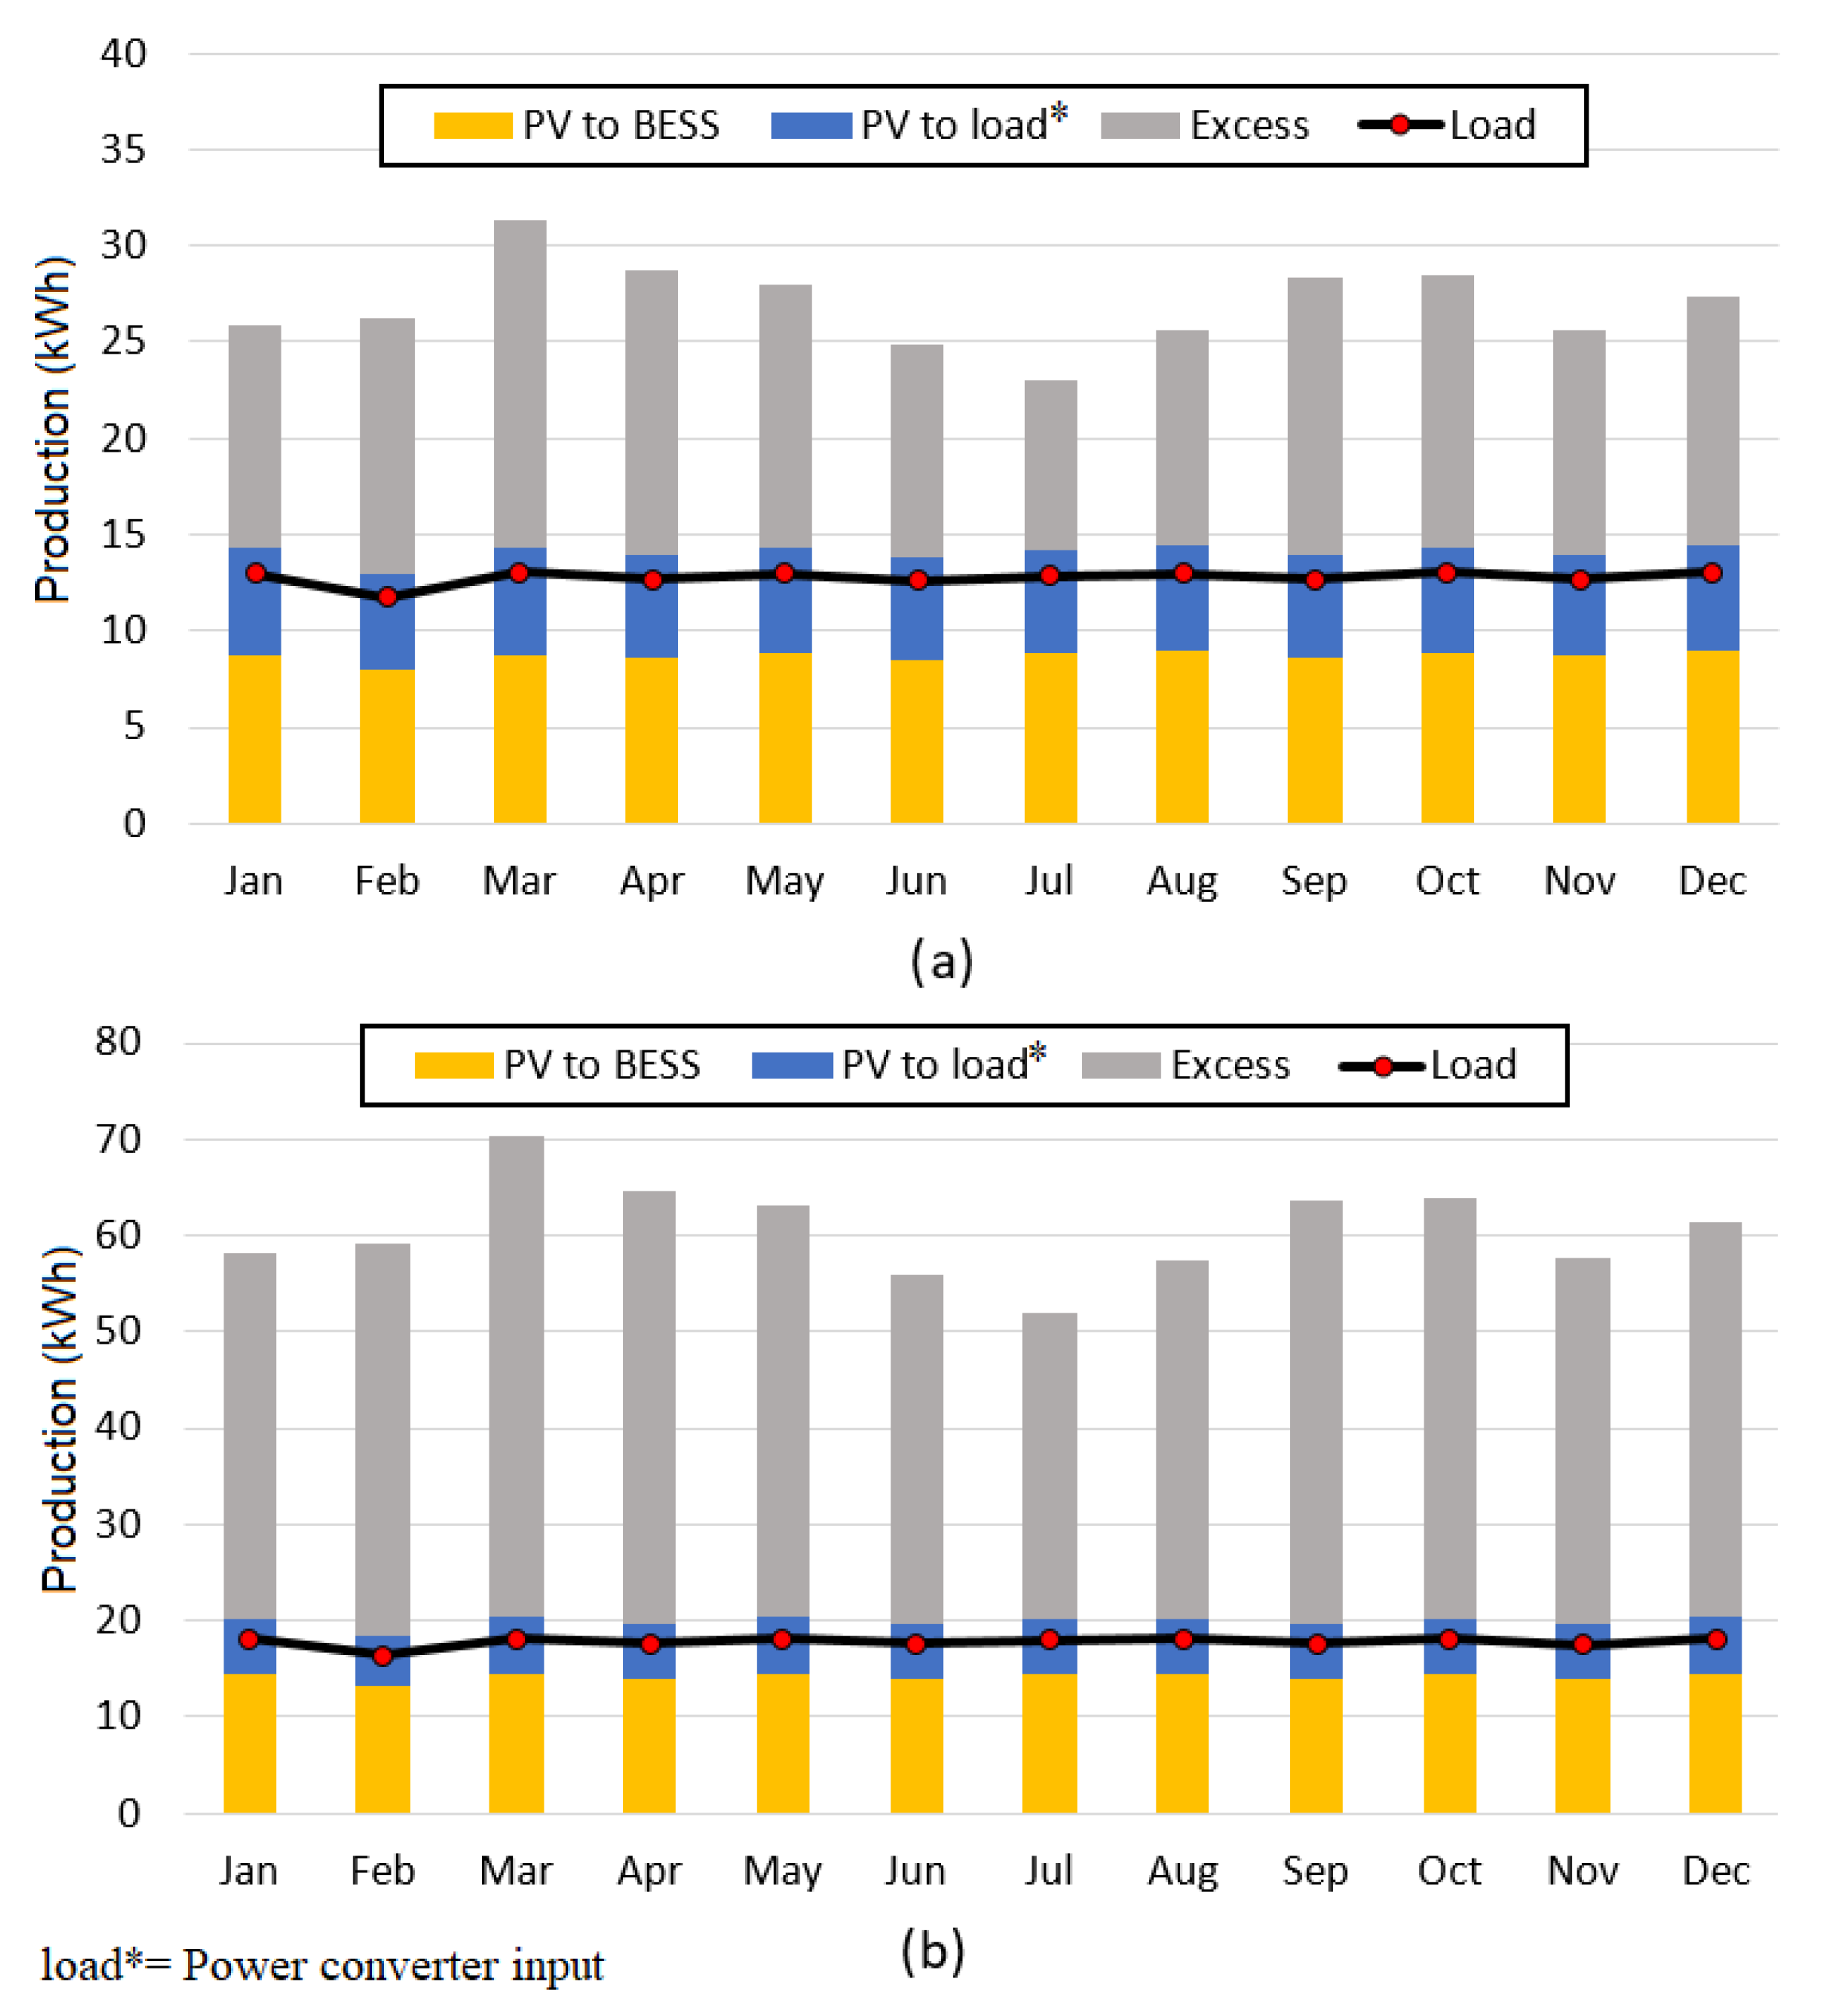
Figure 9 shows the monthly production from the SPVSs, and the community energy consumption in year 15. The energy of the SPVS is distributed to the BESS, the power converter input and the load. Excesses of electricity occur on days when solar production is higher than the community’s electricity consumption and with the BESS fully charged. At the CEEI, the excess of electricity was 160,774 kWh/year and 508,684 kWh/year for the CWEEI.
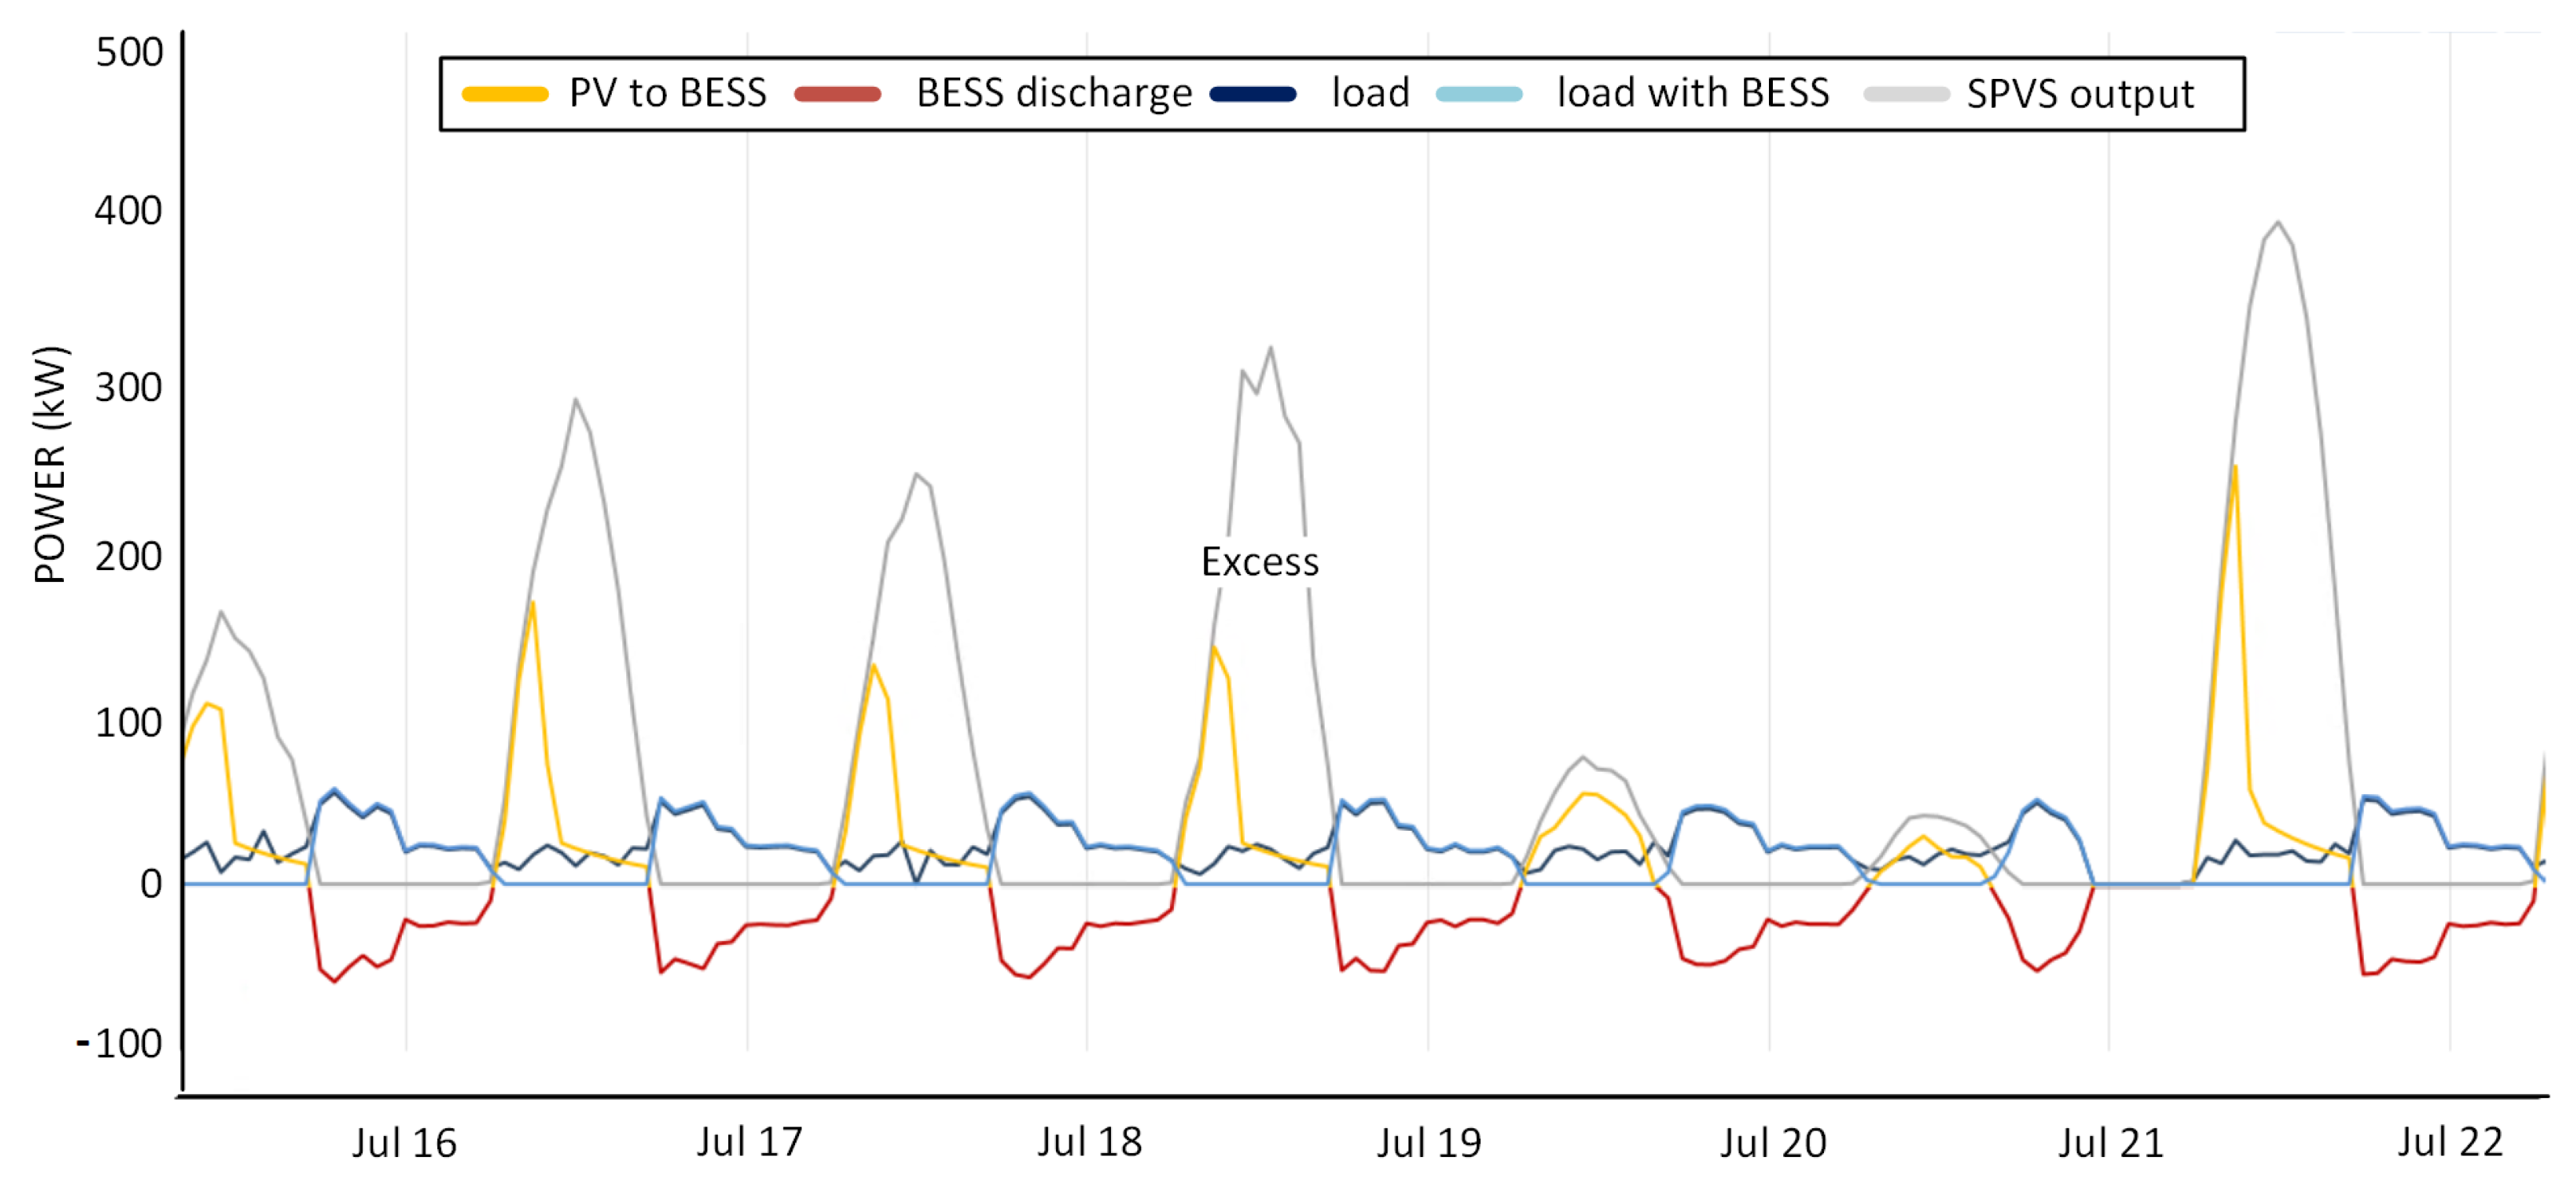
The results for the CEEI and the CWEEI showed that the optimization and simulation proposed by Homer Pro follows the behavior of the load profile for the community, which is higher at night, as shown in
Figure 10. This figure shows a time interval in the month of July in the CWEEI. In periods of low solar radiation and low state of charge from the BESS, the energy demand consists mainly of the charging of the BESS for evening use and load demand from the community, turning the BESS into a load until it is fully charged (100% State of Charge). In this scenario, the SPVS is the only source. Thus, the SPVS requires many PV panels to meet the demand. In other conditions during the year, the BESS can be charged entirely early in the day. Afterward, energy generated from the SPVS but not consumed by the load is the excess energy, as shown in
Figure 9a,b. This type of behavior was expected given the requirement to supply the evening demand completely from the BESS. In alternative scenarios where a diesel generator or an alternative energy source is available, these sources can partially support the evening load, and thus the excess energy will be significantly lower. This scenario requires creative thinking to take advantage of the excess energy to be used in other applications such as water pumping.
4.4. Configuration 4: Diesel Generator/SPVS/BESS
This configuration operates with renewable and non-renewable electricity sources, as shown in
Figure 2d. Both CEEI and CWEEI were optimized with various sizes of SPVSs and two fuel prices. In the CEEI, the optimal SPVS’s size was 160 kWp for both fuel prices (0.93 USD/L and 1.25 USD/L). In CWEEI, the optimal SPVS’s sizes were 130 kWp and 150 kWp with fuel prices of 0.93 USD/L and 1.25 USD/L, respectively. The results of the optimal configurations are presented in this section. NPCs and initial capitals for optimal solutions for both CEEI and CWEEI can be seen in
Figure 11.
In the case of the fuel price of 0.93 USD/L, the NPC of the CEEI was reduced by about 23% relative to the CWEEI (
Figure 11a). Similarly, at the fuel price of 1.25 USD/L, the reduction in the NPC of the CEEI was 26%. However, CEEI showed a slight increase in the initial capitals compared to the CWEEI at both fuel prices (
Figure 11b). This is expected, as higher renewable energy penetration often requires higher capital costs than other power systems such as diesel generators where the bulk of the cost is in fuel and Operations and Maintenance. The results obtained showed that the CEEI had a higher sizing of PV panels than the CWEEI, increasing the number of solar charge controllers.
Table 7 summarizes the operational and economic values of the CEEI and the CWEEI, considering the optimal solutions (fuel price of 0.93 USD/L). In the CEEI, the operating costs were considerably reduced with respect to the CWEEI because the penetration of renewable energy was around 74.3%. In addition, it allowed for the reduction in the generator operating hours and other parameters related to its operation.
The operating results of the CEEI and the CWEEI are presented below.
The SPVS of 160 kWp in CEEI generated an average annual production of 229,584 kWh. The number of PV panels required was 355, so 30 solar charge controllers were required [
54]. The diesel generator produced 39,659 kWh/year with a maximum output of 34.7 kW and an average electrical efficiency of 33.8%. Likewise, the number of batteries used for the BESS was 48 for a DC bus voltage of 96 V. The nominal capacity of the BESS was 283 kWh. In the case of the power converter, its maximum output was 41.8 kW.
The SPVS of 130 kWp in CWEEI generated an average annual production of 186,543 kWh. The number of PV panels required was 289, so 24 solar charge controllers were required [
54]. The diesel generator produced 98,960 kWh/year with a maximum output of 58.9 kW and an average electrical efficiency of about 34%. Likewise, the number of batteries used for the BESS was 48 for a DC bus voltage of 96 V. The nominal capacity of the BESS was 283 kWh. In the case of the power converter, its maximum output was 59.7 kW.
The results of these scenarios showed the reduction in the size of the DC bus compared to the 240 V of the configuration of
Section 4.3. This facilitated the search for commercial equipment for the design of the present power system. Likewise, the output of the SPVSs in year 15 had lower percentages of excess of electricity than the configurations described in
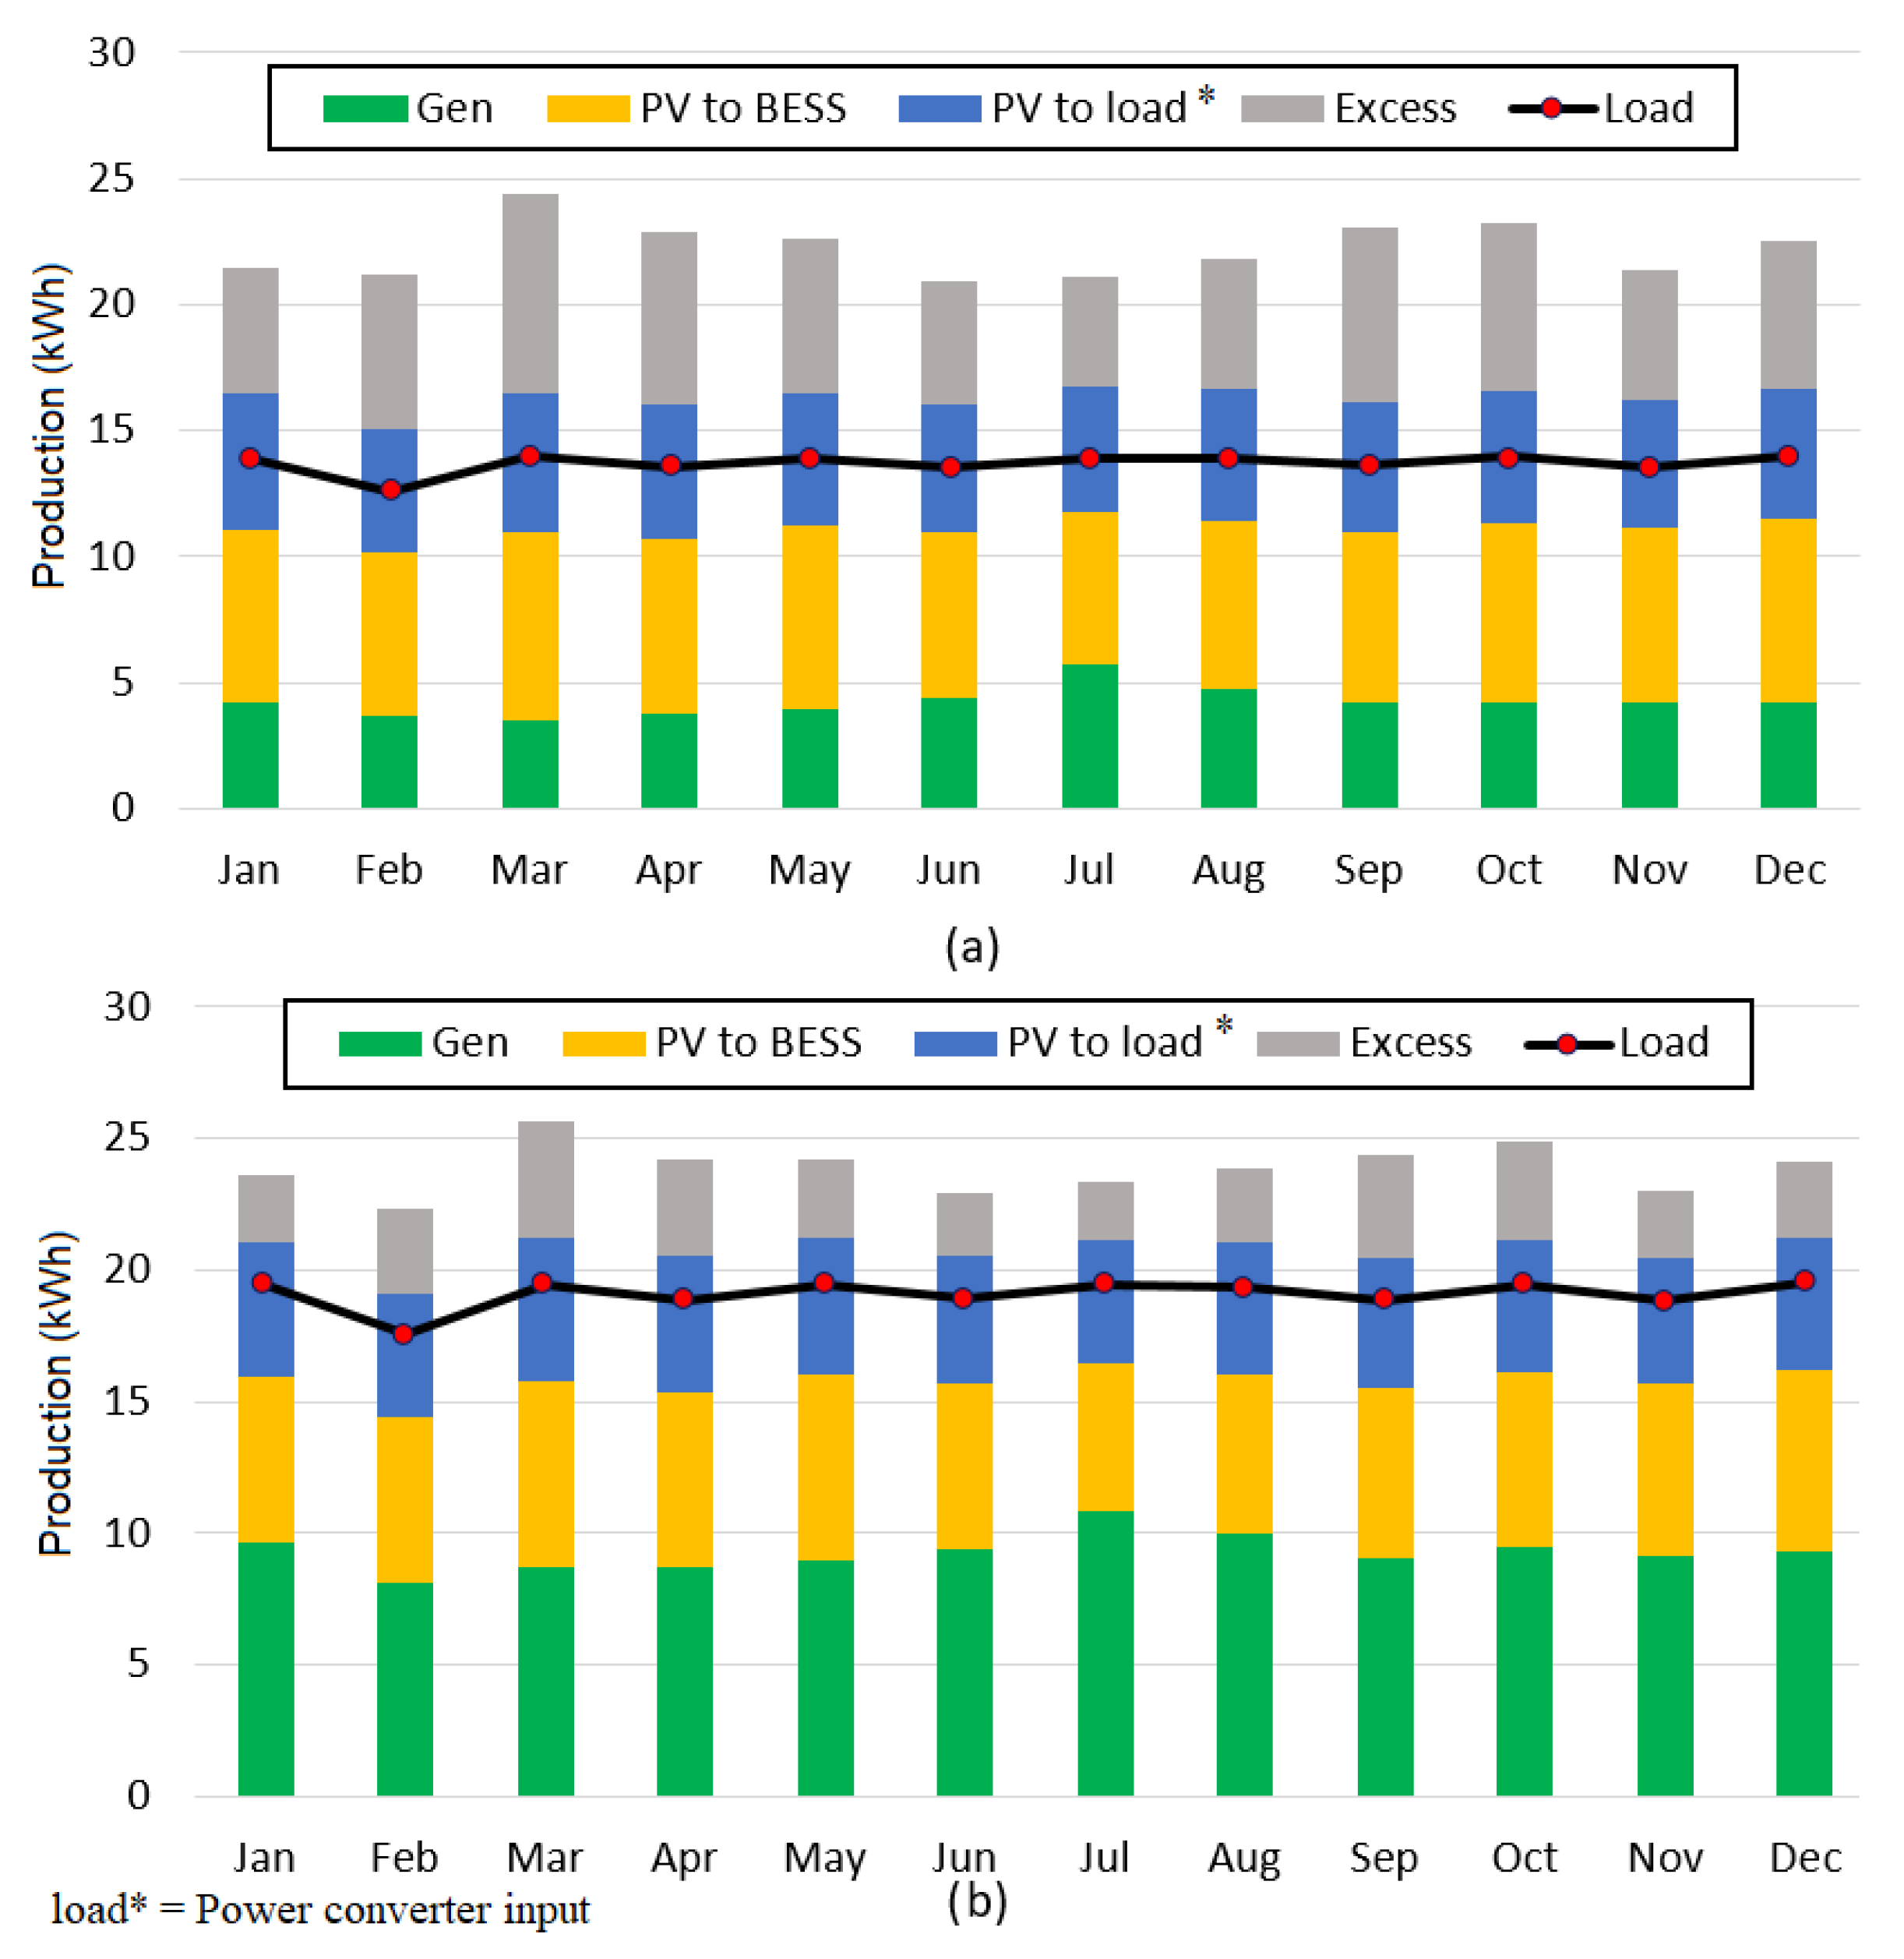
Section 4.3. Similarly, the energy of the SPVS is distributed to the BESS, the power converter input and the load. This can be seen in
Figure 12, where the CEEI had an excess of electricity of 33.6% and 22.3% for the CWEEI.
4.5. Summary of Costs of the Configurations under Study
Table 8 shows the summary of the NPCs and LCOEs over the 15-year time frame of each of the configurations analyzed in this work. As can be observed, the SPVS/BESS configuration in the CEEI showed the lowest NPC among all the scenarios, while its CWEEI presented the highest cost. Additionally, this configuration presented the lowest LCOE in the CEEI, whose value is also the same as the diesel generator/SPVS/BESS configuration. However, this configuration showed the highest LCOE of all configurations in the CWEEI. It should be noted that the NPC is the main economic output of the Homer Pro software. According to this cost, the software ranks all the configurations in the optimization results, and from this value the total annualized cost and LCOE are obtained.
4.6. CO2 Emissions Produced for Configurations
The average CO
2 emissions produced in the configurations during the planning horizon are shown in
Table 9. As can be observed in the table, the diesel generator/SPVS/BESS configuration presented the lowest CO
2 emissions among the CEEIs and the CWEEIs during the 15 years of the project. The SPVS/BESS configuration is 100% renewable, so there were no emissions. Configuration 2 had a similar performance to configuration 1 because there were instability problems due to the relatively large size of the SPVSs, as was indicated in
Section 4.2.
5. Discussion of the Simulation Study
The simulations show how the design of off-grid power systems should be approached in communities with a considerable number of families and a low renewable energy potential, as in the case of Cerrito de los Morreños. These results also showed that proposing an energy efficiency initiative for household appliances and any electrical/electronic equipment in the community should be the first step in designing and implementing an off-grid hybrid power system in localities with similar characteristics. We highlight the importance of including community members and their leadership in the discussion to ensure buy-in of the proposed initiative. The proposed energy efficiency initiative reduced electricity consumption in each of the proposed configurations to cover the community’s energy demands. Likewise, this allowed for a considerable reduction in CO2 emissions in energy-efficient scenarios.
Among the four configurations studied, the SPVS/diesel generator configuration presented instability problems in both simulated scenarios (CEEI and CWEEI). The maximum SPVS size accepted by the configuration in the CEEI was 4 kWp before the instability problems, so the results in
Table 6 showed a negligible contribution to the PV panel output in both scenarios. Likewise, the operating efficiency of the diesel generator in this scenario was slightly lower than the non-renewable configuration. Additionally, the NPC of this configuration was higher than the stand-alone diesel generator configuration. Therefore, the SPVS/diesel generator configuration should be discarded for a possible implementation in this location. In addition, both configurations showed the highest levels of CO
2 emissions, as can be seen in
Table 9.
The SPVS/BESS configuration showed the lowest NPC in the CEEI, while in the CWEEI, it was the highest value compared to all other configurations. The generation of CO
2 emissions was zero in this configuration due to the non-use of the diesel generator. Both scenarios showed high percentages of excess of electricity, which should be exploited through the design of constructive solutions such as water pumping systems [
56,
57] or the use of dump loads to improve the overall efficiency of this configuration. The latter components eliminate the instability problems presented in the microgrids due to the excesses of power generated by the renewable components [
58]. The designs of these solutions are not contemplated in the scope of this work, but considering this will surely raise the NPC of this configuration even over the diesel generator/SPVS/BESS configuration.
The diesel generator/SPVS/BESS configuration showed the best performance among all the proposed configurations. Although this configuration produced CO
2 emissions, these were considerably lower than the other configurations with diesel generators. In the operational area, the voltage level of the DC bus was lower than the SPVS/BESS configuration, which allowed for access to a wider variety of components available on the market for the design of this power system. The diesel generator significantly reduced its operation during electricity production, and renewable generation had higher penetration than the other scenarios. In addition, the excesses of electricity were considerably less than in the SPVS/BESS configuration. In the economic element, the NPC showed low values compared to the other power systems, as shown in
Table 8.
6. Conclusions
We have shown how energy efficiency measures in household appliances and lighting systems in a community have the potential to improve the environmental, economic, and operational performance of off-grid power systems. The four configurations analyzed in this paper were: stand-alone diesel generator, SPVS/diesel generator, SPVS/BESS, and diesel generator/SPVS/BESS. Each configuration was optimized and simulated in two scenarios (CEEI and CWEEI) within a planning horizon. To ensure accurate simulations, an electrical load survey was performed in the community. This allowed for the construction of appropriate annual load profiles for the scenarios with and without an energy efficiency initiative, while also considering an annual load growth of 1% during the 15 years of the project.
The results show that the diesel generator/SPVS/BESS configuration is the best fit for the Cerrito de los Morreños community. In its energy efficiency scenario, this configuration obtained an NPC of USD 620,315 and generated 28,264 kg CO
2/year. Here, the excesses of electricity were considerably less than the SPVS/BESS configuration. It was achieved with an SPVS of 160 kWp, the existing generator of 165 kW, and a capacity of BESS of 283 kWh. In addition, the stand-alone diesel generator and SPVS/diesel generator configurations showed higher NPCs, instability problems, and higher annual CO
2 emissions. In the case of the SPVS/BESS configuration, although it fulfilled the purpose of meeting the community’s energy demand without generating CO
2 emissions, the excesses of electricity suggest that new constructive solutions will have to manage the excesses of energy from the SPVSs effectively. Consequently, these solutions would raise the NPC in this configuration. These results support our argument that the configuration with renewable and non-renewable sources and storage is the most suitable for this site that already has a diesel generator based on fossil fuels. In addition, the results show that the configurations without energy efficiency (CWEEIs) had considerable increases in costs compared to their respective energy-efficient scenarios (CEEIs). These increases ranged from 15% to 40% (
Table 8).
The information generated in this work has significant potential due to the interest of some organizations, institutions and companies in reducing or offsetting their emissions of polluting gases in Ecuador. Given interest, these entities concerned with the care of the environment are looking for Ecuadorian communities where potential projects of electricity generation from renewable and non-renewable can be developed. Here, we have presented technical, operational, environmental, and economic details of four possible power systems that these entities could consider for this location.
Other technical, social, and economic studies must still be carried out towards a possible implementation of one of the power systems proposed for this community. On the social field, the energy efficiency initiative could involve an intrusion into the lifestyle and customs of the inhabitants of this community. Given this, the inhabitants must be informed and consulted about the benefits of implementing off-grid power systems and how they should adapt to these new technologies in case this type of project will be implemented in this location.


 ,
, 


